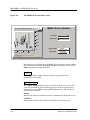
1
®
Novell LANtern Network Monitor
Management Module Guide
Notice
Cabletron Systems reserves the right to make changes in specifications and other information
contained in this document without prior notice. The reader should in all cases consult Cabletron
Systems to determine whether any such changes have been made.
The hardware, firmware, or software described in this manual is subject to change without notice.
IN NO EVENT SHALL CABLETRON SYSTEMS BE LIABLE FOR ANY INCIDENTAL,
INDIRECT, SPECIAL, OR CONSEQUENTIAL DAMAGES WHATSOEVER (INCLUDING BUT
NOT LIMITED TO LOST PROFITS) ARISING OUT OF OR RELATED TO THIS MANUAL OR
THE INFORMATION CONTAINED IN IT, EVEN IF CABLETRON SYSTEMS HAS BEEN
ADVISED OF, KNOWN, OR SHOULD HAVE KNOWN, THE POSSIBILITY OF SUCH
DAMAGES.
Virus Disclaimer
Cabletron has tested its software with current virus checking technologies. However, because no
anti-virus system is 100% reliable, we strongly caution you to write protect and then verify that
the Licensed Software, prior to installing it, is virus-free with an anti-virus system in which you
have confidence.
Cabletron Systems makes no representations or warranties to the effect that the Licensed
Software is virus-free.
Copyright © April 1998, by Cabletron Systems, Inc. All rights reserved.
Printed in the United States of America.
Order Number: 9030372 E7
Cabletron Systems, Inc.
P.O. Box 5005
Rochester, NH 03866-5005
SPECTRUM, the SPECTRUM IMT/VNM logo, DCM, IMT, and VNM are registered
trademarks, and SpectroGRAPH, SpectroSERVER, Inductive Modeling Technology,
Device Communications Manager, and Virtual Network Machine are trademarks of
Cabletron Systems, Inc.
C++ is a trademark of American Telephone and Telegraph, Inc.
UNIX is a trademark of UNIX System Laboratories, Inc.
OSF/Motif and Motif are trademarks of the Open Software Foundation, Inc.
X Window System is a trademark of X Consortium, Inc.
Ethernet is a trademark of Xerox Corporation.
9030372 E7
i
Restricted Rights Notice
(Applicable to licenses to the United States Government only.)
1. Use, duplication, or disclosure by the Government is subject to restrictions as set forth in
subparagraph (c) (1) (ii) of the Rights in Technical Data and Computer Software clause at
DFARS 252.227-7013.
Cabletron Systems, Inc., 35 Industrial Way, Rochester, New Hampshire 03866-5005.
2. (a) This computer software is submitted with restricted rights. It may not be used,
reproduced, or disclosed by the Government except as provided in paragraph (b) of this
Notice or as otherwise expressly stated in the contract.
(b) This computer software may be:
(c)
(1)
Used or copied for use in or with the computer or computers for which it was
acquired, including use at any Government installation to which such computer or
computers may be transferred;
(2)
Used or copied for use in a backup computer if any computer for which it was
acquired is inoperative;
(3)
Reproduced for safekeeping (archives) or backup purposes;
(4)
Modified, adapted, or combined with other computer software, provided that the
modified, combined, or adapted portions of the derivative software incorporating
restricted computer software are made subject to the same restricted rights;
(5)
Disclosed to and reproduced for use by support service contractors in accordance with
subparagraphs (b) (1) through (4) of this clause, provided the Government makes
such disclosure or reproduction subject to these restricted rights; and
(6)
Used or copied for use in or transferred to a replacement computer.
Notwithstanding the foregoing, if this computer software is published copyrighted
computer software, it is licensed to the Government, without disclosure prohibitions, with
the minimum rights set forth in paragraph (b) of this clause.
(d) Any other rights or limitations regarding the use, duplication, or disclosure of this
computer software are to be expressly stated in, or incorporated in, the contract.
(e) This Notice shall be marked on any reproduction of this computer software, in whole or in
part.
ii
Novell LANtern Network Monitor
Management Module Guide
Contents
Preface
What is in this Guide ........................................................................................................... ix
Conventions ............................................................................................................................x
Related SPECTRUM Documentation....................................................................................x
Other Related Documentation ............................................................................................. xi
Getting Help ........................................................................................................................ xii
Chapter 1
Introduction
LANtern Management Module ................................................................................... 1-1
Chapter 2
Device View
Device View Perspective ..................................................................................................... 2-1
Configuring the LANtern NMM in an IRM or IRBM....................................................... 2-2
IRM2 or IRBM Hub Device Views ..................................................................................... 2-3
MMAC Device Panel.............................................................................................. 2-3
LANtern NMM Logical MIM Representation...................................................... 2-4
LANtern NMM Physical MIM Representation.................................................... 2-8
LANtern NMM LEDs .......................................................................................... 2-10
IRM (SIRM or CIRM) Hub Device Views ........................................................................ 2-11
MMAC Device Statistics Panel.................................................................................. 2-11
Changing MIM Representations...................................................................................... 2-13
Changing MIM Representations on the Entire Hub ......................................... 2-13
Changing LANtern NMM Representation Using the Menu Bar...................... 2-14
Changing LANtern NMM Representations Using the Mouse .......................... 2-14
Clearing Duplicate Address Alarms for the LANtern NMM.......................................... 2-14
Case #1 ................................................................................................................. 2-15
Case #2 ................................................................................................................. 2-16
LANtern NMM Generic Views......................................................................................... 2-16
Chapter 3
Configuration View
Enabling the MAC to IP Address Table and Duplicate IP Address Table ................ 3-3
9030372 E7
iii
Chapter 4
Event and Alarm Messages
What is in this Chapter ......................................................................................................4-1
Events and Alarms..............................................................................................................4-1
Chapter 5
Application View
Application View Buttons ...................................................................................................5-1
Organizing Ethernet Addresses...................................................................................5-4
The Instance Count ......................................................................................................5-4
Organizing Application View Tables............................................................................5-4
The Update Timing Interval ........................................................................................5-5
Updating Tables .....................................................................................................5-5
The Indirect Lantern Icon ..................................................................................................5-6
Creating the Indirect LANtern Icon ..................................................................................5-6
Placing the Indirect LANtern Icon into a SPECTRUM View ....................................5-7
Appendix A
Statistical Reports
Sample Report Output File ............................................................................................... A-2
Statistical Report Filename............................................................................................... A-2
Index
iv
Novell LANtern Network Monitor
Management Module Guide
Figures
Chapter 2
Device View
Figure 2-1.
The IRM2 or IRBM MMAC Device Panel ........................................................... 2-4
Figure 2-2.
Logical MIM Representation of a LANtern NMMin a Cabletron IRM2 or IRBM
Hub Device View 2-7
Figure 2-3.
Physical MIM Representation of a LANtern NMM in a Cabletron Hub Device
View
2-9
Figure 2-4.
Detail of the LANtern NMM’s Device View Physical Representation ............. 2-10
Figure 2-5.
The MMAC Device Statistics Panel ................................................................... 2-12
9030372 E7
v
vi
Novell LANtern Network Monitor
Management Module Guide
Tables
Chapter 1
Table 1-1.
Table 1-2.
Chapter 2
Table 2-1.
Table 2-2.
Table 2-3.
Chapter 4
Table 4-1.
Introduction
Model Type Description......................................................................................... 1-2
Valid Views for Creation and Placement of LANtern Device Models ................ 1-2
Device View
Port Status Colors ................................................................................................. 2-5
Statistic Gauge Colors ........................................................................................... 2-6
Logical Gauge Colors ........................................................................................... 2-13
Event and Alarm Messages
Events and Alarms ................................................................................................ 4-2
9030372 E7
vii
viii
Novell LANtern Network Monitor
Management Module Guide
Preface
Use this guide if you are going to manage a Cabletron Ethernet Hub
through SPECTRUM. Before reading this guide, you should be
familiar with SPECTRUM’s functions and operation.You should also
be familiar with any network management and hardware
requirements described in the related hardware documentation.
What is in this Guide
The following chapter descriptions outline the organization of the
Cabletron Ethernet Hubs Management Module Guide.
Chapter
Description
Chapter 1
Introduction
Describes the Cabletron Ethernet Hubs
management module and model types.
Chapter 2
Device Views
Describes the Device Views available for each
Cabletron Ethernet Hub model type.
Chapter 3
Application Views
Describes the Application Views available for
each Cabletron Ethernet Hub model type.
Chapter 4
Configuration Views
Describes the Configuration View available
for each Cabletron Ethernet Hub model type.
Chapter 5
Diagnostic Views
Describes the Diagnostic View available for
each Cabletron Ethernet Hub model type.
Chapter 6
Performance Views
Describes the Performance View available for
each Cabletron Ethernet Hub model type.
Chapter 7
Event and Alarm
Messages
Contains a listing and explanation of the
alarm and event messages generated in the
Event Log or Alarm View for the Cabletron
Ethernet Hub model types.
9030372 E7
ix
Conventions
Conventions
In this manual, the following conventions are used:
• Command names are printed in bold; for example, Clear or Save &
Close.
• Menu selections to access a view are printed in bold; for example,
Configuration or Detail.
.
• Buttons are represented by a shadowed box; for example, Help
.
Related SPECTRUM Documentation
When using this guide, you should have a clear understanding of SPECTRUM
functionality and navigation techniques as described in the Administration,
Operation, and following documentation:
SPECTRUM Report Generator User’s Guide
Getting Started with SPECTRUM for Operators
Getting Started with SPECTRUM for Administators
How to Manage Your Network with SPECTRUM
Preface
x
Novell LANtern Network Monitor
Management Module Guide
Other Related Documentation
Other Related Documentation
Refer to the following documentation for more information on managing TCP/
IP-based networks:
LAN Troubleshooting Handbook, Mark Miller (1989, M&T Publishing, Inc.)
The Simple Book — An Introduction to Management of TCP/IP-based
Internets, Marshall T. Rose, Performance Systems International, Inc.
Computer Networks, Andrew S. Tanenbaum, Prentice-Hall, Inc.
Local Area Networks, Architectures and Implementations, James Martin &
Kathleen K. Chapman for the Arben Group, Inc. (1989, Prentice-Hall, Inc.)
9030372 E7
Preface
xi
Getting Help
Getting Help
For additional support for SPECTRUM products, or to make comments or
suggestions regarding SPECTRUM or this manual, contact Cabletron
Systems Technical Support via one of the following means:
Location
Mail
Cabletron Systems, Inc.
P. O. Box 5005
North America
Rochester, NH 03866-5005
E-mail: [email protected]
FAX
Telephone
603-337-3075
603-337-3500
(*)-44-635-552062
(*)-44-635-580000
Europe
Cabletron Systems, Ltd.
Network House
Newbury Business Park
London Road, Newbury
Berkshire, England RG13 2PZ
E-mail: [email protected]
(*)-61-2-950-5950
(*)-61-2-950-5900
Pacific
Cabletron Systems, Inc.
Allambie Grove Estate
25 French’s Forest Road East
French’s Forest, NSW 2086
Sydney, Australia
E-mail: [email protected]
(*)-81-3-3240-1985
(*)-81-3-3240-1981
Japan
Cabletron Systems, KK
JTB Building 9F
164 Maranouchi
Chiyoda-ku
Tokyo 100 Japan
E-mail: [email protected]
(*)-65-7763382
(*)-65-7755355
Singapore
Cabletron Systems, Inc.
85 Science Park Drive
#03-03/04
The Cavendish
Singapore 051
E-mail: [email protected]
(*)-49-6103/991-229
(*)-49-6103/991-269
Germany
Cabletron Systems GmbH
Dreieich Park
Im Gefierth 13d
63303 Dreieich
Frankfurt, Germany
E-mail: [email protected]
*International Operator Code
Questions About SPECTRUM Documentation?
E-MAIL
Preface
xii
Send your questions, comments or suggestions regarding SPECTRUM
documentation to the Technical Communications Department directly via the
following internet address:
[email protected]
Novell LANtern Network Monitor
Management Module Guide
Chapter 1
Introduction
This chapter describes the SPECTRUM Management Module software for the
Novell LANtern Network Monitor and LANtern Network Monitoring Module
(NMM) for the Cabletron Systems MMAC. It also provides the Model Type
Name assigned to the LANtern in SPECTRUM. The Model Type Name refers
to the template used to specify device attributes, actions, and associations for
device models in SPECTRUM.
LANtern Management Module
NOTE
If you are running a previous version of SPECTRUM, the following user
interface aspects may differ from those in SPECTRUM version 4.0:
• Order and names of menu selections
• Navigational features (mouse button functionality)
For information about menu selections and navigating within previous
versions of SPECTRUM, refer to the SPECTRUM System User’s Guide. For
information about menu selections and navigating within SPECTRUM
version 4.0, refer to the SPECTRUM Menus guide.
A management module is a C++ coded software emulation of a physical device.
It uses X Windows/OSF Motif based icons to represent this device in the user
interface. Management module icons provide:
• Visual status “at a glance” through the use of various color definitions.
• Access to in-depth information on the device’s configuration and operating
activity.
9030372 E7
1-1
LANtern Management Module
The management module software allows a network administrator to model,
monitor, and manage individual devices or groups of devices on a network.
The LANtern Network Monitor/LANtern NMM Management Module contains
all the information necessary to manage Novell LANtern Network Monitor
and LANtern NMM devices using SPECTRUM, including a software
emulation of the actual LANtern Network Monitor and LANtern NMM device
attributes and functionality.
The LANtern Network Monitor/LANtern NMM Management Module
supports the Novell LANtern Network Monitor or LANtern NMM devices
managed through the SNMP basic network management agent. SPECTRUM
bases its management of the Novell LANtern Network Monitor and LANtern
NMM on the Management Information Base (MIB), which comes as part of
the management module.
Table 1-1 provides the Model Type Name for the LANtern devices and a brief
description of the LANtern versions supported by the SPECTRUM LANtern
management module.
Table 1-1.
Model Type Description
Model Type Name
Description
NA_Nov_LANtern
Novell LANtern Network Monitor, which acts as a stand
alone monitor on an Ethernet segment.
NA_Nov_LANMIM
The Novell LANtern NMM, which when installed in a
Cabletron Systems MMAC, monitors the Ethernet
segments attached to that MMAC.
IndrctLANtern
The Novell Indirect LANtern model, which allows
modelling of the devices on the segment being monitored if
those devices do not have SPECTRUM models of their own.
Table 1-2 lists the views in which LANtern device models may be created.
Table 1-2.
Valid Views for Creation and Placement of LANtern Device Models
View
Introduction
1-2
Model
Location
Room, Rack, or Panel
Topology
FDDI, LAN_802_3, LAN_802_5
Device Topology View
Any Device Topology View
Resource View (pasted)
Workstation or other endpoint device
Novell LANtern Network Monitor
Management Module Guide
LANtern Management Module
Table 1-2.
Valid Views for Creation and Placement of LANtern Device Models
View
NOTE
9030372 E7
Model
Cablewalk View
Coax_Segment or Fanout
Organization
Org_Owns
Although the Novell LANtern Network Monitor and LANtern NMM function
identically as network monitors, they are treated slightly differently by
SPECTRUM because of their physical difference (i.e., one is free-standing and
one is installed in an MMAC chassis). The information that you can directly
access from the Novell LANtern or LANtern NMM via SPECTRUM is
identical, but for the LANtern NMM, SPECTRUM will also poll information
regarding the MMAC in which it is installed. This document explains such
differences where appropriate.
Introduction
1-3
LANtern Management Module
Introduction
1-4
Novell LANtern Network Monitor
Management Module Guide
Chapter 2
Device View
The Device View shows a physical representation of the LANtern NMM
installed in a Cabletron MMAC hub chassis and provides menu access to the
LANtern NMM generic views. These generic views allow you to access
network configuration information, as well as traffic flow and error data for
your Novell LANtern Network Monitor. This chapter describes how to use the
Device View to view MIMs, access SPECTRUM generic views, and monitor the
performance of the LANtern or LANtern MIM.
Since the LANtern NMM (NA_Nov_LANMIM) is installed in a Cabletron hub
chassis, it appears in the Device View for that Cabletron hub. The Novell
LANtern Network Monitor (NA_Nov_LANtern) does not have a Device View.
Depending on the type of Cabletron hub containing the LANtern NMM, the
Device View appears slightly different. The Cabletron hub categories are as
follows:
IRM2, IRM3, and IRBM
IRM (both SNMP and Cabletron proprietary protocol)
Device View Perspective
The Device View for a Cabletron hub gives an actual representation of the hub
configuration. If the configuration changes (e.g., a LANtern NMM is inserted
into or pulled from the hub), a corresponding change is displayed in the hub’s
Device View after the hub’s next poll cycle.
The Device View represents the hub’s physical configuration by executing the
following procedures:
1. The Device View reads a perspective file called CsDevice.pib, which
contains a list of designations for all model types supported in
SPECTRUM, along with their appropriate background image files.
9030372 E7
2-1
Configuring the LANtern NMM in an IRM or IRBM
NOTE
This path (<Perspective Path>/CsDevice.pib) is set in your .Xdefaults or appdefaults/spectrum files.
2. The LANtern NMM model type designation contained in the CsDevice.pib
file points to the MIM_LANtern.D3P (<CsIibpath>) perspective file, which
contains:
• The image (.csi) filename for the LANtern NMM. The .csi file is located in
a directory defined by your imagepath (<CsImagepath>).
• The position coordinates for each LED on the LANtern NMM.
3. SPECTRUM’s intelligence (using the HASPART relation) causes the
Device View to read the model type designation and model type handle for
each LANtern NMM installed in the hub chassis.
4. The Device View creates an icon manager that controls each NMM model
associated with the hub chassis model.
5. The Device View periodically polls the hub model in the SpectroSERVER
database to determine if any configuration changes have occurred. If a
configuration change has occurred, the Device View changes
correspondingly to match the model in the SpectroSERVER database.
Configuring the LANtern NMM in an IRM or
IRBM
To receive LANtern NMM gauge and port information in the IRM or IRBM’s
Device View logical representation and for the LANtern NMM LEDs to appear
“live” in the IRM or IRBM’s Device View physical representation, you must
assign an IP address to the LANtern NMM installed in the hub chassis as
follows:
1. Move the mouse pointer onto the LANtern NMM. Single click the left
mouse button to highlight the LANtern NMM.
2. Select Icon Subviews from the View menu.
3. Select MIM Configuration View from the Icon Subviews menu to access
the LANtern NMM Configuration View.
4. Select Update from the File menu in the LANtern NMM Configuration
View.
Device View
2-2
Novell LANtern Network Monitor
Management Module Guide
IRM2 or IRBM Hub Device Views
5. Enter the IP address of the LANtern NMM device. If you have already
created the LANtern NMM as a stand alone icon, enter the same IP
address here.
NOTE
Cabletron recommends assigning a unique model name to the LANtern NMM
installed in the hub chassis to easily differentiate it from an independent
LANtern NMM icon (NA_Nov_LANMIM) with the same assigned IP address..
6. Select Close/Update from the File menu in the LANtern NMM
Configuration View.
7. A Popup Window appears and prompts you whether to save the updated
configuration information. Click OK.
8. Select Go Back from the View menu in the LANtern NMM Configuration
View to close this view.
Current LANtern NMM gauge and port information in the IRM or IRBM’s
Device View logical representation will now be provided. The LANtern NMM
LEDs in the IRM or IRBM’s Device View physical representation will now
appear active.
IRM2 or IRBM Hub Device Views
IRM2 and IRBM hub Device Views present a variety of statistical information
on each MIM installed in the hub chassis because of the high level monitoring
point intelligence inherent in these hub types. The following sections describe
the IRM2 and IRBM hub Device Views.
MMAC Device Panel
The top portion of an IRM2 or IRBM hub Device View containing the LANtern
NMM, displays the following information for the hub:
Name
Location
Net Address
Device Type
9030372 E7
The assigned or user-defined name for the hub
containing the LANtern NMM.
The physical location of the hub containing the
LANtern NMM.
The IP address of the hub containing the LANtern
NMM.
The model type name of the hub containing the
LANtern NMM.
Device View
2-3
IRM2 or IRBM Hub Device Views
System UpTime The time the hub has been active without failure
displayed in the following format:
days+hours:minutes:seconds
A condition status banner surrounding this information displays the condition
status color for the hub containing the LANtern NMM. Refer to Table 4-2 for
definitions of condition status colors.
In addition, the MMAC Device Panel provides two buttons that allow a user to
change the type of statistical information presented in the logical MIM
horizontal bar gauges for either the LANtern NMM or the entire hub, as
described in the following section. Figure 2-1 shows an example of an IRM2 or
IRBM MMAC Device Panel.
Figure 2-1.
The IRM2 or IRBM MMAC Device Panel
MMAC Device Panel
Name IRM3
Location
Network Address
Logical Gauges
My Office
Device Type
System UpTime
Hub_CSI_IRM3
2+01:17:39
132.177.118.24
Frames
Gauge Mode
Rates
LANtern NMM Logical MIM Representation
When a hub Device View is first opened, it displays each MIM in its logical
representation. The LANtern NMM logical representation provides gauge
and port information about the LANtern NMM installed in the Cabletron hub
instead of presenting a physical image. For information on a Device View’s
physical MIM representation, refer to the section titled “LANtern NMM
Physical MIM Representation.” Refer to the section titled “Changing MIM
Representations” for information on changing between logical and physical
MIM representations. Figure 2-2 provides an example of a LANtern NMM
Logical MIM Representation.
A LANtern NMM logical representation provides the following information
about the board and the ports on the board:
Board Name
Port Number
Port Status
Device View
2-4
The name of the LANtern NMM.
The number of the port.
The current status of the port. The port status
conditions are shown in Table 2-1:
Novell LANtern Network Monitor
Management Module Guide
IRM2 or IRBM Hub Device Views
Table 2-1.
Port Status Colors
Status
Color Code
NLNK (No Link)
Yellow
ON
Green
OFF
Blue
SEG (Segmented)
Red
Two buttons are available from the MMAC Device Panel to change the
statistical selections, as follows:
Logical Gauges
The Logical Gauges button accesses a menu that allows you to select the
statistic represented by the horizontal bar gauges for the overall board or
individual port on a MIM in a logical MIM representation. The statistical
selections are as follows:
Frames
Indicates the amount of frames received or transmitted by the board or port.
Bytes
Indicates the amount of bytes received or transmitted by the board or port.
Total_Colls
Indicates the total amount of collisions detected by the board or port.
Recv_Colls
Indicates the amount of collisions received by the board or port.
Trans_Colls
Indicates the amount of collisions generated by the board or port during
transmission.
Total_Errors
Indicates the amount of errors detected by the board or port.
Align_Errors
Indicates the amount of misaligned packets detected by the board or port.
CRC_Errors
Indicates the amount of packets received by the board or port with bad Cyclic
Redundancy Checks (CRCs).
Runts
Indicates the amount of runt packets received by the board or port. A runt
packet is one byte less than the standard Ethernet frame of 64 bytes not
including the preamble.
9030372 E7
Device View
2-5
IRM2 or IRBM Hub Device Views
Giants
Indicates the amount of giant packets received by the board or port. A giant
packet exceeds 1518 bytes not including the preamble.
OutofWindow
Indicates the amount of collisions out of the standard window (51.2µs) due to a
network problem.
The horizontal bar gauge changes color depending on the statistic
represented, as shown in Table 2-2:
Table 2-2.
Statistic Gauge Colors
Statistical
Selection
Gauge Colors
Frames
Light Blue
Bytes
Blue
Total_Colls
Yellow
Recv_Colls
Dark Green
Trans_Colls
Purple
Total_Errors
Orange
Align_Errors
Lavender
CRC_Errors
Blue Green
Runts
Light Purple
Giants
Pink
OutofWindows
Salmon
Gauge Mode
The Gauge Mode button allows you to change the gauge representation of
the selected statistic, as follows:
Percentages
Displays the selected statistic as a percentage of the total statistic for the
MIM.
Rates
Displays the selected statistic as a rate over a given time frame.
Device View
2-6
Novell LANtern Network Monitor
Management Module Guide
IRM2 or IRBM Hub Device Views
Figure 2-2.
Logical MIM Representation of a LANtern NMMin a Cabletron IRM2
or IRBM Hub Device View
Primary Landscape 0x00400000 - VNM Host - CTRON of type Hub_CSI_IRBM
* File
View
Device Menu
Help?
MMAC Device Panel
Name IRM3
Location
Network Address
Logical Gauges
Device Type
My Office
System UpTime
Hub_CSI_IRM3
2+01:17:39
132.177.118.24
Frames
MT8 MIM
Gauge Mode
Rates
IRBM
LANtern
MT8 MIM
SN
SN
1
5
SN
1
5
M
B M
R A
G C
ON
ST
RC
DN
CR
PO
2
4
ON
RH
NK
DN
CR
PO
1
2
ON
OFF
2
4
C
O
N
S
O
L
E
R
C
V
L
N
K
R
C
V
L
N
K
R
C
V
L
N
K
R
C
V
L
N
K
6
3
6
3
8
4
8
4
C
O
M
M
A
U
I
NS
LK
F
O
TH
I
R
RH
L
ETHERNET
9030372 E7
Device View
2-7
IRM2 or IRBM Hub Device Views
LANtern NMM Physical MIM Representation
The physical MIMs representation of the LANtern NMM shows the board, its
LEDs, and other physical features. Figure 2-3 shows an example of an IRM2
or IRBM hub Device View in a physical MIM representation. Figure 2-4
shows a detailed example of the LANtern NMM’s physical representation.
Device View
2-8
Novell LANtern Network Monitor
Management Module Guide
IRM2 or IRBM Hub Device Views
Figure 2-3.
Physical MIM Representation of a LANtern NMM in a Cabletron Hub
Device View
Primary Landscape 0x00400000 - VNM Host - CTRON of type Hub_CSI_IRBM
* File
View
Device Menu
Help?
MMAC Device Panel
Name IRM3
Location
Network Address
Logical Gauges
Device Type
My Office
System UpTime
Hub_CSI_IRM3
2+01:17:39
132.177.118.24
Gauge Mode
Frames
MT8 MIM
LANtern EFDMIM
MT8 MIM
SN
Network Monitor
SN
1
5
Rates
1
5
SN
STAND
BY
POWER
F
D
D
I
CONTROL
2
4
M
M
A
C
TX
RX
TX
RX
COL
POK
WRAP
TOK
2
4
SYS
OK
C
O
N
F
I
G
RESET
FAULT
R
C
V
L
N
K
R
C
V
L
N
K
R
C
V
6
3
8
4
L
N
K
R
C
V
ON NET
DATA
L
N
K
6
3
8
4
B
Y
P
A
S
S
ON
F
D
D
I
A
LINK
®
NOVELL
C
O
N
S
O
L
E
F
D
D
I
B
FDDI
9030372 E7
Device View
2-9
IRM2 or IRBM Hub Device Views
Figure 2-4.
Detail of the LANtern NMM’s Device View Physical Representation
LANtern
Network Monitor
CONTROL
RESET
FAULT
DATA
ON
®
NOVELL
LANtern NMM LEDs
The LANtern NMM supports LEDs that indicate the board’s operating status,
network monitoring status, and power. Figure 2-4 details the physical
presentation of the LANtern NMM, with its LEDs.
There are three LEDs on the front of the LANtern NMM as follows:
Device View
2-10
Novell LANtern Network Monitor
Management Module Guide
IRM (SIRM or CIRM) Hub Device Views
Fault
This LED indicates that the LANtern NMM has failed a diagnostic self test
and may be damaged.
Data
This LED indicates that packets have been detected on the network segment
the LANtern NMM is monitoring.
On
This LED indicates that the LANtern NMM is receiving power from the hub
chassis.
For more information on LANtern NMM LEDs, refer to your LANtern NMM
installation documentation.
IRM (SIRM or CIRM) Hub Device Views
An IRM (SNMP or Cabletron Proprietary Protocol) hub Device View
containing a LANtern NMM, has identical logical and physical MIM
representations as the Device Views for IRM2 or IRBM hubs. The top portion
of this Device View, the MMAC Device Statistics Panel, is different than the
MMAC Device Panel for IRM2 or IRBM hubs and is described in the following
section.
MMAC Device Statistics Panel
The top portion of an IRM2 or IRBM hub Device View containing the LANtern
NMM, displays Frame Rate and Collision Rate information for the hub. Each
rate is color coded to correspond to the Multi-Attribute Line Graph.
Figure 2-5 shows an example on an SIRM or CIRM MMAC Device Statistics
Panel.
9030372 E7
Device View
2-11
IRM (SIRM or CIRM) Hub Device Views
MMAC Device Statistics Panel
Figure 2-5.
The MMAC Device Statistics Panel
Lin
Fri Jan 31 08:05:19 1996
MMAC Device Statistics
1000
800
Frame Rate
90
600
Collision Rate
0
400
200
0
0:9:0
0:6:0
0:3:0
0
Logical Gauges
Gauge Mode
Frames
Percentage
Three buttons are available from the MMAC Device Statistics Panel to change
the statistical presentation of the Multi-Attribute Line Graph or the logical
MIM horizontal bar gauges, as follows:
Log/Lin
The Log/Lin button toggles between a linear or logarithmic scale
presentation of the graph.
Logical Gauges
The Logical Gauges button accesses a menu that allows you to select the
statistic represented by the horizontal bar gauges for the overall board or
individual port on a MIM in a logical MIM representation. The statistical
selections are as follows:
Frames
Indicates the amount of frames received or transmitted by the board or port.
Collisions
Indicates the total amount of collisions detected by the board or port.
Device View
2-12
Novell LANtern Network Monitor
Management Module Guide
Changing MIM Representations
The horizontal bar gauge changes color depending on the statistic
represented, as shown in Table 2-3:
Table 2-3.
Logical Gauge Colors
Statistical Selection
Gauge Color
Frames
Light Blue
Collisions
Yellow
Gauge Mode
The Gauge Mode button allows the user to change the gauge representation
of the selected statistic, as follows:
Percentage
Displays the selected statistic as a percentage of the total statistic for the
MIM.
Rate
Displays the selected statistic as a rate over a given time frame.
Changing MIM Representations
You can change the MIM representation of the entire hub or the MIM
representation for the LANtern NMM installed in the hub. Read the
applicable section that follows.
Changing MIM Representations on the Entire Hub
To change the MIM representation of the entire hub’s Device View, do the
following:
1. Select the Device Menu menu.
2. Click on either the Display Physical MIMs or Display Logical MIMs
menu option.
The entire hub changes to the selected MIM presentation.
9030372 E7
Device View
2-13
Clearing Duplicate Address Alarms for the LANtern NMM
Changing LANtern NMM Representation Using the Menu Bar
To change the MIM representation of the LANtern NMM using the menu bar,
do the following:
1. Move the mouse pointer onto the LANtern NMM. Single click the left
mouse button to highlight the LANtern NMM.
2. Select the View menu, and select the Icon Subviews submenu. Select
either the Go Physical or Go Logical menu option from this submenu.
3. The LANtern NMM changes its MIM representation. A selected single
MIM appears to extend from the hub chassis.
Changing LANtern NMM Representations Using the Mouse
To change the MIM presentation of the LANtern NMM, using the mouse, do
the following:
1. Move the mouse pointer onto the LANtern NMM.
NOTE
Make sure that the mouse pointer is not on top of or next to a gauge or port
connector (depending on the initial MIM representation), otherwise a Port
Performance View will open.
2. Double click the left mouse button.
3. The LANtern NMM changes its MIM presentation. A selected single MIM
appears to extend from the hub chassis.
Clearing Duplicate Address Alarms for the
LANtern NMM
If you have previously created a stand alone LANtern NMM icon and have
created an IRM or IRBM hub icon and configured the LANtern NMM installed
in that hub through the hub’s Device View, a duplicate address alarm
condition (yellow alert) now exists between both LANtern NMM icons. This
occurs because SPECTRUM views both the independent LANtern NMM icon
and the LANtern NMM installed in the hub icon as separate devices with the
same assigned IP address. To alleviate this alarm condition, you must clear
the duplicate alarm.
Device View
2-14
Novell LANtern Network Monitor
Management Module Guide
Clearing Duplicate Address Alarms for the LANtern NMM
NOTE
Although yellow alarm conditions are minor alerts, Cabletron recommends
clearing these alarms when they occur.
Two methods exist for clearing this yellow alarm condition depending on the
procedural order in which you created the independent LANtern NMM icon
and configured the LANtern NMM in the IRM or IRBM hub Device View. The
particular LANtern NMM showing the duplicate IP address yellow alarm
condition depends on which LANtern NMM was created or configured first.
The following sections describe the two possible ways of creating LANtern
NMMs and how to clear the resulting duplicate alarms.
Case #1
1. Create the independent LANtern NMM (NA_Nov_LANMIM) icon.
2. Create the IRM or IRBM hub icon which contains the LANtern NMM.
3. Configure the LANtern NMM in the hub’s Device View.
If you followed the above procedure, you can clear the duplicate address alarm
as follows:
1. Go into the hub’s Device View containing the LANtern NMM.
2. Click on the LANtern NMM.
3. Select Icon Subviews from the View menu.
4. Select MIM Diagnostic View to access the LANtern NMM Diagnostic
View.
5. Select Alarms from the LANtern NMM Diagnostic View. The Alarm
View displays an alarm icon for the LANtern NMM installed in the hub
with a yellow alarm contact status color. The Symptom/Probable Cause
box displays a DUPLICATE IP ADDRESS message.
6. Select the Clear button to clear the alarm. The Alarm View clears and
you can now exit from this view.
9030372 E7
Device View
2-15
LANtern NMM Generic Views
Case #2
1. Create the IRM or IRBM hub icon which contains the LANtern NMM.
2. Configure the LANtern NMM in the hub’s Device View.
3. Create the independent LANtern NMM (NA_Nov_LANMIM) icon.
If you followed the above procedure, the LANtern NMM (NA_Nov_LANMIM)
icon appears with a yellow alarm contact status in the Topology View. You can
clear the duplicate address alarm as follows:
1. Click on the stand alone LANtern NMM (NA_Nov_LANMIM) icon.
2. Select Icon Subviews from the View menu.
3. Select Diagnostic from the Icon Subviews menu to access the LANtern
NMM Diagnostic View.
4. Select Alarms from the LANtern NMM Diagnostic View. The Alarm
View displays two alarm icons for the independent LANtern NMM icon
each with a yellow alarm contact status color. The Symptom/Probable
Cause box displays DUPLICATE IP ADDRESS and DUPLICATEPHYSICAL ADDRESS messages respectively.
5. Select the Clear button to clear each of these alarms. The Alarm View
clears and you can now exit from this view.
LANtern NMM Generic Views
To access the LANtern NMM Configuration, Diagnostic, Application, and
Performance Views while in a hub Device View, do the following:
1. Single click on the LANtern NMM physical or logical representation to
highlight it.
2. Select Icon Subviews from the View menu.
3. Select the generic view of interest.
NOTE
The LANtern NMM Configuration, Diagnostic, Application, and Performance
Views can also be accessed from the independent LANtern NMM icon
(NA_Nov_LANMIM).
To access the LANtern NMM Port Performance View while in a hub Device
View, do the following:
Device View
2-16
Novell LANtern Network Monitor
Management Module Guide
LANtern NMM Generic Views
1. Single click on the port of interest in the LANtern NMM logical
representation to highlight it.
2. Select Icon Subviews from the View menu.
3. Select Port Performance View.
9030372 E7
Device View
2-17
LANtern NMM Generic Views
Device View
2-18
Novell LANtern Network Monitor
Management Module Guide
Chapter 3
Configuration View
The Configuration View contains more detailed network configuration
information for the Novell LANtern Network Monitor and LANtern NMM. It
also allows you to configure the polling cycles to the NA_Nov_LANtern or
NA_Nov_LANMIM model in the VNM database. The Configuration View
contains five buttons, as follows:
Reset LANtern
The Reset LANtern button accesses the Reset LANtern Configuration View
allowing you to reset the Novell LANtern or LANtern NMM.
Client Access
The Client Access button accesses the Client Table. The Client Table allows
you to specify station (client) access to your Novell LANtern or LANtern
NMM.
NOTE
When modifying the Client Table, do not delete the default IP address (0.0.0.0)
unless there are other IP address entries present with a valid mask of
255.255.255.255. Otherwise, you will have to reset the Novell LANtern or
LANtern NMM because they will hang.
9030372 E7
3-1
Trap Notification
The Trap Notification button accesses the Trap Notification Table. The
Trap Notification Table allows you to specify the stations that will receive trap
messages.
NOTE
To specify a station in the Trap Notification Table to receive trap messages, the
station must also be specified in the Client Table.
Stations specified to receive trap messages can be designated as either
primary or backup stations, as follows:
To specify a primary or backup station to receive trap messages, follow these
steps:
1. Navigate to the Trap Notification Table.
2. Select Update from the File menu.
3. Enter the IP Address of the primary or backup station you want to receive
trap messages in the New Notification IP Address field.
4. Select Close/Update from the File menu.
5. Click OK at the Save Updated Information? prompt.
6. Click the Select Parameters button.
7. Specify the following parameters:
Notification Status
Notification Retries
Notification Timeout
Select either primary or backup. (The
default is primary.)
Select the number of times the trap
message will be transmitted — 2, 4, 8, or
10. (The default is 2.)
Select the time interval for confirmation of
trap message reception — 10 seconds, 30
seconds, 45 seconds, or 1 minute. (The
default is 10 seconds.)
8. Specify the traps you are interested in receiving from the Trap Mask list
using the File/Update feature described above.
9. Specify the traps you are interested in confirming from the Confirm Mask
list using the File/Update feature described above.
If you are specifying a backup station, follow these additional steps:
10. Click the Set Notification Backup IP Address button.
Configuration View
3-2
Novell LANtern Network Monitor
Management Module Guide
Enabling the MAC to IP Address Table and Duplicate IP Address Table
11. Enter the backup station’s IP Address in the IP Address Notification
window using the File/Update feature described above.
Set Alarms
The Set Alarms button accesses the Alarm Table. The Alarm Table allows
you to set up alarm table thresholds for the Novell LANtern or LANtern
NMM.
Download Firmware
The DownLoad Firmware button accesses the Download Configuration
View. The Download Configuration View allows you to download firmware to
the Novell LANtern or LANtern NMM.
!
Resetting or powering down the Novell LANtern or LANtern NMM when
downloading firmware using the DownLoad Configuration View will destroy
the Novell LANtern or LANtern NMM firmware.
CAUTION
Enabling the MAC to IP Address Table and Duplicate IP
Address Table
As stated in the section titled “Application View,” you must activate the MAC
to IP Address Table and the Duplicate IP Table found in the Novell LANtern
or LANtern NMM Application View, through the Novell LANtern or LANtern
NMM Configuration View as follows:
1. Access the Novell LANtern or LANtern NMM Configuration View by
either double-clicking on the Configuration View zone of the icon or
selecting Configuration from the Icon Subviews menu option in the View
menu.
2. Select Update from the File menu.
3. Select Enable from the Duplicate IP Checking button.
4. Select Close/Update from the File menu.
5. Click on the Reset LANtern button.
6. Select Update from the File menu.
7. Click on warmStart in the Reset LANtern Configuration View.
9030372 E7
Configuration View
3-3
Enabling the MAC to IP Address Table and Duplicate IP Address Table
8. Select Close/Update from the File menu.
The MAC to IP Address Table and the Duplicate IP Table found in the Novell
LANtern or LANtern NMM Application View are now enabled. The IP
Address Checking status field in the MAC to IP Address Table and the
Duplicate Checking status field in the Duplicate IP Table will both read
Enabled.
Configuration View
3-4
Novell LANtern Network Monitor
Management Module Guide
Chapter 4
Event and Alarm Messages
What is in this Chapter
This chapter describes the events and alarms that Novell LANtern devices
generate. Events and alarms originate as unsolicited Simple Network
Management Protocol (SNMP) messages known as traps. SPECTRUM
translates these traps as events and displays them in the Event Log. If
SPECTRUM maps an event to an alarm, the event will also appear in the
Alarm View as an alarm. (For more information on specific SNMP traps, refer
to RFC 1213, available through the Internet system. Also refer to the
Management Information Base (MIB) documentation for the Cabletron
proprietary devices.)
Events and Alarms
SPECTRUM supports the following events and alarms. The event message
files are in the following directory:
/SPECTRUM Directory Path/SG-Support/CsEvFormat
The alarm message files are in the following directory:
/SPECTRUM Directory Path/SG-Support/CsPCause
Table 4-1 lists the generic events and alarms for devices supported by the
Novell LANtern Network Monitor and NMM Management Module. A full
listing of events and alarms can be found in the directories listed above.
9030372 E7
4-1
Events and Alarms
Table 4-1.
Events and Alarms
Event Message
00010007
Probable Cause Message
00010007
A LANtern network monitor {v} name {v}, The model’s Contact Status attribute has
has reported a Cable Failure. The
been initialized with the value found in
eMediaStatus is {v}. adminTrapHandle = the data base.
{v}. adminDateAndTime = {v}.
00010008
00010008
A LANtern network monitor {v} name {v}
has received an echo response to a proxy
ping from {v}. Ping duration was {v}
hundredths of a second.
adminTrapHandle = {v}.
adminDateAndTime = {v}.
Not Applicable.
00010009
00010009
A LANtern network monitor {v} name {v}
has detected a duplicate IP address {v}.
Good MAC address is {v}, bad MAC
address is {v}. adminTrapHandle = {v}.
adminDateAndTime = {v}.
Device hardware failure, Cable between
device and upstream neighbor broken,
power failure, Incorrect network address,
device firmware failure.
0001000a
0001000a
A LANtern network monitor {v} name {v}, Not Applicable.
has reported a utilizationAlarm.
eAlarmType = {v}, eAlarmValue = {v},
eAlarmLowThreshold = {v},
eAlarmHighThreshold = {v}, and
eAlarmSampleTime = {v}.
adminTrapHandle = {v}.
adminDateAndTime = {v}.
0001000b
0001000b
A LANtern network monitor {v} name {v}, Not Applicable.
has reported an errorsAlarm.
eAlarmType = {v}, eAlarmValue = {v},
eAlarmLowThreshold = {v},
eAlarmHighThreshold = {v}, and
eAlarmSampleTime = {v}.
adminTrapHandle = {v}.
adminDateAndTime = {v}.
Event and Alarm Messages
4-2
Novell LANtern Network Monitor
Management Module Guide
Events and Alarms
Table 4-1.
Events and Alarms (Continued)
0001000c
0001000c
A LANtern network monitor {v} name {v}, Loose cable connection.
has reported a broadcastsAlarm.
eAlarmType = {v}, eAlarmValue = {v},
eAlarmLowThreshold = {v},
eAlarmHighThreshold = {v}, and
eAlarmSampleTime = {v}.
adminTrapHandle = {v}.
adminDateAndTime = {v}.
0001000d
0001000d
A LANtern network monitor {v} name {v}, Excessive hard errors detected by device.
has reported a collisionsAlarm.
These errors include out-of-window
eAlarmType = {v}, eAlarmValue = {v},
collisions.
eAlarmLowThreshold = {v},
eAlarmHighThreshold = {v}, and
eAlarmSampleTime = {v}.
adminTrapHandle = {v}.
adminDateAndTime = {v}.
0001000e
0001000e
A LANtern network monitor {v} name {v}, Excessive soft errors detected by device.
has reported a stationInactive. Station
The soft errors include CRC and
MAC address is {v}. adminTrapHandle = alignment errors, runts and giants.
{v}. adminDateAndTime = {v}.
0001000f
0001000f
A LANtern network monitor {v} name {v}, Excessive traffic detected on the network.
has reported a stationActive. Station
MAC address is {v}. adminTrapHandle =
{v}. adminDateAndTime = {v}.
9030372 E7
00010011
00010011
A(n) {v} device, named {v} has been warm
started. adminPowerOffTime = {v}.
adminTrapHandle =
{v}.adminDateAndTime = {v}.
All models that this Media Segment
Model is connected to are unreachable by
the VNM. Check the status of all the
children of the Media Segment Model.
Event and Alarm Messages
4-3
Events and Alarms
Table 4-1.
Events and Alarms (Continued)
00010012
00010012
A(n) {v} device, named {v}, has detected an
Authentication Failure.
adminUnauthorizedIPAddress = {v},
adminUnauthorizedCommunity = {v}.
adminTrapHandle = {v}.
adminDateAndTime = {v}.
Authorization failure. Other user is
trying to connect to device with an invalid
community string.
00010203
00010203
This network model is lost because all the
models in the network are lost. Check the
status of the devices in this network.
The model created is not the same type as The model created is not the same type as
the device. Model type = {v}, Name = {v}, the device.
User = {v}.
00010306
00010306
A(n) {v} device, named {v}, has been cold
started.
Not Applicable.
00010308
00010308
A(n) {v} device, named {v}, has detected a
commumication Link Down.
Communication link is down.
00010309
00010309
A(n) {v} device, named {v}, has detected a
communication Link Up.
Not Applicable.
0001030b
0001030b
A(n) {v} device, named {v}, has detected an Lost contact with EGP neighbor.
EGP Neighbor or loss.
00010401
00010401
Device {v} of type {v} is created with an IP DUPLICATE IP ADDRESS
address already used by another model.
The model has the same IP address as
that of some other Model.
Event and Alarm Messages
4-4
Novell LANtern Network Monitor
Management Module Guide
Events and Alarms
Table 4-1.
9030372 E7
Events and Alarms (Continued)
00010402
00010402
Device {v} of type {v} is created with a
physical (Mac) address already used by
another model.
DUPLICATE PHYSICAL ADDRESS
00010605
00010605
New source address {X 5} (Instance ID {0
6}) detected by {t} (name - {m}) on port {I
3} (Instance ID {0 4}) of board in slot {I 1}
(Instance ID {0 2}).
Not Applicable.
The model has the same Physical address
(Mac address) as that of some other
model.
Event and Alarm Messages
4-5
Events and Alarms
Event and Alarm Messages
4-6
Novell LANtern Network Monitor
Management Module Guide
Chapter 5
Application View
The Application View contains basic network monitoring information for the
LANtern Network Monitor or LANtern NMM.
Application View Buttons
The Application View contains seven buttons that lead to the Remote PING
utility and the Novell LANtern and LANtern NMM tables, as follows:
Remote PING
The Remote PING button accesses the Remote PING View. Remote PING
allows you to ping a device not on your network segment through the LANtern
or LANtern NMM monitoring that segment. To execute a Remote PING,
follow these steps:
1. Select Update from the File menu in the Remote PING View.
2. Enter the IP addresses for your device and the remote device.
3. Select Close/Update from the File menu.
4. Click OK at the Save Updated Information? prompt.
The ping is executed automatically and the results will appear in your Event
Log file.
9030372 E7
5-1
Application View Buttons
MAC to IP Address Table
The MAC to IP Address Table button accesses the MAC to IP Address
Table. This table cross-references device IP addresses to device MAC
(Ethernet) addresses on your network segment.
Duplicate IP Table
The Duplicate IP Table button accesses the Duplicate IP Table. This table
lists any stations that the Novell LANtern or LANtern NMM has detected
with a duplicate IP address on your network segment.
NOTE
The functionality available in the MAC to IP Address Table and the Duplicate
IP Table must first be enabled through the Novell LANtern or LANtern NMM
Configuration View. For instructions on this procedure, refer to Chapter 3,
“Configuration View.”
Station Table
The Station Table button accesses the Station Table. This table gives total
traffic statistics (in bytes, packets, errors, and protocols) for each device
attached to the segment that the Novell LANtern or LANtern NMM is
monitoring. Double clicking on any statistical variable in the Station Table
brings up a rate graph for that variable. Double clicking on a vendor code
address for a specific device listed in the Station Table brings up a Station
Table Information View for that device and allows you to:
• View the device’s vendor code address as an Ethernet (hex) address.
• View additional traffic statistics (in bytes, packets, and errors) for that
device.
• Bring up a rate graph, through button functions, for that statistic.
• Delete the device (station) from the Station Table list.
• Access the Station to Station Table button, which accesses the Station
to Station Table for that device. The Station to Station Table provides a
cross-reference of other devices transmitting to or receiving transmissions
from the specific device you are monitoring. Double-clicking on the
specific device’s vendor code address brings up an information view for
that device that provides additional statistics (in bytes, packets, and
errors) for total and current network traffic statistics for that device. This
information view also allows you to: view the vendor code address as an
Ethernet (hex) address, bring up a rate graph, through button functions,
Application View
5-2
Novell LANtern Network Monitor
Management Module Guide
Application View Buttons
for that statistic, and delete the station from the Destination-Source Table
list.
• Access the InDirect LANtern Model button (refer to Chapter 6 for
detailed information on the InDirect LANtern Model button).
Destination-Source Table
The Destination-Source Table button accesses the Destination-Source
Table. The Destination-Source Table provides a complete cross-reference of
specific devices that are receiving transmissions and the corresponding
devices that are transmitting to these devices over the network segment.
Double-clicking on a specific device’s vendor code address brings up an
information view for that device that provides additional statistics (in bytes,
packets, and errors) for total and current transmissions received by that
device. This information view also allows you to:
• View the vendor code address as an Ethernet (hex) address.
• Bring up a rate graph, through button functions, for that statistic.
• Delete the device from the Destination-Source Table list.
Source-Destination Table
The Source-Destination Table button accesses the Source-Destination
Table. The Source-Destination Table provides a complete cross-reference of
specific devices that are transmitting and the corresponding devices that are
receiving transmissions from these devices over the network segment.
Double-clicking on a specific device’s vendor code address brings up an
information view for that device that provides additional statistics (in bytes,
packets, and errors) for total and current transmissions by that device. This
information view also allows you to:
• View the vendor code address as an Ethernet (hex) address.
• Bring up a rate graph, through button functions, for that statistic.
• Delete the device from the Source-Destination Table list.
Log Table
The Log Table button accesses the Log Table. The Log Table displays
detailed network statistical information on the overall operation of the
Ethernet segment the LANtern or LANtern NMM is monitoring. These
statistics are displayed over a user-defined Log Interval. The Log Interval is
specified in the Configuration View and can be changed using the Update
feature in the File menu.
9030372 E7
Application View
5-3
Application View Buttons
Organizing Ethernet Addresses
Organizing Ethernet Addresses
As a means of organizing device Ethernet addresses, the Application View
includes a field for creating a file to store specific device addresses. As the
LANtern or LANtern NMM monitors devices on a network segment and adds
their addresses to a table, the tables can become extremely lengthy. By
default, the first 500 addresses in any table are displayed. The address
filename feature allows the user to specify a file to contain a shorter table with
only the Ethernet addresses of particular devices that the user wants to
monitor. To create a device address file, follow these steps:
1. Create an ASCII file using a UNIX text editor.
2. Enter the Ethernet addresses of the devices you want to monitor.
3. Navigate to the LANtern or LANtern NMM Application View.
4. Select Update from the File menu.
5. Enter the ASCII filename and its complete path in the File Name field.
6. Select Close/Update from the File menu.
7. Click OK at the Save Updated Information? prompt.
Columns that have been sorted will remain sorted as the table is updated.
This file is used by default when selecting that particular Application View
table.
The Instance Count
You can specify the default number of Ethernet addresses displayed in a table
by changing the value in the Instance_Count field, as follows:
1. Select Update from the File menu.
2. Enter the number of Ethernet addresses you want to display.
The Instance_Count field initially reads zero, which is the default table
display setting of 500.
3. Select Close/Update from the File menu.
4. Click OK at the Save Updated Information? prompt.
Organizing Application View Tables
Application View tables provide scroll bars which allow the user to move
anywhere in the table and provide the following organizational functions:
Application View
5-4
Novell LANtern Network Monitor
Management Module Guide
Application View Buttons
The Update Timing Interval
Sort
You can sort columns in a table incrementally using the Sort button as
follows:
1. Single-click on the particular column label.
The Sort button appears at the top of the table.
2. Single-click on the Sort button to sort that particular column.
Ethernet (hex) device addresses are sorted in ascending order. Statistical
information is sorted in descending order.
Columns that have been sorted will remain sorted as the table is updated.
Find
You can locate a particular Ethernet device address entry in a table column
using the Find button as follows:
1. Single-click on the particular column label. The Find button appears at
the top of the table.
2. Single-click on the Find button. A text entry box appears.
3. Enter the Ethernet device address in the text entry box.
4. Click OK.
If the address is in that table column, it will be highlighted. If the address is
not in the table an “Item not found in Table” message appears.
The Update Timing Interval
You can specify the timing interval by which SPECTRUM updates tables as
follows:
1. Select Edit from the File menu.
2. Select View ‘ Timing from the Edit menu.
3. Enter the timing interval in milliseconds (1000 milliseconds = 1 second).
Updating Tables
SPECTRUM can update Application View tables automatically, or you can
update them manually, as follows:
1. Select Update from the File menu in the Application View.
2. Select either Automatic or Manual (the default is Manual).
9030372 E7
Application View
5-5
The Indirect Lantern Icon
3. Select Close/Update from the File menu.
4. Click OK at the Save Updated Information? prompt.
If you select Automatic, the table is updated according to the specified
update timing interval.
If you select Manual, an Update button appears on each Application View
table. To update the table, single-click on the button.
The Indirect Lantern Icon
The InDirect LANtern icon allows a network administrator to model any
device that the Novell LANtern Network Monitor or LANtern NMM is
monitoring on an Ethernet segment but is not directly available from
SPECTRUM’s currently supported model types. The device can then be
managed through SPECTRUM with the InDirect LANtern icon.
Creating the Indirect LANtern Icon
The InDirect LANtern icon is created from the LANtern Network Monitor or
LANtern NMM Application View. To create an InDirect LANtern icon, follow
these steps:
1. Select Icon Subviews from the File menu.
2. Select Application from the Icon Subviews to navigate to the Application
View for the LANtern Network Monitor or LANtern NMM.
3. Select the Station Table button to navigate to the LANtern Network
Monitor or LANtern NMM Station Table.
4. Double-click on the MAC address of the device you want to model that is
not directly supported through SPECTRUM. The LANtern Network
Monitor or LANtern NMM Station Table Information View appears.
5. Select the InDirect LANtern Model button. An Add Options Dialog Box
appears.
6. Select the IndrctLANtern model type from the Add Options Dialog Box
and click OK. A Creating IndrctLANtern Dialog Box appears.
Enter the following information:
Model Name
Application View
5-6
Assign a name (preferably unique) that identifies the
device modeled with the InDirect LANtern icon.
Novell LANtern Network Monitor
Management Module Guide
Creating the Indirect LANtern Icon
Placing the Indirect LANtern Icon into a SPECTRUM View
Location
Enter the physical location of the device modeled with
the InDirect LANtern icon (i.e., building, site, room,
etc.).
Contact
Enter the name of the individual responsible for
maintaining the device modeled by the InDirect
LANtern icon.
Polling Interval
The time interval, in seconds, for polling any
attributes that have been flagged as “POLLED.” The
default Polling Interval value is 60 seconds.
Logging Ratio
Enter the number of poll cycles that must be achieved
before the SpectroSERVER writes to the statistical
database any attributes that have been flagged as
“LOGGED.” The default value is 10.
7. After entering the InDirect LANtern icon parameter information, click
OK.
SPECTRUM creates the InDirect LANtern icon and places it into the Lost and
Found View.
Placing the Indirect LANtern Icon into a SPECTRUM View
To place an InDirect LANtern icon into a SPECTRUM view, follow these steps:
1. Select New View from the View menu.
2. Select Lost & Found from the New View menu to navigate to the Lost
and Found View.
3. Select the InDirect LANtern from the Model Name/Model Type list by
double-clicking on the entry. The InDirect LANtern icon appears.
4. Select Edit from the File menu.
5. Click on the InDirect LANtern icon to highlight it.
6. Select Cut from the Edit menu and click OK at the Are You Sure?
prompt.
7. Navigate to the SPECTRUM view where you want to place the InDirect
LANtern icon.
8. Select Edit from the File menu.
9. Select Paste from the Edit menu.
The icon representing the InDirect LANtern device appears in the center of
the window. You can move the icon to another area of the window by dragging
it with the left mouse button while still in Edit mode.
9030372 E7
Application View
5-7
Creating the Indirect LANtern Icon
Placing the Indirect LANtern Icon into a SPECTRUM View
NOTE
Application View
5-8
The SPECTRUM views to which an InDirect LANtern icon can be added, are
identical to those available for the corresponding LANtern Network Monitor
or LANtern NMM model type icons (Location, Topology, or Off-Page
Reference).
Novell LANtern Network Monitor
Management Module Guide
Appendix A
Statistical Reports
This appendix describes the Report Format (.rib) files included with the Novell
LANtern management module. These .rib files allow you to generate reports
which monitor network activity and network entity relations. The network
administrator sets up reports for each model type (not each individual icon) to
record network activity and device performance over a specified period. You
can generate more than one Report Format file for a single model type,
allowing you to access a variety of information on a single model type.
Report generation files are located in the directory pointed to by the <CsRib
path>, which is designated in either your .Xdefaults or app-defaults files.
The Novell LANtern and LANtern NMM module supports the generation of
Statistical reports. This type of report presents information from the
statistical database, maintained by the SpectroSERVER. This report can be
made for a specific user-selectable date-time period. In order to generate a
statistical report, you must select a specific icon prior to making this menu
selection. The available Statistical reports are in subdirectories for each
model type within the CsRib directory.
NOTE
Relational Reports and Fixed Reports are supported for the LANtern and
LANtern NMM model types. These reports are not management module
specific.
9030372 E7
A-1
Sample Report Output File
Sample Report Output File
The following provides an example of a Statistical Report output file for both
the LANtern and LANtern NMM.
NA_Nov_LANtern Performance Report
From Tue Feb 26 10:18:00 1991
Internet Addr
132.177.118.24
Page : 1
To Tue Feb 26 10:28:00 1991
Model Name
JASLantern
Poll Time
Good Packets Local Collisions
Errors
-----------------------------------------------------------------10:22:05
50503
14
28
10:24:36
59329
20
2
10:27:05
59763
38
54
------------------------------------------------------------------Totals
16959
72
110
Statistical Report Filename
This section lists the directory and specific filenames for generating statistical
reports for the NA_Nov_LANtern and NA_Nov_LANMIM model types. The
paths for these Report Format files are as follows:
Model Name
NA_Nov_LANtern
NA_Nov_LANMIM
IndrctLANtern
Statistical Reports
A-2
/Path name/Filename
<CsRib path>/NA_Nov_LANtern/LANtern.rib
<CsRib path>/NA_Nov_LANMIM/LANMIM.rib
<CsRib path>/IndrctLANtern/IndrctLANtern.rib
Novell LANtern Network Monitor
Management Module Guide
Index
Symbols
D
.Xdefaults 2-2
Data 2-11
Destination-Source Table 5-3
Device View 2-1
Device View Perspective 2-1
Diagnostic 2-16
DownLoad Firmware 3-3
duplicate address alarm condition 2-14
duplicate IP address 5-2
Duplicate IP Table 3-3, 5-2
A
alarm message 4-1
Alarm View 2-15
Alarms 2-15, 2-16
Application View 5-1
Application View Buttons 5-1
Application View Tables 5-4
Automatic 5-5
B
background image files 2-1
Board Name 2-4
E
Event Log 5-1
event message 4-1
Events and Alarms 4-1
F
C
Cabletron Proprietary Protocol 2-11
Cabletron Systems 1-1
Case #1 2-15
Case #2 2-16
Changing MIM Representations 2-13
Clear 2-15
Clearing Duplicate Address Alarms 2-14
Client Access 3-1
Client Table 3-1
Collision Rat 2-11
Collisions 2-12
Configuration View 3-1
Configuring the LANtern NMM 2-2
Conventions x
CsDevice.pib 2-1
CsIibpath 2-2
CsImagepath 2-2
Fault 2-11
Find 5-5
Frame Rate 2-11
Frames 2-12
G
gauge information 2-2
Gauge Mode 2-13
Getting Help xi
Go Logica 2-14
Go Physical 2-14
H
HASPART 2-2
hub chassis model 2-2
9030372 E7
1
I
icon manager 2-2
InDirect LANtern Model 5-3
Instance Count 5-4
Introduction 1-1
IP address 2-2, 5-2
IP Address Notification 3-3
IRBM 2-1
IRM 2-1
IRM Hub Device Views 2-11
IRM2 2-1
IRM2 or IRBM Hub Device Views 2-3
IRM3 2-1
Model Type Name 1-1
monitor 5-4
Multi-Attribute Line Graph 2-11
N
NA_Nov_LANMIM 1-2
NA_Nov_LANtern 1-2
Notice i
Notification Retries 3-2
Notification Status 3-2
Notification Timeout 3-2
O
J, K
No entries for these letters.
L
LANtern Management Module 1-1
LANtern Network Monitor 2-1
LANtern NMM 1-2, 2-1
LANtern NMM Configuration View 2-3
LANtern NMM Generic Views 2-16
LANtern NMM LEDs 2-10
LANtern NMM Logical MIM
Representation 2-4
Log Table 5-3
Log/Lin 2-12
Logical Gauge Colors 2-13
Logical Gauges 2-12
logical MIM horizontal bar gauge 2-12
On 2-11
Organizing Application View Tables 5-4
Organizing Ethernet Addresses 5-4
P
Percentage 2-13
Percentages 2-6
physical representation 2-1
poll cycle 2-1
port information 2-2
Port Number 2-4
Port Status 2-4
powering dow 3-3
Preface ix
Q
No entries for this letter.
M
MAC to IP Address Table 3-3, 5-2
Management Information Base 1-2
Manual 5-5
Menu Bar 2-14
MIB 1-2
MIM Configuration View 2-2
MIM Diagnostic View 2-15
MIM Representations on the Entire Hub
2-13
MMAC 1-1
MMAC Device Panel 2-3
MMAC Device Statistics Panel 2-11
Index
2
R
Rate 2-13
rate graph 5-2
Rates 2-6
Related Reading x, xi
Remote PING 5-1
Reset LANtern 3-1
Reset LANtern Configuration Vie 3-1
Resetting 3-3
Restricted Rights Notice ii
Novell LANtern Network Monitor
Management Module Guide
S
Set Alarms 3-3
SIRM or CIRM 2-11
Sort 5-5
Source-Destination Table 5-3
SpectroSERVER database 2-2
stand alone 2-14
Station Table 5-2
Station to Station Table 5-2
T
TCP/IP Based Networks xi
Terminology x
Trademarks i
traffic statistics 5-2
Trap Notification 3-2
Trap Notification Table 3-2
U
Update 5-3
Update Timing Interval 5-5
Updating Tables 5-5
V
Virus Disclaimer i
W, X
No entries for these letters.
Y
yellow alert 2-14
Z
No entries for this letter.
9030372 E7
Index
3
Index
4
Novell LANtern Network Monitor
Management Module Guide