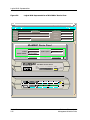
1
®
Cabletron Ethernet Hubs
Management Module Guide
Notice
Cabletron Systems reserves the right to make changes in specifications and other information
contained in this document without prior notice. The reader should in all cases consult Cabletron
Systems to determine whether any such changes have been made.
The hardware, firmware, or software described in this manual is subject to change without notice.
IN NO EVENT SHALL CABLETRON SYSTEMS BE LIABLE FOR ANY INCIDENTAL,
INDIRECT, SPECIAL, OR CONSEQUENTIAL DAMAGES WHATSOEVER (INCLUDING BUT
NOT LIMITED TO LOST PROFITS) ARISING OUT OF OR RELATED TO THIS MANUAL OR
THE INFORMATION CONTAINED IN IT, EVEN IF CABLETRON SYSTEMS HAS BEEN
ADVISED OF, KNOWN, OR SHOULD HAVE KNOWN, THE POSSIBILITY OF SUCH
DAMAGES.
Virus Disclaimer
Cabletron has tested its software with current virus checking technologies. However, because no
anti-virus system is 100% reliable, we strongly caution you to write protect and then verify that
the Licensed Software, prior to installing it, is virus-free with an anti-virus system in which you
have confidence.
Cabletron Systems makes no representations or warranties to the effect that the Licensed
Software is virus-free.
Copyright © April, 1998, by Cabletron Systems, Inc. All rights reserved.
Printed in the United States of America.
Order Number: 9030367 E8
Cabletron Systems, Inc.
P.O. Box 5005
Rochester, NH 03866-5005
SPECTRUM, the SPECTRUM IMT/VNM logo, DCM, IMT, and VNM are registered
trademarks, and SpectroGRAPH, SpectroSERVER, Inductive Modeling Technology,
Device Communications Manager, and Virtual Network Machine are trademarks of
Cabletron Systems, Inc.
C++ is a trademark of American Telephone and Telegraph, Inc.
UNIX is a trademark of UNIX System Laboratories, Inc.
OSF/Motif and Motif are trademarks of the Open Software Foundation, Inc.
X Window System is a trademark of X Consortium, Inc.
Ethernet is a trademark of Xerox Corporation.
9030367 E8
i
Restricted Rights Notice
(Applicable to licenses to the United States Government only.)
1. Use, duplication, or disclosure by the Government is subject to restrictions as set forth in
subparagraph (c) (1) (ii) of the Rights in Technical Data and Computer Software clause at
DFARS 252.227-7013.
Cabletron Systems, Inc., 35 Industrial Way, Rochester, New Hampshire 03866-5005.
2. (a) This computer software is submitted with restricted rights. It may not be used,
reproduced, or disclosed by the Government except as provided in paragraph (b) of this
Notice or as otherwise expressly stated in the contract.
(b) This computer software may be:
(c)
(1)
Used or copied for use in or with the computer or computers for which it was
acquired, including use at any Government installation to which such computer or
computers may be transferred;
(2)
Used or copied for use in a backup computer if any computer for which it was
acquired is inoperative;
(3)
Reproduced for safekeeping (archives) or backup purposes;
(4)
Modified, adapted, or combined with other computer software, provided that the
modified, combined, or adapted portions of the derivative software incorporating
restricted computer software are made subject to the same restricted rights;
(5)
Disclosed to and reproduced for use by support service contractors in accordance with
subparagraphs (b) (1) through (4) of this clause, provided the Government makes
such disclosure or reproduction subject to these restricted rights; and
(6)
Used or copied for use in or transferred to a replacement computer.
Notwithstanding the foregoing, if this computer software is published copyrighted
computer software, it is licensed to the Government, without disclosure prohibitions, with
the minimum rights set forth in paragraph (b) of this clause.
(d) Any other rights or limitations regarding the use, duplication, or disclosure of this
computer software are to be expressly stated in, or incorporated in, the contract.
(e) This Notice shall be marked on any reproduction of this computer software, in whole or in
part.
ii
Cabletron Ethernet Hubs
Management Module Guide
Contents
Preface
What is in this Guide ........................................................................................................... xi
Conventions ......................................................................................................................... xii
Related SPECTRUM Documentation................................................................................. xii
Other Related Documentation ............................................................................................ xii
Getting Help .........................................................................................................................xv
Chapter 1
Introduction
What is in this Chapter...................................................................................................... 1-1
Cabletron Ethernet Hubs Management Module .............................................................. 1-1
Terminology ........................................................................................................................ 1-2
Chapter 2
Device Views
What is in this Chapter...................................................................................................... 2-1
Accessing the Device View ................................................................................................. 2-1
Ethernet Hubs Device View Description ........................................................................... 2-2
Device View Banner............................................................................................................ 2-4
MMAC Device Panel........................................................................................................... 2-5
MMAC Device Statistics Panel .......................................................................................... 2-7
Logical MIM Representation ............................................................................................. 2-8
Gauge Control Panel .................................................................................................. 2-13
Selected Attribute ................................................................................................ 2-13
Gauge Mode ......................................................................................................... 2-13
Gauge Type .......................................................................................................... 2-13
Gauge Control Panel Buttons ............................................................................. 2-14
Physical MIM Representation ......................................................................................... 2-15
Port Source Address View ................................................................................................ 2-18
Cabletron Hub LEDs ........................................................................................................ 2-18
SIRM Hubs ................................................................................................................. 2-19
IRM2 Hubs ................................................................................................................. 2-19
IRM3 Hubs ................................................................................................................. 2-20
IRBM Hubs................................................................................................................. 2-21
MRXI Hubs................................................................................................................. 2-22
MiniMMAC Hubs ....................................................................................................... 2-22
9030367 E8
iii
Chapter 2
Device Views (continued)
Changing MIM Representations ......................................................................................2-23
Changing MIM Representations on the Entire Hub ................................................2-23
Changing MIM Representations on a Single Module
Using the Menu Bar ...................................................................................................2-23
Changing MIM Representations on a Single Module
Using the Mouse .........................................................................................................2-24
Chapter 3
Application Views
What is in this Chapter ......................................................................................................3-1
Accessing the Application View ..........................................................................................3-1
Application View Description .............................................................................................3-2
HASPART Panel ...........................................................................................................3-4
SNMP System Group View ..........................................................................................3-4
SNMP UDP Group View ..............................................................................................3-4
SNMP ICMP Group View.............................................................................................3-5
SNMP IP Group View...................................................................................................3-7
IRBM MMAC Bridge Database View ........................................................................3-10
Acquired Database ...............................................................................................3-10
Permanent Database............................................................................................3-11
UPS Statistics View....................................................................................................3-12
Chapter 4
Configuration Views
What is in this Chapter ......................................................................................................4-1
Accessing the Configuration View......................................................................................4-1
Configuration View Description .........................................................................................4-2
Model Configuration .....................................................................................................4-3
Device Configuration ....................................................................................................4-4
Bridge Information .......................................................................................................4-5
Configuration View Buttons.........................................................................................4-5
Source Address View ....................................................................................................4-6
Device Source Address Table .......................................................................................4-7
Control View .................................................................................................................4-7
Configure Alarms View.................................................................................................4-9
Redundancy View .......................................................................................................4-11
Flash Download View...........................................................................................4-14
Additional Configuration View ............................................................................4-15
Community and Trap Table.................................................................................4-15
Bridge Configuration View.........................................................................................4-17
Model Configuration ............................................................................................4-17
Device Configuration............................................................................................4-17
Configuration View Buttons ................................................................................4-18
Hub Redundancy Management........................................................................................4-21
Setting Redundant Circuits .......................................................................................4-24
iv
Cabletron Ethernet Hubs
Management Module Guide
Chapter 5
Diagnostic Views
What is in this Chapter...................................................................................................... 5-1
Accessing the Diagnostic View........................................................................................... 5-1
Diagnostic View Description .............................................................................................. 5-2
SIRM Hub..................................................................................................................... 5-3
MRXI Hubs................................................................................................................... 5-4
Chapter 6
Performance Views
What is in this Chapter...................................................................................................... 6-1
Device Performance View ................................................................................................... 6-1
Accessing the Device Performance View ........................................................................... 6-2
IRBM, IRM2, IRM3 and MiniMMAC Hubs ................................................................ 6-3
SIRM and MRXI Hubs................................................................................................. 6-6
MIM Performance View...................................................................................................... 6-6
IRBM, IRM2, IRM3 and MiniMMAC Hubs ................................................................ 6-7
SIRM and MRXI Hubs............................................................................................... 6-10
HASPART Panel .................................................................................................. 6-11
Port Performance View ..................................................................................................... 6-11
Device View Access Method ....................................................................................... 6-11
DevTop View Access Method ..................................................................................... 6-12
IRM2, IRM3, IRBM, and MiniMMAC Hubs ............................................................. 6-13
SIRM Hubs ................................................................................................................. 6-16
MRXI Hub .................................................................................................................. 6-17
Chapter 7
Event and Alarm Messages
What is in this Chapter...................................................................................................... 7-1
Cabletron Ethernet Hub Alarms and Events.................................................................... 7-2
Index
9030367 E8
v
vi
Cabletron Ethernet Hubs
Management Module Guide
Figures
Chapter 2
Figure 2-1.
Figure 2-2.
Figure 2-3.
Figure 2-4.
Figure 2-5.
Figure 2-6.
Figure 2-7.
Figure 2-8.
Chapter 3
Figure 3-1.
Chapter 4
Figure 4-1.
Figure 4-2.
Chapter 5
Figure 5-1.
Chapter 6
Figure 6-1.
Device Views
Accessing the Device View ................................................................................... 2-2
Cabletron Hub Device View ................................................................................. 2-3
MMAC Device Statistics Panel ............................................................................ 2-7
Logical MIM Representation of IRM2, IRM3, and IRBM Device Views .......... 2-10
Logical MIM Representation of IRM2, IRM3, and IRBM Device View
(accessed through the Physical MIM Representation) ..................................... 2-11
Logical MIM Representation of MiniMMAC Device View ............................... 2-12
Physical MIM Representation of IRM2, IRM3 and IRBM Device Views ........ 2-16
Physical MIM Representation of MiniMMAC Device View ............................. 2-17
Application Views
Accessing the Application View ........................................................................... 3-2
Configuration Views
Accessing the Configuration View ....................................................................... 4-2
Redundantly Connected Hub Device ................................................................. 4-23
Diagnostic Views
Accessing the Diagnostic View ............................................................................. 5-2
Performance Views
Accessing the Device Performance View ............................................................. 6-2
9030367 E8
vii
viii
Cabletron Ethernet Hubs
Management Module Guide
Tables
Chapter 1
Table 1-1.
Chapter 2
Table 2-1.
Table 2-2.
Table 2-3.
Chapter 3
Table 3-1.
Table 3-2.
Table 3-3.
Table 3-4.
Table 3-5.
Table 3-6.
Chapter 4
Table 4-1.
Table 4-2.
Table 4-3.
Table 4-4.
Table 4-5.
Table 4-6.
Table 4-7.
Table 4-8.
Table 4-9.
Table 4-10.
Table 4-11.
Table 4-12.
Table 4-13.
Introduction
Model Type Descriptions ....................................................................................... 1-2
Device Views
Logical Gauge Menu Options................................................................................ 2-6
Gauge Mode Menu Options................................................................................... 2-6
Port Status Values................................................................................................. 2-9
Application Views
SNMP ICMP Group View Information................................................................. 3-6
IP Address Table Information View Fields .......................................................... 3-8
IP Route Table Information View Fields.............................................................. 3-8
SNMP IP Group View Information....................................................................... 3-9
IRBM MMAC Acquired Database Table ............................................................ 3-11
IRBM MMAC Permanent Database Table......................................................... 3-12
Configuration Views
MMAC Source Address Board/Port Location View Fields .................................. 4-7
Error Source Table Fields ................................................................................... 4-11
MMAC Redundancy Information View Fields ................................................... 4-12
Address Delete View Fields ................................................................................ 4-13
Circuit Reset View Fields.................................................................................... 4-13
DownLoad Software View Field Definitions ...................................................... 4-14
Community Table Detail View Field Definitions............................................... 4-16
SNMP ICMP Group View Fields ........................................................................ 4-18
Additional Bridge Information View Fields ....................................................... 4-19
Setup Information View Fields ........................................................................... 4-19
Topology Information View Table Fields ........................................................... 4-20
Forward Delay & Hello Information View Fields .............................................. 4-20
IRBM Bridge Control View Fields ...................................................................... 4-21
9030367 E8
ix
Chapter 6
Table 6-1.
Table 6-2.
Table 6-3.
Table 6-4.
Table 6-5.
Table 6-6.
Table 6-7.
Table 6-8.
Table 6-9.
Table 6-10.
Table 6-11.
Chapter 7
Table 7-1.
x
Performance Views
Multi-Attribute Line Graph Definitions ...............................................................6-3
Frame Breakdown Pie Chart.................................................................................6-4
Error Breakdown Pie Chart ..................................................................................6-4
MIM Configuration View Fields............................................................................6-9
IRM2, IRM3, IRBM, and MiniMMAC Configure Alarms View Fields ...............6-9
SIRM and MRXI MIM Configure Alarms View Fields ......................................6-10
Port Configuration View Field Definitions .........................................................6-15
Port Configure Alarms View Field Definitions ..................................................6-15
Ethernet Port Standard Statistics View Field Definitions ................................6-17
Ethernet Port Standard Statistics View Field Definitions ................................6-18
Ethernet Port Configure Alarms View Field Definitions...................................6-18
Event and Alarm Messages
Events and Alarms.................................................................................................7-2
Cabletron Ethernet Hubs
Management Module Guide
Preface
Use this guide if you are going to manage a Cabletron Ethernet Hub through
SPECTRUM. Before reading this guide, you should be familiar with
SPECTRUM’s functions as described in the Operations and Administration
documentation. You should also be familiar with any network management
and hardware requirements described in the related hardware
documentation.
What is in this Guide
The following chapter descriptions outline the organization of the Cabletron
Ethernet Hubs Management Module Guide.
Chapter
Description
Chapter 1
Introduction
Describes the Cabletron Ethernet Hubs
management module and model types.
Chapter 2
Device Views
Describes the Device Views available for each
Cabletron Ethernet Hub model type.
Chapter 3
Application Views
Describes the Application Views available for
each Cabletron Ethernet Hub model type.
Chapter 4
Configuration Views
Describes the Configuration View available
for each Cabletron Ethernet Hub model type.
Chapter 5
Diagnostic Views
Describes the Diagnostic View available for
each Cabletron Ethernet Hub model type.
Chapter 6
Performance Views
Describes the Performance View available for
each Cabletron Ethernet Hub model type.
Chapter 7
Event and Alarm
Messages
Contains a listing and explanation of the
alarm and event messages generated in the
Event Log or Alarm View for the Cabletron
Ethernet Hub model types.
9030367 E8
xi
Conventions
Conventions
In this manual, the following conventions are used:
• Command names are printed in bold; for example, Clear or Save &
Close.
• Menu selections to access a view are printed in bold; for example,
Configuration or Detail.
.
• Buttons are represented by a shadowed box; for example, Help
.
• References in blue are hypertext links for online documents.
Related SPECTRUM Documentation
Refer to the Operations, Administration, and following documentation for
more information on using SPECTRUM:
SPECTRUM Report Generator User’s Guide
Getting Started with SPECTRUM for Operators
Getting Started with SPECTRUM for Administators
How to Manage Your Network with SPECTRUM
Other Related Documentation
Refer to the following documentation for more information on managing TCP/
IP-based networks:
LAN Troubleshooting Handbook, Mark Miller (1989, M&T Publishing, Inc.)
The Simple Book — An Introduction to Management of TCP/IP-based
Internets, Marshall T. Rose, Performance Systems International, Inc.
Computer Networks, Andrew S. Tanenbaum, Prentice-Hall, Inc.
Local Area Networks, Architectures and Implementations, James Martin &
Kathleen K. Chapman for the Arben Group, Inc. (1989, Prentice-Hall, Inc.)
Preface
xii
Cabletron Ethernet Hubs
Management Module Guide
Getting Help
Getting Help
For additional support for SPECTRUM products, or to make comments or
suggestions regarding SPECTRUM or this manual, contact Cabletron
Systems Technical Support via one of the following means:
Location
Mail
FAX
Telephone
603-337-3075
603-337-3500
(*)-44-635-552062
(*)-44-635-580000
Europe
Cabletron Systems, Ltd.
Network House
Newbury Business Park
London Road, Newbury
Berkshire, England RG13 2PZ
E-mail: [email protected]
(*)-61-2-950-5950
(*)-61-2-950-5900
Pacific
Cabletron Systems, Inc.
Allambie Grove Estate
25 French’s Forest Road East
French’s Forest, NSW 2086
Sydney, Australia
E-mail: [email protected]
(*)-81-3-3240-1985
(*)-81-3-3240-1981
Japan
Cabletron Systems, KK
JTB Building 9F
164 Maranouchi
Chiyoda-ku
Tokyo 100 Japan
E-mail: [email protected]
(*)-65-7763382
(*)-65-7755355
Singapore
Cabletron Systems, Inc.
85 Science Park Drive
#03-03/04
The Cavendish
Singapore 051
E-mail: [email protected]
(*)-49-6103/991-229
(*)-49-6103/991-269
Germany
Cabletron Systems GmbH
Dreieich Park
Im Gefierth 13d
63303 Dreieich
Frankfurt, Germany
E-mail: [email protected]
Cabletron Systems, Inc.
P. O. Box 5005
North America
Rochester, NH 03866-5005
E-mail: [email protected]
*International Operator Code
Questions About SPECTRUM Documentation?
E-MAIL
9030367 E8
Send your questions, comments or suggestions regarding SPECTRUM
documentation to the Technical Communications Department directly via the
following internet address:
[email protected]
Preface
xiii
Getting Help
Preface
xiv
Cabletron Ethernet Hubs
Management Module Guide
Chapter 1
Introduction
What is in this Chapter
This chapter describes the SPECTRUM Management Module for the
Cabletron Ethernet Hub family of devices. It also provides the Model Type
Names assigned to the hubs in SPECTRUM. The Model Type Name refers to
the template used to specify device attributes, actions, and associations for
device models in SPECTRUM.
Cabletron Ethernet Hubs Management Module
The SPECTRUM Ethernet Hubs Management Module manages the
Cabletron Ethernet Hub family of devices by using the SNMP network
management agent and the Management Information Bases (MIBs), included
with the management module.
Table 1-1 provides the Model Type Names for the Cabletron Ethernet hubs
and a brief description of the intelligent hub module devices supported by the
Cabletron Ethernet Hubs Management Module.
9030367 E8
1-1
Terminology
Table 1-1.
Model Type Descriptions
Model Type Name
NOTE
NOTE
Hub Description
Hub_CSI_IRBM
An Intelligent Repeater Bridging Module
(IRBM) managed through the Simple Network
Management Protocol (SNMP) only. This
module includes bridging functionality that is
similar to a Cabletron SNMP NB25.
Hub_CSI_IRM2
An Intelligent Repeater Module-2 (IRM2)
managed through SNMP only.
Hub_CSI_IRM3
An Intelligent Repeater Module-3 (IRM3)
managed through SNMP only.
Hub_CSI_SIRM
An Intelligent Repeater Module (IRM)
managed through SNMP only.
Hub_CSI_MRXi
An MRXI intelligent repeater module
managed through SNMP only.
Hub_CSI_MiniM
A MiniMMAC intelligent repeater module
managed through SNMP only.
If you have installed both the Hub_CSI_MRXi (Cabletron Ethernet Hubs
Management Module) and the HubCSIMRXi (MRXI-24 Management
Module), and are going to model an MRXI or MRXI-2, make sure you select
the Hub_CSI_MRXi (MRXI/MRXI-2) model type from the Select Model Type
menu, NOT the HubCSIMRXi (MRXI-22 or 24) model type.
If you are running a previous version of SPECTRUM, the following user
interface aspects may differ from those in SPECTRUM version 4.0:
• Order and names of menu selections
• Navigational features (mouse button functionality)
For information about menu selections and navigating within previous
versions of SPECTRUM, refer to the SPECTRUM System User’s Guide. For
information about menu selections and navigating within SPECTRUM
version 4.0, refer to SPECTRUM Menus and SPECTRUM Views.
Terminology
This section defines several terms used in this guide to describe Cabletron
Ethernet hub and board model types.
Introduction
1-2
Cabletron Ethernet Hubs
Management Module Guide
Terminology
Hub Chassis
The software model representation of an MMAC with no boards installed in
its slots. An MMAC chassis can have three, five, or eight slots.
Media Interface Modules (MIMs)
The software model representations of boards installed in an MMAC hub
chassis. For the purposes of this guide, the term MIM will represent all MIMs
that can be installed in a Cabletron hub.
Intelligent MIMs
MIMs that provide network management functions and network media
interfacing.
Non-intelligent MIMs
MIMs that provide interfaces to different kinds of network media, but have no
network management capabilities.
Single-Port Interface Modules (SPIMs)
For the MRXI and MiniMMAC hubs, this term is used to represent the nonintelligent MIMs that can be installed in these hub chassis types.
9030367 E8
Introduction
1-3
Terminology
Introduction
1-4
Cabletron Ethernet Hubs
Management Module Guide
Chapter 2
Device Views
What is in this Chapter
This chapter provides a description of the Device View for the Cabletron
Ethernet Hubs Management Module. This description includes an
explanation of the menu bar access to the various views used to control and
monitor the hub devices, and how to use the Device View to view the logical
and physical representations of Cabletron hubs, access SPECTRUM generic
views, and monitor hub performance. It also points out differences in the
Device Views of various Cabletron hubs.
Accessing the Device View
You can access the Device View using one of the following methods (refer to
Figure ):
• Double-click on the Device View button of the icon. This opens the Device
View last accessed (i.e., Logical or Physical Device View) for this device.
• Highlight the icon and select Device -> Logical or Device -> Physical
from the Icon Subviews menu. The Hub_CSI_MRXi and Hub_CSI_ MiniM
model types do not support the Logical/Physical submenu, and provide
access to the Logical Device View through the Device menu item.
9030367 E8
2-1
Ethernet Hubs Device View Description
Figure 2-1.
Accessing the Device View
Double-click
Close
Navigate
Alarms
Performance
Notes...
Utilities
Zoom
Configuration
Diagnostic
Acknowledge
Flash Green Enabled
Application
Device
DevTop
Logical
Physical
Select Logical or Physical
Ethernet Hubs Device View Description
The Device View for a hub allows you to view a logical or physical
representation of the Media Interface Modules (MIMs) installed in a hub. The
logical MIM representation shows a port status label and a logical gauge,
while the physical MIM representation shows the actual physical appearance
of the module and its LEDs. The Device View also provides you with menu bar
access to the views that monitor and control the hub, the hub modules and
each module port.
The Device View shows an actual representation of the hub configuration. The
representation is updated after each SPECTRUM polling cycle to show any
changes in the hub configuration. For example, if a module is pulled from or
added to the hub, the device view displays the new configuration. Figure
displays one example of a Cabletron Ethernet Hub Device View.
Device Views
2-2
Cabletron Ethernet Hubs
Management Module Guide
Ethernet Hubs Device View Description
Figure 2-2.
Cabletron Hub Device View
Primary Landscape 0x00400000 - VNM Host - IRBM Hub of type Hub_CSI_IRBM
* File
View
Help?
System Up Time
Network Address
Model Name
Contact
Manufacturer
Description
Device Type
Location
Serial Number
3 IRBM Hub
2 IRBM Hub
1 IRBM Hub
MT8
MT8
IRBM
1
ON
1
165
2
ON
2
180
3
ON
ON
5
ON
6
ON
0
ON
7
0
ON
0
ON
9030367 E8
ON
0
ON
0
OFF
0
ON
4
0
8
2
0
ON
7
ON
0
0
6
ON
3
0
5
1
42
0
256
4
ON
0
8
ON
0
Device Views
2-3
Device View Banner
Device View Banner
The top portion of the IRM, IRM2, IRM3, and IRBM Logical Device Views
displays the following information. A condition status banner surrounding
this information displays the condition status color for the device, with the
exception of Flashing Green, which is only valid for the Contact Status Label.
Refer to Table 3-1 for definitions of condition status colors.
Model Name
The user-defined or default model name.
Net Address
The Internet Protocol (IP) address assigned to the device.
Sys Up Time
The time the device has been active without failure, displayed in the following
format: days+hours:minutes:seconds.
Contact
The textual identification and contact information of the person responsible
for managing the device.
Manufacturer
The manufacturer of the device.
Description
A textual description of the device. This description may include the name and
version of the hardware type, the software operating system, and the
networking software.
Device Type
A hardware description of the device being modeled.
Location
The location of the device as entered in the Creation dialog box when the
model was created. If no location has been specified, this field displays the
model name of the SPECTRUM location view containing the device.
Serial Number
The serial number of this device.
Device Views
2-4
Cabletron Ethernet Hubs
Management Module Guide
MMAC Device Panel
MMAC Device Panel
The top portion of a MiniMMAC hub Device View displays an MMAC Device
Panel. The IRBM, IRM, IRM2, and IRM3 Device Views also display the Device
Panel when accessed by selecting the Physical Device View from the Icon
Subviews Menu. The MMAC Device Panel appears in the Device View in both
the logical and physical MIM representations. The MMAC Device Panel
displays the following information about the hub:
Name
The user-defined or default model name for the hub.
Location
The location of the device as entered in the Creation dialog box when the
model was created. If no location has been specified, this field displays the
model name of the SPECTRUM location view containing the device.
Net Address
The IP address of the hub.
Device Type
The SPECTRUM model type name of the hub.
System UpTime
The time the hub has been active without failure. The time is displayed in the
following format: days+hours:minutes:seconds
The colored rectangle that appears around these fields displays the device
contact status. For a list of device contact status colors, refer to Table 3-2.
The MMAC Device Panel also provides a Logical Gauges button and a
Gauge Mode button. These buttons allow you to change the type of statistical
information presented in the Logical MIM horizontal bar gauges. The Logical
MIM bar gauges appear under the name of the module (e.g., IRM2) and under
each module port. The following sections describe how these buttons work.
Logical Gauges
The Logical Gauges button lets you change the statistics represented in the
horizontal gauges for the entire MMAC. The horizontal gauges can display a
given statistic as either a percentage or a rate, depending on the setting of the
Gauge Mode button. When you single-click on the Logical Gauges button, a
menu appears. Table 2-1 provides a list of the Logical Gauge menu options.
Gauge Mode
The Gauge Mode button allows you to change the gauge representation of the
selected statistic. Table 2-2 provides a list of the Gauge Mode menu options.
9030367 E8
Device Views
2-5
MMAC Device Panel
Table 2-1.
Table 2-2.
Logical Gauge Menu Options
Option
Definition
Frames
Indicates frames received or transmitted by the module
or port.
Bytes
Indicates bytes received or transmitted by the module
or port.
Recv_Colls
Indicates collisions detected by the module or port
while receiving data.
Trans_Colls
Indicates collisions generated by the module or port
during transmission.
Total_Errors
Indicates errors detected by the module or port.
Align_Errors
Indicates misaligned packets detected by the module or
port.
CRC_Errors
Indicates packets with bad Cyclical Redundancy
Checks (CRCs) received by the module or port.
Runts
Indicates runt packets received by the module or port.
Runt packets are packets that are less than the
standard Ethernet frame of 64 bytes, not including
preamble.
Giants
Indicates giant packets received by the module or port.
A giant packet exceeds 1518 bytes not including
preamble.
OutOfWindow
Indicates collisions out of the standard window (51.2µs)
due to a network problem.
Gauge Mode Menu Options
Option
Device Views
2-6
Definition
Percentages
Displays the selected statistic as a percentage of the
total statistics for the module.
Rates
Displays the selected statistic as a rate over a given
time frame.
Cabletron Ethernet Hubs
Management Module Guide
MMAC Device Statistics Panel
MMAC Device Statistics Panel
The top portion of the MRXI Device View and the IRM Device View (when
accessed by selecting Physcial from the Device View submenu) displays the
MMAC Device Statistics Panel. This panel displays the Frame Rate and
Collision Rate information for the hub. Each rate is color-coded to correspond
to the Multi-Attribute Line Graph. Figure 2-3 shows an example of the MMAC
Device Statistics Panel.
Figure 2-3.
MMAC Device Statistics Panel
Lin
Fri Jan 31 08:05:19 1996
MMAC Device Statistics
1000
800
Frame Rate
90
600
Collision Rate
0
400
200
0
0:9:0
0:6:0
0:3:0
0
Logical Gauges
Gauge Mode
Frames
Percentage
Three buttons are available on the MMAC Device Statistics Panel. These
buttons allow you to change the statistical presentation of the Multi-Attribute
Line Graph or the Logical MIM horizontal bar gauges. The buttons and their
functions are as follows:
Log/Lin
This button allows you to toggle between a logarithmic and a linear scale
presentation of the multi-attribute line graph.
9030367 E8
Device Views
2-7
Logical MIM Representation
Logical Gauges
This button allows you to change the statistics represented in the horizontal
gauges for the entire MMAC. When you single-click on the Logical Gauges
button, a menu appears. The horizontal bar gauge changes color depending on
the statistic being represented. The following table provides a list of the menu
options and their corresponding gauge color definitions.
Menu Option
Gauge Color
Definition
Frame
Light blue
Indicates the number of frames received or
transmitted by the module or port.
Collisions
Yellow
Indicates the total number of collisions
detected by the module or port.
Gauge Mode
The Gauge Mode button allows you to change the gauge representation of the
selected statistic. Refer to Table 4-2 for the statistic gauge representations.
Logical MIM Representation
The logical MIM representation provides information about the individual
modules. For information on the Device View physical MIM representation,
see the section titled “Physical MIM Representation.”
The logical MIM representation provides port status labels and double-click
zones that provide access to information on each module installed in the hub.
The logical MIM representation also provides several double-click zones that
function as follows:
Port Number
Indicates the port number. You can double-click on the port number to bring
up a notes window.
Port Status
Indicates the status of the port. You can double-click on this zone to bring up
the Port Performance view, which is described in Chapter 6. When you have
accessed the Logical MIM representation through the Physical MIM
representation, double-clicking the Port Status Label opens the Port
Administration Status dialog box. If you have write privileges, you can doubleclick on this zone to change the port administration status from ON to OFF or
from OFF to ON. Table 2-3 provides the port status values.
Device Views
2-8
Cabletron Ethernet Hubs
Management Module Guide
Logical MIM Representation
Port Performance
Indicates the frame rate for the port. You can change this display using the
Gauge Control Panel, which is described later in this chapter. When you have
accessed the Logical MIM representation through the Physical MIM
representation, the Port Performance label displays a gauge. The rates or
percentages measured by this gauge depend on the setting of the Logical
Gauges and Gauge Mode buttons. You can double-click on the Port
Performance Gauge to bring up the port performance view, which is described
in Chapter6.
Table 2-3.
Port Status Values
Status
Color Code
NLNK (No link)
Yellow
ON
Green
OFF
Blue
SEG (Segmented)
Red
NSQE
Green (IRBM)
SQE
Green (IRBM)
CL
Blue (IRBM)
You can also access several generic views from the View and Device Menu
pulldown menus. These generic views include:
•
•
•
•
•
Configuration View
Performance View
Diagnostic View
Application View
Display Logical/Physical MIMs
The procedures for displaying these generic views are given in the section
titled “Changing MIM Representations” later in this chapter.
Figures 2-4 through 2-6 show some examples of Device Views for Cabletron
hubs. The examples show one or more modules displayed in a Logical
Representation.
NOTE
9030367 E8
Some modules may not support logical MIM representations. Refer to the
specific module’s hardware documentation.
Device Views
2-9
Logical MIM Representation
Figure 2-4.
Logical MIM Representation of IRM2, IRM3, and IRBM Device Views
Primary Landscape 0x00400000 - VNM Host - IRM-3 Hub #2 of type Hub_CSI_IRM3
* File
View
Help?
System Up Time
Network Address
Model Name
Contact
Manufacturer
Description
Device Type
Location
Serial Number
3
IRM-3 Hub #2
THIN
1
2
3
4
5
6
7
8
9
10
11
12
SEG
0
SEG
0
SEG
0
SEG
0
SEG
0
SEG
0
SEG
0
SEG
0
SEG
0
SEG
0
SEG
0
SEG
0
Device Views
2-10
2
IRM-3 Hub #2
1
10BT-T
1
2
3
4
5
6
7
8
9
10
11
12
NLK
0
NLK
0
NLK
IRM-3 Hub #2
IRM3
1
ON
0
2
OFF
0
0
NLK
0
NLK
0
NLK
0
NLK
0
NLK
0
NLK
0
NLK
0
NLK
0
NLK
0
Cabletron Ethernet Hubs
Management Module Guide
Logical MIM Representation
Figure 2-5.
Logical MIM Representation of IRM2, IRM3, and IRBM Device View
(accessed through the Physical MIM Representation)
Primary Landscape 0x00400000 - VNM Host - IRBM Hub of type Hub_CSI_IRBM
* File
View
Help?
System Up Time
Network Address
Model Name
Contact
Manufacturer
Description
Device Type
Location
Serial Number
MMAC Device Panel
Name
Location
Network Address
Logical Gauges
Device Type
IRBM Hub
My Office
System UpTime
2+01:17:39
132.177.118.24
Gauge Mode
Frames
MT8
9030367 E8
Hub_CSI_IRBM
Percentage
MT8
IRBM
1
ON
1
ON
1
ON
2
ON
2
ON
2
OFF
3
ON
3
ON
4
ON
4
ON
5
ON
5
ON
6
ON
6
ON
7
ON
7
ON
8
ON
8
ON
Device Views
2-11
Logical MIM Representation
Figure 2-6.
Logical MIM Representation of MiniMMAC Device View
Primary Landscape 0x00400000 - VNM Host - MiniMMAC Hub of type Hub_CSI_MiniM
* File
View
Help?
System Up Time
Network Address
Model Name
Contact
Manufacturer
Description
Device Type
Location
Serial Number
MiniMMAC Device Panel
Name
Device Type
MiniMMAC Hub
My Office
Location
Network Address
Hub_CSI_MiniM
System UpTime
0+00:33:56
132.177.118.24
Logical Gauges
Gauge Mode
Frames
MiniMMAC
Percentage
MULTIMEDIA ACCESS CENTER
WITH REMOTE LANVIEW®
PORT
1 2 3 4 5 6 7 8 9 10 11 12 13
RECEIVE
PORT OK
SPIM-A ON
13
7
Device Views
2-12
MPIM-A
POWER
COLLISION
1 NLNK 2 NLNK 3 NLNK 4 NLNK
MPIM-F2
2
THE REMOTE LANVIEW OPTION
IS NOT INSTALLED
SYSTEM
B
5
1
ON
3
ON
4
12
100-340V~
50-60Hz
11
ON
6
ON
IFI
6
1
Cabletron Ethernet Hubs
Management Module Guide
Logical MIM Representation
Gauge Control Panel
Gauge Control Panel
The Gauge Control Panel allows you to change the type of statistical
information presented in the Port Performance label of the Logical MIM
Representation. To access the Gauge Control Panel, single-click on the rightmost module in the hub chassis to highlight it and then select Gauge Control
Panel from the Icon Subviews menu.
Selected Attribute
This area of the Gauge Control Panel allows you to select the statistical
attribute displayed on the Logical Interface Icon’s Gauge. The label changes
color to reflect the attribute selected. Refer to Table 4-1 for a list of the
attribute definitions.
Gauge Mode
This area of the Gauge Control Panel allows you to select the mode presented
by the Logical Gauge. Possible selections are Totals, Rates, or Percentages.
The Percentages selection represents the percentage of the interface compared
to the rest of the interfaces, and is not currently supported. Once you select
these attributes, click the Gauge Control Panel Apply button to activate the
mode represented in the Logical Gauge Label (f).
Gauge Type
This option allows you to select either a numeric or linear representation of
the Logical Gauge.
9030367 E8
Device Views
2-13
Logical MIM Representation
Gauge Control Panel
Gauge Control Panel Buttons
The following buttons are available in the Gauge Control Panel:
Apply
Apply the Selected Attribute selection(s) to the Port Performance label. The
settings cannot be saved.
Keep Settings
Save the current settings while running SpectroGRAPH.
Reset
Reset back to the last Keep Settings selections.
Close
Close the Gauge Control Panel and reset back to the default attribute of
Frame Rate.
Default
Return all settings to their default values.
Device Views
2-14
Cabletron Ethernet Hubs
Management Module Guide
Physical MIM Representation
Physical MIM Representation
The Physical MIM Representation of the hub shows each of the modules
installed in the hub along with the current LED status conditions (on or off).
The Physical MIM Representation gives you the same access to generic views
as the Logical MIM Representation.
Figures 2-7 through 2-9 show some examples of Device Views showing
modules in a physical representation.
9030367 E8
Device Views
2-15
Physical MIM Representation
Figure 2-7.
Physical MIM Representation of IRM2, IRM3 and IRBM Device Views
Primary Landscape 0x00400000 - VNM Host - IRBM Hub of type Hub_CSI_IRBM
* File
View
Help?
System Up Time
Network Address
Model Name
Contact
Manufacturer
Description
Device Type
Location
Serial Number
MMAC Device Panel
Name
Location
Network Address
Logical Gauges
Device Type
IRBM Hub
My Office
Hub_CSI_IRBM
System UpTime
2+01:17:39
132.177.118.24
Gauge Mode
Frames
MT8 MIM
Percentage
IRBM
MT8 MIM
SN
SN
1
5
SN
1
5
M
B M
R A
G C
ON
ST
RC
DN
CR
PO
2
4
ON
RH
NK
DN
CR
PO
2
4
C
O
N
S
O
L
E
R
C
V
L
N
K
R
C
V
L
N
K
R
C
V
L
N
K
R
C
V
L
N
K
6
3
6
3
8
4
8
4
C
O
M
M
A
U
I
NS
LK
F
O
TH
I
R
RH
L
ETHERNET
Device Views
2-16
Cabletron Ethernet Hubs
Management Module Guide
Physical MIM Representation
Figure 2-8.
Physical MIM Representation of MiniMMAC Device View
Primary Landscape 0x00400000 - VNM Host - MiniMMAC Hub of type Hub_CSI_MiniM
* File
View
Help?
System Up Time
Network Address
Model Name
Contact
Manufacturer
Description
Device Type
Location
Serial Number
MiniMMAC Device Panel
Name
Device Type
MiniMMAC Hub
My Office
Location
Network Address
System UpTime
Hub_CSI_MiniM
0+00:33:56
132.177.118.24
Logical Gauges
Gauge Mode
Frames
MiniMMAC
Percentage
MULTIMEDIA ACCESS CENTER
WITH REMOTE LANVIEW®
PORT
1 2 3 4 5 6 7 8 9 10 11 12 13
RECEIVE
PORT OK
P
W
R
13
7
R
L
R
L
2
R
L
B
R
L
SYSTEM
POWER
COLLISION
R
L
5
R
L
12
100-340V~
50-60Hz
11
IFI
6
THE REMOTE LANVIEW OPTION
IS NOT INSTALLED
9030367 E8
1
PWR
PWR
PWR
PWR
Device Views
2-17
Port Source Address View
Port Source Address View
The Port Source Address View is available from the IRBM, IRM2, IRM3, and
MiniMMAC Device Views. This view allows you to display the Source Address
information for the port. To open the Port Source Address View, follow these
steps:
1. Click on the port icon with the right mouse button to display the port Icon
Subviews menu.
2. Select Port Source Address View from the this menu.
You can also display the Port Source Address View as follows:
1. Click on the port icon to highlight it.
2. Select Icon Subviews from the View menu.
3. Select Port Source Address View from the Icon Subviews menu.
The Port Source Address View displays the following information:
Name
The user-defined or default name for the hub.
Network Address
The IP address of the hub.
Device Type
The SPECTRUM model type name of the hub.
Slot/Port Number
The slot number and the port number in this format: 1.1 (Slot number 1, Port
number 1).
Source Address Table
The list of Source Addresses for the port. The print button allows you to print
out a copy of the table to a printer or a file.
Cabletron Hub LEDs
This section describes the LEDs available on Cabletron Systems intelligent
modules for the MMAC hub chassis types and the LEDs available on the front
panel of the MRXI and MiniMMAC. You can see these LEDs in the Physical
Representation of the Device View. For more specific information on LEDs,
refer to the corresponding Cabletron hardware installation manual.
Device Views
2-18
Cabletron Ethernet Hubs
Management Module Guide
Cabletron Hub LEDs
SIRM Hubs
SIRM Hubs
The SIRM supports LEDs that represent operating status, collision rates,
error rates, packets transmitted and packets received for the entire hub as
follows:
Fail (Error)
This LED is located on the top of the left-hand LED column. It indicates that a
problem has been detected with the SIRM.
CLN (Collision Present)
This LED is located on the top of the right-hand LED column and is not
labelled in SPECTRUM. It indicates that the SIRM is detecting a collision
signal from one of the segments connected to the hub.
Unlabeled 1
This LED is located below the Fail LED. It indicates that the SIRM is
receiving network management packets.
Unlabeled 2
This LED is located below the CLN LED. It indicates that the SIRM network
management software is on line and functional.
The SIRM modules also contain an RCV and POK LED that are associated
with its repeater port and its network management port.
IRM2 Hubs
The IRM2 supports LEDs that represent operating status, collision rates,
error rates, packets transmitted, and packets received for the entire hub as
follows. The LEDs are listed in top to bottom order, except where otherwise
noted.
ER (Error)
This LED indicates that a problem has been detected with the IRM2.
PW (Power)
This LED indicates that the hub is receiving power.
RC (Receive)
This LED indicates the IRM2 is repeating a data packet received from one of
the segments connected to the hub chassis.
XM (Transmit)
This LED indicates that the IRM2 is transmitting a data packet out to all
other segments connected to the hub chassis.
CL (Collision Present)
This LED indicates the IRM2 is detecting a collision signal from one of the
segments connected to the hub chassis.
9030367 E8
Device Views
2-19
Cabletron Hub LEDs
IRM3 Hubs
PO (Port OK)
This LED is lit to indicate that the Network Interface Chip associated with
the IRM2’s internal repeater port has passed an internal Loop Back Test and
is ready for transmission.
P1 (Port 1 OK)
This LED is lit to indicate that the Network Interface Chip associated with
the IRM-2’s external repeater port has passed an internal Loop Back Test and
is ready for transmission.
R1(Receive 1)
This LED is located to the left of the P1 LED. It indicates the IRM2 is
repeating a data packet received from the segment connected to the IRM2 AUI
Port or Fiber Optic Port.
LN (Link)
This LED is located below the IRM2’s AUI port. It indicates that a link has
been established between the fiber optic port on the IRM2 and the fiber optic
device at the other end of the fiber optic link segment.
IRM3 Hubs
The IRM3 supports LEDs that represent operating status, collision rates,
error rates, packets transmitted and packets received for the entire hub as
follows:
PW (Power)
This LED is located at the top of the left-hand LED column. It indicates that
the IRM3 is receiving power from the MMAC.
OK (Board OK)
This LED is located at the top of the right-hand LED column. If this LED is
lit, the module is operating properly. If this LED is not lit, there is an
initialization problem. You may need to press the Reset switch.
RC (Receive)
This LED is located below the OK LED. It indicates that the IRM3 is
repeating a packet received from a connected segment.
MM (Management)
This LED is located below the PW LED. It indicates that the IRM3 is
receiving or transmitting management packets.
CL (Collision)
This LED is located below the MM LED. It indicates that a collision has been
detected on a segment.
PO (Port OK)
This LED is located below the RC LED. It indicates that the internal repeater
port is OK.
Device Views
2-20
Cabletron Ethernet Hubs
Management Module Guide
Cabletron Hub LEDs
IRBM Hubs
ON (AUI)
This LED is located above the AUI port and to the left of the PW LED. It
indicates that the AUI port is the active repeater port.
PW (Power)
This LED is located above the AUI port and to the right of the ON LED. It
indicates that the AUI port is receiving power.
ON (FO)
This LED is located below the AUI port and to the left of the LN LED. It
indicates that the fiber optic port is the active repeater port.
LNK (Link)
This LED is located below the AUI port and to the right of the ON LED. It
indicates that a link has been established between the port and the fiber optic
device.
IRBM Hubs
The IRBM is divided into two sets of LEDs. One set, located in the right-hand
LED column, is associated with the IRBM’s repeating functions and a second
set is associated with the IRBM’s bridging functions. The repeater set has the
same functions as the LEDs described for the IRM2. The bridging set of LEDs
is as follows:
ON (On Line)
This LED is located at the top of the left-hand LED column. It indicates that
the IRBM’s bridging functionality is on line and operational.
ST (Stand By)
This LED is located below the ON LED. It indicates that the IRBM’s bridging
functionality is in the standby mode and is not capable of forwarding packets.
RC (Receive)
This LED is located below the ST LED. It indicates that the IRBM’s bridge
port is receiving data packets.
XM (Transmit)
This LED is located below the RC LED. It indicates that the IRBM’s bridge
port is transmitting packets to the segment connected to it.
CP (Collision Present)
This LED is located below the XM LED. It indicates that a collision is
occurring on the segment connected to the IRBM’s bridge port. On some
IRBMs, this LED may be labelled CP.
PO (Power)
This LED indicates that the hub is receiving power.
9030367 E8
Device Views
2-21
Cabletron Hub LEDs
MRXI Hubs
MRXI Hubs
The MRXI supports LEDs that represent operating status, collision rates,
error rates, packets transmitted and packets received for the entire hub as
follows:
POWER
This LED indicates that the hub is receiving power.
LNK (Link)
This LED indicates that a link has been established between the module and
the 10BASE-T device at the other end of the twisted pair segment. This LED
remains lit as long as the link is maintained. The link LED flashes to indicate
that the hub has established a link with reversed polarity.
RCV (Receive)
This LED indicates that the hub is receiving a data packet on that segment.
COLLISION
This LED indicates that a collision is occurring on a system level.
MGMT (Management)
When flashing, this LED indicates that the MRXI’s network management
software is receiving a packet directed toward management.
FAULT
This LED indicates than an error has been detected by the MRXI’s software.
XMT (Transmit)
This LED indicates that the hub is transmitting packets to the segment
connected to it.
MiniMMAC Hubs
The MiniMMAC supports LEDs that represent network activity and
operating status, as follows:
PORT OK
This LED indicates that the corresponding port is not segmented from the
network and is ready to transmit or receive packets from a segment attached
to the port.
RECEIVE
This LED indicates that the MiniMMAC is receiving a data packet from the
segment attached to the corresponding port.
POWER
This LED indicates that the MiniMMAC is receiving power.
Device Views
2-22
Cabletron Ethernet Hubs
Management Module Guide
Changing MIM Representations
COLLISION
This LED indicates that the MiniMMAC has detected a collision on one of its
ports.
FLT (Fault)
This LED is located on the back of the MiniMMAC. It indicates that an error
has been detected by the MiniMMAC’s software.
XMT (Transmit)
This LED is located on the back of the MiniMMAC. It indicates that the hub is
transmitting packets to the segment connected to it.
Changing MIM Representations
You can change the MIM representation of the entire hub or the MIM
representation of selected modules in the hub. The following sections describe
several methods for changing MIM representations.
Changing MIM Representations on the Entire Hub
To change the representation of the entire hub Device View, follow these steps:
1. Within the hub Device View, pull down the Device Menu.
2. Click on either the Display Physical MIMs or Display Logical MIMs
menu option. The appearance of the hub changes to the selected MIM
representation.
Changing MIM Representations on a Single Module
Using the Menu Bar
To change the representation of a single module using the menu bar, follow
these steps:
1. From the Physical representation of the Device View, move the mouse
pointer onto the module. Single-click the left mouse button.
2. Select the Icon Subviews from the View menu.
3. Select the Go Logical menu option. The selected module changes its
appearance and appears to extend from the hub chassis.
9030367 E8
Device Views
2-23
Changing MIM Representations
Changing MIM Representations on a Single Module Using the Mouse
NOTE
This procedure works only when you are viewing the Physical representation
of modules and you want to change to a Logical representation.
Changing MIM Representations on a Single Module
Using the Mouse
To change the MIM representation of a single module using the mouse, follow
these steps:
1. From the Physical representation of the Device View, move the mouse
pointer onto the module.
NOTE
Make sure that the mouse pointer is not on top of, or next to, a gauge or port
connector (depending on the initial MIM presentation) otherwise a Port
Performance View will open.
2. Double-click the left mouse button. The appearance of the selected module
changes. A selected single module appears to extend from the hub chassis.
3. Double-click the left mouse button again to return the module to its
original appearance.
NOTE
Device Views
2-24
This procedure works only when you are viewing the Physical representation
of modules and you want to change to a Logical representation.
Cabletron Ethernet Hubs
Management Module Guide
Chapter 3
Application Views
What is in this Chapter
This chapter describes the Cabletron Ethernet Hubs Management Module
Application Views. The Application View provides buttons that allow you to
access increasingly detailed views of network information, and table entries
within views that provide you with double-click zones that navigate to devicespecific information views.
Accessing the Application View
You can access the Application View using one of the following methods (refer
to Figure ):
• Double-click on the Application View label of the icon.
• Highlight the icon and select Application from the Icon Subviews menu.
9030367 E8
3-1
Application View Description
Figure 3-1.
Accessing the Application View
Double-click
Close
Navigate
Alarms
Performance
Notes...
Utilities
Zoom
Configuration
Diagnostic
Acknowledge
Flash Green Enabled
Application
Device
DevTop
Select Application
Application View Description
The Application View presents protocol related performance and error
statistics for a device. Protocols covered include TCP/IP, ICMP, and UDP. The
Application View also gives you access to firmware attribute information for
the Cabletron hub device. If the hub device is connected to other devices, you
can access additional attribute information for the connected devices through
the Application View HASPART Panel. The following sections describe the
Application Views for each Cabletron Ethernet hub.
The Application Views for Cabletron Ethernet hubs are similar. There are
only two differences:
• The IRBM Hub Application View provides an extra button (the Bridge
Databases button), which presents bridging statistics on the IRBM hub.
Application Views
3-2
Cabletron Ethernet Hubs
Management Module Guide
Application View Description
• The IRM3 Hub Application View provides a UPS button, which displays
an Uninterruptible Power Supply (UPS) statistics view.
The Application View for the IRBM, IRM2, IRM3, SIRM, MiniMMAC and
MRXI hubs contains the following fields and buttons:
Model Name
The user-defined or default name of the model.
Device Name
The ASCII name of the device read from the device firmware.
Network Address
The network IP address of the device (e.g., 132.177.118.24).
System
This button provides access to the SNMP System Group View, which is
described later in this chapter.
UDP
This button provides access to the SNMP User Datagram Protocol (UDP)
Group View, which is described later in this chapter.
ICMP
This button provides access to the SNMP Internet Control Message Protocol
(ICMP) Group View, which is described later in this chapter.
IP
This button provides access to the SNMP Internet Protocol (IP) Group View,
which is described later in this chapter.
Bridge Databases
This button, available only in the IRBM Application View, provides access to
the IRBM MMAC Bridge Database View. This view is described later in this
chapter.
9030367 E8
Application Views
3-3
Application View Description
HASPART Panel
UPS
This button, available only in the IRM3 Application View, provides access to
the Uninterruptible Power Supply (UPS) Statistics View. This view is
described later in this chapter.
HASPART Panel
The HASPART Panel allows you to access Performance Views for the modules
installed in the hub. You can either double-click on the name of the module in
the HASPART panel, or you can highlight the name and click on OK. The
Performance View for modules is described in Chapter 6.
SNMP System Group View
You can access the SNMP System Group View by clicking on the System
button in the Application View. The SNMP System Group View provides the
following information:
System Descriptor
A textual description of the hub. This description includes the name of the
hardware type and the networking software.
System Up Time
The time since the hub network management software was last reinitialized,
displayed in the following format: days+hours:minutes:seconds
System Object Id
The Structure of Management Information (SMI) identification of the network
management subsystem contained in the hub.
SNMP UDP Group View
You can access the SNMP UDP Group View by clicking on the UDP button in
the Application View. The SNMP UDP Group View provides the following
information:
In DataGrams
The total number of UDP datagrams delivered to UDP users.
Out DataGrams
The total number of UDP datagrams sent from this entity.
In Errors
The number of received UDP datagrams that could not be delivered for
reasons other than the lack of an application at the destination port.
Application Views
3-4
Cabletron Ethernet Hubs
Management Module Guide
Application View Description
SNMP ICMP Group View
Msgs with no Ports
The total number of received UDP datagrams for which there was no
application at the destination port.
SNMP ICMP Group View
You can access the SNMP ICMP Group View by clicking on the ICMP button
in the Application View. The SNMP ICMP Group View displays the following
information for the hub:
Messages
Displays the total number of ICMP messages that the hub received or
attempted to transmit, including messages containing errors.
Errors
Displays the total number of ICMP messages that the hub received containing
errors or did not transmit because of errors.
Dest. Unreachable
Displays the total number of ICMP Destination Unreachable messages
received or transmitted by the hub. This indicates that a network or host was
unreachable, a protocol was not running, or IP datagram fragmentation was
necessary but disallowed because the Don’t Fragment flag was set.
Time Exceeds
Displays the total number of ICMP Time Exceeded messages received or
transmitted by the hub. This indicates that an IP datagram was discarded
because its TTL had expired or it was in the reassembly queue for too long.
Parameter Problems
Displays the total number of ICMP parameter problem messages received or
transmitted by the hub. This indicates an error in an IP datagram’s header.
Src Quench Msgs
Displays the total number of ICMP Source Quench messages received or
transmitted by the hub. This indicates that a network device is discarding IP
datagrams due to a lack of buffer space.
Redirects
Displays the total number of ICMP Redirect messages received by the hub if it
is operating as a host. ICMP redirects are transmitted to the host by a
gateway informing the host of another gateway on the same IP network that is
closer to the desired transmission destination.
More ICMP Stats...
This button allows you to access an additional SNMP ICMP Group View.
Table 3-1 provides the information displayed by the second SNMP ICMP
Group View.
9030367 E8
Application Views
3-5
Application View Description
SNMP ICMP Group View
Table 3-1.
Application Views
3-6
SNMP ICMP Group View Information
Field
Definition
Echo
Displays the total number of times the hub received ICMP
Echo Request messages from another network device or
transmitted them to another network device. Echo Requests
test the availability of a device.
Echo Reply
Displays the total number of times the hub received ICMP
Echo Reply messages from a network device to which it
transmitted an Echo Request or the total number of times
the hub transmitted an Echo Reply to a network device from
which it received an Echo Request. Echo Replies confirm
availability of a network device.
TimeStamp
Displays the total number of times the hub received ICMP
TimeStamp Request Messages from another network device
or transmitted them to another network device. TimeStamp
Requests test the network time delay between devices.
TimeStamp Reply
Displays the total number of times the hub received ICMP
TimeStamp Reply messages from a network device to which
it transmitted a TimeStamp Request or the total number of
times the hub transmitted a TimeStamp Reply to a network
device from which it received a TimeStamp Request.
TimeStamp Replies confirm the network time delay between
devices.
Addr Mask
Request
Displays the total number of times the hub received ICMP
Address Mask Request Messages from another network
device or transmitted them to another network device.
Address Mask Requests are transmitted to determine the
subnet address mask associated with a local IP network.
Addr Mask Reply
Displays the total number of times the hub received ICMP
Address Mask Reply messages from a network device to
which it transmitted an Address Mask Request or the total
number of times the hub transmitted an Address Mask
Reply to a network device from which it received an Address
Mask Request. Address Mask Replies determine the subnet
address mask of a local IP network.
Cabletron Ethernet Hubs
Management Module Guide
Application View Description
SNMP IP Group View
SNMP IP Group View
You can access the SNMP IP Group View by clicking on the IP button in the
Application View. The SNMP IP Group View displays the following
information:
IP Forwarding
Displays whether the hub is operating as a gateway or a host.
Default TTL
Displays the default Time-To-Live (TTL) value, in seconds, that is found in the
IP header of datagrams if a TTL value was not provided by the transport layer
protocol.
In Packets
Displays the total number of datagrams received including those with errors.
In Header Errors
Displays the total number of received datagrams discarded due to invalid
addresses in their IP headers (e.g., bad checksum, version number mismatch,
time-to-live exceeded, etc.).
In Address Errors
Displays the total number of received datagrams discarded due to invalid
addresses in the IP header’s destination field. If the hub is not acting as a
gateway, this field includes datagrams discarded because the destination
address was not a local address.
Forward Datagrams
Displays the total number of received datagrams for which the hub, if acting
as a gateway, was not their final destination and an attempt was made to
route them to this destination. If the hub is not acting as a gateway, this field
displays the number of datagrams successfully routed through the IP Route
Table.
Unknown Protocol
Displays the total number of locally addressed datagrams received
successfully but discarded because of an unknown or unsupported protocol.
In Discards
Displays the total number of received datagrams discarded even though no
errors were encountered to prevent their continued processing. Such
datagrams may have been discarded to increase buffer space.
In Deliveries
Displays the total number of datagrams successfully delivered.
9030367 E8
Application Views
3-7
Application View Description
SNMP IP Group View
IP Add Table
This button allows you to access the IP Address Table. This table provides the
hub IP address, interface index, subnet mask and broadcast address. The
Print button allows you to print out a copy of the table to a printer or a file.
Double-clicking on a table entry opens the IP Address Table Information View.
Table 3-2 provides the information displayed by the IP Address Table
Information View.
Table 3-2.
IP Address Table Information View Fields
Field
Definition
IP Address
The IP address of the interface.
Interface
The number of the interface.
Net Mask Addr
The subnet mask address of the interface.
Broadcast Addr
The broadcast address of the interface.
IP Route Table
This button allows you to access the IP Route Table. This table provides a
description of each transmission route known by the hub. The Print button
allows you to print out a copy of the table to a printer or a file. Double-clicking
on a table entry opens the IP Route Table Information View. Table 3-3
provides the information displayed by the IP Route Table Information View.
Table 3-3.
Application Views
3-8
IP Route Table Information View Fields
Field
Definition
Destination Address
The destination IP address of this route. An
address of 0.0.0.0 is considered a default
route.
Local Interface
The local interface through which the next
hop on this route should be reached.
Next Hop Address
The IP address of the next hop on this route.
Route Type
Specifies the type of route. You may change
this by clicking on the button and selecting a
new choice. Possible values are: N/A, Other,
Invalid, Direct, and Remote.
Primary Metric_1
The primary routing metric for this route. If
this metric is not used, its value should be set
to -1.
Cabletron Ethernet Hubs
Management Module Guide
Application View Description
SNMP IP Group View
Table 3-3.
IP Route Table Information View Fields (Continued)
Field
Definition
Alternate Metric_2
Alternate routing metric for this route. If this
metric is not used, its value should be set to 1.
Alternate Metric_3
Alternate routing metric for this route. If this
metric is not used, its value should be set to 1.
Alternate Metric_4
Alternate routing metric for this
route. If this metric is not used, its
value should be set to -1.
Route Protocol
The protocol type of the route.
Route Age
The number of seconds since this route
was last updated or determined to be
correct.
More IP Stats...
This button allows you to display an additional SNMP IP Group View.
Table 3-4 displays the information supplied by the view.
Table 3-4.
9030367 E8
SNMP IP Group View Information
Field
Definition
Out Packets
Displays the total number of transmission requests from
the local IP network received by the hub.
Out Discards
Displays the number of transmitted datagrams discarded
even though no errors were encountered to prevent their
continued processing. Such datagrams may have been
discarded to increase buffer space.
Out No Routes
Displays the total number of IP datagrams discarded
because no route could be found to transmit them to their
destination address.
Reassembly
Timeout
Displays the maximum number of seconds that IP
datagram fragments are held by the hub while awaiting
reassembly.
Reassembled
Fragments
Displays the total number of IP datagram fragments
received by the hub that needed to be reassembled.
Reassembly OKs
Displays the total number of IP datagram fragments
successfully reassembled.
Application Views
3-9
Application View Description
IRBM MMAC Bridge Database View
Table 3-4.
SNMP IP Group View Information (Continued)
Field
Definition
Reassembly Fails
Displays the total number of IP datagram fragment
reassembly failures detected by the IP reassembly
algorithm due to time out, errors, etc.
Fragment OKs
Displays the total number of IP datagrams that have been
successfully fragmented by the hub.
Fragment Fails
Displays the total number of IP datagrams that could not
be fragmented by the hub because their Don’t Fragment
flag was set.
Fragment Creates
Displays the total of IP datagram fragments that have been
generated by the hub as a result of fragmentation.
IRBM MMAC Bridge Database View
You can access the IRBM MMAC Bridge Database View by clicking on the
Bridge Databases button in the IRBM MMAC Application View. The IRBM
MMAC Bridge Database View provides the following information:
Model Name
The user-defined or default name of the IRBM model.
Acquired Database
The following fields and buttons appear under the Acquired Database
heading:
Total Entries
The total number of entries in the acquired database.
Maximum Entries
The maximum number of entries allowed in the acquired database.
Static Entries
The number of addresses added to the acquired database by you or the
network manager.
Static Entry Age Lmt
The length of time allowed for a static entry in the acquired database to be
inactive before it is dropped from the database. This time is fixed at zero (0).
Dynamic Entries
The number of entries that have been accumulated in the acquired database
through the bridge’s learning process.
Application Views
3-10
Cabletron Ethernet Hubs
Management Module Guide
Application View Description
IRBM MMAC Bridge Database View
Dynamic Entry Age Lmt
The length of time allowed for a dynamic entry in the acquired database to be
inactive before it is dropped from the database.
Database Entries
This button allows you to erase (set to zero) all entries in the acquired
database.
Acquired Database Table
This button allows you to display the IRBM MMAC Acquired Database Table.
Table 3-5 provides the information displayed by the table. The Print button
allows you to print out a copy of the table to a printer or a file. Double-clicking
on entries in this table brings up entry-specific information views. The
Acquired Database Table View also provides a field in which you can enter a
new source address and a button that allows you to select filtering.
To add a new source address to the database, type the address into the New
Source Address field below the Acquired Database Table.
Select Filtering
This button allows you to acess an IRBM MMAC Filter Selection View that
lets you update filter selections for new source addresses.
Table 3-5.
IRBM MMAC Acquired Database Table
Field
Definition
Entry Type
The entry type: Static or Dynamic.
Source Address
The source of this acquired database entry, i.e, the
instance.
Port1 Out
The outbound port for packets entering port 1.
Port2 Out
The outbound port for packets entering port 2.
Permanent Database
The following fields and buttons appear under the Permanent Database
heading:
Current Entries
The number of entries currently recorded in the bridge’s permanent database.
9030367 E8
Application Views
3-11
Application View Description
UPS Statistics View
Maximum Entries
The maximum number of entries allowed in the permanent database.
Database Entries
This button allows you to erase (set to zero) all entries in the permanent
database.
Permanent Database Table
This button allows you to display the IRBM MMAC Permanent Database
Table. Table 3-6 provides the information displayed in the table. The Print
button allows you to print out a copy of the table to a printer or a file. Doubleclicking on entries in this table brings up entry-specific information views.
The Permanent Database Table View also provides a field in which you can
enter a new source address and a button that allows you to select filtering.
To add a new source address to the database, type the address into the New
Source Address field below the Permanent Database Table.
Select Filtering
This button allows you to access an IRBM MMAC Filter Selection View that
lets you update filter selections for new source addresses.
Table 3-6.
IRBM MMAC Permanent Database Table
Field
Definition
Entry Type
The entry type: Static or Dynamic.
Source Address
The source address of entries allowed in permanent
database.
Port1 Out
The outbound port for packets entering port 1.
Port2 Out
The outbound port for packets entering port 2.
UPS Statistics View
You can access the UPS Statistics View by clicking on the UPS button in the
IRM3 MMAC Application View. This view provides information on the status
of the UPS connected to the IRM3.
The UPS Statistics View contains a multi-attribute line graph that has a
scroll bar. You can use this graph to view performance statistics for the UPS.
Application Views
3-12
Cabletron Ethernet Hubs
Management Module Guide
Application View Description
UPS Statistics View
The UPS Statistics View is similar to a hub Performance View. For more
information on how to use this type of view, refer to Chapter 6, Performance
Views. The UPS Statistics View displays the following information:
Name
The user-defined or default name of the model.
Location
The location of the device as entered in the Creation dialog box when the
model was created. If no location has been specified, this field displays the
model name of the SPECTRUM location view containing the device.
Network Address
The Internet Protocol (IP) address of the device.
Device Type
The SPECTRUM Model Type (e.g., Hub_CSI_IRM3).
System Up Time
The time, displayed in days+hours:minutes:seconds, that the device has been
on-line.
Battery Capacity
The current battery capacity of the UPS. Values are displayed as a percentage.
Additional fields show the Average and the Peak Value of this quantity.
Battery Volts Out
The battery output voltage. Additional fields show the Average and the Peak
Value of this quantity.
AC Line Volts In
The input line voltage. Additional fields show the Average and the Peak Value
of this quantity.
UPS Model
This button allows you to select the Model of UPS in use. Possible selections
are: 370, 400, 600, 900, 1250, and 2000. The model assignment is not
information gathered from the UPS; rather, it is an assignment made from the
IRM3. This model type code needs to be assigned after the cable has been
connected between the IRM3 and the UPS and before any access to the UPS
MIB can take place.
UPS Status
Displays the test states. Possible states include Unit_OK, Unit_Failed,
Bad_Battery, No_Recent_Tests, and Unit_In_Test.
UPS Uptime in Hours
The amount of time that the UPS connected to the IRM3 has been running
since start-up.
9030367 E8
Application Views
3-13
Application View Description
UPS Statistics View
Test
This button allows you to initiate a test cycle on the UPS device. To place the
UPS into test mode, click on Initiate. The UPS Status field updates to reflect
the current status of the device.
Scroll to Date-Time
This button allows you to view historical data on UPS performance. Click on
this button to set the viewing area of the graph to begin at a specified date and
time.
Change Time Scale
This button allows you to specify the Y axis time scale for the graph.
Log/Lin
This button allows you to change how the multi-attribute line graph is
displayed. You can display the network statistics in Logarithmic or Linear
format.
Application Views
3-14
Cabletron Ethernet Hubs
Management Module Guide
Chapter 4
Configuration Views
What is in this Chapter
This chapter describes the Configuration View for Cabletron hub devices. The
Configuration View provides buttons that allow you to access increasingly
detailed views of network information. Table entries within views provide you
with double-click zones to navigate to device-specific Information Views.
Accessing the Configuration View
You can access the Configuration View using one of the following methods
(refer to Figure ):
• Double-click on the Configuration View label of the icon.
• Highlight the icon and select Configuration from the Icon Subviews
menu.
9030367 E8
4-1
Configuration View Description
Figure 4-1.
Accessing the Configuration View
Double-click
Close
Navigate
Alarms
Performance
Notes...
Utilities
Zoom
Configuration
Diagnostic
Acknowledge
Flash Green Enabled
Application
Device
DevTop
Select Configuration
Configuration View Description
The Configuration View presents model and device network configuration
information for Cabletron hubs. It provides information on the device model in
the VNM database and the device’s firmware configuration. Depending on the
device, other configuration information may be available in this view. The
Configuration View for Cabletron Ethernet Hubs is divided into two sections:
Model Configuration and Device Configuration. The IRBM Configuration
View also includes a Bridge Information section. Buttons at the bottom of the
view provide access to more detailed configuration information.
Configuration Views
4-2
Cabletron Ethernet Hubs
Management Module Guide
Configuration View Description
Model Configuration
NOTE
SPECTRUM uses the poll time and logging ratio attributes to determine how
often it will poll the device and re-read the configuration. The product of these
two attributes is the time frame used for polling. Resetting either of these
attributes to zero will disable polling. The default is 10 minutes.
Model Configuration
This area of the Configuration View provides the following information:
Model Name
The user-defined or default name of the model.
Network Address
The network IP address (e.g., 132.177.118.24).
Community Name
The Community Name that has been assigned locally to the hub.
Security String
The assigned security string for the device. (Refer toUser Security and User
Maintenance ) for information on setting up security in SPECTRUM.)
Polling Interval
The time, in seconds, between SpectroSERVER polls of the network for the
hub model.
Poll Log Ratio
The number of SpectroSERVER polls of a device that occur prior to logging
the poll results in the database.
Max Pull Boards
The maximum number of board models allowed in the pulled board list.
Polling Status
This button allows you to disable SpectroSERVER polls of a device by setting
Polling Status to False. This button is useful in disabling rollup conditions for
minor network events such as workstation power-downs. This button will also
set all of the models collected by this hub to false. If set to true, models
collected by this hub will be set to true.
Monitor Precedence
The monitor precedence value associated with the device. You must explicitly
reset this value to a higher value than that of the existing monitoring point to
designate this device as the monitoring point.
9030367 E8
Configuration Views
4-3
Configuration View Description
Device Configuration
Device Configuration
This area of the Configuration View provides the following information:
Device Name
The ASCII name of the device that this agent manages.
IP Address
The network IP address (e.g., 132.177.118.24).
PROM Revision
The revision number of the hub firmware.
MMAC Type
The type of MMAC, for example, 3, 5, or 8-slot MMAC (e.g., MMAC3, MMAC5,
MMAC8). You supply the MMAC type when you create the icon. The default is
MMAC8. This button is not available in the MRXI or the MiniMMAC
Configuration Views.
Port Association
This button allows you to select the state of operation of AUI and Fiber ports
on the device. This button is not available in the IRM, MRXI, or MiniMMAC
Configuration Views. Possible states include some subset of the following
states:
AUI_Brdg\Fiber_Off
AUI_Off\Fiber_Brdg
AUI_Brdg\Fiber_Rptr
AUI_Rptr\Fiber_Brdg
AUI_Off\Fiber_Rptr
AUI_Rptr\Fiber_Off
Current Date
A character representation of the current date. This field does not appear in
the MRXI Configuration View.
Current Time
The current time of day as measured by the device. This field does not appear
in the MRXI Configuration View.
Ports On Out Of
The number of operating ports on the device out of the total number of ports.
Configuration Views
4-4
Cabletron Ethernet Hubs
Management Module Guide
Configuration View Description
Bridge Information
Bridge Information
This section of the Configuration View is available only for the IRBM hub. The
Configuration View button found in this section accesses the IRBM Bridge
Configuration View, which is described later in this chapter.
Configuration View Buttons
This section of the Configuration View contains buttons that provide access to
device-specific information views. This section provides the following buttons:
Find Source Address
This button allows you to access the hub’s Source Address View, which is
described later in this chapter. This button is not available in the IRM or the
MRXI Configuration Views.
Source Address Table
This button allows you to access the Device Source Address Table, which is
described later in this chapter. This button is not available in the IRM or the
MRXI Configuration Views.
Control
This button allows you to access the Control View, which is described later in
this chapter.
Config Alarms
This button allows you to access the Configure Alarms View, which is
described later in this chapter. This button is not available in the IRM
Configuration View.
Redundancy
This button allows you to access the MMAC Redundancy View, which is
described later in this chapter. This button is not available in the IRBM or the
IRM Configuration Views.
9030367 E8
Configuration Views
4-5
Configuration View Description
Source Address View
Flash Download
This button allows you to access the Flash DownLoad View. This button is
available only in the IRM3, MRXI, and MiniMMAC Configuration Views.
Additional Configuration
This button allows you to access an additional configuration view, which is
described later in this chapter. This button is available only in the IRM2 and
IRM3 Configuration Views.
Community Table
This button allows you to access the Community and Trap Table View, which
is described later in this chapter. This button is available only in the IRM2
and IRM3 Configuration Views.
Source Address View
You can access the Source Address View by clicking on the Find Source
Address button in the Configuration View. This view gives you the ability to
trace a MAC address to the board and port where the address is detected, and
provides the following information. This view is not available for IRM or the
MRXI hubs.
Model Name
The user-defined or default name of the model.
Network Address
The network IP address (e.g., 132.177.118.24).
Source Address
User-defined MAC address using the format xx.xx.xx.xx.xx.xx.
Find Board/Port
This button allows you to access the Source Address Board/Port Location
View. Figure 4-1 provides the information contained in the view.
Configuration Views
4-6
Cabletron Ethernet Hubs
Management Module Guide
Configuration View Description
Device Source Address Table
Table 4-1.
MMAC Source Address Board/Port Location View Fields
Field
Definition
Model Name
The user-defined or default name of the hub model.
Network Address
The network IP address (e.g., 132.177.118.24).
Source Address
User-defined MAC address using the format
xx.xx.xx.xx.xx.xx.
Board Number
The board number where the MAC address is detected.
Port Number
The port number where the MAC address is detected.
Device Source Address Table
You can access the Device Source Address Table by clicking on the Source
Address Table button in the Configuration View. You can sort, update, and
search the table for certain MAC addresses. To display the Sort and Find
options, click on a column heading. To use the Find option, click on the Find
button and enter the MAC address to search for. This view provides the
following information. This view is not available for the IRM or the MRXI
hubs.
Name
The user-defined or default name of the model.
Network Address
The network IP address (e.g., 132.177.118.24).
Device Type
The SPECTRUM model type name of the hub.
System Up Time
The time the hub has been active without failure. The time is displayed in the
following format: days+hours:minutes:seconds.
Control View
You can access the Control View by clicking the Control button in the
Configuration View. This view provides the following information:
Model Name
The user-defined or default name of the hub model. This field does not appear
in the IRM Control View.
Device Name
An ASCII name of the device that this agent manages. This field does not
appear in the IRM Control View.
9030367 E8
Configuration Views
4-7
Configuration View Description
Control View
Network Address
The network IP address (e.g., 132.177.118.24). This field does not appear in
the IRM Control View.
Counters
This button allows you to reset all of the device’s counters to 0.
Restart Device
This button allows you to restart the device.
Device Redundancy
This button allows you to reset the redundancy for the entire hub. This button
is not available in the IRBM or the IRM Control Views.
Device Discover
This button causes the device and all devices connected to it to send Link-up
traps. This button is not available in the IRM, IRM3, or MRXI Control Views.
Source Address Age Time
The number of seconds that a source address is not detected before it is
removed from the source address table. This field does not appear in the IRM
or MRXI Control Views.
Source Address Traps
This button controls sending of source address related traps. Possible options
are TrapsOn and TrapsOff. This button is not available in the IRM or MRXI
Control Views.
Source Address Lock
This button indicates whether detection of source addresses on a port that are
not in the source address table will cause the port to be turned off. Possible
states are LockOff and LockOn. If a port is turned off, an event and alarm will
be generated to warn you of this condition. This button is not available in the
IRM or MRXI Control Views.
Configuration Views
4-8
Cabletron Ethernet Hubs
Management Module Guide
Configuration View Description
Configure Alarms View
Factory Defaults
This button allows you to reset the device’s settings to their factory defaults.
This button is only available in the IRM2 and IRM3 Control Views. (Does not
affect IP address)
Configure Alarms View
You can access this view by clicking on the Config Alarms button in the
Configuration View. This view allows you to set threshold alarms and enable
them. The Configure Alarms View is not available for the IRM hub. This view
contains the following information:
Model Name
The user-defined or default name of the model.
Device Name
The ASCII name of the device read from the device firmware.
Network Address
The network IP address (e.g., 132.177.118.24).
Traffic Alarms
This button allows you to Enable or Disable detection of Traffic Alarms.
Traffic Threshold
The threshold value within the alarm timebase which, once that number of
packets is exceeded, generates a traffic alarm.
Collision Alarms
This button allows you to Enable or Disable detection of device-level Collision
Alarms.
Collision Threshold
The threshold value within the alarm timebase which, once that number of
collisions per good packet is exceeded, generates a collision alarm. Possible
values range from 1 to 15.
Error Alarms
This button allows you to Enable or Disable detection of Error Alarms. This
button is not available in the MRXI Configure Alarms View.
9030367 E8
Configuration Views
4-9
Configuration View Description
Configure Alarms View
Error Threshold
The threshold value within the alarm timebase which, once the percentage of
errors per good packet is exceeded, generates an error alarm. This field is not
available in the MRXI Configure Alarms View.
Broadcast Alarms
This button allows you to Enable or Disable detection of Broadcast Alarms.
This button is available only in the IRM2 and IRM3 Configure Alarms Views.
Broadcast Threshold
The threshold value within the alarm timebase which, once that number of
broadcasts received is exceeded, generates a broadcast alarm. This field is
available only in the IRM2 and IRM3 Configure Alarms Views.
Time Base
The number of seconds used as the interval for performing all of the rate
alarm checks. The minimum is 10 seconds. For example, if the time base is 10
seconds, an alarm will occur only when the specified number of errors occurs
within 10 seconds.
Audible Alarm
This button allows you to Enable or Disable the audible alarm in the hub. You
must have a community name with Read/Write permission to update this
feature. This button is available only in the IRM2 and IRM3 Configure Alarms
Views.
Sound Audible Alarm
This button permits a management station to turn off a sounding alarm.
Attempting to change this button to the ON position may result in a write
failure error. You must have a community name with Read/Write permission
to update this feature. This button is available only in the IRM2 and IRM3
Configure Alarms Views.
Configuration Views
4-10
Cabletron Ethernet Hubs
Management Module Guide
Configuration View Description
Redundancy View
Error Source Table
The Configure Alarms View also displays an Error Source Table, which
displays a series of buttons which allow you to select the types of errors that
will cause alarms. Table 4-2 provides the definitions of the errors contained in
the Error Source Table.
Table 4-2.
Error Source Table Fields
Error
Definition
Align
Measures the number of misaligned frames detected by the
hub.
Runts
Measures the number of runt frames detected by the hub.
Giants
Measures the number of packets longer than 1,518 bytes
detected by the hub.
CRC
Measures the number of packets with bad Cyclic
Redundancy Checks (CRCs) detected.
OOW
Measures the number of Out-Of-Window (OOW) collisions
detected by the hub.
No_Resource
Measures the number of No_Resource errors detected by the
hub.
Redundancy View
You can access the Redundancy View by clicking on the Redundancy button in
the Configuration View. This view is not available for the IRBM or the IRM
hubs. The Redundancy View provides the following information:
Model Name
The user-defined or default name of the model.
Device Name
An ASCII name of the device that this agent manages.
Maximum Circuits
The maximum number of circuits.
Available Circuits
The number of available circuits. This field does not appear in the IRM3
Redundancy View.
Redundant Poll Interval
The number of seconds between polls for redundancy.
9030367 E8
Configuration Views
4-11
Configuration View Description
Redundancy View
Test Redundant Circuits
This button allows you to test the redundant circuit.
Test Time of Day
The time of day at which the redundant circuits should be tested. This field is
not available in the MRXI Redundancy View.
Redundancy Table
This button allows you to display the MMAC Redundancy Table. The
Redundancy Table allows you to set up redundant circuit connections between
any two or more hubs that have redundant capability in their firmware. For
more information on setting up redundant circuits, refer to Hub Redundancy
Management in this chapter.
You can double-click on any of the circuit names in the Redundancy Table to
access the MMAC Redundancy Information View. This view lets you set up
redundancy circuits. Table 4-3 provides the information contained in the view.
Table 4-3.
MMAC Redundancy Information View Fields
Field
Configuration Views
4-12
Definition
Circuit Name
The name of the indicated circuit.
Retry Count
The number of unanswered polls allowed for the
indicated circuit before the current connection is
declared bad.
Bd/Port Combination
The number of board/port combinations associated
with the indicated circuit.
MAC Address Add
(IRM2, MRXI,
MiniMMAC)
Adds the Ethernet address to the polling list for the
indicated circuit.
IP Address Add (IRM3)
Adds the IP address to the polling list for the indicated
circuit.
Number of Addresses
The number of addresses associated with the indicated
circuit.
Circuit Enable
Enables or disables the indicated circuit.
Circuit Number
The number from the circuit names in the Redundancy
table (e.g., Circuit 04).
Board Port Instance
The board number and port number that the
redundant circuit is connected to. For example, 3.6 is
board 3, port 6.
Port Circuit Status
The current state of this port in the redundant circuit.
Port Circuit Type
The type of port this port is in the redundant circuit.
Cabletron Ethernet Hubs
Management Module Guide
Configuration View Description
Redundancy View
Panels at the bottom of the Redundancy Information View provide additional
information. For the IRM2, MRXI, and MiniMMAC, the panels are Board
Member, Port Member, and Redundancy Table. For the IRM3, there are two
Redundancy Table panels. Double-clicking on any of the entries in the Polled
Address list of the Redundancy Table for the IRM2, MRXI, or MiniMMAC
opens the Address Display View. The Address Display View has two fields:
Polled Address, which is the MAC address, and Instance, which is the
board number and port number associated with the address. For example, 1.1
is board 1, port 1. The IRM3 has no Address Display View.
The Redundancy Information View also provides the following two buttons:
Address Delete View
The Address Delete View button displays the Address Delete View. This
view contains the Redundancy Table and a field. Table 4-4 provides the
information contained in the view.
Table 4-4.
Address Delete View Fields
Field
Definition
MAC Address Delete
(IRM2), MRXI,
MiniMMAC
Removes the Ethernet address from the polling list
for the indicated circuit. You enter a MAC address in
this field.
IP Address Delete
(IRM3)
Removes the IP address from the polling list for the
indicated circuit. You enter an IP address in this field.
The IRM2, MRXI, and MiniMMAC Address Delete Views allow you to doubleclick on the Polled Addresses in the Redundancy Table to access an Address
Display View. The Address Display View has two fields: Polled Address,
which is the MAC address, and Instance, which is the board number and port
number associated with the address. For example, 1.1 is board 1, port 1.
Reset Circuit View
This button allows you to access the Circuit Reset View. This view allows you
to reset a single Redundancy circuit. Table 4-5 provides the information
contained in the view.
Table 4-5.
Circuit Reset View Fields
Field
9030367 E8
Definition
Circuit Number
The circuit number to be reset.
Circuit Reset
Resets the indicated circuit.
Configuration Views
4-13
Configuration View Description
Redundancy View
Flash Download View
You can access the Flash Download View by clicking on the Flash Download
button in the Configuration View. This view is available only for the IRM3, the
MRXI, and the MiniMMAC hubs. The Flash Download View displays the
following information:
Model Name
The user-defined or default name of the hub model.
Network Address
The network IP address (e.g., 132.177.118.24).
Last Image Filename
The filename of the last image to be loaded into flash memory successfully.
Last Server IP Address
The IP address of the file server used to load the image presently in flash
memory.
Flash Size in Bytes
The size in bytes of the flash memory contained in the module.
Flash Count
The number of times that the flash memory has been reprogrammed. This
value is initialized to 1 upon initial power up of the device.
Firmware Base Address
The starting address of the firmware in RAM.
Firmware Top Address
The ending address of the firmware in RAM.
Firmware Start Address
The jump address of the firmware in RAM as established by the boot process.
DownLoad Software
This button allows you to access the DownLoad Software View. This view
allows you to upgrade the hub’s firmware from a TFTP Boot Server.
Table 4-6describes the fields provided by this view.
Table 4-6.
DownLoad Software View Field Definitions
Field
Configuration Views
4-14
Definition
Model Name
The user-defined or default name of the hub model.
Network Address
The network IP address (e.g., 132.177.118.24).
Cabletron Ethernet Hubs
Management Module Guide
Configuration View Description
Redundancy View
Table 4-6.
DownLoad Software View Field Definitions (Continued)
Field
Definition
Force On Boot
When set to Server, the boot software will attempt to boot
from the TFTP boot server. If no boot is found and flash
memory is valid, the device will boot from the flash memory
regardless of the setting for this variable. When set to
Flash_Memory, the device will boot from flash memory.
TFTP Request
Host
A user-defined IP address of the server to be used when the
firmware is to be loaded over the network.
TFTP Request
FileName
A user-defined filename that is requested of the server when
the firmware is to be loaded over the network.
RAM To Flash
When set to Commit, the boot software will erase the flash
memory, compress the download code, and save the
compressed image into flash memory.
Cold Boot
When set to Initiate, the boot software will initiate a reboot
of the system. All MIB variables in this view used to control
the exact nature of the download should be set prior to the
setting of this variable.
Additional Configuration View
You can access the Additional Configuration View by clicking the Additional
Configuration button in the Configuration View. In addition to the model
name and network address, this view shows three panels, each with eight slot
designations. The panels are labeled Ethernet MIMs, Token Ring MIMs, and
FDDI MIMs. When the button next to a slot number is depressed, it means
that a MIM of that type is installed in the slot. This view is available only for
the IRM2 and IRM3 hubs.
Community and Trap Table
You can access the Community and Trap Table by clicking the Community
Table in the Configuration View. The Sort buttons allow you to alter the
display format of the table. The Find button allows you to search the name
column to locate a specific community name. Clicking on a column heading
allows you to access the Sort and Find Buttons. The Update button allows
you to update the contents of the table. Double-clicking on any entry in the
Community and Trap Table opens the Community Table Detail View specific
to the selected table entry. This view allows you to modify the statistics and
parameters for the device. Table 4-7 provides definitions of the Community
Table Detail View. The Community and Trap Table is available only for the
IRM2 and IRM3 hubs. This table provides the following information:
9030367 E8
Configuration Views
4-15
Configuration View Description
Redundancy View
NOTE
You must have Administrative Privileges to access the Community and Trap
Table View and all subviews. Without superuser access you cannot access or
change any of the information displayed in this view.
Name
Displays the community name.
Access
Displays the user access permissions.
Traps
Displays the current status of traps. Possible values are enabled or disabled.
IP Addr
Displays the trap host IP address. This is the IP address traps are sent to if
they are enabled.
Table 4-7.
Community Table Detail View Field Definitions
Field
Configuration Views
4-16
Definition
Device Name
The name of the physical device.
Model Name
The user-defined or default name of the hub model.
Community String
The current community name.
Access
The user access permissions for the community name.
Possible values are: none, readonly, readwrite, and
superuser.
Trap Host
The IP address of the host to which traps will be sent.
Traps
Toggles trap generation. Possible values are: enabled or
disabled.
Cabletron Ethernet Hubs
Management Module Guide
Configuration View Description
Bridge Configuration View
Bridge Configuration View
You can access the Bridge Configuration View by clicking on the Configuration
View button in the Bridge Information section of the Configuration View. This
view is available only for the IRBM hub. The IRBM Bridge Configuration
View is divided into two sections: Model Configuration and Device
Configuration. In addition, buttons at the bottom of the screen provide access
to more detailed informational views.
Model Configuration
This section of the Bridge Configuration View provides the following
information:
Model Name
The user-defined or default model name.
Network Address
The network IP address (e.g., 132.177.118.24).
Community Name
The Community Name that has been assigned locally to the hub.
Security String
The IRBM’s assigned security string. (Refer to User Security and User
Maintenance for information on setting up security in SPECTRUM.)
Polling Interval
The time, in seconds, between SpectroSERVER polls of the network for the
hub model.
Poll Log Ratio
The number of SpectroSERVER polls of a device that occur prior to logging
the poll results in the database.
Device Configuration
This section of the Bridge Configuration View provides the following
information:
Bridge Name
The user-defined name of the bridge. The default is ETHERNET BRIDGE.
Bridge Type
The type of bridge (e.g., NB25E, IRBM, or NB20E).
Bridge Location
The user-defined name to indicate the location of the bridge on the network.
The default location is LOCAL.
9030367 E8
Configuration Views
4-17
Configuration View Description
Bridge Configuration View
Firmware Version
The release version of the firmware installed in the bridge.
Number of Ports
The number of ports present on the bridge.
Configuration View Buttons
This section of the Bridge Configuration View contains buttons that provide
access to more specific information views. This section provides the following
buttons:
Bridge/Root Information
This button allows you to access the Bridge/Root Information View. Table 4-8
provides the information contained in the view.
Table 4-8.
SNMP ICMP Group View Fields
Field
Definition
Model Name
The user-defined or default name of the model.
Root Bridge ID
The unique identifier of the bridge recorded as the root.
Root Port
The port identifier for the port that provides the lowest cost
path to the root (i.e., that port for which the sum of values of
the designated cost and path cost parameters held for the
port is lowest).
Root Cost
The cost of the path to the root from this bridge.
Root Brdg Max
Age
The value of the Max Age parameter when the bridge is the
root or is attempting to become the root. A time of 6 to 40
seconds is allowed. The default is 20 seconds.
Additional Bridge Information
This button allows you to access the Additional Bridge Information View.
Table 4-9 provides the information contained in the view.
Configuration Views
4-18
Cabletron Ethernet Hubs
Management Module Guide
Configuration View Description
Bridge Configuration View
Table 4-9.
Additional Bridge Information View Fields
Field
Definition
Model Name
The user-defined name or default name of the model.
Bridge Priority
The part of the bridge address that contains the identifier
used in the spanning tree for priority comparisons. The
allowed range is 0 through FFFF. The default is 8000.
Hold Time
The minimum time period elapsing between the
transmission of configuration BPDUs through a given bridge
port.
Protocol Max Age
The maximum age of received protocol information before it
is discarded.
Trap Type Obj ID
Contains the object identifier of the first VarBinding in the
last trap generated by the bridge.
Bridge Setup Information
This button allows you to access the Setup Information View. Table 4-10
provides the information contained in the view.
Table 4-10.
Setup Information View Fields
Field
9030367 E8
Definition
Model Name
The user-defined name or default of the model.
Bridge ID
The unique identifier of the bridge. The first two bytes of the
identifier are the bridge priority and the last six bytes are the
Ethernet address.
Switch Settings
The current switch settings read from the bridge hardware.
Number of
Restarts
The number of times the bridge has been powered up or
restarted.
Type of Filtering
The type of filtering to be performed by the bridge. The
default is IEEE 802.1.
STA Protocol
The spanning tree algorithm under which the bridge is
operating. Selections include: 802.1-compliant spanning tree
algorithm environment (802.1), DEC LAN Bridge 100
environment (DEC) and without spanning tree algorithm
enabled (None). The default is 802.1.
Configuration Views
4-19
Configuration View Description
Bridge Configuration View
Topology Information
This button allows you to access the Topology Information View. Table 4-11
provides the information contained in the view.
Table 4-11.
Topology Information View Table Fields
Field
Definition
Model Name
The user-defined or default name of the model.
Time Topology
Change
The time in seconds that has elapsed since the bridge’s
Topology Change Flag last recorded the value of a topology
change.
Topology Change
Indicates if a bridge Topology change is in progress.
Topology Change
Count
The number of times the bridge’s Topology Change Flag has
been changed since the bridge was powered up or initialized.
Fwd Dly & Hello Information
This button allows you to access the Forward Delay & Hello Information View.
Table 4-12 provides the information contained in the view.
Table 4-12.
Forward Delay & Hello Information View Fields
Field
Configuration Views
4-20
Definition
Model Name
The user-defined or default name of the model.
Forward Delay
Parm
The value of the forward delay parameters when the bridge
is the root or attempting to become root. A time of 4 to 30
seconds is allowed.
Forward Delay
The time spent in the listening state while moving from the
blocking state to the learning state, or the time spent in the
learning state while moving from the listening state to the
forwarding state.
Hello Time Parm
The value of the Hello Time parameter when the bridge is
the root or is attempting to become the root. A time of 1 to 10
seconds is allowed. The default is 2 seconds.
Hello Time
The time interval between the transmission of Configuration
BPDUs by a bridge that is attempting to become the root.
Cabletron Ethernet Hubs
Management Module Guide
Hub Redundancy Management
Control
This button allows you to access the IRBM Bridge Control View. Table 4-13
provides the information contained in the view.
Table 4-13.
IRBM Bridge Control View Fields
Field
Definition
Current Bridge
Status
The status of the bridge, for example, ON-LINE, STAND BY,
or DISABLED.
Bridge Status
Control
Enables or disables the bridge.
Bridge Restart
Forces the bridge to undergo a software reset.
Bridge Settings
Restores the bridge settings to their default values.
Hub Redundancy Management
The hub redundancy management features described in this section include
information specific to the following Cabletron hub devices:
•
•
•
•
NOTE
IRM2
IRM3
MRXI
MiniMMAC
The SIRM and the IRBM hub devices do not have redundant circuit
compatibility available in their device firmware.
SPECTRUM allows redundant “circuit” connections between any two or more
hub devices that have redundant capability in their firmware. A circuit is
represented by a cable connection from one module port on a primary hub
device to one or more module ports on secondary hub devices. The cable
connections can use any valid cable type, including thin-net, coaxial, fiber
optic, or AUI. The terminating connectors used depend on the type of cable
connecting the module ports.
Any two or more cable connections create a complete circular “circuit”
pathway between the two devices. One pathway is always set up as primary
and the others as secondary. The secondary circuit becomes active if the
9030367 E8
Configuration Views
4-21
Hub Redundancy Management
primary pathway fails. This allows the primary hub device to repeat data
packet information on an alternative module port if a problem exists on the
primary port.
Although circuit connections typically occur between devices in the same
room, the circuit connections can also occur over longer distances between
floors or buildings (with the proper FDDI cables and associated modules).
Refer to Figure 4-2 for an illustration of a typical redundant cable circuit
connection between two redundant hub devices.
Configuration Views
4-22
Cabletron Ethernet Hubs
Management Module Guide
Hub Redundancy Management
Figure 4-2.
Redundantly Connected Hub Device
Primary Hub Device
5
MT8
S
1 5
IRB
MT8
S
S
1
2 4
4
2
M
BM
ON
ST
RC
DN
CR
PO
ON
RH
NK
DN
CR
PO
C
O
N
R L
R L
R L
R L
6
3 6
3
C
O
8
4 8
4
A
NS LK
F
TH O
RH
ETHE
Backup Inactive Circuit
Primary Active Circuit
5
MT8
S
1 5
IRB
MT8
S
S
1
2 4
4
2
M
BM
ON
ST
RC
DN
CR
PO
ON
RH
NK
DN
CR
PO
C
O
N
R L
R L
R L
R L
6
3 6
3
C
O
8
4 8
4
A
NS LK
F
TH O
RH
ETHE
Secondary Hub Device
The following example illustrates redundancy between hubs.
Say that you have used redundant circuit management to create a connection
between the Accounting Department and the Payroll Department of your
company. These departments are on the same floor and have two repeaters
between them on an Ethernet network. Suppose a system overload occurred
9030367 E8
Configuration Views
4-23
Hub Redundancy Management
Setting Redundant Circuits
when you were sending direct deposit payroll information from the Payroll
Department to the Accounting Department the night before payday. This
could be a disastrous situation.
Redundant circuit management would prevent this situation by allowing the
primary hub device to automatically switch from the primary circuit to the
secondary circuit. The backup circuit would become active and continue
sending data over its cable connection. Redundancy becomes especially
important for unattended night time batch jobs, or for jobs where a
communications problem could seriously interfere with normal business
operations.
Setting Redundant Circuits
The following procedure uses an IRM2 hub device as an example. However,
this procedure can also be used with MRXI and MiniMMAC hubs as primary
devices. The secondary device can be any hub device with redundancy
capability (e.g., MRXI, MiniMMAC, IRM2, IRM3). This procedure may also be
used to configure multiple secondary hub devices.
NOTE
These instructions assume that you have a primary MMAC hub module port
physically attached to a secondary MMAC hub module port. Both these
modules must have redundant circuit capability. The backup port connection
cannot be completed until you have set up the active connection in
SPECTRUM. For convenience, you should also prepare a list of secondary hub
Ethernet addresses before beginning this procedure.
Also, SNMP devices require the use of the Community Name attribute. The
SPECTRUM default of “public” grants read-only privileges, which allow you
to view device attributes, but not modify them. Since setting up redundancy
requires modifying the device attributes, you should set the Community Name
to “ctron,” which grants read/write privileges. You can set the Community
Name when you create the device or change it in the Device Configuration
View.
To set redundant circuits for the devices modeled in SPECTRUM, follow these
steps:
1. Click on the icon to select it.
2. If contact has been established and the icon is green, bring up the
Configuration View.
3. From the Configuration View menu, click on the Redundancy button. In
the Redundancy View window, click on Redundancy Table.
Configuration Views
4-24
Cabletron Ethernet Hubs
Management Module Guide
Hub Redundancy Management
Setting Redundant Circuits
4. Choose any circuit from the Circuit Name list that appears by doubleclicking on it. A Redundancy Information View window appears.
5. Set the Retry Count to any value between 1 and 10, inclusive.
6. For any of the devices other than the IRM-3 enter the Ethernet address of
the secondary hub device, which will be polled, in the MAC Address Add
field. This field should allow you to enter the address in any of the
following formats (where X is any hexadecimal value from 0 to F):
XX.XX.XX.XX.XX.XX
XX:XX:XX:XX:XX:XX
XX-XX-XX-XX-XX-XX
For the IRM-3, enter the IP address of the secondary hub device, which will be
polled, in the IP Address Add field. You should enter this address in the
format NNN.NNN.NNN.NNN (where NNN is a decimal number from 0 to
255).
7. Enter the Board Port Instance for the primary connection. For example, if
the primary connection is on port 4 of a module in the device’s fifth slot,
the Board Port Instance would be 5.4. (Modules on these devices start
from 1 and can go up to 8 depending on the MMAC type.)
8. Change the Port Circuit Status to Active and the Port Circuit Type to
Primary.
9. Choose Save All Changes from the File menu. This will save the circuit
configuration you entered.
10. Now change the Board Port Instance to represent the backup connection.
Change the Port Circuit Status to Inactive and the Port Circuit Type to
Backup.
11. Choose Save All Changes from the File menu. This will save the circuit
configuration you entered for the backup connection.
12. Close this Redundancy Information View and then bring it up again.
Verify that the redundancy setup information is present and correct.
13. Click on the Circuit Enable field and choose Enable. This enables the
circuit that was created on the primary hub device. Choose Save All
Changes from the File menu.
14. Now physically connect the secondary circuit between the two hub
devices. To test the redundancy, disconnect the primary circuit and make
sure the backup circuit becomes active.
9030367 E8
Configuration Views
4-25
Hub Redundancy Management
Setting Redundant Circuits
Configuration Views
4-26
Cabletron Ethernet Hubs
Management Module Guide
Chapter 5
Diagnostic Views
What is in this Chapter
This chapter describes the Diagnostic View for Cabletron hub devices. The
Diagnostic View provides a complete breakdown of network errors gathered
by the Cabletron hub on a network segment. Each error attribute is
summarized over two intervals: the Total number counted since the device
was powered on; and the Last Poll, which is the number counted since the last
poll.
Accessing the Diagnostic View
You can access the Diagnostic View using one of the following methods (refer
to Figure ):
• Double-click on the Diagnostic View label of the icon.
• Highlight the icon and select Diagnostic from the Icon Subviews menu.
9030367 E8
5-1
Diagnostic View Description
Figure 5-1.
Accessing the Diagnostic View
Double-click
Close
Navigate
Alarms
Performance
Notes...
Utilities
Zoom
Configuration
Diagnostic
Acknowledge
Flash Green Enabled
Application
Device
DevTop
NOTE
Select Diagnostic
There is no Diagnostic View for the IRBM, IRM2, IRM3, or MiniMMAC hub.
Following the procedure to open the Diagnostic View will open the hub
Performance View instead.
Diagnostic View Description
The Cabletron hub Diagnostic View provides the following navigational
features:
• Buttons allow you to access increasingly detailed views of network
information, to select a graphical representation for the error attributes,
and to bring up the Events and Alarms Log Views.
Diagnostic Views
5-2
Cabletron Ethernet Hubs
Management Module Guide
Diagnostic View Description
SIRM Hub
• Table entries within views provide double-click zones, which navigate you
to device-specific Information Views.
SIRM Hub
The Cabletron SIRM MMAC Diagnostic View provides the following
information:
Model Name
The user-defined or default name of the model.
Device Name
The ASCII name of the device read from the device firmware.
Network Address
The network IP address (e.g., 132.177.118.24).
Total
The total number of collisions counted since the device was powered on.
Last Poll
The number of collisions counted since the last poll.
Total Collisions
This button displays a graph showing SIRM MMAC Hub Collisions. The
graph has a scroll bar that allows you to view the history of the hub collision
statistics. The bottom axis of the graph shows the time in seconds broken into
five minute intervals. The right axis shows the rate of collisions that occurred
in the last polling interval. There is also a small box on the graph that shows
the rate of collisions counted during that last polling interval.
Events
This button allows you to access the Event Log containing a list of network
events specific to the hub. You can scroll through the Event Log using the
menu or the scroll bars.
Alarms
This button allows you to access the IRM MMAC Alarms View. The Alarms
View displays a list of current network alarms. For information on how to use
the Alarms View, refer to Enterprise Alarm Manager.
9030367 E8
Diagnostic Views
5-3
Diagnostic View Description
MRXI Hubs
MRXI Hubs
The Cabletron MRXI Hub Diagnostic View provides the following information:
Model Name
The user-defined or default name of the model.
Device Name
The ASCII name of the device read from the device firmware.
Total (Receive Collisions)
The total number of receive collisions detected by the MRXI Hub.
Total (Transmit Collisions)
The total number of transmit collisions detected by the MRXI Hub.
Last Poll (Transmit Collisions)
The number of transmit collisions detected by the MRXI Hub since
SPECTRUM last polled the device.
Last Poll (Receive Collisions)
The number of receive collisions detected by the MRXI Hub since SPECTRUM
last polled the device.
Receive Collisions
This button allows you to access a graph showing MRXI Hub Receive
Collisions. The graph has a scroll bar that allows you to view the history of the
hub collision statistics. The bottom axis of the graph shows the time in
seconds broken into five minute intervals. The right axis shows the rate of
collisions that occurred in the last polling interval. There is also a small box
on the graph that shows the rate of collisions counted during that last polling
interval.
Transmit Collisions
This button allows you to access a graph showing MRXI Hub Transmit
Collisions. The graph has a scroll bar that allows you to view the history of the
hub collision statistics. The bottom axis of the graph shows the time in
seconds broken into five minute intervals. The right axis shows the rate of
collisions that occurred in the last polling interval. There is also a small box
on the graph that shows the rate of collisions counted during that last polling
interval.
Diagnostic Views
5-4
Cabletron Ethernet Hubs
Management Module Guide
Diagnostic View Description
MRXI Hubs
Events
This button allows you to access the Event Log containing a list of network
events specific to the hub. You can scroll through the Event Log using the
menu or the scroll bars.
Alarms
This button displays the MRXI MMAC Alarms View. The Alarms View
displays a list of current network alarms. For information on how to use the
Alarms View, refer to the SPECTRUM Opertator’s Reference.
9030367 E8
Diagnostic Views
5-5
Diagnostic View Description
MRXI Hubs
Diagnostic Views
5-6
Cabletron Ethernet Hubs
Management Module Guide
Chapter 6
Performance Views
What is in this Chapter
This chapter describes the Device, MIM, and Port Performance Views
available for Cabletron hub devices.
• The Device Performance View provides traffic data attributes for the
traffic on the network segments connected to the Cabletron hub device.
• The MIM Performance View for Cabletron Ethernet hubs displays
network statistics and information for each module installed in a hub
chassis.
• The Port Performance View for Cabletron Ethernet hubs displays network
statistics and information for individual ports on a MIM board.
These views summarize traffic flow (in bytes and packets), and gives a
statistical and graphical breakdown of traffic by packet size.
Device Performance View
The Cabletron hub Device Performance View provides the following
navigational features:
• Buttons allow you to access increasingly detailed views of network
information, and select graphical representations for each traffic
attribute.
• Table entries within views provide double-click zones which navigate you
to device-specific Information Views.
9030367 E8
6-1
Accessing the Device Performance View
The following sections describe the fields and buttons available for individual
Cabletron hub devices.
Accessing the Device Performance View
You can access the Device Performance View using one of the following
methods (refer to Figure ):
• Double-click on the Performance View label of the icon.
• Highlight the icon and select Performance from the Icon Subviews
menu.
Figure 6-1.
Accessing the Device Performance View
Double-click
Close
Navigate
Alarms
Performance
Notes...
Utilities
Zoom
Configuration
Diagnostic
Acknowledge
Flash Green Enabled
Application
Device
DevTop
Performance Views
6-2
Select Performance
Cabletron Ethernet Hubs
Management Module Guide
Accessing the Device Performance View
IRBM, IRM2, IRM3 and MiniMMAC Hubs
IRBM, IRM2, IRM3 and MiniMMAC Hubs
The Performance View displays monitoring point performance statistics
gathered by SPECTRUM. These statistics include load, error rate, frame rate
and collision rate. The banner across the top of the Performance View provides
information about the monitoring point. The border color of the banner
indicates the device status. The banner area contains the following fields:
Name
The user-defined or default name of the model.
Location
The location of the device as entered in the Creation dialog box when the
model was created. If no location has been specified, this field displays the
model name of the SPECTRUM location view containing the device.
Network Address
The network IP address of the device.
Device Type
The SPECTRUM Model Type (e.g., Hub_CSI_IRBM).
System Up Time
The time, displayed in days+hours:minutes:seconds, that the device has been
on-line.
The Performance View includes a multi-attribute line graph that shows
network load in green, frame rate in blue, percent errors in orange and the
percent collisions in yellow. For the IRM2 and IRM3 hubs, the number of
active users is shown in brown.
Table 6-1 displays the categories of information supplied by the Performance
View.
Table 6-1.
Multi-Attribute Line Graph Definitions
Statistic
9030367 E8
Definition
Load
Percentage of the bandwidth used by the device.
Frame Rate
Number of frames per second that are repeated by the device.
% Errors
Percentage of frames that are Error Frames.
% Collisions
Percentage of frames that are Collision Frames.
Active Users
(IRM2 and IRM3 only.) The number of active users seen by
this device.
Performance Views
6-3
Accessing the Device Performance View
IRBM, IRM2, IRM3 and MiniMMAC Hubs
In addition to the banner and the Multi-Attribute Line Graph, the
Performance View provides the following buttons:
Log/Lin
This button allows you to toggle how the multi-attribute line graph is
displayed. You can display the network statistics in Logarithmic or Linear
format.
Detail
This button displays a view that shows Frame Breakdown and Error
Breakdown pie charts. Four buttons at the bottom of each pie chart allow you
to display the statistics as a total count or as a percentage of the sum of all
attributes in each pie chart. You can also select Clear to clear the pie chart’s
buffer. The pie chart will resume displaying the count as a percentage of the
sum of all attributes in the pie chart since the buffer was cleared. For more
information on how these pie charts display network attributes, refer to
SPECTRUM Views. The Detail button is not available for the IRM3 Hub.
The No_resources field, located below the pie chart, displays the number of
No Resource conditions detected by the hub. Table 6-2 and Table 6-3provide
definitions of the information contained in the pie charts.
Table 6-2.
Frame Breakdown Pie Chart
Statistic
Table 6-3.
Good Frames
The number of frames detected on all ports of the hub.
Errors
The sum of all errors including alignment, CRC, runts, giants
and OOW collisions.
Collisions
The sum of received and transmitted collisions detected by the
hub.
Error Breakdown Pie Chart
Statistic
Performance Views
6-4
Definition
Definition
Alignment
The number of frames with alignment errors detected by the
hub.
CRC Errors
The number of frames with bad CRCs detected by the hub.
Runts
The number of frames detected with a size of less than 64
bytes.
Cabletron Ethernet Hubs
Management Module Guide
Accessing the Device Performance View
IRBM, IRM2, IRM3 and MiniMMAC Hubs
Table 6-3.
Error Breakdown Pie Chart (Continued)
Statistic
Definition
Giants
The number of frames detected with a size greater than 1518
bytes.
OOW Coll
The number of Out Of Window collisions detected by the hub.
Errors
This button, available only for the IRM3, provides the same information as
the Detail button for IRM2, IRBM, and MiniMMAC hubs.
Frames
This button, available only for the IRM3, displays two pie charts. The Frame
Size pie chart shows the total number of frames, grouped according to their
size in bytes. The Protocol pie chart shows the number of frames per protocol
type.
Scroll to Date-Time
This button allows you to view historical data related to hub performance. For
example, if you set a date and time for two days ago, you can view hub
performance statistics for two days ago.
Change Time Scale
This button allows you to change how time is measured on the line graph in
the hub Performance View. You can choose to display statistics in time blocks
ranging from 1 to 100 hours.
Events
This button accesses the Event Log containing a list of hub-specific network
events. Use the menu or the scroll bars to scroll through the Event Log.
Alarms
This button allows you to access the Alarms View. The Alarms View displays a
list of current network alarms. For information on how to use the Alarms
View, refer to the Enterprise Alarm Manager
9030367 E8
Performance Views
6-5
MIM Performance View
SIRM and MRXI Hubs
SIRM and MRXI Hubs
The Performance View for the SIRM and the MRXI hubs provides the
following information:
Model Name
The user-defined or default name of the model.
Device Name
The ASCII name of the device read from the device.
Network Address
The network IP address (e.g., 132.177.118.24).
The Performance View also displays a bar gauge at the bottom of the view. The
right box (green number) and the bar gauge show the number of packets since
the last poll. The left box (white number) shows the number of packets
measured since the hub was powered up.
In addition, the Performance View provides a Packets Per Poll button. The
Packets Per Poll button displays a graph showing the rate of packets
counted per poll. The graph that appears has a scroll bar that lets you view
the recent hub performance statistics. The bottom axis of the graph shows the
time in seconds broken into 5 minute intervals. The right axis shows the rate
of packets received during the last polling interval.
There is also a small box on the graph that shows the rate of packets received
during the last polling interval. You can scroll to a particular date and time to
view past hub performance statistics. A Set Date-Time (SDT) button is
provided in the lower-right corner for setting a specific date and time for
which you want to view statistics.
MIM Performance View
You can access non-intelligent and third-party-intelligent MIM Performance
Views through the following views: The hub Device View, or the HASPART
Panel in the hub Application View. You can also refer to the management
module guide for any third-party modules installed in the hub. To open the
MIM Performance View from the Device View, follow these steps:
1. Click on the module to highlight it.
2. Select Icon Subviews from the View menu.
3. Select Module Performance from the Icon Subviews menu.
Performance Views
6-6
Cabletron Ethernet Hubs
Management Module Guide
MIM Performance View
IRBM, IRM2, IRM3 and MiniMMAC Hubs
You can also access the MIM Performance View from the Device View as
follows:
1. Click on the Module Label with the right mouse button to access the Icon
Subviews menu.
2. Select Module Performance from the Icon Subviews menu.
IRBM, IRM2, IRM3 and MiniMMAC Hubs
The MIM Performance View displays monitoring point performance statistics
gathered by SPECTRUM. These statistics include load, error rate, frame rate
and collision rate. The banner across the top of the Performance View provides
information about the monitoring point. The border color of the banner
indicates the device status. The border area contains the following fields:
Name
The user-defined or default name of the model.
Location
The location of the device as entered in the Creation dialog box when the
model was created. If no location has been specified, this field displays the
model name of the SPECTRUM location view containing the device.
Network Address
The network IP address of the device.
Device Type
The SPECTRUM Model Type (e.g., Hub_CSI_IRBM).
System Up Time
The time, displayed in days+hours:minutes:seconds, that the device has been
online.
Slot Number
The number of the hub slot in which the module is installed.
The Performance View includes a multi-attribute line graph that shows
network load in green, frame rate in blue, error rate in orange and collision
rate in yellow. The IRM3 has an additional field, Active Users, which displays
the number of active users detected by the hub. Table 6-1 displays the
categories of information supplied by the MIM Performance View.
In addition to the banner and the Multi-Attribute Line Graph, the
Performance View provides the following buttons:
9030367 E8
Performance Views
6-7
MIM Performance View
IRBM, IRM2, IRM3 and MiniMMAC Hubs
Log/Lin
This button allows you to toggle how the multi-attribute line graph is
displayed. You can display the network statistics in Logarithmic or Linear
format.
Detail
This button, not available for the IRM3, displays the same Detail view as
described earlieer in this chapter. Refer to that section for information on this
view.
Errors
This button, available only for the IRM3, provides the same information as
the Detail button for IRM2, IRBM, and MiniMMAC hubs.
Frames
This button, available only for the IRM3, displays two pie charts. The Frame
Size pie chart shows the total number of frames, grouped according to their
size in bytes. The Protocol pie chart shows the number of frames per protocol
type.
Scroll to Date-Time
This button allows you to view historical data related to module performance.
For example, if you set a date and time for two days ago, you can view module
performance statistics for two days ago.
Change Time Scale
This button lets you change how time is measured on the line graph in the
MIM Performance View. You can choose to display statistics in time blocks
ranging from 1 to 100 hours.
MIM Configuration
This button opens the MIM Configuration View. This view allows you to
configure the module information. Table 6-1 provides definitions of the fields
contained in the MIM Configuration View. This view also has one button. The
Config Alarms button allows you to access the MIM Configure Alarms View,
Performance Views
6-8
Cabletron Ethernet Hubs
Management Module Guide
MIM Performance View
IRBM, IRM2, IRM3 and MiniMMAC Hubs
which allows you to set threshold alarms and enable them. Table 6-4 displays
the information contained in this view. The Configure Alarms View also
displays an Error Source Table, which lets you select the types of errors that
will cause alarms. Table 4-2, in the Configuration View chapter, provides the
information contained in the Error Source Table.
Table 6-4.
MIM Configuration View Fields
Field
Table 6-5.
MIM Name
The name of the module.
Serial Number
The serial number of the MIM device.
MIM Type
The type of module (i.e., IRM2).
Slot Number
The number of the hub slot that contains the
module.
Ports On Out Of
The number of operating ports on the device out of
the total number of ports.
IRM2, IRM3, IRBM, and MiniMMAC Configure Alarms View Fields
Field
9030367 E8
Description
Description
Model Name
The user-defined or default name of the module
model.
MIM Name
The name of the module device.
Slot Number
The number of the hub slot that contains the
module.
Traffic Alarms
Enables the sending of device-level traffic traps.
Traffic Threshold Alarm
Permits a port to be disabled on a traffic threshold
alarm.
Traffic Threshold
The threshold of packets within the Time Base that
will cause a traffic alarm.
Collisions Alarms
Enables the sending of device-level collision alarms.
Collisions Threshold Alarm
Permits a port to be disabled on a collision threshold
alarm.
Collisions Threshold
The threshold of collisions per good packet that will
generate an alarm. Values can be 1 to 15.
Error Alarms
Enables the sending of device-level error alarms.
Error Threshold Alarm
Permits a port to be disabled on an error threshold
alarm.
Error Threshold
The threshold of errors per good packet that will
generate an alarm.
Performance Views
6-9
MIM Performance View
SIRM and MRXI Hubs
SIRM and MRXI Hubs
The Performance View for the SIRM and the MRXI modules provides the
following information:
Model Name
The user-defined or default name of the hub model.
Network Address
The network IP address (e.g., 132.177.118.24).
MIM Name
The name of the module.
MIM Type
The type of module (i.e., IRM2).
Slot Number
The number of the hub slot that contains the module.
Ports On Out Of
The number of operating ports on the device out of the total number of ports.
Standard Statistics
This button allows you to access the MIM Standard Statistics View. The MIM
Standard Statistics View displays two bar gauges at the bottom of the view,
displaying information on Packets and Collisions. The right box (green
number) and the bar gauge show the number of packets/collisions since the
last poll. The left box (white number) shows the number of packets/collisions
measured since the module was powered up. The Packets and Collisions
buttons display rate graphs for each statistic.
Config Alarms
This button allows you to access the MIM Configure Alarms View, which
allows you to set threshold alarms and enable them. Table 6-6 displays the
information contained in this view.
Table 6-6.
SIRM and MRXI MIM Configure Alarms View Fields
Field
Performance Views
6-10
Description
Model Name
The user-defined name of the MIM model.
Network Address
The IP address of the device.
MIM Name
The name of the MIM device.
Cabletron Ethernet Hubs
Management Module Guide
Port Performance View
Table 6-6.
SIRM and MRXI MIM Configure Alarms View Fields (Continued)
Field
Description
Slot Number
The number of the hub slot that contains the MIM.
Traffic Alarms
Enables the sending of device-level traffic traps.
Traffic Threshold
The threshold of packets within the Time Base that
will cause a traffic alarm.
Collisions Alarms
Enables the sending of device-level collision
alarms.
Collisions Threshold
The number of collisions per good packet measured
by the device that will generate an alarm. Values
can be 1 to 15.
HASPART Panel
The HASPART Panel allows you to access Port Performance Views for the
modules installed in the hub. You can either double-click on the name of the
module in the HASPART Panel, or you can highlight the name and click on
OK. The Port Performance View for modules is described in the next section.
Port Performance View
The Cabletron hub Port Performance View provides the following navigational
features:
• Buttons allow you to access increasingly detailed views of network
information.
• Table entries within views provide double-click zones which navigate you
to device-specific Information Views.
You can display Port Performance Views from the DevTop View or the Device
View.
Device View Access Method
There are three ways to access the Port Performance View from the Device
View. To display a Port Performance View from the Device View, follow these
steps:
1. Click on an individual port in the Logical MIM Representation with
the right mouse button to display the pop-up menu.
9030367 E8
Performance Views
6-11
Port Performance View
DevTop View Access Method
2. Select Port Performance View from the pop-up menu.
You can also display the Port Performance View from the Device View by
following these steps:
1. Click on an individual port in the Logical MIM Representation to
highlight it.
2. Choose Icon Subviews from the View menu.
3. Choose Port Performance View from the Icon Subviews menu.
Finally, Device View port icons provide double-click access to the Port
Performance View. For port icons including a bar graph, double-click on the
bar graph to access the Port Performance View. For port icons not including a
bar graph, double-click on the port status label to access the Port Performance
View.
DevTop View Access Method
There are three ways to access the Port Performance View from the DevTop
View. To display a Port Performance View from the DevTop View follow these
steps:
1. Double-click on a module in the Simplified Device Panel. One or more
port representations appear in the Port Connections Panel.
2. Double-click on either one of the gauges of a port representation in the
Port Connections Panel. The Port Performance View appears.
You can also display a Port Performance View from the DevTop View by
following these steps:
1. Double-click on a module in the Simplified Device Panel. One or more
port representations appear in the Port Connections Panel.
2. Click on one of the port icons in the Port Connections Panel with the right
mouse button to display the pop-up menu.
3. Choose Performance from the pop-up menu.
Finally, you can display the Port Performance View from the DevTop View by
following these steps:
1. Double-click on a module in the Simplified Device Panel. One or more
port representations appear in the Port Connections Panel.
2. Click on one of the port icons in the Port Connections Panel to highlight
the icon.
3. Choose Icon Subviews from the View menu.
4. Choose Performance from the Icon Subviews menu.
Performance Views
6-12
Cabletron Ethernet Hubs
Management Module Guide
Port Performance View
IRM2, IRM3, IRBM, and MiniMMAC Hubs
IRM2, IRM3, IRBM, and MiniMMAC Hubs
The Port Performance View for IRM2, IRM3, IRBM and MiniMMAC hubs
displays monitoring point performance statistics gathered by SPECTRUM.
These statistics include load, error rate, frame rate and collision rate. The
banner across the top of the Port Performance View provides information
about the monitoring point. The border color of the banner indicates the
device status. The border area contains the following fields:
Name
The user-defined or default name of the model.
Location
The location of the device as entered in the Creation dialog box when the
model was created. If no location has been specified, this field displays the
model name of the SPECTRUM location view containing the device.
Network Address
The network IP address of the device.
Device Type
The SPECTRUM Model Type (e.g., Hub_CSI_IRBM).
System Up Time
The time, displayed in days+hours:minutes:seconds, that the device has been
on-line.
Slot/Port Number
The slot number and the port number in this format: 1.1 (Slot number 1, Port
number 1).
The Port Performance View includes a multi-attribute line graph that shows
network load in green, frame rate in blue, error rate in orange and collision
rate in yellow. The IRM3 has an additional field, Active Users, which displays
the number of active users detected by the hub. Table 6-1 displays the
categories of information supplied by the Port Performance View.
In addition to the banner and the Multi-Attribute Line Graph, the
Performance View provides the following buttons:
Log/Lin
This button allows you to toggle how the multi-attribute line graph is
displayed. You can display the network statistics in Logarithmic or Linear
format
9030367 E8
Performance Views
6-13
Port Performance View
IRM2, IRM3, IRBM, and MiniMMAC Hubs
Detail
This button, not available for the IRM3, displays the same Detail View as
described earlier in this chapter. Refer to that section for information on this
view.
Errors
This button, available only for the IRM3, provides the same information as
the Detail button for IRM2, IRBM, and MiniMMAC hubs.
Frames
This button, available only for the IRM3, displays a view that shows pie
charts. The Frame Size pie chart shows the total number of frames, grouped
according to their size in bytes. The Protocol pie chart shows the number of
frames per protocol type.
Scroll to Date-Time
This button allows you to view historical data related to port performance. For
example, if you set a date and time for two days ago, you can view port
performance statistics for two days ago.
Change Time Scale
This button lets you change how time is measured on the line graph in the
Port Performance View. You can choose to display statistics in time blocks
ranging from 1 to 100 hours.
Port Configuration
This button opens the Port Configuration View. This view allows you to
configure the port information. Table 6-7 provides definitions of the fields
contained in the Port Configuration View. The Connects_to panel at the
bottom of the view allows you to access performance views for devices
connected to the port. The Config Alarms button allows you to access the
Port Configure Alarms View, which allows you to set threshold alarms and
enable them. Table 6-8 displays the information contained in the Configure
Alarms View. The Configure Alarms View also displays an Error Source Table,
which lets you select the types of errors that will cause alarms. Table 4-2, in
Performance Views
6-14
Cabletron Ethernet Hubs
Management Module Guide
Port Performance View
IRM2, IRM3, IRBM, and MiniMMAC Hubs
the Configuration View chapter, provides the information contained in the
Error Source Table.
Table 6-7.
Port Configuration View Field Definitions
Field
Table 6-8.
Model Name
The user-defined or default name of the model.
Network Address
The network IP address (e.g., 134.141.256.145).
MIM/Port Number
The MIM number and the port number, in this format: 1.1
(MIM/slot 1, Port 1).
Port Media Type
The type of cables that can be connected to this port.
Port Topology Type
The topological type of the port (Station or Trunk).
Port Status
The network state of this port.
Port Admin Status
The administrative state of this port (Off or On).
Port Link Status
The state of the link signal for this port.
Port Configure Alarms View Field Definitions
Field
9030367 E8
Definition
Definition
Model Name
The user-defined or default name of the model.
Network Address
The network IP address (e.g., 132.177.118.24).
MIM/Port Number
The board number and port number in the format: 1.1 (MIM
or slot 1, port 1).
Traffic Alarms
Enables or disables the sending of port level traps for this
port.
Traffic Threshold
Alarm
Permits a port to be disabled on a traffic threshold alarm
(Not available for MiniMMAC and IRBM).
Traffic Threshold
The threshold of packets within the Device Time Base that
will cause a traffic alarm.
Collisions Alarms
Enables or disables the sending of port-level collision
alarms.
Collisions
Threshold Alarm
Permits a port to be disabled on a collision threshold alarm
(Not available for MiniMMAC and IRBM).
Collisions Threshold
The number of collisions per good packet measured by the
port that will generate an alarm.
Error Alarms
Enables or disables the sending of port-level error alarms.
Error Threshold
Alarm
Permits a port to be disabled on an error threshold alarm
(Not available for MiniMMAC and IRBM).
Performance Views
6-15
Port Performance View
SIRM Hubs
Table 6-8.
Port Configure Alarms View Field Definitions (Continued)
Field
Definition
Error Threshold
The percentage of errors per good packet that will generate
an alarm.
Broadcast Alarms
Enables or disables the sending of port-level broadcast
alarms.
Broadcast Threshold
Alarm
Permits a port to be disabled on a broadcast alarm (Not
available for MiniMMAC and IRBM).
Broadcast Threshold
The number of broadcasts received that will generate an
alarm.
SIRM Hubs
The Port Performance View for SIRM and MRXI hubs displays information
related to the status of the port. The information in this view includes:
Model Name
The user-defined or default name of the model.
Network Address
The network IP address (e.g., 132.177.118.24).
MIM/Port Number
The MIM (the slot in the hub) number and the port number in this format: 1.1
(Port 1, Slot 1).
Port Media Type
The type of cables that can be connected to this port.
Port Status
The network state of this port.
Port Link Status
The state of the link signal for this port.
Port Admin State
The administrative state of this port (off or on).
Standard Statistics
This button allows you to display the Ethernet Port Standard Statistics View.
Table provides definitions of the fields in this view.
Performance Views
6-16
Cabletron Ethernet Hubs
Management Module Guide
Port Performance View
MRXI Hub
Table 6-9.
Ethernet Port Standard Statistics View Field Definitions
Field
Definition
Model Name
The user-defined or default name of the model.
Network Address
The network IP address (e.g., 134.141.256.145).
MIM/Port Number
The MIM number and the port number, in this format: 1.1
(MIM/slot 1, Port 1).
Packets
The number of packets this port has seen since the last
reset. The white number is the total number, the green
number and the horizontal bar gauge are the number since
the last poll. The button opens a view that displays a graph
showing the rate of change and the value of the graph at
the last poll.
Collisions
The number of collisions this port has seen since the last
reset. The white number is the total number, the orange
number and the horizontal bar gauge are the number since
the last poll. The button opens a view that displays a graph
showing the rate of change the value of the graph at the
last poll.
MRXI Hub
The Port Performance View for the MRXI hub displays information related to
the status of the port. The information in this view includes:
Model Name
The user-defined or default name of the hub model.
Network Address
The network IP address (e.g., 134.141.256.145).
MIM/Port Number
The MIM (the slot in the hub) number and the port number in this format: 1.1
(Port 1, Slot 1).
Port Media Type
The type of cables that can be connected to this port.
Port Status
The network state of this port.
Port Link Status
The state of the link signal for this port.
Port Admin State
The administrative state of this port (off or on).;
9030367 E8
Performance Views
6-17
Port Performance View
MRXI Hub
Standard Statistics
This button allows you to display the Ethernet Port Standard Statistics View.
Table 6-10 provides definitions of the fields in this view.
Table 6-10.
Ethernet Port Standard Statistics View Field Definitions
Field
Definition
Model Name
The user-defined or default name of the model.
Network Address
The network IP address (e.g., 134.141.256.145).
MIM/Port Number
The MIM number and the port number, in this format: 1.1
(MIM/slot 1, Port 1).
Packets
The number of packets this port has seen since the last
reset. The white number is the total number, the green
number and the horizontal bar gauge are the number since
the last poll. The button opens a view that displays a graph
showing the rate of change and the value of the graph at the
last poll.
Collisions
The number of collisions this port has seen since the last
reset. The white number is the total number, the orange
number and the horizontal bar gauge are the number since
the last poll. The button opens a view that displays a graph
showing the rate of change the value of the graph at the last
poll.
Config Alarms
This button lets you display the Ethernet Port Configure Alarms View.
Table 6-11 provides definitions of the fields in this view.
Table 6-11.
Ethernet Port Configure Alarms View Field Definitions
Field
Performance Views
6-18
Definition
Model Name
The user-defined or default name of the model.
Network Address
The network IP address (e.g., 132.177.118.24).
MIM/Port Number
The module number and port number in the format: 1.1
(MIM or slot 1, port 1).
Traffic Alarms
Enables or disables the sending of port level alarms for this
port.
Cabletron Ethernet Hubs
Management Module Guide
Port Performance View
MRXI Hub
Table 6-11.
Ethernet Port Configure Alarms View Field Definitions (Continued)
Field
9030367 E8
Definition
Traffic Threshold
The threshold of packets within the Device Time Base that
will cause a traffic alarm.
Collisions Alarms
Enables or disables the sending of port-level collision
alarms.
Collisions Threshold
The number of collisions per good packet measured by the
port that will generate an alarm.
Performance Views
6-19
Port Performance View
MRXI Hub
Performance Views
6-20
Cabletron Ethernet Hubs
Management Module Guide
Chapter 7
Event and Alarm Messages
What is in this Chapter
This chapter describes the events and alarms that the Cabletron Ethernet
Hubs Management Module supports. It also notes if an event is mapped to an
identical alarm message, and if it provides any corresponding probable cause
message.
Events and alarms originate as generic Simple Network Management
Protocol (SNMP) traps sent from the physical hub devices. These traps, or
unsolicited messages, are translated as SPECTRUM events and displayed in
the Event Log. For more information on specific SNMP traps, refer to RFC
1213 available through the Internet system. Also refer to the Management
Information Base (MIB) documentation for each specific hub device.
NOTE
Each event/alarm listed below includes: the event code, the event/alarm
message, followed by a brief description of the event/alarm, an alarm
mapping indicator, and any probable cause message for the mapped alarm.
When variable data is inserted in a message, it is indicated by a {v}. Data in
braces will be replaced by the named variable followed by a specific value,
without the braces.
9030367 E8
7-1
Cabletron Ethernet Hub Alarms and Events
Cabletron Ethernet Hub Alarms and Events
Table 7-1 lists the events and alarms supported by the Cabletron Ethernet
Hub devices. The event message files are located in the following directory:
/SPECTRUM Directory Path/SG-Support/CsEvFormat
The alarm message files are located in the following directory:
/SPECTRUM Directory Path/SG-Support/CsPCause
Table 7-1.
Events and Alarms
Event Message
Probable Cause Message
00010203
00010203
The model created is not the
same type as the device. Model
type = {v}, Name = {v}, User =
{v}.
The model created is not the
same type as the device.
00010306
00010306
A(n) {v} device, named {v}, has
been cold started.
Not Applicable.
00010307
00010307
The device named {v} has been
warm started.
Not Applicable.
00010308
00010308
A(n) {v} device, named {v}, has
detected a commumication Link
Down.
Communication link is down.
00010309
00010309
A(n) {v} device, named {v}, has
detected a communication link
up.
Not Applicable.
0001030a
0001030a
The device named {v} has
detected an authentication
failure.
Other user is trying to connect
to device with an invalid
community string.
0001030b
0001030b
A(n) {v} device, named {v}, has
detected an EGP Neighbor or
loss.
Lost contact with EGP neighbor.
Event and Alarm Messages
7-2
Cabletron Ethernet Hubs
Management Module Guide
Cabletron Ethernet Hub Alarms and Events
Table 7-1.
Events and Alarms (Continued)
Event Message
9030367 E8
Probable Cause Message
00010401
00010401
Device {v} of type {v} is
created with an IP address
already used by another model.
DUPLICATE IP ADDRESS
00010402
00010402
Device {v} of type {v} is
created with a physical (Mac)
address already used by another
model.
DUPLICATE PHYSICAL ADDRESS
00010601
00010601
Port {v} (Instance ID {v}) on
board in slot {v} (Instance ID
{v}) of {v} (name - {v}) has
segmented.
A port has changed from
operational to segmented.
00010602
00010602
Port {v} (Instance ID {v}) on
board in slot {v} (Instance ID
{v}) of {v} (name - {v}) is no
longer segmented.
Not Applicable.
00010603
00010603
Network configuration change
reported by {v} (name - {v}).
MAU attached to port {v}
(Instance ID {v}) on board in
slot {v} (Instance ID {v}).
Not Applicable.
00010604
00010604
Network configuration change
reported by {v} (name - {v}).
MAU previously attached to port
{v} (Instance ID {v}) on board
in slot {v} (Instance ID {v})
has been removed or powered
down.
A previously attached MAU has
been removed or powered down.
This trap should only occur for
MIMs that support link state.
00010605
00010605
New source address {X 5}
(Instance ID {0 6}) detected by
{t} (name - {m}) on port {I 3}
(Instance ID {0 4}) of board in
slot {I 1} (Instance ID {0 2}).
Not Applicable.
The model has the same IP
address as that of some other
Model.
The model has the same Physical
address (Mac address) as that of
some other model.
Event and Alarm Messages
7-3
Cabletron Ethernet Hub Alarms and Events
Table 7-1.
Events and Alarms (Continued)
Event Message
Probable Cause Message
00010606
00010606
Source Address {v} (Instance ID
{v}) timeout detected by {v}
(name - {v}) on port {v}
(Instance ID {v}) of board in
slot {v} (Instance ID {v}).
Not Applicable.
00010607
00010607
Device configuration change
reported by {v} (name - {v}).
Board in slot {I 1} (Instance ID
{0 2}) has been removed.
A MIM has been removed from this
MMAC.
00010608
00010608
Device configuration change
reported by {v} (name - {v}).
Board type {I 3} has been
installed in slot {I 1}. Its new
instance ID is {0 2}.
Not Applicable.
00010609
00010609
Network configuration change
reported by {v} (name - {v}).
Port {v} (Instance ID {v}) on
board in slot {v} (Instance ID
{v}) has failed polling.
Redundancy activated for Circuit
{v} (Instance ID {v}).
An active port in a redundant
circuit has failed polling. This
indicates the activation of
redundancy.
0001060a
0001060a
Network configuration change
reported by {v} (Instance ID
{v}). Port {v} (Instnace ID {v})
on board in slot {v} (Instance
ID {v}), Circuit {v} (Instance
ID {v}) has been activated.
Not Applicable.
0001060b
0001060b
Redundancy diagnostics of {v}
(name - {v}) indicate port {v}
(Instance ID {v}) on board in
slot {v} (Instance ID {v}),
Circuit {v} (Instance ID {v})
has failed.
During this MMAC’s periodic
redundancy diagnostics, it was
found that a port in a redundant
cycle has failed. This does not
indicate that redundancy has
been activated, but it should be
fixed before it is needed.
Event and Alarm Messages
7-4
Cabletron Ethernet Hubs
Management Module Guide
Cabletron Ethernet Hub Alarms and Events
Table 7-1.
Events and Alarms (Continued)
Event Message
9030367 E8
Probable Cause Message
0001060c
0001060c
Traffic threshold, {v} (Instance
ID {v}) packets per {v}
(Instance ID {v}) seconds,
exceeded for {v} (name - {v}).
This trap will be generated when
the traffic (good packets per
time interval) has been exceeded
for the entire MMAC.
0001060d
0001060d
Threshold exceeded for error
type {v} (Instance ID {v}).
Error type {v} packets exceeded
{v} (Instance ID {v})% of good
packets in {v} seconds for {v}
(Instance ID {v}).
This trap will be generated when
packets of the selected error
type exceed a threshold
percentage of the good packets
for a particular interval for
the entire MMAC.
0001060e
0001060e
Collision threshold exceeded.
Collisions exceeded {v}% of good
packets in {v} seconds for {v}
(Instance ID {v}).
This trap will be generated when
collisions exceed a threshold
percentage of the good packets
for a particular interval for
the entire MMAC.
0001060f
0001060f
Traffic threshold, {v} packets
per {v} seconds, exceeded on
board in slot {v} of {v} (name {v}).
This trap is generated when the
traffic (good packets per time
interval) has been exceeded for
a particular MIM.
00010610
00010610
Error threshold exceeded. An
error threshold, {v}% of good
packets in {v} seconds exceeded
on board in slot {v} (Instance
ID {v}) of {v} (name - {v}).
This trap will be generated when
packets of the selected error
type exceeds a threshold
percentage of the good packets
for a particular interval for a
particular MIM. This most likely
indicates a bad MIM.
00010611
00010611
Collisions threshold exceeded.
Collisions exceeded {v}% of good
packets in {v} seconds on board
in slot {v} (Instance ID {v}) of
{v} (name - {v}).
This trap will be generated when
collisions exceed a threshold
percentage of the good packets
for a particular interval for a
particular MIM.
00010612
00010612
Traffic threshold, {v} packets
per {v} seconds, exceeded on
port {v} (Instance ID {v}) of
board in slot {v} (Instance ID
{v}) of {v} (name - {v}).
This trap will be generated when
the traffic (good packets per
time interval) has been exceeded
for a particular port.
Event and Alarm Messages
7-5
Cabletron Ethernet Hub Alarms and Events
Table 7-1.
Events and Alarms (Continued)
Event Message
Probable Cause Message
00010613
00010613
Error threshold exceeded. An
error threshold, {v}% of good
packets in {v} seconds, has
exceeded on port {v} (Instance
ID {v}) of board in slot {v}
(Instance ID {v}) of {v} (name {v}).
This trap will be generated when
packets of the selected error
type exceeds a threshold
percentage of the good packets
for a particular interval for a
particular port.
00010614
00010614
Collision threshold exceeded.
Collisions exceeded {v}% of good
packets in {v} seconds on port
{v} (Instance ID {v}) of board
in slot {v} (Instance ID {v}) of
{v} (name - {v}).
This trap will be generated when
collisions exceed a threshold
percentage of the good packets
for a particular interval for a
particular port.
00010615
00010615
Port type changed. Port {v}
(Instance ID {v}) on board in
slot {v} (Instance ID {v}) of
{v} (name - {v}) is now type {v}
(Instance ID {v}).
A port has been changed from a
station port to a link port, or
vice versa.
00010616
00010616
Address lock changed for {v}
(name - {v}). New lock status is
{v} (1 = Off / 2 = On).
The status of the address lock
has been changed.
00010617
00010617
Port security violation occurred
on port {v} (Instance ID {v}) on
board in slot {v} (Instance ID
{v}) of {v} (name - {v}).
Violating address is {v}.
A source address other than
those locked to a port has been
seen.
00010618
00010618
Port violation reset. Port {v}
(Instance ID {v}) on board in
slot {v} (Instance ID {v}) of
{v} (name - {v}) has been reset.
Management intervention has
reset a port after a violation
has occurred.
00010619
00010619
Environment Temperature Warm
detected by {v} (name - {v}).
This device detects that the
temperature within the device
has reached a WARM condition.
Event and Alarm Messages
7-6
Cabletron Ethernet Hubs
Management Module Guide
Cabletron Ethernet Hub Alarms and Events
Table 7-1.
Events and Alarms (Continued)
Event Message
9030367 E8
Probable Cause Message
0001061a
0001061a
ENVIRONMENT TEMPERATURE HOT
detected by {v} (name - {v}).
This device detects that the
temperature within the device
has reached a HOT condition.
0001061b
0001061b
Environment Voltage Low detected
by board in slot {v} (Instance
ID {v}) of {v} (name - {v}).
A board detects that its power
supply voltage is low.
0001061c
0001061c
Environment Temperature has
returned to a normal state at
slot {I 1} (Instance ID {0 2}),
has been detected by {v} (name {v}).
Not Applicable.
0001061d
0001061d
Environment Voltage has returned
to a normal state, has been
detected by {v} (name - {v}).
Not Applicable.
0001061e
0001061e
A fan in the system’s chassis is
operating at an abnormal RPM
rate, has been detected by {v}
(name - {v}).
The device detects that a fan in
the system’s chassis is
operating at an abnormal RPM
rate.
0001061f
0001061f
A fan in the system’s chassis is
operating at a normal RPM rate,
has been detected by {v} (name {v}).
Not Applicable.
00010620
00010620
User defined broadcast
threshold, {v} broadcast packets
within {v} seconds, exceeded on
{v} (name - {v}).
Device Broadcast Threshold
Exceeded.
This trap will be generated when
the broadcast (packets per time
interval) has been exceeded for
the entire MMAC.
Event and Alarm Messages
7-7
Cabletron Ethernet Hub Alarms and Events
Table 7-1.
Events and Alarms (Continued)
Event Message
Probable Cause Message
00010621
00010621
User defined broadcast
threshold, {v} broadcast packets
within {v} seconds, exceeded on
the board in slot {v} of {v}
(name - {v}).
Board Broadcast Threshold
Exceeded
00010622
00010622
User defined broadcast
threshold, {v} broadcast packets
within {v} seconds, exceeded on
port {v} of the board in slot
{v} of {v} (name - {v}).
Port Broadcast Threshold
Exceeded
00010625
00010625
Network configuration changes
reported by {v} (name - {v}).
{v} (name - {v} status is now
{v} (Instance ID {v}).
Not Applicable.
00010626
00010626
Device configuration change
reported by {v} (name - {v}).
Acquired database of {v} (name {v}) is full.
Not Applicable.
00010639
00010639
Environment Temperature Warm
condition at slot {I 1}
(Instance ID {0 2}) has been
detected by {v} (name - {v}).
This device detects that the
temperature within the device
has reached a WARM condition.
0001063a
0001063a
ENVIRONMENT TEMPERATURE HOT
condition at slot {I 1}
(Instance ID {0 2}), has been
detected by {v} (name - {v}).
This device detects that the
temperature within the device
has reached a HOT condition.
0001063b
0001063b
Environment Voltage Low
condition has been detected by
power supply in slot {I 1}
(Instance ID {0 2}) of {v} (name
- {v}).
The device detects that its
power supply voltage is low.
Event and Alarm Messages
7-8
This trap will be generated when
the broadcast (packets per time
interval) has been exceeded for
the given board.
This trap will be generated when
the broadcast (packets per time
interval) has been exceeded for
the given port.
Cabletron Ethernet Hubs
Management Module Guide
Index
Symbols
% Collisions 6-3
% Errors 6-3
A
Access 4-16
Permissions 4-16
Accessing the
Hub
Configuration View 4-1
Device View 2-1
Performance View 6-2
Active Users 6-3
Additional
Bridge Information
Button 4-18
View 4-18
Configuration Button 4-15
Additional Configuration 4-6
Address
Delete View 4-13
Button 4-13
Display View 4-13
Administrative State 6-15, 6-16, 6-17
Alarm
Messages 7-1
Alarms
Button 5-3, 5-5, 6-5
Log View 5-2
View 5-5, 6-5
Alignment 4-11, 6-4
Errors 6-4
Apply Button 2-14
Audible Alarm 4-10
AUI 4-4, 4-21
BrdgFiber_Off 4-4
BridgeFiber_Rptr 4-4
Off
Fiber_Brdg 4-4
Fiber_Rptr 4-4
Rptr
Fiber_Brdg 4-4
Fiber_Off 4-4
Available Circuits 4-11
B
Banner 6-3, 6-13
Bar Gauge 6-6
Bd/Port Combination 4-12
Board
Member 4-13
Number 4-7
Port Instance 4-12, 4-25
Bridge
Configuration View 4-17
ID 4-19
Information 4-2, 4-5
Button 4-18
View 4-18
Location 4-18
Name 4-17
Priority 4-19
Restart 4-21
Settings 4-21
Status Control 4-21
Type 4-17
9030367 E8
1
C
Change
Time Scale Button 6-5
Circuit
Configuration 4-25
Enable 4-12
Field 4-25
Name 4-12, 4-25
Number 4-12, 4-13
Reset 4-13
View 4-13
Clear 6-4
Close Button 2-14
Coaxial 4-21
Cold Boot 4-15
Collision 5-3, 6-4, 6-17, 6-18
Alarms 6-15, 6-19
Rate 6-3, 6-13
Statistics 5-3, 5-4
Threshold 6-15, 6-19
Alarm 6-15
Comments xiii
Community
And Trap Table
View 4-6
and Trap Table 4-15
Name 4-3, 4-17
Attribute 4-24
String 4-16
Table 4-6
Detail View 4-15
Condition
Status
Banner 2-4
Config Alarms
Button 4-5, 6-18
Configuration
Information 4-2
View 4-1
Contact 2-4
Control Button 4-5, 4-21
Conventions xii
Counters 4-8
CRC 4-11, 6-4
Errors 6-4
Cs Files
CsEvFormat 7-2
CsPCause 7-2
Index
2
Current
Bridge Status 4-21
Date 4-4
Time 4-4
Cyclic Redundancy Checks 4-11
D
Default 2-14
Description 2-4
Detail Button 6-4
Device
Actions 1-1
Associations 1-1
Attributes 1-1
Configuration 4-2, 4-4, 4-17
Counters 4-8
Discover 4-8
Models 1-1
Name 4-4, 4-7, 4-9, 4-11, 4-16, 5-3, 5-4,
6-6
Redundancy 4-8
Type 2-4, 4-7, 6-3, 6-13
Diagnostic
View 5-1
Disastrous Situation 4-24
DownLoad
Software Button 4-14
Software View 4-14
E
Enable 4-25
Error 6-4
Alarms 6-15
Attributes 5-2
Breakdown 6-4
Button 6-5
Rate 6-3, 6-13
Source Table 4-11
Threshold 6-16
Alarm 6-15
Ethernet
Bridge 4-17
MIMs 4-15
Port
Configure Alarms View 6-18
Cabletron Ethernet Hubs
Management Module Guide
E (continued)
G
Event
Button 5-3, 5-4, 6-5
Code 7-1
Log 5-3, 5-5, 6-5, 7-1
View 5-2
Messages 7-1
Events 5-5
Gauge
Control Panel 2-13
Mode 2-13
Type 2-13
Getting Help xii
Giants 4-11, 6-4, 6-5
Good Frames 6-4
F
H
Factory Defaults 4-9
FDDI 4-22
MIMs 4-15
Fiber
Optic 4-21
Ports 4-4
Find 4-7
Board/Port Button 4-6
Source Address Button 4-5
Firmware
Base Address 4-14
Configuration 4-2
Start Address 4-14
Top Address 4-14
Version 4-18
Flash
Count 4-14
Download 4-6
Download View 4-14
Memory 4-14
Size in Bytes 4-14
Force On Boot 4-15
Forward
Delay 4-20
Hello Information View 4-20
Parm 4-20
Frame
Breakdown 6-4
Button 6-5
Rate 6-3, 6-13
Size Pie Chart 6-5, 6-8, 6-14
Fwd Dly & Hello Information Button 4-20
Hello Time Parm 4-20
Help xiii
Hold Time 4-19
Hub
Performance 6-5
Redundancy Management 4-21
Hub_CSI
IRBM 1-2
IRM2 1-2
IRM3 1-2
MiniM 1-2
MRXi 1-2
SIRM 1-2
9030367 E8
I
Instance 4-13
Internet
Protocol Address 2-4
Introduction 1-1
IP
Addr 4-16
Address 2-4, 4-4
Add 4-12
Field 4-25
Delete 4-13
IRBM 4-17, 6-3, 6-13
Bridge
Control View 4-21
IRM
MMAC
Alarms View 5-3
IRM2 4-21, 6-3, 6-13
IRM3 4-21, 6-3, 6-13
Index
3
J
No entries for this letter.
K
Keep Settings Button 2-14
L
Last
Image Filename 4-14
Poll 5-3, 5-4
Server IP Address 4-14
Lin Button 6-4
Linear 6-4
Link
Signal 6-15, 6-16, 6-17
Link-Up Traps 4-8
Load 6-3, 6-13
Local 4-18
Location 2-4, 6-3, 6-13
Log Button 6-4
Logarithmic 6-4
Logical
MIM
Representation 6-11
M
MAC
Address
Add 4-12
Field 4-25
Delete 4-13
Management
Information Base 1-1, 7-1
Manufacturer 2-4
Max Pull Boards 4-3
Maximum
Circuits 4-11
MIB 1-1, 7-1
MIM
Number 6-15, 6-16, 6-17, 6-18
MiniMMAC 4-21, 6-3, 6-13
Index
4
MMAC
Redundancy
Information View 4-12
Table 4-12
View 4-5
Type 4-4
MMAC3 4-4
MMAC5 4-4
MMAC8 4-4
Model 1-1
Configuration 4-2, 4-3, 4-17
Name 2-4, 4-3, 4-6, 4-7, 4-9, 4-11, 4-14,
4-16, 4-17, 4-18, 4-19, 4-20, 5-3,
5-4, 6-6, 6-15, 6-16, 6-17, 6-18
Type 6-3, 6-13
Names 1-1
Monitor
Point 6-3, 6-13
Precedence 4-3
MRXI 4-21, 5-4, 6-6, 6-17
Hub
Receive Collisions 5-4
Transmit Collisions 5-4
Multi-Attribute Line Graph 6-3, 6-4
N
Name 4-7, 4-16, 6-3, 6-13
NB20E 4-17
NB25E 4-17
Net
Address 2-4
Network
Address 4-3, 4-6, 4-7, 4-8, 4-9, 4-14, 4-17,
5-3, 6-3, 6-6, 6-13, 6-15, 6-16, 617, 6-18
Alarms 5-3, 5-5, 6-5
Configuration 4-2
Events 5-3, 5-5, 6-5
Statistics 6-4
No
Resource 4-11, 6-4
None 4-16
Notice i
Number of
Addresses 4-12
Ports 4-18
Restarts 4-19
Cabletron Ethernet Hubs
Management Module Guide
O
OOW 4-11
Coll 6-5
Collisions 6-4
Out
Of Window 4-11
Collisions 6-5
Primary 4-21
Circuit 4-24
Pathway 4-22
Port 4-22
PROM Revision 4-4
Protocol
Max Age 4-19
Pie Chart 6-5, 6-8, 6-14
Pulled Board List 4-3
P
Packets 6-17, 6-18
Per Poll Button 6-6
Pathway 4-21
Percentages 2-13
Performance
Statistics 6-3, 6-5, 6-6, 6-13
View 6-1
Pie Charts 6-4, 6-5
Poll Log Ratio 4-3, 4-17
Polled
Address 4-13
List 4-13
Polling
Interval 4-3, 4-17
Status 4-3
Port
Admin
State 6-16, 6-17
Status 6-15
Association 4-4
Circuit
Status 4-12, 4-25
Type 4-12, 4-25
Configuration Button 6-14
Connections Panel 6-12
Link Status 6-15, 6-16, 6-17
Media Type 6-15, 6-16, 6-17
Member 4-13
Number 4-7, 6-13, 6-15, 6-16, 6-17, 6-18
Performance
View 6-11, 6-12
Status 6-15, 6-16, 6-17
Topology Type 6-15
Ports
On Out Of 4-4
Preface xi
9030367 E8
Q
Questions xiii
R
RAM To Flash 4-15
Rate
Alarm Checks 4-10
Rates 2-13
Readonly 4-16
Readwrite 4-16
Receive
Collisions 5-4
Button 5-4
Redundancy 4-5
Button 4-11, 4-24
Circuit 4-12, 4-13
Information View 4-25
Table 4-12, 4-13, 4-24
Button 4-12
Redundant
Cable Circuit 4-22
Capability 4-21
Circuit
Connections 4-12, 4-21
Management 4-23
Poll Interval 4-11
Related Reading xii
Repeater 4-23
Reset 2-14
Circuit View Button 4-13
Restart
Device 4-8
Restricted Rights Notice ii
Retry Count 4-12, 4-25
Revision Number 4-4
Index
5
R (continued)
Root
Brdg Max Age 4-18
Bridge ID 4-18
Cost 4-18
Information
Button 4-18
View 4-18
Port 4-18
Runts 4-11, 6-4
S
Scroll to Date-Time Button 6-5
SDT Button 6-6
Secondary
Circuit 4-24
Secondary Circuit 4-21
Security String 4-3, 4-17
Selected Attribute 2-13
Serial Number 2-4
Set Date-Time Button 6-6
Setting Redundant Circuits 4-24
Setup Information View 4-19
Simple Network Management Protocol
Traps 7-1
Simplified Device
Panel 6-12
SIRM 5-3, 6-6, 6-16
MMAC
Hub Collisions 5-3
Slot Number 6-13
SNMP 1-1
Traps 7-1
Sort 4-7
Sound
Audible Alarm 4-10
Source
Addr
Lock 4-8
Traps 4-8
Address 4-6, 4-7, 4-8
Table 4-8
Button 4-5
SPECTRUM
Events 7-1
Src
Addr Age Time 4-8
STA Protocol 4-19
Index
6
Station 6-15
Suggestions xiii
Superuser 4-16
Support xiii
Switch Settings 4-19
Sys Up Time 2-4
System
Up Time 4-7, 6-3, 6-13
T
TCP/IP Based Networks xii
Technical Support xiii
Template 1-1
Terminology xii
Test
Redundant Circuit 4-12
Time of Day 4-12
Testing Redundancy 4-25
TFTP
Boot Server 4-14
Request
FileName 4-15
Host 4-15
Thin-Net 4-21
Threshold
Alarms 4-9
Time
Base 4-10
Topology Change 4-20
Token Ring MIMs 4-15
Topology
Change 4-20
Count 4-20
Information
Button 4-20
View 4-20
Total 2-13, 5-3, 5-4
Collisions Button 5-3
Trademarks i
Traffic
Alarms 6-15, 6-18
Attribute 6-1
Threshold 4-9, 6-15, 6-19
Alarm 6-15
Transmit
Collisions 5-4
Button 5-4
Cabletron Ethernet Hubs
Management Module Guide
T (continued)
Trap 4-8, 4-16
Generation 4-16
Host 4-16
Type Obj ID 4-19
Trunk 6-15
Type of Filtering 4-19
U
Unsolicited
Messages 7-1
V
Virus Disclaimer i
VNM
Database 4-2
W, X, Y, Z
No entries for these letters.
9030367 E8
Index
7
Index
8
Cabletron Ethernet Hubs
Management Module Guide