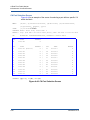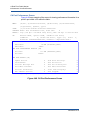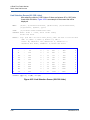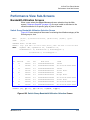
1
User Guide FastFabric 7.0 IB0054607-01 A FastFabric 7.0 User Guide Information furnished in this manual is believed to be accurate and reliable. However, QLogic Corporation assumes no responsibility for its use, nor for any infringements of patents or other rights of third parties which may result from its use. QLogic Corporation reserves the right to change product specifications at any time without notice. Applications described in this document for any of these products are for illustrative purposes only. QLogic Corporation makes no representation nor warranty that such applications are suitable for the specified use without further testing or modification. QLogic Corporation assumes no responsibility for any errors that may appear in this document. Document Revision History Revision A, September, 2011 Changes ii Sections Affected IB0054607-01 A Table of Contents Preface Intended Audience . . . . . . . . . . . . . . . . . . . . . . . . . . . . . . . . . . . . . . . . . . . . Related Materials . . . . . . . . . . . . . . . . . . . . . . . . . . . . . . . . . . . . . . . . . . . . . Documentation Conventions . . . . . . . . . . . . . . . . . . . . . . . . . . . . . . . . . . . . License Agreements. . . . . . . . . . . . . . . . . . . . . . . . . . . . . . . . . . . . . . . . . . . Technical Support. . . . . . . . . . . . . . . . . . . . . . . . . . . . . . . . . . . . . . . . . . . . . Training . . . . . . . . . . . . . . . . . . . . . . . . . . . . . . . . . . . . . . . . . . . . . . . . Contact Information . . . . . . . . . . . . . . . . . . . . . . . . . . . . . . . . . . . . . . . Knowledge Database . . . . . . . . . . . . . . . . . . . . . . . . . . . . . . . . . . . . . 1 FastFabric Overview Feature Overview . . . . . . . . . . . . . . . . . . . . . . . . . . . . . . . . . . . . . . . . . . . . . FastFabric Architecture . . . . . . . . . . . . . . . . . . . . . . . . . . . . . . . . . . . . . . . . How FastFabric Works . . . . . . . . . . . . . . . . . . . . . . . . . . . . . . . . . . . . 2 xi xi xi xii xiii xiii xiii xiv 1-1 1-3 1-4 FastFabric TUI Menu FastFabric TUI Menu Overview . . . . . . . . . . . . . . . . . . . . . . . . . . . . . . . . . . TUI Menu Usage . . . . . . . . . . . . . . . . . . . . . . . . . . . . . . . . . . . . . . . . . QLogic InfiniBand Software Main Menu . . . . . . . . . . . . . . . . . . . . . . . . . . . . Menu Items Description. . . . . . . . . . . . . . . . . . . . . . . . . . . . . . . . . . . . Show Installed Software . . . . . . . . . . . . . . . . . . . . . . . . . . . . . . . Reconfigure OFED IP over IB . . . . . . . . . . . . . . . . . . . . . . . . . . Reconfigure Driver Autostart . . . . . . . . . . . . . . . . . . . . . . . . . . . Update HCA Firmware . . . . . . . . . . . . . . . . . . . . . . . . . . . . . . . . Generate Supporting Information for Problem Report . . . . . . . . Fast Fabric (Host/Chassis/Switch Setup/Admin) . . . . . . . . . . . . Uninstall Software. . . . . . . . . . . . . . . . . . . . . . . . . . . . . . . . . . . . FastFabric Main Menu . . . . . . . . . . . . . . . . . . . . . . . . . . . . . . . . . . . . . . . . . Menu Items Description. . . . . . . . . . . . . . . . . . . . . . . . . . . . . . . . . . . . Chassis Setup/Admin . . . . . . . . . . . . . . . . . . . . . . . . . . . . . . . . . Externally Managed Switch Setup/Admin. . . . . . . . . . . . . . . . . . Host Setup . . . . . . . . . . . . . . . . . . . . . . . . . . . . . . . . . . . . . . . . . Host Verification/Admin . . . . . . . . . . . . . . . . . . . . . . . . . . . . . . . Fabric Monitoring . . . . . . . . . . . . . . . . . . . . . . . . . . . . . . . . . . . . IB0054607-01 A 2-1 2-1 2-3 2-3 2-3 2-3 2-3 2-3 2-4 2-4 2-4 2-5 2-5 2-5 2-5 2-5 2-5 2-6 iii FastFabric 7.0 User Guide Fast Fabric IB Chassis Setup/Admin Menu . . . . . . . . . . . . . . . . . . . . . . . . . Menu Items Description. . . . . . . . . . . . . . . . . . . . . . . . . . . . . . . . . . . . Edit the Configuration and Select/Edit Chassis Files . . . . . . . . . Verify Chassis via Ethernet ping . . . . . . . . . . . . . . . . . . . . . . . . . Update Chassis Firmware . . . . . . . . . . . . . . . . . . . . . . . . . . . . . Set up Chassis Basic Configuration . . . . . . . . . . . . . . . . . . . . . . Setup Password-less SSH/SCP . . . . . . . . . . . . . . . . . . . . . . . . . Reboot Chassis . . . . . . . . . . . . . . . . . . . . . . . . . . . . . . . . . . . . . Configure Chassis Fabric Manager . . . . . . . . . . . . . . . . . . . . . . Get Basic Chassis Configuration . . . . . . . . . . . . . . . . . . . . . . . . Check Status of IB Ports. . . . . . . . . . . . . . . . . . . . . . . . . . . . . . . Control Chassis Fabric Manager . . . . . . . . . . . . . . . . . . . . . . . . Generate all Chassis Problem Report Information . . . . . . . . . . . Run a command on all chassis. . . . . . . . . . . . . . . . . . . . . . . . . . View iba_chassis_admin results files . . . . . . . . . . . . . . . . . . . . . Fast Fabric InfiniBand Externally Managed Switch Setup/Admin Menu. . . . . . . . . . . . . . . . . . . . . . . . . . . . . . . . . . . . . Menu Items Description. . . . . . . . . . . . . . . . . . . . . . . . . . . . . . . . . . . . Edit Config and Select/Edit Switch Files. . . . . . . . . . . . . . . . . . . Test for Switch Presence . . . . . . . . . . . . . . . . . . . . . . . . . . . . . . Verify Switch Firmware . . . . . . . . . . . . . . . . . . . . . . . . . . . . . . . . Update Switch Firmware . . . . . . . . . . . . . . . . . . . . . . . . . . . . . . Setup Switch Basic Configuration . . . . . . . . . . . . . . . . . . . . . . . Reboot Switch . . . . . . . . . . . . . . . . . . . . . . . . . . . . . . . . . . . . . . Report Switch Firmware & Hardware Info . . . . . . . . . . . . . . . . . Get Basic Switch configuration . . . . . . . . . . . . . . . . . . . . . . . . . . Report Switch VPD Information . . . . . . . . . . . . . . . . . . . . . . . . . Generate All Switch Problem Report Info . . . . . . . . . . . . . . . . . . View iba_switch_admin result files . . . . . . . . . . . . . . . . . . . . . . . Fast Fabric IB Host Setup . . . . . . . . . . . . . . . . . . . . . . . . . . . . . . . . . . . . . . iv 2-6 2-7 2-7 2-7 2-8 2-8 2-9 2-9 2-10 2-11 2-11 2-12 2-13 2-13 2-13 2-13 2-14 2-14 2-15 2-15 2-15 2-16 2-17 2-17 2-17 2-18 2-18 2-18 2-19 IB0054607-01 A FastFabric 7.0 User Guide Menu Items Description. . . . . . . . . . . . . . . . . . . . . . . . . . . . . . . . . . . . Edit Configuration and Select/Edit Hosts Files . . . . . . . . . . . . . . Verify Hosts via Ethernet ping. . . . . . . . . . . . . . . . . . . . . . . . . . . Setup Password-less SSH/SCP . . . . . . . . . . . . . . . . . . . . . . . . . Copy /etc/hosts to all hosts. . . . . . . . . . . . . . . . . . . . . . . . . . . . . Show uname -a for all hosts . . . . . . . . . . . . . . . . . . . . . . . . . . . . Install/Upgrade QLogic IB Software . . . . . . . . . . . . . . . . . . . . . . Configure IPoIB IP Address . . . . . . . . . . . . . . . . . . . . . . . . . . . . Build MPI Test Apps and Copy to Hosts . . . . . . . . . . . . . . . . . . . Reboot Hosts . . . . . . . . . . . . . . . . . . . . . . . . . . . . . . . . . . . . . . . Refresh SSH Known Hosts. . . . . . . . . . . . . . . . . . . . . . . . . . . . . Rebuild MPI Library and Tools . . . . . . . . . . . . . . . . . . . . . . . . . . Run a command on all hosts . . . . . . . . . . . . . . . . . . . . . . . . . . . Copy a file to all hosts. . . . . . . . . . . . . . . . . . . . . . . . . . . . . . . . . View iba_host_admin result files . . . . . . . . . . . . . . . . . . . . . . . . Fast Fabric IB Host Verification/Admin Menu. . . . . . . . . . . . . . . . . . . . . . . . Menu Items Description. . . . . . . . . . . . . . . . . . . . . . . . . . . . . . . . . . . . Edit Config and Select/Edit Hosts Files . . . . . . . . . . . . . . . . . . . Verify Hosts via Ethernet ping. . . . . . . . . . . . . . . . . . . . . . . . . . . Summary of Fabric Components . . . . . . . . . . . . . . . . . . . . . . . . Check Status of IB Ports. . . . . . . . . . . . . . . . . . . . . . . . . . . . . . . Verify Hosts see each other . . . . . . . . . . . . . . . . . . . . . . . . . . . . Verify Hosts ping via IPoIB . . . . . . . . . . . . . . . . . . . . . . . . . . . . . Refresh SSH Known Hosts. . . . . . . . . . . . . . . . . . . . . . . . . . . . . Check MPI Performance . . . . . . . . . . . . . . . . . . . . . . . . . . . . . . Check Overall Fabric Health. . . . . . . . . . . . . . . . . . . . . . . . . . . . Generate all Hosts Problem Report Info. . . . . . . . . . . . . . . . . . . Run a command on all hosts . . . . . . . . . . . . . . . . . . . . . . . . . . . View iba_host_admin result files . . . . . . . . . . . . . . . . . . . . . . . . Fabric Monitoring . . . . . . . . . . . . . . . . . . . . . . . . . . . . . . . . . . . . . . . . . . . . . Menu Items Description. . . . . . . . . . . . . . . . . . . . . . . . . . . . . . . . . . . . Fabric Performance Monitoring . . . . . . . . . . . . . . . . . . . . . . . . . 3 2-19 2-20 2-20 2-20 2-20 2-20 2-21 2-21 2-22 2-22 2-22 2-22 2-22 2-22 2-23 2-23 2-24 2-24 2-25 2-25 2-25 2-26 2-26 2-27 2-27 2-28 2-28 2-29 2-29 2-29 2-29 2-30 iba_top Fabric Performance Monitor Introduction. . . . . . . . . . . . . . . . . . . . . . . . . . . . . . . . . . . . . . . . . . . . . . . . . . iba_top TUI. . . . . . . . . . . . . . . . . . . . . . . . . . . . . . . . . . . . . . . . . . . . . . . . . . Image Identification . . . . . . . . . . . . . . . . . . . . . . . . . . . . . . . . . . . . . . . Screen Specific Information. . . . . . . . . . . . . . . . . . . . . . . . . . . . . . . . . IB0054607-01 A 3-1 3-1 3-2 3-2 v FastFabric 7.0 User Guide Command Entry. . . . . . . . . . . . . . . . . . . . . . . . . . . . . . . . . . . . . . . . . . Common Input Commands. . . . . . . . . . . . . . . . . . . . . . . . . . . . . Screen-Specific Input Commands . . . . . . . . . . . . . . . . . . . . . . . Access to Live and Recent PM Historical Data . . . . . . . . . . . . . . . . . . iba_top TUI Screens. . . . . . . . . . . . . . . . . . . . . . . . . . . . . . . . . . . . . . . . . . . Summary Screen. . . . . . . . . . . . . . . . . . . . . . . . . . . . . . . . . . . . . . . . . Fabric configuration information . . . . . . . . . . . . . . . . . . . . . . . . . Performance and Error Statistics for Each Port Group . . . . . . . . Screen-Specific Input Commands . . . . . . . . . . . . . . . . . . . . . . . Additional Screens. . . . . . . . . . . . . . . . . . . . . . . . . . . . . . . . . . . . . . . . PM Configuration Screen . . . . . . . . . . . . . . . . . . . . . . . . . . . . . . . . . . Image Information Screen . . . . . . . . . . . . . . . . . . . . . . . . . . . . . . . . . . Group Information Select Screen . . . . . . . . . . . . . . . . . . . . . . . . . . . . Bandwidth Statistics Screen . . . . . . . . . . . . . . . . . . . . . . . . . . . . . . . . Error Statistics Screen . . . . . . . . . . . . . . . . . . . . . . . . . . . . . . . . . . . . . Group Configuration Screen . . . . . . . . . . . . . . . . . . . . . . . . . . . . . . . . Group Focus Screen . . . . . . . . . . . . . . . . . . . . . . . . . . . . . . . . . . . . . . Port Statistics Screen . . . . . . . . . . . . . . . . . . . . . . . . . . . . . . . . . . . . . Command Line Options. . . . . . . . . . . . . . . . . . . . . . . . . . . . . . . . . . . . 4 Real-Time Fabric Monitor Real-time Fabric Monitor Overview . . . . . . . . . . . . . . . . . . . . . . . . . . . . . . . RFM Screen Layout and User Interaction . . . . . . . . . . . . . . . . . . . . . . . . . . Main Screen . . . . . . . . . . . . . . . . . . . . . . . . . . . . . . . . . . . . . . . . . . . . . . . . . Command-line Segment . . . . . . . . . . . . . . . . . . . . . . . . . . . . . . . . . . . Menu Segment . . . . . . . . . . . . . . . . . . . . . . . . . . . . . . . . . . . . . . . . . . Fabric Segment . . . . . . . . . . . . . . . . . . . . . . . . . . . . . . . . . . . . . . . . . . Selection Segment . . . . . . . . . . . . . . . . . . . . . . . . . . . . . . . . . . . . . . . Submenu Segment . . . . . . . . . . . . . . . . . . . . . . . . . . . . . . . . . . . . . . . View Screen . . . . . . . . . . . . . . . . . . . . . . . . . . . . . . . . . . . . . . . . . . . . . . . . . Menu Section. . . . . . . . . . . . . . . . . . . . . . . . . . . . . . . . . . . . . . . . . . . . View Section . . . . . . . . . . . . . . . . . . . . . . . . . . . . . . . . . . . . . . . . . . . . Context Section . . . . . . . . . . . . . . . . . . . . . . . . . . . . . . . . . . . . . . . . . . Fabric Section . . . . . . . . . . . . . . . . . . . . . . . . . . . . . . . . . . . . . . . . . . . Information Section . . . . . . . . . . . . . . . . . . . . . . . . . . . . . . . . . . . . . . . Sub-Menu Section . . . . . . . . . . . . . . . . . . . . . . . . . . . . . . . . . . . . . . . . Infrastructure View Sub-Screens . . . . . . . . . . . . . . . . . . . . . . . . . . . . . . . . . vi 3-2 3-3 3-3 3-3 3-4 3-4 3-4 3-5 3-6 3-6 3-6 3-7 3-7 3-8 3-9 3-12 3-13 3-14 3-15 4-1 4-2 4-4 4-5 4-5 4-5 4-6 4-6 4-7 4-8 4-9 4-9 4-10 4-10 4-14 4-15 IB0054607-01 A FastFabric 7.0 User Guide Switch Node Screens . . . . . . . . . . . . . . . . . . . . . . . . . . . . . . . . . . . . . Switch Node Selection Screen (500+ Switch Nodes). . . . . . . . . Switch Node Selection Screen (26-500 Switch Nodes) . . . . . . . Switch Node Selection Screen (1-25 Switch Nodes) . . . . . . . . . Switch Node Information Selection Screen . . . . . . . . . . . . . . . . Switch Node Device Information Screen . . . . . . . . . . . . . . . . . . Switch Node Port Selection Screen . . . . . . . . . . . . . . . . . . . . . . Switch Node Port Information Selection Screen. . . . . . . . . . . . . Switch Node General Port Information Screen. . . . . . . . . . . . . . Switch Node Port Statistics Selection Screen. . . . . . . . . . . . . . . Switch Node Port Performance Screen . . . . . . . . . . . . . . . . . . . Channel Adapter (CA) Screens . . . . . . . . . . . . . . . . . . . . . . . . . . . . . . CA Selection Screen (26+ CAs) . . . . . . . . . . . . . . . . . . . . . . . . . CA Selection Screen (1-25 CAs) . . . . . . . . . . . . . . . . . . . . . . . . CA Information Selection Screen . . . . . . . . . . . . . . . . . . . . . . . . CA Device Information Screen . . . . . . . . . . . . . . . . . . . . . . . . . . CA Port Selection Screen . . . . . . . . . . . . . . . . . . . . . . . . . . . . . . CA Port Information Selection Screen . . . . . . . . . . . . . . . . . . . . CA Port General Information Screen . . . . . . . . . . . . . . . . . . . . . CA Port Statistics Selection Screen . . . . . . . . . . . . . . . . . . . . . . CA Port Performance Screen . . . . . . . . . . . . . . . . . . . . . . . . . . . Fabric View Sub-Screens. . . . . . . . . . . . . . . . . . . . . . . . . . . . . . . . . . . . . . . Link Screens . . . . . . . . . . . . . . . . . . . . . . . . . . . . . . . . . . . . . . . . . . . . Link Category Selection Screen . . . . . . . . . . . . . . . . . . . . . . . . . Link Selection Screen (24000+ Links) . . . . . . . . . . . . . . . . . . . . Link Selection Screen (1200-24000 Links) . . . . . . . . . . . . . . . . . Link Selection Screen (60-1200 Links) . . . . . . . . . . . . . . . . . . . . Link Selection Screen (1-60 Links) . . . . . . . . . . . . . . . . . . . . . . . Link Information Selection Screen . . . . . . . . . . . . . . . . . . . . . . . Link End-Node Information Selection Screen. . . . . . . . . . . . . . . Link End-Port Information Selection Screen. . . . . . . . . . . . . . . . Slow Link Selection Screen . . . . . . . . . . . . . . . . . . . . . . . . . . . . SM Screens . . . . . . . . . . . . . . . . . . . . . . . . . . . . . . . . . . . . . . . . . . . . . SM Selection Screen . . . . . . . . . . . . . . . . . . . . . . . . . . . . . . . . . SM Detailed Information Screen. . . . . . . . . . . . . . . . . . . . . . . . . Performance View Sub-Screens . . . . . . . . . . . . . . . . . . . . . . . . . . . . . . . . . Bandwidth Utilization Screens . . . . . . . . . . . . . . . . . . . . . . . . . . . . . . Switch Group Bandwidth Utilization Selection Screen . . . . . . . . Low Bandwidth Utilization Selection Screen . . . . . . . . . . . . . . . IB0054607-01 A 4-15 4-15 4-17 4-18 4-19 4-20 4-21 4-22 4-23 4-24 4-25 4-26 4-26 4-27 4-28 4-29 4-30 4-31 4-32 4-33 4-34 4-35 4-35 4-35 4-36 4-37 4-38 4-39 4-40 4-41 4-43 4-44 4-45 4-45 4-46 4-47 4-47 4-47 4-48 vii FastFabric 7.0 User Guide Error Condition Screens . . . . . . . . . . . . . . . . . . . . . . . . . . . . . . . . . . . Switch Group Error Condition Selection Screen . . . . . . . . . . . . Integrity Error Selection Screen . . . . . . . . . . . . . . . . . . . . . . . . . Link Selection Screen . . . . . . . . . . . . . . . . . . . . . . . . . . . . . . . . Admin Menu Screens . . . . . . . . . . . . . . . . . . . . . . . . . . . . . . . . . . . . . . . . . . Main Screen . . . . . . . . . . . . . . . . . . . . . . . . . . . . . . . . . . . . . . . . Fabric Discovery Screen . . . . . . . . . . . . . . . . . . . . . . . . . . . . . . 5 Configuration of IPoIB Name Mapping A FastFabric Configuration Files FastFabric Configuration File . . . . . . . . . . . . . . . . . . . . . . . . . . . . . . . . . . . . Port Statistics Thresholds Configuration File . . . . . . . . . . . . . . . . . . . . . . . . Signal Integrity Thresholds Configuration File . . . . . . . . . . . . . . . . . . . . . . . Host List Files. . . . . . . . . . . . . . . . . . . . . . . . . . . . . . . . . . . . . . . . . . . . . . . . Chassis List Files . . . . . . . . . . . . . . . . . . . . . . . . . . . . . . . . . . . . . . . . . . . . . Selection of slots within a chassis . . . . . . . . . . . . . . . . . . . . . . . . . . . . Externally Managed Switch List File. . . . . . . . . . . . . . . . . . . . . . . . . . . . . . . Port List File . . . . . . . . . . . . . . . . . . . . . . . . . . . . . . . . . . . . . . . . . . . . . . . . . Fabric Topology Input File . . . . . . . . . . . . . . . . . . . . . . . . . . . . . . . . . . . . . . viii 4-49 4-49 4-50 4-51 4-52 4-52 4-53 A-2 A-7 A-9 A-11 A-12 A-12 A-13 A-17 A-18 IB0054607-01 A FastFabric 7.0 User Guide List of Figures Figure Page 1-1 FastFabric Architecture . . . . . . . . . . . . . . . . . . . . . . . . . . . . . . . . . . . . . . . . . . . . . . 1-3 2-2 QLogic InfiniBand Software Main Menu (Example) . . . . . . . . . . . . . . . . . . . . . . . . . 2-3 2-3 QLogic Fast Fabric InfiniBand Tools Menu (Example) . . . . . . . . . . . . . . . . . . . . . . . 2-5 2-4 Fast Fabric IB Chassis Setup/Admin Menu . . . . . . . . . . . . . . . . . . . . . . . . . . . . . . . 2-6 2-5 Fast Fabric IB Switch Setup/Admin Menu . . . . . . . . . . . . . . . . . . . . . . . . . . . . . . . . 2-14 2-6 Fast Fabric IB Host Setup Menu . . . . . . . . . . . . . . . . . . . . . . . . . . . . . . . . . . . . . . . 2-19 2-7 Fast Fabric IB Host Verification/Admin Menu. . . . . . . . . . . . . . . . . . . . . . . . . . . . . . 2-24 2-8 Fast Fabric IB Fabric Monitoring Menu . . . . . . . . . . . . . . . . . . . . . . . . . . . . . . . . . . 2-29 3-9 iba_top TUI Screen Layout . . . . . . . . . . . . . . . . . . . . . . . . . . . . . . . . . . . . . . . . . . . 3-2 3-10 iba_top Summary Screen. . . . . . . . . . . . . . . . . . . . . . . . . . . . . . . . . . . . . . . . . . . . . 3-4 3-11 PM Configuration Screen . . . . . . . . . . . . . . . . . . . . . . . . . . . . . . . . . . . . . . . . . . . . . 3-6 3-12 Image Information Screen . . . . . . . . . . . . . . . . . . . . . . . . . . . . . . . . . . . . . . . . . . . . 3-7 3-13 Group Information Screen . . . . . . . . . . . . . . . . . . . . . . . . . . . . . . . . . . . . . . . . . . . . 3-8 3-14 Bandwidth Statistics Screen. . . . . . . . . . . . . . . . . . . . . . . . . . . . . . . . . . . . . . . . . . . 3-8 3-15 Error Statistics Screen . . . . . . . . . . . . . . . . . . . . . . . . . . . . . . . . . . . . . . . . . . . . . . . 3-10 3-16 Group Configuration Screen . . . . . . . . . . . . . . . . . . . . . . . . . . . . . . . . . . . . . . . . . . 3-12 3-17 Group Focus Screen . . . . . . . . . . . . . . . . . . . . . . . . . . . . . . . . . . . . . . . . . . . . . . . . 3-14 3-18 Port Statistics Screen . . . . . . . . . . . . . . . . . . . . . . . . . . . . . . . . . . . . . . . . . . . . . . . . 3-15 4-19 RFM Main Screen . . . . . . . . . . . . . . . . . . . . . . . . . . . . . . . . . . . . . . . . . . . . . . . . . . 4-3 4-20 Main Menu Segments . . . . . . . . . . . . . . . . . . . . . . . . . . . . . . . . . . . . . . . . . . . . . . . 4-4 4-21 View Screen . . . . . . . . . . . . . . . . . . . . . . . . . . . . . . . . . . . . . . . . . . . . . . . . . . . . . . . 4-8 4-22 Menu Section . . . . . . . . . . . . . . . . . . . . . . . . . . . . . . . . . . . . . . . . . . . . . . . . . . . . . . 4-8 4-23 View Section . . . . . . . . . . . . . . . . . . . . . . . . . . . . . . . . . . . . . . . . . . . . . . . . . . . . . . 4-9 4-24 Context Section . . . . . . . . . . . . . . . . . . . . . . . . . . . . . . . . . . . . . . . . . . . . . . . . . . . . 4-10 4-25 Infrastructure and Fabric View Information Section . . . . . . . . . . . . . . . . . . . . . . . . . 4-11 4-26 Performance View Error Conditions Information Section. . . . . . . . . . . . . . . . . . . . . 4-12 4-27 Performance View Bandwidth Utilization Information Section . . . . . . . . . . . . . . . . . 4-13 4-28 Infrastructure and Fabric View Sub-Menu Section. . . . . . . . . . . . . . . . . . . . . . . . . . 4-14 4-29 Performance View Bandwidth Utilization Sub-Menu Section . . . . . . . . . . . . . . . . . . 4-14 4-30 Switch Node Selection Screen (500+ Switch Nodes) . . . . . . . . . . . . . . . . . . . . . . . 4-16 4-31 Switch Node Selection Screen (26-500 Switch Nodes) . . . . . . . . . . . . . . . . . . . . . . 4-17 4-32 Switch Node Selection Screen (1-25 Switch Nodes) . . . . . . . . . . . . . . . . . . . . . . . . 4-18 4-33 Switch Node Information Selection Screen . . . . . . . . . . . . . . . . . . . . . . . . . . . . . . . 4-19 4-34 Switch Node Device Information Screen . . . . . . . . . . . . . . . . . . . . . . . . . . . . . . . . . 4-20 4-35 Switch Node Port Selection Screen . . . . . . . . . . . . . . . . . . . . . . . . . . . . . . . . . . . . . 4-21 4-36 Switch Node Port Information Selection Screen . . . . . . . . . . . . . . . . . . . . . . . . . . . 4-22 4-37 Switch Node General Port Information Screen . . . . . . . . . . . . . . . . . . . . . . . . . . . . 4-23 4-38 Switch Node Port Statistics Selection Screen . . . . . . . . . . . . . . . . . . . . . . . . . . . . . 4-24 4-39 Switch Node Port Performance Screen . . . . . . . . . . . . . . . . . . . . . . . . . . . . . . . . . . 4-25 4-40 CA Selection Screen (26+ CAs). . . . . . . . . . . . . . . . . . . . . . . . . . . . . . . . . . . . . . . . 4-26 4-41 CA Selection Screen (1-25 CAs) . . . . . . . . . . . . . . . . . . . . . . . . . . . . . . . . . . . . . . . 4-27 4-42 CA Information Selection Screen . . . . . . . . . . . . . . . . . . . . . . . . . . . . . . . . . . . . . . . 4-28 4-43 CA Device Information Screen. . . . . . . . . . . . . . . . . . . . . . . . . . . . . . . . . . . . . . . . . 4-29 IB0054607-01 A ix FastFabric 7.0 User Guide 4-44 4-45 4-46 4-47 4-48 4-49 4-50 4-51 4-52 4-53 4-54 4-55 4-56 4-57 4-58 4-59 4-60 4-61 4-62 4-63 4-64 4-65 4-66 CA Port Selection Screen . . . . . . . . . . . . . . . . . . . . . . . . . . . . . . . . . . . . . . . . . . . . CA Port Information Selection Screen . . . . . . . . . . . . . . . . . . . . . . . . . . . . . . . . . . . CA Port General Information Screen . . . . . . . . . . . . . . . . . . . . . . . . . . . . . . . . . . . . CA Port Statistics Selection Screen . . . . . . . . . . . . . . . . . . . . . . . . . . . . . . . . . . . . . CA Port Performance Screen. . . . . . . . . . . . . . . . . . . . . . . . . . . . . . . . . . . . . . . . . . Link Category Selection Screen. . . . . . . . . . . . . . . . . . . . . . . . . . . . . . . . . . . . . . . . Link Selection Screen (24000+ Links) . . . . . . . . . . . . . . . . . . . . . . . . . . . . . . . . . . . Link Selection Screen (1200-24000 Links) . . . . . . . . . . . . . . . . . . . . . . . . . . . . . . . Link Selection Screen (60-1200 Links) . . . . . . . . . . . . . . . . . . . . . . . . . . . . . . . . . . Link Selection Screen (1-60 Links) . . . . . . . . . . . . . . . . . . . . . . . . . . . . . . . . . . . . . Link Information Selection Screen (60-1200 Links) . . . . . . . . . . . . . . . . . . . . . . . . . Link End-Node Information Selection Screen . . . . . . . . . . . . . . . . . . . . . . . . . . . . . Link End-Port Information Selection Screen . . . . . . . . . . . . . . . . . . . . . . . . . . . . . . Slow Link Selection Screen . . . . . . . . . . . . . . . . . . . . . . . . . . . . . . . . . . . . . . . . . . . SM Selection Screen . . . . . . . . . . . . . . . . . . . . . . . . . . . . . . . . . . . . . . . . . . . . . . . . SM Detailed Information Screen . . . . . . . . . . . . . . . . . . . . . . . . . . . . . . . . . . . . . . . Switch Group Bandwidth Utilization Selection Screen . . . . . . . . . . . . . . . . . . . . . . . Low Bandwidth Utilization Selection Screen . . . . . . . . . . . . . . . . . . . . . . . . . . . . . . Switch Group Error Condition Selection Screen . . . . . . . . . . . . . . . . . . . . . . . . . . . Integrity Error Selection Screen . . . . . . . . . . . . . . . . . . . . . . . . . . . . . . . . . . . . . . . . Link Selection Screen . . . . . . . . . . . . . . . . . . . . . . . . . . . . . . . . . . . . . . . . . . . . . . . Admin Menu Main Screen . . . . . . . . . . . . . . . . . . . . . . . . . . . . . . . . . . . . . . . . . . . . Fabric Discovery Screen . . . . . . . . . . . . . . . . . . . . . . . . . . . . . . . . . . . . . . . . . . . . . 4-30 4-31 4-32 4-33 4-34 4-35 4-36 4-37 4-38 4-39 4-40 4-41 4-43 4-44 4-45 4-46 4-47 4-48 4-49 4-50 4-51 4-52 4-53 List of Tables Table Page 1-1 FastFabric Methods . . . . . . . . . . . . . . . . . . . . . . . . . . . . . . . . . . . . . . . . . . . . . . . . . 1-4 A-2 FastFabric Configuration Files . . . . . . . . . . . . . . . . . . . . . . . . . . . . . . . . . . . . . . . . . A-1 x IB0054607-01 A Preface Intended Audience This manual is intended to provide network administrators and other qualified personnel a reference for installation, configuration and administration task information for the FastFabric Toolset. Related Materials QLogic FastFabric Command Line Interface Reference Guide QLogic Fabric Software Installation Guide Documentation Conventions This guide uses the following documentation conventions: NOTE: provides additional information. CAUTION! indicates the presence of a hazard that has the potential of causing damage to data or equipment. WARNING!! indicates the presence of a hazard that has the potential of causing personal injury. Text in blue font indicates a hyperlink (jump) to a figure, table, or section in this guide, and links to Web sites are shown in underlined blue. For example: IB0054607-01 A Table 9-2 lists problems related to the user interface and remote agent. See “Installation Checklist” on page 3-6. For more information, visit www.qlogic.com. Text in bold font indicates user interface elements such as a menu items, buttons, check boxes, or column headings. For example: Click the Start button, point to Programs, point to Accessories, and then click Command Prompt. Under Notification Options, select the Warning Alarms check box. Text in Courier font indicates a file name, directory path, or command line text. For example: xi To return to the root directory from anywhere in the file structure: Type cd /root and press ENTER. Enter the following command: sh ./install.bin Key names and key strokes are indicated with UPPERCASE: Press CTRL+P. Press the UP ARROW key. Text in italics indicates terms, emphasis, variables, or document titles. For example: For a complete listing of license agreements, refer to the QLogic Software End User License Agreement. What are shortcut keys? To enter the date type mm/dd/yyyy (where mm is the month, dd is the day, and yyyy is the year). Topic titles between quotation marks identify related topics either within this manual or in the online help, which is also referred to as the help system throughout this document. License Agreements Refer to the QLogic Software End User License Agreement for a complete listing of all license agreements affecting this product. xii IB0054607-01 A Technical Support Customers should contact their authorized maintenance provider for technical support of their QLogic products. QLogic-direct customers may contact QLogic Technical Support; others will be redirected to their authorized maintenance provider. Visit the QLogic support Web site listed in Contact Information for the latest firmware and software updates. For details about available service plans, or for information about renewing and extending your service, visit the Service Program web page at http://www.qlogic.com/services. Training QLogic offers training for technical professionals for all iSCSI, InfiniBand, and Fibre Channel products. From the main QLogic web page at www.qlogic.com, click the Support tab at the top, and then click Training and Certification on the left. The QLogic Global Training portal offers online courses, certification exams, and scheduling of in-person training. Technical Certification courses include installation, maintenance and troubleshooting QLogic products. Upon demonstrating knowledge using live equipment, QLogic awards a certificate identifying the student as a certified professional. You can reach the training professionals at QLogic by e-mail at [email protected]. Contact Information QLogic Technical Support for products under warranty is available during local standard working hours excluding QLogic Observed Holidays. For customers with extended service, consult your plan for available hours.For Support phone numbers, see the Contact Support link at [email protected]. Support Headquarters QLogic Corporation 4601 Dean Lakes Blvd. Shakopee, MN 55379 USA QLogic Web Site www.qlogic.com Technical Support Web Site http://support.qlogic.com Technical Support E-mail [email protected] Technical Training E-mail [email protected] IB0054607-01 A xiii Knowledge Database The QLogic knowledge database is an extensive collection of QLogic product information that you can search for specific solutions. We are constantly adding to the collection of information in our database to provide answers to your most urgent questions. Access the database from the QLogic Support Center: http://support.qlogic.com. xiv IB0054607-01 A 1 FastFabric Overview Feature Overview The FastFabric Toolset is designed to both simplify and expedite common InfiniBand (IB) cluster management tasks. FastFabric can assist in generic management tasks as well as InfiniBand installation, upgrade, configuration and verification tasks. FastFabric has the following key capabilities: Accelerates initial fabric installation Performs chassis and switch configuration Verifies host management network connectivity Verifies host OS levels Sets up host and chassis ssh keys Performs initial InfiniBand software installation Configures Internet Protocol over InfiniBand (IPoIB) IP addresses Performs InfiniBand driver upgrades or the installation of additional InfiniBand drivers Verifies key fabric installation matrixes: Components in fabric Link error counters Link widths and speeds InfiniBand and PCI bus bandwidth InfiniBand end-to-end latency IPoIB connectivity Subnet Agent (SA) visibility of all nodes InfiniBand connectivity of all switches and nodes Aids in diagnosis of fabric problems IB0054607-01 A Fabric error isolation 1-1 1–FastFabric Overview Feature Overview Fabric topology analysis and verification Fabric route analysis Aids in ongoing fabric status and configuration monitoring Fabric Performance, Error and congestion monitoring Automated fabric health checks and configuration baseline compare Automated chassis health checks and configuration baseline compare Automated Subnet Management (SM) health checks and configuration baseline compare Provides tools to accelerate common host administration tasks Executes commands across many hosts Copies files to and from many hosts Edits host-specific files across many hosts Provides tools to accelerate common chassis and switch administration tasks Manage firmware levels on switches and chassis Execute commands across many chassis Administer switches Assists in the initial benchmarking and tuning of High Performance Computing (HPC) fabrics. FastFabric includes both a Textual User Interface (TUI) menu system and command line tools. The TUI presents the menus in a typical order of execution for a new fabric install to simplify fabric installation for new users. All operations available in the TUI can also be accomplished using the command line. The command line tools are designed to permit customer-specific scripts to invoke the command line tools. 1-2 IB0054607-01 A 1–FastFabric Overview FastFabric Architecture FastFabric Architecture Figure 1-1. FastFabric Architecture FastFabric is typically installed on one or more InfiniBand Management Nodes. The InfiniBand Management Node must be connected to the rest of the cluster through InfiniBand and a management network. The management network may be the primary InfiniBand network (IPoIB) or Ethernet. The management network will be used for FastFabric host setup and administration tasks. It may also be used for other aspects of server administration or operation. Depending on cluster size and design, the InfiniBand Management node may also be used as the master node for starting Message Passing Interface (MPI) jobs. It may also be used to run a QLogic Host Fabric Manager (including the Subnet Manager) and other management software. Consult the QLogic Fabric Manager User Guide for details and what combinations are valid. NOTE: When InfiniBand is used as the management network, FastFabric will not be able to install host InfiniBand software or configure IPoIB. However in this configuration, FastFabric is able to support host InfiniBand software upgrades, verification and all its other features. IB0054607-01 A 1-3 1–FastFabric Overview FastFabric Architecture If remote access to FastFabric is desired, set up remote access to the InfiniBand Management Node using ssh, telnet, X-Windows, VNC or any other mechanism which will allow the remote user to access a Linux Command Line shell. Typically FastFabric is used only by cluster administrators. How FastFabric Works FastFabric consists of a variety of tools to administer hosts, chassis and externally managed switches. Depending on the tool, the method of accessing and administering the target devices may differ. The following methods are used by FastFabric: Table 1-1. FastFabric Methods Method Examples Inband access through InfiniBand Fabric Performance, Error and congestion monitoring. Fabric topology reports, SA database queries, fabric error and link speed analysis, tools for externally managed switches, etc. Login through a management network Host setup and installation, tools for internally managed chassis, etc. MPI job startup (can be inband or through a management network) Verify MPI performance, running sample MPI benchmarks. Tools which log in to other hosts will do so in a password-less manner using ssh or telnet (configurable). Tools which log in to internally managed chassis can use ssh or telnet (configurable). Chassis tools can prompt for a single password for all chassis, use password-less ssh, or can be preconfigured with the password. These approaches permit the tools to operate with minimal user interaction and for this reason reduce the time to perform operations against many hosts or chassis. After initial installation, FastFabric can be configured to use IPoIB instead of the management network. NOTE: IPoIB can not be used to reconfigure IPoIB or install new InfiniBand hosts. 1-4 IB0054607-01 A 2 FastFabric TUI Menu FastFabric TUI Menu Overview FastFabric is easiest to use from the textual user interface (TUI) menu system. The menu system provides a way to perform all common tasks and presents common options. Additional less common options are available directly, using the Command Line Tools, documented in the QLogic FastFabric Command Line Interface Reference Guide. In the sections that follow, the menu system will be discussed. The majority of menu items directly invoke various FastFabric command tools. As such the section on each menu item will indicate what command tool it invokes and a summary of the operation performed. For further details about the given command tool, consult the relevant section in the FastFabric Command Line Interface Reference Guide. Some of the menu items are only applicable when Linux is being used. They will be marked with (Linux). Similarly some of the menu items are only applicable when QLogic OFED+, the QLogicIB packaging of OFED software, is being used on the hosts and will be marked with (Host). All menu items which are applicable only when QLogic InfiniBand Switches or Chassis are being used will be marked with (Switch). All remaining menu items are generally applicable to all environments and will be marked with (All) . NOTE: Some of the Linux menu items may be applicable to other Unix-like operating systems.These may be used to enable the use of non-InfiniBand specific FastFabric tools (such as cmdall) against the given hosts. TUI Menu Usage The TUI menus are set up for ease of use. The submenus typically present operations in the typical order they would be used during an installation. Pressing the keys corresponding to menu items (0-9, a-d) will toggle the Skip/Perform selection for the given item. More than one item may be selected. Once the desired set of items have been selected, enter P. To unselect all items, enter N. Entering X or pressing ESC will exit this menu and return to the Main Menu. IB0054607-01 A 2-1 2–FastFabric TUI Menu FastFabric TUI Menu Overview If more than one item is selected, the items will be performed in the order shown in the menu. This is the typical order desired during fabric setup. If it's desired to perform items in a different order, select a single item and enter P to perform it by itself. Then repeat for the next item to be performed. An opportunity will be presented after each item is selected to abort as follows: Hit any key to continue (or ESC to abort)... If ESC is pressed, the sequence of operations will be aborted and return to the previous menu. Any other key will result in the next selected menu item being performed. This prompt is also shown after the last selected item completes permitting an opportunity to review the results before the screen is cleared to display the menu. At the top of each FastFabric menu, the file listing the components to operate on is shown. For example: Host List: /etc/sysconfig/iba/hosts On each FastFabric menu, item 0 will permit a different file to be selected and will permit the editing of the file (using the editor selected by the EDITOR environment variable). In addition it will also permit review and editing of the fastfabric.conf file. The fastfabric.conf file guides the overall configuration of FastFabric and describes cluster specific attributes of how FastFabric will operate. It is discussed in greater detail in Appendix A. During the execution of each menu selection, the actual FastFabric command line tool being used will be shown. This can be used as an educational aid to learn the command line tools. 2-2 IB0054607-01 A 2–FastFabric TUI Menu QLogic InfiniBand Software Main Menu QLogic InfiniBand Software Main Menu The QLogic InfiniBand Software main menu is the top level menu for the QLogic InfiniBand Software. It can be activated using the iba_config command. This menu is not part of the FastFabric TUI. However, since it is one way of getting to the FastFabric Main Menu it will be summarized here. Figure 2-2 is a example of the QLogic Infiniband Software main menu. QLogic Inc. InfiniBand VERSION Software 1) Show Installed Software 2) Reconfigure OFED IP over IB 3) Reconfigure Driver Autostart 4) Update HCA Firmware 5) Generate Supporting Information for Problem Report 6) Fast Fabric (Host/Chassis/Switch Setup/Admin) 7) Uninstall Software X) Exit Figure 2-2. QLogic InfiniBand Software Main Menu (Example) Menu Items Description Selecting items 1 through 7 will display the given submenu. Selecting X will exit the menu system. The submenus are described below. Show Installed Software Menu item 1) Show Installed Software when selected displays the QLogic Inc. IB Installed Software list and shows what is Installed and Not Installed. Reconfigure OFED IP over IB Menu item 2) Reconfigure OFED IP over IB when selected proceeds through the reconfiguration of the OFED IP over IB configuration. Reconfigure Driver Autostart Menu item 3) Reconfigure Driver Autostart when selected proceeds through the reconfiguring of the drivers autostart configuration. Update HCA Firmware Menu item 4) Update HCA Firmware when selected proceeds through the updating the HCA Firmware. IB0054607-01 A 2-3 2–FastFabric TUI Menu QLogic InfiniBand Software Main Menu Generate Supporting Information for Problem Report Menu item 5) Generate Supporting Information for Problem Report when selected proceeds through the process of generating a report and saving it to a user specified file. Fast Fabric (Host/Chassis/Switch Setup/Admin) Menu item 6) Fast Fabric (Host/Chassis/Switch Setup/Admin) when selected displays the Fast Fabric InfiniBand Tools menu. Refer to FastFabric Main Menu section below. Uninstall Software Menu item 7) Uninstall Software when selected proceeds to the QLogic Inc. IB Uninstall Menu. 2-4 IB0054607-01 A 2–FastFabric TUI Menu FastFabric Main Menu FastFabric Main Menu The FastFabric main menu is the starting point to manage the fabric using the TUI. Selecting 6 from the above menu or executing the fastfabric command at a prompt, displays the Fast Fabric InfiniBand Tools menu (Figure 2-3) QLogic Inc. Fast Fabric InfiniBand Tools Version: VERSION 1) Chassis Setup/Admin 2) Externally Managed Switch Setup/Admin 3) Host Setup 4) Host Verification/Admin 5) Fabric Monitoring X) Exit Figure 2-3. QLogic Fast Fabric InfiniBand Tools Menu (Example) Menu Items Description Selecting items 1 through 5 will display the given submenu. Selecting X will exit the menu system. The submenus are described below. Chassis Setup/Admin Menu item 1) Chassis Setup/Admin when selected displays the Fast Fabric IB Chassis Setup/Admin Menu. Refer to “Fast Fabric IB Chassis Setup/Admin Menu” on page 2-6 for detailed information. Externally Managed Switch Setup/Admin Menu item 2) Externally Managed Switch Setup/Admin when selected displays the Fast Fabric IB Switch Setup/Admin Menu. Refer to “Fast Fabric InfiniBand Externally Managed Switch Setup/Admin Menu” on page 2-13 for detailed information. Host Setup Menu item 3) Host Setup when selected displays the Fast Fabric IB Host Setup Menu. Refer to “Fast Fabric IB Host Setup” on page 2-19 for detailed information. Host Verification/Admin Menu item 4) Host Verification/Admin when selected displays the Fast Fabric IB Host Verification/Admin Menu. Refer to “Fast Fabric IB Host Verification/Admin Menu” on page 2-23 for detailed information. IB0054607-01 A 2-5 2–FastFabric TUI Menu Fast Fabric IB Chassis Setup/Admin Menu Fabric Monitoring Menu item 5) Fabric Monitoring when selected displays the Fast Fabric IB Fabric Monitoring Menu. Refer to “Fabric Monitoring” on page 2-29 for detailed information. Fast Fabric IB Chassis Setup/Admin Menu This menu is focused on initial setup and administration of QLogic 12000 internally-managed InfiniBand switches. Pressing the keys corresponding to menu items (0-9) will toggle the Skip/Perform selection for the given item. More than one item may be selected. Once the desired set of items have been selected, enter P. To unselect all items, enter N. Entering X or pressing ESC will exit this menu and return to the Main Menu. Selecting 1 from the Fast Fabric InfiniBand Tools menu (Figure 2-3), displays the Fast Fabric IB Chassis Setup/Admin Menu (Figure 2-4) Fast Fabric IB Chassis Setup/Admin Menu Chassis List: /etc/sysconfig/iba/chassis Setup: 0) Edit Config and Select/Edit Chassis Files [ Skip ] 1) Verify Chassis via Ethernet ping [ Skip ] 2) Update Chassis Firmware [ Skip ] 3) Setup Chassis Basic Configuration [ Skip ] 4) Setup Password-less ssh/scp [ Skip ] 5) Reboot Chassis [ Skip ] 6) Configure Chassis Fabric Manager [ Skip ] 7) Get Basic Chassis Configuration [ Skip ] 8) Check Status of IB Ports [ Skip ] 9) Control Chassis Fabric Manager [ Skip ] a) Generate all Chassis Problem Report Info [ Skip ] b) Run a command on all chassis [ Skip ] c) View iba_chassis_admin result files [ Skip ] P) Perform the selected actions N) Select None Admin: Review: X) Return to Previous Menu (or ESC) Figure 2-4. Fast Fabric IB Chassis Setup/Admin Menu 2-6 IB0054607-01 A 2–FastFabric TUI Menu Fast Fabric IB Chassis Setup/Admin Menu Menu Items Description Selecting items 0 through c will change the item from skip to perform. Selecting N will unselect all items and X will exit the menu system. The items are described below. Edit the Configuration and Select/Edit Chassis Files (Switch) This will permit the chassis, ports and fastfabric.conf files to be edited. The chassis file selected and created by the menu should list the internally managed QLogic switching chassis which are to be operated on. After editing the files, an opportunity is given to edit them again or continue forward. The first file to review and edit is the FastFabric configuration file, /etc/sysconfig/fastfabric.conf: About to: vi /etc/sysconfig/fastfabric.conf Hit any key to continue (or ESC to abort)... The next file to be reviewed is the FastFabric PORTS_FILE, /etc/sysconfig/iba/ports: About to: vi /etc/sysconfig/iba/ports Hit any key to continue (or ESC to abort)... The next file to be reviewed is the chassis file, It first ask the user to select the chassis file to use and gives a default. If a different chassis file needs to be edited the user would need to type in the file location and name. If not pressing ENTER selects the default chassis file: Select Chassis File to Use/Edit [/etc/sysconfig/iba/chassis]: About to: vi /etc/sysconfig/iba/chassis Hit any key to continue (or ESC to abort)... After exiting the vi editor, the TUI will ask if you want to edit the chassis file again. Answer n to continue forward and return to the Fast Fabric IB Chassis Setup/Admin Menu. Refer to “FastFabric Configuration File” on page A-2 for more details about the format of the FastFabric configuration file. Refer to “Port List File” on page A-17 for more details about the format of the FastFabric ports file. Refer to “Chassis List Files” on page A-12 for more details about the format of the chassis list file and about the iba_gen_chassis command which can help generate the chassis file. Verify Chassis via Ethernet ping (Switch) This will run the pingall -C -p -F command to verify the existence of each selected chassis listed in the chassis file using a ping over the management network. IB0054607-01 A 2-7 2–FastFabric TUI Menu Fast Fabric IB Chassis Setup/Admin Menu Update Chassis Firmware (Switch) This will run the iba_chassis_admin update command to permit the chassis firmware version to be verified and updated as needed. NOTE: Any QLogic or SilverStorm 9000 chassis must be running firmware version 4.0.0.4.3 or later to perform this function. If the chassis is not up to this level, it will need to be manually updated using the chassis GUI. See the SilverStorm 9000 Users Guide for more information. NOTE: Consult the relevant chassis firmware release notes to ensure any prerequisites for the upgrade to the new firmware level have been met prior to performing the upgrade using FastFabric. Prompts will guide the user through the options: run - Ensures given firmware is in primary image and running. As needed push firmware to each chassis, select it for use and/or if its not the presently running firmware, reboot the chassis select - Ensures given firmware is in primary image. As needed push firmware to each chassis and/or select it for use on next reboot push - Ensures given firmware is in primary or alternate image. As needed push firmware to each chassis but do not change selected nor running firmware Additional options prompted for: selection of firmware files or directory containing .pkg files parallel vs serial update prompting for chassis password (default is to have password in fastfabric.conf or to use password-less ssh) If any chassis fails to be updated, use the View iba_chassis_admin result files option to review the result files from the update. Refer to FastFabric Command Line Interface Reference Guide for more details. Set up Chassis Basic Configuration (Switch) This will run the iba_chassis_admin configure command which will prompt for chassis configuration settings and then configure all the selected chassis accordingly. The following aspects of chassis configuration may be set: 2-8 Syslog Server IP Address, and Facility code IB0054607-01 A 2–FastFabric TUI Menu Fast Fabric IB Chassis Setup/Admin Menu NTP Server IP Address Time zone and Daylight Savings Time (DST) Maximum MTU size, VL Capability and Link Layer Credit Distribution Link Width Supported IB Node Description (configured to match chassis ethernet name) The IB node description must be a string consisting of the characters A–Z, a–z,0–9, and underscore. No spaces are allowed in the node description string, and it may not begin with a digit., IB Node Description format (concise format or verbose format) Disable chassis auto clear of port counters NOTE: It is required to set the chassis IP address using the chassis serial port CLI during initial chassis installation and setup. Setup Password-less SSH/SCP (Switch) This will run the setup_ssh -C command. This will set up secure password-less SSH such that the InfiniBand Management Node can securely login to all the other chassis as admin through the management network without requiring a password. Password-less SSH avoids the need to enter the chassis password for each FastFabric chassis operation. It also avoids the need to put the chassis password in /etc/sysconfig/fastfabric.conf. Once password-less ssh is set up, the password in the chassis may be changed without impacting the ability to use password-less ssh. As part of this operation, the user will be prompted: Would you like to override the default Chassis password? [n]: If y is answered, the user will be prompted for the current password to use to login into each chassis. Otherwise the password specified in /etc/sysconfig/fastfabric.conf will be used. Reboot Chassis (Switch) This will run the iba_chassis_admin reboot command to reboot each chassis listed in the /etc/sysconfig/iba/chassis file that was created in an earlier step. it also ensures that they are rebooted (as verified using ping over the management network). IB0054607-01 A 2-9 2–FastFabric TUI Menu Fast Fabric IB Chassis Setup/Admin Menu Configure Chassis Fabric Manager (Switch) The Configure Chassis Fabric Manager selection will assist in configuring the Fabric Manager for any QLogic 12000 chassis with appropriate license keys. This operation will be skipped for other chassis models. Prompts will first guide the user through selection or generation of a qlogic_fm.xml file. When generate is selected, the config_generate command is used to guide the user through selecting Fabric Manager configuration options. See the QLogic Fabric Manager User Guide for more information about config_generate. Prompts will guide the user through selecting the config update options: run - Ensures given Fabric Manager configuration is on the chassis and running. As needed push Fabric Manager configuration to each chassis. It will unconditionally restart the Fabric Manager on master Management Modules (MM), it will make sure it is not running on slave MMs. runall - Ensures given Fabric Manager configuration is on the chassis and running. As needed push Fabric Manager configuration to each chassis. It will unconditionally restart the FM on master and slave MMs push - Ensures given Fabric Manager configuration is on the chassis. As needed push Fabric Manager configuration to each chassis. Prompts will also guide the user through selecting the Fabric Manager autostart options: enable - Enables Fabric Manager start on master MM upon chassis boot/reboot, disabled Fabric Manager autostart on any slave MMs in selected chassis. enableall - Enables Fabric Manager start on master and any slave MMs in selected chassis upon boot/reboot. disable - Disables Fabric Manager start on master and any slave MMs in selected chassis upon boot/reboot. Additional options prompted for: parallel vs serial update prompting for chassis password (default is to have password in fastfabric.conf or to use password-less ssh) If any chassis fails to be updated, use the View iba_chassis_admin result files option to review the result files from the update. Refer to FastFabric Command Line Interface Reference Guide for more details. 2-10 IB0054607-01 A 2–FastFabric TUI Menu Fast Fabric IB Chassis Setup/Admin Menu Get Basic Chassis Configuration (Switch) The Get Basic Chassis Configuration supports a new feature to retrieve basic information from chassis such as syslog, NTP configuration, time zone information, MTU Capability, VL Capability, VL Credit Distribution, Link Width and node description. The following is an example of the information retrieved: TEST SUITE getconfig CASE (getconfig.i12k71f.getconfig) get i12k71f i12k71f: Syslog Configuration : Syslog host set to: 192.168.2.15 port 514 facility 22 NTP : Configured to use NTP server: 10.32.2.3 time zone : Current time zone offset is: -5 MTU Capability : 2048 Bytes VL Capability : 2 VLs VL Credit Distribution : 4 LinkWidth Support : 4X Node Description : i12k71f Auto clear status : Auto clear is disabled PASSED Check Status of IB Ports (Switch or All): Check Status of IB Ports allows the state and error counts of all ports to be checked and reviewed. Based on the answers to the prompts shown below either the showallports -C or the iba_report command will be used. Would you like to perform fabric error analysis? [y]: Clear error counters after generating report? [y]: Would you like to perform fabric link speed error analysis? [y]: Check for links configured to run slower than supported? [n]: Check for links connected with mismatched speed potential? [n]: (All): The answer to Would you like to perform fabric error analysis selects whether iba_report -o errors should be run. If the user answers y, the Clear error counters after processing report question is asked. If the user answers y, the -C option will also be used on iba_report to clear the port error counters after doing the error analysis. IB0054607-01 A 2-11 2–FastFabric TUI Menu Fast Fabric IB Chassis Setup/Admin Menu (All): The answer to Would you like to perform fabric link speed error analysis indicates whether iba_report -o slowlinks should be run. If the user answers y to this question, the Check for links configured to run slower than supported question is asked. If the user answers y, the -o misconfiglinks option will also be used for iba_report. Additionally, if the user answers y to the Would you like to perform fabric link speed error analysis question, the Check for links connected with mismatched speed potential question will also be asked. If the user answers y, the -o misconnlinks option is also be used for iba_report. Answering y to all but the last 2 questions is recommended (these are the defaults for each prompt). This checks all the ports in the fabric for any links that have high error rates or are running at a lower speed than expected. Any identified links should be diagnosed and corrected. NOTE: If the fabric is homogeneous and all links are expected to be running at full speed, answer y to the last two questions as well. (Switch): If the user responds n to all of the prompts, the showallports -C command is run to allow the state and symbol error counts of all chassis ports to be manually reviewed. Control Chassis Fabric Manager (Switch) The Configure Chassis Fabric Manager selection will assist in controlling the Fabric Manager for any QLogic 12000 chassis with appropriate license keys. This operation will be skipped for other chassis models. Prompts will guide the user through selecting the control options: restart - Unconditionally restart the Fabric Manager on master Management Modules (MM), it will make sure it is not running on slave MMs. restartall - Unconditionally restart the FM on master and slave MMs run - make sure FM is running on master Management Modules (MM), it will make sure it is not running on slave MMs. runall - make sure FM is running on master and slave MMs stop - Stop FM on master and slave MMs. Prompts will also guide the user through selecting the Fabric Manager autostart options: enable - Enables Fabric Manager start on master MM upon chassis boot/reboot, disabled Fabric Manager autostart on any slave MMs in selected chassis. 2-12 IB0054607-01 A 2–FastFabric TUI Menu Fast Fabric InfiniBand Externally Managed Switch Setup/Admin Menu enableall - Enables Fabric Manager start on master and any slave MMs in selected chassis upon boot/reboot. disable - Disables Fabric Manager start on master and any slave MMs in selected chassis upon boot/reboot. Additional options prompted for: parallel vs serial operation prompting for chassis password (default is to have password in fastfabric.conf or to use password-less ssh) If any chassis fails the operation, use the View iba_chassis_admin result files option to review the result files from the update. Refer to QLogic FastFabric Command Line Interface Reference Guide for more details. Generate all Chassis Problem Report Information (Switch) This will run the captureall -C command to collect configuration and status information from all selected chassis and generate a single *.tgz file that can be sent to the Support Representative. Run a command on all chassis (Switch) This will run the cmdall -C command. A Chassis CLI command may be specified to be executed against all selected chassis. View iba_chassis_admin results files (All) This permits viewing of the test.log and test.res files which reflect the results from iba_chassis_admin runs (such as for updating Chassis Firmware or rebooting all chassis per menu items above). The user is also given the option to remove these files after viewing them. If not removed, subsequent runs of iba_chassis_admin, iba_host_admin or iba_switch_admin from within the current directory will continue to append to these files. Fast Fabric InfiniBand Externally Managed Switch Setup/Admin Menu This menu is focused on administration of QLogic 12200 and SilverStorm 9024FC externally managed switches. Pressing the keys corresponding to menu items (0-8) will toggle the Skip/Perform selection for the given item. More than one item may be selected. Once the desired set of items have been selected, enter P. To unselect all items, enter N. Entering X or pressing ESC will exit this menu and return to the Main Menu. Selecting 2 from the Fast Fabric InfiniBand Tools menu (Figure 2-3), displays the Fast Fabric IB Externally Managed Switch Setup/Admin Menu (Figure 2-5) IB0054607-01 A 2-13 2–FastFabric TUI Menu Fast Fabric InfiniBand Externally Managed Switch Setup/Admin Menu Fast Fabric IB Switch Setup/Admin Menu Externally Managed Switch List: /etc/sysconfig/iba/ibnodes Setup: 0) Edit Config and Select/Edit Switch Files [ Skip ] 1) Test for Switch Presence [ Skip ] 2) Verify Switch Firmware [ Skip ] 3) Update Switch Firmware [ Skip ] 4) Setup Switch Basic Configuration [ Skip ] 5) Reboot Switch [ Skip ] 6) Report Switch Firmware & Hardware Info [ Skip ] 7) Get Basic Switch configuration [ Skip ] 8) Report Switch VPD Information [ Skip ] 9) Generate all Switch Problem Report Info [ Skip ] a) View iba_switch_admin result files [ Skip ] P) Perform the selected actions N) Select None Admin: Review: X) Return to Previous Menu (or ESC) Figure 2-5. Fast Fabric IB Switch Setup/Admin Menu Menu Items Description Selecting items 0 through 9 or a will change the item from skip to perform. Selecting N will unselect all items and X will exit the menu system. The items are described below. Edit Config and Select/Edit Switch Files (Switch) This will permit the fastfabric.conf, ports, and ibnodes files to be edited. The fastfabric.conf file controls the default operation of the FastFabric Tools. The values specified in the fastfabric.conf specify the defaults that will be used for all FastFabric operations performed using this o access the fabric(s) being used. Existing environment variables will override the values in this ports file. The ibnodes file selected and created using this menu should list Externally Managed 12000 and 9024FC Switches that are to be used. After editing the three files, an opportunity is given to edit them again or continue forward. Do you want to edit/review/change the files? [y]: The default will repeat the editing process, answer n to continue forward. 2-14 IB0054607-01 A 2–FastFabric TUI Menu Fast Fabric InfiniBand Externally Managed Switch Setup/Admin Menu Refer to FastFabric Command Line Interface Reference Guide for more details about the format of the ibnodes and ports file, and about the iba_gen_ibnodes command which can help generate the ibnodes file. Test for Switch Presence (Switch) This will run the iba_switch_admin ping command to test for the presence of the selected switches in the fabric. Verify Switch Firmware (Switch) This will run the iba_switch_admin fwverify command to verify the integrity of the present firmware in the switch. If this operation fails, prior to any switch reboots or power-offs of the switch, perform Update Switch Firmware to correct the firmware in the switch. Update Switch Firmware (Switch) This will run the iba_switch_admin upgrade command to permit the switch firmware version to be updated and the switch node name to be set. NOTE: Consult the relevant switch firmware release notes to ensure any prerequisites for the upgrade to the new firmware level have been met prior to performing the upgrade using FastFabric. Prompts will guide the user through options: Selection of firmware files or directory containing .emfw files Reboot switch after update (needed to run new firmware) Parallel vs serial update Prompting for switch password IB0054607-01 A 2-15 2–FastFabric TUI Menu Fast Fabric InfiniBand Externally Managed Switch Setup/Admin Menu NOTE: Since the InfiniBand fabric itself is used to update externally managed switches, updating multiple switches with the reboot option may disrupt parallel update operations. If there are no selected externally managed switches in the path from the InfiniBand Management Node to any other externally managed switch, parallel operations may be used. For example if an InfiniBand Management node is connected directly to a core switch and the externally managed switches are only at the edges. If in doubt, do not use parallel update. Be aware that non-parallel operation for a fabric with many externally managed switches could take a significant amount of time. Another alternative is to perform the update in parallel without a reboot and then perform the reboot separately using the Reboot Switch menu selection. To control the order of the rebooting of externally managed switches by FastFabric, see the discussion of the distance value in “Externally Managed Switch List File” on page A-13. If any switches fail to be updated, use the View iba_switch_admin result files option to review the result files from the update. Refer to FastFabric Command Line Interface Reference Guide for more details. Setup Switch Basic Configuration (Switch) This will run the iba_switch_admin configure command which will prompt for switch configuration settings and then configure all the selected QLogic 12200 switches accordingly. The following aspects of switch configuration may be set: Maximum MTU size VL Capability Link Layer Credit Distribution Link Width Supported Link Speed Supported IB Node Description NOTE: Normally, the IB Node Description is updated as part of a firmware upgrade; however, the user is given the option to update the node description outside of an upgrade procedure. 2-16 IB0054607-01 A 2–FastFabric TUI Menu Fast Fabric InfiniBand Externally Managed Switch Setup/Admin Menu NOTE: This only operates on QLogic 12200 switches. Any 9024FC switches selected will be skipped without change. Reboot Switch (Switch) This will run the iba_switch_admin reboot command to reboot all the switches listed in the /etc/sysconfig/iba/ibnodes file that was created in a previous step. Report Switch Firmware & Hardware Info (Switch) This will run the iba_switch_admin info command to provide a summary of the present state for all the selected switches. The information reported by this option includes: Firmware Version Hardware Version Hardware Part Number Switch Capability (SDR, DDR, or QDR) Present Fan Status Present status of both power supplies (in some models the second power supply is optional) If information fails to be reported for any switches, use the View iba_switch_admin result files option to review the result files from the update. Refer to FastFabric Command Line Interface Reference Guide for more details. Get Basic Switch configuration (Switch) This will run the iba_switch_admin -S -L /etc/sysconfig/iba/ibnodes getconfig command to retrieve basic information from externally managed switch such as: MTU, VL Cap, Credit Distribution, Link Width, Link Speed and node description. The following files are produced from this selection: test.res - appended with summary results of run test.log - appended with detailed results of run save_tmp/ - contains a directory per failed operation with detailed logs test_tmp*/ - intermediate result files while operation is running IB0054607-01 A 2-17 2–FastFabric TUI Menu Fast Fabric InfiniBand Externally Managed Switch Setup/Admin Menu Report Switch VPD Information (Switch) This will run the iba_switch_admin hwvpd command to provide the Virtual Product Data (VPD) for all the selected switches. This information can be useful for inventory and asset control as well as to provide details about the product to customer support. The information reported by this option includes: Serial Number Part Number Model Number Hardware Version Manufacturer Product description Manufacturer ID code Manufacture date Manufacture time of day If information fails to be reported for any switches, use the View iba_switch_admin result files option to review the result files from the update. Refer to FastFabric Command Line Interface Reference Guide for more details. Generate All Switch Problem Report Info (Switch) This menu item runs the captureall -n -S -p command to collect configuration and status information from all selected switches, then generates a single *.tgz file that can be sent to Technical Support. View iba_switch_admin result files (All) This permits viewing of the test.log and test.res files that reflect the results from iba_switch_admin runs (such as those for updating Switch Firmware or rebooting all switches per menu items above). The user is also given the option to remove these files after viewing them. If not removed, subsequent runs of iba_chassis_admin, iba_host_admin or iba_switch_admin from within the current directory will continue to append to these files. 2-18 IB0054607-01 A 2–FastFabric TUI Menu Fast Fabric IB Host Setup Fast Fabric IB Host Setup This menu is focused on initial host setup and installation of InfiniBand software on all the hosts. Pressing the keys corresponding to menu items (0-9, a-d) will toggle the Skip/Perform selection for the given item. More than one item may be selected. Once the desired set of items have been selected, enter P. To unselect all items, enter N. Entering X or pressing ESC will exit this menu and return to the Main Menu. Selecting 3 from the Fast Fabric InfiniBand Tools menu (Figure 2-3), displays the Fast Fabric IB Host Setup Menu (Figure 2-6) Fast Fabric IB Host Setup Menu Host List: /etc/sysconfig/iba/hosts Setup: 0) Edit Config and Select/Edit Hosts Files [ Skip ] 1) Verify Hosts via Ethernet ping [ Skip ] 2) Setup Password-less ssh/scp [ Skip ] 3) Copy /etc/hosts to all hosts [ Skip ] 4) Show uname -a for all hosts [ Skip ] 5) Install/Upgrade QLogic IB Software [ Skip ] 6) Configure IPoIB IP Address [ Skip ] 7) Build MPI Test Apps and Copy to Hosts [ Skip ] 8) Reboot Hosts [ Skip ] 9) Refresh ssh Known Hosts [ Skip ] a) Rebuild MPI Library and Tools [ Skip ] b) Run a command on all hosts [ Skip ] c) Copy a file to all hosts [ Skip ] d) View iba_host_admin result files [ Skip ] P) Perform the selected actions N) Select None Admin: Review: X) Return to Previous Menu (or ESC) Figure 2-6. Fast Fabric IB Host Setup Menu Menu Items Description Selecting items 0 through 9 and a through d will change the item from skip to perform. Selecting N will unselect all items and X will exit the menu system. The items are described below. IB0054607-01 A 2-19 2–FastFabric TUI Menu Fast Fabric IB Host Setup Edit Configuration and Select/Edit Hosts Files (All) This will permit the hosts and fastfabric.conf files to be edited. The hosts file selected and created using this menu should not list the FastFabric host itself. After editing the two files, an opportunity is given to edit them again or continue forward. Selected Host File: /etc/sysconfig/iba/hosts Do you want to edit/review/change the files? [y]: The default will repeat the editing process, answer n to continue forward. Refer to FastFabric Command Line Interface Reference Guide for more details about the format of the hosts file. Verify Hosts via Ethernet ping (All) This will run the pingall command. All the hosts listed will be pinged through the Management Network. Setup Password-less SSH/SCP (Linux) This will run the setup_ssh -s -S -i “” command. This will setup secure password-less SSH such that the InfiniBand Management Node can securely login to all the other hosts as root through the management network without requiring a password. The user will be prompted for the present password of the hosts, the same password will be used to login to all selected hosts. Once password-less ssh is setup, the password in the hosts may be changed without impacting the ability to use password-less ssh. Password-less SSH is required by FastFabric, MPI test applications and most versions of MPI (including QuickSilver MPI, OFED openmpi, OFED mvapich, and OFED mvapich2). Copy /etc/hosts to all hosts (Linux) This will run the scpall /etc/hosts /etc/hosts command to copy the /etc/hosts file on this host to all the other selected hosts. This is not necessary when using a DNS server to resolve hostnames for the cluster. Show uname -a for all hosts (Linux) This run the cmdall “uname -a” command to show the OS version on all the hosts. Review the results carefully to verify all the hosts have the expected OS version. In typical clusters all hosts will be running the same OS and kernel version. 2-20 IB0054607-01 A 2–FastFabric TUI Menu Fast Fabric IB Host Setup Install/Upgrade QLogic IB Software (Host) This will run the iba_host_admin load or iba_host_admin update command to install the QLogicIB software on all the hosts. By default it will look in the current directory for the FF_PRODUCT.FF_PRODUCT_VERSION.tgz file. If it is not found in the current directory, it will prompt for input of a directory name where this file can be found. Prompts will guide the user through options: upgrade - updates all servers with new release. Only components previously installed are upgraded. Will fail for any hosts which have no QLogicIB software currently installed initial install/load - uninstalls any existing QLogicIB software and installs the given release based on fastfabric.conf installation options specified. After the install is completed, the hosts will still need to be rebooted to bring up the new InfiniBand drivers. This can be performed using Reboot Hosts option. If any hosts fail to be updated, use the View iba_host_admin result files option to review the result files from the update. For more details, see FastFabric Command Line Interface Reference Guide. NOTE: When using the QLogicIB packaging of OFED, the entire InfiniBand stack may be installed using FastFabric, which is the recommended approach. When using other packagings of OFED, FastFabric may be used to install the QLogicIB Tools (InfiniServTools.FF_PRODUCT_VERSION.tgz) on the remaining hosts. To do so, FF_PRODUCT_VERSION must be set to the desired InfiniServTools release level and OFED must be installed on each host manually. NOTE: The InfiniBand software selected for installation must be appropriate for the OS version and distribution installed on the destination hosts. Configure IPoIB IP Address (Host) This will run the iba_host_admin configipoib command to create the ifcfg-ib0 files on each host. The file will be created with a statically assigned IPv4 address. The IPoIB IP address for each host will be determined by the resolver (Linux host command). If not found using the resolver, /etc/hosts on the given host will be checked. IB0054607-01 A 2-21 2–FastFabric TUI Menu Fast Fabric IB Host Setup Build MPI Test Apps and Copy to Hosts (Host) This will build the MPI sample benchmarks on the InfiniBand Management Node and copy the resulting object files to all the hosts. This is in preparation for execution of MPI performance tests and benchmarks in a later step. NOTE: This option is available for the QLogicIB packaging of OFED, but is not presently available for other packagings of OFED. Reboot Hosts (Linux) This will run the iba_host_admin reboot command to reboot all the selected hosts and ensure they go down and come back up (as verified using ping over the management network). When the hosts come back up, they will be running the InfiniBand software installed. Refresh SSH Known Hosts (Linux) This will run the setup_ssh -U “” command to refresh the ssh known hosts list on this server for the Management Network. This may be used to update security for this host if hosts are replaced, reinstalled, renamed, or repaired. Rebuild MPI Library and Tools (Host) This will rebuild the MPI Library itself and related tools (such as mpirun). This will be performed using the do_build tool supplied with the MPI Source. When rebuilding MPI, do_build will prompt the user for selection of which MPI (openmpi, mvapich or mvapich2) to rebuild and provide choices as to which available compiler to use. Consult the QLogic HCA and QLogic OFED Software Users Guide for more information. NOTE: This option is available for the QLogicIB packaging of OFED, but is not presently available for other packagings of OFED. Run a command on all hosts (Linux) This will run the cmdall command. A Linux shell command (or sequence of commands separated by semicolons) may be specified to be executed against all selected hosts. Copy a file to all hosts (Linux) This will run the scpall command. A file on the local host may be specified to be copied to all selected hosts. 2-22 IB0054607-01 A 2–FastFabric TUI Menu Fast Fabric IB Host Verification/Admin Menu View iba_host_admin result files (All) This permits viewing of the test.log and test.res files that reflect the results from iba_host_admin runs (such as for installing InfiniBand software or rebooting all hosts per menu items above). The user is also given the option to remove these files after viewing them. If not removed, subsequent runs of iba_chassis_admin, iba_host_admin or iba_switch_admin from within the current directory will continue to append to these files. Fast Fabric IB Host Verification/Admin Menu This menu is focused on verifying hosts and the fabric as well as administration of all the hosts. Pressing the keys corresponding to menu items (0-9, a-b) will toggle the Skip/Perform selection for the given item. More than one item may be selected. Once the desired set of items have been selected, enter P. To unselect all items, enter N. Entering X or pressing ESC will exit this menu and return to the Main Menu. Selecting 4 from the Fast Fabric InfiniBand Tools menu (Figure 2-3), displays the Fast Fabric IB Host Verification/Admin Menu (Figure 2-7) IB0054607-01 A 2-23 2–FastFabric TUI Menu Fast Fabric IB Host Verification/Admin Menu Fast Fabric IB Host Verification/Admin Menu Host List: /etc/sysconfig/iba/allhosts Validation: 0) Edit Config and Select/Edit Hosts Files [ Skip ] 1) Verify Hosts via Ethernet ping [ Skip ] 2) Summary of Fabric Components [ Skip ] 3) Check Status of IB Ports [ Skip ] 4) Verify Hosts see each other [ Skip ] 5) Verify Hosts ping via IPoIB [ Skip ] 6) Refresh ssh Known Hosts [ Skip ] 7) Check MPI Performance [ Skip ] 8) Check Overall Fabric Health [ Skip ] 9) Generate all Hosts Problem Report Info [ Skip ] a) Run a command on all hosts [ Skip ] b) View iba_host_admin result files [ Skip ] P) Perform the selected actions N) Select None Admin: Review: X) Return to Previous Menu (or ESC) Figure 2-7. Fast Fabric IB Host Verification/Admin Menu Menu Items Description Selecting items 0 through 9 and a through b will change the item from skip to perform. Selecting N will unselect all items and X will exit the menu system. The items are described below. Edit Config and Select/Edit Hosts Files (All) This will permit the allhosts, ports, and fastfabric.conf files to be edited. The allhosts file selected and created using this menu should list the FastFabric host itself. After editing the two files, an opportunity is given to edit them again or continue forward. Selected Host File: /etc/sysconfig/iba/allhosts Do you want to edit/review/change the files? [y]: The default will repeat the editing process, enter n to continue forward. Refer to FastFabric Command Line Interface Reference Guide for more details about the format of the allhosts and ports files. 2-24 IB0054607-01 A 2–FastFabric TUI Menu Fast Fabric IB Host Verification/Admin Menu Verify Hosts via Ethernet ping (All) This will run the pingall command. All the hosts listed will be pinged through the Management Network. Summary of Fabric Components (All) This will run the fabric_info command to provide a brief summary of the counts of components in the fabric including how many switch chips, hosts, and links are in the fabric. It will also indicate if any 1x links were found (that could indicate a poorly seated or bad cable). Review the results against the expected configuration of the cluster. NOTE: The link count includes some internal links within the switch boxes. This means that the count displayed will be greater than the actual number of cables. Check Status of IB Ports (Host or All): Check Status of IB Ports allows the state and error counts of all ports to be checked and reviewed. Based on the answers to the prompts shown below either the showallports or the iba_report command will be used. Would you like to perform fabric error analysis? [y]: Clear error counters after generating report? [y]: Would you like to perform fabric link speed error analysis? [y]: Check for links configured to run slower than supported? [n]: Check for links connected with mismatched speed potential? [n]: (All): The answer to Would you like to perform fabric error analysis selects whether iba_report -o errors should be run. If the user enters y, the Clear error counters after processing report question is asked. If the user enters y, the -C option will also be used on iba_report to clear the error counters after doing the error analysis. IB0054607-01 A 2-25 2–FastFabric TUI Menu Fast Fabric IB Host Verification/Admin Menu (All): The answer to Would you like to perform fabric link speed error analysis indicates when iba_report -o slowlinks should be run. If the user enters y to this question, the Check for links configured to run slower than supported question is asked. If the user enters y, the -o misconfiglinks option will also be used for iba_report. Additionally, if the user enters y to the Would you like to perform fabric link speed error analysis question, the Check for links connected with mismatched speed potential question will also be asked. If the user enters y, the -o misconnlinks option is also be used for iba_report. Entering y to all but the last 2 questions is recommended (these are the defaults for each prompt). This checks all the ports in the fabric for any links that have high error rates or are running at a lower speed than expected. Any identified links should be diagnosed and corrected. NOTE: If the fabric is homogeneous and all links are expected to be running at full speed, enter y to the last two questions as well. (Host): If the user enters n to all of the prompts, the showallports command is run to allow the state and symbol error counts of all host ports to be manually reviewed. Selection of this option requires that QLogicIB OFED+ software be installed on all hosts being checked. Verify Hosts see each other (Host) This will run the iba_host_admin sacache command to verify that each host can see all the others through queries to the Subnet Administrator. For the OFED+ stack this also verifies the Distributed SA on each host has been fully populated. NOTE: This operation requires that the hosts being queried be specified by a resolvable TCP/IP host name. This operation will FAIL if the selected hosts are specified by IP address. See the FastFabric Command Line Interface Reference Guide, Selection of Hosts section for more information. Verify Hosts ping via IPoIB (Host) This will run the iba_host_admin ipoibping command to verify that IPoIB is properly configured and running on all the hosts. This is accomplished through the InfiniBand management node pinging each host using IPoIB. 2-26 IB0054607-01 A 2–FastFabric TUI Menu Fast Fabric IB Host Verification/Admin Menu Refresh SSH Known Hosts (Linux) This will run the setup_ssh -U command to refresh the SSH known hosts list on this server for the IPoIB and Management Networks. This may be used to update security for this host if hosts are replaced, reinstalled, renamed, or repaired. Check MPI Performance (Host) This will do a quick check of PCI and MPI performance using end to end latency and bandwidth tests. NOTE: This option is available for the QLogicIB packaging of OFED, but is not presently available for other packagings of OFED. Based on the answer to the prompt shown below either the iba_host_admin mpiperfdeviation or the iba_host_admin mpiperf command will be used. Test Latency and Bandwidth deviation between all hosts? [y]: Answering y is recommended, this will run the iba_host_admin mpiperfdeviation command to do pairwise analysis of latency and bandwidth for the selected hosts and report pairs outside an acceptable tolerance range. By default performance is compared relative to other hosts in the fabric (with the assumption that all hosts selected for a given run should have comparable InfiniBand performance). Failing hosts will be clearly indicated. Answering n will run the iba_host_admin mpiperf command. This displays the MPI latency and bandwidth between pairs of hosts (1-2, 3-4, 5-6, etc). The numbers reported should be checked against the practical PCI speeds in the Performance Impact table in the QLogic Fabric Software Installation Guide. If any pairs are not in the expected performance range, it should be considered a failure for those pairs of hosts. For either test, If any hosts fail, carefully examine the failing hosts to verify the HCA models, PCI slot used, BIOS settings and any motherboard jumpers related to devices on PCI buses or slot speeds. Also verify the HCA and riser cards are properly seated. The results of either test are also written to the test.res file which may be viewed using the View iba_host_admin result files. Refer to FastFabric Command Line Interface Reference Guide for more details. The bandwidth reported should also be checked against the practical PCI speeds in the Performance Impact section. If all pairs are not in the expected performance range, carefully examine all hosts to verify the HCA models, PCI slot used, BIOS IB0054607-01 A 2-27 2–FastFabric TUI Menu Fast Fabric IB Host Verification/Admin Menu settings and any motherboard jumpers related to devices on PCI buses or slot speeds. Check Overall Fabric Health (Host) This will run the all_analysis command to check the overall fabric health. The user will be prompted: Baseline present configuration? [n]: If the user enters y, a new baseline will be created using the present fabric configuration. If the user enters n, the present fabric state is checked against the baseline and the general health of the fabric is also checked. Generate all Hosts Problem Report Info (Host) This will run the captureall command to collect configuration and status information from all hosts and generate a single *.tgz file which can be sent to the Support Representative. Based on the answer to the prompt shown below, various levels of detail about the fabric can be included in the capture. Capture detail level (1=Normal, 2-Fabric, 3-Fabric+FDB, 4-Analysis): The Details levels are: 1-Normal - obtains local information from each host 2-Fabric - in addition to “Normal”, also obtains basic fabric information by queries to the SM and fabric error analysis using iba_report. 3-Fabric+FDB - in addition to “Fabric”, also obtains all the switch forwarding tables and InfiniBand multicast membership lists from the SM. 4-Analysis - in addition to “Fabric+FDB”, also obtains all_analysis results. If all_analysis has not yet been run, it is run as part of the capture. NOTE: Detail levels 2-4 can be used when fabric operational problems occur. If the problem is most likely node specific, detail level 1 should be sufficient. Detail levels 2-4 require an operational Fabric Manager. Typically your support representative will request a given detail level. If a given detail level takes excessively long or fails to be gathered, try a lower detail level. 2-28 IB0054607-01 A 2–FastFabric TUI Menu Fabric Monitoring For detail levels 2-4, the additional information is only gathered on the node running the captureall command. The information is gathered for every fabric specified in the /etc/sysconfig/iba/ports file. Run a command on all hosts (Linux) This will run the cmdall command. A Linux shell command (or sequence of commands separated by semicolons) may be specified to be executed against all selected hosts. View iba_host_admin result files (All) This permits viewing of the test.log and test.res files which reflect the results from iba_host_admin runs (such as those for installing InfiniBand software or rebooting all hosts per menu items above). The user is also given the option to remove these files after viewing them. If not removed, subsequent runs of iba_chassis_admin, iba_host_admin or iba_switch_admin from within the current directory will continue to append to these files. Fabric Monitoring This menu is focused on monitoring the performance of the fabric. Pressing the key corresponding to menu item (0) will toggle the Skip/Perform selection for the given item. More than one item may be selected. Once the desired set of items have been selected, enter P. To unselect all items, enter N. Entering X or pressing ESC will exit this menu and return to the Main Menu. Selecting 5 from the Fast Fabric InfiniBand Tools menu (Figure 2-3), displays the Fast Fabric IB Fabric Monitoring Menu (Figure 2-8) Fast Fabric IB Fabric Monitoring Menu 0) Fabric Performance Monitoring [Perform] P) Perform the selected actions N) Select None X) Return to Previous Menu (or ESC) Figure 2-8. Fast Fabric IB Fabric Monitoring Menu Menu Items Description Selecting item 0 will change the item from skip to perform. Selecting N will unselect all items and X will exit the menu system. The item is described below. IB0054607-01 A 2-29 2–FastFabric TUI Menu Fabric Monitoring Fabric Performance Monitoring (All) This selection initiates iba_top. for full details about iba_top refer to Section 3 2-30 IB0054607-01 A 3 iba_top Fabric Performance Monitor Introduction iba_top is a command line tool which displays performance, congestion, and error information about a fabric. Fabric information is divided into two areas performance and error statistics, which are the main starting points for analyzing fabric traffic. Performance (bandwidth utilization) can identify over-utilized areas (bottle necks) and under-utilized areas (potentially misconfigured); errors can identify problems in fabric hardware or configuration, as well as congestion and other performance situations. iba_top TUI The iba_top TUI screen layout and options consist of four areas in the layout. Image Identification, Screen Specific Information, Common Input Commands, and Screen Specific Input Commands. Figure 3-9shows the top level (summary screen which is being used as an example to show the screen layout. The section following the figure explains each of the areas and the common commands that are available on each screen. IB0054607-01 A 3-1 3–iba_top Fabric Performance Monitor iba_top TUI iba_top: Img:Tue Apr 13 14:11:46 2010, Live Summary: Link:21 SW:4 SM:1 NodeFail:0 AvgMBps 0 All Int 1 HCAs TCA-Port:0 PortSkip:3 MaxMBps AvgKPps MinKPps 0 0 0 0 SmaCong:min Secure:min Snd 0 0 0 0 0 Rcv 0 0 0 0 0 Congst:min SmaCong:min Secure:min MaxKPps 0 0 0 Routing:min 0 0 0 0 0 0 Rcv 0 0 0 0 0 0 Congst:min SmaCong:min Secure:min 0 0 0 0 0 0 Snd 0 0 0 0 0 0 Rcv 0 0 0 0 0 Master-SM: LID:0x0001 Congst:min Port: 1 SmaCong:min Secure:min Priority: 0 State:Master Screen Specific Information Routing:min Int Integ:min Image Identification Routing:min Snd Integ:min 3 SWs PortFail:0 Congst:min Integ:min 2 TCAs HCA-Port:8 NodeSkip:0 MinMBps 0 Integ:min SW-Port:38 0 Routing:min Name:admin1 HCA-1 PortGUID:0x00066A00A000EC5B Secondary-SM: none Quit up Live/rRev/fFwd/bookmrked Bookmrk Unbookmrk ?help | Pmcfg Imginfo 0-3: Common Input Commands Screen-Specific Input commands Figure 3-9. iba_top TUI Screen Layout Image Identification The first display line of iba_top shows the timestamp for the PM sweep (image) being displayed and the type of image (Live, Hist, Bkmk). If a Live image is not being displayed, the current time ('Now:') is also shown. Screen Specific Information The information and layout of this area of the screen will vary depending on which screen is selected. The information and the layout of this section will be discussed for each specific screen in the following sections. Command Entry The last display line of iba_top is a prompt showing available input commands. The left section of commands are available in every screen and perform the same action in each screen. The right section are screen-specific. Commands are case insensitive except as noted by *; the ENTER key must be pressed after a command. Note that a help command ? is available at every screen and provides information about the screen contents and input commands. 3-2 IB0054607-01 A 3–iba_top Fabric Performance Monitor iba_top TUI Common Input Commands The following input commands are available in every screen: Q: Quit program; u*: Up to previous screen; L: Select Live image; R: Navigate reverse 1 (r*) or 5 (R*) sweeps; F: Navigate forward 1 (f*) or 5 (F*) sweeps; b*: Select (previously) Bookmarked image; B*: Bookmark currently selected image; U*: Unbookmark Bookmarked image; ?: Help Screen-Specific Input Commands The screen-specific input commands will be discussed with each screen description in the following sections. Access to Live and Recent PM Historical Data iba_top allows the user to access statistics from sequential PM sweeps (the PM keeps a history of previous sweep images) and queries the PM at a user-specified interval (10 seconds by default). When iba_top queries for statistics for the most recent PM sweep it is in “Live” mode. In Live mode the data will change, at the iba_top interval rate, as iba_top queries new PM sweeps. At each screen (summary or detail) the data being displayed is refreshed for the current PM sweep. A PM sweep can be in “frozen” mode. The data in a frozen sweep will not change, allowing the statistics to be examined in summary and detail screens. Two user actions result in a sweep being frozen. The first is when the user “Bookmarks” a sweep. A Bookmarked sweep will remain frozen until the user explicitly “Unbookmarks” it; iba_top allows one sweep at a time to be bookmarked. The second action is when the user moves (navigates) iba_top's focus to another sweep within the history of sweeps maintained by the PM. For the duration of iba_top's focus on such a sweep it will remain frozen. Navigation can occur from Live mode or when displaying a Bookmarked image; during navigation iba_top is in “Historic” mode. Navigation can be performed backward or forward, 1 or 5 sweeps at a time. IB0054607-01 A 3-3 3–iba_top Fabric Performance Monitor iba_top TUI Screens iba_top TUI Screens Additional screens, described in the following paragraphs, are available to display detailed information about: PM configuration, PM sweep (image) configuration, performance statistics, error statistics, port group configuration, and port statistics (port counters). The screens can be navigated in a hierarchal manner to examine the state of a fabric. Summary Screen The top level (summary) screen of iba_top shows basic fabric configuration information as well as performance and error information. An example of the iba_top summary screen is shown in Figure 3-10. iba_top: Img:Tue Apr 13 14:11:46 2010, Live Summary: Link:21 SW:4 SM:1 NodeFail:0 SW-Port:38 HCA-Port:8 NodeSkip:0 PortFail:0 TCA-Port:0 PortSkip:3 AvgMBps MinMBps MaxMBps AvgKPps MinKPps MaxKPps 0 0 0 0 0 0 0 All Int 1 HCAs Snd 0 0 0 0 0 Rcv 0 0 0 0 0 Integ:min Congst:min Integ:min 2 TCAs Congst:min SmaCong:min Secure:min Secure:min Routing:min 0 0 Routing:min Snd 0 0 0 0 0 0 Rcv 0 0 0 0 0 0 Integ:min 3 SWs SmaCong:min Congst:min SmaCong:min Secure:min Routing:min Int 0 0 0 0 0 0 Snd 0 0 0 0 0 0 Rcv 0 0 0 0 0 Integ:min Master-SM: LID:0x0001 Congst:min Port: 1 SmaCong:min Secure:min Priority: 0 State:Master Fabric Configuration Information Performance and Error Status for Each Port Group 0 Routing:min Name:admin1 HCA-1 PortGUID:0x00066A00A000EC5B Secondary-SM: none SM Configuration Information Quit up Live/rRev/fFwd/bookmrked Bookmrk Unbookmrk ?help | Pmcfg Imginfo 0-3: Figure 3-10. iba_top Summary Screen Fabric configuration information Fabric configuration information includes numbers of links, switches, SMs, and ports, as well as details about the master and secondary (if present) SMs. 3-4 IB0054607-01 A 3–iba_top Fabric Performance Monitor iba_top TUI Screens Performance and Error Statistics for Each Port Group Fabric performance and error statistics are presented based on four groupings of ports: All (all ports in the fabric), HCAs, TCAs and SWs. These groups provide a natural subdivision of the ports in a fabric for analysis. For more information about Groups and the operation of the PM, refer to the QLogic Fabric Manager User Guide. For each port group, average, minimum and maximum MBps (megabytes per second), and KPps (kilopackets per second) are shown, as well as a status indicator for each of five error categories. Performance Statistics Performance statistics for each port group are further divided into up to three subgroups - Internal, Send and Receive - based on whether a port's neighbor port is in its group. If a port's neighbor port is in its group, all performance statistics are contained in the Internal subgroup. If a port's neighbor is not in its group, statistics for data leaving the port (group) are contained in the Send subgroup and statistics for data entering the port are contained in the Receive subgroup. All Group In the All group all ports are Internal since, by definition, the neighbor port must be in the All group. HCAs and TCAs Groups In the HCAs and TCAs groups all neighbor ports are outside the group so statistics are contained in the Send and Receive subgroups. SWs group In the SWs group neighbor ports are either outside the group (HCA or TCA) or inside the group (another switch) so statistics are contained in all three subgroups. Error Categories The five error categories are: Integ — Integrity Congst — Congestion SmaCong — SMA Congestion Secure — Security Routing — Routing These error categories are each based on one or more port error counters. Each error category’s status indicator is shown at one of five values/colors: minimum/green, Low/blue, Moderate/cyan, Warning/yellow or OVER/red based on the error value as compared to a threshold value. IB0054607-01 A 3-5 3–iba_top Fabric Performance Monitor iba_top TUI Screens Screen-Specific Input Commands The summary screen accepts the following input commands: P: PM Configuration screen; I: Image Information screen 0-3: Select Port Group - All (0), HCAs (1), TCAs (2), SWs (3); Additional Screens After looking at the summary screen a user can decide which area of the fabric (performance or error) and which group of ports most warrants investigation, and can then drill down into that area. PM Configuration Screen The PM Configuration screen (Figure 3-11) displays information as provided by the PM (refer to the QLogic Fabric Manager User Guide). The Sweep Interval parameter is separate from the iba_top interval. Normally the iba_top interval should be set to a value greater than or equal to Sweep Interval. The PM configuration screen shows the results for image information (total images, freeze images, freeze lease time), error thresholds, integrity weights, PM memory footprint, PMA MADs retry/timeout, and sweep information. The PM Config screen has no screen-specific input commands. iba_top: Img:Mon Feb 1 16:26:02 2010, Bkmk Now:Mon Feb 1 18:07:09 2010 PM Config: Sweep Interval:10 sec PM Flags(0x17):CaStat EnSwVnd EHcaStat En64Bit Total Images:10 Freeze Images:5 Freeze Lease:60 seconds Err Thresholds: Integrity:100 Integrity Wts: Congestion:100000 SmaCongest:100 Security:10 Routing:100 Symbol Err:1 Link Recovery:30 Port Rcv Err:1 Link Downed:30 Loc Link Integ:30 Congest Wts: Tx Discard %:1 Excess Bfr Ovrn:30 Tx Congest %:1 Tx Ineffic %:1 PM Memory Size:9 MB (10443860 bytes) PMA MADs: MaxAttempts: 0 Sweep: MaxParallelNodes: 0 MinRespTimeout: 0 RespTimeout: 0 PmaBatchSize: 0 Quit up Live/rRev/fFwd/bookmrked Bookmrk Unbookmrk ?help | Figure 3-11. PM Configuration Screen 3-6 IB0054607-01 A 3–iba_top Fabric Performance Monitor iba_top TUI Screens Image Information Screen The Image Information screen (Figure 3-12) displays image information as provided by the PM. Sweep start and duration, numbers of ports in each group, node and port information for the sweep, and SM information is shown. The Image Information screen has no screen-specific input commands. iba_top: Img:Tue Apr 13 15:01:53 2010, Live Image Info: Sweep Start:Tue Apr 13 15:01:53 2010 Sweep Duration:0.016 Seconds Num SW-Ports:38 HCA-Ports:8 TCA-Ports:0 Num SWs:4 Num Links:21 Num SMs:1 Num Fail Nodes:0 Fail Ports:0 Num Skip Nodes:0 Skip Ports:3 Master-SM: LID:0x0001 Port: 1 RTR-Ports:0 Unexpected Clear Ports:0 Priority: 0 State:Master Name:admin1 HCA-1 PortGUID:0x00066A00A000EC5B Secondary-SM: none Quit up Live/rRev/fFwd/bookmrked Bookmrk Unbookmrk ?help | Figure 3-12. Image Information Screen Group Information Select Screen The Group Information Select screen (Figure 3-13) allows the user to select the type of group information to display for the group selected in the summary screen. The following input commands are accepted and lead to the corresponding screen. W: Performance (Bandwidth Utilization) statistics E: Error statistics C: Group configuration (port list) IB0054607-01 A 3-7 3–iba_top Fabric Performance Monitor iba_top TUI Screens iba_top: Img:Tue Apr 13 15:05:25 2010, Live Group Info Select:All NumIntPorts:43 NumExtPorts:0 Group BW Summary (W) Group Err Summary (E) Group Config (C) Quit up Live/rRev/fFwd/bookmrked Bookmrk Unbookmrk ?help | W E C: Figure 3-13. Group Information Screen Bandwidth Statistics Screen The Bandwidth Statistics screen (Figure 3-14) displays, for each valid performance data subgroup (Internal, Send, Receive), the total, average, minimum and maximum MBps and KPps. For each subgroup ten performance 'buckets', from 0+% to 90+% in 10% increments, count the number of ports whose 'MBps compared to link speed' value corresponds to that bucket. This provides an indication of how the data rate of the group compares to its potential. iba_top: Img:Mon Feb 1 16:26:02 2010, Bkmk Now:Mon Feb Group BW Stats:HCAs Criteria:Util-High Number:10 1 17:31:24 2010 Snd TotMBps AvgMBps MinMBps MaxMBps TotKPps AvgKPps MinKPps MaxKPps 2307 769 20 1864 2274 758 20 1841 Buckt 0+% 1 10+% 0 20+% 1 30+% 0 40+% 0 50+% 0 60+% 0 70+% 0 80+% 0 90+% 1 Rcv TotMBps AvgMBps MinMBps MaxMBps TotKPps AvgKPps MinKPps MaxKPps 2307 769 0 1884 2274 758 0 1861 Buckt 0+% 1 10+% 0 20+% 1 30+% 0 40+% 0 50+% 0 60+% 0 70+% 0 80+% 0 90+% 1 Quit up Live/rRev/fFwd/bookmrked Bookmrk Unbookmrk ?help | cC N0-n Detail: Figure 3-14. Bandwidth Statistics Screen 3-8 IB0054607-01 A 3–iba_top Fabric Performance Monitor iba_top TUI Screens The Bandwidth Statistics screen accepts input commands which specify parameters to be used in a group focus query, which will provide a list of ports (in the port group) sorted according to a specified performance criterion. The second line of the Bandwidth Statistics screen displays the group name, and the currently selected focus criterion and number of ports for a group focus query. The D command causes the group focus query to be performed and displayed in a Group Focus screen. The following input commands are accepted in the Bandwidth Statistics screen. C: Select group focus criterion forward (c*) or reverse (C*): Util-High: Bandwidth Utilization (highest first) UtlPkt-Hi: Packet Utilization (highest first) Util-Low: Bandwidth Utilization (lowest first) Nn: Number of entries n in group focus list D: Display detail group focus list Error Statistics Screen The Error Statistics screen (Figure 3-15) displays error statistics for a port group and are divided into up to two subgroups, Internal or External, based on whether a port's neighbor port is in its group (Internal) or not (External). In the All group all ports are Internal. In the HCAs and TCAs groups all ports are External. In the SWs group ports are Internal and External. IB0054607-01 A 3-9 3–iba_top Fabric Performance Monitor iba_top TUI Screens iba_top: Img:Tue Apr 13 15:11:47 2010, Live Group Err Stats:All Criteria:Integ Int Max 0+% 25+% 50+% 75+% 100+% Integrity 0 43 0 0 0 0 Congestion 0 43 0 0 0 0 SmaCongest 0 43 0 0 0 0 Security 0 43 0 0 0 0 Routing 0 43 0 0 0 0 Congest %: 0.0 Ext Discard: Number:10 0 Ineffic %: 0.0 Adapt Rt:0 Max 0+% 25+% 50+% 75+% 100+% Integrity 0 43 0 0 0 0 Congestion 0 43 0 0 0 0 SmaCongest 0 43 0 0 0 0 Security 0 43 0 0 0 0 Routing 0 43 0 0 0 0 Congest %: 0.0 Discard: 0 Ineffic %: 0.0 Adapt Rt:0 Quit up Live/rRev/fFwd/bookmrked Bookmrk Unbookmrk ?help | cC N0-n Detail: Figure 3-15. Error Statistics Screen The five error categories are each based on one or more port error counters. The integrity and congestion error values are calculated by using a weighted sum. The weights for each and the threshold value for each error category can be seen in the PM Configuration screen (see Figure 3-11). For more details about how the values for each error category is composed, refer to the QLogic Fabric Manager User Guide. Integrity: Symbol Errors Link Error Recovery Count Link Downed Count Port Receive Errors Local Link Integrity Errors Excessive Buffer Overrun Errors (neighbor port) 3-10 IB0054607-01 A 3–iba_top Fabric Performance Monitor iba_top TUI Screens Congestion: Port Transmit Discards (neighbor port) Port Transmit Congestion (neighbor port) Port Transmit Wait (neighbor port) SmaCongestion: VL15 Dropped Errors Security: Port Receive Constraint Errors Port Transmit Constraint Errors (neighbor port) Routing: Port Receive Switch Relay Errors For each error subgroup five error 'buckets', from 0+% to 100+% in 25% increments, count the number of ports whose 'error compared to error threshold' value corresponds to that bucket. This provides an indication of how error rates compare to their thresholds. In addition, to aid analysis of congestion, the raw values for maximum Congestion, Transmit Discards, Inefficiency, and number of Adaptive Routing adjustments are shown. The Error Statistics screen accepts input commands which specify parameters to be used in a group focus query, which will provide a list of ports sorted according to a specified error criterion. The second line of the Error Statistics screen displays the group name, and the currently selected focus criterion and number of ports for a group focus query. The D command causes the group focus query to be performed and displayed in a Group Focus screen. The following input commands are accepted in the Error Statistics screen. C: Select group focus criterion forward (c*) or reverse (C*): Integrity errors (highest first) Congestion errors (highest first) SmaCongestion errors (highest first) Security errors (highest first) Routing errors (highest first) Adaptive routing (highest first) Nn: Number of entries n in group focus list D: IB0054607-01 A Display detail group focus list 3-11 3–iba_top Fabric Performance Monitor iba_top TUI Screens Group Configuration Screen The Group Configuration screen (Figure 3-16) displays a list of the ports in a group, including the LID, port number, port GUID and NodeDesc of each. The second line of the screen displays the group name and the number of ports returned in the group config query. If more ports exist than will fit on a screen, the list can be scrolled forward and backward. An index value, shown with each port, can be used to select the port and show the port's counters in a Port Stats screen. The Group Configuration screen accepts the following input commands. S: Scroll forward (s*) or backward (S*) through port list Pn: Select port index value n iba_top: Img:Wed Sep 21 12:51:58 2011, Live Group Config:All Ix LIDx Port NumPorts:43 Node GUID 0x NodeDesc 0 0001 1 00066A009800EC5B admin1 HCA-1 1 0002 1 00066A00070014DC i9k066 L02 2 0002 2 00066A00070014DC i9k066 L02 3 0002 7 00066A00070014DC i9k066 L02 4 0002 8 00066A00070014DC i9k066 L02 5 0002 9 00066A00070014DC i9k066 L02 6 0002 11 00066A00070014DC i9k066 L02 7 0002 13 00066A00070014DC i9k066 L02 8 0002 14 00066A00070014DC i9k066 L02 9 0002 15 00066A00070014DC i9k066 L02 10 0002 16 00066A00070014DC i9k066 L02 11 0002 17 00066A00070014DC i9k066 L02 12 0002 18 00066A00070014DC i9k066 L02 13 0002 19 00066A00070014DC i9k066 L02 14 0002 20 00066A00070014DC i9k066 L02 15 0002 21 00066A00070014DC i9k066 L02 16 0002 22 00066A00070014DC i9k066 L02 17 0002 23 00066A00070014DC i9k066 L02 18 0002 24 00066A00070014DC i9k066 L02 Quit up Live/rRev/fFwd/bookmrked Bookmrk Unbookmrk ?help | sS P0-n: Figure 3-16. Group Configuration Screen 3-12 IB0054607-01 A 3–iba_top Fabric Performance Monitor iba_top TUI Screens Group Focus Screen The Group Focus screen (Figure 3-17) displays a list of the ports the user has selected to focus on within a group, including the LID, port number, focus criterion, port GUID and NodeDesc of each. If the port has a neighbor port, the same information is displayed for the neighbor. The second line of the screen displays the group name, the number of ports selected by in the combination of group, criteria and requested ports, and the number of ports requested in the group focus query. If more ports exist than will fit on a screen, the list can be scrolled forward and backward. Like the Bandwidth Statistics and Error Statistics screens which precede this screen, the focus criterion and number of requested focus ports can be changed to modify the focus port list. An index value, shown with each port, can be used to select the port and show the port's counters in a Port Stats screen. The Group Focus screen accepts the following input commands. S: Scroll forward (s*) or backward (S*) through port list C: Select group focus criteria forward (c*) or reverse (C*): Bandwidth Utilization (highest first) Packet Utilization (highest first) Bandwidth Utilization (lowest first) Integrity errors (highest first) Congestion errors (highest first) SmaCongestion errors (highest first) Security errors (highest first) Routing errors (highest first) Adaptive Routing (highest first) Nn: Number of entries n in group focus list Pn: Select port index value n IB0054607-01 A 3-13 3–iba_top Fabric Performance Monitor iba_top TUI Screens iba_top: Img:Wed Sep 21 13:01:21 2011, Live Group Focus:All GrpNumPorts:43 Ix Integrity LIDx Port NumPorts:3 Node GUID 0x Number:3 NodeDesc 0 0 0001 1 00066A009800EC5B admin1 HCA-1 <-> 0 0002 1 00066A00070014DC i9k066 L02 1 0 0002 2 00066A00070014DC i9k066 L02 <-> 0 0003 1 00066A009800EC51 compute0001 HCA-1 2 0 000C 1 00066A0098007B5E compute0004 HCA-1 <-> 0 0007 24 00066A00D9000108 i9k108 Quit up Live/rRev/fFwd/bookmrked Bookmrk Unbookmrk ?help | sS cC N0-n P0-n: Figure 3-17. Group Focus Screen Port Statistics Screen The Port Statistics screen (Figure 3-18) displays a port's counters (performance and error). Error counters are grouped according to the error category to which they belong. A trailing asterisk ('*') on the counter name indicates the count will be used in computing Error Category information for the neighbor port. When the Port Statistics screen is entered from the Group Focus screen, port neighbor and link information is available. When the Port Statistics screen is entered from the Group Configuration screen this information is not available. The second line of the Port Statistics screen displays the group name, and LID and port number of the port, as well as link rate and MTU (if available). The third line of the screen displays the NodeDesc and Node GUID of the port. The fourth line of the screen displays the NodeDesc, LID and port number of the neighbor port (if available). The Port Statistics screen accepts the following input command (when neighbor information is available). N: Switch between statistics for port and port's neighbor 3-14 IB0054607-01 A 3–iba_top Fabric Performance Monitor iba_top TUI Screens iba_top: Img:Mon Apr Port Stats:All 5 00:01:28 2010, Live LID:0x28 NodeDesc:i12k71f PortNum:10 Rate: 40g MTU:4096 NodeGUID:0x00066A00E300271F Neighbor:pyro HCA-1 LID:0x7 PortNum:2 Xmit: Data:0 MB (3168 Quads) Pkts:44 Recv: Data:0 MB (1152 Quads) Pkts:16 Integrity: SmaCongest: Symbol:0 VL15 Dropped:0 Link Recovery:0 Link Downed:0 Port Rcv:0 Security: Loc Lnk Integrity:0 Port Rcv Constrain:0 Excess Bfr Overrun*:0 Port Xmt Constrain*:0 Congestion: Routing: Port Xmt Discards*:0 Port Rcv Sw Relay:0 Port Xmt Congest*:0 ( Congest Inefficiency*: 0.0%) 0.0% Port Rcv Rmt Phy:0 Port Adapt Route:0 Port Check Rate:2000 per sec Quit up Live/rRev/fFwd/bookmrked Bookmrk Unbookmrk ?help | Neighbor Figure 3-18. Port Statistics Screen Command Line Options The following command line options are available for iba_top: Usage: iba_top [-v][-q] [-h hca] [-p port] [-i seconds] or iba_top --help Options --help — produce full help text -v/--verbose level — verbose output level (additive): 1 — Screen IB0054607-01 A 3-15 3–iba_top Fabric Performance Monitor iba_top TUI Screens 4 — STDERR (iba_top) 16 — STDERR PaClient -q/--quiet — disable progress reports -h/--hca hca — hca to send by, default is 1st hca -p/--port port — port to send by, default is 1st active port -i/--interval seconds — obtain performance stats over interval seconds 3-16 IB0054607-01 A 4 Real-Time Fabric Monitor Real-time Fabric Monitor Overview The Real-time Fabric Monitor (RFM) is a TUI based user interactive application that provides real-time fabric monitoring support. It must be run on a host connected to the InfiniBand fabric with FastFabric installed. To use the Performance view of RFM the QLogic Fabric Manager must be installed. The RFM obtains all its data in an InfiniBand Trade Association (IBTA)-compliant manner. Therefore, it will interoperate with both QLogic and 3rd party InfiniBand components, provided those components are IBTA compliant and implement the IBTA optional features required by the RFM The RFM requires that the subnet manager implement all the IBTA SA queries defined in the standard (such as SM Info records, Link Records, Trace Routes, Port Records, Node Records, etc). As such, it is recommended that the QLogic Fabric Manager version 4.0 or later be used. The RFM requires all end nodes to implement the PMA PortCounters (IBTA mandatory counters). Also any end nodes which report support of a IBTA device management agent must implement the IOU Info, IOC Profile and Service Entry queries as outlined in the IBTA 1.1 standard. The RFM takes advantage of these interfaces to obtain extensive information about the fabric from the subnet manager and the end nodes. Using this information, the RFM is able to cross reference it and produce analysis greatly beyond what any single subnet manager request could provide. As such, it exceeds the capabilities previously available in tools such as iba_saquery and fabric_info. The RFM displays the information in a user-friendly TUI based user interface. The RFM user interface enables users to analyze the information, using interactive requests from the user. The RFM obtains up to date information about the fabric by performing a discovery of the fabric when it is first started. Each discovery will take a few seconds (or less, depending on the size of the fabric) to obtain all the fabric data. The RFM is started by entering the following command at a command prompt. IB0054607-01 A 4-1 4–Real-Time Fabric Monitor RFM Screen Layout and User Interaction Syntax iba_rfm [-v] [-h<hca>] [-p<port>] [-i<seconds>] [-I<seconds>] or iba_rfm --help Options -v — verbose output.This will cause all message types (Errors, Warnings and Debug) to be output to the screen -h/--hca<hca> — hca to send by, default is 1st hca -p/--port<port> — port to send by, default is 1st active port -i/ --interval<seconds> — topology sweep interval, default is 10 seconds -I/ --interval<seconds> — PM sweep interval, default is 10 seconds --help — produce full help text and information on how to use iba_rfm RFM Screen Layout and User Interaction The RFM essentially provides a portal into the fabric environment, in order to enable the administrator to focus on specific facets of the fabric that are of interest. This is accomplished by a view in the RFM, which defines a specific category of information pertaining to the fabric environment. Figure 4-19 is the main menu of the RFM. 4-2 IB0054607-01 A 4–Real-Time Fabric Monitor RFM Screen Layout and User Interaction > MENU: (A)dmin, (Q)uit FABRIC: Img: [Tue Mar 16 09:16:38 2010, Live], SWs: 8, HCAs: 5, Links: 28, GROUP 1 All TCAs: 0, SWsPorts: 62, TCAsPorts: 0 MinMBps MaxMBps AvgKPps MinKPps MaxKPps 0 0 0 0 0 Snd 0 0 0 0 Integ:Min SmaCong:Min Congst:Min Secure:Min 0 0 0 0 Congst:Min 0 0 Secure:Min Rtng:Min 0 0 Rtng:Min Snd 0 0 0 0 0 0 Rcv 0 0 0 0 0 0 Integ:Min 4 SWs HCAsPorts: 2, 0 Rcv 3 TCAs SMs: 2 AvgMBps Int Integ:Min SmaCong:Min 2 HCAs Nodes: 9, SmaCong:Min Congst:Min Secure:Min Rtng:Min Snd 0 0 0 0 0 0 Rcv 0 0 0 0 0 0 Integ:Min SmaCong:Min VID VIEWS 1 Infrastructure View 2 Fabric View Congst:Min Secure:Min Rtng:Min SUBMENU: (L)v, (rR)v, F(wW)d, (b)kmrkd, (B)kmrk, (U)nbkmrk, (G)rp<1-4><u|e> Figure 4-19. RFM Main Screen The Views are as follows: Infrastructure View — enables a user to focus on the infrastructure specific elements and characteristics of the fabric, such as Switches and CAs. Fabric View — enables a user to focus on the networking specific elements and characteristics of the fabric, such as links and SMs. Performance View — enables a user to focus on the customer defined performance specific elements and characteristics of the fabric. A user gains access to this view using the SUBMENU command: (G)rp<1-4><u|e>. After selecting a view, the user may drill down into increasing levels of detail regarding items in that category of view. IB0054607-01 A 4-3 4–Real-Time Fabric Monitor Main Screen The screens of RFM are segmented into fixed sections that provide specific information about the fabric environment, and the actions taken by the user. The following subsections describe the different screens and the segments of each screen starting with the main menu shown in Figure 4-19. Main Screen The RFM main screen shown in Figure 4-20 shows a brake down of the segments in the TUI screen. The following subsections describe each segment of the screen. Command-line Segment > MENU: Menu Segment Fabric Segment (A)dmin, (Q)uit Selection Segment FABRIC: Img: [Tue Mar 16 09:16:38 2010, Live], SWs: 8, HCAs: 5, Links: 28, GROUP 1 All Int TCAs: 0, SWsPorts: 62, MaxMBps AvgKPps MinKPps MaxKPps 0 0 0 0 0 0 Congst:Min Secure:Min Rtng:Min Snd 0 0 0 0 0 0 Rcv 0 0 0 0 0 0 Snd 0 Rcv 0 Integ:Min 4 SWs TCAsPorts: 0 MinMBps Integ:Min SmaCong:Min 3 TCAs HCAsPorts: 2, SMs: 2 AvgMBps Integ:Min SmaCong:Min 2 HCAs Nodes: 9, 0 0 SmaCong:Min Congst:Min Secure:Min 0 0 0 0 Congst:Min 0 0 Secure:Min Rtng:Min 0 0 Rtng:Min Snd 0 0 0 0 0 0 Rcv 0 0 0 0 0 0 Integ:Min SmaCong:Min VID VIEWS 1 Infrastructure View 2 Fabric View Congst:Min Secure:Min Rtng:Min SUBMENU: (L)v, (rR)v, F(wW)d, (b)kmrkd, (B)kmrk, (U)nbkmrk, (G)rp<1-4><u|e> Submenu Segment Figure 4-20. Main Menu Segments 4-4 IB0054607-01 A 4–Real-Time Fabric Monitor Main Screen Command-line Segment The Command-line segment of the screen (Figure 4-20) enables the user to submit commands to control RFM. This is the only section of the screen where user typing will appear. All other sections of the screen are output only. Menu Segment The Menu segment of the screen (Figure 4-20) displays any menu selections available for the user to utilize for the screen being displayed. The available selections have a bolded first letter. The other selections are not available. The menu selections for the main screen are as follows: (A)dmin — Selects the Administration screen. This controls operation of the RFM, such as viewing and/or changing the RFM configuration options. (Q)uit — Exits the RFM. Fabric Segment The Fabric segment of the screen (Figure 4-20) displays summary information about the fabric, specific to the View that the user is currently accessing. The following are the possible types of information that could be shown: Image — PV performance image time-stamp and view mode: Live, Hist, or Bkmk, SWs — number of switches within the fabric HCAs — number of Host Channel adapters within the fabric TCAs — number of Target Channel adapters within the fabric SMs — number of Subnet Managers within the fabric Links — number of links within the fabric SWsPorts — number of ports specific to switches within the fabric HCAsPorts — number of ports specific to HCAs within the fabric TCAsPorts — number of ports specific to TCAs within the fabric Nodes — number of nodes within the fabric Montrd — number of nodes the RFM is configured to monitor. Oprtnl — number of nodes that are currently operational. HlthErrs — number of health related errors within the fabric. CommErrs — number of communication related errors within the fabric. Alarms — number of alarms generated within the fabric IB0054607-01 A 4-5 4–Real-Time Fabric Monitor Main Screen . NOTE: HlthErrs and Alarms are not presently implemented and will report “Not Avail” Selection Segment The Selection segment of the screen (Figure 4-20) displays the various Views and Contexts selections available. Each View selection has a numeric View Identifier (VID) associated with it and each Context selection has a numeric Context Identifier (CID) associated with it. The user may select an available View/Context by entering the numeric VID/CID at the Command-line section. The area of this segment listing groups and their respective bandwidth utilization and error statistics, is summary information for the Performance View. Unlike the other View selections, a user gains access to this View using the SUBMENU command: (G)rp<1-4><u|e> Submenu Segment The Submenu segment of the screen (Figure 4-20) displays the following submenus that can be selected for the main screen. (L)v — this option selects the live image (rR)v — this option reverse step/skips thru historical images F(Ww)d — this option forward step/skips thru historical images (b)kmrkd — this option selects the current bookmarked image (B)kmrk — this option bookmarks the current image (U)nbkmrk — this option unbookmarks the current bookmarked image (G)rp<1-4><u|e> 4-6 1 — this option selects the All group 2 — this option selects the HCAs group 3 — this option selects the TCAs group 4 — this option selects the SWs group u — this option selects the utilization statistics category e — this option selects the error statistics category (e)rror<1-6> 1 — this option selects the Integrity error category 2 — this option selects the Congestion error category IB0054607-01 A 4–Real-Time Fabric Monitor View Screen 3 — this option selects the Sma Congestion error category 4 — this option selects the Security error category 5 — this option selects the Routing error category 6 — this option selects the Adaptive Route error category (u)til<h|p|l> h — this option selects the High BW utilization category p — this option selects the Packet Utilization High category l — this option selects the Low BW utilization category (p)rvPg — this sub-menu selection returns the user to the previous screen Scrl(d)wn — this sub-menu selection lists the next page of information Scrl(u)p — this sub-menu selection lists the previous page of information Ls(t)<n> — this sub-menu selection adjusts the size of lists displaying a list of information (cC)rit — this sub-menu selection forward/reverse switch between utilization and error categories Im(g)Info — this sub-menu selection displays the Image Info Fr(Z) — this sub-menu selection freezes the topology Unfr(Z) — this sub-menu selection unfreezes the topology (+/-) — this sub-menu selection toggles between primary/secondary sub-menu option selections View Screen Each View has a unique Top-level View Summary screen, which enables a user to focus on elements and characteristics of the fabric specific to the selected View. The Top-level View Summary screen displays when the Infrastructure View, Fabric View, or Performance View is selected from the Main screen. An example of a Top-level Infrastructure View Summary screen is shown in Figure 4-21. The following subsections describe the segments of the screen. IB0054607-01 A 4-7 4–Real-Time Fabric Monitor View Screen > MENU: (H)ome, (F)abricView, (P)erformanceView, (A)dmin, (Q)uit VIEW: [I]:H CONTEXT: Name: Infrastructure View FABRIC: Top: [Wed Sep 21 13:10:13 2011, Live], SWs: 4, HCAs: Links: 21, 8, SWsPorts: HlthErrs: Not Avail, TCAs: 38, CommErrs: 0, Nodes: HCAsPorts: 65631, 12, 8, SMs: 2 TCAsPorts: 0 Alrms: Not Avail INFRASTRUCTURE VIEW INFORMATION CID CATEGORY TOTAL MONTRD OPRTNL HLTH-ERRS COMM-ERRS ALRMS 1 Switches 4 4 4 0 65600 Not Avail 2 CAs 8 8 8 0 31 Not Avail 3 Chassis 0 0 0 0 0 Not Avail 4 Servers 0 0 0 0 0 Not Avail 5 Cables 0 0 0 0 0 Not Avail 6 Routers 0 0 0 0 0 Not Avail 7 Applications 0 0 0 0 0 Not Avail SUBMENU: (p)rvPg, Fr(Z), Unfr(z) Figure 4-21. View Screen Menu Section This section of the screen displays any menu selections available for the user to utilize for the screen being displayed (Figure 4-22). The available selections have a bolded first letter. The other selection are not available. > MENU: (H)ome, (F)abricView, (P)erformanceView, (A)dmin, (Q)uit VIEW: [I]:H Figure 4-22. Menu Section The menu selections for the main screen are as follows: 4-8 (H)ome - this menu selection returns the user to the Main screen IB0054607-01 A 4–Real-Time Fabric Monitor View Screen (F)abricView - this menu selection takes the user to the Fabric View main screen, which enables a user to focus on networking specific elements and characteristics of the fabric. This selection is available when in Infrastructure and Performance View. (I)nfrastructureView - this menu selection takes the user to the Infrastructure View main screen, which enables a user to monitor and query components in the fabric. This selection is available when in Fabric and Performance View (P)erformanceView - this menu selection takes the user to the active Performance View main screen, which enables a user to focus on performance specific elements and characteristics of the fabric. (A)dmin — this menu selection takes the user to the Administration screen, which enables a user to focus on administrative related operations of the RFM, such as changing/viewing configuration options. (Q)uit — Exits the RFM. View Section This provides a historical description of the screens traversed by the user to arrive at the present screen (Figure 4-23). The first letter is the view type followed by the hierarchy of screens as the user drives deeper into the fabric. Each screen abbreviation (first letter) is shown in order. > MENU: (H)ome, (F)abricView, (P)erformanceView, (A)dmin, (Q)uit VIEW: [I]:H CONTEXT: Name: Infrastructure View FABRIC: Top: [Wed Sep 21 13:10:13 2011, Live], Figure 4-23. View Section The following format is used: [view-abbreviation]:<screen-abbreviation>:<screen-abbreviatio n> The presently supported view-abbreviations are Infrastructure View [I], Fabric View [F], and Performance View [P]. Context Section This displays the Context of the current screen (Figure 4-24). IB0054607-01 A 4-9 4–Real-Time Fabric Monitor View Screen MENU: (H)ome, (F)abricView, (P)erformanceView, (A)dmin, (Q)uit VIEW: [I]:H CONTEXT: Name: Infrastructure View FABRIC: Top: [Wed Sep 21 13:10:13 2011, Live], Figure 4-24. Context Section The Context Section will always contain the name of the context and could include other information at various levels. The full list of information included in the Context section are: Name — name of the current context Total <element-name> — number of this specific element that exist in the current context Alarms — number of alarms generated relevant to the current Context. Fabric Section This section includes the same type of information in all screens. Refer to “Fabric Segment” on page 4-5 Information Section This section displays general information about a specific context within the fabric. This section of the screen contains different information based on the view, category, and element type. The Infrastructure, Fabric, and Performance view information is described below. The other layouts of this section will be discussed in their appropriate subsections. 4-10 IB0054607-01 A 4–Real-Time Fabric Monitor View Screen HlthErrs: Not Avail, CommErrs: 65631, Alrms: Not Avail INFRASTRUCTURE VIEW INFORMATION CID CATEGORY TOTAL MONTRD OPRTNL HLTH-ERRS COMM-ERRS ALRMS 1 Switches 4 4 4 0 65600 Not Avail 2 CAs 8 8 8 0 31 Not Avail 3 Chassis 0 0 0 0 0 Not Avail 4 Servers 0 0 0 0 0 Not Avail 5 Cables 0 0 0 0 0 Not Avail 6 Routers 0 0 0 0 0 Not Avail 7 Applications 0 0 0 0 0 Not Avail SUBMENU: (p)rvPg, Fr(Z), Unfr(z) Figure 4-25. Infrastructure and Fabric View Information Section The following are the definitions of each column in the Information Section for the Infrastructure and Fabric Views: CID — Numeric Context Identifier (CID) CATEGORY — Element type TOTAL — Total number of the element type in the fabric MONTRD — Indicates number of the element type that RFM is configured to monitor. Applies to Switches, CAs, Links, and SMs only OPRTNL — Indicates number of the element type that is currently operational. Applies to Switches, CAs, Links, and SMs only HLTHERRS — Number of health related errors associated with the element type COMM-ERRS — Number of communication related errors associated with the element type. ALRMS — number of alarms generated that are associated with the element type. IB0054607-01 A 4-11 4–Real-Time Fabric Monitor View Screen PERF: GrpName: All, GrpNumPrts: 107, LstNumPrts: 10, LstMaxNumPrts: 10, NodesFailed: 0, NodesSkipped: 0, PortsFailed: 0, PortsSkipped: 9 All GROUP ERROR STATS INFORMATION Int Max 0+% 25+% 50+% 75+% 100+% Integrity 0 98 0 0 0 0 Congestion 0 98 0 0 0 0 SmaCongest 0 98 0 0 0 0 Security 0 98 0 0 0 0 Routing 0 98 0 0 0 0 Congest %: 0.0 Discard: 0 Ineffic %: 0.0 Adapt Rt:0 SUBMENU: (+), (p)rvPg, (e)rr<1-6>, Ls(t)<n>, Im(g)Info Figure 4-26. Performance View Error Conditions Information Section The following are the definitions of each column in the Information Section for the Error Conditions category of the Performance View: 4-12 Buckt % — number of ports within given percentage of error conditions Integrity — link integrity related errors Congestion — link congestion related errors SmaCongest — link SMA congestion related errors Security — link security related errors Routing — link routing related errors Adaptive routing — Adaptive routing related errors IB0054607-01 A 4–Real-Time Fabric Monitor View Screen PERF: GrpName: All, GrpNumPrts: 107, LstNumPrts: 10, LstMaxNumPrts: 10, NodesFailed: 0, NodesSkipped: 0, PortsFailed: 0, PortsSkipped: 9 All GROUP BW STATS INFORMATION Int TotMBps AvgMBps MinMBps MaxMBps TotKPps AvgKPps MinKPps MaxKPps 0 0 0 0 0 0 0 0 Buckt 0+% 10+% 20+% 30+% 40+% 50+% 60+% 70+% 80+% 90+% 98 0 0 0 0 0 0 0 0 0 SUBMENU: (+), (p)rvPg, (u)til<h|l>, Ls(t)<n>, Im(g)Info Figure 4-27. Performance View Bandwidth Utilization Information Section The following are the definitions of each column in the Information Section for the Bandwidth Utilization category of the Performance View: Int — ports sub-group, which indicates that both ports of a link are in a single group Snd — ports sub-group, which indicates that a port of a link sends from group to outside Rcv — ports sub-group, which indicates that a port of a link receives by group from outside TotMBps — Total of MBps of all selected ports AvgMBps — average MB per second of all selected ports MinMBps — minimum MB per second of all selected ports MaxMBps — maximum MB per second of all selected ports TotKPps — Total of KPps of all selected ports AvgKPps — average kilo packets/sec of all selected ports MinKPps — minimum kilo packets/sec of all selected ports MaxKPps — maximum kilo packets/sec of all selected ports Buckt % — number of ports within given percentage of bandwidth utilization IB0054607-01 A 4-13 4–Real-Time Fabric Monitor View Screen Sub-Menu Section Displays an additional set of minor menu selections that are available. These menu selections exist to assist the user with miscellaneous operations (i.e., maneuvering through the screens). SUBMENU: (p)rvPg, Fr(Z), Unfr(z) Figure 4-28. Infrastructure and Fabric View Sub-Menu Section The menu selections supported are the following: (p)rvPg — return to the previous screen Scroll (d)own — scroll down to the next screen of information being listed. Scroll (u)p — scroll up to the previous screen of information being listed. Fr(Z) — freezes the current topology sweep Unfr(z) — unfreezes the current topology sweep SUBMENU: (+), (p)rvPg, (u)til<h|p|l>, Ls(t)<n>, Im(g)Info Figure 4-29. Performance View Bandwidth Utilization Sub-Menu Section The primary menu selections supported for the Performance View are the following: (+/-) — toggles between the primary/secondary sub-menu selections (p)rvPg — return to the previous screen. Scrl(d)wn — scroll down to the next screen of information being listed. Scrl(u)p — scroll up to the previous screen of information being listed. (u)til<h|p|l> — selects the high/low bandwidth or high packet utilization category 4-14 (e)rr<1-6> — selects an error category: 1) Integrity, 2) Congestion, 3) Sma Congestion, 4) Security, 5) Routing, 6) Adaptive Route Ls(t)<n> — adjusts the size of lists displaying a list of information Im(g)Info — displays the Image Information of the current image IB0054607-01 A 4–Real-Time Fabric Monitor Infrastructure View Sub-Screens (cC)rit — forward/reverse switch between utilization and error categories (n)eighbor — displays information about the neighbor port of a link The secondary menu selections supported for the Performance View are the following: (L)v — selects the live image (rR)v — reverse step/skips thru historical images F(wW)d —forward step/skips thru historical images (b)kmrkd —selects the current bookmarked image (B)kmrk —bookmarks the current image (U)nbkmrk —unbookmarks the current bookmarked image Infrastructure View Sub-Screens Switch Node Screens When the user selects the Switches category from the main screen of the Infrastructure Section View Screen discussed in “Submenu Segment” on page 4-6 above, screens are displayed to enable the user to drill-down to a specific switch of interest. The order in which these screens are displayed will depend upon the number of switches found within the fabric. NOTE: A Switch Node represents a single Switch Chip within the fabric. Large switches, such as the QLogic12000 or SilverStorm 9240 are composed of many Switch Chips and will be displayed as multiple Switch Nodes within the screens which follow. Switch Node Selection Screen (500+ Switch Nodes) If there are 500 or more switch nodes found within the fabric, Figure 4-30 is an example of the screen that will be displayed first. IB0054607-01 A 4-15 4–Real-Time Fabric Monitor Infrastructure View Sub-Screens MENU: (H)ome, (I)nfrastructureView, (F)abricView, (P)erformanceView, (T)opContext, (A)dmin, (Q)uit VIEW: [I]:H:I CONTEXT: Name: Switches, Total Switches: 500, Alrms: Not Avail FABRIC: Top: [Mon Feb 1 16:50:13 2010, Hist], Now: Mon Feb 1 16:54:39 2010 SWs: 500, HCAs: 50, TCAs: 0, Nodes: 527, SMs: 1 Links: 48, SWsPorts: 12000, HCAsPorts: 54, TCAsPorts: 0 HlthErrs: Not Avail, CommErrs: 297, Alrms: Not Avail CID SWITCHES ERRORS | CID SWITCHES ERRORS 1 1 - 499 0 | 11 5000 - 5499 0 2 500 - 999 0 | 12 5500 - 5999 0 3 1000 - 1499 0 | 13 6000 - 6499 0 4 1500 - 1999 0 | 14 6500 - 6999 0 5 2000 - 2499 0 | 15 7000 - 7499 0 6 2500 - 2999 0 | 16 7500 - 7999 0 7 3000 - 3499 0 | 17 8000 - 8499 0 8 3500 - 3999 0 | 18 8500 - 8999 0 9 4000 - 4499 0 | 19 9000 - 9499 0 10 4500 - 4999 0 | 20 9500 - 10000 0 SUBMENU: (p)rvPg, Fr(Z), Unfr(z) Figure 4-30. Switch Node Selection Screen (500+ Switch Nodes) 4-16 IB0054607-01 A 4–Real-Time Fabric Monitor Infrastructure View Sub-Screens Switch Node Selection Screen (26-500 Switch Nodes) After selecting a block of 500 switch nodes or if there are between 26 to 500 switch nodes found within the fabric Figure 4-31 is an example of the screen that will be displayed. MENU: (H)ome, (I)nfrastructureView, (F)abricView, (P)erformanceView, (T)opContext, (A)dmin, (Q)uit VIEW: [I]:H:I:Sw1-499 CONTEXT: Name: Switches 1 - 499, Total Switches: 500, Alrms: Not Avail FABRIC: Top: [Mon Feb 1 16:50:13 2010, Hist], Now: Mon Feb 1 16:54:39 2010 SWs: 500, HCAs: 50, TCAs: 0, Nodes: 527, SMs: 1 Links: 48, SWsPorts: 12000, HCAsPorts: 54, TCAsPorts: 0 HlthErrs: Not Avail, CommErrs: 297, Alrms: Not Avail CID SWITCHES ERRORS | CID SWITCHES ERRORS 1 1 - 25 0 | 11 251 - 275 0 2 26 - 50 0 | 12 276 - 300 0 3 51 - 75 0 | 13 301 - 325 0 4 76 - 100 0 | 14 326 - 350 0 5 101 - 125 0 | 15 351 - 375 0 6 126 - 150 0 | 16 376 - 400 0 7 151 - 175 0 | 17 401 - 425 0 8 176 - 200 0 | 18 426 - 450 0 9 201 - 225 0 | 19 451 - 475 0 10 226 - 250 0 | 20 476 - 500 0 SUBMENU: (p)rvPg, Fr(Z), Unfr(z) Figure 4-31. Switch Node Selection Screen (26-500 Switch Nodes) IB0054607-01 A 4-17 4–Real-Time Fabric Monitor Infrastructure View Sub-Screens Switch Node Selection Screen (1-25 Switch Nodes) After selecting a block of 25 switch nodes or if there are between 1 to 25 switch nodes found within the fabric, Figure 4-32 is an example of the screen that will be displayed. MENU: (H)ome, (I)nfrastructureView, (F)abricView, (P)erformanceView, (T)opContext, (A)dmin, (Q)uit VIEW: [I]:H:I:Sw1-499:Sw1-25 CONTEXT: Name: Switches 1 - 25, Total Switches: 14, Alrms: Not Avail FABRIC: Top: [Mon Feb 1 16:50:13 2010, Hist], Now: Mon Feb 1 16:54:39 2010 SWs: 500, HCAs: 50, TCAs: 0, Nodes: 527, SMs: 1 Links: 48, SWsPorts: 12000, HCAsPorts: 54, TCAsPorts: 0 HlthErrs: Not Avail, CommErrs: 297, Alrms: Not Avail CID SWITCH TYPE PORTS ERRORS NODE DESC 1 0x00066a000600025a DDR 24 0 SilverStorm 9080 GUID=0x00066a 2 0x00066a00060002f7 DDR 24 0 SilverStorm 9080 GUID=0x00066a 3 0x00066a0007000311 DDR 24 0 SilverStorm 9080 GUID=0x00066a 4 0x00066a00070003bb DDR 24 0 SilverStorm 9080 GUID=0x00066a 5 0x00066a0007000df3 DDR 24 0 SilverStorm 9080 GUID=0x00066a 6 0x00066a0007000df6 DDR 24 0 SilverStorm 9080 GUID=0x00066a 7 0x00066a0007000e03 DDR 24 0 SilverStorm 9080 GUID=0x00066a 8 0x00066a0007000e6d DDR 24 0 SilverStorm 9080 GUID=0x00066a 9 0x00066a00d900045f DDR 24 0 i9k45f 10 0x00066a00d9000479 DDR 24 0 i9k479 11 0x00066a00dd000075 DDR 24 0 SilverStorm 9080 GUID=0x00066a 12 0x00066a00de00004d DDR 24 0 SilverStorm 9080 GUID=0x00066a SUBMENU: (p)rvPg, Fr(Z), Unfr(z) Figure 4-32. Switch Node Selection Screen (1-25 Switch Nodes) 4-18 IB0054607-01 A 4–Real-Time Fabric Monitor Infrastructure View Sub-Screens Switch Node Information Selection Screen Figure 4-33 is an example of the screen for selecting specific information for a switch node within the fabric. MENU: (H)ome, (I)nfrastructureView, (F)abricView, (P)erformanceView, (T)opContext, (A)dmin, (Q)uit VIEW: [I]:H:I:Sw13 CONTEXT: Name: 0x00066a00d90000479, Total Switches: 11 FABRIC: Top: [Tue Feb 2 07:31:25 2010, Hist], Now: Tue Feb 2 07:51:50 2010 SWs: 11, HCAs: 3, TCAs: 0, Nodes: 14, SMs: 1 Links: 48, SWsPorts: 103, HCAsPorts: 4, HlthErrs: Not Avail, SWITCH: CommErrs: TCAsPorts: 0 297, Alrms: Not Avail Montrd: TRUE, Oprtnl: TRUE, HlthErrs: Not Avail, CommErrs: 285, Alrms: Not Avail, Type: n/a, Ports: 24, NodeGUID: 0x00066a00d9000479, NodeDesc: i9k479 CID NODE INFORMATION 1 Device Info 2 Ports Info 3 Chassis Info 4 Module Info 5 Partition Info 6 Health Info SUBMENU: (p)rvPg, Fr(Z), Unfr(z) Figure 4-33. Switch Node Information Selection Screen NOTE: In the present release only the Device Info and Ports Info Categories are implemented. IB0054607-01 A 4-19 4–Real-Time Fabric Monitor Infrastructure View Sub-Screens Switch Node Device Information Screen Figure 4-34 is an example of the screen for viewing device specific information for a switch node within the fabric. MENU: (H)ome, (I)nfrastructureView, (F)abricView, (P)erformanceView, (T)opContext, (A)dmin, (Q)uit VIEW: [I]:H:I:Sw1:Sw1Info CONTEXT: Name: Device Info, Total Switches: 11 FABRIC: Top: [Tue Feb 2 07:31:25 2010, Hist], Now: Tue Feb 2 07:51:50 2010 SWs: 11, HCAs: 3, TCAs: 0, Nodes: 14, SMs: 1 Links: 48, SWsPorts: 103, HCAsPorts: 4, HlthErrs: Not Avail, SWITCH: CommErrs: TCAsPorts: 0 297, Alrms: Not Avail Montrd: TRUE, Oprtnl: TRUE, HlthErrs: Not Avail, CommErrs: 285, Alrms: Not Avail, Type: n/a, Ports: 24, NodeGUID: 0x00066a00d9000479, NodeDesc: i9k479 State: Active Number of Ports: Node GUID: 0x00066a00de00004d SysImageGuid: Node Type: SW PartitionCap: Device ID: 0xb924 Revision Number: 0x01a1 Vendor ID: 0x066a Class Version: 0x0001 Base Version: 0x0001 LID: 0x0004 LinearFDBCap: 49152 LinearFDBTop: 1024 RandomFDBCap: MCFDBCap: LIDsPerPort: 0 LifeTime: DefPort: 0 DefMCPrimPort: DefMCNotPrimPort: PortStateChange: Capability: 255 0 24 0x00066a00da000159 8 51 0 33 ms 255 PartEnfCap: 32 Connected Ports: 16 0xf0: IE OE FI FO SUBMENU: (p)rvPg, Fr(Z), Unfr(z) Figure 4-34. Switch Node Device Information Screen 4-20 IB0054607-01 A 4–Real-Time Fabric Monitor Infrastructure View Sub-Screens Switch Node Port Selection Screen Figure 4-35 is an example of the screen for selecting a port within a specific switch node within the fabric. MENU: (H)ome, (I)nfrastructureView, (F)abricView, (P)erformanceView, (T)opContext, (A)dmin, (Q)uit VIEW: [I]:H:I:Sw1:Sw1Info CONTEXT: Name: Ports Info, Total Switches: 11 FABRIC: Top: [Tue Feb 2 07:31:25 2010, Hist], Now: Tue Feb 2 07:51:50 2010 SWITCH: NodeGUID: 0x00066a00d9000479, NodeDesc: i9k479 CID 0 CID PORT ERRORS Port-00 (Active) PORT 0 ERRORS | CID PORT ERRORS 1 Port-01 0 | 13 Port-13 (Active) 0 2 Port-02 0 | 14 Port-14 (Active) 0 3 Port-03 0 | 15 Port-15 (Active) 0 4 Port-04 0 | 16 Port-16 (Active) 0 5 Port-05 0 | 17 Port-17 (Active) 0 6 Port-06 0 | 18 Port-18 (Active) 0 7 Port-07 0 | 19 Port-19 (Active) 0 8 Port-08 0 | 20 Port-20 (Active) 0 9 Port-09 (Active) 0 | 21 Port-21 (Active) 0 10 Port-10 0 | 22 Port-22 (Active) 0 11 Port-11 (Active) 0 | 23 Port-23 (Active) 0 12 Port-12 (Active) 0 | 24 Port-24 (Active) 0 SUBMENU: (p)rvPg, Fr(Z), Unfr(z) Figure 4-35. Switch Node Port Selection Screen IB0054607-01 A 4-21 4–Real-Time Fabric Monitor Infrastructure View Sub-Screens Switch Node Port Information Selection Screen Figure 4-36 is an example of the screen for selecting the information to display for a port within a switch node within the fabric. MENU: (H)ome, (I)nfrastructureView, (F)abricView, (P)erformanceView, (T)opContext, (A)dmin, (Q)uit VIEW: [I]:H:I:Sw1:Sw1Info:P0 CONTEXT: Name: Port-00, Total Switches: 11 FABRIC: Top: [Tue Feb 2 07:31:25 2010, Hist], Now: Tue Feb 2 07:51:50 2010 SWITCH: Montrd: TRUE, Oprtnl: TRUE, HlthErrs: Not Avail, CommErrs: 285, Alrms: Not Avail, Type: n/a, Ports: 24, NodeGUID: 0x00066a00d9000479, NodeDesc: i9k479, PORT: CID PortNo: 0, PortErrs: 0 PORT INFORMATION 1 General Port Info 2 Port Statistics Info 3 Port Attributes Info 4 Port SL2VL Mapping Info SUBMENU: (p)rvPg, Fr(Z), Unfr(z) Figure 4-36. Switch Node Port Information Selection Screen NOTE: In the present release only the General Port Info and Port Statistics Info are implemented. 4-22 IB0054607-01 A 4–Real-Time Fabric Monitor Infrastructure View Sub-Screens Switch Node General Port Information Screen Figure 4-37 is an example of the screen for viewing general port information, about a specific port within a switch node within the fabric. MENU: (H)ome, (I)nfrastructureView, (F)abricView, (P)erformanceView, (T)opContext, (A)dmin, (Q)uit VIEW: [I]:H:I:Sw1:Sw1Info:P0:P0Info CONTEXT: Name: General Port Info, Total Switches: 11 FABRIC: Top: [Tue Feb 2 07:31:25 2010, Hist], Now: Tue Feb 2 07:51:50 2010 SWITCH: NodeGUID: 0x00066a00d9000479, NodeDesc: i9k479 PortNum: 0 LID: 0x0004 GUID: 0x00066a00de00004d PortState: Active PhysState: LinkUp DownDefault: Polling LID: 0x0004 LMC: 0 Subnet: 0xfe80000000000000 SMLID: 0x000e M_KEY: 0x0000000000000000 Lease: MTU: SMSL: 0 RespTimeout: 536 ms SubnetTimeout: 0 s 536 ms Protect: Readonly Active: 2048 Supported: 2048 VL Stall: 0 LinkWidth: Active: 4x Supported: 1-4x Enabled: 4x LinkSpeed: Active: 2.5Gb Supported: 2.5Gb Enabled: 2.5Gb 8+1 Supported: 8+1 VLs: Active: HOQLife: 4096 ns Capability 0x00100848: VDR SIG SL Trap Violations: M_Key: 0 P_Key: ErrorLimits: Overrun: 0 LocalPhys: P_Key Enforcement: In: Off Out: Off 0 Q_Key: 0 0 DiagCode: 0x0000 FilterRaw: In: Off Out: Off SUBMENU: (p)rvPg, Fr(Z), Unfr(z) Figure 4-37. Switch Node General Port Information Screen IB0054607-01 A 4-23 4–Real-Time Fabric Monitor Infrastructure View Sub-Screens Switch Node Port Statistics Selection Screen Figure 4-38 is the screen for viewing port statistic information about a specific port within a switch node within the fabric. MENU: (H)ome, (I)nfrastructureView, (F)abricView, (P)erformanceView, (T)opContext, (A)dmin, (Q)uit VIEW: [I]:H:I:Sw13:Sw13Info:P0:P0Info CONTEXT: Name: Port Statistics Info, Total Switches: 11 FABRIC: Top: [Tue Feb 2 07:31:25 2010, Hist], Now: Tue Feb 2 07:51:50 2010 SWITCH: Montrd: TRUE, Oprtnl: TRUE, HlthErrs: Not Avail, CommErrs: 285, Alrms: Not Avail, Type: DDR, Ports: 24, NodeGUID: 0x00066a00d9000479, NodeDesc: i9k479, PORT: CID PortNo: 0, PortErrs: 0 PORT STATISTICS INFORMATION 1 Port Performance Info 2 Port Async Events/Traps Info SUBMENU: (p)rvPg, Fr(Z), Unfr(z) Figure 4-38. Switch Node Port Statistics Selection Screen NOTE: In the present release only the Port Performance Info is implemented. 4-24 IB0054607-01 A 4–Real-Time Fabric Monitor Infrastructure View Sub-Screens Switch Node Port Performance Screen Figure 4-39 is the screen for viewing performance information about a specific port within a switch node within the fabric. MENU: (H)ome, (I)nfrastructureView, (F)abricView, (P)erformanceView, (T)opContext, (A)dmin, (Q)uit VIEW: [I]:H:I:Sw1:Sw1Info:P19:P19Info:P19StatInfo CONTEXT: Name: Port Performance Info, Total Switches: 4 FABRIC: Top: [Sat Apr 3 14:37:06 2010, Hist], Now: Sat Apr 3 14:39:56 2010 SWITCH: Montrd: TRUE, Oprtnl: TRUE, CommErrs: 0, HlthErrs: Not Avail, Alrms: Not Avail, Type: n/a, Ports: 24, NodeGUID: 0x00066a00060008bc, NodeDesc: SilverStorm 9040 GUID=0x PMA PORT PERFORMANCE TRANSMIT [PA] Xmit Data: Xmit Pkts: 4889 MB (1281863304 Quads) 17803657 PMA PORT PERFORMANCE RECEIVE [PA] Rcv Data: 9230 MB (2419802026 Quads) Rcv Pkts: 33608385 PMA PORT ERRORS [PA] Symbol Errors: 0 Link Error Recovery: 0 Link Downed: 0 Port Rcv Errors: 0 Port Rcv Rmt Phys Err: 0 Port Rcv Sw Relay Err: Port Xmit Discards: 0 Port Xmit Constraint: 0 Port Rcv Constraint: 0 Local Link Integrity: 0 Exc. Buffer Overrun: 0 VL15 Dropped: 0 48 SUBMENU: (p)rvPg, Fr(Z), Unfr(z) Figure 4-39. Switch Node Port Performance Screen IB0054607-01 A 4-25 4–Real-Time Fabric Monitor Infrastructure View Sub-Screens Channel Adapter (CA) Screens When the user selects the CAs category from the main screen of the Infrastructure View (Refer to “Submenu Segment” on page 4-6), screens are displayed to enable the user to drill-down to a specific channel adapter of interest. The order in which these screens are displayed will depend upon the number of channel adapters found within the fabric. NOTE: If a given Server or IO Device contains multiple Channel Adapters (CAs), each will be show separately and can be accessed independently in the screens which follow. CA Selection Screen (26+ CAs) If there are 26 or more CAs found within the fabric, Figure 4-40 is an example of the screen that will be displayed first. MENU: (H)ome, (I)nfrastructureView, (F)abricView, (P)erformanceView, (T)opContext, (A)dmin, (Q)uit VIEW: [I]:H:I CONTEXT: Name: CAs, Total CAs: 3, FABRIC: Alrms: Not Avail Top: [Tue Feb 2 07:31:25 2010, Hist], Now: Tue Feb 2 07:51:50 2010 SWs: 11, HCAs: 3, TCAs: 0, Nodes: 14, SMs: 1 Links: 48, SWsPorts: 103, HCAsPorts: 4, TCAsPorts: 0 HlthErrs: Not Avail, CommErrs: 297, Alrms: Not Avail CID CAs ERRORS | CID CAs ERRORS 1 1 - 25 0 | 11 251 - 275 0 2 26 - 50 0 | 12 276 - 300 0 3 51 - 75 0 | 13 301 - 325 0 4 76 - 100 0 | 14 326 - 350 0 5 101 - 125 0 | 15 351 - 375 0 6 126 - 150 0 | 16 376 - 400 0 7 151 - 175 0 | 17 401 - 425 0 8 176 - 200 0 | 18 426 - 450 0 9 201 - 225 0 | 19 451 - 475 0 10 226 - 250 0 | 20 476 - 500 0 SUBMENU: (p)rvPg, Fr(Z), Unfr(z) Figure 4-40. CA Selection Screen (26+ CAs) 4-26 IB0054607-01 A 4–Real-Time Fabric Monitor Infrastructure View Sub-Screens CA Selection Screen (1-25 CAs) After selecting a block of 25 CAs or if there are between 1 to 25 CAs found within the fabric, Figure 4-41 is an example of the screen that will be displayed. MENU: (H)ome, (I)nfrastructureView, (F)abricView, (P)erformanceView, (T)opContext, (A)dmin, (Q)uit VIEW: [I]:H:I CONTEXT: Name: CAs 1 - 25, Total CAs: 13, Alrms: Not Avail FABRIC: Top: [Tue Feb 2 07:31:25 2010, Hist], Now: Tue Feb 2 07:51:50 2010 SWs: 11, HCAs: 3, TCAs: 0, Nodes: 14, SMs: 1 Links: 48, SWsPorts: 103, HCAsPorts: 4, TCAsPorts: 0 HlthErrs: Not Avail, CommErrs: 297, Alrms: Not Avail CID CA TYPE PORTS ERRORS NODE DESC 1 0x0002c9020025a678 DDR 2 0 mindy2 HCA-1 2 0x00066a0098000405 DDR 2 0 endrin 3 0x00066a009800413e DDR 2 0 cuda 4 0x00066a009800447b DDR 2 0 duster 5 0x00066a0098006cad DDR 2 0 InfiniServ 6 0x00066a0098006f74 DDR 2 0 QuickSilver 7 0x00066a0098007b70 DDR 2 0 stewie HCA-1 8 0x00066a10dd000075 DDR 1 0 FVIC in Chassis 0x00066a00da00 9 0x00066a10de00004d DDR 1 0 EVIC in Chassis 0x00066a00da00 10 0x00066a20dd000075 DDR 1 0 FVIC in Chassis 0x00066a00da00 11 0x00066a20de00004d DDR 1 0 EVIC in Chassis 0x00066a00da00 12 0x0011750000ff8f4d DDR 1 0 scooby HCA-1 SUBMENU: (p)rvPg, Fr(Z), Unfr(z) Figure 4-41. CA Selection Screen (1-25 CAs) IB0054607-01 A 4-27 4–Real-Time Fabric Monitor Infrastructure View Sub-Screens CA Information Selection Screen Figure 4-42 is an example of the screen for selecting the information to display for a CA within the fabric. MENU: (H)ome, (I)nfrastructureView, (F)abricView, (P)erformanceView, (T)opContext, (A)dmin, (Q)uit VIEW: [I]:H:I:Ca1 CONTEXT: Name: 0x00066a0098007b70, Total CAs: 3 FABRIC: Top: [Tue Feb 2 07:31:25 2010, Hist], Now: Tue Feb 2 07:51:50 2010 SWs: 11, HCAs: 3, TCAs: 0, Nodes: 14, SMs: 1 Links: 48, SWsPorts: 103, HCAsPorts: 4, TCAsPorts: 0 HlthErrs: Not Avail, CommErrs: 297, Alrms: Not Avail CA: Montrd: TRUE, CommErrs: 87, Oprtnl: TRUE, HlthErrs: Not Avail, Alrms: Not Avail, Type: n/a, Ports: 2, NodeGUID: 0x00066a0098007b70, NodeDesc: stewie HCA-1 CID NODE INFORMATION 1 Device Info 2 Ports Info 3 Chassis Info 4 Module Info 5 Partition Info 6 Health Info SUBMENU: (p)rvPg, Fr(Z), Unfr(z) Figure 4-42. CA Information Selection Screen NOTE: In the present release only the Device Info and Ports Info Categories are implemented. 4-28 IB0054607-01 A 4–Real-Time Fabric Monitor Infrastructure View Sub-Screens CA Device Information Screen Figure 4-43 is an example of the screen for viewing device specific information for a CA within the fabric. MENU: (H)ome, (I)nfrastructureView, (F)abricView, (P)erformanceView, (T)opContext, (A)dmin, (Q)uit VIEW: [I]:H:I:Ca1:Ca1Info CONTEXT: Name: 0x00066a0098007b70, Total CAs: 3 FABRIC: Top: [Tue Feb 2 07:31:25 2010, Hist], Now: Tue Feb 2 07:51:50 2010 SWs: 11, HCAs: 3, TCAs: 0, Nodes: 14, SMs: 1 Links: 48, SWsPorts: 103, HCAsPorts: 4, TCAsPorts: 0 HlthErrs: Not Avail, CommErrs: 297, Alrms: Not Avail CA: NodeGUID: 0x00066a0098007b70, NodeDesc: stewie HCA-1 State: Active Number of Ports: 2 Node GUID: 0x0002c9020025a678 SysImageGuid: Node Type: CA PartitionCap: Device ID: 0x634a Revision Number: 0x00a0 Vendor ID: 0x02c9 Class Version: 0x0001 Base Version: 0x0001 Connected Ports: 0x0001 0x0002c9020025a67b 128 SUBMENU: (p)rvPg, Fr(Z), Unfr(z) Figure 4-43. CA Device Information Screen IB0054607-01 A 4-29 4–Real-Time Fabric Monitor Infrastructure View Sub-Screens CA Port Selection Screen Figure 4-44 is an example of the screen for selecting a port within a specific CA within the fabric. MENU: (H)ome, (I)nfrastructureView, (F)abricView, (P)erformanceView, (T)opContext, (A)dmin, (Q)uit VIEW: [I]:H:I:Ca1:Ca1Info CONTEXT: Name: Ports Info, Total CAs: 3 FABRIC: Top: [Tue Feb 2 07:31:25 2010, Hist], Now: Tue Feb 2 07:51:50 2010 CA: NodeGUID: 0x00066a0098007b70, NodeDesc: stewie HCA-1 CID 0 CID PORT ERRORS Port-00 0 PORT ERRORS | CID PORT ERRORS 1 Port-01 (Active) 0 | 13 Port-13 0 2 Port-02 0 | 14 Port-14 0 3 Port-03 0 | 15 Port-15 0 4 Port-04 0 | 16 Port-16 0 5 Port-05 0 | 17 Port-17 0 6 Port-06 0 | 18 Port-18 0 7 Port-07 0 | 19 Port-19 0 8 Port-08 0 | 20 Port-20 0 9 Port-09 0 | 21 Port-21 0 10 Port-10 0 | 22 Port-22 0 11 Port-11 0 | 23 Port-23 0 12 Port-12 0 | 24 Port-24 0 SUBMENU: (p)rvPg, Fr(Z), Unfr(z) Figure 4-44. CA Port Selection Screen 4-30 IB0054607-01 A 4–Real-Time Fabric Monitor Infrastructure View Sub-Screens CA Port Information Selection Screen Figure 4-45 is an example of the screen for selecting the information to be displayed for a port within a CA within the fabric MENU: (H)ome, (I)nfrastructureView, (F)abricView, (P)erformanceView, (T)opContext, (A)dmin, (Q)uit VIEW: [I]:H:I:Ca1:Ca1Info:P1 CONTEXT: Name: FABRIC: Ports Info, Total CAs: 3 Top: [Tue Feb 2 07:31:25 2010, Hist], Now: Tue Feb 2 07:51:50 2010 SWs: 11, HCAs: 3, TCAs: 0, Nodes: 14, SMs: 1 Links: 48, SWsPorts: 103, HCAsPorts: 4, TCAsPorts: 0 HlthErrs: Not Avail, CommErrs: 297, Alrms: Not Avail CA: Montrd: TRUE, CommErrs: 87, Oprtnl: TRUE, HlthErrs: Not Avail, Alrms: Not Avail, Type: n/a, Ports: 2, NodeGUID: 0x00066a0098007b70, NodeDesc: stewie HCA-1 PORT: CID PortNo: 1, PortErrs: 0 PORT INFORMATION 1 General Port Info 2 Port Statistics Info 3 Port Attributes Info 4 Port SL2VL Mapping Info SUBMENU: (p)rvPg, Fr(Z), Unfr(z) Figure 4-45. CA Port Information Selection Screen NOTE: In the present release only the General Port Info and Port Statistics Info are implemented. Port Element The following are shown for a port, within a node: PortNo — port number of the port. PortErrs — number of errors observed on the port. IB0054607-01 A 4-31 4–Real-Time Fabric Monitor Infrastructure View Sub-Screens CA Port General Information Screen Figure 4-46 is an example of the screen for viewing general port information for a specific port within a CA within the fabric. MENU: (H)ome, (I)nfrastructureView, (F)abricView, (P)erformanceView, (T)opContext, (A)dmin, (Q)uit VIEW: [I]:H:I:Ca1:Ca1Info:P1:P1Info CONTEXT: Name: General Port Info, Total CAs: 3 FABRIC: Top: [Tue Feb 2 07:31:25 2010, Hist], Now: Tue Feb 2 07:51:50 2010 SWs: 11, HCAs: 3, TCAs: 0, Nodes: 14, SMs: 1 Links: 48, SWsPorts: 103, HCAsPorts: 4, TCAsPorts: 0 HlthErrs: Not Avail, CommErrs: 297, Alrms: Not Avail CA: NodeGUID: 0x00066a0098007b70, NodeDesc: stewie HCA-1 PortNum: 1 LID: 0x0028 GUID: 0x0002c9020025a679 PortState: Active PhysState: LinkUp DownDefault: Polling LID: 0x0028 LMC: 1 Subnet: 0xfe80000000000000 SMLID: 0x000e M_KEY: 0x0000000000000000 Lease: MTU: SMSL: 0 RespTimeout: 268 ms SubnetTimeout: 0 s Protect: Readonly Active: 2048 Supported: 2048 VL Stall: 0 LinkWidth: Active: 4x Supported: 1-4x Enabled: LinkSpeed: Active: VLs: Active: 5.0Gb Supported: 2.5-5Gb 8+1 Supported: 536 ms 8+1 1-4x Enabled: 2.5-5Gb HOQLife: 4096 ns Capability 0x02510868: CR CN VDR CM SIG SL APM Trap Violations: M_Key: 0 P_Key: 0 Q_Key: ErrorLimits: Overrun: 15 LocalPhys: 15 P_Key Enforcement: In: Off Out: Off Neighbor: 0x0002c9020025a678 0 DiagCode: 0x0000 FilterRaw: In: Off Out: Off 1 CA mindy2 HCA-1 SUBMENU: (p)rvPg, Fr(Z), Unfr(z) Figure 4-46. CA Port General Information Screen 4-32 IB0054607-01 A 4–Real-Time Fabric Monitor Infrastructure View Sub-Screens CA Port Statistics Selection Screen Figure 4-47 is an example of the screen for viewing port statistic information for a specific port within a CA within the fabric MENU: (H)ome, (I)nfrastructureView, (F)abricView, (P)erformanceView, (T)opContext, (A)dmin, (Q)uit VIEW: [I]:H:I:Ca1:Ca1Info:P1:P1Info CONTEXT: Name: Port Statistics Info, Total CAs: 3 FABRIC: Top: [Tue Feb 2 07:31:25 2010, Hist], Now: Tue Feb 2 07:51:50 2010 SWs: 11, HCAs: 3, TCAs: 0, Nodes: 14, SMs: 1 Links: 48, SWsPorts: 103, HCAsPorts: 4, TCAsPorts: 0 HlthErrs: Not Avail, CommErrs: 297, Alrms: Not Avail CA: Montrd: TRUE, CommErrs: 87, Oprtnl: TRUE, HlthErrs: Not Avail, Alrms: Not Avail, Type: n/a, Ports: 2, NodeGUID: 0x00066a0098007b70, NodeDesc: stewie HCA-1 PORT: CID PortNo: 1, PortErrs: 0 PORT STATISTICS INFORMATION 1 Port Performance Info 2 Port Async Events/Traps Info SUBMENU: (p)rvPg, Fr(Z), Unfr(z) Figure 4-47. CA Port Statistics Selection Screen NOTE: In the present release only the Port Performance Info is implemented. IB0054607-01 A 4-33 4–Real-Time Fabric Monitor Infrastructure View Sub-Screens CA Port Performance Screen Figure 4-48 is an example of the screen for viewing performance information for a specific port within a CA within the fabric. MENU: (H)ome, (I)nfrastructureView, (F)abricView, (P)erformanceView, (T)opContext, (A)dmin, (Q)uit VIEW: [I]:H:I:Ca1:Ca1Info:P1:P1Info:P1StatInfo CONTEXT: Name: Port Performance Info, Total CAs: 8 FABRIC: Top: [Sat Apr 3 14:44:50 2010, Hist], Now: Sat Apr 3 14:52:50 2010 CA: Montrd: TRUE, Oprtnl: TRUE, CommErrs: 0, HlthErrs: Not Avail, Alrms: Not Avail, Type: n/a, Ports: 2, NodeGUID: 0x00066a0098007b5e, NodeDesc: compute0004 HCA-1 PMA PORT PERFORMANCE TRANSMIT [PA] Xmit Data: 86 MB (22798588 Quads) Xmit Pkts: 69962 PMA PORT PERFORMANCE RECEIVE [PA] Rcv Data: 167 MB (44018464 Quads) Rcv Pkts: 110902 PMA PORT ERRORS [PA] Symbol Errors: 0 Link Error Recovery: 0 Link Downed: 0 Port Rcv Errors: 0 Port Rcv Rmt Phys Err: 0 Port Rcv Sw Relay Err: 0 Port Xmit Discards: 2 Port Xmit Constraint: 0 Port Rcv Constraint: 0 Local Link Integrity: 0 Exc. Buffer Overrun: 0 VL15 Dropped: 2 SUBMENU: (p)rvPg, Fr(Z), Unfr(z) Figure 4-48. CA Port Performance Screen 4-34 IB0054607-01 A 4–Real-Time Fabric Monitor Fabric View Sub-Screens Fabric View Sub-Screens Link Screens When a user selects the Links category from the Fabric View main screen (“Submenu Segment” on page 4-6), the user is able to drill-down to a specific communication link of interest. The order in which these screens are displayed will depend upon the number of links found within the fabric. Link Category Selection Screen Figure 4-49 is an example of the screen for selecting the category of links to view. MENU: (H)ome, (I)nfrastructureView, (F)abricView, (P)erformanceView, (T)opContext, (A)dmin, (Q)uit VIEW: [F]:H:F CONTEXT: Name: Links FABRIC: Top: [Wed Sep 21 14:11:42 2011, Hist], Now: Wed Sep 21 14:13:02 2011 SWs: 4, Links: 21, HCAs: 8, SWsPorts: HlthErrs: Not Avail, TCAs: 38, 0, Nodes: HCAsPorts: CommErrs: 65631, 8, 12, SMs: 2 TCAsPorts: 0 Alrms: Not Avail FABRIC LINK INFORMATION CID CATEGORY TOTAL MONTRD OPRTNL HLTH-ERRS COMM-ERRS ALRMS 21 21 21 0 65631 Not Avail 1 All Links 2 External Links 9 9 9 0 65595 Not Avail 3 Internal Links 12 12 12 0 36 Not Avail 4 Error Links 0 0 0 0 0 Not Avail 5 Slow Links 0 0 0 0 0 Not Avail 6 TopTalker Links 9 9 9 0 65595 Not Avail SUBMENU: (p)rvPg, Fr(Z), Unfr(z) Figure 4-49. Link Category Selection Screen IB0054607-01 A 4-35 4–Real-Time Fabric Monitor Fabric View Sub-Screens Link Selection Screen (24000+ Links) If there are 24000 or more links found within the fabric, Figure 4-50 is an example of the screen that will be displayed first. MENU: (H)ome, (I)nfrastructureView, (F)abricView, (P)erformanceView, (T)opContext, (A)dmin, (Q)uit VIEW: [F]:H:F:All CONTEXT: Name: All Links, Total links: 25007, Alrms: Not Avail FABRIC: Top: [Tue Feb 2 07:31:25 2010, Hist], Now: Tue Feb 2 07:51:50 2010 SWs: 11, HCAs: 3, TCAs: 0, Nodes: 14, SMs: 1 Links: 48, SWsPorts: 103, HCAsPorts: 4, TCAsPorts: 0 HlthErrs: Not Avail, CommErrs: 0, Alrms: Not Avail CID LINKS ERRORS | CID LINKS ERRORS 1 1 - 23999 0 | 11 240000 - 263999 0 2 24000 - 47999 0 | 12 264000 - 287999 0 3 48000 - 71999 0 | 13 288000 - 311999 0 4 72000 - 95999 0 | 14 312000 - 335999 0 5 96000 - 119999 0 | 15 336000 - 359999 0 6 120000 - 143999 0 | 16 360000 - 383999 0 7 144000 - 167999 0 | 17 384000 - 407999 0 8 168000 - 191999 0 | 18 408000 - 431999 0 9 192000 - 215999 0 | 19 432000 - 455999 0 10 216000 - 239999 0 | 20 456000 - 480000 0 SUBMENU: (p)rvPg, Fr(Z), Unfr(z) Figure 4-50. Link Selection Screen (24000+ Links) 4-36 IB0054607-01 A 4–Real-Time Fabric Monitor Fabric View Sub-Screens Link Selection Screen (1200-24000 Links) After selecting a block of 24000 Links or if there are between 1200 to 24000 Links found within the fabric, Figure 4-51 is an example of the screen that will be displayed. MENU: (H)ome, (I)nfrastructureView, (F)abricView, (P)erformanceView, (T)opContext, (A)dmin, (Q)uit VIEW: [F]:H:F:All:Link1-23999 CONTEXT: Name: Links 1 - 23999, Total links: 25007, Alrms: Not Avail FABRIC: Top: [Tue Feb 2 07:31:25 2010, Hist], Now: Tue Feb 2 07:51:50 2010 SWs: 11, HCAs: 3, TCAs: 0, Nodes: 14, SMs: 1 Links: 48, SWsPorts: 103, HCAsPorts: 4, TCAsPorts: 0 HlthErrs: Not Avail, CommErrs: 0, Alrms: Not Avail CID LINKS ERRORS | CID LINKS ERRORS 1 1 - 1200 0 | 11 12001 - 13200 0 2 1201 - 2400 0 | 12 13201 - 14400 0 3 2401 - 3600 0 | 13 14401 - 15600 0 4 3601 - 4800 0 | 14 15601 - 16800 0 5 4801 - 6000 0 | 15 16801 - 18000 0 6 6001 - 7200 0 | 16 18001 - 19200 0 7 7201 - 8400 0 | 17 19201 - 20400 0 8 8401 - 9600 0 | 18 20401 - 21600 0 9 9601 - 10800 0 | 19 21601 - 22800 0 10 10801 - 12000 0 | 20 22801 - 24000 0 SUBMENU: (p)rvPg, Fr(Z), Unfr(z) Figure 4-51. Link Selection Screen (1200-24000 Links) IB0054607-01 A 4-37 4–Real-Time Fabric Monitor Fabric View Sub-Screens Link Selection Screen (60-1200 Links) After selecting a block of 1200 Links or if there are between 60 to 1200 Links found within the fabric, Figure 4-52 is an example of the screen that will be displayed. MENU: (H)ome, (I)nfrastructureView, (F)abricView, (P)erformanceView, (T)opContext, (A)dmin, (Q)uit VIEW: [F]:H:F:All:Link1-23999:Link1-1200 CONTEXT: Name: Links 1 - 1200, Total links: 25007, Alrms: Not Avail FABRIC: Top: [Tue Feb 2 07:31:25 2010, Hist], Now: Tue Feb 2 07:51:50 2010 SWs: 11, HCAs: 3, TCAs: 0, Nodes: 14, SMs: 1 Links: 48, SWsPorts: 103, HCAsPorts: 4, TCAsPorts: 0 HlthErrs: Not Avail, CommErrs: 0, Alrms: Not Avail CID LINKS ERRORS | CID LINKS ERRORS 1 1 - 60 0 | 11 601 - 660 0 2 61 - 120 0 | 12 661 - 720 0 3 121 - 180 0 | 13 721 - 780 0 4 181 - 240 0 | 14 781 - 840 0 5 241 - 300 0 | 15 841 - 900 0 6 301 - 360 0 | 16 901 - 960 0 7 361 - 420 0 | 17 961 - 1020 0 8 421 - 480 0 | 18 1021 - 1080 0 9 481 - 540 0 | 19 1081 - 1140 0 10 541 - 600 0 | 20 1141 - 1200 0 SUBMENU: (p)rvPg, Fr(Z), Unfr(z) Figure 4-52. Link Selection Screen (60-1200 Links) 4-38 IB0054607-01 A 4–Real-Time Fabric Monitor Fabric View Sub-Screens Link Selection Screen (1-60 Links) After selecting a block of 60 Links or if there are between 1 to 60 Links found within the fabric, Figure 4-53 is an example of the screen that will be displayed. MENU: (H)ome, (I)nfrastructureView, (F)abricView, (P)erformanceView, (T)opContext, (A)dmin, (Q)uit VIEW: [F]:H:F:All:Link1-23999:Link1-1200:Link1-60 CONTEXT: Name: Links 1 - 60, Total links: 25007, Alrms: Not Avail FABRIC: Top: [Tue Feb 2 07:31:25 2010, Hist], Now: Tue Feb 2 07:51:50 2010 SWs: 11, HCAs: 3, TCAs: 0, Nodes: 14, SMs: 1 Links: 48, SWsPorts: 103, HCAsPorts: 4, TCAsPorts: 0 HlthErrs: Not Avail, CommErrs: 0, Alrms: Not Avail CID 1 2 3 4 5 6 RATE 20g 20g 20g 20g 20g 20g LINK NODE TYPE PORT ERRORS NODE DESC 0x0002c9020025a678 CA 1 0 mindy2 HCA-1 0x00066a0007000e6d SW 4 0 SilverStorm 9080 GUID= 0x00066a000600025a SW 1 0 SilverStorm 9080 GUID= 0x00066a0007000e6d SW 19 0 SilverStorm 9080 GUID= 0x00066a000600025a SW 2 0 SilverStorm 9080 GUID= 0x00066a0007000e6d SW 20 0 SilverStorm 9080 GUID= 0x00066a000600025a SW 3 0 SilverStorm 9080 GUID= 0x00066a0007000e6d SW 21 0 SilverStorm 9080 GUID= 0x00066a000600025a SW 4 0 SilverStorm 9080 GUID= 0x00066a00de00004d SW 22 0 SilverStorm 9080 GUID= 0x00066a000600025a SW 5 0 SilverStorm 9080 GUID= 0x00066a00de00004d SW 23 0 SilverStorm 9080 GUID= SUBMENU: (p)rvPg, Scrl(d)wn, Fr(Z), Unfr(z) Figure 4-53. Link Selection Screen (1-60 Links) IB0054607-01 A 4-39 4–Real-Time Fabric Monitor Fabric View Sub-Screens Link Information Selection Screen Figure 4-54 is an example of the screen for selecting the information to display or a link within the fabric. MENU: (H)ome, (I)nfrastructureView, (F)abricView, (P)erformanceView, (T)opContext, (A)dmin, (Q)uit VIEW: [F]:H:F:All:Link1-23999:Link1-1200:Link1-60:Link1 CONTEXT: Name: Link1, Total links: FABRIC: 25007 Top: [Tue Feb 2 07:31:25 2010, Hist], Now: Tue Feb 2 07:51:50 2010 SWs: 11, HCAs: 3, TCAs: 0, Nodes: 14, SMs: 1 Links: 48, SWsPorts: 103, HCAsPorts: 4, TCAsPorts: 0 HlthErrs: Not Avail, CommErrs: 0, Alrms: Not Avail LINK: LnkNo: 1, LnkTyp: External, EndNode1: 0x00066a0098007b70, PortNo: 1, NodeDesc: stewie HCA-1 EndNode2: 0x00066a00d9000479, PortNo: 18, NodeDesc: i9k479 LinkWidth: Active: LnkSpd: Active: CID LINK INFORMATION 4x, Supported: 1-4x, Enabled: 1-4x, 5.0Gb, Supported: 2.5-5Gb, Enabled: 2.5-5Gb ERRORS 1 End-Node 1 Info 0 2 End-Node 2 Info 0 3 End-Port 1 Info 0 4 End-Port 2 Info 0 SUBMENU: (p)rvPg, Fr(Z), Unfr(z) Figure 4-54. Link Information Selection Screen (60-1200 Links) NOTE: A link consists of two connected ports between two end nodes (Switch, CA, or router). In this screen the user may select to drill down into either port or either end node. 4-40 IB0054607-01 A 4–Real-Time Fabric Monitor Fabric View Sub-Screens Link End-Node Information Selection Screen Figure 4-55 is an example of the screen for selecting the information to display for an end-node of a specific link within the fabric MENU: (H)ome, (I)nfrastructureView, (F)abricView, (P)erformanceView, (T)opContext, (A)dmin, (Q)uit VIEW: [F]:H:F:All:Link1:Node1Info CONTEXT: Name: End-Node 1 Info, Total links: FABRIC: 111 Top: [Tue Feb 2 07:31:25 2010, Hist], Now: Tue Feb 2 07:51:50 2010 SWs: 11, HCAs: 3, TCAs: 0, Nodes: 14, SMs: 1 Links: 48, SWsPorts: 103, HCAsPorts: 4, TCAsPorts: 0 HlthErrs: Not Avail, CommErrs: 0, Alrms: Not Avail LINK: LnkNo: 1, LnkTyp: External, EndNode1: 0x00066a0098007b70, PortNo: 1, NodeDesc: stewie HCA-1 EndNode2: 0x00066a00d9000479, PortNo: 18, NodeDesc: i9k479 LinkWidth: Active: LnkSpd: Active: CID 4x, Supported: 1-4x, Enabled: 1-4x, 5.0Gb, Supported: 2.5-5Gb, Enabled: 2.5-5Gb NODE INFORMATION 1 Device Info 2 Ports Info 3 Chassis Info 4 Module Info 5 Partition Info 6 Health Info SUBMENU: (p)rvPg, Fr(Z), Unfr(z) Figure 4-55. Link End-Node Information Selection Screen NOTE: In the present release only the Device Info and Ports Info Categories are implemented. Selections on this screen will display Device Information screen described in “CA Device Information Screen” on page 4-29 or Port Information Selection screen described in “CA Port Information Selection Screen” on page 4-31. IB0054607-01 A 4-41 4–Real-Time Fabric Monitor Fabric View Sub-Screens Link Element A link is an established connection between two ports (cable or backplane/internal). The following are shown in Figure 4-55: 4-42 LnkNo — numeric identifier associated with the link. LnkTyp — type of link: Internal or External. EndNode1/2 — These two fields lists the Node GUIDs of the two nodes connected through the link. NodeDesc — lists the Node Description of the node. PortNo — lists the port number on the node which is used by the link. LinkWidth — lists the Active, Supported, and Enabled widths of the link. LnkSpd — lists the Active, Supported, and Enabled speeds of the link. IB0054607-01 A 4–Real-Time Fabric Monitor Fabric View Sub-Screens Link End-Port Information Selection Screen Figure 4-56 is an example of the screen for selecting the information to display for an end-port of a specific link within the fabric MENU: (H)ome, (I)nfrastructureView, (F)abricView, (P)erformanceView, (T)opContext, (A)dmin, (Q)uit VIEW: [F]:H:F:All:Link1:Node1Info:Ca1Info:P1 CONTEXT: Name: End-Port 1 Info, Total links: FABRIC: 111 Top: [Tue Feb 2 07:31:25 2010, Hist], Now: Tue Feb 2 07:51:50 2010 SWs: 11, HCAs: 3, TCAs: 0, Nodes: 14, SMs: 1 Links: 48, SWsPorts: 103, HCAsPorts: 4, TCAsPorts: 0 HlthErrs: Not Avail, CommErrs: 0, Alrms: Not Avail CA: Montrd: TRUE, CommErrs: 8, Oprtnl: TRUE, HlthErrs: Not Avail, Alrms: Not Avail, Type: n/a, Ports: 2, NodeGUID: 0x00066a0098007b70, NodeDesc: stewie HCA-1 LINK: LnkNo: 1, LnkTyp: External, EndNode1: 0x00066a0098007b70, PortNo: 1, NodeDesc: stewie HCA-1 EndNode2: 0x00066a00d9000479, PortNo: 18, NodeDesc: i9k479 LinkWidth: Active: LnkSpd: Active: PORT: CID PortNo: 1, 4x, Supported: 1-4x, Enabled: 1-4x, 5.0Gb, Supported: 2.5-5Gb, Enabled: 2.5-5Gb PortErrs: 0 PORT INFORMATION 1 General Port Info 2 Port Statistics Info 3 Port Attributes Info 4 Port SL2VL Mapping Info SUBMENU: (p)rvPg, Fr(Z), Unfr(z) Figure 4-56. Link End-Port Information Selection Screen NOTE: In the present release only the General Port Info and Port Statistics Info are implemented. Selections on this screen will display General Port Information described in “CA Port General Information Screen” on page 4-32 or Port Statistics Selection screen described in “CA Port Statistics Selection Screen” on page 4-33 IB0054607-01 A 4-43 4–Real-Time Fabric Monitor Fabric View Sub-Screens Slow Link Selection Screen Figure 4-57 is an example of the screen for selecting which types of slow link performance to analyze. MENU: (H)ome, (I)nfrastructureView, (F)abricView, (P)erformanceView, (T)opContext, (A)dmin, (Q)uit VIEW: [F]:H:F:Slow CONTEXT: Name: Slow Links, Total links: FABRIC: 25007 Top: [Tue Feb 2 07:31:25 2010, Hist], Now: Tue Feb 2 07:51:50 2010 SWs: 11, HCAs: 3, TCAs: 0, Nodes: 14, SMs: 1 Links: 48, SWsPorts: 103, HCAsPorts: 4, TCAsPorts: 0 HlthErrs: Not Avail, CommErrs: 0, Alrms: Not Avail SLOW LINK INFORMATION CID TOTAL ERRS 1 Links running slower than expected speed CATEGORY 0 0 2 Links running slower than supported speed 0 0 3 Links running slower than faster port 5 0 4 Links configured slower than supported speed 0 0 5 Links connected with mismatched supported speeds 5 0 SUBMENU: (p)rvPg, Fr(Z), Unfr(z) Figure 4-57. Slow Link Selection Screen Selections on this screen will display Link screens as shown in “Link Selection Screen (24000+ Links)” on page 4-36, “Link Selection Screen (1200-24000 Links)” on page 4-37, “Link Selection Screen (60-1200 Links)” on page 4-38, or “Link Selection Screen (1-60 Links)” on page 4-39 4-44 IB0054607-01 A 4–Real-Time Fabric Monitor Fabric View Sub-Screens SM Screens SM Selection Screen Figure 4-58 is an example of the initial screen for selecting a SM within the fabric. MENU: (H)ome, (I)nfrastructureView, (F)abricView, (P)erformanceView, (T)opContext, (A)dmin, (Q)uit VIEW: [F]:H:F CONTEXT: Name: SMs FABRIC: Top: [Tue Feb 2 07:31:25 2010, Hist], Now: Tue Feb 2 07:51:50 2010 SWs: 11, HCAs: 3, TCAs: 0, Nodes: 14, SMs: 1 Links: 48, SWsPorts: 103, HCAsPorts: 4, TCAsPorts: 0 HlthErrs: Not Avail, CommErrs: 0, Alrms: Not Avail CID TYPE NODE GUID NAME 1 Master 0x00066a000600025a SilverStorm 9080 GUID= 2 Standby 0x00066a00060002f7 SilverStorm 9080 GUID= 3 Standby 0x0011750000ffd66c strawberry HCA-1 SUBMENU: (p)rvPg, Fr(Z), Unfr(z) Figure 4-58. SM Selection Screen IB0054607-01 A 4-45 4–Real-Time Fabric Monitor Fabric View Sub-Screens SM Detailed Information Screen Figure 4-59 is an example of the screen showing detailed information about an SM within the fabric. MENU: (H)ome, (I)nfrastructureView, (F)abricView, (P)erformanceView, (T)opContext, (A)dmin, (Q)uit VIEW: [F]:H:F:Sm1 CONTEXT: Name: Sm1 FABRIC: Top: [Tue Feb 2 07:31:25 2010, Hist], Now: Tue Feb 2 07:51:50 2010 SWs: 11, HCAs: 3, TCAs: 0, Nodes: 14, SMs: 1 Links: 48, SWsPorts: 103, HCAsPorts: 4, TCAsPorts: 0 HlthErrs: Not Avail, CommErrs: 0, Alrms: Not Avail State: Master Name: SilverStorm 9080 GUID=0x00066a NodeGUID: 0x00066a000600025a Type: SW PortNum: 0 LID: 0x000e PortGUID: 0x00066a000600025a SM_Key: 0x0000000000000000 Priority: 0 ActCount: 0x0025e41d SUBMENU: (p)rvPg, Fr(Z), Unfr(z) Figure 4-59. SM Detailed Information Screen 4-46 IB0054607-01 A 4–Real-Time Fabric Monitor Performance View Sub-Screens Performance View Sub-Screens Bandwidth Utilization Screens When a user selects the (G)rp<1-4><u> sub-menu selection from the Main screen (“Submenu Segment” on page 4-6), the user is able to drill-down to the utilization statistics for a specific group of ports of interest. Switch Group Bandwidth Utilization Selection Screen Figure 4-60 is an example of the screen for selecting the utilization category of the Switch group to view. MENU: (H)ome, (I)nfrastructureView, (F)abricView, (A)dmin, (Q)uit VIEW: [P]:H CONTEXT: Name: Low BW Stats FABRIC: PERF: Top: [Tue Feb 2 07:31:25 2010, Hist], Now: Tue Feb 2 07:51:50 2010 GrpName: SWs, GrpNumPrts: 94, LstNumPrts: 10, LstMaxNumPrts: 10, NodesFailed: 0, NodesSkipped: 0, PortsFailed: 0, PortsSkipped: 9 LOW BW STATS PORTS LISTING CID 1 2 3 4 5 PORT NO LID VAL Node GUID NODE 13 0x0003 0.0 0x00066a00d9000479 i9k479 9 0x0400 0.0 0x00066a0007000e6d SilverStorm 9080 GUID= 18 0x0003 0.0 0x00066a00d9000479 i9k479 1 0x0100 0.0 0x00066a0098007b70 stewie HCA-1 20 0x0003 0.0 0x00066a00d9000479 i9k479 1 0x0f00 0.0 0x0002c9020025a678 mindy2 HCA-1 7 0x0004 0.0 0x00066a0007000e6d SilverStorm 9080 GUID= 2 0x0200 0.0 0x00066a0098007b70 stewie HCA-1 13 0x0004 0.0 0x00066a0007000e6d SilverStorm 9080 GUID= 10 0x0500 0.0 0x00066a100600025a SilverStorm 9080 GUID= SUBMENU: (+), (p)rvPg, (u)til<h|l>, Ls(t)<n>, Im(g)Cfg Figure 4-60. Switch Group Bandwidth Utilization Selection Screen IB0054607-01 A 4-47 4–Real-Time Fabric Monitor Performance View Sub-Screens Low Bandwidth Utilization Selection Screen After selecting the (u)til<l> sub-menu selection, for ports associated with links with a low bandwidth utilization, a list of links is displayed to the user. Figure 4-61 is an example of the screen that will be displayed. MENU: (H)ome, (I)nfrastructureView, (F)abricView, (P)erformanceView, (T)opContext, (A)dmin, (Q)uit VIEW: [P]:H:LowStats CONTEXT: Name: Performance Group BW View FABRIC: Top: [Tue Feb 2 07:31:25 2010, Hist], Now: Tue Feb 2 07:51:50 2010 PERF: GrpName: SWs, GrpNumPrts: 94, LstNumPrts: 10, LstMaxNumPrts: 10 SWs GROUP BW STATS INFORMATION Int TotMBps AvgMBps MinMBps MaxMBps TotKPps AvgKPps MinKPps MaxKPps 0 Buckt 0 0+% 10+% 90 0 0 20+% 0 0 30+% 0 40+% 0 0 50+% 0 0 60+% 0 0 0 70+% 80+% 90+% 0 0 0 Snd TotMBps AvgMBps MinMBps MaxMBps TotKPps AvgKPps MinKPps MaxKPps 0 Buckt 0 0+% 10+% 4 0 0 20+% 0 0 30+% 0 40+% 0 0 50+% 0 0 60+% 0 0 70+% 0 80+% 0 0 90+% 0 Rcv TotMBps AvgMBps MinMBps MaxMBps TotKPps AvgKPps MinKPps MaxKPps 0 Buckt 0 0+% 10+% 4 0 0 20+% 0 0 30+% 0 0 40+% 0 50+% 0 0 60+% 0 0 70+% 0 80+% 0 0 90+% 0 SUBMENU: (+), (p)rvPg, (u)til<h|l>, Ls(t)<n>, Im(g)Cfg Figure 4-61. Low Bandwidth Utilization Selection Screen 4-48 IB0054607-01 A 4–Real-Time Fabric Monitor Performance View Sub-Screens Error Condition Screens When a user selects the (G)rp<1-4><e> sub-menu selection from the Main screen (“Submenu Segment” on page 4-6), the user is able to drill-down to the error condition statistics for a specific group of ports of interest. Switch Group Error Condition Selection Screen Figure 4-62 is an example of the screen for selecting the error category of the Switch group to view. MENU: (H)ome, (I)nfrastructureView, (F)abricView, (A)dmin, (Q)uit VIEW: [P]:H CONTEXT: Name: Performance Group Errors View FABRIC: Img: [Sat Apr 3 14:29:23 2010, Hist], Now: Sat Apr 3 15:00:25 2010 PERF: GrpName: SWs, GrpNumPrts: LstMaxNumPrts: 35, LstNumPrts: 10, 10 SWs GROUP ERROR STATS INFORMATION Int Max 0+% 25+% 50+% 75+% 100+% Integrity 0 27 0 0 0 0 Congestion 0 27 0 0 0 0 SmaCongest 0 27 0 0 0 0 Security 0 27 0 0 0 0 Routing 0 27 0 0 0 0 Congest %: 0.0 Ext Discard: 0 Ineffic %: 0.0 Adapt Rt:0 Max 0+% 25+% 50+% 75+% 100+% Integrity 0 8 0 0 0 0 Congestion 0 8 0 0 0 0 SmaCongest 0 8 0 0 0 0 Security 0 8 0 0 0 0 Routing 0 8 0 0 0 0 Congest %: 0.0 Discard: 0 Ineffic %: 0.0 Adapt Rt:0 SUBMENU: (+), (p)rvPg, (e)rr<1-6>, Ls(t)<n>, Im(g)Info Figure 4-62. Switch Group Error Condition Selection Screen IB0054607-01 A 4-49 4–Real-Time Fabric Monitor Performance View Sub-Screens Integrity Error Selection Screen After selecting the (e)rr<1> sub-menu selection, for ports associated with links that have integrity related errors, a list of links is displayed to the user. Figure 4-63 is an example of the screen that will be displayed. MENU: (H)ome, (I)nfrastructureView, (F)abricView, (A)dmin, (Q)uit VIEW: [P]:H:IntegErr CONTEXT: Name: Integrity Error FABRIC: Top: [Tue Feb 2 07:31:25 2010, Hist], Now: Tue Feb 2 07:51:50 2010 PERF: GrpName: SWs, GrpNumPrts: 94, LstNumPrts: 10, LstMaxNumPrts: 10, NodesFailed: 0, NodesSkipped: 0, PortsFailed: 0, PortsSkipped: 9 INTEGRITY ERROR PORTS LISTING CID 1 2 3 4 5 PORT NO LID VAL Node GUID NODE DECS 13 0x0003 0.0 0x00066a00d9000479 i9k479 9 0x0400 0.0 0x00066a0007000e6d SilverStorm 9080 GUID= 18 0x0003 0.0 0x00066a00d9000479 i9k479 1 0x0100 0.0 0x00066a0098007b70 stewie HCA-1 20 0x0003 0.0 0x00066a00d9000479 i9k479 1 0x0f00 0.0 0x0002c9020025a678 mindy2 HCA-1 7 0x0004 0.0 0x00066a0007000e6d SilverStorm 9080 GUID= 2 0x0200 0.0 0x00066a0098007b70 stewie HCA-1 13 0x0004 0.0 0x00066a0007000e6d SilverStorm 9080 GUID= 10 0x0500 0.0 0x00066a100600025a SilverStorm 9080 GUID= SUBMENU: (+), (p)rvPg, (u)til<h|l>, Ls(t)<n>, Im(g)Cfg Figure 4-63. Integrity Error Selection Screen 4-50 IB0054607-01 A 4–Real-Time Fabric Monitor Performance View Sub-Screens Link Selection Screen Figure 4-64 is an example of the screen for selecting the information to display for a specific link within the fabric. MENU: (H)ome, (I)nfrastructureView, (F)abricView, (P)erformanceView, (T)opContext, (A)dmin, (Q)uit VIEW: [P]:H:IntegErr CONTEXT: Name: Integrity Error FABRIC: Img: [Sat Apr 3 14:29:23 2010, Hist], Now: Sat Apr 3 15:06:05 2010 PERF: GrpName: SWs, GrpNumPrts: LstMaxNumPrts: PortsFailed: 35, LstNumPrts: 10, NodesFailed: 0, PortsSkipped: 10, 0, NodesSkipped: 0, 3 INTEGRITY ERROR PORTS LISTING CID PORT NO LID VAL 1 0x0002 0 0x00066a00070014dc SilverStorm 9040 GUID= 1 0x0001 0 0x00066a009800ec5b admin1 HCA-1 2 2 0x0002 0 0x00066a00070014dc SilverStorm 9040 GUID= 1 0x0003 0 0x00066a009800ec51 compute0001 HCA-1 3 7 0x0002 0 0x00066a00070014dc SilverStorm 9040 GUID= 1 0x0004 0 0x00066a009800ec5a compute0006 HCA-1 4 8 0x0002 0 0x00066a00070014dc SilverStorm 9040 GUID= 1 0x0006 0 0x00066a009800ec47 compute0007 HCA-1 5 9 0x0002 0 0x00066a00070014dc SilverStorm 9040 GUID= 1 0x0008 0 0x00066a009800ec73 compute0002 HCA-1 1 Node GUID NODE SUBMENU: (+), (p)rvPg, Scrl(d)wn, (cC)rit, Im(g)Info Figure 4-64. Link Selection Screen IB0054607-01 A 4-51 4–Real-Time Fabric Monitor Admin Menu Screens Admin Menu Screens Main Screen Figure 4-65 is the main screen of the Admin menu selection, which enables a user to perform administration related operations with RFM MENU: (H)ome, (Q)uit VIEW: [A]:H CONTEXT: Name: Admin CID ADMIN OPERATIONS 1 Performance View Configuration 2 Infrastructure View Configuration 3 Fabric View Configuration 4 General Configuration SUBMENU: (p)rvPg Figure 4-65. Admin Menu Main Screen NOTE: In the present release only the Performance View Configuration category is implemented. 4-52 IB0054607-01 A 4–Real-Time Fabric Monitor Admin Menu Screens Fabric Discovery Screen Figure 4-66 is the screen for viewing results from the execution of a fabric discovery operation. # iba_rfm Please wait, while the fabric is being discovered... Beginning Fabric Discovery... Getting general information about all PM groups Getting All Node Records... Done Getting All Node Records Done Getting All Link Records Done Getting All SM Info Records Getting All PA Port Counters... Done Getting All PA Port Counters Completed Topology related discovery: OK Completed enhanced PM related discovery: OK FABRIC DISCOVERY SUMMARY Total Nodes: 48 Total Switch Nodes: 20 Total CA Nodes: 28 Total Router Nodes: 0 Total SMs: 1 Completed Topology related discovery: OK Completed enhanced PM related discovery: OK [Press the Enter key to continue] Figure 4-66. Fabric Discovery Screen IB0054607-01 A 4-53 4–Real-Time Fabric Monitor Admin Menu Screens 4-54 IB0054607-01 A 5 Configuration of IPoIB Name Mapping The FastFabric tools support the concept of a management network and an IPoIB network. For some clusters the management network will be a low speed network such as 10/100 Ethernet. For other clusters IPoIB may serve double duty as the host management network. NOTE: When using IPoIB as the management network, the initial installation of InfiniBand software cannot be done using FastFabric. The various FastFabric tools will translate from host names provided to and from IPoIB names as needed. This permits the host names given to be either management network or IPoIB network names. The default configuration file assumes that IPoIB host names are formed by adding a -ib suffix to the management network name. If a different suffix is desired, FF_IPOIB_SUFFIX can be changed. If IPoIB is also being used as the management network, FF_IPOIB_SUFFIX can be set to an empty string "". The translation is driven by the following functions within fastfabric.conf: ff_host_basename - given a management network or IPoIB hostname, translate to management network name, should match hostname -s ff_host_basename_to_ipoib - given a management network name, translate to IPoIB hostname More complex mappings can be specified by implementing alternate algorithms for these functions. NOTE: When managing a cluster where the IPoIB settings on the compute nodes are incompatible with the InfiniBand Management node (for example when a 4K MTU is used on the compute nodes and a 2K MTU is used on the InfiniBand Management Nodes), it is recommended not to run IPoIB on the InfiniBand management nodes. IB0054607-01 A 5-1 5–Configuration of IPoIB Name Mapping 5-2 IB0054607-01 A A FastFabric Configuration Files Table A-2 list the configuration files that are used by FastFabric. The description in the table also list the following sections that have detailed descriptions of each file. For a given release consult the files with -sample at the end of the file name for a sample file with the defaults of the given release. Table A-2. FastFabric Configuration Files Configuration File IB0054607-01 A Description /etc/sysconfig/fastfabric.conf Overall configuration file. Refer to FastFabric Configuration File. /etc/sysconfig/iba/iba_mon.conf Error thresholds. Refer to Port Statistics Thresholds Configuration File. /etc/sysconfig/iba/iba_mon.si.conf Error thresholds related to Signal Integrity. Refer to Signal Integrity Thresholds Configuration File. /etc/sysconfig/iba/allhosts List of all hosts managed by FastFabric including the localhost. Refer to Host List Files. /etc/sysconfig/iba/hosts List of all hosts managed by FastFabric except the localhost. Refer to Host List Files. /etc/sysconfig/iba/chassis List of all chassis managed by FastFabric. Refer to Chassis List Files. /etc/sysconfig/iba/esm_chassis List of all chassis running an embedded SM which are to be monitored using esm_analysis. Refer to Chassis List Files. /etc/sysconfig/iba/ibnodes List of all externally managed switches managed by FastFabric. Refer to Externally Managed Switch List File. /etc/sysconfig/iba/ports List of local HCA ports (for example subnets) to be used for fabric health analysis. Refer to Port List File. A-1 A–FastFabric Configuration Files FastFabric Configuration File Table A-2. FastFabric Configuration Files Configuration File /etc/sysconfig/iba/topology.0:0.xml Description Fabric topology input file used by iba_reports and fabric health tools. Refer to Fabric Topology Input File. FastFabric Configuration File The FastFabric tools support a configuration file /etc/sysconfig/fastfabric.conf. This file can be used to provide default settings for most of the FastFabric command line options. The configuration file is a bash shell script which will be included by each tool. As such the file should be implemented such that environment variables defined before the con fig file is executed will not be altered. The sample displayed below makes use of the bash syntax: var= "${var:-value}" such that only uninitialized variables are overwritten by the configuration file. An example of a sample file is provided, and matches the internal defaults of the FastFabric tools. For a given release consult /etc/sysconfig/fastfabric.conf-sample for a sample file with the defaults of the given release. If fastfabric.conf does not assign a value to a given configuration variable, the default value will be used. NOTE: Do not edit /etc/sysconfig/fastfabric.conf-sample. The use of various configuration variables are discussed in the Environment Variables section for each command. #!/bin/bash # [ICS VERSION STRING: @(#) ./fastfabric/ib_tools/defaults x_x_x_x_x [MM/DD/YY hh:mm] # This is a bash sourced config file which defines variables used in # fast fabric tools. Command line arguments will override these settings. # Assignments should be scripted such that this file does not override # exported environment settings, as shown in the defaults below if [ "$CONFIG_DIR" = "" ] then if [ -d /etc/sysconfig ] then CONFIG_DIR=/etc/sysconfig else CONFIG_DIR=/etc fi A-2 IB0054607-01 A A–FastFabric Configuration Files FastFabric Configuration File export CONFIG_DIR fi # Override default location for HOSTS_FILE export HOSTS_FILE=${HOSTS_FILE:-$CONFIG_DIR/iba/hosts} # Override default location for CHASSIS_FILE export CHASSIS_FILE=${CHASSIS_FILE:-$CONFIG_DIR/iba/chassis} # Override default location for ESM_CHASSIS_FILE export ESM_CHASSIS_FILE=${ESM_CHASSIS_FILE:-$CONFIG_DIR/iba/esm_chassis} # Override default location for IBNODES_FILE export IBNODES_FILE=${IBNODES_FILE:-$CONFIG_DIR/iba/ibnodes} # Override default location for PORTS_FILE export PORTS_FILE=${PORTS_FILE:-$CONFIG_DIR/iba/ports} # Default suffix for IPoIB host names # the special value "NONE" is used to indicate a value of "" # this value can be used in ff_host_basename_to_ipoib and ff_host_basename # below to convert between IPoIB and Ethernet hostnames export FF_IPOIB_SUFFIX=${FF_IPOIB_SUFFIX:--ib} # Alternatively a IPoIB prefix can be provided, commented out # examples in ff_host_basename and ff_host_basename can be enabled if desired export FF_IPOIB_PREFIX=${FF_IPOIB_PREFIX:-ic-} # Default management host export MGMT_HOST=${MGMT_HOST:-localhost} # The shell functions below are only defined if no existing function/command # with given name, hence allowing use of shell functions or creation of a # command for this operation # shell Function to convert a basic hostname into an IPoIB hostname # if FF_IPOIB_SUFFIX is "", this should return $1 unmodified # such that commands can be used with -i "" to skip IPoIB operations # (special value of NONE will be converted to "" before this is called) if ! type ff_host_basename_to_ipoib >/dev/null 2>/dev/null then function ff_host_basename_to_ipoib() { # $1 = hostname provided echo "$1$FF_IPOIB_SUFFIX" # comment out line above and uncomment line below if using prefixes #echo "$FF_IPOIB_PREFIX$1" } fi # shell Function to convert a hostname into a basic hostname # (eg. remove IPoIB suffix, etc) should match result of "hostname -s" on host # if FF_IPOIB_SUFFIX is "", this should return $1 unmodified # such that commands can be used with -i "" to skip IPoIB operations # (special value of NONE will be converted to "" before this is called) if ! type ff_host_basename >/dev/null 2>/dev/null then function ff_host_basename() { IB0054607-01 A A-3 A–FastFabric Configuration Files FastFabric Configuration File # $1 = hostname provided (could be ethernet or IPoIB name) echo "$1"|sed -e "s/$FF_IPOIB_SUFFIX\$//" # comment out line above and uncomment line below if using prefixes #echo "$1"|sed -e "s/^$FF_IPOIB_PREFIX//" } fi # IP netmask for IPoIB subnet [-m option] # if "" default will be determined based on class of IP address [A, B, C] export FF_IPOIB_NETMASK=${FF_IPOIB_NETMASK:-} # Maximum parallel processes for ibtest and -p option on other commands # set to 1 to avoid parallel execution export FF_MAX_PARALLEL=${FF_MAX_PARALLEL:-20} # If the systems are slow for some reason, this can be used to provide a # multiplier for all timeouts in ibtest, iba_host_admin, iba_chassis_admin, # iba_switch_admin export FF_TIMEOUT_MULT=${FF_TIMEOUT_MULT:-2} # where to put result files from FastFabric runs of # ibtest, iba_host_admin, iba_chassis_admin, iba_switch_admin #export FF_RESULT_DIR=${FF_RESULT_DIR:-.} export FF_RESULT_DIR=${FF_RESULT_DIR:-$HOME} # QLogic IB product to install during iba_host_admin load and upgrade export FF_PRODUCT=${FF_PRODUCT:-QLogicIB-Basic.`cat /etc/sysconfig/iba/osid_wrapper`} # QLogic IB product version to install during iba_host_admin load and upgrade export FF_PRODUCT_VERSION=${FF_PRODUCT_VERSION:-`cat /etc/sysconfig/iba/version_wrapper 2>/dev/null`} # QLogic IB packages to install during iba_host_admin load [-P option] #export FF_PACKAGES=${FF_PACKAGES:-iba ipoib verbs_mpi} #export FF_PACKAGES=${FF_PACKAGES:-iba ipoib psm_mpi} export FF_PACKAGES=${FF_PACKAGES:-iba ipoib mpi} # Additional INSTALL options during iba_host_admin load [-I option] #export FF_INSTALL_OPTIONS=${FF_INSTALL_OPTIONS:- -D iba_mon -D s20tune -E qlogic_sa} export FF_INSTALL_OPTIONS=${FF_INSTALL_OPTIONS:- -D iba_mon -D s20tune} # Additional INSTALL options during iba_host_admin upgrade [-U option] #export FF_UPGRADE_OPTIONS=${FF_UPGRADE_OPTIONS:- -D iba_mon -D s20tune -E qlogic_sa} export FF_UPGRADE_OPTIONS=${FF_UPGRADE_OPTIONS:- -D iba_mon -D s20tune} # where to upload server specific files to during uploadall, captureall # [-d option] export UPLOADS_DIR=${UPLOADS_DIR:-./uploads} # where to download server specific files from during downloadall # [-d option] export DOWNLOADS_DIR=${DOWNLOADS_DIR:-./downloads} # where to save history and baselines for cluster analysis and health checks # [-d option] export FF_ANALYSIS_DIR=${FF_ANALYSIS_DIR:-/var/opt/iba/analysis} # topology input file(s) to use for fabric_analysis, all_analysis and # iba_reports operations. The %P marker will be replaced with the A-4 IB0054607-01 A A–FastFabric Configuration Files FastFabric Configuration File # local HCA port/fabric selection string (for example 0:0 or 1:2) for # the fabric being selected (see PORTS_FILE for more information) # if this file is not found, or the value of this parameter is "NONE" # no topology input file will be used export FF_TOPOLOGY_FILE=${FF_TOPOLOGY_FILE:-$CONFIG_DIR/iba/topology.%P.xml} # How to login to host systems during iba_host_admin # can be ssh, rsh or telnet # Note: at present cmdall and scpall always assume password-less ssh/scp # Note: check_rsh always assumes password-less rsh/rcp # Note: arguments (-s) to setup_ssh select ssh setup via rsh/rcp or ssh/scp export FF_LOGIN_METHOD=${FF_LOGIN_METHOD:-ssh} # initial user name (cannot be root if CFG_LOGIN_METHOD=telnet) export FF_USERNAME=${FF_USERNAME:-root} # password for FF_USERNAME (not needed if password-less ssh/rsh configured) export FF_PASSWORD=${FF_PASSWORD:-} # if FF_USERNAME is not root, what is the root password needed when # suing to root export FF_ROOTPASS=${FF_ROOTPASS:=} # How to login to chassis # can be ssh or telnet export FF_CHASSIS_LOGIN_METHOD=${FF_CHASSIS_LOGIN_METHOD:-ssh} # password for admin (not needed if password-less ssh configured) export FF_CHASSIS_ADMIN_PASSWORD=${FF_CHASSIS_ADMIN_PASSWORD:-adminpass} #base device number for IPoIB devices - IPoIB devices in the systems will # be named "ib($FF_IPOIB_BASE_DEV_NUM) ib($FF_IPOIB_BASE_DEV_NUM+1) ..." # On Silvertstorm stack it will be "ib1 ib2 ...." # On OFED stack it will be "ib0 ib1 ..." export FF_IPOIB_BASE_DEV_NUM=${FF_IPOIB_BASE_DEV_NUM:-0} # shell Function to return the base IPoIB device number for this stack type. # For Silverstorm stack installations this function should return 1, for # OFED stack installations this should return 0. if ! type ff_ipoib_base_dev_num >/dev/null 2>/dev/null then function ff_ipoib_base_dev_num() { # No arguments to this function # $host is supplied as an arguemnt when this function is called # but it is ignored here. This is a hack to limit the number of # changes required. echo "$FF_IPOIB_BASE_DEV_NUM" } fi # options for iba_report during fabric_analysis health check # alternative would be to use "-i seconds" instead of -C # depending on fabric design, more strict link speed checks, such as # -o slowconfiglinks or -o slowconnlinks may be appropriate export FF_FABRIC_HEALTH=${FF_FABRIC_HEALTH:- -s -C -o errors -o slowlinks} # list of CLI commands to issue during chassis_analysis IB0054607-01 A A-5 A–FastFabric Configuration Files FastFabric Configuration File export FF_CHASSIS_CMDS=${FF_CHASSIS_CMDS:-showInventory fwVersion showIBNodeDesc ismShowPStatThresh ismChassisSet12x timeZoneConf timeDSTConf snmpCommunityConf snmpTargetAddr showChassisIpAddr showDefaultRoute} # other possible additions (if running newer chassis FW which supports these) # ismIslSet12x, ismIslSetSpeed # single CLI command to issue to check overall health during chassis_analysis # hwCheck is prefered, but is not supported on older chassis FW export FF_CHASSIS_HEALTH=${FF_CHASSIS_HEALTH:-hwCheck} #export FF_CHASSIS_HEALTH=${FF_CHASSIS_HEALTH:-fruInfo} # list of CLI commands to issue during esm_analysis export FF_ESM_CMDS=${FF_ESM_CMDS:-smShowSMParms smShowDefBcGroup} # list of analysis to perform during all_analysis # pick appropriate type of SM to analyze #export FF_ALL_ANALYSIS=${FF_ALL_ANALYSIS:-fabric chassis hostsm esm} export FF_ALL_ANALYSIS=${FF_ALL_ANALYSIS:-fabric chassis} # command to perform text files for baseline vs latest snapshot during # fabric health analysis commands #export FF_DIFF_CMD=${FF_DIFF_CMD:-diff} export FF_DIFF_CMD=${FF_DIFF_CMD:-diff -C 1} # env variables to set within each rank of MPI runs done by fastfabric directly # alternatively the /opt/iba/src/mpi_apps/ofed.*.param files can be edited # with appropriate values. # example of PSM selection of vFabric by PKEY/SL #export FF_MPI_ENV=${FF_MPI_ENV:-PSM_PKEY=0xffff IPATH_SL=0} # example of PSM selection of path and vFabric by query to qlogic_sa #export FF_MPI_ENV=${FF_MPI_ENV:-PSM_PATH_REC=opp PSM_IB_SERVICE_ID=0x1000117500000000} # example of PSM selection of path and vFabric by default query to qlogic_sa #export FF_MPI_ENV=${FF_MPI_ENV:-PSM_PATH_REC=opp} export FF_MPI_ENV=${FF_MPI_ENV:-} # configuration of arguments for MPI performance deviation testing # via /opt/iba/src/mpi_apps/deviation/deviation # The defaults should work for most fabrics. This can be made stricter # and/or specific to the fabric by using arguments such as -h hostname # -bwthres and -latthres. See run_deviation or the user's guide for more # information. #export FF_DEVIATION_ARGS=${FF_DEVIATION_ARGS:--bwtol 20 -lattol 50 -c -v} #export FF_DEVIATION_ARGS=${FF_DEVIATION_ARGS:--bwtol 20 -lattol 50 -c -h hostname} export FF_DEVIATION_ARGS=${FF_DEVIATION_ARGS:--bwtol 20 -lattol 50 -c} # input to iba_host_admin configipoib indicating which mode to # use for IP configuration of ipoib interface, valid values are one of # static, dhcp , auto export FF_IPOIB_CONFIG=${FF_IPOIB_CONFIG:-static} A-6 IB0054607-01 A A–FastFabric Configuration Files Port Statistics Thresholds Configuration File Port Statistics Thresholds Configuration File The /etc/sysconfig/iba/iba_mon.conf configuration file defines port statistics thresholds for use by iba_report, fabric_analysis, all_analysis and iba_mon. This file lists a threshold for each port statistic. If the threshold for a given statistic is not defined or is set to 0, the given statistic will not be checked. An example of a sample file is provided, and matches the internal defaults of the FastFabric tools. For a given release consult /etc/sysconfig/iba/iba_mon.conf-sample for a sample file with the defaults of the given release NOTE: Do not edit /etc/sysconfig/iba/iba_mon.conf-sample. # # # # # # # # # # # # # # This file controls the iba_mon Port Counter monitoring Thresholds. [ICS VERSION STRING: @(#) ./config/iba_mon.conf x_x_x_x_x [MM/DD/YY hh:mm] Error Counters are specified in absolute number of errors over Interval. All Data Movement thresholds are specified in terms of average data/second over the monitoring interval. Setting a threshold to 0 disables monitoring of the given counter Output is generated when a threshold is exceeded. Counters for which a non-zero threshold is specified will be cleared by iba_mon and may impact any remote Performance Managers which are monitoring the given Counter Interval10# monitoring interval in seconds SyslogFacility local6# syslog facility code, or disable ThresholdGreater# how compare counter to threshold # alternative value is Equal # Normal Data Movement PortXmitData PortRcvData PortXmitPkts PortRcvPkts # Error Counters SymbolErrorCounter LinkErrorRecoveryCounter LinkDownedCounter PortRcvErrors PortRcvRemotePhysicalErrors #PortRcvSwitchRelayErrors PortXmitDiscards PortXmitConstraintErrors IB0054607-01 A 0# 0# 0# 0# as as as as MB/second MB/second packets/second packets/second 100 3 3 100 0# side effect of errors elsewhere, ignore 100# known Anafa2 issue, incorrectly increments 100 10 A-7 A–FastFabric Configuration Files Port Statistics Thresholds Configuration File PortRcvConstraintErrors LocalLinkIntegrityErrors ExcessiveBufferOverrunErrors #VL15Dropped 10 3 3 100 # expected to optimize SM sweep time NOTE: When this file is used by iba_mon, the thresholds represent counts per “Interval”. However, when used by iba_report or fabric health tools, the counts are absolute values and are applied against the counters as found in the system A-8 IB0054607-01 A A–FastFabric Configuration Files Signal Integrity Thresholds Configuration File Signal Integrity Thresholds Configuration File The /etc/sysconfig/iba/iba_mon.si.conf configuration file defines port counter signal integrity thresholds. This file allows analysis for any non-zero error counters related to Signal Integrity (bad cables, etc) and can be used by adding the -c option to iba_report, iba_extract_error and other related fastfabric tools. An example of a sample file is provided, and matches the internal defaults of the FastFabric tools. NOTE: Do not edit /etc/sysconfig/iba/iba_mon.conf-sample. # This file controls the iba_mon Port Counter monitoring Thresholds. # [ICS VERSION STRING: @(#) ./config/iba_mon.si.conf x_x_x_x_x [MM/DD/YY hh:mm] # This is a variation of the default iba_mon.conf file. # checks error counters related to Signal Integrity. This file only Thresholds are set # such that any and all non-zero counters will be visible. This can be # useful when using iba_report -o errors, iba_extract_error, and other # related tools. For many FastFabric tools this filename can be specified by # the -c option. # # Error Counters are specified in absolute number of errors over Interval. # All Data Movement thresholds are specified in terms of average data/second # over the monitoring interval. # # Setting a threshold to 0 disables monitoring of the given counter # # Output is generated when a threshold is exceeded. # # Counters for which a non-zero threshold is specified will be cleared by # iba_mon and may impact any remote Performance Managers which are monitoring # the given Counter Interval10# monitoring interval in seconds SyslogFacility local6# syslog facility code, or disable ThresholdEqual# how compare counter to threshold IB0054607-01 A A-9 A–FastFabric Configuration Files Signal Integrity Thresholds Configuration File # alternative value is Greater # Normal Data Movement PortXmitData 0# as MB/second PortRcvData 0# as MB/second PortXmitPkts 0# as packets/second PortRcvPkts 0# as packets/second # Error Counters A-10 SymbolErrorCounter 1 LinkErrorRecoveryCounter 1 LinkDownedCounter 1 PortRcvErrors 1 PortRcvRemotePhysicalErrors 0# side effect of errors elsewhere, ignore PortRcvSwitchRelayErrors 0# not related to SI PortXmitDiscards 0# not related to SI PortXmitConstraintErrors 0# not related to SI PortRcvConstraintErrors 0# not related to SI LocalLinkIntegrityErrors 1 ExcessiveBufferOverrunErrors 1# can be side effect of SI VL15Dropped 0 # expected to optimize SM sweep time IB0054607-01 A A–FastFabric Configuration Files Host List Files Host List Files The /etc/sysconfig/iba/hosts and /etc/sysconfig/iba/allhosts files are used to specify the hosts which FastFabric will operate against for many operations. If desired alternate filenames may be specified in fastfabric.conf, using environment variables or on the command line. Refer to FastFabric Command Line Interface Reference Guide for more information. Below is a sample host list file: # [ICS VERSION STRING: @(#) ./fastfabric/ib_tools/allhosts x_x_x_x_x [MM/DD/YY hh:mm] # This file lists the TCP/IP names of ALL the hosts in the cluster. # THIS SHOULD INCLUDE THE NODE RUNNING FASTFABRIC # # If Ethernet is being used for the management network, specify # the hostname corresponding to the ethernet IP address. # This file will be used by FastFabric to indicate which hosts should be # operated on by various fastfabric menus and CLI commands. include /etc/sysconfig/iba/hosts # add line below with TCP/IP name of FastFabric host (eg. this host) Each line of the host list file may specify a single host, a comment or another host list file to include. Hosts may be specified by IP address or a resolvable TCP/IP hostname. Typically hostnames are used for readability. Also, some FastFabric tools will translate the supplied host names to IPoIB hostnames, in which case names are generally easier to translate than numeric IP addresses. Typically management network host names are specified. However, if desired, IPoIB hostnames or IP addresses may be used. This can accelerate large file transfers and other operations. Files to be included may be specified using an include directive followed by a file name. File names specified should generally be absolute path names. If relative path names are used, they will be searched for within the current directory then /etc/sysconfig/iba. Comments may be placed on any line by using a # to precede the comment. On lines with hosts or include directives, the # must be white-space separated from any preceding host name, IP address or included file name. IB0054607-01 A A-11 A–FastFabric Configuration Files Chassis List Files Chassis List Files The /etc/sysconfig/iba/chassis and /etc/sysconfig/iba/esm_chassis files are used to specify the QLogic InfiniBand chassis that FastFabric will operate against for many operations. If desired alternate filenames may be specified in fastfabric.conf, using environment variables or on the command line. Refer to FastFabric Command Line Interface Reference Guide for more information. The following is a sample chassis file: # # # # # # # # [ICS VERSION STRING: @(#) ./fastfabric/ib_tools/chassis x_x_x_x_x [MM/DD/YY hh:mm] This file lists the TCP/IP names of the QLogic 9000 and 12000 Internally Managed Switches in the cluster. If Ethernet is being used for the management network, specify the name corresponding to the ethernet IP address of the chassis. This file will be used by FastFabric to indicate which chassis should be operated on by various fastfabric menus and CLI commands. Each line of the chassis list file may specify a single chassis, a comment or another chassis list file to include. Chassis may be specified by chassis management network IP address or a resolvable TCP/IP name. Typically, names are used for readability. Files to be included may be specified using an include directive followed by a file name. File names specified should generally be absolute path names. If relative path names are used, they will be searched for within the current directory then /etc/sysconfig/iba. Comments may be placed on any line by using a # to precede the comment. On lines with chassis or include directives, the # must be white-space separated from any preceding name, IP address or included filename. The iba_gen_chassis command can be used to help locate chassis in the fabric and generate a chassis file. Selection of slots within a chassis Normally, operations are performed against the management card in the chassis. For operations such as cmdall, the command is executed against the management interface for the given chassis. For more sophisticated operations, such as firmware update, a directory with firmware for each chassis card type can be supplied and all cards in the chassis will be updated with the appropriate firmware from that directory. A-12 IB0054607-01 A A–FastFabric Configuration Files Externally Managed Switch List File However, in some cases it may be desirable to perform operations against a specific subset of cards within the chassis. In this case the chassis IP address, name within a chassis list or a chassis file can be augmented with a list of slot numbers to operate on. This is done in the form: chassis:slot1,slot2,… For example: i9k229:0 i9k229:0,1,5 192.168.0.5:0,1,5 NOTE: There must be no spaces within the chassis name and/or slot list. This format is used by cmdall and chassis firmware update. This format may be used anywhere a chassis name or IP address is valid, such as the -H option, the CHASSIS environment variable or chassis list files. The slot number specified is ignored on some operations (such as pingall). Only slots containing management cards, EVICs and FVICs may be specified with this format. For all 9000 series chassis, slot 0 is always an alias for the presently active management card for the chassis. For the remainder of slot usages in the chassis, the chassisQuery command can be executed against a given chassis to identify which slots have management, EVIC or FVIC cards. NOTE: For any operation, care should be taken that a given chassis is listed only once with all relevant slots as part of that single specification. This is important so that parallel operations do not cause conflicting concurrent operations against a given chassis. Externally Managed Switch List File The /etc/sysconfig/iba/ibnodes file is used to specify the externally-managed QLogic InfiniBand switches that FastFabric will operate against for many operations. Alternate file names may be specified in fastfabric.conf, using environment variables or on the command line. Refer to FastFabric Command Line Interface Reference Guide for more information. IB0054607-01 A A-13 A–FastFabric Configuration Files Externally Managed Switch List File The following is a sample ibanodes file: # # # # # # # # # # # # # # # # # # # # # [ICS VERSION STRING: @(#) ./fastfabric/ib_tools/ibnodes x_x_x_x_x [MM/DD/YY hh:mm] This file lists all the QLogic 9000 and 12000 Externally Managed Switches specify one line per switch of the form guid,nodeDesc,distance guid - node guid of the switch nodeDesc - optional node description which should be programmed into the switch by FastFabric. It is recommended to supply a unique nodeDesc for each switch to simplify management of the cluster. distance - optional relative distance of the switch from the FastFabric node this is used by reboot operations to first operate on switches furthest from the FastFabric node. Nodes without a distance specified will be treated as furthest. For fabrics with multiple IB subnets, the local hca and port to use may be specified as: guid:hca:port,nodeDesc,distance. See the FastFabric Manual for more info The iba_gen_ibnodes tool can be used to query the SM and generate a list Externally Managed switches in the proper form for this file. for example: 0x00066a00e300299f,SwitchA1,2 Each line of the switch list file may specify a single switch, a comment, or another switch list file to include. Switches can be specified by node GUID optionally followed by a colon and the hca:port, optionally followed by a comma and the IB Node Description (nodename) to be assigned to the switch, and optionally followed by the distance value indicating the relative distance from the FastFabric node for each switch. The iba_gen_ibnodes can be used to help locate externally managed switches in the fabric and generate an ibnodes file. The iba_gen_ibnodes tool will by default provide the proper distance value relative to the FastFabric node from which it was run. This capability requires use of IBTA standard TraceRecord queries which are not supported by openSM, but can be supplied by the QLogic Fabric Manager. Alternatively the iba_gen_ibnodes -R option can suppress generation of this field. See the QLogic FastFabric Command Line Interface Reference Guide for more information. In a typical pure fat tree topology with externally managed switches as edge switches and internally managed switches as core switches, the user can also easily manually specify proper distance by simply specifying 1 for the distance value of the switch next to the FastFabric node. Note that in such a topology all other switches are an equal length from the FastFabric node and a missing distance value will cause them to be treated as having a distance value which is larger than any other found in the file. Therefore the other switches would be rebooted first and the FastFabric node's switch would be rebooted last. A-14 IB0054607-01 A A–FastFabric Configuration Files Externally Managed Switch List File The GUID will be used to select the switch and on firmware update operations, the node description will be written to the switch such that other FastFabric tools (such as iba_aquery and iba_report) can provide a more easily readable name for the switch. The node description can also be updated as part of switch basic configuration. The hca:port may be used to specify which local port (subnet) to use to access the switch. If this is omitted, all local ports specified will be checked for the switch and the first port found to be able to access the switch will be used to access it. See the FastFabric Command Line Interface Reference Guide for more information about how to specify and hca:port value. Files to be included may be specified using an include directive followed by a file name. File names specified should generally be absolute path names. If relative path names are used, they will be searched for within the current directory then /etc/sysconfig/iba. Comments may be placed on any line. By using a # to precede the comment. On lines with chassis or include directives, the # must be white-space separated from any preceding GUID, name or included file name. QLogic recommends that a unique node description be specified for each switch. This name should follow typical naming rules and use the characters a-z, A-Z, 0-9, and underscore. No spaces are allowed in the node description. Additionally, names should not start with a digit. For externally-managed switches, the node GUID can be found on a label on the bottom of the switch. Alternately the node GUIDs for switches in the fabric can be found using a command such as: iba_saquery -t sw -o nodeguid NOTE: The preceding command will report all switch node GUIDs, including those of internally-managed chassis such as the QLogic 12000 or SilverStorm 9120. GUIDs for internally-managed chassis cannot be specified for use in the ibnodes file. FastFabric is topology aware when updating externally managed switch firmware or resetting the switches. Switches furthest from the FastFabric node are updated or reset first and then each switch, working toward the FastFabric node. This way switches that are rebooted are not in the path between the FastFabric node and others that are being rebooted. IB0054607-01 A A-15 A–FastFabric Configuration Files Externally Managed Switch List File The ordering is controlled by an optional distance field in the ibnodes file or the ibnodes provided on the command line. The distance field indicates the relative distance from the FastFabric node for each switch. Any ibnodes file entries which do not specify a distance value are treated as having a value larger than any others in the file. The ibnodes file contains any of these formats per line: nodeguid nodeguid,,distance nodeguid:hca:port nodeguid:hca:port,,distance nodeguid,nodename nodeguid,nodename,distance nodeguid:hca:port,nodename nodeguid:hca:port,nodename,distance The iba_gen_ibnodes tool by default, provides the proper distance value relative to the FastFabric node on which it ran. This capability requires the use of IBTA standard TraceRecord queries which are not supported by openSM, but can be supplied by QLogic FM. Alternatively, the iba_gen_ibnodes -R option can suppress generation of this field. In a typical pure fat tree topology with externally managed switches as edge switches and internally managed switches as core switches, the user can also manually specify proper distance by simply specifying 1 for the distance value of the switch next to the FastFabric node. Note that in such a topology all other switches are an equal length from the FastFabric node and a missing hops value will cause them to be treated as having a distance value which is larger than any other found in the file. Therefore, the other switches would be rebooted first and the FastFabric node's switch would be rebooted last. A-16 IB0054607-01 A A–FastFabric Configuration Files Port List File Port List File The /etc/sysconfig/iba/ports file is used to specify the local HCA ports (i.e., subnets) that FastFabric will use for assorted commands (such as iba_reports, fabric_info, iba_switch_admin, fabric_analysis, all_analysis) for fabric access. Alternate filenames may be specified in fastfabric.conf, using environment variables or on the command line. Refer to FastFabric Command Line Interface Reference Guide for more information. The following is a sample port list file: # [ICS VERSION STRING: @(#) ./fastfabric/ib_tools/ports x_x_x_x_x [MM/DD/YY hh:mm] # This file defines the local HCA ports to use to access the fabric(s) # # specify one line per HCA port of the form hca:port such as: # 0:0 = 1st active port in system # 0:y = port y within system # x:0 = 1st active port on HCA x # x:y = HCA x, port y # The first HCA in the system is 1. The first port on an HCA is 1. 0:0 Each line of the port list file may specify a single port, a comment or another port list file to include. Ports are specified as hca:port. No spaces are permitted. The first Host Channel Adapter is 1 and the first port is 1. The special value 0 for Host Channel Adapter or port has special meaning. The allowed formats are shown in the previous sample. Files to be included may be specified using an include directive followed by a file name. File names specified should generally be absolute path names. If relative path names are used, they will be searched for within the current directory then /etc/sysconfig/iba. Comments may be placed on any line. By using a # to precede the comment. On lines with a port or include directive, the # must be white-space separated from any preceding port or included file name. IB0054607-01 A A-17 A–FastFabric Configuration Files Fabric Topology Input File Fabric Topology Input File The /etc/sysconfig/iba/topology.0:0.xml file is used to specify the expected fabric topology and augmented fabric information (such as cable labels, types, lengths, SM details, node details, link details, etc). If present this file will be used by assorted FastFabric commands (such as iba_reports, fabric_analysis, all_analysis). Refer to the FastFabric Command Line Interface Reference Guide for more information on how to create a topology file describing the fabric. If desired, alternate filenames may be specified in fastfabric.conf, using environment variables or on the command line. Refer to FastFabric Command Line Interface Reference Guide for more information. The XML format of topology input can appear as follows (the example below is purposely brief and omits many links, nodes, and SMs): <?xml version="1.0" encoding="utf-8" ?> <Report> <LinkSummary> <Link> <Rate>20g</Rate> <MTU>2048</MTU> <Internal>0</Internal> <LinkDetails>Bender to Switch</LinkDetails> <Cable> <CableLength>11m</CableLength> <CableLabel>S4567</CableLabel> <CableDetails>gore cable model 456</CableDetails> </Cable> <Port> <NodeGUID>0x0002c9020020e004</NodeGUID> <PortGUID>0x0002c9020020e005</PortGUID> <PortNum>1</PortNum> <NodeType>CA</NodeType> <NodeDesc>bender HCA-1</NodeDesc> <PortDetails>bender primary port</PortDetails> </Port> <Port> <NodeGUID>0x00066a0007000df6</NodeGUID> <PortNum>1</PortNum> <NodeType>SW</NodeType> <NodeDesc>i9k159 Leaf 4, Chip A</NodeDesc> </Port> </Link> <Link> <Rate>20g</Rate> <MTU>2048</MTU> <Internal>0</Internal> <Port> <NodeGUID>0x0002c9020025a678</NodeGUID> <PortGUID>0x0002c9020025a679</PortGUID> A-18 IB0054607-01 A A–FastFabric Configuration Files Fabric Topology Input File <PortNum>1</PortNum> <NodeType>CA</NodeType> <NodeDesc>mindy2 HCA-1</NodeDesc> </Port> <Port> <NodeGUID>0x00066a0007000e6d</NodeGUID> <PortNum>4</PortNum> <NodeType>SW</NodeType> <NodeDesc>i9k159 Leaf 5, Chip A</NodeDesc> </Port> </Link> </LinkSummary> <Nodes> <CAs> <Node id="0x0002c9020025a678"> <NodeGUID>0x0002c9020025a678</NodeGUID> <NodeDesc>mindy2 HCA-1</NodeDesc> <NodeDetails>mindy2 only HCA</NodeDetails> </Node> </CAs> <Switches> <Node id="0x00066a000600025a"> <NodeGUID>0x00066a000600025a</NodeGUID> <NodeDesc>i9k159 Spine 1, Chip A</NodeDesc> <NodeDetails>core switch</NodeDetails> </Node> </Switches> <SMs> <SM id="0x0002c9020025a678:1"> <NodeGUID>0x0002c9020025a678</NodeGUID> <NodeDesc>mindy2 HCA-1</NodeDesc> <PortNum>1</PortNum> <PortGUID>0x0002c9020025a679</PortGUID> <NodeType>CA</NodeType> <NodeType_Int>1</NodeType_Int> <SMDetails>mindy2 SM</SMDetails> </SM> </SMs> </Nodes> </Report> IB0054607-01 A A-19 A–FastFabric Configuration Files Fabric Topology Input File A-20 IB0054607-01 A Corporate Headquarters QLogic Corporation 26650 Aliso Viejo Parkway Aliso Viejo, CA 92656 949.389.6000 www.qlogic.com International Offices UK | Ireland | Germany | France | India | Japan | China | Hong Kong | Singapore | Taiwan © 2011 QLogic Corporation. Specifications are subject to change without notice. All rights reserved worldwide. QLogic, the QLogic logo, and FastFabric are registered trademarks of QLogic Corporation. All other brand and product names are trademarks or registered trademarks of their respective owners. Information supplied by QLogic Corporation is believed to be accurate and reliable. QLogic Corporation assumes no responsibility for any errors in this brochure. QLogic Corporation reserves the right, without notice, to make changes in product design or specifications.