1
REFERENCE
86 A1 93FF 03
ESCALA Power7
High performance clustering
ESCALA Power7
High performance clustering
The ESCALA Power7 publications concern the following models:
- Bull Escala E5-700 (Power 750 / 8233-E8B)
- Bull Escala M6-700 (Power 770 / 9117-MMB)
- Bull Escala M6-705 (Power 770 / 9117-MMC)
- Bull Escala M7-700 (Power 780 / 9179-MHB)
- Bull Escala M7-705 (Power 780 / 9179-MHC)
- Bull Escala E1-700 (Power 710 / 8231-E2B)
- Bull Escala E1-705 (Power 710 / 8231-E1C)
- Bull Escala E2-700 / E2-700T (Power 720 / 8202-E4B)
- Bull Escala E2-705 / E2-705T (Power 720 / 8202-E4C)
- Bull Escala E3-700 (Power 730 / 8231-E2B)
- Bull Escala E3-705 (Power 730 / 8231-E2C)
- Bull Escala E4-700 / E4-700T (Power 740 / 8205-E6B)
- Bull Escala E4-705 (Power 740 / 8205-E6C)
References to Power 755 / 8236-E8C models are irrelevant.
Hardware
October 2011
BULL CEDOC
357 AVENUE PATTON
B.P.20845
49008 ANGERS CEDEX 01
FRANCE
REFERENCE
86 A1 93FF 03
The following copyright notice protects this book under Copyright laws which prohibit such actions as, but not limited to, copying,
distributing, modifying, and making derivative works.
Copyright
Bull SAS 2011
Printed in France
Suggestions and criticisms concerning the form, content, and presentation of this book are
invited. A form is provided at the end of this book for this purpose.
To order additional copies of this book or other Bull Technical Publications, you are invited
to use the Ordering Form also provided at the end of this book.
Trademarks and Acknowledgements
We acknowledge the right of proprietors of trademarks mentioned in this book.
The information in this document is subject to change without notice. Bull will not be liable for errors contained herein, or
for incidental or consequential damages in connection with the use of this material.
Contents
Safety notices . . . . . . . . . . . . . . . . . . . . . . . . . . . . . . . . . ix
High-performance computing clusters using InfiniBand hardware . . . . . . . . . . . 1
Clustering systems by using InfiniBand hardware . . . . . . . . . . . . . .
Cluster information resources . . . . . . . . . . . . . . . . . . . .
Fabric communications . . . . . . . . . . . . . . . . . . . . . .
IBM GX+ or GX++ host channel adapter . . . . . . . . . . . . . . .
Logical switch naming convention . . . . . . . . . . . . . . . .
Host channel adapter statistics counter . . . . . . . . . . . . . .
Vendor and IBM switches . . . . . . . . . . . . . . . . . . .
QLogic switches supported by IBM . . . . . . . . . . . . . . . .
Cables . . . . . . . . . . . . . . . . . . . . . . . . . .
Subnet Manager . . . . . . . . . . . . . . . . . . . . . . .
POWER Hypervisor . . . . . . . . . . . . . . . . . . . . .
Device drivers . . . . . . . . . . . . . . . . . . . . . . .
IBM host stack . . . . . . . . . . . . . . . . . . . . . . .
Management subsystem function overview . . . . . . . . . . . . . . .
Management subsystem integration recommendations . . . . . . . . . .
Management subsystem high-level functions . . . . . . . . . . . . .
Management subsystem overview . . . . . . . . . . . . . . . . .
xCAT . . . . . . . . . . . . . . . . . . . . . . . . .
Fabric manager . . . . . . . . . . . . . . . . . . . . . .
Hardware Management Console . . . . . . . . . . . . . . . .
Switch chassis viewer . . . . . . . . . . . . . . . . . . . .
Switch command-line interface . . . . . . . . . . . . . . . . .
Server Operating system . . . . . . . . . . . . . . . . . . .
Network Time Protocol . . . . . . . . . . . . . . . . . . .
Fast Fabric Toolset . . . . . . . . . . . . . . . . . . . . .
Flexible Service processor. . . . . . . . . . . . . . . . . . .
Fabric viewer . . . . . . . . . . . . . . . . . . . . . . .
Email notifications . . . . . . . . . . . . . . . . . . . . .
Management subsystem networks . . . . . . . . . . . . . . . .
Vendor log flow to xCAT event management . . . . . . . . . . . . .
Supported components in an HPC cluster . . . . . . . . . . . . . . .
Cluster planning. . . . . . . . . . . . . . . . . . . . . . . . .
Cluster planning overview . . . . . . . . . . . . . . . . . . . .
Required level of support, firmware, and devices . . . . . . . . . . . . .
Server planning . . . . . . . . . . . . . . . . . . . . . . . .
Server types . . . . . . . . . . . . . . . . . . . . . . . .
Planning InfiniBand network cabling and configuration . . . . . . . . . .
Topology planning . . . . . . . . . . . . . . . . . . . . . .
Example configurations using only 9125-F2A servers . . . . . . . . .
Example configurations: 9125-F2A compute servers and 8203-E4Astorage servers
Configurations with IO router servers . . . . . . . . . . . . . .
Cable planning . . . . . . . . . . . . . . . . . . . . . . .
Planning QLogic or IBM Machine Type InfiniBand switch configuration . . . .
Planning maximum transfer unit (MTU) . . . . . . . . . . . . . .
Planning for global identifier prefixes. . . . . . . . . . . . . . .
Planning an IBM GX HCA configuration . . . . . . . . . . . . . .
IP subnet addressing restriction with RSCT . . . . . . . . . . . . .
Management subsystem planning . . . . . . . . . . . . . . . . . .
Planning your Systems Management application . . . . . . . . . . . .
Planning xCAT as your Systems Management application . . . . . . . .
Planning for QLogic fabric management applications . . . . . . . . . .
Planning the fabric manager and fabric Viewer . . . . . . . . . . .
© Copyright IBM Corp. 2011
.
.
.
.
.
.
.
.
.
.
.
.
.
.
.
.
.
.
.
.
.
.
.
.
.
.
.
.
.
.
.
.
.
.
.
.
.
.
.
.
.
.
.
.
.
.
.
.
.
.
.
.
.
.
.
.
.
.
.
.
.
.
.
.
.
.
.
.
.
.
.
.
.
.
.
.
.
.
.
.
.
.
.
.
.
.
.
.
.
.
.
.
.
.
.
.
.
.
.
.
.
.
.
.
.
.
.
.
.
.
.
.
.
.
.
.
.
.
.
.
.
.
.
.
.
.
.
.
.
.
.
.
.
.
.
.
.
.
.
.
.
.
.
.
.
.
.
.
.
.
.
.
.
.
.
.
.
.
.
.
.
.
.
.
.
.
.
.
.
.
.
.
.
.
.
.
.
.
.
.
.
.
.
.
.
.
.
.
.
.
.
.
.
.
.
.
.
.
.
.
.
.
.
.
.
.
.
.
.
.
.
.
.
.
.
.
.
.
.
.
.
.
.
.
.
.
.
.
.
.
.
.
.
.
.
.
.
.
.
.
.
.
.
.
.
.
.
.
.
.
.
.
.
.
.
.
.
.
.
.
.
.
.
.
.
.
.
.
.
.
.
.
.
.
.
.
.
.
.
.
.
.
.
.
.
.
.
.
.
.
.
.
.
.
.
.
.
.
.
.
.
.
.
.
.
.
.
.
.
.
.
.
.
.
.
.
.
.
.
.
.
.
.
.
.
.
.
.
.
.
.
.
.
.
.
.
.
.
.
.
.
.
.
.
.
.
.
.
.
.
.
.
.
.
.
.
.
.
.
.
.
.
.
.
.
.
.
.
.
.
.
.
.
.
.
.
.
.
.
.
.
.
.
.
.
.
.
.
.
.
.
.
.
.
.
.
.
.
.
.
.
.
.
.
.
.
.
.
.
.
.
.
.
.
.
.
. 2
. 2
. 6
. 7
. 9
. 10
. 10
. 10
. 10
. 11
. 12
. 12
. 12
. 13
. 13
. 14
. 15
. 17
. 17
. 18
. 19
. 19
. 20
. 20
. 20
. 21
. 21
. 22
. 22
. 23
. 24
. 26
. 27
. 28
. 29
. 29
. 30
. 30
. 33
. 43
. 47
. 48
. 49
. 51
. 52
. 53
. 53
. 54
. 55
. 55
. 56
. 56
iii
Planning Fast Fabric Toolset . . . . . . . . . . . . . . . . . . . . . .
Planning for fabric management server . . . . . . . . . . . . . . . . . . .
Planning event monitoring with QLogic and management server . . . . . . . . . .
Planning event monitoring with xCAT on the cluster management server . . . . . .
Planning to run remote commands with QLogic from the management server . . . . . .
Planning to run remote commands with QLogic from xCAT/MS . . . . . . . . .
Frame planning . . . . . . . . . . . . . . . . . . . . . . . . . . . .
Planning installation flow . . . . . . . . . . . . . . . . . . . . . . . .
Key installation points . . . . . . . . . . . . . . . . . . . . . . . . .
Installation responsibilities by organization . . . . . . . . . . . . . . . . . .
Installation responsibilities of units and devices . . . . . . . . . . . . . . . .
Order of installation . . . . . . . . . . . . . . . . . . . . . . . . .
Installation coordination worksheet . . . . . . . . . . . . . . . . . . . .
Planning for an HPC MPI configuration . . . . . . . . . . . . . . . . . . . .
Planning 12x HCA connections . . . . . . . . . . . . . . . . . . . . . . .
Planning aids . . . . . . . . . . . . . . . . . . . . . . . . . . . . .
Planning checklist . . . . . . . . . . . . . . . . . . . . . . . . . . .
Planning worksheets . . . . . . . . . . . . . . . . . . . . . . . . . .
Cluster summary worksheet . . . . . . . . . . . . . . . . . . . . . . .
Frame and rack planning worksheet . . . . . . . . . . . . . . . . . . . .
Server planning worksheet . . . . . . . . . . . . . . . . . . . . . . .
QLogic and IBM switch planning worksheets . . . . . . . . . . . . . . . . .
Planning worksheet for 24-port switches. . . . . . . . . . . . . . . . . .
Planning worksheet for switches with more than 24 ports . . . . . . . . . . . .
xCAT planning worksheets . . . . . . . . . . . . . . . . . . . . . . .
QLogic fabric management worksheets . . . . . . . . . . . . . . . . . . .
Installing a high-performance computing (HPC) cluster with an InfiniBand network . . . . . .
IBM Service representative installation responsibilities . . . . . . . . . . . . . . .
Cluster expansion or partial installation . . . . . . . . . . . . . . . . . . . .
Site setup for power, cooling, and floor . . . . . . . . . . . . . . . . . . . .
Installing and configuring the management subsystem . . . . . . . . . . . . . . .
Installing and configuring the management subsystem for a cluster expansion or addition .
Installing and configuring service VLAN devices . . . . . . . . . . . . . . .
Installing the Hardware Management Console . . . . . . . . . . . . . . . .
Installing the xCAT management server . . . . . . . . . . . . . . . . . .
Installing operating system installation servers . . . . . . . . . . . . . . . .
Installing the fabric management server . . . . . . . . . . . . . . . . . .
Set up remote logging . . . . . . . . . . . . . . . . . . . . . . . .
Remote syslogging to an xCAT/MS . . . . . . . . . . . . . . . . . . .
Using syslog on RedHat Linux-based xCAT/MS . . . . . . . . . . . . . .
Set up remote command processing . . . . . . . . . . . . . . . . . . . .
Setting up remote command processing from the xCAT/MS. . . . . . . . . . .
Installing and configuring servers with management consoles . . . . . . . . . . .
Installing and configuring the cluster server hardware. . . . . . . . . . . . . . .
Server installation and configuration information for expansion . . . . . . . . . .
Server hardware installation and configuration procedure . . . . . . . . . . . .
Installing the operating system and configuring the cluster servers . . . . . . . . . .
Installing the operating system and configuring the cluster servers information for expansion
Installing the operating system and configuring the cluster servers . . . . . . . . .
Installation sub procedure for AIX only. . . . . . . . . . . . . . . . . .
RedHat rpms required for InfiniBand . . . . . . . . . . . . . . . . . .
Installing and configuring vendor or IBM InfiniBand switches . . . . . . . . . . . .
Installing and configuring InfiniBand switches when adding or expanding an existing cluster
Installing and configuring the InfiniBand switch. . . . . . . . . . . . . . . .
Attaching cables to the InfiniBand network . . . . . . . . . . . . . . . . . .
Cabling the InfiniBand network information for expansion . . . . . . . . . . . .
InfiniBand network cabling procedure . . . . . . . . . . . . . . . . . . .
Verifying the InfiniBand network topology and operation . . . . . . . . . . . . .
Installing or replacing an InfiniBand GX host channel adapter . . . . . . . . . . . .
Deferring replacement of a failing host channel adapter . . . . . . . . . . . . .
Verifying the installed InfiniBand network (fabric) in AIX . . . . . . . . . . . . .
iv
Power Systems: High performance clustering
.
.
.
.
.
.
.
.
.
.
.
.
.
.
.
.
.
.
.
.
.
.
.
.
.
.
.
.
.
.
.
.
.
.
.
.
.
.
.
.
.
.
.
.
.
.
.
.
.
.
.
.
.
.
.
.
.
.
.
.
.
.
.
.
.
.
.
.
.
.
.
.
.
.
.
.
.
.
.
.
.
.
.
.
.
.
.
.
.
.
.
.
.
.
.
.
.
.
.
.
.
.
.
.
.
.
.
.
.
.
.
.
.
.
.
.
.
.
.
.
.
.
.
.
.
.
.
.
.
.
.
.
.
.
.
.
.
.
.
.
.
.
.
.
.
.
.
.
.
.
.
.
.
.
.
.
.
.
.
.
.
.
.
.
.
.
.
.
.
.
.
.
.
.
.
.
.
.
.
.
.
.
.
.
.
.
.
.
.
.
.
.
.
.
.
.
.
.
.
.
.
.
.
.
.
.
.
.
.
.
.
.
.
.
.
.
.
.
.
.
.
.
.
.
.
.
.
.
.
.
.
.
.
.
.
.
.
.
.
.
.
.
.
.
. 63
. 64
. 66
. 66
. 67
. 67
. 68
. 68
. 68
. 68
. 69
. 70
. 73
. 74
. 75
. 75
. 75
. 76
. 77
. 79
. 81
. 83
. 84
. 85
. 89
. 92
. 96
. 97
. 97
. 98
. 98
. 101
. 102
. 102
. 104
. 105
. 105
. 112
. 112
. 120
. 120
. 120
. 122
. 123
. 123
. 124
. 127
. 127
. 128
. 134
. 135
. 137
. 137
. 138
. 143
. 144
. 144
. 145
. 147
. 149
. 150
Fabric verification . . . . . . . . . . . . . . . . . . . . .
Fabric verification responsibilities . . . . . . . . . . . . . .
Reference documentation for fabric verification procedures . . . . . .
Fabric verification tasks . . . . . . . . . . . . . . . . . .
Fabric verification procedure . . . . . . . . . . . . . . . .
Runtime errors . . . . . . . . . . . . . . . . . . . . . .
Cluster Fabric Management . . . . . . . . . . . . . . . . . .
Cluster fabric management flow . . . . . . . . . . . . . . . .
Cluster Fabric Management components and their use . . . . . . . .
xCAT Systems Management . . . . . . . . . . . . . . . .
QLogic subnet manager . . . . . . . . . . . . . . . . . .
QLogic fast fabric toolset . . . . . . . . . . . . . . . . .
QLogic performance manager . . . . . . . . . . . . . . . .
Managing the fabric management server . . . . . . . . . . . .
Cluster fabric management tasks . . . . . . . . . . . . . . . .
Monitoring the fabric for problems . . . . . . . . . . . . . . .
Monitoring fabric logs from the xCAT Cluster Management server . . .
Health checking . . . . . . . . . . . . . . . . . . . .
Setting up periodic fabric health checking . . . . . . . . . . .
Output files for health check . . . . . . . . . . . . . . .
Interpreting health check .changes files . . . . . . . . . . . .
Interpreting health check .diff files . . . . . . . . . . . . .
Querying status . . . . . . . . . . . . . . . . . . . .
Remotely accessing QLogic management tools and commands from xCAT/MS
Remotely accessing the Fabric Management Server from xCAT/MS . . .
Remotely accessing QLogic switches from the xCAT/MS . . . . . . .
Updating code . . . . . . . . . . . . . . . . . . . . . .
Updating Fabric Manager code . . . . . . . . . . . . . . .
Updating switch chassis code . . . . . . . . . . . . . . . .
Finding and interpreting configuration changes . . . . . . . . . . .
Hints on using iba_report . . . . . . . . . . . . . . . . . .
Cluster service . . . . . . . . . . . . . . . . . . . . . . .
Service responsibilities . . . . . . . . . . . . . . . . . . .
Fault reporting mechanisms . . . . . . . . . . . . . . . . .
Fault diagnosis approach . . . . . . . . . . . . . . . . . .
Types of events . . . . . . . . . . . . . . . . . . . . .
Isolating link problems . . . . . . . . . . . . . . . . . .
Restarting or repowering on scenarios . . . . . . . . . . . . .
The importance of NTP . . . . . . . . . . . . . . . . . .
Table of symptoms . . . . . . . . . . . . . . . . . . . .
Service procedures . . . . . . . . . . . . . . . . . . . .
Capturing data for fabric diagnosis . . . . . . . . . . . . . . .
Using script command to capture switch CLI output . . . . . . . .
Capture data for Fabric Manager and Fast Fabric problems . . . . . . .
Mapping fabric devices . . . . . . . . . . . . . . . . . . .
General mapping of IBM HCA GUIDs to physical HCAs . . . . . . .
Finding devices based on a known logical switch . . . . . . . . .
Finding devices based on a known logical HCA . . . . . . . . . .
Finding devices based on a known physical switch port . . . . . . .
Finding devices based on a known ib interface (ibX/ehcaX) . . . . . .
IBM GX HCA Physical port mapping based on device number . . . . . .
Interpreting switch vendor log formats . . . . . . . . . . . . . .
Log severities . . . . . . . . . . . . . . . . . . . . .
Switch chassis management log format . . . . . . . . . . . . .
Subnet Manager log format. . . . . . . . . . . . . . . . .
Diagnosing link errors . . . . . . . . . . . . . . . . . . .
Diagnosing and repairing switch component problems . . . . . . . .
Diagnosing and repairing IBM system problems. . . . . . . . . . .
Diagnosing configuration changes . . . . . . . . . . . . . . .
Checking for hardware problems affecting the fabric . . . . . . . . .
Checking for fabric configuration and functional problems . . . . . . .
.
.
.
.
.
.
.
.
.
.
.
.
.
.
.
.
.
.
.
.
.
.
.
.
.
.
.
.
.
.
.
.
.
.
.
.
.
.
.
.
.
.
.
.
.
.
.
.
.
.
.
.
.
.
.
.
.
.
.
.
.
.
.
.
.
.
.
.
.
.
.
.
.
.
.
.
.
.
.
.
.
.
.
.
.
.
.
.
.
.
.
.
.
.
.
.
.
.
.
.
.
.
.
.
.
.
.
.
.
.
.
.
.
.
.
.
.
.
.
.
.
.
.
.
.
.
.
.
.
.
.
.
.
.
.
.
.
.
.
.
.
.
.
.
.
.
.
.
.
.
.
.
.
.
.
.
.
.
.
.
.
.
.
.
.
.
.
.
.
.
.
.
.
.
.
.
.
.
.
.
.
.
.
.
.
.
.
.
.
.
.
.
.
.
.
.
.
.
.
.
.
.
.
.
.
.
.
.
.
.
.
.
.
.
.
.
.
.
.
.
.
.
.
.
.
.
.
.
.
.
.
.
.
.
.
.
.
.
.
.
.
.
.
.
.
.
.
.
.
.
.
.
.
.
.
.
.
.
.
.
.
.
.
.
.
.
.
.
.
.
.
.
.
.
.
.
.
.
.
.
.
.
.
.
.
.
.
.
.
.
.
.
.
.
.
.
.
.
.
.
.
.
.
.
.
.
.
.
.
.
.
.
.
.
.
.
.
.
.
.
.
.
.
.
.
.
.
.
.
.
.
.
.
.
.
.
.
.
.
.
.
.
.
.
.
.
.
.
.
.
.
.
.
.
.
.
.
.
.
.
.
.
.
.
.
.
.
.
.
.
.
.
.
.
.
.
.
.
.
.
.
.
.
.
.
.
.
.
.
.
.
.
.
.
.
.
.
.
.
.
.
.
.
.
.
.
.
.
.
.
.
.
.
.
.
.
.
.
.
.
.
.
.
.
.
.
.
.
.
.
.
.
.
.
.
.
.
.
.
.
.
.
.
.
.
.
.
.
.
.
.
.
.
.
.
.
.
.
.
.
.
.
.
.
.
.
.
.
.
.
.
.
.
.
.
.
.
.
.
.
.
.
.
.
.
.
.
.
.
.
.
.
.
.
.
.
.
.
.
.
.
.
.
.
.
.
.
.
.
.
.
.
.
.
.
.
.
.
.
.
.
.
.
.
.
.
.
.
.
.
.
.
.
.
.
.
.
.
.
.
.
.
.
.
.
.
.
.
.
.
.
.
.
.
.
.
.
.
.
.
.
.
.
.
.
.
.
.
.
.
.
.
.
.
.
.
.
.
.
.
.
.
.
.
.
.
.
.
.
.
.
.
.
.
.
.
.
.
.
.
.
.
.
.
.
.
.
.
.
.
.
.
.
.
.
.
.
.
.
.
.
.
.
.
.
.
.
.
.
.
.
.
.
.
.
.
.
.
.
.
.
.
.
.
.
.
.
.
.
.
.
.
.
.
.
.
.
.
.
.
.
.
.
.
.
.
.
.
.
.
.
150
150
150
150
151
151
152
152
152
152
153
154
155
155
155
156
156
157
158
164
167
172
174
174
175
175
176
176
179
180
180
183
183
183
185
185
186
187
187
187
191
193
196
196
197
197
199
201
203
205
207
207
207
208
209
210
213
213
213
214
214
Contents
v
Checking InfiniBand configuration in AIX . . . . . . . . . . .
Checking system configuration in AIX . . . . . . . . . . . .
Verifying the availability of processor resources . . . . . . . .
Verifying the availability of memory resources . . . . . . . .
Checking InfiniBand configuration in Linux . . . . . . . . . .
Checking system configuration in Linux . . . . . . . . . . .
Verifying the availability of processor resources . . . . . . . .
Verifying the availability of memory resources . . . . . . . .
Checking multicast groups . . . . . . . . . . . . . . . .
Diagnosing swapped HCA ports . . . . . . . . . . . . . .
Diagnosing swapped switch ports . . . . . . . . . . . . .
Diagnosing events reported by the operating system . . . . . . .
Diagnosing performance problems . . . . . . . . . . . . .
Diagnosing and recovering ping problems. . . . . . . . . . .
Diagnosing application crashes . . . . . . . . . . . . . .
Diagnosing management subsystem problems . . . . . . . . .
Problem with event management or remote syslogging . . . . .
Event not in xCAT/MS:/tmp/systemEvents . . . . . . . .
Event not in xCAT/MS: /var/log/xcat/syslog.fabric.notices. . .
Event not in xCAT/MS: /var/log/xcat/syslog.fabric.info. . . .
Event not in log on fabric management server . . . . . . .
Event not in switch log . . . . . . . . . . . . . . .
Reconfiguring xCAT event management . . . . . . . . . .
Reconfiguring xCAT on the AIX operating system . . . . . .
Reconfiguring xCAT on the Linux operating system . . . . .
Recovering from an HCA preventing a logical partition from activating .
Recovering ibX interfaces . . . . . . . . . . . . . . . .
Recovering a single ibX interface in AIX . . . . . . . . . .
Recovering all of the ibX interfaces in an LPAR in the AIX . . . .
Recovering an ibX interface tcp_sendspace and tcp_recvspace . . .
Recovering ml0 in AIX . . . . . . . . . . . . . . . .
Recovering icm in AIX . . . . . . . . . . . . . . . .
Recovering ehcaX interfaces in Linux . . . . . . . . . . . .
Recovering a single ibX interface in Linux . . . . . . . . . .
Recovering all of the ibX interfaces in an LPAR in the Linux . . .
Recovering to 4K maximum transfer units in the AIX . . . . . . .
Recovering to 4K maximum transfer units in the Linux . . . . . .
Recovering the original master SM . . . . . . . . . . . . .
Re-establishing Health Check baseline . . . . . . . . . . . .
Verifying link FRU replacements . . . . . . . . . . . . . .
Verifying repairs and configuration changes . . . . . . . . . .
Restarting the cluster . . . . . . . . . . . . . . . . . .
Restarting or powering off an IBM system. . . . . . . . . . .
Counting devices . . . . . . . . . . . . . . . . . . .
Counting switches. . . . . . . . . . . . . . . . . .
Counting logical switches . . . . . . . . . . . . . . .
Counting host channel adapters . . . . . . . . . . . . .
Counting end ports . . . . . . . . . . . . . . . . .
Counting ports . . . . . . . . . . . . . . . . . . .
Counting Subnet Managers . . . . . . . . . . . . . . .
Counting devices example . . . . . . . . . . . . . . .
Handling emergency power off situations . . . . . . . . . . .
Monitoring and checking for fabric problems . . . . . . . . . .
Retraining 9125-F2A links . . . . . . . . . . . . . . . .
How to retrain 9125-F2A links . . . . . . . . . . . . . .
When to retrain 9125-F2A links . . . . . . . . . . . . .
Error counters . . . . . . . . . . . . . . . . . . . . .
Interpreting error counters . . . . . . . . . . . . . . . .
Interpreting link Integrity errors . . . . . . . . . . . . .
Interpreting remote errors . . . . . . . . . . . . . . .
Example PortXmitDiscard analyses . . . . . . . . . . .
vi
Power Systems: High performance clustering
.
.
.
.
.
.
.
.
.
.
.
.
.
.
.
.
.
.
.
.
.
.
.
.
.
.
.
.
.
.
.
.
.
.
.
.
.
.
.
.
.
.
.
.
.
.
.
.
.
.
.
.
.
.
.
.
.
.
.
.
.
.
.
.
.
.
.
.
.
.
.
.
.
.
.
.
.
.
.
.
.
.
.
.
.
.
.
.
.
.
.
.
.
.
.
.
.
.
.
.
.
.
.
.
.
.
.
.
.
.
.
.
.
.
.
.
.
.
.
.
.
.
.
.
.
.
.
.
.
.
.
.
.
.
.
.
.
.
.
.
.
.
.
.
.
.
.
.
.
.
.
.
.
.
.
.
.
.
.
.
.
.
.
.
.
.
.
.
.
.
.
.
.
.
.
.
.
.
.
.
.
.
.
.
.
.
.
.
.
.
.
.
.
.
.
.
.
.
.
.
.
.
.
.
.
.
.
.
.
.
.
.
.
.
.
.
.
.
.
.
.
.
.
.
.
.
.
.
.
.
.
.
.
.
.
.
.
.
.
.
.
.
.
.
.
.
.
.
.
.
.
.
.
.
.
.
.
.
.
.
.
.
.
.
.
.
.
.
.
.
.
.
.
.
.
.
.
.
.
.
.
.
.
.
.
.
.
.
.
.
.
.
.
.
.
.
.
.
.
.
.
.
.
.
.
.
.
.
.
.
.
.
.
.
.
.
.
.
.
.
.
.
.
.
.
.
.
.
.
.
.
.
.
.
.
.
.
.
.
.
.
.
.
.
.
.
.
.
.
.
.
.
.
.
.
.
.
.
.
.
.
.
.
.
.
.
.
.
.
.
.
.
.
.
.
.
.
.
.
.
.
.
.
.
.
.
.
.
.
.
.
.
.
.
.
.
.
.
.
.
.
.
.
.
.
.
.
.
.
.
.
.
.
.
.
.
.
.
.
.
.
.
.
.
.
.
.
.
.
.
.
.
.
.
.
.
.
.
.
.
.
.
.
.
.
.
.
.
.
.
.
.
.
.
.
.
.
.
.
.
.
.
.
.
.
.
.
.
.
.
.
.
.
.
.
.
.
.
.
.
.
.
.
.
.
.
.
.
.
.
.
.
.
.
.
.
.
.
.
.
.
.
.
.
.
.
.
.
.
.
.
.
.
.
.
.
.
.
.
.
.
.
.
.
.
.
.
.
.
.
.
.
.
.
.
.
.
.
.
.
.
.
.
.
.
.
.
.
.
.
.
.
.
.
.
.
.
.
.
.
.
.
.
.
.
.
.
.
.
.
.
.
.
.
.
.
.
.
.
.
.
.
.
.
.
.
.
.
.
.
.
.
.
.
.
.
.
.
.
.
.
.
.
.
.
.
.
.
.
.
.
.
.
.
.
.
.
.
.
.
.
.
.
.
.
.
.
.
.
.
.
.
.
.
.
.
.
.
.
.
.
.
.
.
.
.
.
.
.
.
.
.
.
.
.
.
.
.
.
.
.
.
.
.
.
.
.
.
.
.
.
.
.
.
.
.
.
.
.
.
.
.
.
.
.
.
.
.
.
.
.
.
.
.
.
.
.
.
.
.
.
.
.
.
.
.
.
.
.
.
.
.
.
.
.
.
.
.
.
.
.
.
.
.
.
.
.
.
.
.
.
.
.
.
.
.
.
.
.
.
.
.
.
.
.
.
.
.
.
.
.
.
.
.
.
.
.
.
.
.
.
.
.
.
.
.
.
.
.
.
.
.
.
.
.
.
.
.
.
.
.
.
.
.
.
.
.
.
.
.
.
.
.
215
217
217
217
218
220
220
220
221
221
222
223
224
225
226
226
226
227
228
230
231
232
232
232
233
235
235
235
236
237
237
237
237
237
238
238
241
243
244
244
245
246
247
248
248
249
249
249
249
250
250
251
252
252
252
254
254
255
256
260
261
Example PortRcvRemotePhysicalErrors analyses. . . .
Interpreting security errors . . . . . . . . . . . .
Diagnose a link problem based on error counters . . . . .
Error counter details . . . . . . . . . . . . . . .
Categorizing Error Counters . . . . . . . . . . .
Link Integrity Errors . . . . . . . . . . . . . .
LinkDownedCounter . . . . . . . . . . . . .
LinkErrorRecoveryCounter . . . . . . . . . . .
LocalLinkIntegrityErrors. . . . . . . . . . . .
ExcessiveBufferOverrunErrors . . . . . . . . . .
PortRcvErrors . . . . . . . . . . . . . . .
SymbolErrorCounter . . . . . . . . . . . . .
Remote Link Errors (including congestion and link integrity)
PortRcvRemotePhysicalErrors . . . . . . . . . .
PortXmitDiscards . . . . . . . . . . . . . .
Security errors . . . . . . . . . . . . . . . .
PortXmitConstraintErrors . . . . . . . . . . .
PortRcvConstraintErrors . . . . . . . . . . . .
Other error counters . . . . . . . . . . . . . .
VL15Dropped . . . . . . . . . . . . . . .
PortRcvSwitchRelayErrors . . . . . . . . . . .
Clearing error counters . . . . . . . . . . . . . .
Example health check scripts . . . . . . . . . . . . .
Configuration script . . . . . . . . . . . . . . .
Error counter clearing script . . . . . . . . . . . .
Healthcheck control script . . . . . . . . . . . . .
Cron setup on the Fabric MS . . . . . . . . . . . .
Improved healthcheck . . . . . . . . . . . . . .
.
.
.
.
.
.
.
.
.
.
.
.
.
.
.
.
.
.
.
.
.
.
.
.
.
.
.
.
.
.
.
.
.
.
.
.
.
.
.
.
.
.
.
.
.
.
.
.
.
.
.
.
.
.
.
.
.
.
.
.
.
.
.
.
.
.
.
.
.
.
.
.
.
.
.
.
.
.
.
.
.
.
.
.
.
.
.
.
.
.
.
.
.
.
.
.
.
.
.
.
.
.
.
.
.
.
.
.
.
.
.
.
.
.
.
.
.
.
.
.
.
.
.
.
.
.
.
.
.
.
.
.
.
.
.
.
.
.
.
.
.
.
.
.
.
.
.
.
.
.
.
.
.
.
.
.
.
.
.
.
.
.
.
.
.
.
.
.
.
.
.
.
.
.
.
.
.
.
.
.
.
.
.
.
.
.
.
.
.
.
.
.
.
.
.
.
.
.
.
.
.
.
.
.
.
.
.
.
.
.
.
.
.
.
.
.
.
.
.
.
.
.
.
.
.
.
.
.
.
.
.
.
.
.
.
.
.
.
.
.
.
.
.
.
.
.
.
.
.
.
.
.
.
.
.
.
.
.
.
.
.
.
.
.
.
.
.
.
.
.
.
.
.
.
.
.
.
.
.
.
.
.
.
.
.
.
.
.
.
.
.
.
.
.
.
.
.
.
.
.
.
.
.
.
.
.
.
.
.
.
.
.
.
.
.
.
.
.
.
.
.
.
.
.
.
.
.
.
.
.
.
.
.
.
.
.
.
.
.
.
.
.
.
.
.
.
.
.
.
.
.
.
.
.
.
.
.
.
.
.
.
.
.
.
.
.
.
.
.
.
.
.
.
.
.
.
.
.
.
.
.
.
.
.
.
.
.
.
.
.
.
.
.
.
.
.
.
.
.
.
.
.
.
.
.
.
.
.
.
.
.
.
.
.
.
.
.
.
.
.
.
.
.
.
.
.
.
.
.
.
.
.
.
.
.
.
.
.
.
.
.
.
.
.
.
.
.
.
262
264
264
265
265
266
266
266
267
267
268
269
271
271
271
273
273
273
273
273
274
274
275
276
276
277
279
279
Notices . . . . . . . . . . . . . . . . . . . . . . . . . . . . . . . . . . . 283
Trademarks . . . . .
Electronic emission notices
Class A Notices. . .
Terms and conditions. .
.
.
.
.
.
.
.
.
.
.
.
.
.
.
.
.
.
.
.
.
.
.
.
.
.
.
.
.
.
.
.
.
.
.
.
.
.
.
.
.
.
.
.
.
.
.
.
.
.
.
.
.
.
.
.
.
.
.
.
.
.
.
.
.
.
.
.
.
.
.
.
.
.
.
.
.
.
.
.
.
.
.
.
.
.
.
.
.
.
.
.
.
.
.
.
.
.
.
.
.
.
.
.
.
.
.
.
.
.
.
.
.
.
.
.
.
Contents
.
.
.
.
284
285
285
288
vii
viii
Power Systems: High performance clustering
Safety notices
Safety notices may be printed throughout this guide:
v DANGER notices call attention to a situation that is potentially lethal or extremely hazardous to
people.
v CAUTION notices call attention to a situation that is potentially hazardous to people because of some
existing condition.
v Attention notices call attention to the possibility of damage to a program, device, system, or data.
World Trade safety information
Several countries require the safety information contained in product publications to be presented in their
national languages. If this requirement applies to your country, a safety information booklet is included
in the publications package shipped with the product. The booklet contains the safety information in
your national language with references to the U.S. English source. Before using a U.S. English publication
to install, operate, or service this product, you must first become familiar with the related safety
information in the booklet. You should also refer to the booklet any time you do not clearly understand
any safety information in the U.S. English publications.
German safety information
Das Produkt ist nicht für den Einsatz an Bildschirmarbeitsplätzen im Sinne § 2 der
Bildschirmarbeitsverordnung geeignet.
Laser safety information
IBM® servers can use I/O cards or features that are fiber-optic based and that utilize lasers or LEDs.
Laser compliance
IBM servers may be installed inside or outside of an IT equipment rack.
© Copyright IBM Corp. 2011
ix
DANGER
When working on or around the system, observe the following precautions:
Electrical voltage and current from power, telephone, and communication cables are hazardous. To
avoid a shock hazard:
v Connect power to this unit only with the IBM provided power cord. Do not use the IBM
provided power cord for any other product.
v Do not open or service any power supply assembly.
v Do not connect or disconnect any cables or perform installation, maintenance, or reconfiguration
of this product during an electrical storm.
v The product might be equipped with multiple power cords. To remove all hazardous voltages,
disconnect all power cords.
v Connect all power cords to a properly wired and grounded electrical outlet. Ensure that the outlet
supplies proper voltage and phase rotation according to the system rating plate.
v Connect any equipment that will be attached to this product to properly wired outlets.
v When possible, use one hand only to connect or disconnect signal cables.
v Never turn on any equipment when there is evidence of fire, water, or structural damage.
v Disconnect the attached power cords, telecommunications systems, networks, and modems before
you open the device covers, unless instructed otherwise in the installation and configuration
procedures.
v Connect and disconnect cables as described in the following procedures when installing, moving,
or opening covers on this product or attached devices.
To Disconnect:
1. Turn off everything (unless instructed otherwise).
2. Remove the power cords from the outlets.
3. Remove the signal cables from the connectors.
4. Remove all cables from the devices
To Connect:
1. Turn off everything (unless instructed otherwise).
2. Attach all cables to the devices.
3. Attach the signal cables to the connectors.
4. Attach the power cords to the outlets.
5. Turn on the devices.
(D005)
DANGER
x
Power Systems: High performance clustering
Observe the following precautions when working on or around your IT rack system:
v Heavy equipment–personal injury or equipment damage might result if mishandled.
v Always lower the leveling pads on the rack cabinet.
v Always install stabilizer brackets on the rack cabinet.
v To avoid hazardous conditions due to uneven mechanical loading, always install the heaviest
devices in the bottom of the rack cabinet. Always install servers and optional devices starting
from the bottom of the rack cabinet.
v Rack-mounted devices are not to be used as shelves or work spaces. Do not place objects on top
of rack-mounted devices.
v Each rack cabinet might have more than one power cord. Be sure to disconnect all power cords in
the rack cabinet when directed to disconnect power during servicing.
v Connect all devices installed in a rack cabinet to power devices installed in the same rack
cabinet. Do not plug a power cord from a device installed in one rack cabinet into a power
device installed in a different rack cabinet.
v An electrical outlet that is not correctly wired could place hazardous voltage on the metal parts of
the system or the devices that attach to the system. It is the responsibility of the customer to
ensure that the outlet is correctly wired and grounded to prevent an electrical shock.
CAUTION
v Do not install a unit in a rack where the internal rack ambient temperatures will exceed the
manufacturer's recommended ambient temperature for all your rack-mounted devices.
v Do not install a unit in a rack where the air flow is compromised. Ensure that air flow is not
blocked or reduced on any side, front, or back of a unit used for air flow through the unit.
v Consideration should be given to the connection of the equipment to the supply circuit so that
overloading of the circuits does not compromise the supply wiring or overcurrent protection. To
provide the correct power connection to a rack, refer to the rating labels located on the
equipment in the rack to determine the total power requirement of the supply circuit.
v (For sliding drawers.) Do not pull out or install any drawer or feature if the rack stabilizer brackets
are not attached to the rack. Do not pull out more than one drawer at a time. The rack might
become unstable if you pull out more than one drawer at a time.
v (For fixed drawers.) This drawer is a fixed drawer and must not be moved for servicing unless
specified by the manufacturer. Attempting to move the drawer partially or completely out of the
rack might cause the rack to become unstable or cause the drawer to fall out of the rack.
(R001)
Safety notices
xi
CAUTION:
Removing components from the upper positions in the rack cabinet improves rack stability during
relocation. Follow these general guidelines whenever you relocate a populated rack cabinet within a
room or building:
v Reduce the weight of the rack cabinet by removing equipment starting at the top of the rack
cabinet. When possible, restore the rack cabinet to the configuration of the rack cabinet as you
received it. If this configuration is not known, you must observe the following precautions:
– Remove all devices in the 32U position and above.
– Ensure that the heaviest devices are installed in the bottom of the rack cabinet.
– Ensure that there are no empty U-levels between devices installed in the rack cabinet below the
32U level.
v If the rack cabinet you are relocating is part of a suite of rack cabinets, detach the rack cabinet from
the suite.
v Inspect the route that you plan to take to eliminate potential hazards.
v Verify that the route that you choose can support the weight of the loaded rack cabinet. Refer to the
documentation that comes with your rack cabinet for the weight of a loaded rack cabinet.
v Verify that all door openings are at least 760 x 230 mm (30 x 80 in.).
v
v
v
v
v
Ensure that all devices, shelves, drawers, doors, and cables are secure.
Ensure that the four leveling pads are raised to their highest position.
Ensure that there is no stabilizer bracket installed on the rack cabinet during movement.
Do not use a ramp inclined at more than 10 degrees.
When the rack cabinet is in the new location, complete the following steps:
– Lower the four leveling pads.
– Install stabilizer brackets on the rack cabinet.
– If you removed any devices from the rack cabinet, repopulate the rack cabinet from the lowest
position to the highest position.
v If a long-distance relocation is required, restore the rack cabinet to the configuration of the rack
cabinet as you received it. Pack the rack cabinet in the original packaging material, or equivalent.
Also lower the leveling pads to raise the casters off of the pallet and bolt the rack cabinet to the
pallet.
(R002)
(L001)
(L002)
xii
Power Systems: High performance clustering
(L003)
or
All lasers are certified in the U.S. to conform to the requirements of DHHS 21 CFR Subchapter J for class
1 laser products. Outside the U.S., they are certified to be in compliance with IEC 60825 as a class 1 laser
product. Consult the label on each part for laser certification numbers and approval information.
CAUTION:
This product might contain one or more of the following devices: CD-ROM drive, DVD-ROM drive,
DVD-RAM drive, or laser module, which are Class 1 laser products. Note the following information:
v Do not remove the covers. Removing the covers of the laser product could result in exposure to
hazardous laser radiation. There are no serviceable parts inside the device.
v Use of the controls or adjustments or performance of procedures other than those specified herein
might result in hazardous radiation exposure.
(C026)
Safety notices
xiii
CAUTION:
Data processing environments can contain equipment transmitting on system links with laser modules
that operate at greater than Class 1 power levels. For this reason, never look into the end of an optical
fiber cable or open receptacle. (C027)
CAUTION:
This product contains a Class 1M laser. Do not view directly with optical instruments. (C028)
CAUTION:
Some laser products contain an embedded Class 3A or Class 3B laser diode. Note the following
information: laser radiation when open. Do not stare into the beam, do not view directly with optical
instruments, and avoid direct exposure to the beam. (C030)
CAUTION:
The battery contains lithium. To avoid possible explosion, do not burn or charge the battery.
Do Not:
v ___ Throw or immerse into water
v ___ Heat to more than 100°C (212°F)
v ___ Repair or disassemble
Exchange only with the IBM-approved part. Recycle or discard the battery as instructed by local
regulations. In the United States, IBM has a process for the collection of this battery. For information,
call 1-800-426-4333. Have the IBM part number for the battery unit available when you call. (C003)
Power and cabling information for NEBS (Network Equipment-Building System)
GR-1089-CORE
The following comments apply to the IBM servers that have been designated as conforming to NEBS
(Network Equipment-Building System) GR-1089-CORE:
The equipment is suitable for installation in the following:
v Network telecommunications facilities
v Locations where the NEC (National Electrical Code) applies
The intrabuilding ports of this equipment are suitable for connection to intrabuilding or unexposed
wiring or cabling only. The intrabuilding ports of this equipment must not be metallically connected to the
interfaces that connect to the OSP (outside plant) or its wiring. These interfaces are designed for use as
intrabuilding interfaces only (Type 2 or Type 4 ports as described in GR-1089-CORE) and require isolation
from the exposed OSP cabling. The addition of primary protectors is not sufficient protection to connect
these interfaces metallically to OSP wiring.
Note: All Ethernet cables must be shielded and grounded at both ends.
The ac-powered system does not require the use of an external surge protection device (SPD).
The dc-powered system employs an isolated DC return (DC-I) design. The DC battery return terminal
shall not be connected to the chassis or frame ground.
xiv
Power Systems: High performance clustering
High-performance computing clusters using InfiniBand
hardware
You can use this information to guide you through the process of planning, installing, managing, and
servicing high-performance computing (HPC) clusters that use InfiniBand hardware.
This information serves as a navigation aid through the publications required to install the hardware
units, firmware, operating system, software, or applications publications produced by IBM or other
vendors. This information provides configuration settings and an order of installation and acts as a
launch point for typical service and management procedures. In some cases, this information provides
detailed procedures instead of referencing procedures that are so generic that their use within the context
of a cluster is not readily apparent.
This information is not intended to replace the existing or vendor-supplied publications for the various
hardware units, firmware, operating systems, software, or applications produced by IBM or other
vendors. These publications are referenced throughout this information.
The following table provides a high-level view of the cluster implementation process. This information is
required to effectively plan, install, manage, and service your HPC clusters that use InfiniBand hardware.
Table 1. High-level view of the cluster implementation process and associated information
Content
Description
“Clustering systems by using InfiniBand hardware” on
page 2
Provides references to information resources, an
overview of cluster components, and the supported
component levels.
“Cluster information resources” on page 2
Provides a list of the various information resources for
the key components of the cluster fabric and where they
can be obtained. These information resources are used
extensively during your cluster implementation, so it is
important to collect the required documents early in the
process.
“Fabric communications” on page 6
Provides a description of the fabric data flow.
“Management subsystem function overview” on page 13
Provides a description of the management subsystem.
“Supported components in an HPC cluster” on page 24
Provides a list of the supported components and
pertinent features, and the minimum shipment levels for
software and firmware.
“Cluster planning” on page 26
Provides information about planning for the cluster and
the fabric.
“Cluster planning overview” on page 27
Provides navigation through the planning process.
“Required level of support, firmware, and devices” on
page 28
Provides the minimum ship level for firmware and
devices and provides a website to obtain the latest
information.
“Server planning” on page 29, “Planning InfiniBand
network cabling and configuration” on page 30, and
“Management subsystem planning” on page 54
Provides the planning requirements for the main
subsystems.
© Copyright IBM Corp. 2011
1
Table 1. High-level view of the cluster implementation process and associated information (continued)
Content
Description
“Planning installation flow” on page 68
Provides guidance in how the various tasks relate to each
other and who is responsible for the various planning
tasks for the cluster. This information also illustrates how
certain tasks are prerequisites to other tasks. This topic
assists you in coordinating the activities of the
installation team.
“Planning worksheets” on page 76
Provides planning worksheets that are used to plan the
important aspects of the cluster fabric. If you are using
your own worksheets, they must cover the items
provided in these worksheets.
Other planning
“Installing a high-performance computing (HPC) cluster
with an InfiniBand network” on page 96
Provides procedures for installing the cluster.
“Cluster Fabric Management” on page 152
Provides tasks for managing the fabric.
“Cluster service” on page 183
Provides high-level service tasks. This topic is intended
to be a launch point for servicing the cluster fabric
components.
Planning installation worksheets
Provides blank copies of the planning worksheets for
easy printing.
Clustering systems by using InfiniBand hardware
This information provides planning and installation details to help guide you through the process of
installing a cluster fabric that incorporates InfiniBand switches.
IBM server hardware supports clustering through InfiniBand host channel adapters (HCAs) and switches.
Information about how to manage and service a cluster by using InfiniBand hardware is included in this
information.
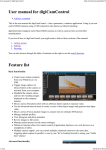
The following figure shows servers that are connected in a cluster configuration with InfiniBand switch
networks (fabric). The servers are connected to this network by using IBM GX HCAs. In System p® Blade
servers, the HCAs are based on PCI Express (PCIe).
Notes:
1. Switch refers to the InfiniBand technology switch unless otherwise noted.
2. Not all configurations support the following network configuration. See the IBM sales information for
supported configurations.
Figure 1. InfiniBand network with four switches and four servers connected
Cluster information resources
The following tables indicate important documentation for the cluster, where to get it and when to use it
relative to Planning, Installation, and Management and Service phases of a clusters life.
The tables are arranged into categories of components:
v “General cluster information resources” on page 3
v “Cluster hardware information resources” on page 3
v “Cluster management software information resources” on page 4
2
Power Systems: High performance clustering
v “Cluster software and firmware information resources” on page 5
General cluster information resources
The following table lists general cluster information resources:
Table 2. General cluster resources
Component
Document
IBM Cluster
Information
This document
IBM Clusters with
the InfiniBand
Switch website
IBM Clusters with the InfiniBand Switch readme file
QLogic
InfiniBand
Architecture
HPC Central wiki
and HPC Central
forum
Plan
Install
Manage and
service
x
x
x
x
x
x
x
x
x
http://www14.software.ibm.com/webapp/set2/
sas/f/networkmanager/home.html
Note: This site lists exceptions that differ from
the IBM and vendor documentation.
QLogic InfiniBand Switches and Management
Software for IBM System p Clusters web-site.
http://driverdownloads.qlogic.com/
QLogicDriverDownloads_UI/
Product_detail.aspx?oemid=389
InfiniBand architecture documents and standard
specifications are available from the InfiniBand
Trade Association http://www.infinibandta.org/
home.
The HPC Central wiki enables collaboration
between customers and IBM teams. This wiki
includes questions and comments.
http://www.ibm.com/developerworks/wikis/
display/hpccentral/HPC+Central
Note: QLogic uses Silverstorm in their product documentation.
Cluster hardware information resources
The following table lists cluster hardware resources:
Table 3. Cluster hardware information resources
Component
Document
Site planning for all
IBM systems
System i® and System p Site Preparation and Physical
Planning Guides
x
POWER6® systems
Site and Hardware Planning Guide
x
9125-F2A
Installation Guide for [MachineType and Model]
8204-E8A
Servicing the IBM system p [MachineType and
Model]
8203-E4A
PCI Adapter Placement
9119-FHA
9117-MMA
Plan
Install
x
x
x
Worldwide Customized Installation Instructions
(WCII) IBM service representative installation
instructions for IBM machines and features
http://w3.rchland.ibm.com/projects/WCII.
Manage and
service
x
x
8236-E8C
High-performance computing clusters using InfiniBand hardware
3
Table 3. Cluster hardware information resources (continued)
Component
Document
Plan
Install
Manage and
service
Logical partitioning
for all systems
Logical Partitioning Guide
BladeCenter® JS22
and JS23
Planning, Installation, and Service Guide
x
x
x
IBM GX HCA
Custom Installation
Custom Installation Instructions, one for each
HCA feature http://w3.rchland.ibm.com/
projects/WCII)
x
x
x
BladeCenter JS22 and Users guide for 1350
JS23 HCA
x
x
x
Pass-through module 1350 documentation
x
x
x
x
Install Instructions for IBM LPAR on System i and
System P
x
®
Fabric management
server
IBM System x 3550 and 3650 documentation
Management node
HCA
HCA vendor documentation
x
x
x
QLogic switches
[Switch model] Users Guide
x
x
x
[Switch model] Quick Setup Guide
x
x
x
[Switch Model] Quick Setup Guide
x
x
QLogic InfiniBand Cluster Planning Guide
x
x
QLogic 9000 CLI Reference Guide
x
x
IBM Power Systems™ documentation is available in the IBM Power Systems Hardware Information
Center.
Any exceptions to the location of information resources for cluster hardware as stated above have been
noted in the table. Any future changes to the location of information that occur before a new release of
this document will be noted in the IBM clusters with the InfiniBand switch website.
Note: QLogic uses Silverstorm in their product documentation.
Cluster management software information resources
The following table lists cluster management software information resources:
Table 4. Cluster management software resources
Component
Document
QLogic Subnet
Manager
Fabric Manager and Fabric Viewer Users Guide
QLogic Fast Fabric
Toolset
Fast Fabric Toolset Users Guide
4
Plan
Install
Manage and service
x
x
x
x
x
x
http://filedownloads.qlogic.com/files/ms/
72922/QLogic_FM_FV_UG_Rev_A.pdf
http://filedownloads.qlogic.com/files/ms/
70168/User%27s_Guide_FF_v4_3_Rev_B.pdf
Power Systems: High performance clustering
Table 4. Cluster management software resources (continued)
Component
Document
Plan
QLogic InfiniServ
Stack
InfiniServ Fabric Access Software Users Guide
Install
Manage and service
x
x
x
QLogic Open Fabrics QLogic OFED+ Users Guide
Enterprise
Distribution (OFED) http://filedownloads.qlogic.com/files/driver/
68069/
Stack
QLogic_OFED+_Users_Guide_Rev_C.pdf
x
x
x
Hardware
Management
Console (HMC)
Installation and Operations Guide for the HMC
x
x
xCAT
http://xcat.sourceforge.net/(go to the
Documentation link)
x
x
x
For InfiniBand support in xCAT, see
xCAT2IBsupport.pdf at:https://
xcat.svn.sourceforge.net/svnroot/xcat/xcatcore/trunk/xCAT-client/share/doc/
xCAT2IBsupport.pdf.
x
x
x
http://filedownloads.qlogic.com/files/driver/
68069/
QLogic_OFED+_Users_Guide_Rev_C.pdf
Operations Guide for the HMC and Managed
Systems
x
IBM Power Systems documentation is available in the IBM Power Systems Hardware Information Center.
The QLogic documentation is initially available from QLogic support. Check the IBM Clusters with the
InfiniBand Switch website for any updates to availability on a QLogic website.
Cluster software and firmware information resources
The following table lists cluster software and firmware information resources.
Table 5. Cluster software and firmware information resources
Component
AIX®
Linux
Document
Plan
Install
Manage and
service
AIX Information Center
x
x
x
Obtain information from your Linux distribution
source
x
x
x
High-performance computing clusters using InfiniBand hardware
5
Table 5. Cluster software and firmware information resources (continued)
Component
Document
Plan
IBM HPC Clusters
Software
GPFS: Concepts, Planning, and Installation Guide
Install
x
GPFS: Administration and Programming
Reference
Manage and
service
x
x
GPFS: Problem Determination Guide
x
GPFS: Data Management API Guide
®
x
x
®
Tivoli Workload Scheduler LoadLeveler :
Installation Guide
x
x
Tivoli Workload Scheduler LoadLeveler: Using and
administering
x
Tivoli Workload Scheduler LoadLeveler: Diagnosis
and Messages Guide
Parallel Environment: Installation
x
x
Parallel Environment: Messages
x
x
x
x
Parallel Environment: Operation and Use,
Volumes 1 and 2
x
Parallel Environment: MPI Programming Guide
x
Parallel Environment: MPI Subroutine Reference
x
The IBM HPC Clusters Software Information can be found at the IBM Cluster Information Center.
Fabric communications
This information provides a description of fabric communications using several figures illustrating the
overall data flow and software layers in an IBM System p High Performance Computing (HPC) cluster
with an InfiniBand fabric.
Review the following types of material to understand the InfiniBand fabrics. For more specific
documentation references see, “Cluster information resources” on page 2.
The following items are the main components in the fabric data flow.
Table 6. Main components in fabric data flow
Component
Reference
IBM Host-Channel Adapters (HCAs)
“IBM GX+ or GX++ host channel adapter” on page 7
Vendor Switches
“Vendor and IBM switches” on page 10
Cables
“Cables” on page 10
Subnet Manager (within the Fabric Manager)
“Subnet Manager” on page 11
Phyp
“POWER Hypervisor” on page 12
Device Drivers (HCADs)
“Device drivers” on page 12
Host Stack
“IBM host stack” on page 12
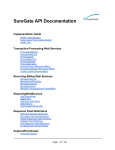
The following figure shows the main components of the fabric data flow.
6
Power Systems: High performance clustering
Figure 2. Main components in fabric data flow
The following figure shows the high-level software architecture.
Figure 3. High-level software architecture
The following figure shows a simple InfiniBand configuration illustrating the tasks, the software layers,
the windows, and the hardware. The host channel adapter (HCA) shown is intended to be a single HCA
card with four physical ports. However, the figure could also be interpreted as a collection of physical
HCAs and a port; for example, two cards, each with two ports.
Figure 4. Simple configuration with InfiniBand
To gain a better understanding of InfiniBand fabrics, see the following documentation:
v The InfiniBand standard specification from the InfiniBand Trade Association.
v Documentation from the switch vendor
IBM GX+ or GX++ host channel adapter
The IBM GX or GX+ host channel adapter (HCA) provides server connectivity to InfiniBand fabrics.
When you attach an adapter to a GX or GX+ bus, you can gain higher bandwidth to and from the
adapter. You also can gain better network performance than attaching an adapter to a PCI bus. Because of
server form factors, including GX or GX+ bus design, each server that supports an IBM GX or GX+ HCA
has its own HCA feature.
The GX or GX+ HCA can be shared between logical partitions so each physical port can be used by each
logical partition.
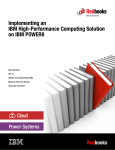
The adapter is logically structured as one logical switch connected to each physical port by using a
logical host channel adapter (LHCA) for each logical partition. The following figure shows a single,
physical, two-port HCA. This configuration has a single chip that can support two ports.
High-performance computing clusters using InfiniBand hardware
7
Figure 5. Two-port GX or GX+ host channel adapter
A four-port HCA has two chips with a total of four logical switches that has two logical switches in each
of the two chips.
The logical structure affects how the HCA is represented to the Subnet Manager. Each logical switch and
LHCA represent a separate InfiniBand node to the Subnet Manager on each port. Each LHCA connects to
all logical switches in the HCA.
Each logical switch has a port globally unique identifier (GUID) for the physical port and a port GUID
for each LHCA. Each LHCA has two port GUIDs, one for each logical switch.
The number of nodes that can be presented to the Subnet Manager is a function of the maximum number
of LHCAs that are assigned. This is a configurable number for POWER6 GX HCAs, and it is a fixed
number for System p POWER5™ GX HCAs. The Power hypervisor (PHyp) communicates with the Subnet
Manager using the Subnet Management Agent (SMA) function in phyp.
The POWER6 GX HCA supports a single LHCA by default. In this case, the GX HCA presents each
physical port to the Subnet Manager as a two-port logical switch. One port is connected to the LHCA and
the second port is connected to the physical port. The POWER6 GX HCA can also be configured to
support up to 16 LHCAs. In this case, the HCA presents each physical port to the Subnet Manager as a
17-port logical switch with up to 16 LHCAs. Ultimately, the number of ports for a logical switch is
dependent on the number of logical partitions concurrently using the GX HCA.
The POWER5 GX HCA supports up to 64 LHCAs. In this case, the GX HCA presents each physical port
to the Subnet Manager as a 65-port logical switch. One port connects to the physical port and 64 ports
connect to LHCAs. As compared to how it works on POWER6 processor-based systems, for System p
POWER5 processor-based systems, it does not matter how many LHCAs are defined and used by logical
partitions. The number of nodes presented includes all potential LHCAs for the configuration. Therefore,
each physical port on a GX HCA in a POWER5 processor-based system presents itself as a 65-port logical
switch.
The Hardware Management Console (HMC) that manages the server, in which the HCA is populated, is
used to configure the virtualization capabilities of the HCA. For systems that are not managed by an
HMC, configuration and virtualization are done using the Integrated Virtualization Manager (IVM).
Each logical partition is only aware of its assigned LHCA. For each logical partition profile, a GUID is
selected with an LHCA. The GUID is programmed in the adapter and cannot be changed.
8
Power Systems: High performance clustering
Since each GUID must be different in a network, the IBM HCA gets a subsequent GUID assigned by the
firmware. You can choose the offset that is used for the LHCA. This information is also stored in the
logical partition profile on the HMC.
Therefore, when an HCA is replaced, each logical partition profile must be manually updated with the
new HCA GUID information. If this step is not performed, the HCA is not available to the operating
system.
The following table describes how the HCA resources are allocated to a logical partition. This ability to
allocate HCA resources permits multiple logical partitions to share a single HCA. The degree of sharing is
driven by your application requirements.
The Dedicated value is only used when you have a single, active logical partition that must use all the
available HCA resources. You can configure multiple logical partitions to be dedicated, but only one can
be active at a time.
When you have more than one logical partition sharing an HCA, you can change to high, medium, or
low allocation to it. You can never allocate more than 100% of the HCA across all active logical partitions.
For example, four active logical partitions can be set to medium and two active logical partitions can be set
to High; (4x1/8) + (2x1/4) = 1.
If the requested resource allocation for an LPAR exceeds the available resource for an HCA, the LPAR
fails to activate. So, in the preceding example with six active LPARs, if one more LPAR tried to activate
and use the HCA, the LPAR would fail to activate, because the HCA is already 100% allocated
Table 7. Allocation of HCA resources to a logical partition
Value
Resulting resource allocation or adapter
Dedicated
All of the adapter resources are dedicated to the LPAR. This value is
the default for single LPARs, which is the supported HPC Cluster
configuration.
If you have multiple active LPARs, you cannot simultaneously
dedicate the HCA to more than one active LPAR.
High
One-quarter of the maximum adapter resources
Medium
One-eighth of the maximum adapter resources
Low
One-sixteenth of maximum adapter resources
Logical switch naming convention:
The IBM GX host channel adapters (HCAs) have a logical switch naming convention based on the server
type and the HCA type.
The following table shows the logical switch naming convention.
Table 8. Logical switch naming convention
Server
HCA chip base
Logical switch name
POWER5
Any
IBM Logical Switch 1 or IBM Logical
Switch 2
System p (POWER6)
First generation
IBM G1 Logical Switch 1 or IBM G1
Logical Switch 2
System p (POWER6)
Second generation
IBM G2 Logical Switch 1 or IBM G2
Logical Switch 2
High-performance computing clusters using InfiniBand hardware
9
Host channel adapter statistics counter:
The statistics counters in the IBM GX host channel adapters (HCAs) are only available with HCAs in
System p (POWER6) servers.
You can query the counters using Performance Manager functions with the Fabric Viewer and the fast
fabric iba_report command. For more information see, “Hints on using iba_report” on page 180. While
the HCA tracks most of the prescribed counters, it does not have counters for transmit packets or receive
packets.
Related reference
“Hints on using iba_report” on page 180
The iba_report function helps you to monitor the cluster fabric resources.
Vendor and IBM switches
In older Power clusters, vendor switches might be used as the backbone of the communications fabric in
an IBM HPC Cluster using InfiniBand technology. These are all based on the 24 port Mellanox chip.
IBM has released a machine type and models based on the QLogic 9000 series. All new clusters are sold
with these switches.
QLogic switches supported by IBM
IBM supports QLogic switches in high-performance computing (HPC) clusters.
The following QLogic switch models are supported. For more details on the models, see the QLogic
documentation and the Users guide for the switch model, which are available at http://
www.qlogic.com/Pages/default.aspx or contact QLogic support.
Note: QLogic uses SilverStorm in their product names.
Table 9. InfiniBand switch models
Number of ports
IBM Switch Machine Type-Model
QLogic Switch Model
24
7874-024
9024 = 24 port
48
7874-040
9040 = 48 port
96
N/A*
9080 = 96 port
144
7874-120
9120 = 144 port
288
7872-240
9240 = 288 port
* IBM does not implement a 96 port 7874 switch.
Cables
IBM supports specific cables for high-performance computing (HPC) cluster configurations.
The following table describes the cables that are supported for IBM HPC configurations.
10
Power Systems: High performance clustering
Table 10. Cables for high-performance computing configurations
System or use
Cable type
Connector type
Length - m (ft)
Source
POWER6
9125-F2A
4x DDR, copper
QSFP - CX4
6 m (passive, 26
awg),
QLogic
Comments(feature
codes listed in order
respective to length)
10 m (active, 26
awg),
14 m (active, 30
awg)
4x DDR, optical
QSFP - CX4
10 m, 20 m, 40 m
IBM
IBM feature codes:
3291, 3292, 3294
POWER6
8204-E8A,
8203-E4A,
9119-FHA,
9117-MMA
12x - 4x DDR
width exchanger,
copper
CX4 - CX4
3 m,
IBM
10 m
Link operates at 4x
speed.
IBM feature codes:
1841, 1842
POWER7®
8236-E8C
JS22
4x DDR, copper
CX4 - CX4
Multiple lengths
Vendor
To connect between
PTM and switch.
Inter-switch
4x DDR, copper
CX4 - CX4
Multiple lengths
Vendor
For use between
switches.
Inter-switch
4x DDR, optical
CX4 - CX4
Multiple lengths
Vendor
For use between
switches. Feature codes
are for the IBM system
type 7874 switch.
7874 IBM Feature
Codes 3301, 3302, 3300
Fabric
management
server
4x DDR, copper
CX4 - CX4
Multiple lengths
Vendor
4x DDR, optical
CX4 - CX4
Multiple lengths
Vendor
For connecting the
fabric management
server to subnet to
support host-based
Subnet Manager and
Fast Fabric Toolset.
Subnet Manager
The Subnet Manager is defined by the InfiniBand standard specification. It is used to configure and
manage the communication fabric so that it can pass data. It does in-band management over the same
links as the data.
The Subnet Manager is defined by the standard specification. Management functions are performed
inband over the same links as the data.
Use a host-based Subnet Manager (HSM) which runs a Fabric Management Server. The host-based Subnet
Manager scales better than the embedded Subnet Manager (ESM), and IBM has verified and approved
the HSM for use in High Performance Computing (HPC) clusters.
For more information about Subnet Managers, see the InfiniBand standard specification or vendor
documentation.
High-performance computing clusters using InfiniBand hardware
11
Related concepts
“Management subsystem function overview” on page 13
This information provides an overview of the servers, consoles, applications, firmware, and networks that
comprise the management subsystem function.
POWER Hypervisor
The POWER Hypervisor™ provides an abstraction layer between the hardware and firmware and the
operating system instances.
POWER Hypervisor provides the following functions in POWER6 GX HCA implementations.
v UD low latency receive queues
v Large page memory sizes
v Shared receive queues (SRQ)
v Support for more than 16 K Queue Pairs (QP). The exact number of QPs is driven by cluster size and
available system memory.
POWER Hypervisor also contains the Subnet Management Agent (SMA) to communicate with the Subnet
Manager and present the HCA as logical switches with a given number of ports attached to the physical
ports and to logical HCAs (LHCAs).
POWER Hypervisor also contains the Performance Management Agent (PMA), which is used to
communicate with the performance manager that collects fabric statistics, such as link statistics, including
errors and link usage statistics. The QLogic Fast Fabric iba_report command uses performance manager
protocol to collect error and performance counters.
If there are logical HCAs, the performance manager packet first goes to the operating system driver. The
operating system replies to the requestor that it must redirect its request to the Hypervisor. Because of
this added traffic for redirection and the Logical HCA counters are of little practical use, it is advised that
the Logical HCA counters are normally not collected.
For more information about SMA and PMA function, see the InfiniBand architecture documentation.
Related concepts
“IBM GX+ or GX++ host channel adapter” on page 7
The IBM GX or GX+ host channel adapter (HCA) provides server connectivity to InfiniBand fabrics.
Device drivers
IBM provides device drivers for the AIX operating system. Device drivers for the Linux operating system
are provided by the distributors.
The vendor provides the device driver that is used on Fabric Management Servers.
Related concepts
“Management subsystem function overview” on page 13
This information provides an overview of the servers, consoles, applications, firmware, and networks that
comprise the management subsystem function.
IBM host stack
The high-performance computing (HPC) software stack is supported for IBMSystem p HPC Clusters.
The vendor host stack is used on Fabric Management Servers.
12
Power Systems: High performance clustering
Related concepts
“Management subsystem function overview”
This information provides an overview of the servers, consoles, applications, firmware, and networks that
comprise the management subsystem function.
Management subsystem function overview
This information provides an overview of the servers, consoles, applications, firmware, and networks that
comprise the management subsystem function.
The management subsystem is a collection of servers, consoles, applications, firmware, and networks that
work together to provide the following functions.
v Installing and managing the firmware on hardware devices
v Configuring the devices and the fabric
v Monitoring for events in the cluster
v Monitoring status of the devices in the cluster
v Recovering and routing around failure scenarios in the fabric
v Diagnosing the problems in the cluster
IBM and vendor system and fabric management products and utilities can be configured to work
together to manage the fabric.
Review the following information to better understand InfiniBand fabrics.
v The InfiniBand standard specification from the InfiniBand Trade Association. Read the information
about managers.
v Documentation from the switch vendor. Read the Fabric Manager and Fast Fabric Toolset
documentation.
Related concepts
“Cluster information resources” on page 2
The following tables indicate important documentation for the cluster, where to get it and when to use it
relative to Planning, Installation, and Management and Service phases of a clusters life.
Management subsystem integration recommendations
Extreme Cloud Administration Toolkit (xCAT) is the IBM Systems Management tool that provides the
integration function for InfiniBand fabric management.
The major advantages of xCAT in a cluster are as follows.
v The ability to issue remote commands to many nodes and devices simultaneously.
v The ability to consolidate logs and events from many sources in a cluster by using event management.
The IBM System p HPC clusters are migrating from CSM to xCAT. With respect to solutions using
InfiniBand, the following table translates key terms, utilities, and file paths from CSM to xCAT:
Table 11. CSM to xCAT translations
CSM
xCAT
dsh
xdsh
/var/opt/csm/IBSwitches/Qlogic/config
/var/opt/xcat/IBSwitch/Qlogic/config
/var/log/csm/errorlog
/tmp/systemEvents
/opt/csm/samples/ib
/opt/xcat/share/xcat/ib/scripts
IBconfigAdapter script
configiba
The term “node”
device
High-performance computing clusters using InfiniBand hardware
13
QLogic provides the following switch and fabric management tools.
v Fabric Manager (From level 4.3, onward, is part of the QLogic InfiniBand Fabric Suite (IFS). Previously,
it was in its own package.)
v Fast Fabric Toolset (From level 4.3, onward, is part of QLogic IFS. Previously, it was in its own
package.)
v Chassis Viewer
v Switch command-line interface
v Fabric Viewer
Management subsystem high-level functions
Several high-level functions address management subsystem integrations.
To address the management subsystem integration, functions for management are divided into the
following topics:
1. Monitor the state and health of the fabric
2. Maintain
3. Diagnose
4. Connectivity
Monitor
You can use the following functions to monitor the state and health of the fabric:
1. Syslog entries (status and configuration changes) can be forwarded from the Subnet Managers to the
xCAT Management Server (MS). Set up different files to separate priority and severity.
2. The IBSwitchLogSensor within xCAT can be configured.
3. The QLogic Fast Fabric Toolset health checking tools can be used for regularly monitoring the fabric
for errors and configuration changes that might lead to performance problems.
Maintain
The xdsh command in xCAT permits you to use the following vendor command-line tools remotely:
1. Switch chassis command-line interface (CLI) on a managed switch.
2. Subnet Manager running in a switch chassis or on a host.
3. Fast Fabric tools running on a fabric management server or host. This host is an IBM System x server
that is running on the Linux operating system and the host stack from the vendor.
Diagnosing
Vendor tools diagnose the health of the fabric.
The QLogic Fast Fabric Toolset running on the Fabric Management Server or Host provides the main
diagnostic capability. It is important when there are no obvious errors, but there is an observed
degradation in performance. This degradation might be a result of errors previously undetected or
configuration changes including missing resources.
Connecting
For connectivity, the xCAT/MS must be on the same cluster VLAN as the switches and the fabric
management servers that is running the Subnet Managers and Fast Fabric tools.
14
Power Systems: High performance clustering
Management subsystem overview
The management subsystem in the System p HPC Cluster solution using an InfiniBand fabric loosely
integrates the typical IBM System p HPC cluster components with the QLogic components.
The management subsystem can be viewed from several perspectives, including:
v Host views
v Networks
v Functional components
v Users and interfaces
The following figure illustrates the functions of the management or service subsystem.
Figure 6. Management subsystem
High-performance computing clusters using InfiniBand hardware
15
The preceding figure illustrates the use of a host-based Subnet Manager (HSM), rather than an embedded
Subnet Manager (ESM), running on a switch. This use of HSM is because of the limited compute
resources on switches for ESM use. If you are using an ESM, then the Fabric Managers runs on switches.
The servers are monitored and serviced in the same fashion as for any IBM Power Systems cluster.
The following table is a quick reference for the various management hosts or consoles in the cluster
including who is intended to use them, and the networks to which they are connected.
Table 12. Management subsystem server, consoles, and workstations
Hosts
Software hosted
Server type
Operating system User
Connectivity
xCAT/MS
xCAT
IBM System p
AIX
IBM System x
Linux
v Cluster virtual
local area
network
(VLAN)
Admin
v Service VLAN
Fabric
management
server
v Fast Fabric
Tools
IBM System x
Linux
v Host-based
Fabric Manager
(recommended)
v System
administrator
v InfiniBand
v Switch service
provider
v Cluster VLAN
(same as
switches)
v IBM CE
v Service VLAN
v System
administrator
v Cluster VLAN
or public
VLAN
(optional)
v System
administrator
Cluster VLAN
(Chassis viewer
requires public
network access)
v Fabric viewer
(optional)
Hardware
Management
Console (HMC)
Hardware
Management
Console for
managing IBM
systems.
IBM System x
Switch
v Chassis
firmware
Switch chassis
Proprietary
Proprietary
v Chassis viewer
v Switch service
provider
v Embedded
Fabric Manager
(optional)
System
administrator
workstation
v System
administrator
workstation
User preference
v Fabric viewer
(optional)
v Launch point
into
management
servers
Note: This
launch point
requires
network access
to other
servers.
(optional)
16
Power Systems: High performance clustering
User preference
System
administrator
Network access to
management
servers
Table 12. Management subsystem server, consoles, and workstations (continued)
Hosts
Software hosted
Server type
Operating system User
Connectivity
Service laptop
Serial interface to
switch
Note: This is not
provided by IBM
as part of the
cluster. It is
provided by the
user or the site.
Laptop
User experience
RS/232 to switch
NTP
Site preference
NTP server
v Switch service
provider
v System
administrator
Site preference
Not applicable
v Cluster VLAN
v Service VLAN
xCAT:
Extreme Cluster Administration Toolset. xCAT is a system administrator tool for monitoring and
managing the cluster.
The following table provides an overview of xCAT.
Table 13. xCAT overview
Description
Extreme Cluster Administration Toolset. xCAT is used by the system admin to monitor
and manage the cluster.
Documentation
xCAT documentation
When to use
For the fabric, use xCAT to:
v Monitor remote logs from the switches and Fabric Management Servers
v Remotely run commands on the switches and Fabric Management Servers
After configuring the switches and Fabric Management Servers IP addresses, remote
syslogging and creating them as devices, xCAT can be used to monitor for switch
events, and xdsh to their CLI.
Host
xCAT Management Server
How to access
Use CLI or GUI on the xCAT Management Server.
Fabric manager:
The fabric manager is used to complete basic operations such as fabric discovery, fabric configuration,
fabric monitoring, fabric reconfiguration after failure, and reporting problems.
The following table provides an overview of the fabric manager.
High-performance computing clusters using InfiniBand hardware
17
Table 14. Fabric manager overview
Fabric manager
Details
Description
The fabric manager performs the following basic operations:
v Discovers fabric devices
v Configures the fabric
v Monitors the fabric
v Reconfigures the fabric on failure
v Reports problems
The fabric manager has several management interfaces that are used to manage an
InfiniBand network. These interfaces include the baseboard manager, performance
manager, Subnet Manager, and fabric executive. All but the fabric executives are
described in the InfiniBand architecture. The fabric executive is there to provide an
interface between the Fabric Viewer and the other managers. Each of these managers is
required to fully manage a single subnet. If you have a host-based fabric manager, there
is up to 4 fabric managers on the Fabric Manager Server. Configuration parameters for
each of the managers for each instance of fabric manager must be considered. There are
many parameters, but only a few typically varies from default.
A more detailed description of fabric management is available in the InfiniBand standard
specification and vendor documentation.
Documentation
v QLogic Fabric Manager Users Guide
v InfiniBand standard specification
When to use
Fabric management cab be used to manage the network and pass data. You use the
Chassis Viewer, CLI, or Fabric Viewer to interact with the fabric manager.
Host
v Host-based fabric manager is on the fabric management server.
v Embedded fabric manager is on the switch.
How to access
You might access the Fabric Manager functions from xCAT by remote commands
through dsh to the Fabric Management Server or switch, on which the embedded fabric
manager is running. You can access many instances using xdsh.
For host-based fabric managers, log on to the Fabric Management Server.
For embedded fabric managers, use the Chassis Viewer, switch CLI, Fast Fabric Toolset,
or Fabric Viewer to interact with the fabric manager.
Hardware Management Console:
You can use the Hardware Management Console (HMC) to manage a group of servers.
The following table provides an overview of the HMC.
Table 15. HMC overview
HMC
Details
Description
Each HMC is assigned to the management of a group of servers. If there is more than
one HMC in a cluster, then it is accomplished by using the Cluster Ready Hardware
Server on the cluster management server.
Documentation
HMC Users Guide
When to use
To set up and manage LPARs, including HCA virtualization. To access Service Focal
Point™ for HCA and server reported hardware events. To control the server hardware.
Host
HMC
18
Power Systems: High performance clustering
Table 15. HMC overview (continued)
HMC
Details
How to access
Use the HMC console located near the system. There is generally a single keyboard and
monitor with a console switch to access multiple HMCs in a rack (if there is a need for
multiple HMCs).
You can also access the HMC through a supported web browser on a remote server that
can connect to the HMC.
Switch chassis viewer:
The switch chassis viewer is a tool that is used to configure a switch and query the state of the switch.
The following table provides an overview of the switch chassis viewer.
Table 16. Switch chassis viewer overview
Switch chassis viewer
Details
Description
The switch chassis viewer is a tool for configuring a switch and a tool for querying its
state. It is also used to access the embedded fabric manager. Since it can only work with
one switch at a time, it does not scale well.
Documentation
Switch Users Guide
When to use
After the configuration setup has been performed, the user will probably only use the
chassis viewer as part of diagnostic test. This diagnostic test is used after the Fabric
Viewer or Fast Fabric tools have been employed and isolated a problem to a chassis.
Host
Switch chassis
How to access
The Chassis Viewer is accessible through any browser on a server connected to the
Ethernet network to which the switch is attached. The IP address of the switch is the
URL that opens the chassis viewer.
Switch command-line interface:
Use the switch command-line interface (CLI) for configuring switches and querying the state of a switch.
The following table provides an overview of the switch chassis viewer.
Table 17. Switch CLI overview
Switch command-line
interface
Details
Description
The Switch Command Line Interface is a non-GUI method for configuring switches and
querying state. It is also used to access the embedded Subnet Manager.
Documentation
Switch Users Guide
When to use
After the configuration setup has been performed, the user will probably only use the
CLI chassis viewer as part of diagnostic test. This diagnostic test is used after the Fabric
Viewer or Fast Fabric tools have been employed. However, using xCAT xdsh or Expect,
remote scripts can access the CLI for creating customized monitoring and management
scripts.
Host
Switch Chassis
How to access
v Telnet or ssh to the switch using its IP address on the cluster VLAN
v Fast Fabric Toolset
v xdsh from the xCAT/MS
v System connected to the RS/232 port
High-performance computing clusters using InfiniBand hardware
19
Server Operating system:
The operating system is the interface with the device drivers.
The following table provides an overview of the operating system.
Table 18. Operating system overview
Operating system details More information
Description
The operating system is the interface for the device drivers.
Documentation
Operating system users guide
When to use
To query the state of the host channel adapters (HCAs) and the availability of the HCAs
to applications.
Host
IBM system
How to access
xdsh from xCAT or telnet/ssh into the LPAR.
Network Time Protocol:
The Network Time Protocol (NTP) synchronizes the clocks in the management servers and switches.
The following table provides an overview of the NTP.
Table 19. Network Time Protocol overview
Network Time Protocol
Details
Description
The NTP is used to keep the switches and management servers time of day clocks
synchronized. It is important to ensure the correlation of events in time.
Documentation
NTP Users Guide
When to use
The NTP is set up during installation.
Host
The NTP Server
How to access
The administrator accesses the NTP by logging on to the system on which the NTP
server is running. The NTP is accessed for configuration and maintenance and usually is
a background application.
Fast Fabric Toolset:
The QLogic Fast Fabric Toolset is a set of scripts that are used to manage switches and to obtain
information about the switch status.
The following table provides an overview of the Fast Fabric Toolset.
Table 20. Fast Fabric Toolset overview
Fast Fabric Toolset
Details
Description
Fast Fabric tools are a set of scripts that provide access to switches and the various
managers to connect with many switches. And the managers simultaneously obtain
useful status or information. Additionally, health-checking tools help you to identify
fabric error states and also unforeseen changes from baseline configuration. Health
checking tools are run from a central server called the fabric management server.
These tools can also help manage nodes running the QLogic host stack. The set of
functions that manages nodes are not used with an IBM System p or IBM Power
Systems high-performance computing (HPC) cluster.
20
Power Systems: High performance clustering
Table 20. Fast Fabric Toolset overview (continued)
Fast Fabric Toolset
Details
Documentation
Fast Fabric Toolset Users Guide
When to use
These tools can be used during installation to search for problems. These tools can also
be used for health checking when you have degraded performance.
Host
Fabric management server
How to access
v Telnet or ssh to the Fabric Management Server
v If you set up the server that is running the Fast Fabric tools as a managed device, you
can use xdsh command for xCAT.
Flexible Service processor:
The Flexible service processor is used to facilitate connectivity.
The following table provides an overview of the flexible service processor.
Table 21. Flexible Service processor overview
Service processor
Details
Description
Cluster management server and the managing HMC must be able to communicate with
the FSP over the service VLAN. For system type 9125 servers, connectivity is facilitated
through an internal hardware virtual local area network (VLAN) within the frame,
which connects to the service VLAN.
Documentation
IBM System Users Guide
When to use
The FSP is in the background most of the time and the HMC and management server
provide the information. It is sometimes accessed under direction from engineering.
Host
IBM system
How to access
Is primarily used by service personnel. Direct access is rarely required, and is done
under direction from engineering using the ASMI screens. Otherwise, management
server and the HMC are used to communicate with the FSP.
Fabric viewer:
The fabric viewer is an interface that is used to access the Fabric Management tools.
The following table provides an overview of the fabric viewer.
Table 22. Fabric viewer overview
Fabric viewer
Details
Description
The fabric viewer is a user interface that is used to access the Fabric Management tools
on the various subnets. It is a Linux or Microsoft Windows application.
The fabric viewer must be able to connect to the cluster virtual local area network
(VLAN) to connect to the switches. The fabric viewer must also connect to the Subnet
Manager hosts through the same cluster VLAN.
Documentation
QLogic Fabric Viewer Users Guide
When to use
After you have setup the switch for communication to the Fabric Viewer this can be
used as the main point for queries and interaction with the switches. You will also use
this to update the switch code simultaneously to multiple switches in the cluster. You
will also use this during install time to set up Email notification for link status changes
and SM and EM communication status changes.
High-performance computing clusters using InfiniBand hardware
21
Table 22. Fabric viewer overview (continued)
Fabric viewer
Details
Host
Any Linux or Microsoft Windows host. Typically, these hosts would be one of the
following items.
v Fabric management server
v System administrator or operator workstation
How to access
Start the graphical user interface (GUI) from the server on which you install the fabric
viewer, or use a remote window access to start it. VNC is an example of a remote
window access application.
Email notifications:
The email notifications function can be enabled to trigger emails from the fabric viewer.
The following table provides an overview of email notifications.
Table 23. Email notifications overview
Email notifications
Details
Description
A subset of events can be enabled to trigger an email from the Fabric Viewer. These are
link up and down and communication issues between the Fabric Viewer and parts of the
fabric manager.
Typically Fabric Viewer is used interactively and shutdown after a session. This would
prevent the ability to effectively use email notification. If you want to use this function,
you must have a copy of Fabric Viewer running continuously; for example, on the Fabric
Management Server.
Documentation
Fabric Viewer Users Guide
When to use
Set up during installation so that you can be notified of events as they occur.
Host
Wherever Fabric Viewer is running.
How to access
Setup for email notification is done on the fabric viewer. The email is accessed from
wherever you have directed the fabric viewer to send the email notifications.
Management subsystem networks:
The devices in the management subsystem are connected through various networks.
All of the devices in the management subsystem are connected to at least two networks over which their
applications must communicate. Typically, the site connects key servers to a local network to provide
remote access for managing the cluster. The networks are shown in the following table.
Table 24. Management subsystem networks overview
Type of network
Details
Service VLAN
The service VLAN is a private Ethernet network which provides connectivity between
the FSPs, BPAs, xCAT/MS, and the HMCs to facilitate hardware control.
Cluster VLAN
The cluster VLAN (or network) is an Ethernet network (public or private), which gives
xCAT access to the operating systems. It is also used for access to InfiniBand switches
and fabric management servers.
Note: The switch vendor documentation references to the Cluster VLAN as the service
VLAN, or possibly the management network.
22
Power Systems: High performance clustering
Table 24. Management subsystem networks overview (continued)
Type of network
Details
Public network
A local site Ethernet network. Typically this network is attached to the xCAT/MS and
Fabric Management Server. Some sites might choose to put the cluster VLAN on the
public network. See the xCAT installation and planning documentation to consider the
implications of combining these networks.
Internal hardware VLAN
Is a virtual local area network (VLAN) within a frame of 9125 servers. It concentrates all
server FSP connections and the BPH connections onto an internal ethernet hub, which
provides a single connection to the service VLAN, which is external to the frame.
Vendor log flow to xCAT event management
The integration of vendor and IBM log flows is a critical factor in event management.
One of the important points of integration for vendor and IBM management subsystems is log flow from
vendor management applications to xCAT event management. This integration provides a consolidated
logging point in the cluster. The flow of log information is shown in the following figure. For this
integration to work, you must set up remote logging and xCAT event management with the Fabric
Management Server and the switches as described in “Set up remote logging” on page 112.
The figure indicates where remote logging and xCAT Sensor-Condition-Response must be enabled for the
flow to work.
There are three standard response outputs shipped with xCAT. Refer the xCAT Monitoring How-to
documentation for more details on event management. For this flow, xCAT uses the IBSwitchLogSensor
and the LocalIBSwitchLog condition and one or more of the following responses: Email root anytime,
Log event anytime, and LogEventToxCATDatabase.
High-performance computing clusters using InfiniBand hardware
23
Figure 7. Vendor log flow to xCAT event management
Supported components in an HPC cluster
High-performance computing (HPC) clusters are implemented using components that are approved and
supported by IBM.
For details, see “Cluster information resources” on page 2.
The following table indicates the components or units that are supported in an HPC cluster as of Service
Pack 10.
Table 25. Supported HPC components
Component type
Component
Model, feature, or minimum level
POWER6 processor-based servers
2U high-end server
9125-F2A
POWER7 (8236)
High volume server 4U high
8203-E4A
8204-E8A
Only IPoIB is supported on the 8203
and 8204.
8236-755 (full IB support)
Blade Server
Model JS22: 7988-61X
Model JS23: 7778-23X
24
Power Systems: High performance clustering
Table 25. Supported HPC components (continued)
Component type
Operating system
Component
AIX 5L
Model, feature, or minimum level
™
AIX 5.3 at Technology Level 5300-12
with Service Pack 1
AIX 5.3 is for POWER6 only
AIX 6.1
POWER6:
AIX Version 6.1 with the 6100-01
Technology Level with Service Pack 1
POWER7 AIX 6LVersion 6.1 with the
6100-04 Technology Level with
Service Pack 2
RedHat RHEL
Red Hat 5.3 ppc kernel-2.6.18128.2.1.el5.ppc64
QLogic (for existing customers only)
9024, 9040, 9080, 9120, 9240
IBM
7874-024, 7874-040, 7874-120, 7874-240
IBM GX+ HCA for 9125-F2A
5612
IBM GX HCA for 8203-E4A and
8204-E8A
5616 = SDR HCA
IBM GX HCA for 8236-E8C
5609 = DDR HCA
JS22/JS23 HCA
Mellanox 4x Connect-X HCA
8258
JS22/JS23 Pass-thru module
Voltaire High Performance InfiniBand 3216
Pass-Through Module for IBM
BladeCenter
Cable
CX4 to CX4
For Information, see“Cables” on page
10
QSFP to CX4
For Information, see“Cables” on page
10
Management node for InfiniBand
fabric
IBM System x 3550 (1U high)
7978AC1
IBM System x 3650 (2U high)
7979AC1
HCA for management node
QLogic Dual-Port 4X DDR
Switch
IBM GX HCAs
5608,5609 = DDR HCA
InfiniBand PCIe HCA
QLogic InfiniBand Fabric Suite Fabric QLogic host-based Fabric Manager
Manager
(embedded not preferred
5.0.3.0.3
QLogic-OFED host stack
Fast Fabric Toolset
Switch firmware
QLogic firmware for the switch
4.2.4.2.1
xCAT
AIX or Linux
2.3.3
High-performance computing clusters using InfiniBand hardware
25
Table 25. Supported HPC components (continued)
Component type
Component
Model, feature, or minimum level
Hardware Management Console
(HMC)
HMC
POWER6:
V7R3.5.0M0 HMC with fixes
MH01194, MH01197, MH01204, and
V7R3.5.0M1 HMC with MH01212
(HMC build level: 20100301.1)
POWER7:
V7R7.1.1 HMC with Fix pack
AL710_03
Cluster planning
Plan a cluster that uses InfiniBand technologies for the communications fabric. This information covers
the key elements of the planning process, and helps you organize existing, detailed planning information.
When planning a cluster with an InfiniBand network, you bring together many different devices and
management tools to form a cluster. The following are major components that are part of a cluster.
v Servers
v I/O devices
v InfiniBand network devices
v Frames (racks)
v Service virtual local area network (VLAN) that includes the following items.
– Hardware Management Console (HMC)
– Ethernet devices
– xCAT Management Server
v Management Network that includes the following items.
– xCAT Management Server
– Servers to provide operating system access from the CAT
– InfiniBand switches
– Fabric management server
– AIX Network Installation Management (NIM) server (for servers with no removable media)
– Linux distribution server (for servers with no removable media)
v System management applications that include the following items.
– HMC
– xCAT
– Fabric Manager
– Other QLogic management tools such as Fast Fabric Toolset, Fabric Viewer and Chassis Viewer
v Physical characteristics such as weight and dimensions
v Electrical characteristics
v Cooling characteristics
The “Cluster information resources” on page 2 provide the required documents and other Internet
resources that help you plan your cluster. It is not an exhaustive list of the documents that you need, but
it would provide a good launch point for gathering required information.
26
Power Systems: High performance clustering
The “Cluster planning overview” can be used as a road map through the planning process. If you read
through the Cluster planning overview without following the links, you gain an understanding of the
overall cluster planning strategy. Then you can follow the links that direct you through the different
procedures to gain an in-depth understanding of the cluster planning process.
In the Cluster planning overview, the planning procedures are arranged in a sequential order for a new
cluster installation. If you are not installing a new cluster, you must choose which procedures to use.
However, you would still perform them in the order they appear in the Cluster planning overview. If you
are using the links in “Cluster planning overview,” note when a planning procedure ends so that you
know when to return to the “Cluster planning overview.” The end of each major planning procedure is
indicated by “[planning procedure name] ends here”.
Cluster planning overview
Use this information as a road map to through the cluster planning procedures.
To plan your cluster complete the following tasks.
1. Gather and review the planning and installation information for the components in the cluster.
See“Cluster information resources” on page 2 as a starting point for where to obtain the information.
This information provides supplemental documentation with respect to clustered computing with an
InfiniBand network. You must understand all of the planning information for the individual
components before continuing with this planning overview.
2. Review the “Planning checklist” on page 75 which can help you track the planning steps that you
have completed.
3. Review the “Required level of support, firmware, and devices” on page 28 to understand the
minimal level of software and firmware required to support clustering with an InfiniBand network.
4. Review the planning resources for the individual servers that you want to use in your cluster. See
“Server planning” on page 29.
5. Review “Planning InfiniBand network cabling and configuration” on page 30 to understand the
network devices and configuration. The planning information addresses the following items.
v “Planning InfiniBand network cabling and configuration” on page 30.
v “Planning an IBM GX HCA configuration” on page 53. For vendor host channel adapter (HCA)
planning, use the vendor documentation.
6. Review the “Management subsystem planning” on page 54. The management subsystem planning
addresses the following items.
v Learning how the Hardware Management Console works in a cluster
Learning about Network Installation Management (NIM) servers (AIX) and distribution servers
(Linux)
v “Planning your Systems Management application” on page 55
v
v “Planning for QLogic fabric management applications” on page 56
v “Planning for fabric management server” on page 64
v “Planning event monitoring with QLogic and management server” on page 66
v “Planning to run remote commands with QLogic from the management server” on page 67
7. When you understand the devices in your cluster, review “Frame planning” on page 68, to ensure
that you have properly planned where to put devices in your cluster.
8. After you understand the basic concepts for planning the cluster, review the high-level installation
flow information in “Planning installation flow” on page 68. There are hints about planning the
installation, and also guidelines to help you to coordinate between you and the IBM Service
Representative responsibilities and vendor responsibilities.
9. Consider special circumstances such as whether you are configuring a cluster for high-performance
computing (HPC) message passing interface (MPI) applications. For more information, see “Planning
for an HPC MPI configuration” on page 74.
High-performance computing clusters using InfiniBand hardware
27
10. For some more hints and tips on installation planning, see “Planning aids” on page 75.
If you have completed all the previous steps, you can plan in more detail by using the planning
worksheets provided in “Planning worksheets” on page 76.
When you are ready to install the components with which you plan to build your cluster, review
information in readme files and online information related to the software and firmware. This
information ensures that you have the latest information and the latest supported levels of firmware.
If this is the first time you have read the planning overview and you understand the overall intent of the
planning tasks, go back to the beginning and start accessing the links and cross-references to get further
details.
The Planning Overview ends here.
Required level of support, firmware, and devices
Use this information to find the minimum requirements necessary to support InfiniBand network
clustering.
The following tables list the minimum requirements necessary to support InfiniBand network clustering.
Note: For the most recent updates to this information, see the Facts and features report website
(http://www.ibm.com/servers/eserver/clusters/hardware/factsfeatures.html).
Table 26 lists the model or feature that must support the given device.
Table 26. Verified and approved hardware associated with a POWER6 processor-based IBM System p or IBM Power
Systems server cluster with an InfiniBand network
Device
Model or feature
Servers
POWER6
v IBM Power 520 Express (8203-E4A) (4U rack-mounted server)
v IBM Power 550 Express (8204-E8A) (4U rack-mounted server)
v IBM Power 575 (9125-F2A)
v IBM 8236 System p 755 4U rack-mount servers (8236-E4A)
Switches
IBM models (QLogic models)
v QLogic 9024CU Managed 24-port DDR InfiniBand Switch
v QLogic 9040 48-port DDR InfiniBand Switch
v QLogic 9120 144-port DDR InfiniBand Switch
v QLogic 9240 288-port DDR InfiniBand Switch
v There is no IBM equivalent to the QLogic 9080
Host channel adapters
(HCAs)
The feature code is dependent on the server you have. Order one or more InfiniBand GX,
dual-port HCA for each server that requires connectivity to InfiniBand networks. The
maximum number of HCAs permitted depends on the server model.
Fabric management
server
IBM System x 3550 or 3650
QLogic HCAs
Note:
v High-performance computing (HPC) proven and validated to work in an IBM HPC cluster.
v For approved IBM System p POWER6 and IBM eServer™ p5InfiniBand configurations, see Facts and features
report website (http://www.ibm.com/servers/eserver/clusters/hardware/factsfeatures.html).
28
Power Systems: High performance clustering
Table 27 lists the minimum levels of software and firmware that are associated with an InfiniBand cluster.
Table 27. Minimum levels of software and firmware associated with an InfiniBand cluster
Software
Minimum level
AIX
AIX 5L(TM) AIX 5L Version 5.3 with the 5300-12 Technology Level
with Service Pack 1
AIX 6L(TM) AIX 6L Version 6.1 with the 6100-03 Technology Level
with Service Pack 1
Red Hat 5.3
Red Hat 5.3 ppc kernel-2.6.18-128.1.6.el5.ppc64
Hardware Management Console
POWER6 V7R3.5.0M0 HMC with fixes MH01194, MH01197, MH01204,
and V7R3.5.0M1 HMC with MH01212 (HMC build level: 20100301.1)
POWER7 V7R7.1.1 HMC with Fix pack AL710_03
QLogic switch firmware
QLogic 4.2.5.0.1
QLogic InfiniBand Fabric Suite (including
the HSM, Fast Fabric Toolset, and
QLogic-OFED stack)
QLogic 5.1.0.0.49
For the most recent support information, see the IBM Clusters with the InfiniBand Switch website.
Required Level of support, firmware, and devices that must support HPC cluster with an InfiniBand network
ends here.
Server planning
This information provides server planning requirements that are relative to the fabric.
Server planning relative to the fabric requires decisions on the following items.
v The number of each type of server you require.
v The type of operating systems running on each server.
v The number and type of host channel adapters (HCAs) that are required in each server.
v Which types of HCAs are required in each server.
v The IP addresses that are needed for the InfiniBand network. For details, see “IP subnet addressing
restriction with RSCT” on page 53.
v The IP addresses that are needed for the service virtual local area network (VLAN) for service
processor access from the xCAT and the Hardware Management Console (HMC)
v The IP addresses for the cluster VLAN to permit operating system access from xCAT
v Which partition assumes service authority. At least, one active partition per server must have the
service authority policy enabled. If multiple active partitions are configured with service authority
enabled, the first one up assumes the authority.
Note: Logical partitioning is not done in high-performance computing (HPC) clusters.
Along with server planning documentation, you can use the “Server planning worksheet” on page 81 as
a planning aid. You can also review server installation documentation to help plan for the installation.
When you have identified the frames in which you plan to place your servers, record the information in
the “Frame and rack planning worksheet” on page 79.
Server types
This information uses the term “server type” to describe the main function that a server is intended to
accomplish.
High-performance computing clusters using InfiniBand hardware
29
Server planning relative to the fabric requires decisions on the following items.
Table 28. Server Types in an HPC cluster
Type
Description
Typical models
Compute
Compute servers primarily perform
computation and the main work of
applications.
9125-F2A, 8236-E8C
Storage
Storage servers provide connectivity 8203-E4A, 8204-E8A, 9125-F2A,
between the InfiniBand fabric and the 8236-E8C
storage devices. This connectivity is a
key part of the GPFS™ subsystem in
the cluster.
IO Router
IO Router servers provide a bridge
for moving data between separate
networks of servers.
9125-F2A, 8236-E8C
Login
Login servers are used to
authenticate users into the cluster. In
order for Login servers to be part of
the GPFS subsystem, they must have
the same number of connections to
the InfiniBand subnets and IP
subnets that are used by the GPFS
subsystem.
Any model
The typical cluster would have compute servers and login nodes. The need for storage servers varies
depending on the application, the wanted performance, and the total size of the cluster. Generally, HPC
clusters with large numbers of servers and strict performance requirements use storage nodes to avoid
contention for compute resource. This setup is especially important for applications that can be easily
affected by the degraded or variable performance of a single server in the cluster.
The use of IO router servers is not typical. There have been examples of clusters where the compute
servers were placed on an entirely different fabric from the storage servers. In these cases, dedicated IO
router servers are used to move the data between the compute and storage fabrics.
For details on how these various server types might be used in fabric, see “Planning InfiniBand network
cabling and configuration.”
Planning InfiniBand network cabling and configuration
Before you plan your InfiniBand network cabling, review the hardware installation and cabling
information for your vendor switch.
See the QLogic documentation referenced in “Cluster information resources” on page 2.
There are several major points in planning network cabling:
v See “Topology planning”
v See “Cable planning” on page 48
v See “Planning QLogic or IBM Machine Type InfiniBand switch configuration” on page 49
v See “Planning an IBM GX HCA configuration” on page 53
Topology planning
This information provides topology planning details.
The following are important considerations for planning the topology of the fabric:
30
Power Systems: High performance clustering
The types and numbers of servers. See “Server planning” on page 29 and “Server types” on page 29
The number of HCA connections in the servers
The number of InfiniBand subnets
The size and number of switches in each InfiniBand subnet. Do not confuse InfiniBand subnets with
IP subnets. In the context of this topology planning section, unless otherwise noted, the term subnet
refers to an InfiniBand subnet.
5. Planning of the topology with a consistent cabling pattern helps you to determine which server HCA
ports are connected to which switch ports by knowing one side or the other.
1.
2.
3.
4.
If you are planning for a topology that exceeds the generally available topology of 64 servers with up to
eight subnets, contact IBM to help with planning the cluster. The rest of this sub-section contains
information that ID helpful in that planning, but it is not intended to cover all possibilities.
The required performance drives the types and models of servers and number of HCA connections per
server.
The size and number of switches in each subnet is driven by the total number of HCA connections,
required availability, and cost considerations. For example, if there are (64) 9125-F2A each with 8 HCA
connections, it is possible to connect them together with (8) 96 port switches, or (4) 144 port switches, or
(2) 288 port switches. The typical recommendation is to choose have either a separate subnet for each
9125-F2A HCA connection, or a subnet for every two 9125-F2A HCA connections. Therefore, the topology
for the example, would either use (8) 96 port switches, or (4) 144 port switches.
While it is desirable to have balanced fabrics where each subnet has the same number of HCA
connections and are connected in a similar manner to each server. This type of connection is not always
possible. For example, the 9125-F2A has up to 8 HCA connections and the 8203-E4A only has two HCA
connections. If the required topology has eight subnets, at most only two of the subnets would have
HCA connections from any given 8203-E4A. While it is possible that with multiple 8203-E4A servers, one
can construct a topology which evenly distributes them among InfiniBand subnets, one must also
consider how IP subnetting factors into such a topology choice.
Most configurations are first concerned with the choice of compute servers, and then the storage servers
are chosen to support the compute servers. Finally, a group of servers are chosen to be login servers.
If the main compute server model is a 9125-F2A consider the following points:
v While the maximum number of 9125-F2A servers that can be populated in a frame is 14, it is preferred
to consider the fact that there are 12 ports on a leaf, and therefore, if you populate up to 12 servers in a
frame, you can easily connect a frame of servers to a switch leaf. In this case, the servers in frame one
would connect such that the server lowest in the frame (node 1) attaches to the first port of a leaf, and
others, until you reach the final server in the frame (node 12), which attaches to port 12 of the leaf. As
a topology grows in size, this can become valuable for speed and accuracy of cabling during
installation and for later interpretation of link errors. For example, if you know that each leaf maps to
a frame of servers and each port on the leaf maps to a given server within a frame, you can quickly
determine that a problem associated with port 3 on leaf 5 is on the link connected to server 3 in frame
5.
v If you have more than 12 9125-F2A servers in a frame, consider a different method of mapping server
connections to leafs. For example, you might want to group the corresponding HCA port connections
for each frame onto the same leaf instead of mapping all of the connections for subnet from a frame
onto a single leaf. For example, the first HCA ports in the first nodes in all of the frames would
connect to leaf 1.
v If you have a mixture of frames with more than 12 9125-F2A servers in a frame and frames with 12
9125-F2A servers, consider first connecting the frames with 12 servers to the lower numbered leaf
modules and then connecting the remaining frames with more than 12 9125-F2A servers to higher
High-performance computing clusters using InfiniBand hardware
31
v
v
v
v
numbered leaf modules. Finally, if there are frames with fewer than 12 nodes try to connect them such
that the servers in the same frame are all connected to the same leaf.
If you only require 4 HCA connections from the servers, for increased availability, you might want to
distribute them across two HCA cards and use only every other port on each card. This protects from
card failure and from chip failure, where each HCA card's four ports are implemented using two chips
each with two ports.
If the number of InfiniBand subnets equals the number of HCA connections available in a 9125, then a
regular pattern of mapping from an instance of an HCA connector to a particular switch connector
should be maintained, and the corresponding HCA connections between servers must always attach to
the same InfiniBand subnet.
If multiple HCA connections from a 9125-F2A connects to multiple ports in the same switch chassis, if
possible, be sure that they connect to different leafs. It is preferred that you divide the switch chassis in
half or into quadrants and define particular sets of leafs to connect to particular HCA connections in a
frame such that there is a consistency across the entire fabric and cluster. The corresponding HCA
connections between servers must always attach to the same InfiniBand subnet.
When planning your connections, keep a consistent pattern of server in frame and HCA connection in
frame to InfiniBand subnet and switch connector.
If the main compute server model is a System p blade, consider the following points:
v The maximum number of HCA connections per blade is 2.
v Blade expansion HCAs connect to the physical fabric through a Pass-through module.
v Blade-based topologies would typically have two subnets. This topology provides the best possible
availability given the limitation of 2 HCA connections per blade.
v If storage nodes are to be used, then the compute servers must connect to all of the same InfiniBand
subnets and IP subnets to which the storage servers connect so that they might participate in the GPFS
subsystem.
For storage servers, consider the following points:
v The total bandwidth required for each server.
v If 8203-E4As or 8204-E8As or 8236-E8C are to be used for storage servers, they only have 2 HCA
connections, so the design for communication between the storage servers and compute servers must
take this into account. It is typically to choose two subnets that would be used for storage traffic.
v If 8203-E4As or 8204-E8As or 8236-E8C are used as storage servers, they are not to be used as compute
servers, too, because the IBM MPI is not supported on them.
v If possible distribute the storage servers across as many leafs as possible to minimize traffic congestion
at a few leafs.
For login servers, consider the following points:
In order to participate in the GPFS subsystem, the number of InfiniBand and IP subnets to which the
login servers are connected must be the same number to which storage servers. If no storage servers are
implemented, then this statement applies to compute servers. For example:
v If 8203-E4As or 8204-E8As or 8236-E8C or System p blades are used for storage servers, and there are
two InfiniBand interfaces connected to two InfiniBand subnets comprising two IP subnets to be used
for the GPFS subsystem, then the login servers must connect to both InfiniBand subnets and IP
subnets.
v If 9125-F2As are to be used for storage servers, and there are 8 InfiniBand interfaces connected to 8
InfiniBand subnets comprising 8 IP subnets to be used for the GPFS subsystem, then the login servers
must be 9125-F2A servers and they must connect to all 8 InfiniBand and IP subnets.
For IO router servers, consider the following points:
32
Power Systems: High performance clustering
IO servers require enough fabric connectivity to ensure enough bandwidth between fabrics. Previous
implementations using IO servers have used the 9125-F2A to permit for up to four connections to one
fabric and four connections to another.
Example configurations using only 9125-F2A servers:
This information provides possible configurations using only 9125-F2A servers details.
The following tables are provided to illustrate possible configurations using only 9125-F2A servers. Not
every connection is illustrated, but there are enough to understand the pattern.
The following tables illustrate the connections from HCAs to switches in a configuration with only
9125-F2A servers that have eight HCA connections going to eight InfiniBand subnets. Whether the servers
are used for compute or storage does not matter for these purposes. The first table illustrates cabling 12
servers in a single frame with eight 7874-024 switch. The second table illustrates cabling 240 servers in 20
frames to eight 7874-240 switches.
Table 29. Example topology -> (12) 9125-F2As in 1 frame with 8 HCA connections
Frame
Server
HCA
Connector
Switch
Connector1
1
1
1 (C65)
T1
1
C1
1
1
1 (C65)
T2
2
C1
1
1
1 (C65)
T3
3
C1
1
1
1 (C65)
T4
4
C1
1
1
2 (C66)
T1
5
C1
1
1
2 (C66)
T2
6
C1
1
1
2 (C66)
T3
7
C1
1
1
2 (C66)
T4
8
C1
1
2
1 (C65)
T1
1
C2
1
2
1 (C65)
T2
2
C2
1
2
1 (C65)
T3
3
C2
1
2
1 (C65)
T4
4
C2
1
2
2 (C66)
T1
5
C2
1
2
2 (C66)
T2
6
C2
1
2
2 (C66)
T3
7
C2
1
2
2 (C66)
T4
8
C2
Continue through to the last server in the frame
1
12
1 (C65)
T1
1
C12
1
12
1 (C65)
T2
2
C12
1
12
1 (C65)
T3
3
C12
1
12
1 (C65)
T4
4
C12
1
12
2 (C66)
T1
5
C12
1
12
2 (C66)
T2
6
C12
1
12
2 (C66)
T3
7
C12
1
12
2 (C66)
T4
8
C12
1
Connector terminology: 7874-024: C# = connector number
High-performance computing clusters using InfiniBand hardware
33
The following example has (240) 9125-F2As in 10 frames with 8 HCA connections in 8 InfiniBand subnets.
You can calculate connections as shown in the following example:
Leaf number = frame number
Leaf connector number = Server number in frame
Server number = Leaf connector number
Frame number = Frame number
HCA number = C(65+(Integer(switch-1)/4))
HCA port = Remainder of ((switch – 1)/4)) + 1
Table 30. Example topology -> (240) 9125-F2As in 20 frames with 8 HCA connections in 8 InfiniBand subnets
Frame
Server
HCA
Connector
Switch
Connector
1
1
1 (C65)
T1
1
L1-C1
1
1
1 (C65)
T2
2
L1-C1
1
1
1 (C65)
T3
3
L1-C1
1
1
1 (C65)
T4
4
L1-C1
1
1
2 (C66)
T1
5
L1-C1
1
1
2 (C66)
T2
6
L1-C1
1
1
2 (C66)
T3
7
L1-C1
1
1
2 (C66)
T4
8
L1-C1
1
2
1 (C65)
T1
1
L1-C2
1
2
1 (C65)
T2
2
L1-C2
1
2
1 (C65)
T3
3
L1-C2
1
2
1 (C65)
T4
4
L1-C2
1
2
2 (C66)
T1
5
L1-C2
1
2
2 (C66)
T2
6
L1-C2
1
2
2 (C66)
T3
7
L1-C2
1
2
2 (C66)
T4
8
L1-C2
Continue through to the last server in the frame
1
12
1 (C65)
T1
1
L1-C12
1
12
1 (C65)
T2
2
L1-C12
1
12
1 (C65)
T3
3
L1-C12
1
12
1 (C65)
T4
4
L1-C12
1
12
2 (C66)
T1
5
L1-C12
1
12
2 (C66)
T2
6
L1-C12
1
12
2 (C66)
T3
7
L1-C12
1
12
2 (C66)
T4
8
L1-C12
2
1
1 (C65)
T1
1
L2-C1
2
1
1 (C65)
T2
2
L2-C1
2
1
1 (C65)
T3
3
L2-C1
2
1
1 (C65)
T4
4
L2-C1
2
1
2 (C66)
T1
5
L2-C1
2
1
2 (C66)
T2
6
L2-C1
2
1
2 (C66)
T3
7
L2-C1
34
Power Systems: High performance clustering
2
Table 30. Example topology -> (240) 9125-F2As in 20 frames with 8 HCA connections in 8 InfiniBand
subnets (continued)
Frame
Server
HCA
Connector
Switch
Connector
2
1
2 (C66)
T4
8
L2-C1
2
2
1 (C65)
T1
1
L2-C2
2
2
1 (C65)
T2
2
L2-C2
2
2
1 (C65)
T3
3
L2-C2
2
2
1 (C65)
T4
4
L2-C2
2
2
2 (C66)
T1
5
L2-C2
2
2
2 (C66)
T2
6
L2-C2
2
2
2 (C66)
T3
7
L2-C2
2
2
2 (C66)
T4
8
L2-C2
2
Continue through to the last server in the frame
2
12
1 (C65)
T1
1
L2-C12
2
12
1 (C65)
T2
2
L2-C12
2
12
1 (C65)
T3
3
L2-C12
2
12
1 (C65)
T4
4
L2-C12
2
12
2 (C66)
T1
5
L2-C12
2
12
2 (C66)
T2
6
L2-C12
2
12
2 (C66)
T3
7
L2-C12
2
12
2 (C66)
T4
8
L2-C12
Continue through to the last frame
20
1
1 (C65)
T1
1
L20-C1
20
1
1 (C65)
T2
2
L20-C1
20
1
1 (C65)
T3
3
L20-C1
20
1
1 (C65)
T4
4
L20-C1
20
1
2 (C66)
T1
5
L20-C1
20
1
2 (C66)
T2
6
L20-C1
20
1
2 (C66)
T3
7
L20-C1
20
1
2 (C66)
T4
8
L20-C1
20
2
1 (C65)
T1
1
L20-C2
20
2
1 (C65)
T2
2
L20-C2
20
2
1 (C65)
T3
3
L20-C2
20
2
1 (C65)
T4
4
L20-C2
20
2
2 (C66)
T1
5
L20-C2
20
2
2 (C66)
T2
6
L20-C2
20
2
2 (C66)
T3
7
L20-C2
20
2
2 (C66)
T4
8
L20-C2
Continue through to the last server in the frame
20
12
1 (C65)
T1
1
L20-C12
20
12
1 (C65)
T2
2
L20-C12
20
12
1 (C65)
T3
3
L20-C12
High-performance computing clusters using InfiniBand hardware
35
Table 30. Example topology -> (240) 9125-F2As in 20 frames with 8 HCA connections in 8 InfiniBand
subnets (continued)
Frame
Server
HCA
Connector
Switch
Connector
20
12
1 (C65)
T4
4
L20-C12
20
12
2 (C66)
T1
5
L20-C12
20
12
2 (C66)
T2
6
L20-C12
20
12
2 (C66)
T3
7
L20-C12
20
12
2 (C66)
T4
8
L20-C12
Fabric management server 13
1
Port 1
1
L21-C1
Fabric management server 1
1
Port 2
2
L21-C1
Fabric management server 1
2
Port 1
3
L21-C1
Fabric management server 1
2
Port 2
4
L21-C1
Fabric management server 2
1
Port 1
5
L21-C1
Fabric management server 2
1
Port 2
6
L21-C1
Fabric management server 2
2
Port 1
7
L21-C1
Fabric management server 2
2
Port 2
8
L21-C1
Fabric management server 3
1
Port 1
1
L22-C1
Fabric management server 3
1
Port 2
2
L22-C1
Fabric management server 3
2
Port 1
3
L22-C1
Fabric management server 3
2
Port 2
4
L22-C1
Fabric management server 4
1
Port 1
5
L22-C1
Fabric management server 4
1
Port 2
6
L22-C1
Fabric management server 4
2
Port 1
7
L22-C1
Fabric management server 4
2
Port 2
8
L22-C1
2
2
Connector terminology -> LxCx = Leaf # Connector #
3
There are backup fabric management server in this example. For maximum availability, the backup is
connected to a different leaf from the primary.
The following is an example of a cluster with (120) 9125-F2As in 10 frames with 8 HCA connections each,
but with only 4 InfiniBand subnets. It uses 7874-240 switches where the first HCA in a server is
connected to leafs in the lower hemisphere. And the second HCA in a server is connected to leafs in the
upper hemisphere. Some leafs are left unpopulated.
You can calculate connections as shown in the following example:
Leaf number = frame number
Leaf connector number = Server number in frame; add 12 if HCA is C66
Server number = Leaf connector number; subtract 12 if leaf > 12
Frame number = Frame number
HCA number = C65 for switch 1,2; C66 for switch 3,4
HCA port = (Remainder of ((switch – 1)/4)) + 1
Table 31. Example topology -> (120) 9125-F2As in 10 frames with 8 HCA connections in 4 InfiniBand subnets
Frame
Server
HCA
Connector
Switch
Connector
1
1
1 (C65)
T1
1
L1-C1
36
Power Systems: High performance clustering
4
Table 31. Example topology -> (120) 9125-F2As in 10 frames with 8 HCA connections in 4 InfiniBand
subnets (continued)
Frame
Server
HCA
Connector
Switch
Connector
1
1
1 (C65)
T2
2
L1-C1
1
1
1 (C65)
T3
3
L1-C1
1
1
1 (C65)
T4
4
L1-C1
1
1
2 (C66)
T1
1
L13-C1
1
1
2 (C66)
T2
2
L13-C1
1
1
2 (C66)
T3
3
L13-C1
1
1
2 (C66)
T4
4
L13-C1
1
2
1 (C65)
T1
1
L1-C2
1
2
1 (C65)
T2
2
L1-C2
1
2
1 (C65)
T3
3
L1-C2
1
2
1 (C65)
T4
4
L1-C2
1
2
2 (C66)
T1
1
L13-C2
1
2
2 (C66)
T2
2
L13-C2
1
2
2 (C66)
T3
3
L13-C2
1
2
2 (C66)
T4
4
L13-C2
4
Continue through to the last server in the frame
1
12
1 (C65)
T1
1
L1-C12
1
12
1 (C65)
T2
2
L1-C12
1
12
1 (C65)
T3
3
L1-C12
1
12
1 (C65)
T4
4
L1-C12
1
12
2 (C66)
T1
1
L13-C12
1
12
2 (C66)
T2
2
L13-C12
1
12
2 (C66)
T3
3
L13-C12
1
12
2 (C66)
T4
4
L13-C12
2
1
1 (C65)
T1
1
L2-C1
2
1
1 (C65)
T2
2
L2-C1
2
1
1 (C65)
T3
3
L2-C1
2
1
1 (C65)
T4
4
L2-C1
2
1
2 (C66)
T1
1
L14-C1
2
1
2 (C66)
T2
2
L14-C1
2
1
2 (C66)
T3
3
L14-C1
2
1
2 (C66)
T4
4
L14-C1
2
2
1 (C65)
T1
1
L2-C2
2
2
1 (C65)
T2
2
L2-C2
2
2
1 (C65)
T3
3
L2-C2
2
2
1 (C65)
T4
4
L2-C2
2
2
2 (C66)
T1
1
L14-C2
2
2
2 (C66)
T2
2
L14-C2
High-performance computing clusters using InfiniBand hardware
37
Table 31. Example topology -> (120) 9125-F2As in 10 frames with 8 HCA connections in 4 InfiniBand
subnets (continued)
Frame
Server
HCA
Connector
Switch
Connector
2
2
2 (C66)
T3
3
L14-C2
2
2
2 (C66)
T4
4
L14-C2
Continue through to the last server in the frame
2
12
1 (C65)
T1
1
L2-C12
2
12
1 (C65)
T2
2
L2-C12
2
12
1 (C65)
T3
3
L2-C12
2
12
1 (C65)
T4
4
L2-C12
2
12
2 (C66)
T1
1
L14-C12
2
12
2 (C66)
T2
2
L14-C12
2
12
2 (C66)
T3
3
L14-C12
2
12
2 (C66)
T4
4
L14-C12
Continue through to the last frame
10
1
1 (C65)
T1
1
L10-C1
10
1
1 (C65)
T2
2
L10-C1
10
1
1 (C65)
T3
3
L10-C1
10
1
1 (C65)
T4
4
L10-C1
10
1
2 (C66)
T1
1
L22-C1
10
1
2 (C66)
T2
2
L22-C1
10
1
2 (C66)
T3
3
L22-C1
10
1
2 (C66)
T4
4
L22-C1
10
2
1 (C65)
T1
1
L10-C2
10
2
1 (C65)
T2
2
L10-C2
10
2
1 (C65)
T3
3
L10-C2
10
2
1 (C65)
T4
4
L10-C2
10
2
2 (C66)
T1
1
L22-C2
10
2
2 (C66)
T2
2
L22-C2
10
2
2 (C66)
T3
3
L22-C2
10
2
2 (C66)
T4
4
L22-C2
Continue through to the last server in the frame
10
12
1 (C65)
T1
1
L10-C12
10
12
1 (C65)
T2
2
L10-C12
10
12
1 (C65)
T3
3
L10-C12
10
12
1 (C65)
T4
4
L10-C12
10
12
2 (C66)
T1
1
L22-C12
10
12
2 (C66)
T2
2
L22-C12
10
12
2 (C66)
T3
3
L22-C12
10
12
2 (C66)
T4
4
L22-C12
1
Port 1
1
L11-C1
Fabric management server 15
38
Power Systems: High performance clustering
4
Table 31. Example topology -> (120) 9125-F2As in 10 frames with 8 HCA connections in 4 InfiniBand
subnets (continued)
Frame
HCA
Connector
Switch
Connector
Fabric management server 1
1
Port 2
2
L11-C1
Fabric management server 1
2
Port 1
3
L11-C1
Fabric management server 1
2
Port 2
4
L11-C1
Fabric management server 2
1
Port 1
1
L21-C1
Fabric management server 2
1
Port 2
2
L21-C1
Fabric management server 2
2
Port 1
3
L21-C1
Fabric management server 2
2
Port 2
4
L21-C1
4
Server
4
Connector terminology -> LxCx = Leaf # Connector #
5
There are backup fabric management server in this example. For maximum availability, the backup is
connected to a different leaf from the primary.
The following is an example of a cluster with (120) 9125-F2As in 10 frames with 4 HCA connections each,
but with only 4 InfiniBand subnets. It uses 7874-120 switches. There are two HCA cards in each server.
Only every other HCA connector is used. This setup provides maximum availability in that it permits for
a single HCA card to fail completely and have another working HCA card in a server.
You can calculate connections as shown in the following example:
Leaf number = Frame number
Leaf connector number = Server number in frame
Server number = Leaf connector number
Frame number = Leaf number
HCA number = C65 for switch 1,2; C66 for switch 3,4
HCA port = T1 for switch 1,3; T3 for switch 2,4
Table 32. Example topology -> (120) 9125-F2As in 10 frames with 4 HCA connections in 4 InfiniBand subnets
Frame
Server
HCA
Connector
Switch
Connector
1
1
1 (C65)
T1
1
L1-C1
1
1
1 (C65)
T3
2
L1-C1
1
1
2 (C66)
T1
3
L1-C1
1
1
2 (C66)
T3
4
L1-C1
1
2
1 (C65)
T1
1
L1-C2
1
2
1 (C65)
T3
2
L1-C2
1
2
2 (C66)
T1
3
L1-C2
1
2
2 (C66)
T3
4
L1-C2
6
Continue through to the last server in the frame
1
12
1 (C65)
T1
1
L1-C12
1
12
1 (C65)
T3
2
L1-C12
1
12
2 (C66)
T1
3
L1-C12
1
12
2 (C66)
T3
4
L1-C12
2
1
1 (C65)
T1
1
L2-C1
2
1
1 (C65)
T3
2
L2-C1
High-performance computing clusters using InfiniBand hardware
39
Table 32. Example topology -> (120) 9125-F2As in 10 frames with 4 HCA connections in 4 InfiniBand
subnets (continued)
Frame
Server
HCA
Connector
Switch
Connector
2
1
2 (C66)
T1
3
L2-C1
2
1
2 (C66)
T3
4
L2-C1
2
2
1 (C65)
T1
1
L2-C2
2
2
1 (C65)
T3
2
L2-C2
2
2
2 (C66)
T1
3
L2-C2
2
2
2 (C66)
T3
4
L2-C2
6
Continue through to the last server in the frame
2
12
1 (C65)
T1
1
L2-C12
2
12
1 (C65)
T3
2
L2-C12
2
12
2 (C66)
T1
3
L2-C12
2
12
2 (C66)
T3
4
L2-C12
Continue through to the last frame
10
1
1 (C65)
T1
1
L10-C1
10
1
1 (C65)
T3
2
L10-C1
10
1
2 (C66)
T1
3
L10-C1
10
1
2 (C66)
T3
4
L10-C1
10
2
1 (C65)
T1
1
L10-C2
10
2
1 (C65)
T3
2
L10-C2
10
2
2 (C66)
T1
3
L10-C2
10
2
2 (C66)
T3
4
L10-C2
Continue through to the last server in the frame
10
12
1 (C65)
T1
1
L10-C12
10
12
1 (C65)
T3
2
L10-C12
10
12
2 (C66)
T1
3
L10-C12
10
12
2 (C66)
T3
4
L10-C12
Fabric management server 17
1
Port 1
1
L11-C1
Fabric management server 1
1
Port 2
2
L11-C1
Fabric management server 1
2
Port 1
3
L11-C1
Fabric management server 1
2
Port 2
4
L11-C1
Fabric management server 2
1
Port 1
1
L12-C1
Fabric management server 2
1
Port 2
2
L12-C1
Fabric management server 2
2
Port 1
3
L12-C1
Fabric management server 2
2
Port 2
4
L12-C1
6
Connector terminology -> LxCx = Leaf # Connector #
7
There are backup fabric management server in this example. For maximum availability, the backup is
connected to a different leaf from the primary
40
Power Systems: High performance clustering
The following is an example of (140) 9125-F2As in 10 frames connected to eight subnets. This requires 14
servers in a frame and therefore a slightly different mapping of leaf to server is used instead of frame to
leaf as in the previous examples.
You can calculate connections as shown in the following example:
Leaf number = server number in frame
Leaf connector number = frame number
Server number = Leaf number
Frame number = Leaf connector number
HCA number = C65 for switch 1-4; C66 for switch 5-8
HCA port = (Remainder of ((switch – 1)/4)) + 1
Table 33. Example topology -> (140) 9125-F2As in 10 frames with 8 HCA connections in 8 InfiniBand subnets
Frame
Server
HCA
Connector
Switch
Connector
1
1
1 (C65)
T1
1
L1-C1
1
1
1 (C65)
T2
2
L1-C1
1
1
1 (C65)
T3
3
L1-C1
1
1
1 (C65)
T4
4
L1-C1
1
1
2 (C66)
T1
5
L1-C1
1
1
2 (C66)
T2
6
L1-C1
1
1
2 (C66)
T3
7
L1-C1
1
1
2 (C66)
T4
8
L1-C1
1
2
1 (C65)
T1
1
L2-C1
1
2
1 (C65)
T2
2
L2-C1
1
2
1 (C65)
T3
3
L2-C1
1
2
1 (C65)
T4
4
L2-C1
1
2
2 (C66)
T1
5
L2-C1
1
2
2 (C66)
T2
6
L2-C1
1
2
2 (C66)
T3
7
L2-C1
1
2
2 (C66)
T4
8
L2-C1
8
Continue through to the last server in the frame
1
12
1 (C65)
T1
1
L12-C1
1
12
1 (C65)
T2
2
L12-C1
1
12
1 (C65)
T3
3
L12-C1
1
12
1 (C65)
T4
4
L12-C1
1
12
2 (C66)
T1
5
L12-C1
1
12
2 (C66)
T2
6
L12-C1
1
12
2 (C66)
T3
7
L12-C1
1
12
2 (C66)
T4
8
L12-C1
2
1
1 (C65)
T1
1
L1-C2
2
1
1 (C65)
T2
2
L1-C2
2
1
1 (C65)
T3
3
L1-C2
2
1
1 (C65)
T4
4
L1-C2
2
1
2 (C66)
T1
5
L1-C2
2
1
2 (C66)
T2
6
L1-C2
High-performance computing clusters using InfiniBand hardware
41
Table 33. Example topology -> (140) 9125-F2As in 10 frames with 8 HCA connections in 8 InfiniBand
subnets (continued)
Frame
Server
HCA
Connector
Switch
Connector
2
1
2 (C66)
T3
7
L1-C2
2
1
2 (C66)
T4
8
L1-C2
2
2
1 (C65)
T1
1
L2-C2
2
2
1 (C65)
T2
2
L2-C2
2
2
1 (C65)
T3
3
L2-C2
2
2
1 (C65)
T4
4
L2-C2
2
2
2 (C66)
T1
5
L2-C2
2
2
2 (C66)
T2
6
L2-C2
2
2
2 (C66)
T3
7
L2-C2
2
2
2 (C66)
T4
8
L2-C2
Continue through to the last server in the frame
2
12
1 (C65)
T1
1
L12-C2
2
12
1 (C65)
T2
2
L12-C2
2
12
1 (C65)
T3
3
L12-C2
2
12
1 (C65)
T4
4
L12-C2
2
12
2 (C66)
T1
5
L12-C2
2
12
2 (C66)
T2
6
L12-C2
2
12
2 (C66)
T3
7
L12-C2
2
12
2 (C66)
T4
8
L12-C2
Continue through to the last frame
10
1
1 (C65)
T1
1
L1-C10
10
1
1 (C65)
T2
2
L1-C10
10
1
1 (C65)
T3
3
L1-C10
10
1
1 (C65)
T4
4
L1-C10
10
1
2 (C66)
T1
5
L1-C10
10
1
2 (C66)
T2
6
L1-C10
10
1
2 (C66)
T3
7
L1-C10
10
1
2 (C66)
T4
8
L1-C10
10
2
1 (C65)
T1
1
L2-C10
10
2
1 (C65)
T2
2
L2-C10
10
2
1 (C65)
T3
3
L2-C10
10
2
1 (C65)
T4
4
L2-C10
10
2
2 (C66)
T1
5
L2-C10
10
2
2 (C66)
T2
6
L2-C10
10
2
2 (C66)
T3
7
L2-C10
10
2
2 (C66)
T4
8
L2-C10
Continue through to the last server in the frame
10
12
1 (C65)
T1
1
L10-C10
10
12
1 (C65)
T2
2
L10-C10
42
Power Systems: High performance clustering
8
Table 33. Example topology -> (140) 9125-F2As in 10 frames with 8 HCA connections in 8 InfiniBand
subnets (continued)
Frame
Server
HCA
Connector
Switch
Connector
10
12
1 (C65)
T3
3
L10-C10
10
12
1 (C65)
T4
4
L10-C10
10
12
2 (C66)
T1
5
L10-C10
10
12
2 (C66)
T2
6
L10-C10
10
12
2 (C66)
T3
7
L10-C10
10
12
2 (C66)
T4
8
L10-C10
Fabric management server 19
1
Port 1
1
L21-C1
Fabric management server 1
1
Port 2
2
L21-C1
Fabric management server 1
2
Port 1
3
L21-C1
Fabric management server 1
2
Port 2
4
L21-C1
Fabric management server 2
1
Port 1
5
L21-C1
Fabric management server 2
1
Port 2
6
L21-C1
Fabric management server 2
2
Port 1
7
L21-C1
Fabric management server 2
2
Port 2
8
L21-C1
Fabric management server 3
1
Port 1
1
L22-C1
Fabric management server 3
1
Port 2
2
L22-C1
Fabric management server 3
2
Port 1
3
L22-C1
Fabric management server 3
2
Port 2
4
L22-C1
Fabric management server 4
1
Port 1
5
L22-C1
Fabric management server 4
1
Port 2
6
L22-C1
Fabric management server 4
2
Port 1
7
L22-C1
Fabric management server 4
2
Port 2
8
L22-C1
8
8
Connector terminology -> LxCx = Leaf # Connector #
9
There are backup fabric management server in this example. For maximum availability, the backup is
connected to a different leaf from the primary.
Example configurations: 9125-F2A compute servers and 8203-E4Astorage servers:
This information provides possible configurations using only 9125-F2A compute servers and
8203-E4Astorage servers.
The most significant difference between the examples in “Example configurations using only 9125-F2A
servers” on page 33, and this example is that there are more InfiniBand subnets than an 8203-E4A can
support. In this case, the 8203-E4As connect only to two of the InfiniBand subnets.
The following is an example of (140) 9125-F2A compute servers in 10 frames connected to eight subnets
along with (8) 8203-E4A storage servers. This setup requires (14) 9125-F2A servers in a frame. The
advantage to this topology over one with (12) 9125-F2A servers in a frame is that there is still an easily
understood mapping of connections. Moreover, you can distribute the 8203-E4A storage servers over
multiple leafs to minimize the probability of congestion for traffic to/from the storage servers. Frame 11
contains the 8203-E4A servers.
High-performance computing clusters using InfiniBand hardware
43
You can calculate connections as shown in the following example:
Leaf number = server number in frame
Leaf connector number = frame number
Server number = Leaf number
Frame number = Leaf connector number
HCA number = For 9125-F2A -> C65 for switch 1-4; C66 for switch 5-8
HCA port = (Remainder of ((switch – 1)/4)) + 1
Table 34. Example topology -> (140) 9125-F2As in 10 frames with 8 HCA connections in 8 InfiniBand subnets
Frame
Server
HCA
Connector
Switch
Connector
1
1
1 (C65)
T1
1
L1-C1
1
1
1 (C65)
T2
2
L1-C1
1
1
1 (C65)
T3
3
L1-C1
1
1
1 (C65)
T4
4
L1-C1
1
1
2 (C66)
T1
5
L1-C1
1
1
2 (C66)
T2
6
L1-C1
1
1
2 (C66)
T3
7
L1-C1
1
1
2 (C66)
T4
8
L1-C1
1
2
1 (C65)
T1
1
L2-C1
1
2
1 (C65)
T2
2
L2-C1
1
2
1 (C65)
T3
3
L2-C1
1
2
1 (C65)
T4
4
L2-C1
1
2
2 (C66)
T1
5
L2-C1
1
2
2 (C66)
T2
6
L2-C1
1
2
2 (C66)
T3
7
L2-C1
1
2
2 (C66)
T4
8
L2-C1
Continue through to the last server in the frame
1
12
1 (C65)
T1
1
L12-C1
1
12
1 (C65)
T2
2
L12-C1
1
12
1 (C65)
T3
3
L12-C1
1
12
1 (C65)
T4
4
L12-C1
1
12
2 (C66)
T1
5
L12-C1
1
12
2 (C66)
T2
6
L12-C1
1
12
2 (C66)
T3
7
L12-C1
1
12
2 (C66)
T4
8
L12-C1
2
1
1 (C65)
T1
1
L1-C2
2
1
1 (C65)
T2
2
L1-C2
2
1
1 (C65)
T3
3
L1-C2
2
1
1 (C65)
T4
4
L1-C2
2
1
2 (C66)
T1
5
L1-C2
2
1
2 (C66)
T2
6
L1-C2
2
1
2 (C66)
T3
7
L1-C2
2
1
2 (C66)
T4
8
L1-C2
2
2
1 (C65)
T1
1
L2-C2
44
Power Systems: High performance clustering
10
Table 34. Example topology -> (140) 9125-F2As in 10 frames with 8 HCA connections in 8 InfiniBand
subnets (continued)
Frame
Server
HCA
Connector
Switch
Connector
2
2
1 (C65)
T2
2
L2-C2
2
2
1 (C65)
T3
3
L2-C2
2
2
1 (C65)
T4
4
L2-C2
2
2
2 (C66)
T1
5
L2-C2
2
2
2 (C66)
T2
6
L2-C2
2
2
2 (C66)
T3
7
L2-C2
2
2
2 (C66)
T4
8
L2-C2
10
Continue through to the last server in the frame
2
12
1 (C65)
T1
1
L12-C2
2
12
1 (C65)
T2
2
L12-C2
2
12
1 (C65)
T3
3
L12-C2
2
12
1 (C65)
T4
4
L12-C2
2
12
2 (C66)
T1
5
L12-C2
2
12
2 (C66)
T2
6
L12-C2
2
12
2 (C66)
T3
7
L12-C2
2
12
2 (C66)
T4
8
L12-C2
Continue through to the last frame
10
1
1 (C65)
T1
1
L1-C10
10
1
1 (C65)
T2
2
L1-C10
10
1
1 (C65)
T3
3
L1-C10
10
1
1 (C65)
T4
4
L1-C10
10
1
2 (C66)
T1
5
L1-C10
10
1
2 (C66)
T2
6
L1-C10
10
1
2 (C66)
T3
7
L1-C10
10
1
2 (C66)
T4
8
L1-C10
10
2
1 (C65)
T1
1
L2-C10
10
2
1 (C65)
T2
2
L2-C10
10
2
1 (C65)
T3
3
L2-C10
10
2
1 (C65)
T4
4
L2-C10
10
2
2 (C66)
T1
5
L2-C10
10
2
2 (C66)
T2
6
L2-C10
10
2
2 (C66)
T3
7
L2-C10
10
2
2 (C66)
T4
8
L2-C10
Continue through to the last server in the frame
10
12
1 (C65)
T1
1
L10-C10
10
12
1 (C65)
T2
2
L10-C10
10
12
1 (C65)
T3
3
L10-C10
10
12
1 (C65)
T4
4
L10-C10
10
12
2 (C66)
T1
5
L10-C10
High-performance computing clusters using InfiniBand hardware
45
Table 34. Example topology -> (140) 9125-F2As in 10 frames with 8 HCA connections in 8 InfiniBand
subnets (continued)
Frame
Server
HCA
Connector
Switch
Connector
10
12
2 (C66)
T2
6
L10-C10
10
12
2 (C66)
T3
7
L10-C10
10
12
2 (C66)
T4
8
L10-C10
Frame of 8203-E4A servers
11
1
1 (C8)
1
1
L1-C11
11
1
1 (C8)
2
4
L1-C11
11
2
1 (C8)
1
1
L2-C11
11
2
1 (C8)
2
4
L2-C11
11
3
1 (C8)
1
1
L3-C11
11
3
1 (C8)
2
4
L3-C11
11
4
1 (C8)
1
1
L4-C11
11
4
1 (C8)
2
4
L4-C11
11
5
1 (C8)
1
1
L5-C11
11
5
1 (C8)
2
4
L5-C11
11
6
1 (C8)
1
1
L6-C11
11
6
1 (C8)
2
4
L6-C11
11
7
1 (C8)
1
1
L7-C11
11
7
1 (C8)
2
4
L7-C11
11
8
1 (C8)
1
1
L8-C11
11
8
1 (C8)
2
4
L8-C11
Fabric management server 111
1
Port 1
1
L1-C12
Fabric management server 1
1
Port 2
2
L1-C12
Fabric management server 1
2
Port 1
3
L1-C12
Fabric management server 1
2
Port 2
4
L1-C12
Fabric management server 2
1
Port 1
5
L1-C12
Fabric management server 2
1
Port 2
6
L1-C12
Fabric management server 2
2
Port 1
7
L1-C12
Fabric management server 2
2
Port 2
8
L1-C12
Fabric management server 3
1
Port 1
1
L1-C12
Fabric management server 3
1
Port 2
2
L1-C12
Fabric management server 3
2
Port 1
3
L1-C12
Fabric management server 3
2
Port 2
4
L1-C12
Fabric management server 4
1
Port 1
5
L1-C12
Fabric management server 4
1
Port 2
6
L1-C12
Fabric management server 4
2
Port 1
7
L1-C12
Fabric management server 4
2
Port 2
8
L1-C12
10
Connector terminology -> LxCx = Leaf # Connector #
46
Power Systems: High performance clustering
10
11
There are backup fabric management server in this example. For maximum availability, the backup is
connected to a different leaf from the primary.
Configurations with IO router servers:
This information provides possible configurations using only 9125-F2A compute servers and 8203-E4A
storage servers.
The following is a configuration that is not generally available. Similar configurations have been
implemented. If you are considering such a configuration, be sure to contact IBM to discuss how best to
achieve your requirements.
A good example of a configuration with IO routers servers is for a total system solution that has multiple
compute and storage clusters to provide fully redundant clusters. The storage clusters might be
connected more directly together so that there is the ability to mirror the part or all of the data between
the two.
This example uses 9125-F2As for the compute servers and 8203-E4As for the storage clusters, and
9125-F2As for the IO routers.
High-performance computing clusters using InfiniBand hardware
47
Figure 8. Example configuration with IO router servers
If you are using 12x HCAs (for example, in a 8203-E4A server), you should review “Planning 12x HCA
connections” on page 75, to understand the unique cabling and configuration requirements when using
these adapters with the available 4x switches. Also review any cabling restrictions in IBM Clusters with
the InfiniBand Switch website referenced in “Cluster information resources” on page 2.
Cable planning
While planning your cabling, keep in mind the IBM server and frame physical characteristics that affect
the planning of cable length.
In particular:
v Consider the server height and placement in the frame to plan for cable routing within the frame. This
affects the distance of the HCA connectors from the top of the raised floor.
v Consider routing to the cable entrance of a frame
v Consider cable routing within a frame, especially with respect to bend radius and cable management.
v Consider floor depth
v Remember to plan for connections from the Fabric Management Servers; see “Planning for fabric
management server” on page 64.
48
Power Systems: High performance clustering
Record the cable connection information planned here in the “QLogic and IBM switch planning
worksheets” on page 83, for switch port connections and in a “Server planning worksheet” on page 81,
for HCA port connections.
Planning InfiniBand network cabling and configuration ends here.
Planning QLogic or IBM Machine Type InfiniBand switch configuration
You can plan for QLogic or IBM Machine Type InfiniBand switch configurations by using QLogic
planning resources including general planning guides and planning guides specific to the model being
installed.
Unless otherwise noted, this document uses the term QLogic switches interchangeably with IBM 7874
switches. Unless otherwise noted, they are functionally equivalent.
Most InfiniBand switch planning would be done using QLogic planning resources including general
planning guides and planning guides specific to the model being installed. See the reference material in
“Cluster information resources” on page 2.
Switches require some custom configuration to work well in an IBM System p high performance
computing (HPC) cluster. You must plan for the following configuration settings.
v IP-addressing on the cluster virtual local area network (VLAN) can be configured static. The address
can be planned and recorded.
v Chassis maximum transfer units (MTU) value
v Switch name
v 12x cabling considerations
v Disable telnet in favor of ssh access to the switches
v Remote logging destination (xCAT/MS is preferred)
v New chassis passwords
As part of the consideration in designing the VLAN on which the switches management ports are
populated, you can consider making that a private VLAN, or one that is protected. While the switch
chassis provides password and ssh protection, the Chassis Viewer does not use an SSL protocol.
Therefore, you can consider how this fits with the site security policies.
The IP-addressing that a QLogic switch has on the management Ethernet network is configured for static
addressing. These addresses are associated with the switch management function. The following are
important QLogic management function concepts.
v The 7874-024 (QLogic 9024) switches have a single address associated with its management Ethernet
connection.
v All other switches have one or more managed spine cards per chassis. If you want backup capability
for the management subsystem, you must have more than one managed spine in a chassis. This is not
possible for the7874-040 (QLogic9040).
v Each managed spine gets its own address so that it can be addressed directly.
v Each switch chassis also gets a management Ethernet address that is assumed by the master
management spine. This permits you to use a single address to query the chassis regardless of which
spine is the master spine. To set up management parameters (like which spine is master) each managed
spine must have a separate address.
v The 7874-240 (QLogic 9240) switch chassis is divided into two managed hemispheres. Therefore, a
master and backup managed spine within each hemisphere is required, creating a total of four
managed spines.
– Each managed spine gets its own management Ethernet address.
– The chassis has two management Ethernet addresses. One for each hemisphere.
High-performance computing clusters using InfiniBand hardware
49
– Review the 9240 Users Guide to ensure that you understand which spine slots are used for managed
spines. Slots 1, 2, 5 and 6 are used for managed spines. The numbering of spine 1 through 3 is from
bottom to top. The numbering of spine 4 through 6 is from top to bottom.
v - The total number of management Ethernet addresses is driven by the switch model. Recall, except for
the 7874-024 (QLogic 9024), each management spine has its own IP address in addition to the chassis
address.
– 7874-024 (QLogic 9024) has one address
– 7874-240 (QLogic 9240) has from four (no redundancy) to six (full redundancy) addresses. Recall,
there are two hemispheres in this switch model, and each has its own chassis address.
– All other models have from two (no redundancy) to three addresses.
v For topology and cabling, see “Planning InfiniBand network cabling and configuration” on page 30.
Chassis MTU must be set to an appropriate value for each switch in a cluster. For more information, see
“Planning maximum transfer unit (MTU)” on page 51.
For each subnet, you must plan a different GID-prefix. For more information, see “Planning for global
identifier prefixes” on page 52.
You can assign a name to each switch, which would be used as the IB Node Description. It can be
something that indicates its physical location on a machine floor. You might want to include the frame
and slot in which it resides. The key is a consistent naming convention that is meaningful to you and
your service provider. Also, provide a common prefix to the names. This helps the tools filter on this
name in the IB Node Description. Often the customer name or the cluster name is used as the prefix. If
the servers have only one connection per InfiniBand subnet, some users find it useful to include the ibX
interface in the switch name. For example, if company XYZ has eight subnets, each with a single
connection from each server, the switches might be named XYZ ib0 through XYZ ib7 , or, perhaps, XYZ
switch 1 through XYZ switch 8.
If you have a 4x switch connecting to 12x host channel adapter (HCA), a 12x to 4x width exchanger cable
is required. For more details, see “Planning 12x HCA connections” on page 75.
If you are connecting to 9125-F2A servers, you must alter the switch port configuration to accommodate
the signal characteristics of a copper or optical cable combined with the GX++ HCA in a 9125-F2A server.
v Copper cables connected to a 9125-F2A require an amplitude setting of 0x01010101 and pre-emphasis
value of 0x01010101
v Optical cables connected to a 9125-F2A require a pre-emphasis setting of 0x0000000. The amplitude
setting is not important
v The following table shows the default values by switch model. Use this table to determine if the
default values for amplitude and pre-emphasis are sufficient.
Table 35. Switch Default Amplitude and Pre-emphasis Settings
Switch
Default Amplitude
Default Pre-empahsis
QLogic 9024 or IBM 7874-024
0x01010101
0x01010101
All other switch models
0x06060606
0x01010101
While passwordless ssh is preferred from xCAT/MS and the fabric management server to the switch
chassis, you can also change the switch chassis default password early in the installation process. For Fast
Fabric Toolset functionality, all the switch chassis passwords can be the same.
You can also consolidate switch chassis logs and embedded Subnet Manager logs on to a central location.
Because xCAT is also preferred as the Systems Management application, the xCAT/MS is preferred to be
50
Power Systems: High performance clustering
the recipient of the remote logs from the switch. You can only direct logs from a switch to a single remote
host (xCAT/MS). “Set up remote logging” on page 112 provides the procedure that is used for setting up
remote logging in the cluster.
The information planned here can be recorded in a “QLogic and IBM switch planning worksheets” on
page 83.
Planning QLogic InfiniBand switch configuration ends here.
Planning maximum transfer unit (MTU):
Use this information to plan for maximum transfer units (MTU).
Based on your configuration, there are different maximum transfer units (MTUs) that can be used.
Table 36 list the MTU values that message passing interface (MPI) and Internet Protocol (IP) require for
maximum performance.
The cluster type indicates the type of cluster based on the generation and type of host channel adapters
(HCAs) that are used. You either have a homogeneous cluster based on all the HCAs being of the same
generation and type, or a heterogeneous cluster based on the HCAs being a mix of generations and types.
Cluster composition by HCA indicates the actual generation and type of HCAs being used in the cluster.
Switch and Subnet Manager (SM) settings indicate the settings for the switch chassis and Subnet
Manager. The chassis MTU is used by the switch chassis and applies to the entire chassis, and can be set
the same for all chassis in the cluster. Furthermore, chassis MTU affects the MPI. The broadcast MTU is
set by the Subnet Manager and affects IP. It is part of the broadcast group settings. It can be the same for
all broadcast groups.
The MPI MTU indicates the setting that the MPI requires for the configuration. The IP MTU indicates the
setting that the IP requires. The MPI MTU and IP MTU are included to help understand the settings
indicated in the Switch and SM Settings column. The BC rate is the broadcast MTU rate setting, which
can either be 10 GB (3) or 20 GB (6). The SDR switches run at 10 GB and DDR switches run at 20 GB.
The number in parentheses in the following table indicates the parameter setting in the firmware and SM
which represents that setting.
Table 36. MTU settings
Cluster type
Homogeneous
HCAs
Cluster composition by HCA
®
System p5 GX+ SDR HCA only
Switch and SM settings
MPI
MTU
IP MTU
Chassis MTU = 2 K (4)
2K
2K
4K
4K
2K
2K
Broadcast MTU = 2 K (5)
BC rate = 10 GB (3)
Homogeneous
HCAs
System p (POWER6)GX++ DDR
HCA 9125-F2A, 8204-E8A or
8203-E4A
Chassis MTU = 4 K (5)
Broadcast MTU = 4 K (5)
BC rate = 10 GB (3) for SDR switches,
or 20 GB (6) for DDR switches
Homogeneous
HCAs
POWER6 GX+ SDR HCA
8204-E8A or 8203-E4A
Chassis MTU = 2 K (4)
Broadcast MTU = 2 K (4)
BC rate = 10 GB (3) for SDR switches,
or 20 GB (6) for DDR switches
High-performance computing clusters using InfiniBand hardware
51
Table 36. MTU settings (continued)
Cluster type
Homogeneous
HCAs
Cluster composition by HCA
12
ConnectX HCA only (System p
blades)
Switch and SM settings
MPI
MTU
IP MTU
Chassis MTU = 2 K (4)
2K
2K
Between
compute
only 13 =
4 KB
2K
Between
POWER6
only = 4
KB
2K
2K
2K
Broadcast MTU = 2 K (4)
BC rate = 10 GB (3) for SDR switches,
or 20 GB (6) for DDR switches
Heterogeneous
HCAs
Heterogeneous
HCAs
GX++ DDR HCA in 9125-F2A
(compute servers) and GX+ SDR
HCA in 8204-E8A or 8203-E4A
(storage servers)
Chassis MTU = 4 K (5)
POWER6 GX++ DDR HCA
(compute) and p5 SDR HCA
(storage servers)
Chassis MTU = 4 K (5)
Broadcast MTU = 2 K (4)
BC rate = 10 GB (3)
Broadcast MTU = 2 K (4)
BC rate = 10 GB (3)
Heterogeneous
HCAs
ConnectX HCA (compute) and p5
HCA (storage servers)
Chassis MTU = 2 K (4)
Broadcast MTU = 2 K (4)
BC rate = 10 GB (3)
1
IPoIB performance between compute nodes might be degraded because they are bound by the 2 KB MTU.
12
While Connect X HCAs are used in the Fabric management servers, they are not part of the IPoIB
configuration, nor the MPI configuration. Therefore, their potential MTU is not relevant.
13
IPoIB performance between compute nodes might be degraded because they are bound by the 2 K
MTU.
Note: For IFS 5, record 2048 for 2 K MTU, and record 4096 for 4 K MTU. For the rates in IFS 5, record 20
g for 20 GB, and record 10 g for 10 GB.
The configuration settings for fabric managers can be recorded in the “QLogic fabric management
worksheets” on page 92.
The configuration settings for switches can be recorded in the “QLogic and IBM switch planning
worksheets” on page 83.
Planning MTU ends here.
Planning for global identifier prefixes:
This information describes why and how to plan for fabric global identifier (GID) prefixes in an IBM
System p high-performance computing (HPC) cluster.
Each subnet in the InfiniBand network must be assigned a GID prefix, which is used to identify the
subnet for addressing purposes. The GID prefix is an arbitrary assignment with a format of:
xx:xx:xx:xx:xx:xx:xx:xx (for example: FE:80:00:00:00:00:00:01). The default GID prefix is
FE:80:00:00:00:00:00:00.
The GID prefix is set by the Subnet Manager. Therefore, each instance of the Subnet Manager must be
configured with the appropriate GID prefix. On any given subnet, all instances of the Subnet Manager
(master and backups) must be configured with the same GID prefix.
52
Power Systems: High performance clustering
Typically, all but the lowest order byte of the GID-prefix is kept constant, and the lowest byte is the
number for the subnet. The numbering scheme typically begins with 0 or 1.
The configuration settings for fabric managers can be recorded in the “QLogic fabric management
worksheets” on page 92.
Planning GID Prefixes ends here.
Planning an IBM GX HCA configuration
An IBM GX host channel adapter (HCA) must have certain configuration settings to work in an IBM
POWER® InfiniBand cluster.
The following configuration settings are required to work with an IBM POWER InfiniBand cluster:
v Globally-unique identifier (GUID) index
v Capability
v Global identifier (GID) prefix for each port of an HCA
InfiniBand subnet IP addressing is based on subnet restrictions. For more information, see “IP subnet
addressing restriction with RSCT.” Each physical InfiniBand HCA contains a set of 16 GUIDs that can be
assigned to logical partition profiles. These GUIDs are used to address logical HCA (LHCA) resources on
an HCA. You can assign multiple GUIDs to each profile, but you can assign only one GUID from each
HCA to each partition profile. Each GUID can be used by only one logical partition at a time. You can
create multiple logical partition profiles with the same GUID, but only one of those logical partition
profiles can be activated at a time.
The GUID index is used to choose one of the 16 GUIDs available for an HCA. It can be any number from
1 through 16. Often, you can assign a GUID index based on which logical partition (LPAR) and profile
you are configuring. For example, on each server you might have four logical partitions. The first logical
partition on each server might use a GUID index of 1. The second would use a GUID index of 2. The
third would use a GUID index of 3, and the fourth using a GUID index of 4.
The Capability setting is used to indicate the level of sharing that can be done. The levels of sharing are
as follows.
1. Low
2. Medium
3. High
4. Dedicated
While the GID-prefix for a port is not something that you explicitly set, it is important to understand the
subnet to which a port attaches. This GID-prefix is determined by the switch to which the HCA port is
connected. The GID-prefix is configured for the switch. For more information, see “Planning for global
identifier prefixes” on page 52.
For more information about partition profiles, see Partition profile.
The planned configuration settings can be recorded in a “Server planning worksheet” on page 81 which
is used to record HCA configuration information.
Note: The 9125-F2A servers with “heavy” I/O system boards might have an extra InfiniBand device
defined. The defined device is always iba3. Delete iba3 from the configuration.
Planning an IBM GX HCA configuration ends here.
IP subnet addressing restriction with RSCT:
High-performance computing clusters using InfiniBand hardware
53
When using RSCT, there are restrictions to how you can configure Internet Protocol (IP) subnet
addressing in a server attached to an InfiniBand network.
Note: RSCT is no longer required for IBM Power HPC Clusters. This topic is for clusters that still rely on
RSCT for InfiniBand network status monitoring.
Both IP and InfiniBand use the term subnet. These are two distinctly different entities as described in the
following paragraphs.
The IP addresses for the host channel adapter (HCA) network interfaces must be set up. So that no two
IP addresses in a given LPARs are in the same IP subnet. When planning for the IP subnets in the cluster,
as many separate IP subnets can be established as there are IP addresses on a given LPAR.
The subnets can be set up so that all IP addresses in a given IP subnet are connected to the same
InfiniBand subnet. If there are n network interfaces on each logical partition connected to the same
InfiniBand subnet, then n separate IP subnets can be established.
Note: This IP subnetting limitation does not prevent multiple adapters or ports from being connected to
the same InfiniBand subnet. It is only an indication of how the IP addresses must be configured.
Management subsystem planning
This information is a summary of the planning required for the components of the management
subsystem.
This information is a summary of the service and cluster VLANs, Hardware Management Console
(HMC), Systems Management application and Server, vendor Fabric Management applications, AIX NIM
server and Linux Distribution server. And pointers to key references in planning the management
subsystem. Also, you must plan for the frames that house the management consoles.
Customer-supplied Ethernet service and cluster VLANs are required to support the InfiniBand cluster
computing environment. The number of Ethernet connections depends on the number of servers, bulk
power controllers (BPCs) in 24 - inch frames, InfiniBand switches, and HMCs in the cluster. The Systems
Management application and server, which might include Cluster Ready Hardware Server (CRHS)
software would also require a connection to the service VLAN.
Note: While you can have two service VLANs on different subnets to support redundancy in IBM
servers, BPCs, and HMCs, the InfiniBand switches support only a single service VLAN. Even though
some InfiniBand switch models have multiple Ethernet connections, these connections connect to different
management processors and therefore can connect to the same Ethernet network.
An HMC might be required to manage the LPARs and to configure the GX bus host channel adapters
(HCAs) in the servers. The maximum number of servers that can be managed by an HMC is 32. When
there are more than 32 servers, additional HMCs are required. For details, see Solutions with the Hardware
Management Console in the IBM systems Hardware Information Center. It is under the Planning >
Solutions > Planning for consoles, interfaces, and terminals path.
If you have a single HMC in the cluster, it is normally configured to be the required dynamic host
configuration protocol (DHCP) server for the service VLAN. And the xCAT/MS is the DHCP server for
the cluster VLAN. If multiple HMCs are used, then typically the xCAT M/S would be the DHCP server
for both the cluster and service VLANs.
The servers have connections to the service and cluster VLANs. See xCAT documentation for more
information about the cluster VLAN. See the server documentation for more information about
connecting to the service VLAN. In particular, consider the following items.
v The number of service processor connections from the server to the service VLAN
54
Power Systems: High performance clustering
v If there is a BPC for the power distribution, as in a 24 - inch frame, it might provide a hub for the
processors in the frame, permitting for a single connection per frame to the service VLAN.
After you know the number of devices and cabling of your service and cluster VLANs, you must
consider the device IP-addressing. The following items are the key considerations for IP addressing.
1. Determine the domain addressing and netmasks for the Ethernet networks that you implement.
2. Assign static-IP-addresses
a. Assign a static IP address for HMCs when you are using xCAT. This static IP address is
mandatory when you have multiple HMCs in the cluster.
b. Assign a static IP address for switches when you are using xCAT. This static IP address is
mandatory when you have multiple HMCs in the cluster.
3. Determine the DHCP range for each Ethernet subnet.
4. If you are using xCAT and multiple HMC, the DHCP server is preferred to be on the xCAT
management server, and all HMCs must have their DHCP server capability disabled. Otherwise, you
are in a single HMC environment where the HMC is the DHCP server for the service VLAN.
If there are servers in the cluster without removable media (CD or DVD), you would require an AIX NIM
server for System p server diagnostics. If you are using AIX in your partitions, this provides NIM service
for the partition. The NIM server would be on the cluster VLAN.
If there are servers running the Linux operating system on your logical partitions that do not have
removable media (CD or DVD), a distribution server is required. The “Cluster summary worksheet” on
page 77 can be used to record the information for your management subsystem planning.
Frames or racks must be planned for the management servers. You can consolidate the management
servers into the same rack whenever possible. The following management servers can be considered.
v HMC
v xCAT management server
v Fabric management server
v AIX NIM and Linux distribution servers
v Network time protocol (NTP) server
Further management subsystem considerations are:
v Review “Installing and configuring the management subsystem” on page 98 for the management
subsystem installation tasks. The information helps you to assign tasks in the “Installation coordination
worksheet” on page 73.
v “Planning your Systems Management application”
v “Planning for QLogic fabric management applications” on page 56
v “Planning for fabric management server” on page 64
v “Planning event monitoring with QLogic and management server” on page 66
v “Planning to run remote commands with QLogic from the management server” on page 67
Planning your Systems Management application
You must choose either xCAT as your Systems Management application.
If you are installing servers with Red Hat partitions, then you must use xCAT as your Systems
Management application.
Planning xCAT as your Systems Management application: For general xCAT planning information see
xCAT documentation referenced in Table 4 of “Cluster information resources” on page 2. This section
concerns itself more with how xCAT fits into a cluster with InfiniBand.
High-performance computing clusters using InfiniBand hardware
55
If you have along multiple HMCs and are using xCAT, the xCAT Management Server (xCAT/MS) is
typically the DHCP server for the service VLAN. If the cluster VLAN is public or local site network, then
it is possible that another server might be set up as the DHCP server. It is preferred that the xCAT
Management Server to be a stand-alone server. If you use one of the compute, storage or IO router
servers in the cluster for xCAT, the xCAT operation might degrade performance for user applications, and
it would complicate the installation process with respect to server setup and discovery on the service
VLAN.
You can also set up xCAT event management to be used in a cluster. To set up xCAT event management,
you must plan for the following items.
v The type of syslogd that you are going to use. At the least, you must understand the default syslogd
that comes with the operating system on which xCAT would run. The two main varieties are syslog
and syslog-ng. In general syslog is used in AIX and RedHat. If you prefer syslog-ng, which has more
configuration capabilities than syslog, you might also obtain and install syslog-ng on AIX and RedHat.
v Whether you want to use tcp or udp as the protocol for transferring syslog entries from the fabric
management server to the xCAT/MS. You must use udp if the xCAT/MS is using syslog. If the
xCAT/MS has syslog-ng installed, you can use tcp for better reliability. The switches only use udp.
v If syslog-ng is used on the xCAT/MS, there is a src line that controls the IP addresses and ports over
which syslog-ng accepts logs. The default setup is address 0.0.0.0, which means all addresses. For
added security, you might want to plan to have a src definition for each switch IP address and each
fabric management server IP address rather than opening all IP addresses on the service VLAN. For
information about the format of the src line see “Set up remote logging” on page 112.
Running the remote command from the xCAT/MS to the Fabric Management Servers is advantageous
when you have more than one Fabric Management Server in a cluster. To start the remote command to
the Fabric Management Servers, you must research how to exchange ssh keys between the fabric
management server and the xCAT/MS. This is standard open SSH protocol setup as done in either the
AIX operating system or the Linux operating system. For more information see, “Planning to run remote
commands with QLogic from the management server” on page 67
If you do not require a xCAT Management Server, you might need a server to act as a Network
Installation Manager (NIM) server for diagnostics. This is the case for servers that do not have removable
media (CD or DVD), such as a 575 (9118-575).
If you have servers with no removable media that are running Linux logical partitions, you might require
a server to act as a distribution server.
If you require both an AIX NIM server and a Linux distribution server, and you choose the same server
for both, a reboot is required to change between the services. If the AIX NIM server is used only for
eServer diagnostics, this might be acceptable in your environment. However, you must understand that
this may prolong a service call if use of the AIX NIM service is required. For example, the server that
might normally act as a Linux distribution server could have a second boot image to server as the AIX
NIM server. If AIX NIM services are required for System p diagnostics during a service call, the Linux
distribution server must be rebooted to the AIX NIM image before diagnostics can be performed.
The configuration settings planned here can be recorded in the “xCAT planning worksheets” on page 89.
Planning xCAT as your Systems Management application ends here
Planning for QLogic fabric management applications
Use this information to plan for the QLogic Fabric Management applications.
Planning the fabric manager and fabric Viewer:
This information is used to plan for the Fabric Manager and the Fabric Viewer.
56
Power Systems: High performance clustering
Most details are available in the Fabric Manager and Fabric Viewer Users Guide from QLogic. This
information highlights information from a cluster perspective.
The Fabric Viewer is intended to be used as documented by QLogic. However, it is not scalable and thus
would be only used in small clusters when necessary.
The Fabric Manager has a few key parameters that can be set up in a specific manner for IBM System p
HPC clusters.
The following items are the key planning points to for your Fabric Manager in an IBM System p HPC
cluster.
Note: See Figure 9 on page 58 and Figure 10 on page 58 for illustrations of typical fabric management
configurations.
v For HPC clusters, IBM has only qualified use of a host-based Fabric Manager (HFM). The HFM is
typically referred as host-based Subnet Manager (HSM), because the Subnet Manager is considered the
most important component of the Fabric Manager.
v The host for HSM is the fabric management server. For more information, see “Planning for fabric
management server” on page 64.
– The host requires one host channel adapter (HCA) port per subnet to be managed by the Subnet
Manager.
– If you have more than four subnets in your cluster, you must have two hosts actively servicing your
fabrics. To permit for backups, up to four hosts to be fabric management servers are required. That
is two hosts as primaries and two hosts as backups.
– Consolidating switch chassis and Subnet Manager logs on to a central location is preferred. Since
xCAT can be used as the Systems Management application, the xCAT/MS can be the recipient of the
remote logs from the switch. You can direct logs from a fabric management server to multiple
remote hosts. See “Set up remote logging” on page 112 for the procedure that is used to set up
remote logging in the cluster.
– IBM has qualified the System x 3550 or 3650 for use as a Fabric Management Server.
– IBM has qualified the QLogic HCAs for use in the Fabric Management Server.
v Backup fabric management servers are preferred to maintain availability of the critical HSM function.
v At least one unique instance of Fabric Manager to manage each subnet is required.
– A host-based Fabric Manager instance is associated with a specific HCA and port over which it
communicates with the subnet that it manages. For example, if you have four subnets and one
fabric management server, it has four instances of Subnet Manager running on it; one for each
subnet. Also, the server must be attached to all four subnets.
– The Fabric Manager consists of four processes: the subnet manager (SM), the performance manager
(PM), baseboard manager (BM) and fabric executive (FE). For more details, see “Fabric manager” on
page 17 and the QLogic Fabric Manager Users Guide.
– When more than one HSM is configured to manage a fabric, the priority (SM_x_priority) is used to
determine which one manages the subnet at a given time. The wanted master, or primary, can be
configured with the highest priority. The priorities are 0- through 15, with 15 being the highest.
– In addition to the priority parameter, there is an elevated priority parameter
(SM_x_elevated_priority) that is used by the backup when it takes over for the master. More details
are available in the following explanation of key parameters.
– It is common practice in the industry for the terms Subnet Manager and Fabric Manager to be used
interchangeably, because the Subnet Manager performs the most vital role in managing the fabric.
v The HSM license fee is based on the size of the cluster that it covers. See the vendor documentation
and website referenced in “Cluster information resources” on page 2.
v The following items are embedded Subnet Manager (ESM) considerations.
– IBM is not qualifying the embedded Subnet Manager.
High-performance computing clusters using InfiniBand hardware
57
– If you use an embedded Subnet Manager, you might experience performance problems and outages
if the subnet has more than 64 IBM GX+ or GX++ HCA ports attached to it. This is because of the
limited compute power and memory available to run the embedded Subnet Manager in the switch.
And because the IBM GX+ or GX++ HCAs also present themselves as multiple logical devices,
because they can be virtualized. For more information, see “IBM GX+ or GX++ host channel
adapter” on page 7. Considering these restrictions, you might want to restrict embedded Subnet
Manager use to subnets with only one model 9024 switch in them.
– If you plan to use the embedded Subnet Manager, you need the fabric management server for the
Fast Fabric Toolset. For more information, see “Planning Fast Fabric Toolset” on page 63. If you use
ESM, it does not eliminate the need for a fabric management server. The need for a backup fabric
management server is not as great, but it is still preferred.
– You might find it simpler to maintain host-based Subnet Manager code than embedded Subnet
Manager code.
– You must obtain a license for the embedded Subnet Manager, since it is keyed to the switch chassis
serial number.
Figure 9. Typical Fabric Manager configuration on a single fabric management server
Figure 10. Typical fabric management server configuration with eight subnets
The key parameters for which to plan for the Fabric Manager are:
Note: If a parameter applies to only a certain component of the fabric manager that are noted as in the
following section. Otherwise, you must specify that parameter for each component of each instance of the
fabric manager on the Fabric Management Server. Components of the fabric manager are: subnet manager
(SM), performance manager (PM), baseboard manager (BM), and fabric executive (FE).
v Plan a global identifier (GID) prefix for each subnet. Each subnet requires a different GID prefix, which
is set by the Subnet Manager. The default is 0xfe80000000000000. This GID prefix is for the subnet
manager only.
v LMC = 2 to permit for 4 LIDs. This is important for IBM MPI performance. This is for the subnet
manager only. It is important to note that the IBM MPI performance gain is realized in the FIFO mode.
Consult performance papers and IBM for information about the impact of LMC = 2 on RDMA. The
default is to not use the LMC = 2, and use only the first of the 4 available LIDs. This reduces startup
time and processor usage for managing Queue Pairs (QPs), which are used in establishing
protocol-level communication between InfiniBand interfaces. For each LID used, another QP must be
created to communicate with another InfiniBand interface on the InfiniBand subnet. For more
information and an example failover and recovery scenario, see “QLogic subnet manager” on page 153
v For each Fabric Management Server, plan which instance of the fabric manager can be used to manage
each subnet. Instances are numbered from 0 to 3 on a single Fabric Management Server. For example, if
a single Fabric Management server is managing four subnets, you would typically have instance 0
manage the first subnet. Instance 1 manage the second subnet, instance 2 manage the third subnet and
instance 3 manage the fourth subnet. All components under a particular fabric manager instance are
referenced using the same instance. For example, fabric manager instance 0, would have SM_0, PM_0,
BM_0, and FE_0.
v For each Fabric Management Server, plan which HCA and HCA port on each would connect which
subnet. You need this to point each fabric management instance to the correct HCA and HCA port so
that it manages the correct subnet. This is specified individually for each component. However, it can
be the same for each component in each instance of fabric manager. Otherwise, you would have the
SM component of the fabric manager 0 manage one subnet and the PM component of the fabric
manager 0 managing another subnet. This would make it confusing to try to understand how things
are set up. Typically, instance 0 manages the first subnet, which typically is on the first port of the first
58
Power Systems: High performance clustering
HCA. And instance 1 manages the second subnet, which typically is on the second port of the first
HCA. Instance 2 manages the third subnet, which typically is on the first port of the second HCA, and
instance 3 manages the fourth subnet, which typically is on the second port of the second HCA.
v Plan for a backup Fabric Manager for each subnet.
v Plan for the maximum transfer unit (MTU) by using the rules found in “Planning maximum transfer
unit (MTU)” on page 51. This MTU is for the subnet manager only.
v In order to account for maximum pHyp response times, change the default MaxAttempts value from 3
to 8. This controls the number of times that the SM attempts before deciding that it cannot reach a
device.
v Do not start the Baseboard Manager (BM), Performance Manager (PM), or Fabric Executive (FE), unless
you require the Fabric Viewer. Which would not be necessary if you are running the Host-based fabric
manager and FastFabric Toolset.
v There are other parameters that can be configured for the Subnet Manager. However, the defaults are
typically chosen for Subnet Manager. Further details can be found in the QLogic Fabric Manager Users
Guide.
Examples of configuration files for IFS 5:
Example setup of host-based fabric manager for IFS 5
The following is a set of example entries from an qlogic_fm.xml file on a fabric management server,
which manages two subnets, where the fabric manager is the primary one, as indicated by a priority=1.
These entries are found throughout the file in the startup section, and each of the manager sections in
each of the instance sections. In this case, instance 0 manages subnet 1 and instance 1 manages subnet 2
and instance 2 manages subnet 3 and instance 3 manages subnet 4.
Note: Comments made in boxes in this example are not found in the example file. They are here to help
clarify where in the file you would find these entries, or give more information. Also, the example file
has many more comments that are not given in this example. You might find these comments to be
helpful in understanding the attributes and the file format in more detail, but they would make this
example difficult to read. Finally, in order to conserve space, most of the attributes that typically remain
at default are not included.
<?xml version="1.0" encoding="utf-8"?>
<Config>
<!-- Common FM configuration, applies to all FM instances/subnets -->
<Common>
THE APPLICATIONS CONTROLS ARE NOT USED
<!-- Various sets of Applications which may be used in Virtual Fabrics -->
<!-- Applications defined here are available for use in all FM instances. -->
. . .
<!-- All Applications, can be used when per Application VFs not needed -->
. . .
<!-- Shared Common config, applies to all components: SM, PM, BM and FE -->
<!-- The parameters below can also be set per component if needed -->
<Shared>
. . .
Priorities are typically set within the FM instances farther below
<Priority>0</Priority> <!-- 0 to 15, higher wins -->
<ElevatedPriority>0</ElevatedPriority> <!-- 0 to 15, higher wins -->
. . .
</Shared>
<!-- Common SM (Subnet Manager) attributes -->
High-performance computing clusters using InfiniBand hardware
59
<Sm>
<Start>1</Start> <!-- default SM startup for all instances -->
. . .
<!-- **************** Fabric Routing **************************** -->
. . .
<Lmc>2</Lmc>
. . .
<!-- assign 2^lmc LIDs to all CAs (Lmc can be 0-7) -->
<!-- **************** IB Multicast **************************** -->
<Multicast>
. . .
<!-- *************************************************************** -->
<!-- Pre-Created Multicast Groups -->
. . .
<MulticastGroup>
<Create>1</Create>
<MTU>4096</MTU>
<Rate>20g</Rate>
<!-- <SL>0</SL> -->
<QKey>0x0</QKey>
<FlowLabel>0x0</FlowLabel>
<TClass>0x0</TClass>
</MulticastGroup>
. . .
</Multicast>
. . .
<!-- **************** Fabric Sweep **************************** -->
. . .
<MaxAttempts>8</MaxAttempts>
. . .
<!-- **************** SM Logging/Debug **************************** -->
. . .
<NodeAppearanceMsgThreshold>10</NodeAppearanceMsgThreshold>
. . .
<!-- **************** Miscellaneous **************************** -->
. . .
<!-- Overrides of the Common.Shared parameters if desired -->
<Priority>1</Priority> <!-- 0 to 15, higher wins -->
<ElevatedPriority>12</ElevatedPriority> <!-- 0 to 15, higher wins -->
. . .
</Sm>
<!-- Common FE (Fabric Executive) attributes -->
<Fe>
<Start>0</Start> <!-- default FE startup for all instances -->
. . .
60
Power Systems: High performance clustering
</Fe>
<!-- Common PM (Performance Manager) attributes -->
<Pm>
<Start>0</Start> <!-- default PM startup for all instances -->
. . .
</Pm>
<!-- Common BM (Baseboard Manager) attributes -->
<Bm>
<Start>0</Start> <!-- default BM startup for all instances -->
. . .
</Bm>
</Common>
Instance 0 of the FM. When editing the configuration file,
it is recommended that you note the instance in a comment
<!-- A single FM Instance/subnet -->
<!—INSTANCE 0 -->
<Fm>
. . .
<Shared>
. . .
<Name>ib0</Name> <!-- also for logging with _sm, _fe, _pm, _bm appended -->
<Hca>1</Hca> <!-- local HCA to use for FM instance, 1=1st HCA -->
<Port>1</Port> <!-- local HCA port to use for FM instance, 1=1st Port -->
<PortGUID>0x0000000000000000</PortGUID> <!-- local port to use for FM -->
<SubnetPrefix>0xfe80000000000042</SubnetPrefix> <!-- should be unique -->
. . .
</Shared>
<!-- Instance Specific SM (Subnet Manager) attributes -->
<Sm>
<!-- Overrides of the Common.Shared, Common.Sm or Fm.Shared parameters -->
<Priority>1</Priority>
<ElevatedPriority>8</ElevatedPriority>
</Sm>
. . .
</Fm>
Instance 1 of the FM. When editing the configuration file,
it is recommended that you note the instance in a comment
<!-- A single FM Instance/subnet -->
<!—INSTANCE 1 -->
<Fm>
. . .
<Shared>
<Start>1</Start> <!-- Overall Instance Startup, see fm0 for more info -->
<Name>ib1</Name> <!-- also for logging with _sm, _fe, _pm, _bm appended -->
<Hca>1</Hca> <!-- local HCA to use for FM instance, 1=1st HCA -->
<Port>2</Port> <!-- local HCA port to use for FM instance, 1=1st Port -->
<PortGUID>0x0000000000000000</PortGUID> <!-- local port to use for FM -->
<SubnetPrefix>0xfe80000000000043</SubnetPrefix> <!-- should be unique -->
<!-- Overrides of the Common.Shared or Fm.Shared parameters if desired -->
<!-- <LogFile>/var/log/fm1_log</LogFile> --> <!-- log for this instance -->
</Shared>
<!-- Instance Specific SM (Subnet Manager) attributes -->
<Sm>
<!-- Overrides of the Common.Shared, Common.Sm or Fm.Shared parameters -->
<Start>1</Start>
<Lmc>2</Lmc>
High-performance computing clusters using InfiniBand hardware
61
. . .
<Priority>0</Priority> <!-- 0 to 15, higher wins -->
<ElevatedPriority>8</ElevatedPriority> <!-- 0 to 15, higher wins -->
</Sm>
. . .
</Fm>
Instance 2 of the FM. When editing the configuration file,
it is recommended that you note the instance in a comment
<!-- A single FM Instance/subnet -->
<!—INSTANCE 2 -->
<Fm>
. . .
<Shared>
<Start>1</Start> <!-- Overall Instance Startup, see fm0 for more info -->
<Name>ib2</Name> <!-- also for logging with _sm, _fe, _pm, _bm appended -->
<Hca>2</Hca> <!-- local HCA to use for FM instance, 1=1st HCA -->
<Port>1</Port> <!-- local HCA port to use for FM instance, 1=1st Port -->
<PortGUID>0x0000000000000000</PortGUID> <!-- local port to use for FM -->
<SubnetPrefix>0xfe80000000000031</SubnetPrefix> <!-- should be unique -->
<!-- Overrides of the Common.Shared or Fm.Shared parameters if desired -->
<!-- <LogFile>/var/log/fm2_log</LogFile> --> <!-- log for this instance -->
</Shared>
<!-- Instance Specific SM (Subnet Manager) attributes -->
<Sm>
. . .
<Priority>1</Priority> <!-- 0 to 15, higher wins -->
<ElevatedPriority>8</ElevatedPriority> <!-- 0 to 15, higher wins -->
</Sm>
. . .
</Fm>
Instance 3 of the FM. When editing the configuration file,
it is recommended that you note the instance in a comment
<!-- A single FM Instance/subnet -->
<!—INSTANCE 3 -->
<Fm>
. . .
<Shared>
<Start>1</Start> <!-- Overall Instance Startup, see fm0 for more info -->
<Name>ib3</Name> <!-- also for logging with _sm, _fe, _pm, _bm appended -->
<Hca>2</Hca> <!-- local HCA to use for FM instance, 1=1st HCA -->
<Port>2</Port> <!-- local HCA port to use for FM instance, 1=1st Port -->
<PortGUID>0x0000000000000000</PortGUID> <!-- local port to use for FM -->
<SubnetPrefix>0xfe80000000000015</SubnetPrefix> <!-- should be unique -->
<!-- Overrides of the Common.Shared or Fm.Shared parameters if desired -->
<!-- <LogFile>/var/log/fm3_log</LogFile> --> <!-- log for this instance -->
</Shared>
<!-- Instance Specific SM (Subnet Manager) attributes -->
<Sm>
. . .
<Priority>0</Priority> <!-- 0 to 15, higher wins -->
<ElevatedPriority>8</ElevatedPriority> <!-- 0 to 15, higher wins -->
</Sm>
62
Power Systems: High performance clustering
. . .
</Fm>
</Config>
Plan for remote logging of Fabric Manager events:
v Plan to update /etc/syslog.conf (or the equivalent syslogd configuration file on your Fabric
Management Server) to point syslog entries to the Systems Management server. This requires
knowledge of the Systems Management Servers IP address. It is best to limit these syslog entries to
those that are created by the Subnet Manager. However, some syslogd applications generally do not
permit finely tuned forwarding.
– For the embedded Subnet Manager, the forwarding of log entries is achieved through a command
on the switch command-line interface (CLI), or through the Chassis Viewer.
v You are required to set a Notice message threshold for each Subnet Manager instance. This message is
used to limit the number of Notice or higher messages logged by the Subnet Manager on sweeps of
the network. The suggested limit is 10. Generally, if the number of Notice messages is greater than 10,
then the user is probably rebooting nodes or powering on switches again and causing links to go
down. See the IBM Clusters with the InfiniBand Switch website referenced in “Cluster information
resources” on page 2, for any updates to this suggestion.
The configuration setting planned here can be recorded in “QLogic fabric management worksheets” on
page 92.
Planning for Fabric Management and Fabric Viewer ends here
Planning Fast Fabric Toolset:
The Fast Fabric Toolset provides reporting and health check tools that are important for managing and
monitoring the fabric.
In-depth information about the Fast Fabric Toolset can be found in the Fast Fabric Toolset Users Guide
available from QLogic. The following information provides details about the Fast Fabric Toolset from a
cluster perspective.
The following items are the key things to remember when setting up the Fast Fabric Toolset in an IBM
System p or IBM Power Systems HPC cluster.
v The Fast Fabric Toolset requires you to install the QLogic InfiniServ host stack, which is part of the
Fast Fabric Toolset bundle.
v The Fast Fabric Toolset must be installed on each Fabric Management Server, including backups. See
“Planning for fabric management server” on page 64.
v The Fast Fabric tools that rely on the InfiniBand interfaces to collect report data can work only with
subnets to which their server is attached. Therefore, if you require more than one primary Fabric
Management Server, because you have more than four subnets. Then you must run two different
instances of the Fast Fabric Toolset on two different servers to query the state of all subnets.
v The Fast Fabric Toolset is used to interface with the following hardware:
– Switches
– Fabric management server hosts
– Not IBM systems (Vendor systems)
v To use xCAT for remote command access to the Fast Fabric Toolset, you must set up the host running
Fast Fabric as a device managed by xCAT. You can exchange ssh-keys with it for passwordless access.
v The master node referred in the Fast Fabric Toolset Users Guide is considered to be the host running the
Fast Fabric Toolset. In IBM System p or IBM Power Systems HPC clusters, this is not a compute or I/O
node, but is generally the Fabric Management Server.
High-performance computing clusters using InfiniBand hardware
63
v You cannot use the message passing interface (MPI) performance tests because they are not compiled
for the IBM System p or IBM Power Systems HPC clusters host stack.
v High-Performance Linpack (HPL) in the Fast Fabric Toolset is not applicable to IBM clusters.
v The Fast Fabric Toolset configuration must be set up in its configuration files. The default configuration
files are documented in the Fast Fabric Toolset. The following list indicates key parameters to be
configured in Fast Fabric Toolset configuration files.
–
–
–
–
Switch addresses go into chassis files.
Fabric management server addresses go into host files.
The IBM system addresses do not go into host files.
Create groups of switches by creating a different chassis file for each group. Some suggestions are:
1. A group of all switches, because they are all accessible on the service virtual local area network
(VLAN)
2. Groups that contain switches for each subnet
3. A group that contains all switches with ESM (if applicable)
4. A group that contains all switches running primary ESM (if applicable)
5. Groups for each subnet which contain the switches running ESM in the subnet (if applicable) include primaries and backups
– Create groups of Fabric Management Servers by creating a different host file for each group. Some
suggestions are:
1. A group of all fabric management servers, because they are all accessible on the service VLAN
2. A group of all primary fabric management servers
3. A group of all backup fabric management servers
v Plan an interval at which to run Fast Fabric Toolset health checks. Because health checks use fabric
resources, you cannot run them frequently enough to cause performance problems. Use the
recommendation given in the Fast Fabric Toolset Users Guide. Generally, you cannot run health checks
more often than every 10 minutes. For more information, see “Health checking” on page 157.
v In addition to running the Fast Fabric Toolset health checks, it is suggested that you query error
counters using iba_reports –o errors –F “nodepat:[switch IB node description pattern” –c
[config file] at least once every hour. Run this checks with a configuration file that has thresholds
turned to 1 for all but the V15Dropped and PortRcvSwitchRelayErrors, which can be commented out
or set to 0. For more information, see “Health checking” on page 157.
v You must configure the Fast Fabric Toolset health checks to use either the hostsm_analysis tools for
host-based fabric management or esm_analysis tools for embedded fabric management.
v If you are using host-based fabric management, you are required to configure Fast Fabric Toolset to
access all of the Fabric Management Servers running Fast Fabric.
v If you do not choose to set up passwordless ssh between the Fabric Management Server and the
switches, you must set up the fastfabric.conf file with the switch chassis passwords.
v The configuration setting planned here can be recorded in “QLogic fabric management worksheets” on
page 92.
Planning for Fast Fabric Toolset ends here.
Planning for fabric management server
With QLogic switches, the fabric management server is required to run the Fast Fabric Toolset, which is
used for managing and monitoring the InfiniBand network.
With QLogic switches, unless you have a small cluster, it is preferred that you use the host-based Fabric
Manager, which would also run on the Fabric Management Server. The total package of Fabric Manager
and Fast Fabric Toolset is known as the InfiniBand Fabric Suite (IFS). The fabric management server has
the following requirements.
v IBM System x 3550 or 3650.
64
Power Systems: High performance clustering
–
The 3550 is 1U high and supports two PCI Express (PCIe) slots. It can support a total of four
subnets.
–
v Memory requirements
– In the following bullets, a node is either a GX HCA port with a single logical partition, or a
PCI-based HCA port. If you have implemented more than one active logical partition in a server,
count each additional logical partition as an additional node. This also assumes a typical fat-tree
topology with either a single switch chassis per plane, or a combination of edge switches and core
switches. Management of other topologies might consume more memory.
– For fewer than 500 nodes, you require 500 MB for each instance of fabric manager running on a
fabric management server. For example, with four subnets being managed by a server, you would
require 2 GB of memory.
– For 500 to 1500 nodes, you require 1 GB for each instance of fabric manager running on a fabric
management server. For example, with four subnets being managed by a server, you would require
4 GB of memory.
– Swap space must follow Linux guidelines. This requires at least twice as much swap space as
physical memory.
v Plan sufficient rack space for the fabric management server. If space is available, the fabric
management server can be placed in the same rack with other management consoles such as the
Hardware Management Console (HMC), xCAT/MS, and others.
v One QLogic host channel adapter (HCA) for every two subnets to be managed by the server to a
maximum of four subnets.
v QLogic Fast Fabric Toolset bundle, which includes the QLogic host stack. For more information, see
“Planning Fast Fabric Toolset” on page 63.
v The QLogic host-based Fabric Manager. For more information, see “Planning the fabric manager and
fabric Viewer” on page 56.
v The number of fabric management servers is determined by the following parameters.
– Up to four subnets can be managed from each Fabric Management Server.
– One backup fabric management server must be available for each primary fabric management
server.
– For up to four subnets, a total of two fabric management servers must be available; one primary
and one backup.
v
v
v
v
– For up to eight subnets, a total of four fabric management servers must be available; two primaries
and two backups.
A backup fabric management server that has a symmetrical configuration to that of the primary fabric
management server, for any given group of subnets. This means that an HCA device number and port
on the backup must be attached to the same subnet as it is to the corresponding HCA device number
and port on the primary.
Designate a single fabric management server to be the primary data collection point for fabric
diagnosis data.
xCAT event management must be used in a cluster. To use xCAT event management, plan for the
following requirements.
– The type of syslogd that you would use. At a minimum, you must understand the default syslogd
that comes with the operating system on which xCAT is run.
– Whether you want to use TCP or udp as the protocol for transferring syslog entries from the fabric
management server to the xCAT/MS. Use TCP for better reliability.
For starting remote command to the fabric management server, you must know how to exchange SSH
keys between the fabric management server and the xCAT/MS. This is standard openSSH protocol
setup as done in either the AIX or Linux operating system.
High-performance computing clusters using InfiniBand hardware
65
v If you are updating from IFS 4 to IFS 5, then you can review the QLogic Fabric Management Users
Guide to learn about the new /etc/sysconfig/qlogic_fm.xml in IFS 5, which replaces the
/etc/sysconfig/iview_fm.config file. There are some attribute name changes, including the change
from a flat text file to an XML format. The mapping from the old to new names is included in an
appendix for the QLogic Fabric Management Users Guide. For each setting that is non-default in IFS 4,
record the mapping of the old to the new attribute name.
Note: This is covered in more detail in the Installation section for the Fabric Management Server.
In addition to planning for requirements, see “Planning Fast Fabric Toolset” on page 63 for information
about creating hosts groups for fabric management servers. These Planning Fast Fabric Toolsets are used
to set up configuration files for hosts for Fast Fabric tools.
The configuration settings planned here can be recorded in the “QLogic fabric management worksheets”
on page 92.
Planning for fabric management server ends here.
Planning event monitoring with QLogic and management server
Event monitoring for fabrics by using QLogic switches can be done with a combination of remote
syslogging and event management on the Clusters Management Server.
Use this information to plan event monitoring of fabrics by using QLogic switches.
Planning event monitoring with xCAT on the cluster management server: The result of event
management is the ability to forward switch and fabric management logs in a single log file on the
xCAT/MS in the typical event management log directory (/var/log/xcat/errorlog) with messages in the
auditlog. You can also use the included response script to “wall” log entries to the xCAT/MS console.
Finally, you can use the RSCT event sensor and condition-response infrastructure to write your own
response scripts to react to fabric log entries in the form that you want. For example, you can email the
log entries to an account.
For event monitoring to work between the QLogic switches and fabric manager and xCAT event
monitoring, the switches, xCAT/MS, and fabric management server running the host-based Fabric
Manager must all be on the same virtual local area network (VLAN). The cluster VLAN can be used.
To plan for event monitoring, complete the following items.
v Review the xCAT Monitoring How-To guide and the RSCT administration guide for more information
about the event monitoring infrastructure.
v Plan for the xCAT/MS IP address, so that you can point the switches and Fabric Manager to log there
remotely.
v Plan for the xCAT/MS operating system, so that you know which syslog sensor and condition to use.
One of the following sensors and conditions can be used.
– The xCAT sensor to be used is IBSwitchLogSensor. This sensor must be updated from the default
so that it looks only for NOTICE and above log entries. Because the preferred file/FIFO to monitor
is /var/log/xcat/syslog.fabric.notices, the sensor also must be updated to point to that file.
While it is possible to point to the default syslog file, or some other file, the procedures in this
document assume that /var/log/xcat/syslog.fabric.notices is used.
– The condition to be used is LocalIBSwitchLog, which is based on IBSwitchLog.
v To determine which response scripts to use, evaluate the following options.
– Use Log event anytime to log the entries to /tmp/systemEvents.
– Use Email root anytime to send mail to root when a log occurs. If you use this option, you have to
plan to disable it when booting large portions of the cluster. Otherwise, many logs are mailed.
– Consult the xCAT monitoring How-to to get the latest information about available response scripts.
66
Power Systems: High performance clustering
– Consider creating response scripts that are specialized to your environment. For example, you might
want to email an account other than root with log entries. See RSCT and xCAT documentation for
how to create such scripts and where to find the response scripts associated with Log event
anytime, Email root anytime, and LogEventToxCATDatabase, which can be used as examples.
v Plan regular monitoring of the file system containing /var on the xCAT/MS to ensure that it does not
get overrun.
The configuration settings planned here can be recorded in the “xCAT planning worksheets” on page 89.
Planning Event Monitoring with xCAT on the Cluster Management Server ends here.
Planning to run remote commands with QLogic from the management server
Remote commands can be started from the management server, which makes it simpler to perform
commands against multiple switches or fabric management servers simultaneously and remotely.
It also has the ability to create scripts that run on the Cluster Management Server and can be triggered
based on events on servers that can be monitored only from the Cluster Management Server.
Planning to run remote commands with QLogic from xCAT/MS: Remote commands can be started
from the xCAT/MS by using the xdsh command to the fabric management server and the switches.
Running remote commands is an important addition to the management infrastructure since it effectively
integrates the QLogic management environment with the IBM management environment.
For more details, see xCAT2IBsupport.pdf.
The following are some of the benefits for running remote commands.
v You can do manual queries from the xCAT/MS console without logging on to the fabric management
server or switch.
v Writing management and monitoring scripts that run from the xCAT/MS, which can improve
productivity for administration of the cluster fabric. For example, you can write scripts to act on nodes
based on fabric activity, or act on the fabric based on node activity.
v Easier data capture across multiple Fabric Management Servers or switches simultaneously.
The following items can be considered to plan for remote command execution.
v xCAT must be installed.
v The fabric management server and switch addresses are used.
v The Fabric Management Server and switches would be created as nodes.
v Node attributes for the Fabric Management Server would be:
– nodetype=FabricMS
v Node attributes for the switch would be:
– nodetype=IBSwitch::Qlogic
v Node groups can be considered for:
– All the fabric management servers; example: ALLFMS
– All primary fabric management servers; example: PRIMARYFMS
– All of the switches; example: ALLSW
– A separate subnet group for all of the switches on a subnet; example: ib0SW
–
v You can exchange ssh keys between the xCAT/MS and the switches and fabric management server
v For more secure installations, you might plan to disable telnet on the switches and the fabric
management server
High-performance computing clusters using InfiniBand hardware
67
The configuration settings planned here can be recorded in the “xCAT planning worksheets” on page 89.
Planning Remote Command Execution with QLogic from the xCAT/MS ends here.
Frame planning
After reviewing the server, fabric device, and the management subsystem information, you can review
the frames in which to place all the devices.
Fill-out the “Frame and rack planning worksheet” on page 79.
Planning installation flow
This information provides a description of the key installation points, organizations responsible for
installation, installation responsibilities for units and devices, and order that components are installed.
Installation coordination worksheets are also provided in this information.
Key installation points
When you are coordinating the installation of the many systems, networks and devices in a cluster, there
are several factors that drive a successful installation.
The following are key factors for a successful installation:
v The order of the installation of physical units is important. The units might be placed physically on the
data center floor in any order after the site is ready. However, there is a specific order for how they are
cabled, powered on, and recognized on the service subsystem.
v The types of units and contractual agreements affect the composition of the installation team. The team
can be composed of customer, IBM, or vendor personnel. For more guidance on installation
responsibilities, see “Installation responsibilities of units and devices” on page 69.
v If you have 12x host channel adapters (HCAs) and 4x switches, the switches must be powered on and
configured with the correct 12x groupings before servers are powered on. The order of port
configuration on 4x switches that are configured with groups of three ports acting as a 12x link is
important. Therefore, specific steps must be followed to ensure that the 12x HCA is connected as a 12x
link and not a 4x link.
v All switches must be connected to the same service virtual local area network (VLAN). If there are
redundant connections available on a switch, they must also be connected to the same service VLAN.
This connection is required because of the IP-addressing methods used in the switches.
Installation responsibilities by organization
Use this information to find who is responsible for aspects of installation.
Within a cluster that has an InfiniBand network, different organizations are responsible for installation
activities. The following table lists information about responsibilities for a typical installation. However, it
is possible for the specific responsibilities to change because of agreements between the customer and the
supporting hardware teams.
Note: Given the complexity of typical cluster installations, trained, and authorized installers must be
used.
68
Power Systems: High performance clustering
Table 37. Installation responsibilities
Installation responsibilities
Customer responsibilities:
v Install customer setup units (according to server model)
v Update system firmware
v Update InfiniBand switch software including Fabric Management software
v If applicable, install and customize the fabric management server including:
– The connection to the service virtual local area network (VLAN)
– Required vendor host stack
– If applicable, the QLogic Fast Fabric Toolset
v Customize InfiniBand network configuration
v Customize host channel adapter (HCA) partitioning and configuration
v Verify the InfiniBand network topology and operation
IBM responsibilities:
v Install and service IBM installable units (servers) and adapters and HCAs and switches with an IBM machine
type and model.
v Cable the InfiniBand network if it contains IBM cable part numbers and switches with an IBM machine type and
model.
v Verify server operation for IBM installable servers
Third-party vendor responsibilities:
Note: This information does not detail the contractual possibilities for third-party responsibilities. By contract, the
customer might be responsible for some of these activities. It is suggested that you note the customer name or
contracted vendor when planning these activities so that you can better coordinate all the activities of the installers.
In some cases, IBM might be contracted for one or more of these activities.
v Install switches without an IBM machine type and model
v Set up the service VLAN IP and attach switches to the service VLAN
v Cable the InfiniBand network when there are not switches with an IBM machine type and model
v Verify switch operation through status and LED queries when there are not switches with an IBM machine type
and model
Installation responsibilities of units and devices
Use this information to determine who is responsible for the installation of units and devices.
Note: It is possible that a contracted agreement might alter the basic installation responsibilities for
particular devices.
Table 38. Hardware to install and who is responsible for the installation
Hardware to install
Who is responsible for the installation
Servers
Unless otherwise contracted, the use of a server in a cluster with an InfiniBand
network does not change the normal installation and service responsibilities
for it. There are some servers that are installed by IBM and others that are
installed by the customer. See the specific server literature to determine who is
responsible for the installation.
Hardware Management Console
(HMC)
The type of servers attached to the HMCs dictate who installs them. See the
HMC documentation to determine who is responsible for the installation. This
is typically the customer or IBM service.
xCAT
xCAT are the preferred Systems Management tools. They can also be used as a
centralized source for device discovery in the cluster. The customer is
responsible for xCAT installation and customization.
High-performance computing clusters using InfiniBand hardware
69
Table 38. Hardware to install and who is responsible for the installation (continued)
Hardware to install
Who is responsible for the installation
InfiniBand switches
The switch manufacturer or its designee (IBM Business Partner) or another
contracted organization is responsible for installing the switches. If the
switches have an IBM machine type and model, IBM is responsible for them.
Switch network cabling
The customer must work with the switch manufacturer or its designee or
another contracted organization to determine who is responsible for installing
the switch network cabling. However, if a cable with an IBM part number
fails, IBM service is responsible for servicing the cable.
Service VLAN Ethernet devices
Ethernet switches or routers required for the service virtual local area network
(VLAN) are the responsibility of the customer.
VLAN cabling
The organization responsible for the installation of a device is responsible for
connecting it to the service VLAN.
Fabric Manager software
The customer is responsible for updating the Fabric Manager software on the
switch or the fabric management server.
Fabric Manager server
The customer is responsible for installing, customizing, and updating the fabric
management server.
QLogic Fast Fabric Toolset and host The customer is responsible for installing, customizing, and updating the
stack
QLogic Fast Fabric Toolset and host stack on the fabric management server.
Order of installation
Use this information to learn the tasks required to install a new cluster.
This information provides a high-level outline of the general tasks required to install a new cluster. If you
understand the full installation flow of a new cluster, you can identify the tasks that can be performed
when you expand your InfiniBand cluster network. Tasks such as adding InfiniBand hardware to an
existing cluster, adding host channel adapters (HCAs) to an existing InfiniBand network, and adding a
subnet to an existing network are described. To complete a cluster installation, all devices and units must
be available before you begin installing the cluster.
The following are the fundamental tasks that are required for installing a cluster.
1. The site is set up with power, cooling, and floor space and floor load requirements.
2.
3.
4.
5.
6.
7.
8.
The
The
The
The
The
The
The
switches and processing units are installed and configured.
management subsystem is installed and configured.
units are cabled and connected to the service virtual local area network (VLAN).
units can be verified and discovered on the service VLAN.
basic unit operation is verified.
cabling for the InfiniBand network is connected.
InfiniBand network topology and operation is verified.
Figure 11 on page 71 shows a breakdown of the tasks by major subsystem. The following list illustrates
the preferred order of installation by major subsystem. The order minimizes potential problems with
performing recovery operations as you install, and also minimizes the number of reboots of devices
during the installation.
1. Management consoles and the service VLAN (Management consoles include the HMC, any server
running xCAT, and a Fabric Management Server)
2. Servers in the cluster
3. Switches
4. Switch cable installation
70
Power Systems: High performance clustering
By breaking down the installation by major subsystem, you can see how to install the units in parallel. Or
how you might be able to perform some installation tasks for on-site units while waiting for other units
to be delivered.
It is important that you recognize the key points in the installation where you cannot proceed with one
subsystems installation task before completing the installation tasks in the other subsystem. These are
called as merge points, and are illustrated by using the inverted triangle symbol in Figure 11.
The following items are some of the key merge points.
1. The management consoles must be installed and configured before starting to cable the service VLAN.
This allows dynamic host configuration protocol (DHCP) management of the IP-addressing on the
service VLAN. Otherwise, the addressing might be compromised. This is not as critical for the fabric
management server. However, the fabric management server must be operational before the switches
are started on the network.
2. You must power on the InfiniBand switches and configure their IP addresses before connecting them
to the service VLAN. If this is not done, then you must power them on individually and change their
addresses by logging into each of them by using their default address.
3. If you have 12x host channel adapters (HCAs) connected to 4x switches, you must power on switches
and cable them to their ports. And configure the 12x groupings before attaching cables to HCAs in
servers that have been powered on to Standby mode or beyond. This allows auto-negotiation to 12x
by the HMCs to occur smoothly. When powering on the switches, it is not guaranteed that the ports
become operational in an order that makes the link appear as 12x to the HCA. Therefore, you must be
sure that the switch is properly cabled, configured, and ready to negotiate to 12x before starting the
adapters.
4. To fully verify the InfiniBand network, the servers must be fully installed in order to send data and
run tools required to verify the network. The servers must be powered on to Standby mode for
topology verification.
a. With QLogic switches, you can use the Fast Fabric Toolset to verify topology. Alternatively, you
can use the Chassis Viewer and Fabric Viewer.
Figure 11. High-level cluster installation flow
Important: In each task box of Figure 11, there is also an index letter and number. These indexes indicate
the major subsystem installation tasks and you can use them to cross-reference between the following
descriptions and the tasks in the figure.
The tasks indexes are listed before each of the following major subsystem installation items:
U1: Site setup for power and cooling, including proper floor cutouts for cable routing.
M1, S1, W1: Place units and frames in their correct positions on the data center floor. This includes, but is
not limited to HMCs, fabric management servers, and cluster servers (with HCAs, I/O devices, and
storage devices) and InfiniBand switches. You can physically place units on the floor as they arrive.
However, do not apply power or cable units to the service VLAN or to the InfiniBand network until
instructed to do so.
Management console installation steps M2 through M4 have multiple tasks associated with each of them.
Review the details in “Installing and configuring the management subsystem” on page 98 to see where
you can assign different people to those tasks that can be performed simultaneously.
M2: Perform the initial management console installation and configuration. This includes HMCs, fabric
management server, and DHCP service for the service VLAN.
v Plan and setup static addresses for HMCs and switches.
High-performance computing clusters using InfiniBand hardware
71
v Plan and setup DHCP ranges for each service VLAN.
Important: If these devices and associated services are not set up correctly before applying power to the
base servers and devices, you might not be able to correctly configure and control cluster devices.
Furthermore, if this is done out of sequence, the recovery procedures for doing this part of the cluster
installation can be lengthy.
M3: Connect server hardware control points to the service VLAN as instructed by server installation
documentation. The location of the connection is dependent on the server model and might involve a
connection to the bulk power controllers (BPCs) or be directly attached to the service processor. Do not
attach switches to the cluster VLAN at this time.
Also, attach the management consoles to the service and cluster VLANs.
Note: Switch IP-addressing must be static. Each switch comes up with the same default address,
therefore, you must set the switch address before it is added to the service VLAN, or bring the switches
one at a time onto the service VLAN and assign a new IP address before bringing the next switch onto
the service VLAN.
M4: Do the portion of final management console installation and configuration which involves assigning
or acquiring servers to their managing HMCs and authenticating frames and servers through Cluster
Ready Hardware Server (CRHS).
Note: The double arrow between M4 and S3 indicates that these two tasks cannot be completed
independently. As the server installation portion of the flow is completed, then the management console
configuration can be completed.
Setup remote logging and remote command execution and verify these operations.
When M4 is complete, the bulk power assemblies (BPAs) and cluster service processors must be at power
standby state. To be at the power standby state, the power cables for each server must be connected to
the appropriate power source. Prerequisites for M4 are M3, S2, and W3; co-requisite for M4 is S3.
The following server installation and configuration operations (S2 through S7) can be performed
sequentially once step M3 has been performed.
M3
This is in the Management Subsystem Installation flow, but the tasks are associated with the servers. Attach
the cluster server service processors and BPAs to the service VLAN. This must be done before connecting
power to the servers, and after the management consoles are configured, so that the cluster servers can be
discovered correctly.
S2
To bring the cluster servers to the power standby state, connect the servers in the cluster to their appropriate
power sources. Prerequisites for S2 are M3 and S1.
S3
Verify the discovery of the cluster servers by the management consoles.
S4
Update the system firmware.
S5
Verify the system operation. Use the server installation manual to verify that the system is operational.
S6
Customize logical partition and HCA configurations.
S7
Load and update the operating system.
Complete the following switch installation and configuration tasks W2 through W6.
W2
72
Power on and configure IP address of the switch Ethernet connections. This must be done before attaching it
to the service VLAN.
Power Systems: High performance clustering
W3
Connect switches to the cluster VLAN. If there is more than one VLAN, all switches must be attached to a
single cluster VLAN, and all redundant switch Ethernet connections must be attached to the same network.
Prerequisites for W3 are M3 and W2.
W4
Verify discovery of the switches.
W5
Update the switch software.
W6
Customize InfiniBand network configuration.
Complete C1 through C4 for cabling the InfiniBand network.
Notes:
1. It is possible to cable and start networks other than the InfiniBand networks before cabling and
starting the InfiniBand network.
2. When plugging InfiniBand cables between switches and HCAs, connect the cable to the switch end
first. Connecting the cable to the switch end first is important in this phase of the installation.
C1
Route cables and attach cables ends to the switch ports. Apply labels at this time.
C2
If 12x
HCAs are connecting to 4x switches and the links are being configured to run at 12x instead of 4x, the
switch ports must be configured in groups of three 4x ports to act as a single 12x link. If you are
configuring links at 12X, go to C3. Otherwise, go to C4.
Prerequisites for C2 are W2 and C1.
C3
Configure 12x groupings on switches. This must be done before attaching HCA ports. Assure that switches
remain powered-on before attaching HCA ports.
Prerequisite is a Yes to decision point C2.
C4
Attach the InfiniBand cable ends to the HCA ports.
Prerequisite is either a No decision in C2 or if the decision in C2 was Yes, then C3 must be done first.
Complete V1 through V3 to verify the cluster networking topology and operation.
V1
This involves checking the topology by using QLogic Fast Fabric tools. There might be different methods for
checking the topology. Prerequisites for V1 are M4, S7, W6 and C4.
V2
You must also check for serviceable events reported to the HMC. Furthermore, an all-to-all ping is
suggested to exercise the InfiniBand network before putting the cluster into operation. A vendor might have
a different method for verifying network operation. However, you can consult the HMC, and address any
open serviceable events. If a vendor has discovered and resolved a serviceable event, then the serviceable
event must be closed. Prerequisite for V2 is V1.
V3
You must contact service numbers to resolve problems after service representatives leave the site.
In the “Installation coordination worksheet,” there is a sample worksheet to help you coordinate tasks
among installation teams and members.
Related concepts
“Hardware Management Console” on page 18
You can use the Hardware Management Console (HMC) to manage a group of servers.
Installation coordination worksheet
Use this worksheet to coordinate installation tasks.
High-performance computing clusters using InfiniBand hardware
73
Each organization can use a separate installation worksheet and the worksheet can be completed by
using the flow shown in Figure 11 on page 71.
It is good practice for each individual and team participating in the installation review the coordination
worksheet ahead of time and identify their dependencies on other installers.
Management console installation steps M2 – M4 from Figure 11 on page 71 have multiple tasks associated
with each of them. You can also review the details for them in Figure 12 on page 100 and see where you
can assign different individuals to those tasks that can be performed simultaneously.
Table 39. Sample Installation coordination worksheet
Organization:
Task
Task description
Prerequisite tasks
Scheduled date
Completed date
The following table is an example of a completed installation coordination worksheet.
Table 40. Example: Completed installation coordination worksheet
Organization: IBM Service
Task
Task description
Prerequisite tasks
Scheduled date
S1
Place model servers on floor
4/20/2010
M3
Cable the model servers and BPAs to
service VLAN
4/20/2010
S2
Start the model servers
4/20/2010
S3
Verify discovery of the system
4/20/2010
S5
Verify system operation
4/20/2010
Completed date
Planning Installation Flow ends here.
Planning for an HPC MPI configuration
Use this information to plan an IBM high-performance computing (HPC) message passing interface (MPI)
configuration.
The following assumptions apply to HPC MPI configurations.
v Proven configurations for an HPC MPI configuration are limited to:
– Eight subnets for each cluster
– Up to eight links out of a server
v Servers are shipped preinstalled in frames.
v Servers are shipped with a minimum level of firmware to enable the system to perform an initial
program load (IPL) to POWER Hypervisor standby.
Because HPC applications are designed for performance, it is important to configure the InfiniBand
network components with performance as a key element. The main consideration is that the LID Mask
Control (LMC) field in the switches must be set to provide more local identifiers (LIDs) per port than the
default of one. This provides more addressability and better opportunity for using available bandwidth in
the network. The HPC software provided by IBM works best with an LMC value of 2. The number of
LIDs is equal to 2x, where x is the LMC value. Therefore, the LMC value of 2 that is required for IBM
74
Power Systems: High performance clustering
HPC applications results in four (4) LIDs for each port. The IBM MPI performance gain is realized
particular in the FIFO mode. Consult performance papers and IBM for information about the impact of
LMC is equal to 2 on RDMA. The default is to not use the LMC is equal to 2, and use only the first of
the 4 available LIDs. This reduces startup time and overhead for managing Queue Pairs (QPs), which are
used in establishing protocol-level communication between InfiniBand interfaces. For each LID used,
another QP must be created to communicate with another InfiniBand interface on the InfiniBand subnet.
See “Planning maximum transfer unit (MTU)” on page 51 for planning the maximum transfer unit (MTU)
for communication protocols.
The LMC and MTU settings planned here can be recorded in “QLogic and IBM switch planning
worksheets” on page 83 which is meant to record switch and Subnet Manager configuration information.
Important information for planning an HPC MPI configuration ends here.
Planning 12x HCA connections
Use this information for a brief description of host channel adapter (HCA) requirements.
Host channel adapters with 12x capabilities have a 12x connector. Supported switch models have only 4x
connectors.
You can use a width exchanger cable to connect a 12x width HCA connector to a single 4x width switch
port. The exchanger cable has a 12x connector on one end and a 4x connector on the other end.
Planning aids
Use this information to identify tasks that might be part of planning your cluster hardware.
Consider the following tasks when planning for your cluster hardware.
v Determine a convention for frame numbering and slot numbering, where slots are the location of cages
as you go from the bottom of the frame to the top. If you have empty space in a frame, reserve a
number for that space.
v Determine a convention for switch and system unit naming that includes physical location, including
their frame numbers and slot numbers.
v Prepare labels for frames to indicate frame numbers.
v Prepare cable labels for each end of the cables. Indicate the ports to which each end of the cable
connects.
v Document where switches and servers are located and which Hardware Management Console (HMC)
manages them.
v Print out a floor plan and keep it with the HMCs.
Planning Aids ends here.
Planning checklist
The planning checklist helps you track your progress through the planning process.
Table 41. Planning checklist
Target
date
Step
Completed
date
Start planning checklist
Gather documentation and review planning information for individual units and
applications.
High-performance computing clusters using InfiniBand hardware
75
Table 41. Planning checklist (continued)
Target
date
Step
Completed
date
Ensure that you have planned for:
v Servers
v I/O devices
v InfiniBand network devices
v Frames or racks for servers, I/O devices and switches, and management servers
v Service virtual local area network (VLAN), including:
– Hardware Management Console (HMC)
– Ethernet devices
– xCAT Management Server (for multiple HMC environments)
– Network Installation Management (NIM) server (for AIX servers that do not have
removable media)
–
Distribution server (for Linux servers that do not have removable media)
– Fabric management server
v System management applications (HMC and xCAT)
v Where Fabric Manager runs - host-based (HSM) or embedded (Tivoli Event Services
Manager)
v Fabric management server (for HSM and Fast Fabric toolset)
v Physical dimension and weight characteristics
v Electrical characteristics
v Cooling characteristics
Ensure that you have the required levels of supported firmware, software, and hardware
for your cluster. See “Required level of support, firmware, and devices” on page 28.
Review the cabling and topology documentation for InfiniBand networks provided by the
switch vendor.
Review “Planning installation flow” on page 68
Review “Planning for an HPC MPI configuration” on page 74
Review “Planning 12x HCA connections” on page 75, if you are using 12x host channel
adapters.
Review “Planning aids” on page 75
Complete planning worksheets
Complete planning process
Review readme files and online information related to software and firmware to ensure that
you have up-to-date information and the latest support levels.
Planning checklist ends here.
Planning worksheets
Planning worksheets can be used to plan your cluster environment.
Tip: Keep the planning worksheets in a location that is accessible to the system administrators and
service representatives for the installation, and for future reference during maintenance, upgrade, or
repair actions.
All the worksheets and checklists are available in the respective topics.
76
Power Systems: High performance clustering
Using the planning worksheets
The planning worksheets do not cover every situation you might encounter (especially the number of
instances of slots in a frame, servers in a frame, or I/O slots in a server). However, they can provide
enough information upon which you can build a custom worksheet for your application. In some cases,
you might find it useful to create the worksheets in a spreadsheet application so that you can fill out
repetitive information. Otherwise, you can devise a method to indicate repetitive information in a
formula on printed worksheets. So that you do not have to complete large numbers of worksheets for a
large cluster that is likely to have a definite pattern in frame, server, and switch configuration.
The planning worksheets can be completed in the following order. You must refer some of the
worksheets as you generate the new information.
1. “Cluster summary worksheet”
2. “Frame and rack planning worksheet” on page 79
3. “Server planning worksheet” on page 81
4. Applicable vendor software/firmware planning worksheets
v “QLogic and IBM switch planning worksheets” on page 83
v “QLogic fabric management worksheets” on page 92
For examples of completed planning worksheets, see the examples that follow each blank worksheet.
Planning worksheets ends here.
Cluster summary worksheet
Use the cluster summary worksheet to record information for your cluster planning.
Record your cluster planning information in the following worksheet.
Table 42. Sample Cluster summary worksheet
Cluster summary worksheet
Cluster name:
Application: High-performance cluster (HPC) or not:
Number and types of servers:
Number of servers and host channel adapters (HCAs) for each server:
Note: If there are servers with varying numbers of HCAs, list the number of servers with each configuration. For
example, 12 servers with one 2-port HCA; 4 servers with two 2-port HCAs.
Number and types of switches (include model numbers):
Number of subnets
List of global identifier (GID) prefixes and subnet masters (assign a number to a subnet for easy reference)
Switch partitions:
Number and types of frames: (include systems, switches, management servers, NIM server, or distribution server)
Number of Hardware Management Consoles (HMCs):
xCAT to be used?
If Yes -> server model:
High-performance computing clusters using InfiniBand hardware
77
Table 42. Sample Cluster summary worksheet (continued)
Cluster summary worksheet
Number and models of fabric management servers:
Number of Service VLANs:
Service VLAN domains:
Service VLAN DHCP server locations:
Service VLAN: InfiniBand switches static IP: addresses: (not typical)
Service VLAN HMCs with static IP:
Service VLAN DHCP ranges:
Number of cluster VLANs:
Cluster VLAN security addressed: (yes/no/comments)
Cluster VLAN domains:
Cluster VLAN DHCP server locations:
Cluster VLAN: InfiniBand switches static IP: addresses:
Cluster VLAN HMCs with static IP:
Cluster VLAN DHCP ranges:
AIX NIM server information:
Linux distribution server information:
NTP server information:
Power requirements:
Maximum cooling required:
Number of cooling zones:
Maximum weight per area: Minimum weight per area:
The following worksheet is an example of a completed cluster summary worksheet.
Table 43. Example: Completed cluster summary worksheet
Cluster summary worksheet
Cluster name: Example
Application: (HPC or not) HPC
Number and types of servers: (96) 9125-F2A
Number of servers and host channel adapters (HCAs) per server:
Each 9125-F2A has one HCA
Note: If there are servers with varying numbers of HCAs, list the number of servers with each configuration. For
example, 12 servers with one 2-port HCA; 4 servers with two 2-port HCAs.
Number and types of switches (include model numbers):
(4) 9140 (require connections for fabric management servers and for 9125-F2A servers
Number of subnets: 4
List of GID prefixes and subnet masters (assign a number to a subnet for easy reference)
78
Power Systems: High performance clustering
Table 43. Example: Completed cluster summary worksheet (continued)
Cluster summary worksheet
Switch partitions:
subnet 1 = FE:80:00:00:00:00:00:00 (egf11fm01)
subnet 2 = FE:80:00:00:00:00:00:01 (egf11fm02)
subnet 3 = FE:80:00:00:00:00:00:00 (egf11fm01)
subnet 4 = FE:80:00:00:00:00:00:01 (egf11fm02)
Number and types of frames: (include systems, switches, management servers, Network Installation Management
(NIM) servers (AIX) and distribution servers (Linux)
(8) for 9125-F2A
(1) for switches, and fabric management servers
Number of Hardware Management Consoles (HMCs): 3
xCAT to be used?
If Yes -> server model: Yes
Number and models of fabric management servers: (1) System x 3650
Number of Service virtual local area networks (VLANs): 2
Service VLAN domains: 10.0.1.x, 10.0.2.x
Service VLAN DHCP server locations: egxcatsv01 (10.0.1.1) (xCAT/MS)
Service VLAN: InfiniBand switches static IP: addresses: (not typical) Not Applicable (see Cluster VLAN)
Service VLAN HMCs with static IP: 10.0.1.2 - 10.0.1.4
Service VLAN DHCP ranges: 10.0.1.32 - 10.0.1.128
Number of cluster VLANs: 1
Cluster VLAN security addressed: (yes/no/comments) yes
Cluster VLAN domains: 10.1.1.x
Cluster VLAN DHCP server locations: egxcatsv01 (10.0.1.1) (xCAT/MS)
Cluster VLAN: InfiniBand switches static IP: addresses: 10.1.1.10 - 10.1.1.13
Cluster VLAN HMCs with static IP: Not Applicable
Cluster VLAN DHCP ranges: 10.1.1.32 - 10.1.1.128
AIX NIM server information: xCAT/MS
Linux distribution server information: Not applicable
NTP server information: xCAT/MS
Power requirements: See site planning
Maximum cooling required: See site planning
Number of cooling zones: See site planning
Maximum weight per area: Minimum weight per area: See site planning
Frame and rack planning worksheet
The frame and rack planning worksheet is used for planning how to populate your frames or racks.
High-performance computing clusters using InfiniBand hardware
79
You must know the quantity of each device type, including, server, switch, and bulk power assembly
(BPA). For the slots, you can indicate the range of slots or drawers that the device populates. A standard
method for naming slots can either be found in the documentation for the frames or servers, or you can
choose to use EIA heights (1.75 in.) as a standard.
You can include frames for systems, switches, management servers, Network Installation Management
(NIM) servers (AIX), distribution servers (Linux), and I/O devices.
Table 44. Sample Frame and rack planning worksheet
Frame planning worksheet
Frame number or numbers: _____________________
Frame MTM or feature or type: _____________________
Frame size: _______________ (19 in. or 24 in.)
Number of slots: ___________________
Slots
Device type (server, switch, BPA)
Device name
Indicate machine type and model number
The following worksheets are an example of a completed frame planning worksheets.
Table 45. Example: Completed frame and rack planning worksheet (1 of 3)
Frame planning worksheet (1 of 3)
Frame number or numbers: _______1 - 8______________
Frame MTM or feature or type: ____for 9125-F2A_________________
Frame size: ____24___________ (19 in. or 24 in.)
Number of slots: ______12_____________
Slots
Slots
Device type (server, switch, BPA)
Device name
Indicate machine type and model number
1-12
Server 9125-F2A
egf[frame#]n[node#]
egf01n01 - egf08n12
80
Power Systems: High performance clustering
Table 46. Example: Completed frame and rack planning worksheet (2 of 3)
Frame planning worksheet (2 of 3)
Frame number or numbers: _______10______________
Frame machine type and model number: _____________________
Frame size: ____19___________ (19 in. or 24 in.)
Number of slots: ______4_____________
Slots
Slots
Device type (server, switch, BPA)
Device name
Indicate machine type and model number
1-4
Switch 9140
egf10sw1-4
5
Power unit
Not applicable
Table 47. Example: Completed frame and rack planning worksheet (3 of 3)
Frame planning worksheet (3 of 3)
Frame number or numbers: _______11______________
Frame machine type and model number: _____19 in.________________
Frame size: ____19 in.___________ (19 in. or 24 in.)
Number of slots: ______8_____________
Slots
Slots
Device type (server, switch, BPA)
Device name
Indicate machine type and model number
1-2
System x 3650
egf11fm01; egf11fm02
3-5
HMCs
egf11hmc01 - egf11hmc03
6
xCAT/MS
egf11xcat01
Server planning worksheet
You can use this worksheet as a template for multiple servers with similar configurations.
For such cases, you can give the range of names of these servers and where they are located. You can
also use the configuration note to remind you of other specific characteristics of the server. It is important
to note the type of host channel adapters (HCAs) to be used.
High-performance computing clusters using InfiniBand hardware
81
Table 48. Sample Server planning worksheet
Server planning worksheet
Names: _____________________________________________
Types: ______________________________________________
Frame or Frames slot or slot: ____________________________
Number and type of HCAs_________________________________
Number of LPARs or /LHCAs: ____________________________________
IP addressing for InfiniBand: __________________
Partition with service authority: ____________________________________
IP-addressing of service VLAN: _____________________________________________________
IP-addressing of cluster VLAN: ________________________________________________
LPAR IP-addressing: ____________________________________________________________
MPI addressing: ________________________________________________________________
Configuration notes:
HCA information
HCA
Capability (sharing)
HCA port
Switch connection
GID prefix
Operating system
type
GUID index
Shared HCA (capability)
Switch partition
LPAR
LPAR or LHCA
(give name)
The following worksheet shows an example of a completed server planning worksheet.
82
Power Systems: High performance clustering
Table 49. Example: Completed server planning worksheet
Server planning worksheet
Names: __________egf01n01 – egf08n12_______________________
Types: _________9125-F2A____________________
Frame or frames/slot or slots: _______1-8/1-12_________________________________
Number and type of HCAs___(1) IBM GX+ per 9125-F2A____________________
Number of LPARs or LHCAs: ___1/4_________________________________
IP-addressing for InfiniBand: _______10.1.2.32-10.1.2.128 10.1.3.32-10.1.3.128 10.1.4.x 10.1.5.x___
Partition with service authority: ____________Yes________________________
IP-addressing of service VLAN: _10.0.1.32-10.1.1.128; 10.0.2.32-10.0.2.128__
IP-addressing of cluster VLAN: ____10.1.1.32-10.1.1.128________________________
LPAR IP addressing: _________10.1.5.32-10.1.5.128___________________________
MPI addressing: ________________________________________________________________
Configuration notes:
HCA information
HCA
Capability (sharing)
HCA port
Switch connection
GID prefix
C65
Not applicable
C65-T1
Switch1:Frame1=Leaf1
FE:80:00:00:00:00:00:00
Frame8=Leaf8
C65
Not applicable
C65-T2
Switch2:Frame1=Leaf1
FE:80:00:00:00:00:00:01
Frame8=Leaf8
C65
Not applicable
C65-T3
Switch3:Frame1=Leaf1
FE:80:00:00:00:00:00:02
Frame8=Leaf8
C65
Not applicable
C65-T4
Switch4:Frame1=Leaf1
FE:80:00:00:00:00:00:03
Frame8=Leaf8
LPAR
LPAR or LHCA
(give name)
Operating system
type
GUID index
Shared HCA (capability)
Switch partition
egf01n01sq01 –
egf08n12sq01
AIX
0
Not applicable
Not applicable
QLogic and IBM switch planning worksheets
Use the appropriate QLogic switch planning worksheet for each type of switch.
When documenting connections to switch ports, you can indicate both a shorthand for your own use and
the IBM host channel adapter (HCA) physical locations.
For example, if you are connecting port 1 of a 24-port switch to port 1 of the only HCAs in an IBM
Power 575 that you are going to name f1n1, you might want to use the shorthand f1n1-HCA1-Port1 to
indicate this connection.
High-performance computing clusters using InfiniBand hardware
83
It might also be useful to note the IBM location code for this HCA port. You can get the location code
information specific to each server in the server documentation during the planning process. Or you can
work with the IBM service representative at the time of the installation to make the correct notation of
the IBM location code. Generally, the only piece of information not available during the planning phase is
the server serial number, which is used as part of the location code.
Host channel adapters generally have the location code: U[server feature code].001.[server serial
number]-Px-Cy-Tz where Px represents the planar into which the HCA is plugged and Cy represents the
planar connector into which the HCA is plugged and Tz represents the HCA port into which the cable is
plugged.
Planning worksheet for 24-port switches:
Use this worksheet to plan for a 24-port QLogic switch.
Table 50. Sample QLogic 24-port switch planning worksheet
24-port switch worksheet
Switch model: ______________________________
Switch name: ______________________________ (set by using setIBNodeDesc)
xCAT Device/Node name: ___________________________
Frame and slot: ______________________________
Cluster virtual VLAN IP address: _________________________________
Default gateway: ___________________
GID-prefix: _________________________________
LMC: _____________________________________ (0=default 2=if used in HPC cluster)
NTP Server: _____________________________
Switch MTMS: ______________________________ (Fill out during installation)
New admin password: _________________________ (Fill out during installation)
Remote logging host: __________________________
Ports
Connection or Amplitude or Pre-emphasis
1 (16)
2
3
4
5
6
7
8
9
10
11
12
13
14
84
Power Systems: High performance clustering
Table 50. Sample QLogic 24-port switch planning worksheet (continued)
24-port switch worksheet
15
16
17
18
19
20
21
22
23
24
Planning worksheet for switches with more than 24 ports:
Use these worksheets for planning switches with more than 24 ports (ones with leafs and spines).
The first worksheet is for the overall switch chassis planning. The second worksheet is planning for each
leaf.
Table 51. Planning worksheet for Director or core switch with more than 24 ports
Director or Core Switch (greater than 24 ports)
Switch model: _____________________________
Switch name: ____________________________ (set by using setIBNodeDesc)
xCAT Device/Node name:___________________
Frame and slot: ____________________________
Chassis IP addresses: ____________________________________________________
(9240 has 2 hemispheres)
Spine IP addresses: _____________________________________________________________ (indicate spine slot)
Default gateway: _________________________________________________
GID-prefix: ______________________________
LMC: __________________________________ (0=default 2=if used in HPC cluster)
NTP Server: _____________________________
Switch MTMS: ___________________________ (Fill out during installation)
New admin password: _________________________ (Fill out during installation)
Remote logging host: __________________________
The following worksheet can be used to plan for each leaf.
High-performance computing clusters using InfiniBand hardware
85
Table 52. Sample: Planning worksheet for Director or core switch with more than 24 ports - leaf configuration
Leaf _____
Ports
Leaf ____
Connection
Ports
1
1
2
2
3
3
4
4
5
5
6
6
7
7
8
8
9
9
10
10
11
11
12
12
Connection
The following worksheets are examples of the switch planning worksheets.
Table 53. Example: Planning worksheet for Director or core switch with more than 24 ports
Director or Core Switch (greater than 24 ports) (1 of 4)
Switch Model: ____9140_________________________
Switch name: _____egsw01_______________________ (set by using setIBNodeDesc)
xCAT Device/Node name:_________xCAT 123__________
Frame and slot: ____f10s01________________________
Chassis IP addresses: _________10.1.1.10___________________________________________
(9240 has 2 hemispheres)
Spine IP addresses: _____slot1=10.1.1.16 slot2=10.1.1.20 _____________ (indicate spine slot)
Default gateway: _________________________________________________
GID-prefix: _fe.80.00.00.00.00.00.00_________________
LMC: ___________2_______________________ (0=default 2=if used in HPC cluster)
NTP Server: ______xCAT/MS_____________________
Switch MTMS: ___________________________ (Fill out during installation)
New admin password: _________________________ (Fill out during installation)
Remote logging host: _____xCAT/MS_______________
The following worksheet can be used to plan for each leaf.
86
Power Systems: High performance clustering
Table 54. Example: Planning worksheet for Director or core switch with more than 24 ports - leaf configuration (2 of
4)
Leaf __1___
Leaf __2__
Ports
Connection
Ports
Connection
1
f01n01-C65-T1
1
f02n01-C65-T1
2
f01n02-C65-T1
2
f02n02-C65-T1
3
f01n03-C65-T1
3
f02n03-C65-T1
4
f01n04-C65-T1
4
f02n04-C65-T1
5
f01n05-C65-T1
5
f02n05-C65-T1
6
f01n06-C65-T1
6
f02n06-C65-T1
7
f01n07-C65-T1
7
f02n07-C65-T1
8
f01n08-C65-T1
8
f02n08-C65-T1
9
f01n09-C65-T1
9
f02n09-C65-T1
10
f01n10-C65-T1
10
f02n10-C65-T1
11
f01n11-C65-T1
11
f02n11-C65-T1
12
f01n12-C65-T1
12
f02n12-C65-T1
Table 55. Example: Planning worksheet for Director or core switch with more than 24 ports - leaf configuration
Leaf __7___
Leaf __8__
Ports
Connection
Ports
Connection
1
f07n01-C65-T1
1
f08n01-C65-T1
2
f07n02-C65-T1
2
f08n02-C65-T1
3
f07n03-C65-T1
3
f08n03-C65-T1
4
f07n04-C65-T1
4
f08n04-C65-T1
5
f07n05-C65-T1
5
f08n05-C65-T1
6
f07n06-C65-T1
6
f08n06-C65-T1
7
f07n07-C65-T1
7
f08n07-C65-T1
8
f07n08-C65-T1
8
f08n08-C65-T1
9
f07n09-C65-T1
9
f08n09-C65-T1
10
f07n10-C65-T1
10
f08n10-C65-T1
11
f07n11-C65-T1
11
f08n11-C65-T1
12
f07n12-C65-T1
12
f08n12-C65-T1
A similar pattern to the previous worksheets is used for the next three switches. Only the worksheet for
the fourth switch is shown.
Table 56. Example: Planning worksheet for Director or core switch with more than 24 ports
Director or Core Switch (greater than 24 ports) (4 of 4)
High-performance computing clusters using InfiniBand hardware
87
Table 56. Example: Planning worksheet for Director or core switch with more than 24 ports (continued)
Switch Model: ____9140_________________________
Switch name: _____egsw04_______________________ (set by using setIBNodeDesc)
xCAT Device/Node name:_______xCAT 123____________
Frame and slot: ____f10s04________________________
Chassis IP addresses: _________10.1.1.13___________________________________________
(9240 has 2 hemispheres)
Spine IP addresses: _____slot1=10.1.1.19; slot2=10.1.1.23 _____________ (indicate spine slot)
Default gateway: _________________________________________________
GID-prefix: _fe.80.00.00.00.00.00.03_________________
LMC: ___________2_______________________ (0=default 2=if used in HPC cluster)
NTP Server: ______xCAT/MS_____________________
Switch MTMS: ___________________________ (Fill out during installation)
New admin password: _________________________ (Fill out during installation)
Remote logging host: _____xCAT/MS_______________
Table 57. Example: Planning worksheet for Director or core switch with more than 24 ports - leaf configuration
Leaf __1___
Leaf __2__
Ports
Connection
Ports
Connection
1
f01n01-C65-T4
1
f02n01-C65-T4
2
f01n02-C65-T4
2
f02n02-C65-T4
3
f01n03-C65-T4
3
f02n03-C65-T4
4
f01n04-C65-T4
4
f02n04-C65-T4
5
f01n05-C65-T4
5
f02n05-C65-T4
6
f01n06-C65-T4
6
f02n06-C65-T4
7
f01n07-C65-T4
7
f02n07-C65-T4
8
f01n08-C65-T4
8
f02n08-C65-T4
9
f01n09-C65-T4
9
f02n09-C65-T4
10
f01n10-C65-T4
10
f02n10-C65-T4
11
f01n11-C65-T4
11
f02n11-C65-T4
12
f01n12-C65-T4
12
f02n12-C65-T4
Table 58. Example: Planning worksheet for Director or core switch with more than 24 ports - leaf configuration
Leaf __7___
Leaf __8__
Ports
Connection
Ports
Connection
1
f07n01-C65-T4
1
f08n01-C65-T4
2
f07n02-C65-T4
2
f08n02-C65-T4
3
f07n03-C65-T4
3
f08n03-C65-T4
4
f07n04-C65-T4
4
f08n04-C65-T4
88
Power Systems: High performance clustering
Table 58. Example: Planning worksheet for Director or core switch with more than 24 ports - leaf
configuration (continued)
Leaf __7___
Leaf __8__
5
f07n05-C65-T4
5
f08n05-C65-T4
6
f07n06-C65-T4
6
f08n06-C65-T4
7
f07n07-C65-T4
7
f08n07-C65-T4
8
f07n08-C65-T4
8
f08n08-C65-T4
9
f07n09-C65-T4
9
f08n09-C65-T4
10
f07n10-C65-T4
10
f08n10-C65-T4
11
f07n11-C65-T4
11
f08n11-C65-T4
12
f07n12-C65-T4
12
f08n12-C65-T4
xCAT planning worksheets
Use the xCAT planning worksheet to plan for your xCAT management servers.
The xCAT worksheet is intended to highlight information that is important for management subsystem
integration in high-performance computing (HPC) clusters with an InfiniBand network.
It is not intended to replace planning instruction in the xCAT documentation.
If you have multiple xCAT Management Servers (xCAT/MS), complete a worksheet for each server. The
Switch Remote Command Setup and the fabric management server Remote Command Setup allow for
multiple devices to be defined.
The Event Monitoring worksheet allows for multiple Sensor and Response mechanisms to be
documented.
Table 59. xCAT planning worksheet
xCAT Planning Worksheet
xCAT/MS name: ________________________________________
xCAT/MS IP addresses: Service VLAN:_________________Cluster VLAN: _______________
xCAT/MS operating system: ___________________________
NTP Server: ___________________________________________
Server model: ___________________ Frame: _____________________
syslog or syslog-ng or other syslogd _________________________
Switch Remote Command Setup
nodetype = IBSwitch:QLogic (for QLogic Switches) ________________________
Node names/addresses of switches: _____________________________________
_______________________________________________________________
_______________________________________________________________
Node groups for switches:
Fabric management server Remote Command Setup
High-performance computing clusters using InfiniBand hardware
89
Table 59. xCAT planning worksheet (continued)
nodetype = FabricMS
Node names or addresses of Fabric/MS: ___________________________________
Node groups for Fabric/MS: ____________________________________________
Primary Fabric/MS for data collection:
The following worksheet is an example of a completed xCAT planning worksheet.
Table 60. Example: Completed xCAT planning worksheet
xCAT Planning Worksheet
xCAT/MS Name: _______egxCAT01____________________________________
xCAT/MS IP addresses: service VLAN:___10.0.1.1 10.0.2.1________________ Cluster VLAN: __10.1.1.1___
xCAT/MS Operating System: ________AIX 5.3_____________________
NTP Server: _______________xCAT/MS__________________________________________________
Server Model: _System p_520_ Frame: 11__
syslog or syslog-ng or other syslogd ___________syslog_____________________
Switch Remote Command Setup
nodetype = IBSwitch:QLogic (for QLogic Switches) _______IBSwitch::QLogic_____________________
Node names/addresses of switches: _____egf11sw01, egf11sw02, egf11sw03, egf11sw04______
___________________________________________________________
___________________________________________________________
Node groups for switches: AllIBSwitches
Fabric management server Remote Command Setup
nodetype = FabricMS
Node names or addresses of Fabric/MS: _____egf11fm01; egf11fm02___________________
Node groups for Fabric/MS: __________AllFMS MasterFMS BackupFMS______________
Primary Fabric/MS for data collection: egf11fm01
The following xCAT Event Monitoring worksheet is used to document multiple Sensor and Response
mechanisms.
90
Power Systems: High performance clustering
Table 61. xCAT event monitoring worksheet
xCAT Event Monitoring worksheet
syslog or syslog-ng or other: ___________________________________
Accept logs from IP address (0.0.0.0): ___________________________ (yes=default)
Fabric management server logging: TCP or UDP? ___________ port: _______ (514 default)
Fabric management server IP addresses: ________________________________
Switch logging is UDP protocol: port: __________________ (514 default)
Switch chassis IP address: __________________________________________
______________________________________________________________
Notice
Info
File or named pipe
File or named pipe
Sensor
Condition
Response
Notes:
The following worksheet shows an example of a completed xCAT event monitoring worksheet.
Table 62. Example: Completed xCAT event monitoring worksheet
xCAT Event Monitoring worksheet
syslog or syslog-ng or other: _______syslog_______________________
Accept logs from IP address (0.0.0.0): _________Yes_________________(yes=default)
Fabric management server logging: TCP or UDP? __UDP________ port: __514__ (514 default)
Fabric management server IP addresses: _________10.1.1.14; 10.1.1.15_____________
Switch logging is UDP protocol: port: ___514_______ (514 default)
Switch chassis IP address: __________10.1.1.16; 10.1.1.17; 10.1.1.18; 10.1.1.19________________
___________________________________________________________________________________
Notice
Info
File or named pipe
File or named pipe
/var/log/xCAT/
fabric.syslog.notices
/var/log/xCAT/
fabric.syslog.info
Sensor
Condition
Response
AIXSyslogSensor
LocalAIXNodeSyslog LogNodeErrorLogEntry
Notes:
High-performance computing clusters using InfiniBand hardware
91
QLogic fabric management worksheets
Use this worksheet to plan QLogic Fabric Management.
This worksheet highlights information that is important for management subsystem integration in
high-performance computing (HPC) clusters with an InfiniBand network. It is not intended to replace the
planning instructions found in the QLogic Installation and Planning Guides.
To plan thoroughly for QLogic Fabric Management, complete the following worksheets.
v General QLogic Fabric Management worksheet
v Embedded Subnet Manager worksheet (if applicable)
v Fabric management server worksheet
Table 63. General QLogic Fabric Management worksheet
General QLogic Fabric Management worksheet
Host-based or embedded SM: _______________________________
LMC: _______ (2 is preferred)
MTU:
Chassis: ____________
Broadcast: ____________ MTU rate for broadcast: _____________
Fabric management server names and addresses on cluster VLAN: ____________________________
______________________________________________________________________________
Embedded Subnet Manager Switches: __________________________________________________
______________________________________________________________________________
Primary Subnet Managers location: _____________________________________________________
_______________________________________________________________________________
Backup Subnet Managers locations: _____________________________________________________
________________________________________________________________________________
Primary Fabric/MS as fabric diagnosis collector: ____________________________________________
xCAT server addresses for remote logging: __________________________________________
NTP server:
Notes:
The following worksheet shows an example of a completed General QLogic Fabric Management
worksheet
Table 64. Example: Completed General QLogic Fabric Management worksheet
General QLogic Fabric Management worksheet
92
Power Systems: High performance clustering
Table 64. Example: Completed General QLogic Fabric Management worksheet (continued)
Host-based or embedded SM: _____Host-based____________________
LMC: __2___ (2 is preferred)
MTU:
Chassis: ___4096__________
Broadcast: ___4096___ MTU rate for broadcast: _____4096______
Fabric management server names and addresses on cluster VLAN: _____egf11fm01;
egf11fm02__________________________
_____________________________________________________________________________________________
Embedded Subnet Manager Switches: ______Not applicable______________________________________
_____________________________________________________________________________________________
Primary Subnet Managers location: ___subnet1 & 3=egf11fm01; subnet2 & 4 = egf11fm02 __________
_____________________________________________________________________________________________
Backup Subnet Managers locations: ___subnet1 & 3=egf11fm02; subnet2 & 4 = egf11fm01 _________
_____________________________________________________________________________________________
Primary Fabric/MS as fabric diagnosis collector: _______egf11fm01 _______________________________
xCAT server addresses for remote logging: __________10.1.1.1__________________________________
NTP server: 10.1.1.1
Notes:
The following worksheet is for planning an embedded Subnet Manager. Most HPC cluster installations
use host-based Subnet Managers.
Table 65. Embedded Subnet Manager worksheet
Tivoli Event Services Manager or HSM to
be used? ___________
Embedded Subnet Manager worksheet
License obtained from vendor:
xCAT server address or addresses for remote logging:
_________________________________________________________
Subnet 1 Subnet 2 Subnet
3
Subnet 4 Subnet 5 Subnet 6
Subnet 7
Subnet 8
10
10
10
10
Primary switch/priority
Back up switch/priority
Back up switch/priority
Back up switch/priority
Broadcast MTU (put rate in
parentheses)
LMC
GID prefix
smAppearanceMsgThresh
10
10
10
10
High-performance computing clusters using InfiniBand hardware
93
Table 65. Embedded Subnet Manager worksheet (continued)
Tivoli Event Services Manager or HSM to
be used? ___________
Embedded Subnet Manager worksheet
Notes:
The following worksheet is used to plan fabric management servers. A separate worksheet can be filled
out for each server. It is intended to highlight information that is important for management subsystem
integration in HPC clusters with an InfiniBand network. It is not intended to replace planning
instructions found in the QLogic Installation and Planning Guides.
Note: On any given subnet, or group of subnets, the backup fabric management server must have a
symmetrical configuration to that of the primary fabric management server. This means that a host
channel adapter (HCA) device number and port on the backup must be attached to the same subnet as it
is to the corresponding HCA device number and port on the primary.
Table 66. Fabric management server worksheet
Fabric management server worksheet (one for each server)
Server name: _____________________________________________________________________________________
Server IP address on cluster virtual local area network (VLAN):
________________________________________________
Server model (System x 3550 or 3650): __________ Frame: ____________
Number of PCI slots: _______________________________________
Number of HCAs: _________________________________________
Primary/Backup/NA HSM: _____________________________________________________________
Primary data collection point?____________________________________________________________ (Yes or No)
Local syslogd is syslog, syslog-ng, or other:
_______________________________________________________________________
xCAT server address for remote logging: ___________________________________________________________________
Using TCP or UDP for remote logging: ______________________________
NTP server: ___________________________________________________
Subnet management planning
Subnet
1
Subnet
2
Subnet
3
Subnet 4 Subnet
5
Subnet 6
Subnet 7
Subnet 8
10
10
10
10
10
10
10
HCA number
HCA port
GID prefix
Broadcast MTU (put rate in
parentheses)
node_appearance
_msg_thresh
Primary switch/Priority
Back up switch/Priority
94
Power Systems: High performance clustering
10
Table 66. Fabric management server worksheet (continued)
Fabric management server worksheet (one for each server)
Backup switch/Priority
10
10
10
10
10
10
10
10
Back up switch/Priority
Fast Fabric Toolset Planning
Host-based or embedded SM? ___________________________________ (for FF_ALL_ANALYSIS)
List of switch chassis: _________________________________________
__________________________________________________________
List of switches running embedded SM: (if applicable) _____________________________
______________________________________________________________________
Subnet connectivity planning is in the previous Subnet Management planning worksheet.
Chassis list files: _________________________________________________________
Host list files: ___________________________________________________________
Notes:
The following worksheet shows an example of a completed fabric management server worksheet.
Table 67. Example: Completed fabric management server worksheet
Fabric management server worksheet (one for each server)
Server name: _______ egf11fm01 ____________________________
Server IP address on cluster virtual local area network (VLAN): ___10.1.1.14 ___________________________________
Server model (System x 3550 or 3650): __3650_ Frame: ___11___
Number of PCI slots: ___2____________________________
Number of HCAs: _____2___________________________________
Primary/Backup/NA HSM: ____Primary subnet 1 and 3 backup subnet 2 and 4 ________________________
Primary data collection point?__Yes______________________________________________________ (Yes or No)
Local syslogd is syslog, syslog-ng, or other: __syslog-ng____________________________________________
xCAT server address for remote logging: _____10.1.1.1_____________________________________
Using TCP or UDP for remote logging: ______UDP________________________
NTP server: ___________________________10.1.1.1________________________
Subnet management planning
Subnet
1
Subnet
2
Subnet
3
Subnet 4 Subnet 5 Subnet 6
HCA number
1
1
2
2
HCA port
1
2
1
2
GID prefix
00
01
02
03
Subnet 7
Subnet 8
(all start w/
fe.80.00.00.00.00.00)
High-performance computing clusters using InfiniBand hardware
95
Table 67. Example: Completed fabric management server worksheet (continued)
Fabric management server worksheet (one for each server)
Broadcast MTU (put rate in
parentheses)
5 (4096) 5 (4096) 5 (4096) 5 (4096)
node_appearance
10
10
10
10
2
1
2
1
10
10
10
10
10
10
10
10
10
10
10
10
_msg_thresh
Primary switch/Priority
Back up switch/Priority
Backup switch/Priority
Back up switch/Priority
Fast Fabric Toolset Planning
Host-based or embedded SM? _______Host-based________________________________ (for FF_ALL_ANALYSIS)
List of switch chassis: ___10.1.1.16; 10.1.1.17; 10.1.1.18; 10.1.1.19 _____________________________________
_________________________________________________________________________________________________
List of switches running embedded SM: (if applicable) ______Not applicable ________________________________
_________________________________________________________________________________________________
Subnet connectivity planning is in the Subnet Management Planning worksheet.
Chassis list files: _____AllSwitches (list all switches)_________________________________________________
Host list files: ________AllFM (list all Fabric MS)___________________________________________________
Notes:
Installing a high-performance computing (HPC) cluster with an
InfiniBand network
Learn how to physically install your Management Subsystems and InfiniBand hardware and software
including the required steps for the hardware and software installation.
Do not proceed unless you have read “Cluster planning” on page 26, or your role in the installation has
been planned by someone who has read that information.
Before beginning any installation procedure, for the most current release information, see the “Cluster
information resources” on page 2
This information does not cover installation of I/O devices other than those in the InfiniBand network.
All I/O devices that are not InfiniBand devices are considered part of the server installation procedure.
The general installation process consists of the following steps.
1. Separate the installation tasks based on the generalized tasks and the people responsible for them, as
outlined in “Installation responsibilities by organization” on page 68 and “Installation responsibilities
of units and devices” on page 69.
2. Ensure that you understand “Planning installation flow” on page 68. Understanding the merge points
is crucial to the coordination of a successful installation.
3. The detailed installation instructions follow the “Order of installation” on page 70 found in “Cluster
planning” on page 26. The major task numbers found in the order of installation are referenced in the
detailed installation instructions. The detailed instructions might contain several steps to perform a
major task.
96
Power Systems: High performance clustering
a.
b.
c.
d.
e.
Complete “Site setup for power, cooling, and floor” on page 98
Complete “Installing and configuring the management subsystem” on page 98
Complete “Installing and configuring the cluster server hardware” on page 123
Complete “Installing the operating system and configuring the cluster servers” on page 127
Complete “Installing and configuring vendor or IBM InfiniBand switches” on page 137
f. Complete “Attaching cables to the InfiniBand network” on page 143
g. Complete “Verifying the InfiniBand network topology and operation” on page 145
h. Complete “Installing or replacing an InfiniBand GX host channel adapter” on page 147
i. Complete “Verifying the installed InfiniBand network (fabric) in AIX” on page 150
j. Complete “Fabric verification” on page 150
4. If you are not performing a new installation, but are expanding an existing cluster, or adding function
to support an InfiniBand network, see “Cluster expansion or partial installation.”
IBM Service representative installation responsibilities
IBM Service installation responsibilities include installing IBM Machine Types that are IBM installable
versus those that are customer installable. In addition to normal repair responsibilities during installation,
it must be noted that IBM service is responsible for repairing the InfiniBand cables and host channel
adapters (HCAs).
IBM Service representatives are responsible for performing the following installation instructions:
1. For IBM installable Hardware Management Console (HMC), use “Installing the Hardware
Management Console” on page 102.
2. For IBM installable servers, use “Installing and configuring the cluster server hardware” on page 123.
Cluster expansion or partial installation
If you are performing an expansion or partial installation you must perform a subset of the steps
required for a full installation.
Use the following table to determine which major steps must be performed for a cluster expansion or
partial installation.
Table 68. Cluster expansion or partial installation determination
Adding
InfiniBand
hardware to an
existing cluster
(switches and
host channel
adapters (HCAs))
Adding new
servers to an
existing
InfiniBand
network
Adding HCAs to
an existing
InfiniBand
network
Adding a subnet
to an existing
InfiniBand
network
Adding servers
and a subnet to
an existing
InfiniBand
network
“Site setup for
power, cooling,
and floor” on
page 98
Yes
Yes
Floor tile cut-outs
for cables
Yes
Yes
“Installing and
configuring the
management
subsystem” on
page 98
Yes
Yes (for
installation
images)
No
Yes
Yes
High-performance computing clusters using InfiniBand hardware
97
Table 68. Cluster expansion or partial installation determination (continued)
Adding
InfiniBand
hardware to an
existing cluster
(switches and
host channel
adapters (HCAs))
Adding new
servers to an
existing
InfiniBand
network
Adding HCAs to
an existing
InfiniBand
network
Adding a subnet
to an existing
InfiniBand
network
Adding servers
and a subnet to
an existing
InfiniBand
network
“Installing and
configuring the
cluster server
hardware” on
page 123
Yes
Yes
Yes
No
Yes
“Installing and
configuring
vendor or IBM
InfiniBand
switches” on page
137
Yes
If Management
server and
Cluster-Ready
Hardware Server
(CRHS) would be
used1
No
Yes
Yes
“Attaching cables
to the InfiniBand
network” on page
143
Yes
Yes
Yes
Yes
Yes
“Verifying the
InfiniBand
network topology
and operation”
on page 145
Yes
Yes
Yes
Yes
Yes
1
This occurs when:
v A single Hardware Management Console (HMC) is in an existing cluster, and at least one more HMC is to be
added to the cluster.
v Servers are being added to an existing cluster.
v Servers that were added require you to add one or more new HMCs.
v You must use management sever and CRHS, and configure the switches with static IP-addressing on the cluster
network, unless you are using xCAT.
Site setup for power, cooling, and floor
The site setup for power, cooling, and the floor encompasses several major tasks that are part of the
installation flow.
The site setup for power, cooling, and the floor encompasses major task U1 as shown in the Figure 11 on
page 71. The setup for the power, cooling, and floor construction must be complete before installing the
cluster. This would meet all documented requirements for the individual units, frames, systems, and
adapters in the cluster. These tasks are performed by the customer, an IBM Installation planning
representative or a contractor. All applicable IBM and vendor documentation can be consulted.
Note: If installing host channel adapters (HCAs) into existing servers, you must only perform operations
involving cable routing and floor tile cut-outs.
Installing and configuring the management subsystem
This information is used to learn the requirements for installing and configuring the management
subsystem.
98
Power Systems: High performance clustering
The Management subsystem installation and configuration encompass major tasks M1 through M4 as
shown in Figure 11 on page 71.
This is the most complex area of a high-performance computing (HPC) cluster installation. It is affected
by, and affects, other areas (such as server installation and switch installation). Many tasks can be
performed simultaneously, while others must be done in a particular order.
You install and configure Hardware Management Console (HMC), a service virtual local area network
(VLAN), a cluster VLAN, a Fabric Management Server, a xCAT Management Server, and building an AIX
network installation management (NIM) Shared Product Object Tree (SPoT) to run diagnostics for servers
without removable media (CD and DVD drives). The diagnostics are only available with the AIX
operating system and require an AIX NIM SPoT even if partitions are running the Linux operating
system.
If your partitions are running the Linux operating system, you also need a Linux distribution server for
updating the operating system to be used on the partitions in servers without removable media.
While it is typical to use the xCAT\MS as the dynamic host configuration protocol (DHCP) server for the
service VLAN, if a separate DHCP server is installed, you can follow the DHCP installation tasks as
described in the installation procedure for xCAT.
This procedure is not a detailed description of how to install the management subsystem components,
because such procedures are described in detail in documentation for the individual devices and
applications. This procedure documents the order of installation and key points that you must consider in
installing and configuring the management consoles.
The management consoles that are to be installed are the HMC, the xCAT\MS and the fabric
management server. The management consoles are key to successfully installing and configuring the
cluster, because they are the heart of the management subsystem. Before you do any start-up and
configuration, these devices must be installed and configured so that they are ready to discover and
manage the rest of the devices in the cluster.
During management subsystem installation and configuration, you can perform the following tasks,
which are illustrated in Figure 12 on page 100. While many of the tasks within the procedures can be
performed simultaneously, pay close attention to where they converge and where one task might be a
prerequisite for another task, as indicated by the inverted triangle symbol. The following steps are the
major tasks for installation.
1. Physically place units on the data center floor.
2. Install and configure service and cluster VLAN devices following the procedure in “Installing and
configuring service VLAN devices” on page 102.
3. Install HMCs following the procedure in “Installing the Hardware Management Console” on page
102.
4. Install the xCAT Management Server following the procedure in “Installing the xCAT management
server” on page 104.
5. Install the operating system installation servers following the procedure in “Installing operating
system installation servers” on page 105.
6. Install the fabric management server following the procedure “Installing the fabric management
server” on page 105.
7. Perform server installation and configuration with management consoles following the procedure in
“Installing and configuring the cluster server hardware” on page 123.
8. Configure remote logging from switches and fabric management servers to the xCAT/MS following
the procedure in “Set up remote logging” on page 112.
9. Configure remote command execution capability from the xCAT/MS to the switches and fabric
management servers following the procedure in “Set up remote command processing” on page 120.
High-performance computing clusters using InfiniBand hardware
99
Tasks have two reference labels to help cross-reference them between figures and procedures. The first is
from Figure 12 and the second is from Figure 11 on page 71. For example E1 (M1) indicates, task label E1
in the Figure 12 and task label (M1) in the Figure 11 on page 71.
Steps that have a shaded background are steps that are performed under “Installing and configuring
vendor or IBM InfiniBand switches” on page 137.
Figure 12. Management subsystem installation tasks
100
Power Systems: High performance clustering
Installing and configuring the management subsystem for a cluster expansion or
addition
The tasks for expanding an existing cluster are different from the tasks for a new installation. This
information is used when you want to expand an existing cluster.
If you are adding or expanding InfiniBand network capabilities to an existing cluster, then you might
approach the management subsystem installation and configuration differently than with a new cluster
installation. The flow for the management subsystem installation and configuration task is based on a
new cluster installation. However, it indicates where there are variances for expansion scenarios.
The following table outlines how the new cluster installation is affected or altered by expansion scenarios.
Table 69. Impact of cluster expansions
Scenario
Effects
Adding InfiniBand hardware to an existing cluster
(switches and host channel adapters (HCAs))
v Cable to InfiniBand switch service subsystem Ethernet
ports
v Might require additional service subsystem Ethernet
switches or routers to accommodate new InfiniBand
switches
v Install a fabric management server
v Add remote syslog capability from Fabric Management
Server and switches to xCAT
v Add remote execution capability from xCAT to Fabric
Management Server and switches
Adding new servers to an existing InfiniBand network
v Cable to servers service subsystem Ethernet ports
v Build operating system update mechanisms for new
servers without removable media.
v Might require additional HMCs to accommodate the
new servers. If you are using Cluster Ready Hardware
server or xCAT server, you must unconfigure the
current DHCP services on the existing HMC and
reconfigure using the DHCP on the xCAT MS, or other
DHCP server
v Might require additional service subsystem Ethernet
switches or routers to accommodate new servers
Adding HCAs to an existing InfiniBand network
This should not affect the management or service
subsystem.
Adding a subnet to an existing InfiniBand network
v Cable to InfiniBand switch service subsystem Ethernet
ports
v Might require additional service subsystem Ethernet
switches or routers to accommodate new InfiniBand
switches
v Might require additional Fabric Management Servers,
which would affect xCAT event monitoring and
remote command access of the additional Fabric
Management Servers
v Add remote syslog capability from new Fabric
Management Server and switches to xCAT
v Add remote execution capability from xCAT to new
Fabric Management Server and switches
High-performance computing clusters using InfiniBand hardware
101
Table 69. Impact of cluster expansions (continued)
Scenario
Effects
Adding servers and a subnet to an existing InfiniBand
network
v Cable to InfiniBand switches service subsystem
Ethernet ports
v Cable to servers service subsystem Ethernet ports
v Build operating system update mechanisms for new
servers without removable media
v Might require additional HMCs to accommodate the
new servers. If you are using Cluster Ready Hardware
server, or xCAT/MS you must unconfigure the current
DHCP services on the existing HMC and reconfigure
using DHCP on the xCAT/MS, or other DHCP server
v Might require additional service subsystem Ethernet
switches or routers to accommodate new InfiniBand
switches and servers
v Might require additional Fabric Management Servers,
which would affect xCAT event monitoring and
remote command access of the additional Fabric
Management Servers
v Add remote syslog capability from new Fabric
Management Server and switches to xCAT
v Add remote execution capability from xCAT to new
Fabric Management Server and switches
Installing and configuring service VLAN devices
This procedure is for the person responsible for installing and configuring the service virtual local area
network (VLAN) devices. It indicates the correct times to cable units to the service VLAN.
1. E1 (M1) - Physically locate the service and cluster VLAN Ethernet devices on the data center floor.
2. E2 (M2) - Install and configure the service and cluster VLAN Ethernet devices using the
documentation for the Ethernet devices and any configuration details provided by the Hardware
Management Console (HMC) installation information.
3. (M3) - Do not cable management consoles, servers, or switch units to the VLANs until you are
instructed to do so within the installation procedure for each management console.
Note: Correct ordering of management console installation steps and cabling to the VLANs is
important for a successful installation. Failing to follow the installation order can result in long
recovery procedures.
Installing the Hardware Management Console
This installation procedure is for an IBM service representative.
Before starting this installation procedure obtain the Hardware Management Console (HMC) installation
instructions. Do not use these instructions until you are directed to do so within this procedure.
During the HMC installation, for HMC information, refer the “Cluster summary worksheet” on page 77,
which have been filled out during the planning phase for the cluster.
Notes:
v If there are multiple HMCs on the service VLAN, do not set up the HMC as a dynamic host
configuration protocol (DHCP) server as instructed. This would result in multiple DHCP servers on the
service VLAN.
v xCAT can be used as the Systems Management application. It is required to be installed with
Cluster-Ready Hardware Server (CRHS) under the following conditions.
102
Power Systems: High performance clustering
– You have more than one HMC.
– You have opted to install xCAT and CRHS in anticipation of future expansion.
To install the HMC, complete the following steps.
Note: Tasks have two reference labels to help cross-reference them between figures and procedures. The
first is from Figure 12 on page 100 and the second is from Figure 11 on page 71. For example E1 (M1)
indicates, task label E1 in the Figure 12 on page 100 and task label (M1) in the Figure 11 on page 71.
1. H1 (M1) - Perform the physical installation of the HMC hardware on the data center floor. HMCs
might have a maximum distance restriction from the devices that they manage. Generally, you want
to minimize the distance from the HMCs to their managed servers so that IBM service
representatives can perform tasks efficiently. Also, if you are adding new servers into an existing
cluster, you might install one or more new HMCs to manage the new servers. If this is not a new
cluster installation, you must not add more HMCs to the cluster.
2. H2 (M2) - Before proceeding, ensure that the server frames and systems are not powered on and are
not attached to the service VLAN.
3. H2 (M2) - Perform the initial installation and configuration of the HMCs using the HMC
documentation, for more information see Managing the Hardware Management Console.
Note: HMC and IBM-managed server installation documentation directs the installer to enable
DHCP on the HMC. At that point in the HMC and managed server installation documentation, stop
the HMC installation procedure and go to step 4. You will be instructed to return to the HMC
documentation after the appropriate steps have been taken in this procedure.
4. H3 (M2) - If you are installing a cluster with a single HMC and you are not enabling a CRHS, go to
step 6 on page 104.
5. H4 (M2) - To perform installation of a DHCP server that is not an HMC, use the following
procedure.
Notes
: Perform this procedure if you are:
v Installing a new cluster with xCAT
v Adding an HMC to a cluster that already has xCAT
v Adding an HMC to a cluster with only a single HMC.
v Adding an InfiniBand network to an existing cluster with multiple HMCs that is not currently
using xCAT
a. To enable the CRHS with xCAT to connect correctly to the service processors and bulk power
controllers (BPCs), be sure to use the systemid command on the xCAT/MS. This manages
passwords.
b. Disable the DHCP server on the HMC and assign the HMC a static IP address so that there is
only one DHCP server on the Ethernet service VLAN, and so that device discovery occurs
from the xCAT
Note: If the HMC is currently managing devices, disabling DHCP on the HMC temporarily
disconnects the HMC from its managed devices. If the current cluster already has xCAT, or
does not require an additional HMC, go to step 6 on page 104.
c. Change existing HMCs from DHCP server to static IP address so that the address is within the
cluster Ethernet service VLAN subnet (provided by the customer) but outside of the DHCP
address range.
d. Restart the HMC.
High-performance computing clusters using InfiniBand hardware
103
6. H5 (M2) - Return to the HMC installation documentation and finish the installation and
configuration procedures. However, do not attach the HMC cables to the service VLAN until
instructed to do so in step 9 of this procedure. After finishing those procedures, continue with step 7.
7. H6 (M2) - Ensure that your HMCs are at the correct software and firmware levels. See the IBM
Clusters with the InfiniBand Switch website referenced in“Cluster information resources” on page 2
website for information regarding the most current released level of the HMC. Follow the links in
the readme file to the appropriate download sites and instructions.
8. Do not proceed until the following requirements have been met.
a. The xCAT\MS is set up as a DHCP server as described in “Installing the xCAT management
server” or you have only a single HMC that remains as a DHCP server.
b. The Ethernet devices for the service VLAN are installed and configured, as described in
“Installing and configuring service VLAN devices” on page 102.
c. If the xCAT\MS is not the DHCP server for the service VLAN, then you must wait for the DHCP
server to be installed and configured and cabled to the service VLAN.
9. H7 (M3) - Cable the HMCs to the service VLAN.
10. This completes the procedure.
Installing the xCAT management server
The Cluster management server installation is performed by the customer.
Before proceeding, obtain the xCAT Planning and Installation information and the server installation guide
for the xCAT/MS machine type and model.
The following procedure is for installing the xCAT/MS in the high-performance computing (HPC) cluster.
Refer the “xCAT planning worksheets” on page 89, which have been completed during the planning
phase for the cluster.
1. CM1 (M1) - Perform the physical installation of the xCAT/MS on the data center floor. If you are
using a separate dynamic host configuration protocol (DHCP) server for the service or cluster virtual
local area network (VLAN) that is being installed as part of this installation activity, also physically
place it on the data center floor.
2. CM2 (M2) - Perform the procedures in the xCAT Installation documentation. When performing those
procedures, you must ensure that you complete the following steps. If you are using a separate DHCP
server for the service VLAN, also perform the following steps for it, and for the xCAT/MS. Do not
perform the steps configuring DHCP on the xCAT/MS.
a. Install the xCAT/MS system hardware.
b. Update the operating system on the xCAT/MS.
c. Install the xCAT code on the xCAT/MS.
d. As appropriate, enable the xCAT/MS as the DHCP server for the service VLAN and the cluster
VLAN. If you are using a separate DHCP server, perform this step on that server instead of the
xCAT/MS.
e. Define the subnet ranges for the service and cluster VLANs. If you are using a separate DHCP
server, perform this step on that server instead of the xCAT/MS.
f. Configure the DHCP ranges for the servers and bulk power controllers (BPCs). If you are using a
separate DHCP server, perform this step on that server instead of the xCAT/MS.
g. Add the planned static IP addresses for the HMCs to the Cluster Ready Hardware Server (CRHS)
peer domain.
3. Do not proceed until the service and cluster VLANs Ethernet devices have been installed and
configured as described in “Installing and configuring service VLAN devices” on page 102.
4. CM3 (M3) - Cable the xCAT/MS to the service and cluster VLANs. If you are using a separate DHCP
server, cable it to the appropriate VLANs also.
104
Power Systems: High performance clustering
5. CM4 (M4) - Start the DHCP server on the xCAT/MS, or if applicable, on a separate DHCP server.
This step blocks other installation tasks for servers and management consoles that require DHCP
service from xCAT/MS.
6. It is a good practice to enter the configuration information for the server in its /etc/motd. Use the
information from the “xCAT planning worksheets” on page 89.
Other procedures involving the xCAT/MS are part of L1- L3 and R1- R2, which are all part of major task
M4.
v “Set up remote logging” on page 112
v “Set up remote command processing” on page 120
Installing operating system installation servers
Use this procedure to install operating system installation servers that assists with diagnostics.
This procedure is performed by the customer.
While there is reference to installing operating system installation servers, this procedure concentrates on
the need for diagnostics service using an operating system installation server.
In particular, eServer diagnostics for System p servers are available only in the AIX operating system. You
need an AIX Shared Product Object Tree (SPoT), even if you are running another operating system in
your partitions on servers with no removable media (CD or DVD).
Before proceeding, obtain documentation on the server, AIX network installation management (NIM)
server, and Linux distribution server. The following documents must be used.
v Server installation guide for the operating system installation server (AIX NIM or Linux distribution
server)
v For the NIM server, obtain installation information from AIX documentation
v For the Linux server, obtain Linux distribution documentation
Depending on where you install the operating system install services for servers this might be coupled
with “Installing the xCAT management server” on page 104.
1. I1 (M1) - Physically place the AIX NIM and Linux distribution servers on the data center floor.
2. Do not proceed until you have started the dynamic host configuration protocol (DHCP) server on the
xCAT\MS as described in “Installing the xCAT management server” on page 104.
3. I2 (M2) - If you plan to have servers with no removable media (CD or DVD), build an AIX NIM SPoT
on your chosen server to enable eServer diagnostics. Refer the NIM information in AIX
documentation.
Note: Since the eServer diagnostics are available only in the AIX operating system, you need an AIX
SPoT, even if you are running another operating system in your partitions. If you are running AIX in
your partitions, you require an AIX NIM SPoT for servers with no removable media.
4. I2 (M2) - If you have servers with no removable media (CD or DVD), and you are going to use Linux
in your partitions, install a distribution server.
5. I3 (M4) - Cable the operating system installation servers to the cluster virtual local area network
(VLAN), not the service VLAN.
Installing the fabric management server
Use this procedure to install the fabric management server.
The installation of the fabric management server is performed by the customer.
High-performance computing clusters using InfiniBand hardware
105
The fabric management server provides the following two functions that are installed and configured in
this procedure.
v Host-based Fabric Manager function
v Fast Fabric Toolset
Note: This procedure is written from the perspective of installing a single fabric management server.
Using the instructions in the Fast Fabric Toolset Users Guide, you can use the ftpall command to copy
common configuration files from the first Fabric Management Server to other fabric management servers.
Care should be taken with the Subnet Manager configuration files, since there are certain parameters (like
the global identifier (GID) prefix) that are not common between all fabric management servers.
Before proceeding with this procedure, obtain the following documentation.
v IBM System x 3550 or 3650 Installation Guide
v Linux distribution documentation
v Fabric Manager Users Guide
v QLogic InfiniServ host stack documentation
v Fast Fabric Toolset Users Guide
There is a point in this procedure that cannot be passed until the QLogic switches are installed, powered
on and configured, and the cluster virtual local area network (VLAN) Ethernet devices are configured
and powered on. You must coordinate with the teams performing those installation activities.
Use the following procedure for installing the fabric management server. It references QLogic
documentation for detailed installation instructions. See the “QLogic fabric management worksheets” on
page 92, which is completed during the planning phase for the cluster.
1. F1 (M1) - Physically place the Fabric Management Server the data center floor.
2. F2 (M2) - Install and configure the operating system on the fabric management server.
Note:
v Disable the firewall when installing the operating system on the fabric management server.
v Keep all the license key documentation that comes with the operating system used for the Fabric
Management Server, and for the QLogic InfiniBand Fabric Suite. This is for obtaining updates to
software.
3. F3 (M2) - If you are connecting the Fabric Management Servers to a public Ethernet network (not the
service, nor the cluster VLAN), do so at this time.
4. F4 (M2) - Install and cable the host channel adapters (HCAs) in the fabric management servers. The
HCAs must be installed before proceeding to the next step. Cabling of the HCAs to the fabric can
wait, but do not start the fabric manager software until the fabric management server HCAs have
been cabled to the fabric.
5. F5 (M2) - To install the QLogic InfiniBand Fabric Suite (which includes the Fabric Manager, Fast
Fabric toolset, and QLogic OFED stack) use the InfiniServ Fabric Access Software Users Guide. The
following items are the key steps to the installation.
a. Untar the QLogic tarball.
b. Run the install script using the appropriate flags as described in the QLogic documentation.
Note: Do not enable IPoIB on the fabric management server, or do not install the IPoIB
capability. Otherwise, the multicast groups might be negatively affected by IPoIB on the fabric
management server setting up groups that are not valid for the compute and I/O servers on the
fabric.
c. Restart to start the QLogic OFED Stack.
6. F5 (M2) - Set up the Fast Fabric Toolset by completing the following tasks.
106
Power Systems: High performance clustering
a. Configure the Fast Fabric Toolset according to the instructions in the Fast Fabric Toolset Users
Guide. When configuring the Fast Fabric Toolset consider the following application of Fast Fabric
within high-performance computing (HPC) clusters.
v The master node referred in the Fast Fabric Toolset Users Guide, is considered to be Fast Fabric
Toolset host in IBM HPC clusters.
v Do not set up rsh and ssh access to the servers from the Fast Fabric Toolset host, because xCAT
would be used for remote server access.
v Do not use the message passing interface (MPI) performance tests because they are not
compiled for the IBM host stack.
v High-Performance Linpack (HPL) is not applicable for the IBM host stack
v Use only parameters that list switch chassis and never issue commands to hosts.
b. Update the following Fast Fabric configuration files. These files list the switch and Fabric
Manager servers that make up the fabric. This function has the ability to report and run
commands across the fabric concurrently.
v The /etc/sysconfig/iba/chassis file must have the list of all the switch chassis in the fabric. Each
chassis is listed on a separate line of the file. You can use either the IP address or the
resolvable host name for the chassis address.
v If you planned for groups of switches, create a file for each group.
v The /etc/sysconfig/iba/hosts file must have a list of all of the fabric management servers.
v If you planned for groups of fabric management servers, create a file for each group.
v Set up the /etc/sysconfig/fastfabric.conf file with the appropriate FF_ALL_ANALYSIS and
FF_FABRIC_HEALTH environmental variable values. This must include the fabric, chassis, and
Subnet Manager (SM) analysis. The SM analysis depends on the type of SM you are using.
Note there is a commented entry for FF_ALL_ANALYSIS that includes all possible analysis
tools. You must require a hostsm or esm (embedded SM) entry. You must also ensure that Fast
Fabric is set up with the appropriate authentication method for accessing the chassis. Also,
change the config file to save any uploaded data collection to a particular directory.
– If you have a host-based SM, edit the entry to look like the following example.
export FF_ALL_ANALYSIS="${FF_ALL_ANALYSIS:-fabric chassis hostsm}"
– If you have an embedded SM, edit the entry to look like the following example.
export FF_ALL_ANALYSIS="${FF_ALL_ANALYSIS:-fabric chassis esm}"
–
Using a pattern that matches the names of your switches, set up the FF_FABRIC_HEALTH
variable. The following is an example which assumes that the default names were left in
place. The default names begin with SilverStorm. It also removes the clear of errors that
exceed threshold:
export FF_FABRIC_HEALTH="${FF_FABRIC_HEALTH:- -s -o errors
-o slowlinks –F nodepat:SilverStorm*}""
v The default upload directory for data collection is ./uploads. In order to make this more
consistent it must be either changed to $HOME or some other standard for the site. Change
the following variable:
export UPLOADS_DIR="${UPLOADS_DIR:-$HOME }"
v Also, if applicable, ensure that the /etc/sysconfig/iba/esm_chassis file has the list of switch IP
addresses for switches that are running the Embedded-SM
c. The /etc/sysconfig/iba/ports file must have a list of ports on the fabric management server. The
format is a single line listing the HCA ports on the fabric management server that are attached to
the subnets. There should be one port per subnet. The format for identifying a port is
[hca]:[port]. If four ports are connected, the ports file should have a single line like: 1:1 1:2 2:1
2:2
Note: While there is another format possible for the ports file, the previous format is preferred
because tools and methodologies for command-line scripts in this document
High-performance computing clusters using InfiniBand hardware
107
d. Assure that tcl and Expect are installed on the Fabric Management Server. They should be at
least at the following levels. You can check using the rpm -qa | grep expect and rpm -qa | grep
tcl commands.
v expect-5.43.0-16.2
v tcl-8.4.12-16.2
v For IFS 5, tcl-devel-8.4.12-16.2 is also required
e. If this is the primary data collection point for fabric diagnosis, ensure that this is noted. One
method would be to add this to the /etc/motd file.
7. F6 (M2) - If you are using a host-based Fabric Manager, install it using the Fabric Manager Users
Guide. The following are key rpms to install:
a. aiview_agent-4_3_2_1-1. x86_64.rpm (4_3_2_1-1 refers the level of the agent code; x86_64 refers
the platform)
b. iview_fm-4_3_2_1-1. x86_64.rpm (4_3_2_1-1 refers the level of the fabric manager code; x86_64
refers the platform)
Note: Do not start the Fabric Managers until the switch fabric is installed and cabled completely.
Otherwise, it might cause unnecessary log activity from the Fabric Manager, which can cause
confusion when trying to verify fabric operation.
c. Run one of the following commands:
For IFS 5, /etc/init.d/qlogic_fm stop (This ensures that the Subnet Manager is stopped until it is
required.)
Verify that the Subnet Manager is stopped by running the ps –ef|grep iview command.
Note: Keep all license key documentation that comes with your QLogic software. This comes
with the CD. This is important for obtaining software updates and service.
8. F6 (M2) - Configure the host-based Fabric Manager by updating the configuration file using the
Fabric Manager Users Guide. For IFS 5 the configuration file is /etc/sysconfig/qlogic_fm.config.
Note: For more information about Fabric Management configuration see the “Fabric manager” on
page 17 and “Planning the fabric manager and fabric Viewer” on page 56.
For IFS 5:
The configuration file for IFS 5, /etc/sysconfig/qlogic_fm.xml, allows for declaring common
attribute values for any component in the FM, or common attribute values across different instances
of an FM component (SM, PM, BM or FE), or you can define a specific attribute value for a given
instance. This allows you to change fewer lines in the configuration file. It is preferred that you
review the QLogic Fabric Manager Users Guide's section on Fabric Manager Configuration.
There is a separate instance of the various fabric management components running to manage each
subnet. In the /etc/sysconfig/view_fm.config file, you must configure each instance of each
component.
a. Configure the common SM attributes by going the section that begins with the comment
“<!–Common SM (Subnet Manager) attributes –>”, and update the following lines:
1) To start all instances of the SM:
<Start>1</Start> <!-- default SM startup for all instances -->
2) To set the LMC for all instances of the SM to be 2. If you have chosen the default of 0, then
do not change the line. If you have chosen, LMC=1, then substitute “1” for the value of “2”
below. If you have a different LMC for each instance of SM, you must update each instance
of SM, as described in step f.
<Lmc>2< /Lmc>
<!-- assign 2^lmc LIDs to all CAs (Lmc can be 0-7) -->
b. Configure the Multicast parameters, in the first <MulticastGroup> section, using the planning
information.
108
Power Systems: High performance clustering
1) For MTU use the value planned in “Planning maximum transfer unit (MTU)” on page 51 <
MTU>4096< /MTU>
2) For MTU rate, use the value planned in “Planning maximum transfer unit (MTU)” on page
51. The following example is for MTU rate of 20 g. <Rate>20g</Rate>
c. Configure the Fabric Sweep parameters
Increase the number of maximum attempts for SM requests to 8:<MaxAttempts>8</MaxAttempts>
d. Configure the SM logging attributes:
Set the maximum number of Node Appearances and Disappearances to minimize log entries
during reboot/recycle actions:<NodeAppearanceMsgThreshold>10</NodeAppearanceMsgThreshold>
e. If all of the SM priorities and elevated priorities on this fabric management server are the same,
update them near the end of the <Sm> section. The following example priority is 1, and the
example elevated priority is 12. Use the values planned in “Planning the fabric manager and
fabric Viewer” on page 56.
<Priority>1< /Priority> <!-- 0 to 15, higher wins -->
<ElevatedPriority>12</ElevatedPriority> <!-- 0 to 15, higher wins -->
f. Configure the common FE attributes:
The common FE attributes begin with:
<!-- Common Fe (Fabric Executive) attributes -->
<Bm>
Unless otherwise noted, prevent the FE from running:
<Start>0</Start> <!-- default FE startup for all instances -->
g. Configure the common PM attributes.
The common PM attributes begin with:
<!-- Common PM (Performance Manager) attributes -->
<Pm>
Unless otherwise noted, prevent the PM from running:
<Start>0</Start> <!-- default PM startup for all instances -->
h. Configure the common BM attributes:
<!-- Common BM (Baseboard Manager) attributes -->
<Bm>
Unless otherwise noted, prevent the BM from running:
<Start>0</Start> < !-- default BM startup for all instances -->
i. Update the individual instances of the FM. By default there are four instances defined in the
configuration file. Be sure to examine the attributes for each FM instance.
The attributes for each instance of FM, are bounded by the following.
<!-- A single FM Instance/subnet -->
<Fm>
Attributes
</Fm>
Find the shared parameters beginning with:
<!-- Shared Instance config, applies to all components:
SM, PM, BM and FE -->
<Shared>
1) If none of the components of this instance is be started, set the Start parameter to 0. By default
there are four instances defined in the configuration file. If you require fewer than four
instances of the FM, then be sure to turn off the extraneous instances. The common Start
attributes for each FM component set previously would apply to all instances, unless you turn
off a instance of FM.
<Start>0</Start>
High-performance computing clusters using InfiniBand hardware
109
2) Configure the name for the FM instance. You might use this name for referencing the instance.
The FM also uses this name when creating log entries for this instance. The following example
uses “ib0”.
<Name>ib0< /Name>
< !-- also for logging with _sm, _fe, _pm, _bm appended -->
3) Configure the HCA in the fabric management server to be used to reach the subnet that is
managed by this instance of FM. The following example uses HCA 1.
<Hca>1</Hca>
< !-- local HCA to use for FM instance, 1=1st HCA -->
4) Configure the port on the above HCA in the fabric management server to be used to reach the
subnet that is managed by this instance of FM. The following example uses Port 1.
<Port>1</Port>
< !-- local HCA port to use for FM instance, 1=1st Port -->
5) Configure the subnet, or GID, prefix that corresponds to the subnet that is managed by this
instance of FM. The following example uses 0xfe80000000000042.
<SubnetPrefix>0xfe80000000000042</SubnetPrefix>
< !-- should be unique -->
j. Update the individual instances of the SM.
If any of the individual instances of SM deviate from the common attributes for the SM as defined
previously, or for the FM attributes as defined previously, go to the specific SM instance that is
defined within the corresponding FM instance and add the appropriate parameters.
The most likely reason to do this is to update an individual SM instance priority or elevated
priority.
The SM instance attributes is added to the following section within the FM instance. This example
includes an example of adding the priority and elevated priority that deviate from the common
attributes set previously.
<!-- Instance Specific SM (Subnet Manager) attributes -->
<Sm>
<!-- Overrides of the Common.Shared, Common.Sm or Fm.Shared parameters -->
<Priority>2</Priority> <!-- 0 to 15, higher wins -->
<ElevatedPriority>10</ElevatedPriority>
<!-- 0 to 15, higher wins -->
</Sm>
9. Cable the fabric management server to the InfiniBand fabric.
10.
11.
12.
13.
110
Note: The switches must have been installed as in “Installing and configuring vendor or IBM
InfiniBand switches” on page 137.
F7 (M2) - Use a static IP address for the cluster VLAN for the fabric management servers. Assign
and configure this address.
F8 (M3) - Cable the fabric management server to the cluster VLAN. It must be on the same VLAN
with the switches.
Before proceeding, ensure that the fabric management server is cabled to the InfiniBand fabric and
the switches are powered on.
F9 (M4) - Final fabric management server Configuration and Verification
a. If you are using a host-based SM, make sure that the embedded Subnet Managers are not
running (unless you plan to use both):
i. Run the cmdall -C 'smControl status' command
ii. If one or more ESM is running, stop it using the cmdall -C 'smControl stop' command.
iii. Ensure that the ESM would not start on reboot by using the cmdall –C ‘smConfig
startAtBoot no' command.
b. After starting the fabric manager using: /etc/init.d/qlogic_fm start, verify that the HCA cables
are connected to the correct switches. This assumes that the switches have had their IBNodeDesc
set so that each switch can be identified in the iba_report output.
Power Systems: High performance clustering
Run iba_report against each port in the /etc/sysconfig/iba/ports file.
For example:
v iba_report -h 1 -p 1 | grep SW
v iba_report -h 2 -p 2 | grep SW
c. Verify correct security configuration for switches by ensuring that each switch has the required
username/password enabled.
i. Run the cmdall -C 'loginMode' command.
ii. The return value must be zero. If not, enable it.
iii. Run the cmdall -C 'loginMode 0'e command.
14. Set up passwordless ssh communication between the Fabric Management Server and the switches
and other fabric management servers. If this is not wanted, you must set up password information
for the Fast Fabric Toolset, in which case, skip to step 15.
a. Generate the key on the fabric management server. Depending on local security requirements,
you would typically do this for the root on the fabric management server (Fabric/MS). Typically,
you would use the /usr/bin/ssh-keygen -t rsa command.
b. Set up secure fabric management server to switch communication, using the following
instructions:
i. Exchange the key using the cmdall –C ‘sshKey add “[Fabric/MS key]”' command where
[Fabric/MS key] is the key.
Note: The key is in the ~/.ssh/id_rsa.pub file. Use the entire contents of the file as the
[Fabric/MS key]. Remember to put double quotation marks around the key and single quotes
around the entire sshKey add command.
ii. ensure that the following is in /etc/fastfabric.conf file. export
FF_LOGIN_METHOD="${FF_LOGIN_METHOD:-ssh}"
c. Set up secure communication between Fabric Management Servers using one of the following
methods:
v Use the “setup_ssh” command in the Fast Fabric Toolset.
v Use the Fast Fabric Toolset iba_config menu. Choose the options Fast Fabric → Host setup →
Setup Password-less ssh/scp.
v Use typical key exchange methods between Linux servers.
15. If you chose not to set up passwordless ssh from the fabric management server to switches and to
other Fabric Management Servers, you must update the/etc/sysconfig/fastfabric.conf file with
the correct password for admin. The following procedure assumes that the password is xyz. Detailed
instructions are provided in the Fast Fabric Users Guide.
a. Edit the /etc/sysconfig/fastfabric.conf file and ensure that the following lines are in the file
and are not commented out. FF_LOGIN_METHOD and FF_PASSWORD are used for fabric management
server access. FF_CHASSIS_LOGIN_METHOD and FF_CHASSIS_ADMIN_PASSWORD are used for switch
chassis access.
export FF_LOGIN_METHOD="${FF_LOGIN_METHOD:-telnet}"
export FF_PASSWORD="${FF_PASSWORD:-}"
export FF_CHASSIS_LOGIN_METHOD="${FF_CHASSIS_LOGIN_METHOD:-telnet}"
export FF_CHASSIS_ADMIN_PASSWORD="${FF_CHASSIS_ADMIN_PASSWORD:- xyz}
b. Run the chmod 600 /etc/sysconfig/fastfabric.conf command. This ensures that only root can use
the Fast Fabric tools and also only root can see the updated password.
16. It is a good practice to enter the configuration information for the server in its /etc/motd file. Use
the information from the “QLogic fabric management worksheets” on page 92.
17. If you want to monitor the fabric by running the health check on a regular basis, review “Setting up
periodic fabric health checking” on page 158. Do not set this up until the fabric has been installed
and verified.
High-performance computing clusters using InfiniBand hardware
111
This procedure ends here.
Set up remote logging
Remote logging to xCAT/MS helps you monitor clusters by consolidating logs to a central location.
This procedure involves setting up remote logging from the following locations to the xCAT/MS.
v To set up remote logging for a fabric management server, continue with step 2 in:
For xCAT/MS: “Remote syslogging to an xCAT/MS”
v To set up remote logging for InfiniBand switches, continue with step 3 in:
For xCAT/MS: “Remote syslogging to an xCAT/MS.”
v To set up remote logging on the Hardware Management Console (HMC), continue with step 4 in:
For xCAT/MS: “Remote syslogging to an xCAT/MS”
Note: Step 5 step 6 in the following topics involve verifying the remote logging setup.
For xCAT/MS: “Remote syslogging to an xCAT/MS”
Figure 13 shows tasks L1 through L6 for setting up remote logging. It also shows how the remote logging
setup tasks relate to the key tasks illustrated in Figure 12 on page 100.
Figure 13. Set up remote logging
Do not start this procedure until all the following tasks have been completed.
1. The HMCs have been installed and cabled to the service virtual local area network (VLAN) (H6) in
Figure 12 on page 100.
2. The xCAT/MS has been installed and cabled to the service and cluster VLANs (CM4).
3. The fabric management server has been installed and cabled to the cluster VLAN (F8).
4. The switches have been installed and cabled to the cluster VLAN (W3).
5. The service and cluster VLANs Ethernet devices have been installed and cabled (E2).
If you are using xCAT, use the procedure in “Remote syslogging to an xCAT/MS.”
Remote syslogging to an xCAT/MS:
Remote logging to xCAT/MS helps you monitor clusters by consolidating logs to a central location.
To set up syslogging to a xCAT management server, complete the following steps.
1. L1 (M4) : Set up remote logging and event management for the fabric on the xCAT/MS. There are
two sets of instructions. One is for xCAT running on the AIX operating system and the other is for
xCAT running on the Linux operating system. Even if you do not plan to use xCAT, the remote syslog
setup instructions would still be useful to consolidate Subnet Manager and switch logs into one place.
Notes:
a. It is assumed that the fabric management server setup for remote syslogging has already been
done.
b. This procedure assumes that the xCAT/MS is not defined as a managed node. It is assumed that
administrators who have set up the xCAT/MS as a managed node are experienced and can
modify this procedure to accommodate their configuration. The key is to monitor the
/var/log/xcat/syslog.fabric.notices file using a sensor and setting up a condition to monitor
that sensor and direct the log entries to the /tmp/systemEvents file.
112
Power Systems: High performance clustering
If the xCAT/MS is running the AIX operating system, go to Remote Syslogging and Event
Management for xCAT on AIX. After finishing the event management setup, proceed to step 2 on
page 117.
If the xCAT/MS is running the Linux operating system, go to Remote Syslogging and Event
Management for xCAT on Linux. After finishing the event management setup, proceed to step 2 on
page 117.
Remote Syslogging and Event Management for xCAT on AIX:
You point the syslogd to one or two files into which to place the remote syslogs. The file is
syslog.fabric.notices, which contains log entries that are of a severity of NOTICE or higher and are
from switches and FM servers. These entries might indicate a problem with the fabric, as such this
would be the source of xCAT monitoring for fabric events. The other file is syslog.fabric.info,
which contains log entries that are of a severity of INFO or higher. This provides a consolidated log
that is not normally monitored, but can be important for in-depth diagnosis.
Note: It is assumed that you are using syslogd on the xCAT/MS. If you are using another syslog
application, like syslog-ng, you must set up things differently, but these instructions can be useful in
understanding how to set up the syslog configuration.
a. Log on to the xCAT/MS running the AIX operating system as the root user.
b. Edit the /etc/syslog.conf file to direct the syslogs to a file to be monitored by xCAT event
management. The basic format of the line is [facility].[min. priority] [destination]. If you
are using syslog-ng, you must adjust the format to accomplish the same type of function.
Add the following lines, so that local6 facilities (used by Subnet Manager and the switch) with log
entry priorities (severities) of INFO or higher (Notice, Warning, Error, for example) are directed to
a log file for debug purposes. The disadvantage of this is that /var must be monitored more
closely so that it does not fill up. If you cannot maintain the /var log, you can leave out this line.
# optional local6 info and above priorities in another file
local6.info /var/log/xcat/syslog.fabric.info
Note: You can use different file names, but you must record them and update the rest of the
procedure steps with the new names.
c. Run a touch command on the output files, because syslog does not create them on its own.
i. Run the touch /var/log/xcat/syslog.fabric.notices command.
ii. Run the touch /var/log/xcat/syslog.fabric.info command.
d. Refresh the syslog daemon using the refresh -s syslogd command.
e. Set up a sensor for syslog.fabric.notices file by copying the default and changing the default priority
filter and monitored file.
1) lsrsrc -i -s "Name= ’AIXSyslogSensor’" IBM.Sensor > /tmp/AIXSyslogSensorDef
2) Modify the /tmp/IBSwitchLogSensorDef file by updating the Command attribute to:
/opt/xcat/sbin/rmcmon/monaixsyslog -p local6.notice -f /var/log/xcat/syslog.fabric.notices
Note: The default “-p” parameter is “local6.info”. This creates unnecessary entries in the
event management subsystem.
3) Remove the old sensor using the rmsensor IBSwitchLogSensor command.
4) Create the sensor and keep its scope local using the CT_MANAGEMENT_SCOPE=0 mkrsrc –f
/tmp/IBSwitchLogSensorDef IBM.Sensor command.
Note: Local management scope is required or you would get an error indicating that the node
(xCAT/MS) is not in the NodeNameList.
5) Run the following command:
/opt/xcat/sbin/rmcmon/monaixsyslog -f /var/log/xcat/syslog.fabric.notices –p local6.notice
High-performance computing clusters using InfiniBand hardware
113
6) Wait approximately 2 minutes and check the /etc/syslog.conf file. The sensor might have
placed the following line in the file. The default cycle for the sensor is to check the files every
60 seconds. The first time it runs, it recognizes that it must set up the syslog.conf file with the
following entry:
local6.notice
/var/log/xcat/syslog.fabric.notices
rotate size 4m files 1
f. Set up the condition for the sensor and link a response to it.
Note: The method documented here is for a xCAT/MS that has not been defined as a managed
node. If the xCAT/MS is defined as a managed node, you do not set the scope of the condition to
be local.
1) Create a copy of the prepackaged condition AIXNodeSyslog and set the ManagementScope to
local (l for local) using the following command.
mkcondition -c IBSwitchLog -m l LocalIBSwitchLog
2) Link a response using the startcondresp LocalIBSwitchLog “Log event anytime” command.
The above condition-response link would direct log entries to /tmp/systemEvents on the
management server. If you have planned different, or additional responses, in the previous
command, you might substitute them for “Log event anytime”. Run the command once for
each response that is to be linked to LocalIBSwitchLog.
Note:
v The /tmp/systemEvents file is not created until the first event comes through.
v Substitute Email root anytime for Log event anytime to send mail to root when a log occurs.
If you use this, plan to disable it when booting large portions of the cluster. Otherwise, many
logs would be mailed.
v Substitute LogEventToxCATDatabase for Log event anytime to record logs in the xCAT
Database.
v Be careful of responses intended to display entries on the console or email root. Unless you
temporarily disable them before rebooting servers, these results in many events being
broadcast to the console or emailed to root when servers are rebooted.
3) If you want to create any other response scripts, use a similar format for the startcondresp
command after creating the appropriate response script. Refer the xCAT Reference Guide and
RSCT Reference Guide on how to do this.
g.
Note: If there are problems with the event management from this point forward, and you must
remake the IBSwitchLogSensor, you must follow the procedure in “Reconfiguring xCAT event
management” on page 232.
Proceed to step 2 on page 117.
Remote Syslogging and Event Management for xCAT on Linux:
You point the syslogd to a FIFO for serviceable events, and a file for informational events. The syslog
file is /var/log/messages, which is configured to contain log entries that are of a severity of NOTICE
or higher and are from switches and FM servers. These entries might indicate a problem with the
fabric, as such this would be the source of xCAT monitoring for fabric events. The informational file is
syslog.fabric.info, which contains log entries that are of a severity of INFO or higher. This provides
a consolidated log that is not normally monitored, but can be important for in-depth diagnosis.
a. Log on to the xCAT/MS running the Linux operating system as root user.
b. Edit the configuration file for the syslogd so that it directs entries coming from the fabric
management server and the switches to an appropriate file.
Notes:
1) If the level of the Linux operating system on the xCAT/MS is using syslog instead of
syslog-ng, use “Using syslog on RedHat Linux-based xCAT/MS” on page 120. When you
return from that procedure, return to step g.
114
Power Systems: High performance clustering
2) Log entries with a priority (severity) of INFO or lower are logged to the default location of
/var/log/messages
i. Edit the /etc/syslog-ng/syslog-ng.conf file
ii. Add the following lines to the end of the file.
# Fabric Notices from local6 into a FIFO/named pipe
filter f_fabnotices
{ facility(local6) and level(notice, alert, warn,
err, crit) and not filter(f_iptables); };
Note: The sensor that is created adds the lines to the /etc/syslog-ng/syslog-ng.conf file that is
required to direct the entries to a particular log file.
Also, ensure that udp(ip("0.0.0.0") port(514)); is in the src stanza and is not commented out.
You must use udp to receive logs from switches and the fabric management server.
Note: The ip("0.0.0.0") entry indicates that the server allows entries from any IP address. For
added security, you might want to specify each switch and fabric management server IP address
in a separate line. You must use the appropriate protocol as defined previously.
udp(ip("192.9.3.42") port(514));
udp(ip("192.9.3.50”) port(514));
c. With syslog-ng, you must configure AppArmor to allow syslog-ng to access the named-pipe file
(var/log/xcat/syslog.fabric.notices) to which the remote syslog entries are directed. Syslog-ng
requires read/write permission to named-pipes.
i. Edit the syslog-ng file for AppArmor: /etc/apparmor.d/sbin.syslog-ng
ii. Add “/ var/log/xcat/syslog.fabric.notices wr,”, just before the closing brace, “}”, in the
/sbin/syslog-ng stanza. Optionally, to handle INFO entries, also add “/var/log/xcat/
syslog.fabric.info wr”. For example:
/sbin/syslog-ng {
#include <abstractions/base>
.
.
.
/var/run/syslog-ng.pid w,
/var/log/xcat/syslog.fabric.notices wr,
}
Note: There would be many more INFO events than NOTICE events.
d. Restart AppArmor using the /etc/init.d/boot.apparmor restart command.
e. Set up a sensor for the syslog.fabric.notices file by copying the default and changing the
default priority filter and monitored file using the following steps.
1) Run the lsrsrc -i -s "Name= 'IBSwitchLogSensor'" IBM.Sensor > /tmp/IBSwitchLogSensorDef
command.
Note: The default “-p” parameter is “local6.info”. This creates many unnecessary entries in the
event management subsystem
2) Remove the old sensor using the rmsensor ErrorLogSensor command.
3) Create the sensor and keep its scope local using the CT_MANAGEMENT_SCOPE=0 mkrsrc –f
/tmp/IBSwitchLogSensorDef IBM.Sensor command.
Note: Local management scope is required or you would get an error indicating that the node
(xCAT/MS) is not in the NodeNameList.
4) Run the
/opt/xcat/sbin/rmcmon/monerrorlog -p f_fabnotices -f
/var/log/xcat/syslog.fabric.notices
command.
High-performance computing clusters using InfiniBand hardware
115
f. If you get an error back from monerrorlog indicating a problem with syslog, there is probably a
typographical error in the /etc/syslog-ng/syslog-ng.conf file. The message includes syslog in the
error message, similar to:
monerrorlog: * syslog *
Note: The * is a wildcard.
1) Look for the typographical error in the /etc/syslog-ng/syslog-ng.conf file by reviewing the
previous steps that you have taken to edit the syslog-ng.conf file.
2) Remove the destination and log lines from the end of syslog-ng.conf file.
3) Rerun the /opt/xcat/xCATbin/monerrorlog -f "/var/log/xcat/syslog.fabric.notices" -p
"f_fabnotices" command.
4) If you get another error, examine the file again and repeat the recovery procedures.
g. Check the /etc/syslog-ng/syslog-ng.conf file to ensure that the sensor set it up correctly. The
following lines might be at the end of the file.
Note: Because it is a generic xCAT command being used for InfiniBand, monerrorlog uses a
different name from fabnotices_fifo in the destination and log entries. It is a pseudo random name
that looks like fifonfJGQsBw.
filter f_fabnotices { facility(local6) and level(notice, alert, warn, err, crit)
and not filter(f_iptables); };
destination fabnotices_file { ("/var/log/messages" group(root) perm(0644)); };
log { source(src); filter(f_fabnotices); destination(fabnotices_file); };
#optionally set up handling of INFO entries
filter f_fabinfo { facility(local6) and level(notice, alert, warn, err, crit)
and not filter(f_iptables); };
destination fabinfo_file { ("/var/log/xcat/syslog.fabric.info" group(root) perm(0644)); };
log { source(src); filter(f_fabinfo); destination(fabinfo_file); };
h. Set up the condition for the previous sensor and link a response to it. The method depends on
whether the xCAT/MS is defined as a managed node.
Note: The method documented here is for a xCAT/MS that has not been defined as a managed
node. If the xCAT/MS is defined as a managed node, you did not set the scope of the condition to
be local.
1) Make a copy of the pre-packaged condition AnyNodeAnyLoggedError and set the
ManagementScope to local (l for local).mkcondition -c IBSwitchLog -m l LocalIBSwitchLog.
2) To the condition, link a response which can log entries using the startcondresp
LocalIBSwitchLog “Log event anytime” command.
The previous condition-response link logs node error log entries to the /tmp/systemEvents file
on the xCAT management server. If you have planned different, or additional responses, in the
above command, you might substitute them for “Log event anytime”. Run the command once
for each response that is to be linked to LocalIBSwitchLog.
Note:
v /tmp/systemEvents would not be created until the first event comes through.
v Substitute Email root anytime for Log event anytime to send mail to root when a log
occurs. If you use this, plan to disable it when booting large portions of the cluster.
Otherwise, many logs would be mailed.
v Substitute LogEventToxCATDatabase for Log event anytime to record logs in the xCAT
Database.
v Be careful of responses intended to display entries on the console or email root. Unless you
temporarily disable them before rebooting servers, these results in many events being
broadcast to the console or emailed to root when servers are rebooted.
116
Power Systems: High performance clustering
3) If you want to create any other response scripts, you use a similar format for the
startcondresp command after creating the appropriate response script. For details, refer the
xCAT Reference Guide and RSCT Reference Guide.
i. Proceed to step 2.
2. L2 (M4) - Point to the xCAT/MS as a remote syslog server from the fabric management server by
completing the following steps.
Note: It is assumed that you are using syslogd on the xCAT/MS. If you are using another syslog
application, like syslog-ng), you must set up things differently, but these instructions can be useful in
understanding how to set up the syslog configuration.
a. Do not proceed until you have installed, configured, and cabled the fabric management server to
the service VLAN as in “Installing the fabric management server” on page 105. You must also
have installed, configured, and cabled the xCAT/MS as described in “Installing the xCAT
management server” on page 104.
b. Logon to the fabric management server.
c. Edit the /etc/syslog.conf (some Linux levels use /etc/syslog-ng/syslog-ng.conf) file.
1) If the Fabric Management server is using syslog instead of syslog-ng, use substep ii. If the
Fabric Management server is using syslog-ng instead of syslog, use substep iii.
2) For syslog, add the following lines to the end of the file. Remove brackets when entering the
xCAT/MS IP address.
# send IB SM logs to xCAT/MS (“xCAT IP-address”)
local6.*
@[put xCAT/MS IP-address]
3) For syslog-ng, add the following to the end of the file. Use udp as the transfer protocol. You
must configure syslog-ng on the xCAT/MS to accept one or the other, or both.
# Fabric Info from local6 to xCAT/MS (“xCAT IP-address”)
filter f_fabinfo
{ facility(local6) and level(info, notice, alert, warn, err, crit)
and not filter(f_iptables); };
destination fabinfo_xcat { udp("xCAT/MS IP-address" port(514)); };
log { source(src); filter(f_fabinfo); destination(fabinfo_xcat); };
Note: If you want to logon to more than one xCAT/MS, or to another server, make sure to
change the destination handle of the statement for each instance, and then refer a different one
for each log statement. For example: fabinfo_xCAT1 and fabinfo_xCAT2, would be good
handles for logging to different xCAT/MS.
4)
5)
d. Restart the syslog daemon using the /etc/init.d/syslog restart command. If the syslog daemon is
not running, use the /etc/init.d/syslog start command.
e. You have now setup the fabric management server to remotely log to the xCAT/MS. You are able
to verify fabric management server remote logging operation when you get to step 4 on page 118.
3. L3 (M4) - Point the switch logs to the xCAT/MS.
a. Do not proceed until you have installed, configured, and cabled the fabric management server to
the service VLAN as described in “Installing and configuring vendor or IBM InfiniBand switches”
on page 137. You must also have installed, configured, and cabled the xCAT/MS as described in
“Installing the xCAT management server” on page 104.
b. Use the switch documentation to point the switch to a remote syslog server. If you want to use the
command-line interface, use substep i. If you want to use the Chassis Viewer, use substep ii. In
either case, you must also run substep iii.
1) From the switch command line, or Fast Fabric Toolset's cmdall run the logSyslogConfig -h
xcat_ip_address –f 22 –p 514 –m 1 command.
2) From Chassis Viewer, on the Syslog Host tab use the IP address of the xCAT/MS and point to
Port 514. You must do this for each switch individually.
High-performance computing clusters using InfiniBand hardware
117
3) In either case, ensure that all Priority logging levels with a severity above INFO are set to log
using the logShowConfig command on the switch command line or using the Chassis Viewer
to look at the log configuration. If you must turn on INFO entries, use the following methods:
v On the switch command line use the logConfigure command and follow the instructions on
screen.
v In Chassis Viewer use the log configuration window.
Note: The switch command line and Chassis Viewer do not necessarily list the log priorities
with respect to severity. Ensure that a logShowConfig command results in a result like the
following example, where Dump, Fatal, Error, Alarm, Warning, Partial, Config, Periodic, and
Notice are enabled. The following example has Info enabled as well, but that is optional.
Configurable presets
index : name
: state
-----------------------------1
: Dump
: Enabled
2
: Fatal
: Enabled
3
: Error
: Enabled
4
: Alarm
: Enabled
5
: Warning : Enabled
6
: Partial : Enabled
7
: Config
: Enabled
8
: Info
: Enabled
9
: Periodic : Enabled
15 : Notice
: Enabled
10 : Debug1
: Disabled
11 : Debug2
: Disabled
12 : Debug3
: Disabled
13 : Debug4
: Disabled
14 : Debug5
: Disabled
c. You have now setup the switches to remotely log to the xCAT/MS. You can verify the switch
remote logging operation using step 5.
4. L4 (M4) - Set up Service Focal Point monitoring on the xCAT/MS and the HMCs. See the xCAT
documentation for instructions on Service Focal Point Monitoring.
Note: Service Focal Point Monitoring is useful when there is more than one HMC in a cluster.
5. L5 (M4) - Verify the remote syslogging and event management path from the fabric management
server through to the xCAT/MS /tmp/systemEvents file.
a. Do not proceed with this step until you have setup the xCAT/MS for remote logging and event
management in step 1 on page 112, and you have set up the fabric management server to remotely
log to the xCAT/MS in step 2 on page 117.
b. Logon to the fabric management server.
c. Create a Notice level log and an INFO level log. Replace “XXX” with your initials.
logger -p local6.notice XXX: This is a NOTICE test from the Fabric Management Server
logger -p local6.info XXX: This is an INFO test from the Fabric Management Server
d. Logon to the xCAT/MS to see if the log made it through. It might take a minute or two before the
event management sensor senses the log entry file: /var/log/xcat/syslog.fabric.notices on the
xCAT/MS.
e. Check the /tmp/systemEvents file and verify that only the Notice entry was logged in it. The INFO
entry might not have made it into the syslog.fabric.notices file and therefore, might not have been
picked up by the sensor.
If you have waited as much as 5 minutes and the Notice entry was not logged in the
/tmp/systemEvents file then check the following items.
v Review the previous setup instructions to ensure that they were performed correctly, paying
close attention to the setup of the /etc/syslog.conf file. (or syslog-ng.conf file)
118
Power Systems: High performance clustering
v Use the procedure in “Problem with event management or remote syslogging” on page 226.
Recall that you were using the logger command such that the Fabric Management Server would
be the source of the log entry.
f. Check the /var/log/xcat/syslog.fabric.info file and verify that both the Notice entry and the
INFO entry are in the file. This applies only if you have chosen to set up the syslog.fabric.info
file.
If one or both of the entries are missed then check the following items.
v Review the previous setup instructions to ensure that they were performed correctly, paying
close attention to the setup of the /etc/syslog.conf(or syslog-ng.conf) file.
v Use the procedure in “Problem with event management or remote syslogging” on page 226.
Recall that you were using the logger command such that the Fabric Management Server would
be the source of the log entry.
6. L6 (M4) : Verify remote syslogging from the switches to the xCAT/MS.
a. Do not proceed with this step until you have setup the xCAT/MS for remote logging and event
management in step 1 on page 112, and you have set up the switches to remotely log to the
xCAT/MS in step 3 on page 117.
b. Ping the switches from the xCAT/MS to ensure that there is connectivity across the service VLAN.
If the ping fails, use standard techniques to debug Ethernet interface problems between the
xCAT/MS and the switches.
c. Use the following commands on the Fabric Management Server to test logging from the switches
to the xCAT/MS:
v To see an ERROR in /tmp/systemEvents: cmdall –C “logSyslogTest –e”
v To see a NOTICE in / tmp/systemEvents: cmdall –C “logSyslogTest –n
d. Logon to the xCAT/MS to see if the log made it through. It might take a minute or two before the
event management sensor senses the log entry in the xCAT/MS/var/log/xcat/syslog.fabric.notices file.
e. Check the /tmp/systemEvents file and verify that only an ERROR and a NOTICE entry are logged
in it from each switch address.
If you have waited as much as 5 minutes and the Notice entry was not logged in the
/tmp/systemEvents file then check the following items.
v Review the previous setup instructions to ensure that they were performed correctly, paying
close attention to the setup of the /etc/syslog.conf file.
v Use the procedure in “Problem with event management or remote syslogging” on page 226.
Recall that you were using the logger command such that the Fabric Management Server would
be the source of the log entry.
f. Check the /var/log/xcat/syslog.fabric.info file and verify that the ERROR and NOTICE entry is
in the file. This applies only if you have chosen to set up the syslog.fabric.info file.
If one or both entries are missing then:
v Review the previous setup instructions to ensure that they were performed correctly, paying
close attention to the setup of the /etc/syslog.conf file.
v Use the procedure in “Problem with event management or remote syslogging” on page 226.
Recall that you were using the logger command such that the Fabric Management Server would
be the source of the log entry.
g. Use the procedure in “Problem with event management or remote syslogging” on page 226. Recall
that you were using the logSyslogTest command such that the switches were the source of the log
entry.
h. Verifying switch remote logging ends here.
This procedure ends here.
Remote syslogging to an xCAT/MS ends here.
High-performance computing clusters using InfiniBand hardware
119
Using syslog on RedHat Linux-based xCAT/MS:
Use this procedure to setup syslog to direct log entries from the fabric management server and switches.
Note: Do not use this procedure unless you were directed here from another procedure.
If the level of Linux on the xCAT/MS uses syslog instead of syslog-ng, use the following procedure to set
up syslog to direct log entries from the fabric management server and switches instead of the one
documented in Remote Syslogging and Event Management for xCAT on Linux.
After completing this procedure return to the procedure from which you were sent and continue after the
steps that set up syslog-ng and runs the monerrorlog command.
1. Set up a sensor for syslog.fabric.notices file using the monerrorlog command, but change the
default priority filter to f_fabnotices and the monitored file to syslog.fabric.notices as shown in the
following example.
/opt/xcat/sbin/rmcmon/monerrorlog -f "/var/log/xcat/syslog.fabric.notices" -p "local6.notice"
2. Wait approximately 2 minutes after running the monerrorlog command. The following line should be
found in /etc/syslog.conf file.
local6.notice /var/log/xcat/syslog.fabric.notices rotate 4m files 1
3. Return to the procedure that referenced this procedure and go to the step referenced by that
procedure.
Set up remote command processing
Use this procedure to set up remote command processing from xCAT to the switches and Fabric
Management Server.
Remote command processing to the fabric management server setup is a standard Linux node setup,
except that the fabric management server is treated as a device.
Remote command processing to the switches is standard hardware device setup.
Figure 14 illustrate tasks R1, R2 and R3 for setting up remote command processing. It also illustrates how
the remote command processing setup tasks relate to key tasks illustrated in Figure 12 on page 100.
Figure 14. Remote command processing setup
Do not proceed with this procedure until all of the following tasks have been completed.
1. The xCAT/MS has been installed and cabled to the service and cluster virtual local area networks
(VLANs) (CM4).
2. The fabric management server has been installed and cabled to the cluster VLAN (F8).
3. The switches have been installed and cabled to the cluster VLAN (W3).
4. The service and cluster VLANs Ethernet devices have been installed and cabled (E2).
Setting up remote command processing from the xCAT/MS:
Use this procedure to set up remote command processing from xCAT/MS.
To set up remote command processing, complete the following steps.
Refer the fabric management worksheet based on the template in “xCAT planning worksheets” on page
89 and “QLogic fabric management worksheets” on page 92.
1. R1 (M4) - Set up remote command processing with the fabric management server.
120
Power Systems: High performance clustering
Note: The following method is just one of several methods by which you can set up remote
command processing to a fabric management server. You can use any method that meets your
requirements. For example, you can set up the Fabric Management Server as a node. By setting it up
as a device rather than a node, you might find it easier to group it differently from the IBM servers.
a. Add the fabric management servers to /etc/hosts.
[IP address] [hostname]
b. Ensure that you are using ssh for xdsh, and that you have run the command: chtab
key=useSSHonAIX site.value=yes
c. Use the following loop to define all fabric management servers to xCAT:
for fm in `cat <file containingFabric/MS IP/hostname>`; do
mkdef -t node –o $fm groups=all,AllFabricMS nodetype= FabricMS
done
d. Exchange ssh-keys with the fabric management servers. This assumes that the password is the
same for all fabric management servers.
xdsh ALLFabricMS -K
Enter the password for the userid on the node where the ssh keys will
be updated.
/usr/bin/ssh setup is complete.
return code = 0
or
xdsh ALLFabricMS -K -l root --devicetype=FabricMS
Enter the password for the userid on the node where the ssh keys will
be updated.
/usr/bin/ssh setup is complete.
return code = 0
e. If you have defined multiple groups for the fabric management servers, assign those by using the
following command for each group:
chdef -t node [noderange] groups=[groupname]
Where [noderange] is a comma-delimited list of fabric management servers. See: man noderange.
f. You might now use xdsh to remotely access the Fabric Management Server from the xCATMS
2. R2 (M4) - Set up remote command processing with the switches.
Note: The following is method just one of several methods by which you can set up remote
command processing to a QLogic switch. You can use any method that meets your requirements. The
QLogic switch does not use a standard shell for its command-line interface (CLI). Thus, it should be
set up as a device and not a node. For dsh and updatehwdev to work, you need the command
definition file.
a. Create a device type command definition file for the switch device. This is important for dsh and
updatehwdev to work with the switch proprietary command-line.
1) If the /var/opt/xcat/IBSwitch/Qlogic/config file exists, you can skip the creation of this file,
and go to step 2b
2) Create the path using the /var/opt/xcat/IBSwitch/Qlogic command.
3) Edit the /var/opt/xcat/IBSwitch/Qlogic/config file.
4) Add the following lines to the file.
# QLogic switch device configuration
# Please follow the section format to add entry/value pair like below
[main]
# SSH key add command on device (must be upper-case K)
ssh-setup-command=sshKey add
[xdsh]
# Special command before remote command: e.g. export environment variable
pre-command=NULL
# Command used to show the return code of last command executed
High-performance computing clusters using InfiniBand hardware
121
# Note: the command output must be a numeric value in the last line.
# e.g. # hello world!
#
# 0
post-command=showLastRetcode -brief
5)
b. Add each switch to /etc/hosts: [IP address] [hostname]
c. Ensure that you are using ssh for xdsh, and that you have run the command: chtab
key=useSSHonAIX site.value=yes
d. For each switch, define the switch as a device for xCAT using the following command. This
example uses a loop to define all switches.
Fr sw in `cat <file containing chassis IP/hostname>`; do
mkdef –t node –o $sw groups=all,IBSwitches nodetype=switch
done
e.
Exchange ssh keys with IBSwitches group using the following command.
xdsh IBSwitches -K -l admin --devicetype IBSwitch::Qlogic
Enter the password for the userid on the node where the ssh keys will
be updated.
/usr/bin/ssh setup is complete.
return code = 0
f. Verify remote access to the switches using the following command. Do not enter a password, and
each switch should reply with its firmware level.
/opt/xcat/bin/xdsh IBSwitches –l admin --devicetype IBSwitch::Qlogic fwVersion | more
g. If you have defined multiple groups for the switches, assign those by using the following
command for each group:
chdef -t node [noderange] groups=[groupname]
Where [noderange] is a comma-delimited list of fabric management servers. See: man noderange
h. You may now use xdsh to remotely access the switches from the xCAT/MS. Do not forget to use
the options: --devicetype and –l admin so that xdsh uses the appropriate command sequence to
the switches.
3. R3 (M4) - It is good practice to create device groups to allow you to direct commands to groups of
switches and Fabric Management Servers. In the steps above, you set up a group for all fabric
management servers, and a group for all switches. See the xCAT documentation for more details on
setting up device groups. Some possible groupings are shown below.
a. All the fabric management servers (AllFabricMS)
b. All primary fabric management servers
c. All of the switches (IBSwitches)
d. A separate subnet group for all of the switches on a subnet
This procedure ends here.
Set up remote command processing ends here.
Installing and configuring servers with management consoles
This procedure outlines the considerations for final configuration of management consoles (Hardware
Management Console (HMC) or operating system installation servers) to work with servers. It is included
to help understand final configuration of the Management Subsystem.
The task references in this procedure are all from Figure 11 on page 71.
Do not start this procedure until all of the following tasks have been completed:
1. The HMCs have been installed and cabled to the service virtual local area network (VLAN) (H6).
2. The xCAT/MS has been installed and cabled to the service and cluster VLANs (CM4).
3. The service and cluster VLANs Ethernet devices have been installed and cabled (E2).
122
Power Systems: High performance clustering
To install and configure server with management consoles, complete the following steps.
M4 - Final configuration of management consoles: This procedure is performed in “Installing and
configuring the cluster server hardware” during the steps associated with S3 and M4. The following
procedure is intended to provide an overview of what is done in that procedure.
If you add servers and host channel adapters (HCAs), you must perform these tasks.
Notes:
1. The bulk power controllers (BPCs) and servers must be at power Standby before proceeding. See the
“Server hardware installation and configuration procedure” on page 124 procedure up to and
including major task S2.
2. Dynamic host configuration protocol (DHCP) on the service VLAN must be operational.
The following tasks are performed when you do the Server Installation and Configuration procedure:
1. Verify that the BPCs and service processors are acquired by the DHCP server on the service VLAN.
2. If using Cluster Ready Hardware Server (CRHS), set up the peer domains and HMC links in CRHS
on the management server as instructed in the Administration Guide.
3. If using CRHS, perform server and frame authentication with CRHS on the management server as
instructed in the Administration Guide.
This procedure ends here.
Management subsystem installation and configuration ends here.
Installing and configuring the cluster server hardware
This procedure is intended to be completed by an IBM service representative, or the customer responsible
for installing cluster server hardware.
Installing and configuring the cluster server hardware encompasses major tasks S3 through S5, and the
server part of M3 and M4 which are illustrated in the Figure 11 on page 71. Install and configure the
servers for your cluster.
Note: If possible, do not begin this procedure until the “Installing operating system installation servers”
on page 105 is completed. This helps avoid the situation where installation personnel are waiting on site
for key parts of this procedure to be completed. Depending on the arrival of units on-site, this is not
always practical. Review “Order of installation” on page 70 and the Figure 11 on page 71 to identify the
merge points where a step in a major task or procedure that is being performed by one person is
dependent of the completion of steps in another major task or procedure that is being performed by
another person.
Before proceeding obtain the following documentation.
v Server Installation documentation, including applicable Worldwide Custom Install Instructions (WCII)
v Host channel adapter (HCA) installation topics from the IBM Power Systems Hardware Information
Center
If this installation is for a cluster expansion or addition of hardware to a cluster, before proceeding,
review “Installing the operating system and configuring the cluster servers information for expansion” on
page 127.
Server installation and configuration information for expansion
This information is for installing server and configuring information for expansion.
If this is a new installation, skip this section.
High-performance computing clusters using InfiniBand hardware
123
If you are adding or expanding InfiniBand network capabilities to an existing cluster by adding servers to
the cluster, then you must approach the Server installation and configuration a little differently than with
a new cluster flow. The flow for Server installation and configuration is based on a new cluster
installation, but it would indicate where there are variances for expansion scenarios.
The following table outlines how the new cluster installation is affected/altered by expansion scenarios:
Table 70. New cluster installation expansion scenarios
Scenario
Effects
Adding InfiniBand hardware to an existing cluster
(switches and HCAs)
v Configure the LPARs to use the HCAs
Adding new servers to an existing InfiniBand network
Perform this procedure as if it was a new cluster
installation
Adding HCAs to an existing InfiniBand network
Perform this procedure as if it was a new cluster
installation
Adding a subnet to an existing InfiniBand network
v Configure the LPARs to use the new HCA ports
v Configure HCAs for switch partitioning
v Configure the newly cabled HCA ports for switch
partitioning
Adding servers and a subnet to an existing InfiniBand
network
Perform this procedure as if it were a new cluster
installation
Server hardware installation and configuration procedure
Use this procedure to install and configure server hardware for use with your cluster.
1. Before you start your server hardware installation and configuration, select one of the following
options.
v If it is a new installation, go to step 2.
v If you are adding servers to an existing cluster, go to step 2.
v If you are adding cables to existing host channel adapters (HCAs), proceed to step 12 on page 126.
v If you are adding host channel adapters (HCAs) to existing servers, go to “Installing or replacing
an InfiniBand GX host channel adapter” on page 147 and follow the installation instructions for
the HCAs (Worldwide Custom Installation Instructions or IBM Power Systems Hardware
Information Center instructions), then proceed to step 12 on page 126.
2. S3 - Position the frames or racks according to the data center floor plan.
3. Choose from the following items, then go to the appropriate step for your cluster.
v If you have a single Hardware Management Console (HMC) in the cluster and you are not using
xCAT in your cluster, go to step 4.
v If you are using xCAT, go to step 5 on page 125.
4. If you have a single HMC and you are not using xCAT, complete the following steps.
a. S1 - Position the servers in frames or racks and install the HCAs, do not connect, or apply
power to the servers at this time.
Note: Do not proceed in the server installation instructions (WCII or Information Center) past
the point where you physically install the hardware.
Follow the installation procedures for servers found in the following resources.
v Worldwide Customized Installation Instructions (WCIIs) for each server model that is installed
by IBM service representatives.
v For all other server models, customer procedures for initial server setup are available in:
– For POWER6: IBM System Information Center for the IBM system being installed.
124
Power Systems: High performance clustering
– For POWER5: IBM System Information CenterInformation Center → Initial server setup.
Procedures for installing the GX InfiniBand host channel adapters are also available in the
IBM systems Hardware Information Center, click IBM systems Hardware Information
Center → Installing hardware.
b. Verify that the HMC is configured and operational.
c. After the Ethernet service virtual local area network (VLAN) and management consoles have
been installed and configured, they are ready to discover and connect to frames and servers on
the Ethernet service VLAN. Proceed to step 6.
5. If you are using xCAT in your cluster, complete the following steps.
a. S1 - Position servers in frames or racks and install the HCAs, do not connect, or apply power
to the servers at this time.
Note: Do not proceed in the server installation instructions (Worldwide Customized Installation
Instructions or Information Center) past the point where you physically install the hardware.
Follow the installation procedures for servers found in:
v Worldwide Customized Installation Instructions (WCII) for each server model that is installed
by IBM service representatives.
v For all other server models, customer procedures for initial server setup are available in:
– For POWER6: IBM System Information Center for the IBM system being installed.
– For POWER5: IBM System Information CenterInformation Center → Initial server setup.
Procedures for installing the GX InfiniBand host channel adapters are also available in the
IBM systems Hardware Information Center, click IBM systems Hardware Information
Center → Installing hardware.
b.
S2 - Verify that the dynamic host configuration protocol (DHCP) server is running on the xCAT
management server.
c. After the Ethernet service VLAN and management consoles have been initially installed and
configured, they are ready to discover and connect to frames and servers on the Ethernet service
VLAN. Proceed to step 6.
6. To connect the resources in each rack of servers to the Ethernet service VLAN and verify that
addresses have been correctly served for each frame or rack of servers, perform the following
procedure. By doing this one frame or rack at a time, you can verify that addresses have been served
correctly, which is critical for cluster operation.
a. M3 - Connect the frame or server to the Ethernet service VLAN. Use the documentation
provided for the installation of these units. IBM Service personnel can access the Worldwide
Customized Installation Instructions for each server model that is not a customer setup model.
Customer server setup information is available:
v For POWER6: IBM System Information Center for the IBM system being installed.
v For POWER5: IBM System Information CenterInformation Center → Initial server setup.
Procedures for installing the GX InfiniBand host channel adapters are also available in the IBM
systems Hardware Information Center, click IBM systems Hardware Information Center →
Installing hardware.
Note: Do not proceed in the server installation instructions (Worldwide Customized Installation
Instructions or Information Center) past the point where you attach the Ethernet cables from the
frames and servers to the Ethernet service VLAN.
b. Attach power cables to the frames and servers. Use the documentation provided for the
installation of these units. For units that are installed by IBM Service, the service representative
has access to Worldwide Customized Installation Instructions for each server model. For
customer installable units, setup information is available in:
v For POWER6: IBM System Information Center for the IBM system being installed.
High-performance computing clusters using InfiniBand hardware
125
v For POWER5: IBM System Information CenterInformation Center → Initial server setup.
Procedures for installing the GX InfiniBand host channel adapters are also available in the IBM
systems Hardware Information Center, click IBM systems Hardware Information Center →
Installing hardware.
c. S2 - Apply power to the system racks or frames through the unit emergency power off (UEPO)
switch. Allow the servers to reach the power standby state (Power Off). For servers in frames or
racks without bulk power assemblies (BPAs), the server starts to the power standby state after
connecting the power cable.
Note: Do not press the power button on the control panels or apply power to the servers so that
they boot to the logical partition standby state.
S3 - Use the following procedure to verify that the servers are now visible on the DHCP server.
1) Check the DHCP server to verify that each server and bulk power controller (BPC) have been
given an IP address. For a frame with a BPC, you would see an IP address assigned for each
BPC and service processor connection. For a frame or rack with no BPC, you would see IP
addresses assigned for each service processor connection.
2) Record the association between each server and its assigned IP address.
7. M4 - If you are not using CRHS, skip to step 8. Otherwise, after each server and BPC is visible on
the DHCP server, using instructions for CRHS in the installation documentation, you must connect
the frames and servers by assigning them to their respective managing HMC. Go to step 9.
d.
8. If you are not using Cluster Ready Hardware Server, in the Server and Frame Management
windows, verify that each HMC has visibility to the appropriate servers and frames that it controls.
9. M4 - Authenticate the frames and servers.
10. S3 - In the server and frame management windows on each HMC, verify that you can see all the
servers and frames to be managed by the HMC.
11. S4 - Ensure that the servers and power subsystems (applies to IBM systems with 24 inch racks) in
your cluster are all at the correct firmware levels. See the IBM Clusters with the InfiniBand Switch
web-site referenced in “Cluster information resources” on page 2, for information regarding the most
current release levels of:
v system firmware
v power subsystem firmware (applies to IBM systems with 24 inch racks)
Follow the links in the IBM Clusters with the InfiniBand Switch web-site referenced in “Cluster
information resources” on page 2, to the appropriate download sites and instructions.
12. S5 - Verify system operation from the HMCs by performing the following procedure at each HMC
for the cluster.
a. a. Bring the servers to LPAR standby and verify the system viability by waiting several minutes
and checking Service Focal Point. If you cannot bring a server to LPAR Standby, or there is a
serviceable event reported in Service Focal Point, perform the prescribed service procedure as
found in:
1) For POWER6: IBM System Information Center for the IBM system being installed.
2) For POWER5: IBM System Information Center.
b. To verify each server, use the following procedure to run the eServer diagnostics:
1) Depending on the server and who is doing the installation, you might want to run these
diagnostics from the CD-ROM, AIX NIM SPoT, or concurrently from an installed AIX
operating system. The LPAR must be configured and activated before you might run eServer
diagnostics.
2) ii. To resolve any problem with a server, check the diagnostic results and Service Focal Point
and follow the maintenance procedures.
126
Power Systems: High performance clustering
Note: Typically, the IBM service representatives responsibility ends here for IBM service installed
frames and servers. From this point forward, after the IBM service representative leaves the site,
if any problem is found in a server, or with an InfiniBand link, a service call must be placed.
The IBM service representative would recognize that the HCA link interface and InfiniBand
cables have not been verified, and is not verified until the end of the procedure for InfiniBand
network verification, which might be performed by either the customer or a non-IBM vendor.
When the IBM service representative leaves the site, it is possible that the procedure for
InfiniBand network verification might identify a faulty link. In this case the IBM service
representative might receive a service call to isolate and repair a faulty HCA or cable.
Installing and configuring the cluster server hardware ends here.
Installing the operating system and configuring the cluster servers
This procedure is for the customer installing the operating system and configuring the cluster servers.
Operating system installation and configuring the cluster servers encompasses major tasks S6 and S7,
and the server part of M4 which are illustrated in Figure 11 on page 71. You would be installing
operating systems and configuring the cluster servers.
Note: If possible, do not begin this procedure until “Installing and configuring the management
subsystem” on page 98 is completed. This helps avoid the situation where installation personnel might be
waiting on-site for key parts of this procedure to be completed. Depending on the arrival of units on-site,
this is not always practical. Review “Order of installation” on page 70 and Figure 11 on page 71 to
identify the merge points where a step in a major task or procedure that is being performed by one
person is dependent of the completion of steps in another major task or procedure that is being
performed by another person.
Also, if possible, do not begin this procedure until “Installing operating system installation servers” on
page 105, is completed.
Before proceeding obtain the following documentation.
v Operating system installation guides
v Host channel adapter (HCA) installation topics from the IBM systems Hardware Resource and
Information Centers.
If this installation is for a cluster expansion or addition of hardware to a cluster, before proceeding,
review “Installing the operating system and configuring the cluster servers information for expansion.”
Installing the operating system and configuring the cluster servers information for
expansion
View information for server installation and configuration expansion.
If it is a new installation, skip this section.
If you are adding or expanding InfiniBand network capabilities to an existing cluster by adding servers to
the cluster, then you must approach the server installation and configuration differently than with a new
cluster flow. The flow for server installation and configuration is based on a new cluster installation, but
it indicates where there are variances for expansion scenarios.
The following table outlines how the new cluster installation is affected or altered by expansion scenarios.
High-performance computing clusters using InfiniBand hardware
127
Table 71. Effects on cluster installation when expanding existing clusters
Scenario
Effects
Adding InfiniBand hardware to an existing cluster (switches v Configure the logical partitions to use the HCAs.
and host channel adapters (HCAs))
v Configure HCAs for switch partitioning.
Adding new servers to an existing InfiniBand network
v Perform this procedure as if it were a new cluster
installation.
Adding HCAs to an existing InfiniBand network
v Perform this procedure as if it were a new cluster
installation.
Adding a subnet to an existing InfiniBand network
v Configure the logical partitions to use the new
HCA ports.
v Configure the newly cabled HCA ports for switch
partitioning.
Adding servers and a subnet to an existing InfiniBand
network
v Perform this procedure as if it were a new cluster
installation.
Installing the operating system and configuring the cluster servers
Use this procedure to install your operating system and to configure the cluster servers.
Note: Installing and configuring the operating system and configuring the cluster server encompasses
major tasks that are illustrated in the Figure 11 on page 71.
1. S6 - (M2) Customize LPARs and HCA configuration. For more information about HCA configuration,
“Planning an IBM GX HCA configuration” on page 53.
a. If you are using 9125-F2A servers with only one logical partition per server, use the configCECs
script on the xCAT management server.
1) When using xCAT: /opt/xcat/share/xcat/ib/scripts/configCECs
Note: The script must be modified to work with model 520/550 servers.
Note: If you have 9125-F2A servers with “heavy” I/O planars, you must exclude the onboard
InfiniBand HCA that normally is defined as iba3 for AIX partitions and ehca3 for Linux
partitions. Without excluding the on-board HCA, if you have a second IBM GX HCA, its
devices would be iba2 and iba4 for AIX and ehca2 and ehca4 for Linux. Use “–exclude_hw
RIO” to completely eliminate the onboard iba from the configuration. If there is a special and
IBM qualified reason to use it as iba4, use “-exclude_hw 10G”.
b. If you did not use the configCECs script for partitions on non-supported server types, define
LPARs using the following procedures. Otherwise, go to step 2. During this procedure, you must
Configure the HCAs using the procedure found in “Installing or replacing an InfiniBand GX host
channel adapter” on page 147. Ensure that you do the steps that configure the GUID index and
capability for the HCA in the LPAR.
1) For POWER6: IBM Resource Link® for the IBM system on which the LPAR is running.
Note: 9125-F2A servers with “heavy” I/O planars would have an on-board InfiniBand HCA
defined as an extra InfiniBand device. This is always iba3 for AIX partitions and ehca3 for
Linux partitions. Delete this from the configuration. Without excluding the on-board HCA, if
you have a second IBM GX HCA, its devices would be iba2 and iba4 for AIX and ehca2 and
ehca4 for Linux.
2) For POWER5: IBM systems Hardware Information Center.
Note: When creating LPAR profiles, be sure to configure the appropriate LPARs to ensure that
at any given time at least one active LPAR has the service authority policy enabled.
128
Power Systems: High performance clustering
2. S7 - After the servers are connected to the cluster VLAN, install and update the operating systems. If
servers do not have removable media, you must use an AIX network installation management (NIM)
server or Linux distribution server to load and update the operating systems.
Note: In order to use ml0 with AIX 5.3, you must install the devices.common.IBM.sni.ml file set. To
verify the existence of the file set use lslpp -h devices.common.IBM.sni.ml.
If you are installing Linux on your servers, ensure that the appropriate rpms are ready to be installed,
see “RedHat rpms required for InfiniBand” on page 135. For xCAT, see the following information.
Quite often the xCAT management server is used as an AIX NIM server or Linux distribution server.
If so, be sure to refer the documentation for xCAT and the procedure in “Installing operating system
installation servers” on page 105.
When using xCAT:
In addition to consulting xCAT documentation (see references in “Cluster software and firmware
information resources” on page 5), including the xCAT InfiniBand setup documentation
(xCAT2IBsupport.pdf), perform the following procedure.
Note: This step is meant to prepare the operating system and the appropriate rpms for InfiniBand.
Step 4 completes the operating system installation of the InfiniBand secondary adapter (HCA).
a. Create a /install/postscript/host.sh script to copy the /etc/hosts and other important files out
to the nodes during installation. This is important for configuring the InfiniBand interfaces.
#!/bin/sh
# Log what is being done to the syslog
logger -t xcat "copy the /etc/hosts from mgt server"
cd /tmp/
# $MASTER is a standard environment variable used in the install
process
wget -l inf -N -r --waitretry=10 --random-wait --retry-connrefused -t
0 -T 60 ftp://$MASTER/postscripts/hosts |logger -t xcat
mv /tmp/$MASTER/postscripts/hosts /etc/hosts
rm -fr /tmp/$MASTER
b. Update the postscripts table to include the hosts.sh script by using one of the two commands:
chdef -t node -o <node> -p postscripts=host.sh or chdef -t group -o lpar -p
postscripts=host.sh # where “lpar” is a node group consisting of all servers’ partitions.
To check the postscripts table, run tabdump postscripts. The results should be like the following,
especially the entry with “hosts.sh”. This example output assumes that –o <node> was used for
chdef.
#node,postscripts,comments,disable
"xcatdefaults","syslog,aixremoteshell,setupntp,configrmcnode",,
"service","servicenode",,
"<node>","hosts.sh",,
c. Put appropriate InfiniBand drivers/libraries rpms listed into the /install/post/otherpkgs/<os>/
<arch> directory where <os> and <arch> can be found in the nodetype table. For installations using
RedHat, see “RedHat rpms required for InfiniBand” on page 135.
The following os types are recognized by xCAT. However, the System P clusters using InfiniBand
hardware support only rh.
centos
fedora
rh
windows
The arch should be ppc64 or ppc32. However, you require both 32 and 64 bit libraries to be placed
in the directory.
3. Before proceeding ensure that the Subnet Manager has been started and that it is configured with the
appropriate MTU as planned using “Planning maximum transfer unit (MTU)” on page 51 and the
“QLogic and IBM switch planning worksheets” on page 83. For host-based Subnet Managers, see
High-performance computing clusters using InfiniBand hardware
129
“Installing the fabric management server” on page 105. For embedded Subnet Managers, see
“Installing and configuring vendor or IBM InfiniBand switches” on page 137.
The subnet managers must be running before you start to configure the interfaces in the partitions. If
the commands start failing and lsdev | grep ib reveals that devices are Stopped, it is likely that the
subnet managers are not running.
4. S7 (M2) Configure the InfiniBand secondary adapter as described in the following section. Choose the
procedure based on using xCAT. Use the planned IP addresses for the Infiniband interfaces.
a. If you have installed Linux on the servers, confirm that all of the required rpm for InfiniBand are
on the servers. For installations using RedHat, see “RedHat rpms required for InfiniBand” on page
135. If these rpms are not installed on the servers, yet, install them now. Use the documentation
provided with the operating system. For further information, see the IBM Clusters with the
InfiniBand Switch web-site referenced in “General cluster information resources” on page 3.
b. Use cluster management server scripts to configure the InfiniBand secondary adapter.
Note: For AIX, this can also be done manually, using the operating system-dependent instructions
found in “Installation sub procedure for AIX only” on page 134. For Linux, see the following
instructions.
For xCAT:
Copy configiba script:
1) On the management server copy and modify the appropriate configiba script from:
/opt/xcat/share/xcat/ib/scripts to /install/postscript/configiba
v If only /opt/xcat/share/xcat/ib/scripts/configiba exists in your installation copy that.
v If you have predominantly dual 2-port IBM GX HCAs, and using all of the ports, copy
/opt/xcat/share/xcat/ib/scripts/configiba.2 ports (unless it does not exist in your
installation).
v If you are configuring fewer than 8 HCA ports on your servers, copy /opt/xcat/share/xcat/
ib/scripts/configiba.1 port (unless it does not exist in your installation).
2) Make the following updates to the copied configiba script:
v 1 - Copy configiba from /opt/xcat/share/xcat/ib/ to configiba
v 2 - Modify the @nums variable to match the number of ports you have per server:
For 2 ports: my @nums = (0..1)
For 4 ports: my @nums = (0..3)
For 8 ports: my @nums = (0..7)
v 3 - If necessary modify the netmask in the configiba script. The default is 255.255.0.0
v 4 - If necessary modify the gateway in the configiba script. The default is X.X.255.254
v 5 - If the InfiniBand interface name is not a simple combination of a short host name and
ibX or the netmask and gateway does not meet the user requirements, then modify the
sample configiba script, like in the following example:
my $hostname = "$ENV{NODE}-$nic";
or
my $fullname = `echo $ENV{NODE} | cut -c 1-11`;
chomp($fullname);
my $hostname = "$fullname-$nic";
3) Add the configiba script to the xCAT postscripts table. The PostScript otherpkgs is used to
install InfiniBand libraries/drivers and configiba is used to configure the HCAs.
chtab node=lpar postscripts.postscripts=hosts.sh,otherpkgs,configiba
4) On each partition, perform the following steps:
v echo "options ib_ehca nr_ports=-1" >> /etc/modprobe.conf
v /etc/init.d/openibd restart
130
Power Systems: High performance clustering
v Verify that the following is set to -1: cat /sys/module/ib_ehca/parameters/nr_ports
5) On the management server, run updatenode for each partition: updatenode lpar
otherpkgs,configiba.
Set up DNS:
If the xCAT management server provids DNS service, the following procedure can be used.
1) The IP address entries for IB interfaces in /etc/hosts on xCAT managed nodes should have the
node short host name and the unique IB interface name in them. The format should be
<ip_address_for_this_ib_interface node_short_hostname-ib_interfacename>.
For example, if c890f11ec01 is the node short host name, c890f11ec01-ib0, c890f11ec01-ib1,
c890f11ec01-ib2, etc. are the IP names for the IB interfaces on c890f11ec01.
2) Update networks table with IB sub-network, using tabedit networks. For example:
chtab net=172.16.0.0 networks.netname=ib0
networks.mask=255.255.0.0 networks.mgtifname=ib
Note: The attributes gateway, dhcpserver, tftpserver, and nameservers in the networks table
are not required to be assigned, since the xCAT management function is running over ethernet.
3) On AIX, change the default connection between management nodes and managed nodes from
ssh to rsh: chtab key=useSSHonAIX site.key=no
4) If the managed nodes have already been installed, make sure /etc/resolv.conf is available on
the managed nodes before running updatenode, since configiba connects to the same server to
resolve IP address for the IB interfaces. If /etc/resolv.conf is not available on the managed
nodes, define it or use rcp to copy it from the management node to the managed nodes.
An example resolv.conf file is:
domain ppd.pok.ibm.com
search ppd.pok.ibm.com
nameserver 172.16.0.1
Note: In this example, 172.16.0.1 is the name server address for the name server that provides
the IP addresses for IB interfaces on managed nodes.
5) Add the entries in the /etc/hosts into DNS and restart the DNS.
The following is an example of /etc/hosts:
192.168.0.10 c890f11ec01-ib0
192.168.0.11 c890f11ec01-ib1
6) For Linux Managed Nodes, perform the following steps:
v makedns
v service named restart
Note: Make sure the state of named is active.
7) For AIX Managed Nodes, perform the following steps:
v makedns
v stopsrc –s named
v startsrc –s named
Note: Make sure the state of named is active.
8) Check if DNS for the IB network has been set up successfully. The following commands
would check ib0 and ib1 on c890f11ec01:
For AIX:lsrrc –s named | grep “c890f11ec01”
For Linux:
v nslookup c890f11ec01-ib0
v nslookup c890f11ec01-ib1
High-performance computing clusters using InfiniBand hardware
131
5. S7 - Verify InfiniBand adapter configuration
a. If you are running a host-based Subnet Manager, to check multicast group creation, on the Fabric
Management Server run the following commands. Remember that, for some commands, you must
provide the HCA and port through which the Subnet Manager connects to the subnet. For IFS 5,
complete the following steps:
1) Check for multicast membership. At least one group should be returned per InfiniBand subnet:
iba_showmc | egrep "Fabric|GID"
Fabric 1:1 Multicast Information:
GID: 0xff12601bffff0000:0x0000000000000016
GID: 0xff12401bffff0000:0x0000000000000016
Fabric 1:2 Multicast Information:
GID: 0xff12601bffff0000:0x0000000000000016
GID: 0xff12401bffff0000:0x0000000000000016
Fabric 2:1 Multicast Information:
GID: 0xff12601bffff0000:0x0000000000000016
GID: 0xff12401bffff0000:0x0000000000000016
Fabric 2:2 Multicast Information:
GID: 0xff12601bffff0000:0x0000000000000016
GID: 0xff12401bffff0000:0x0000000000000016
2) Check for MTU and link rate. Typically, you use the MTU and rate that are considered to be in
error, because that should return fewer things. Generally, these would return only the fabric
management server HCA links. The following example shows checking for 2 K MTU and SDR
speeds.
iba_reports –o links –F “mtu:2048” # To check for MTU of 2048
iba_reports –o links –F “rate:10g” # To check for SDR speeds
b.
If you are running an embedded Subnet Manager, to check multicast group creation, run the
following on each switch with a master Subnet Manager. If you have set it up, you might use xdsh
from the xCAT/MS to the switches (see “Set up remote command processing” on page 120). For
dsh, remember to use --devicetype IBSwitch::Qlogic when pointing to the switches. For xdsh,
remember to use –l admin --devicetype IBSwitch::Qlogicfor i in [list of SM instances;
typically 0 1 2 3]; do /usr/local/util/sm_query –i $i smShowGroups; done
There should be just one group with all the HCA devices on the subnet being part of the group.
Note that mtu=5 indicates 4 K. mtu=4 indicates 2 K. The following example shows 4 K MTU.ico
0xff12401bffff0000:00000000ffffffff (c000)
qKey = 0x00000000 pKey = 0xFFFF mtu = 5 rate = 3 life = 19 sl = 0
0x00025500101a3300 F 0x00025500101a3100 F 0x00025500101a8300 F
0x00025500101a8100 F 0x00025500101a6300 F 0x00025500101a6100 F
0x0002550010194000 F 0x0002550010193e00 F 0x00066a00facade01 F
c. Verify HCA configuration in the partitions:
For AIX partitions:
1) Verify that the device is set to superpackets on:
for i in `lsdev | grep Infiniband | awk ’{print $1}’ | egrep -v "iba|icm"`
do
echo $i
lsattr -El $i | egrep "super"
done
Note: To verify a single device (like ib0) use lsattr -El ib0 | egrep "mtu|super"
2) Now check the interfaces for the HCA devices (ibx) and ml0 using:
netstat -in | grep -v link | awk ’{print $1,$2}’
The results should look like the following, where the MTU value is in the second column:
Name Mtu
en2 1500
ib0 65532
ib1 65532
ib2 65532
132
Power Systems: High performance clustering
ib3 65532
ib4* 65532
ib5 65532
ib6 65532
ib7 65532
ml0 65532
lo0 16896
lo0 16896
Note: If you have a problem where the MTU value is not 65532, you must follow the recover
procedure in “Recovering ibX interfaces” on page 235.
For Linux partitions:
1) Verify that the IPoIB process starts. Use lsmod.
2) Verify that /etc/sysconfig/network/ifcfg-ib* files are set up correctly. The following is an
example which first lists the ifcfg-ib* file for each interface and then example contents for
ib0. DEVICE indicates the interface. The key fields that change based on the server and
interface are: IPADDR, NETMASK and GATEWAY. BOOTPROTO should be static, and
STARTMODE should be auto.
c957f8ec01:~ # ls -l /etc/sysconfig/network/ifcfg-ib*
-rw-r--r-- 1 root root 104 Jun 25 14:42 /etc/sysconfig/network/ifcfg-ib0
-rw-r--r-- 1 root root 104 Jun 25 14:42 /etc/sysconfig/network/ifcfg-ib1
-rw-r--r-- 1 root root 104 Jun 25 14:42 /etc/sysconfig/network/ifcfg-ib2
-rw-r--r-- 1 root root 104 Jun 25 14:43 /etc/sysconfig/network/ifcfg-ib3
c957f8ec01:~ # cat /etc/sysconfig/network/ifcfg-ib0
DEVICE=ib0
BOOTPROTO=static
IPADDR=10.0.1.101
NETMASK=255.255.255.0
GATEWAY=10.0.255.254
STARTMODE=auto
3) Use ifconfig ibX to verify interface operation.
Example output. Note the correctconfiguration based on the /etc/sysconfig/ifcfg-ib0 file, and
that the broadcast is running.
[root on c697f1sq01][/etc/sysconfig/network] => ifconfig ib0
ib0
Link encap:UNSPEC HWaddr 80-00-08-24-FE-80-00-00-00-00-00-00-00-00-00-00
inet addr:10.0.1.1 Bcast:10.0.1.255 Mask:255.255.255.0
inet6 addr: fe80::202:5500:1001:2900/64 Scope:Link
UP BROADCAST RUNNING MULTICAST MTU:2044 Metric:1
RX packets:895100 errors:0 dropped:0 overruns:0 frame:0
TX packets:89686 errors:0 dropped:0 overruns:0 carrier:0
collisions:0 txqueuelen:512
RX bytes:50136680 (47.8 Mb) TX bytes:5393192 (5.1 Mb)
4) Use netstat –i to verify the interface table
Example output with 4 K MTU configuration:
Iface
MTU Met
RX-OK RX-ERR RX-DRP RX-OVR
eth0
1500
0 1141647
0
0
0
ib0
4092
0 1028150
0
0
0
ib1
4092
0 1028260
0
0
0
ib2
4092
0 1028494
0
0
0
ib3
4092
0 1028293
0
0
0
lo
16436
0 513906
0
0
0
TX-OK TX-ERR TX-DRP TX-OVR Flg
122790
0
0
0 BMRU
102996
0
0
0 BMRU
102937
0
0
0 BMRU
102901
0
0
0 BMRU
102910
0
0
0 BMRU
513906
0
0
0 LRU
5) Use netstat –rn to verify the routing table
Example output:
[root on c697f1sq01][/etc/init.d] => netstat -rn
Kernel IP routing table
Destination
Gateway
Genmask
Flags
9.114.28.64
0.0.0.0
255.255.255.192 U
10.0.4.0
0.0.0.0
255.255.255.0
U
10.0.1.0
0.0.0.0
255.255.255.0
U
MSS
0
0
0
Window
0
0
0
irtt
0
0
0
Iface
eth0
ib3
ib0
High-performance computing clusters using InfiniBand hardware
133
10.0.2.0
10.0.3.0
169.254.0.0
127.0.0.0
0.0.0.0
0.0.0.0
0.0.0.0
0.0.0.0
0.0.0.0
9.114.28.126
255.255.255.0
255.255.255.0
255.255.0.0
255.0.0.0
0.0.0.0
U
U
U
U
UG
0
0
0
0
0
0
0
0
0
0
0
0
0
0
0
ib1
ib2
eth0
lo
eth0
6. Once the servers are up and running and xCAT is installed and you can dsh/xdsh to the servers, and
you have verified the adapter configuration, map the HCAs. This will help with future fault isolation.
For more details see 'Use the procedure found in “General mapping of IBM HCA GUIDs to physical
HCAs” on page 197.
a. Logon to the xCAT MS
b. Create a location for storing the HCA maps such as: /home/root/HCAmaps
Note: If you do not have mixed AIX and Linux nodes, instead of using the “-N” parameter in the
following commands, use “-a” and store all nodes in one file; for example NodeHCAmap.
c. For AIX nodes run the following command:
For xCAT: xdsh [noderange with all AIX nodes] –v 'ibstat -n | grep GUID' >
/home/root/HCAmaps/AIXNodeHCAmap
d. For Linux nodes run the following command:
For xCAT: xdsh [noderange with all Linux nodes] –v 'ibv_devinfo -v | grep “node_guid”' >
/home/root/HCAmaps/LinuxNodeHCAmap
This procedure ends here.
Installation sub procedure for AIX only:
Use this procedure when installing the AIX operating system and when directed from another procedure.
Return to the previous procedure at the end of this sub procedure.
1. Do not run a mkiba command until you have properly set up the Subnet Managers for correct
maximum transfer unit (MTU) as planned using “Planning maximum transfer unit (MTU)” on page
51 and the “QLogic and IBM switch planning worksheets” on page 83. For host-based Subnet
Managers, see “Installing the fabric management server” on page 105. For embedded Subnet
Managers, see “Installing and configuring vendor or IBM InfiniBand switches” on page 137.
The subnet managers must be running before you start to configure the interfaces in the partitions. If
the commands start failing and an lsdev | grep ib command reveals that devices are Stopped, it is
likely that the subnet managers are not running.
2. Run the mkdev command for the icm. For example, mkdev -c management -s infiniband -t icm
3. Run the mkiba command for the devices. For example, mkiba -a [ip address] -i ib0 -A iba0 -p 1
-P 1 -S up -m 255.255.255.0
4. After the HCA device driver is installed and mkiba is done, run the following to set the device MTU
to 4 K and enable super-packets
for i in `lsdev | grep Infiniband | awk ’{print $1}’ | egrep -v "iba|icm"`
do
chdev -l $i -a superpacket=on –a tcp_recvspace=524288 –a tcp_sendspace=524288
–a srq_size=16000 -a state=up
done
Note: The previous example modifies all of the host channel adapter (HCA) devices in the logical
partition. To modify a specific device (such as, ib0) use the command chdev -l ib0 –a
superpacket=on –a tcp_recvspace=524288 –a tcp_sendspace=524288 –a srq_size=16000 -a state=up
5. Verify the configuration.
a. To verify that the device is set with super packets on, use the following command.
134
Power Systems: High performance clustering
for i in `lsdev | grep Infiniband | awk ’{print $1}’ | egrep -v "iba|icm"`
do
echo $i
lsattr -El $i | egrep "super"
done
Note: To verify a single device (such as, ib0) run the command lsattr -El ib0 | egrep
"mtu|super"
b. Check the interfaces for the HCA devices (ibx) and ml0 using the following command.
netstat -in | grep -v link | awk ’{print $1,$2}’
The results should look similar to the following example, where the MTU value is in the second
column:
Name Mtu
en2 1500
ib0 65532
ib1 65532
ib2 65532
ib3 65532
ib4* 65532
ib5 65532
ib6 65532
ib7 65532
ml0 65532
lo0 16896
lo0 16896
Note: If you have a problem where the MTU value is not 65532, you must follow the recover
procedure in “Recovering ibX interfaces” on page 235.
c. If you are running a host-based Subnet Manager, to check multicast group creation, on the Fabric
Management Server run the following commands. Remember that, for some commands, you must
provide the HCA and port through which the Subnet Manager connects to the subnet.
For IFS 5, complete the following steps:
1) Check for multicast membership. At least one group should be returned per InfiniBand subnet:
iba_showmc | egrep "Fabric|GID"
Fabric 1:1 Multicast Information:
GID: 0xff12601bffff0000:0x0000000000000016
GID: 0xff12401bffff0000:0x0000000000000016
Fabric 1:2 Multicast Information:
GID: 0xff12601bffff0000:0x0000000000000016
GID: 0xff12401bffff0000:0x0000000000000016
Fabric 2:1 Multicast Information:
GID: 0xff12601bffff0000:0x0000000000000016
GID: 0xff12401bffff0000:0x0000000000000016
Fabric 2:2 Multicast Information:
GID: 0xff12601bffff0000:0x0000000000000016
GID: 0xff12401bffff0000:0x0000000000000016
2) Check for MTU and link rate. Typically, you use the MTU and rate that are considered to be in
error, because that should return fewer things. Generally, these return only the fabric
management server HCA links. The following example shows checking for 2 K MTU and SDR
speeds.
iba_reports –o links –F “mtu:2048” # To check for MTU of 2048
iba_reports –o links –F “rate:10g” # To check for SDR speeds
6. Return to the procedure that directed you to this sub procedure.
This sub procedure ends here
RedHat rpms required for InfiniBand:
Use this procedure only when installing the RedHat rmps required for InfiniBand.
High-performance computing clusters using InfiniBand hardware
135
1. Confirm that the rpms listed in the following table, are installed by using the rpm command as in the
following example:
[root on c697f1sq01][/etc/sysconfig/network] => rpm -qa | grep -i ofed
Refer the notes at the end of the table. The indications in the table for which libraries apply for
Galaxy1/Galaxy2 HCAs versus Mellanox-based HCAs; see libehca, libmthca and libmlx4.
Table 72. RHEL5.3 InfiniBand related drivers and libraries
Driver/Library
Corresponding rpm in RedHatEL5.3
openib
openib-*. el5.noarch.rpm
libib
32-bit
libibcm-*.el5.ppc.rpm
libibcm-devel-*.el5.ppc.rpm
libibcm-static-*.el5.ppc.rpm
libibcommon-*.el5.ppc.rpm
libibcommon-devel-*.el5.ppc.rpm
libibcommon-static-*.el5.ppc.rpm
libibmad-*.el5.ppc.rpm
libibmad-devel-*.el5.ppc.rpm
libibmad-static-*.el5.ppc.rpm
libibumad-*.el5.ppc.rpm
libibumad-devel-*.el5.ppc.rpm
libibumad-static-*.el5.ppc.rpm
libibverbs-*.el5.ppc.rpm
libibverbs-devel-*.el5.ppc.rpm
libibverbs-static-*.el5.ppc.rpm
libibverbs-utils-*.el5.ppc.rpm
64-bit
libibcm-*.el5.ppc64.rpm
libibcm-devel-*.el5.ppc64.rpm
libibcm-static-*.el5.ppc64.rpm
libibcommon-*.el5.ppc64.rpm
libibcommon-devel-*.el5.ppc64.rpm
libibcommon-static-*.el5.ppc64.rpm
libibmad-*.el5.ppc64.rpm
libibmad-devel-*.el5.ppc64.rpm
libibmad-static-*.el5.ppc64.rpm
libibumad-*.el5.ppc64.rpm
libibumad-devel-*.el5.ppc64.rpm
libibumad-static-*.el5.ppc64.rpm
libibverbs-*.el5.ppc64.rpm
libibverbs-devel-*.el5.ppc64.rpm
libibverbs-static-*.el5.ppc64.rpm
libibverbs-utils 64bit rpm is not available in RedHatEL5.3
libehca (for
Galaxy1/Galaxy2
support)
32-bit
libehca-*.el5.ppc.rpm
libehca-static-*.el5.ppc.rpm
64-bit
libehca-*.el5.ppc64.rpm
libehca-static-*.el5.ppc64.rpm
libmthca (for Mellanox
InfiniHost support)
32-bit
libmthca-*.el5.ppc.rpm
libmthca-static-*.el5.ppc.rpm
64-bit
libmthca-*.el5.ppc64.rpm
libmthca-static-*.el5.ppc64.rpm
32-bit
libmlx4-*.el5.ppc.rpm
libmlx4-static-*.el5.ppc.rpm
64-bit
libmlx4-*.el5.ppc64.rpm
libmlx4-static-*.el5.ppc64.rpm
libmlx4 (for Mellanox
ConnectX support)
General Notes®:
RedHatEL5.3 only ships 32-bit libibverbs-utils(it used to ship ibv_* commands) package in
CDs/DVD, which depends on 32-bit IB libraries. So it fails to be installed if only 64-bit
136
Power Systems: High performance clustering
libraries exist on the system. For the user who needs both these IB commands and the 64-bit
libraries, install both 32-bit and 64-bit library packages.
2. If the previous rpms have not been installed, yet, do so now. Use instructions from the documentation
provided with RedHat.
For other information, see the IBM Clusters with the InfiniBand Switch web-site referenced in
“Cluster information resources” on page 2.
Installing the operating system and configuring the cluster servers ends here.
Installing and configuring vendor or IBM InfiniBand switches
Use this procedure if you are responsible for installing the vendor or IBM switches.
The InfiniBand switch installation and configuration encompasses major tasks W1 through W6 that are
shown in Figure 11 on page 71.
Note: If possible, do not begin this procedure before the management subsystem installation and
configuration procedure is completed. This avoids the situation where various installation personnel are
waiting on-site for key parts of this procedure to be completed. Depending on the arrival of units on-site,
this is not always practical. Therefore, it is important to review the “Order of installation” on page 70 and
the Figure 11 on page 71. This is to identify the merge points where a step in a major task or procedure
being performed by one person is dependent on the completion of steps in another major task or
procedure being performed by another person.
Before installing and configuring vendor or IBM InfiniBand switches, obtain the following
documentation.
v QLogic Switch Users Guide and Quick Setup Guide
v QLogic Best Practices Guide for a Cluster
From your installation planner, obtain the “QLogic and IBM switch planning worksheets” on page 83.
Installing and configuring InfiniBand switches when adding or expanding an
existing cluster
If you are adding or expanding InfiniBand network capabilities to an existing cluster, then you might
approach the InfiniBand switch installation and configuration differently than with a new cluster flow.
If it is a new installation, skip this section.
The flow for InfiniBand switch installation and configuration is based on a new cluster installation, but it
indicates where there are variances for expansion scenarios.
The following table outlines how the new cluster installation is affected by expansion scenarios:
Table 73. Effects of expansion scenarios on cluster installation
Scenario
Effects
Adding InfiniBand hardware to an existing cluster
(switches and host channel adapters (HCAs))
Perform this task as if it were a new cluster installation.
Adding new servers to an existing InfiniBand network
Do not perform anything outlined in this major task.
Adding HCAs to an existing InfiniBand network
Do not perform anything outlined in this major task.
Adding a subnet to an existing InfiniBand network
Perform this task on new switches as if it were a new
cluster installation.
Adding servers and a subnet to an existing InfiniBand
network
Perform this task on new switches as if it were a new
cluster installation.
High-performance computing clusters using InfiniBand hardware
137
Installing and configuring the InfiniBand switch
Use this procedure to install and configure InfiniBand switches.
It is possible to perform some of the tasks in this procedure in a method other than which is described. If
you have other methods for configuring switches, you must review a few key points in the installation
process that are related to the order and coordination of tasks and configuration settings that are required
in a cluster environment. Review the following list of key points before beginning the switch installation
process.
v Power-on the InfiniBand switches and configure their IP addresses before attaching them to the cluster
virtual local area network (VLAN). Alternatively, you must add each switch to the cluster VLAN
individually and change the default IP address before adding another switch.
Note: The switch vendor documentation refers the Ethernet connection for switch management as the
service VLAN.
v Switches are set with static IP addresses on the cluster VLAN.
– If a switch has multiple managed spines or management modules, each one requires its own IP
address, in addition to an overall chassis IP address.
– You also must set up the default gateway.
v If an InfiniBand switch has multiple Ethernet connections for the cluster VLAN, and the cluster has
multiple cluster VLANs for redundancy, the switch Ethernet ports must connect to the same cluster
VLAN.
v Update the switch firmware code as required. See the IBM Clusters with the InfiniBand Switch website
referenced in “Cluster information resources” on page 2, for information regarding switch code levels.
v Set the switch name.
v Temporarily stop the embedded Subnet Manager and performance manager from running. Depending
on configuration, this might be a permanent state.
v Setup logging
– Enable full logging
– Enable full logging format
v Set the chassis maximum transfer unit (MTU) value according to the installation plan. See the switch
planning worksheet or “Planning maximum transfer unit (MTU)” on page 51.
v If the switch is not running an embedded Subnet Manager, complete the following tasks.
– Ensure that the embedded Subnet Manager is disabled
– Disable the performance manager
– Disable the default broadcast group
v If the switch is running an embedded Subnet Manager, complete the following tasks.
– Use the license key to enable embedded Subnet Manager to be run on the switch.
– Set up the priority based on the fabric management worksheet.
– Set the global identifier (GID)-prefix value according to the installation plan. See the switch planning
worksheet or “Planning for global identifier prefixes” on page 52.
– If this is a high-performance computing (HPC) environment, set the LID Mask Control (LMC) value
to 2.
– Set the broadcast MTU value according to the installation plan. See the switch planning worksheet
or “Planning maximum transfer unit (MTU)” on page 51.
v Point to network time protocol (NTP) server.
v Instruct the customer to verify that the switch is detected by the management server using the verify
detection step in the following procedure.
If you are expanding an existing cluster, also consider the following items.
138
Power Systems: High performance clustering
v For QLogic switch command help, on the command-line interface (CLI), use the help <command
name> command. Otherwise, the Users Guides provides information about the commands and
identifies the appropriate command in its procedural documentation.
v For new InfiniBand switches, perform all the steps in the following procedure on the new InfiniBand
switches.
Complete the following procedure to install and configure your InfiniBand switches.
1. Review this procedure and determine if the Fabric Management Server has the Fast Fabric Toolset
installed and be on the cluster VLAN before you finish this procedure. If Fast Fabric tools are
available, you can customize the multiple switches simultaneously once you have them configured
with unique IP addresses and they are attached to the cluster VLAN. If you do not have Fast Fabric
tools ready, you must customize each switch individually. In that case, you might want to do the
customization step right after the the switch management IP address is set up and give it a name.
2. W1 - Physically place frames and switches on the data center floor.
a. Review the vendor documentation for each switch model that you are installing.
b. Physically install the InfiniBand switches into 19-inch frames (or racks) and attach power cables
to the switches according to the instructions for the InfiniBand switch model. This power on the
switches automatically. There is no power switch for the switches.
Note: Do not connect the Ethernet connections for the cluster VLAN at this time.
3. W2 - Set up the Ethernet interface for the cluster VLAN by setting the switch to a fixed IP address
provided by the customer. See the switch planning worksheet. Use the procedure in vendor
documentation for setting switch addresses.
Note:
v You can attach a laptop to the serial port of the switch, or you can attach each switch individually
to the cluster VLAN and address it with the default address to get into the CLI and customize its
static-IP-address.
v As indicated in “Planning QLogic or IBM Machine Type InfiniBand switch configuration” on page
49, QLogic switches with managed spine modules have multiple addresses. There is an address
for each managed spine and an overall chassis address used by whichever spine is master at any
given time.
v If you are customizing the IP address of the switch by accessing the CLI through the serial port on
the switch, you might want to leave the CLI open to perform the rest of the customization. This is
not necessary if the Fast Fabric Toolset has been installed and can access the switches, because
Fast Fabric tools allow you to update multiple switches simultaneously.
v For QLogic switches, the key commands are setChassisIpAddr and setDefaultRoute.
v Use an appropriate subnet mask when setting up the IP addresses.
4. Set the switch name. For QLogic switches, use the setIBNodeDesc command.
5. Disable subnet manager and performance manager functions. If embedded subnet management is
used, this is reversed after the network cabling is done.
v Ensure that the embedded Subnet Manager is not running by using the smControl stop command
v Ensure that the embedded Subnet Manager does not start at boot using smConfig startAtBoot no
command
v Ensure that the performance manager is not running by using smPmBmStart disable command
6. W3 - Attach the switch to the cluster VLAN.
Note: If the switch has multiple Ethernet connections, they must all attach to the same Ethernet
subnet.
7. W4 - For QLogic switches, if the Fast Fabric Toolset is installed on the fabric management server
verify that the Fast Fabric tools can access the switch. Refer the Fast Fabric Toolset Users Guide, use a
High-performance computing clusters using InfiniBand hardware
139
simple query command or ping test to the switch. For example, the pingall command can be used as
long as you point to the switch chassis and not the servers or nodes.
8. W5 - Verify that the switch code matches the latest supported level indicated in IBM Clusters with
the InfiniBand Switch website referenced in “Cluster information resources” on page 2 web site.
Check the switch software level using a method described in the vendor switch Users Guides. These
guides also describe how to update the switch software, which is available on the vendor web site.
For QLogic switches, one of the following guides and methods are suggested:
v You can check each switch individually using a command on its CLI. This command can be found
in the switch model users guide.
v If the Fast Fabric Toolset is installed on the Fabric Management Server, you can check the code
levels of multiple switch simultaneously using techniques found in the Fast Fabric Toolset Users
Guide.
v The fwVersion command can be used. If issued using Fast Fabric tools, the cmdall command can
be used to issue this command to all switches simultaneously.
v For updating multiple switches simultaneously, the Fast Fabric Toolset should be used.
9. W6 - Finalize the configuration for each InfiniBand switch.
You are setting up the final switch and Subnet Manager configuration. These values should have
been planned in the planning phase (see “Planning InfiniBand network cabling and configuration”
on page 30 and the “QLogic and IBM switch planning worksheets” on page 83.
v Subnet Manager priority
v MTU
v LMC
v GID prefix
v Node appearance/disappearance log threshold
For QLogic switches, the pertinent commands and User Manuals and methods to be used by this
procedure follow.
v You can work with each switch individually using a command on its CLI.
v If the Fast Fabric Toolset is installed on the Fabric Management Server at this point, you can check
the code levels of multiple switch simultaneously using techniques found in the Fast Fabric Toolset
Users Guide. Set the chassis MTU value according to the installation plan. See the switch planning
worksheet or “Planning maximum transfer unit (MTU)” on page 51.
v For setting chassis MTU use the ismChassisSetMtu <value> command on each switch. (4=2K;
5=4K)
v For each embedded Subnet Manager, use the following commands for final configuration.
– Set the priority: smPriority <priority>
– For LMC=2: smMasterLMC=2
– For 4K broadcast MTU with default pkey: smDefBcGroup 0xFFFF 5 <rate> (rate: 3=SDR;
6=DDR rate)
– For 2K broadcast MTU with default pkey: smDefBcGroup 0xFFFF 4 <rate> (rate: 3=SDR;
6=DDR rate)
– For GID prefix: smGidPrefix <GID prefix value>
– For node appearance or disappearance threshold = 10: smAppearanceMsgThresh 10
a. If this switch has an embedded Subnet Manager, complete the following steps.
1) Enable the Subnet Manager for operation using the license key. Do not start the embedded
Subnet Manager, yet. That is done during the procedure “Attaching cables to the InfiniBand
network” on page 143. Use the addKey [key] command.
2) Set the GID-prefix value according to the installation plan. See the switch planning worksheet
or “Planning for global identifier prefixes” on page 52.
3) If this is a high-performance computing (HPC) environment, set the LMC value to 2.
140
Power Systems: High performance clustering
b. Set the broadcast MTU value according to the installation plan. See the switch planning
worksheet or “Planning maximum transfer unit (MTU)” on page 51.
c. If you have or would be connecting cables to 9125-F2A servers, configure the amplitude and
pre-emphasis settings as indicated in the “Planning QLogic or IBM Machine Type InfiniBand
switch configuration” on page 49, and the switch planning worksheet, perform one of the
following sets of steps.
If you must change the switch port amplitude settings, and there are more ports that require a
change from the default settings than those that should remain at the default settings, perform
the following steps:
1) Log on to the fabric management server.
2) Read the default amplitude setting from the switches: cmdall –C ismChassisSetDdrAmplitude,
which returns the settings for all ports. You should note that the settings are different from
the desired switch port amplitude settings. If this not the case, then you might stop this
procedure and go to step d, below.
3) Change to the new setting, issue cmdall –C ismChassisSetDdrAmplitude 0x01010101.
4) The next steps will set the ports that should remain at the default settings back to the default
settings. Remember that the links to the fabric management server must probably remain at
default settings.
5) For each port that is common among all switch run the command: cmdall –C
ismPortSetDdrAmplitude [port] 0x01010101.
v For the 9024 switch (IBM 7874-024), the format for the [port] is Cable x, where "x" is the
port number.
v For switches with leafs, the format for the [port] is LxPy, where "x" is the leaf number and
"p" is the port number.
v You might want to use a for loop on the fabric management server command line to step
through all of the ports. Example:
for port in L12P11 L12P12; do
ismPortSetDdrAmplitude $port 0x01010101; done
6) For each port that is unique to a particular switch, run the above ismPortSetDdrAmplitude
command as above, but either log on to the switch or add the -H [switch chassis ip
address] parameter to the cmdall command, so that it directs the command to the correct
switch.
7) Go to step d, below.
If you must change the switch port amplitude settings, and there are fewer ports that require a
change from the default settings than those that should remain at the default settings, perform
the following steps:
1) Log on to the fabric management server.
2) Read the default amplitude setting from the switches: cmdall –C ismChassisSetDdrAmplitude,
which returns the settings for all ports. You should note that the settings are different from
the desired switch port amplitude settings. If this not the case, then you might stop this
procedure and go to step d, below.
3) For each port that is common among all switch execute: cmdall –C ismPortSetDdrAmplitude
[port] 0x01010101.
v For the 9024 switch (IBM 7874-024), the format for the [port] is Cable x, where "x" is the
port number.
v For switches with leafs, the format for the [port] is LxPy, where "x" is the leaf number and
"p" is the port number.
v You might want to use a for loop on the fabric management server command line to step
through all of the ports. Example:
for port in L12P11 L12P12; do
ismPortSetDdrAmplitude $port 0x01010101; done
High-performance computing clusters using InfiniBand hardware
141
4) For each port that is unique to a particular switch, run the above ismPortSetDdrAmplitude
command as above, but either log on to the switch or add the -H [switch chassis ip
address] parameter to the cmdall command, so that it directs the command to the correct
switch.
5) Go to step d, below.
If you must change the switch port pre-emphasis settings and there are more ports that require a
change from the default settings than those that should remain at the default settings, perform
the following steps:
1) Log on to the fabric management server.
2) Read the default amplitude setting from the switches: cmdall –C ismChassisSetDdrAmplitude,
which returns the settings for all ports. You should note that the settings are different from
the desired switch port amplitude settings. If this not the case, then you might stop this
procedure and go to step d, below.
3) Change to the new setting, issue cmdall –C ismChassisSetDdrPreemphasis 0x00000000.
4) The next steps wpuld set the ports that should remain at the default settings back to the
default settings. Remember that the links to the fabric management server probably must
remain at default settings.
5) For each port that is common among all switch run the command: cmdall –C
ismPortSetDdrPreemphasis [port] 0x00000000.
v For the 9024 switch (IBM 7874-024), the format for the [port] is Cable x, where "x" is the
port number.
v For switches with leafs, the format for the [port] is LxPy, where "x" is the leaf number and
"p" is the port number.
v You might want to use a for loop on the fabric management server command line to step
through all of the ports. Example:
for port in L12P11 L12P12; do
ismPortSetDdrAmplitude $port 0x00000000; done
6) For each port that is unique to a particular switch, run the above ismPortSetDdrPreemphasis
command as above, but either log on to the switch or add the -H [switch chassis ip
address] parameter to the cmdall command, so that it directs the command to the correct
switch.
7) Go to step d, below.
If you need to change the switch port pre-emphasis settings and there are fewer ports that
require a change from the default settings than those that should remain at the default settings,
perform the following
1) Log on to the fabric management server.
2) Read the default amplitude setting from the switches: cmdall –C
ismChassisSetDdrPreemphasis, which returns the settings for all ports. You should note that
the settings are different from the desired switch port amplitude settings. If this not the case,
then you may stop this procedure and go to step d, below.
3) For each port that is common among all switch execute cmdall –C ismPortSetDdrPreemphasis
[port] 0x00000000.
v For the 9024 switch (IBM 7874-024), the format for the [port] is Cable x, where "x" is the
port number.
v For switches with leafs, the format for the [port] is LxPy, where "x" is the leaf number and
"p" is the port number.
v You might want to use a for loop on the fabric management server command line to step
through all of the ports. Example:
for port in L12P11 L12P12; do
ismPortSetDdrAmplitude $port 0x01010101; done
142
Power Systems: High performance clustering
4) For each port that is unique to a particular switch, run the above ismPortSetDdrPreemphasis
command as above, but either log on to the switch or add the -H [switch chassis ip
address] parameter to the cmdall command, so that it directs the command to the correct
switch.
5) Go to step d, below.
d. If applicable, point to the NTP server. For QLogic switches, this is done using the time command.
Details are in the Switch Users Guide. Typical commands are from the Fast Fabric Management
Server are as follows. If remote command execution is set up on the xCAT MS, you can use
dsh/xdsh instead of cmdall. For xCAT, remember to use –l -devicetype IBSwitch::Qlogic to
access the switches.
1) If applicable, set time using Network Time Protocol (NTP) server: cmdall -C 'time -S [NTP
server IP-address]
2) If no NTP server is present, set local time using cmdall –C ‘time –T hhmmss[mmddyyyy]'
3) Set time zone; where X is the offset of the timezone from GMT: cmdall -C 'timeZoneConf X'
4) Set daylight saving time; where X is the offset of the timezone from GMT: cmdall -C
'timeDSTTimeout X'
10. This procedure ends here. If you are also responsible for cabling the InfiniBand network, proceed to
“Attaching cables to the InfiniBand network.” Otherwise, you can return to the overview of the
installation section to find your next set of installation tasks.
Other installation tasks involving final configuration of switches are:
v “Set up remote logging” on page 112
v “Set up remote command processing” on page 120
Installing and configuring vendor or IBM InfiniBand switches ends here.
Attaching cables to the InfiniBand network
Use this procedure if you are responsible for installing the cables on the InfiniBand network.
Cabling the InfiniBand network encompasses major tasks C1 through C4, which are shown in Figure 11
on page 71.
Note: Do not start this procedure until InfiniBand switches have been physically installed. Wait until the
servers have been configured. This avoids the situation where installation personnel are waiting on-site
for key parts of this procedure to be completed. Depending on the arrival of units on-site, this is not
always practical. Therefore, it is important to review the “Order of installation” on page 70 and Figure 11
on page 71 to identify the merge points where a step in a major task or procedure being performed by
one person is dependent on the completion of steps in another major task or procedure being performed
by another person.
Before attaching the cables to the InfiniBand network, obtain the following documentation.
v QLogic Switch Users Guide and Quick Setup Guide
v QLogic Best Practices Guide for a Cluster
From your installation planner, obtain the following information.
v Cable planning information
v “QLogic and IBM switch planning worksheets” on page 83
High-performance computing clusters using InfiniBand hardware
143
Cabling the InfiniBand network information for expansion
If you are adding or expanding your InfiniBand network capabilities to an existing cluster, then you
might approach cabling the InfiniBand differently than with a new cluster flow. The flow for cabling the
InfiniBand network is based on a new cluster installation, but it indicates where there are variances for
expansion scenarios.
If it is a new installation, skip this section.
The following table outlines how the new cluster installation is affected or altered by expansion scenarios.
Table 74. Effects of expanding an existing cluster
Scenario
Effects
Adding InfiniBand hardware to an existing cluster
(switches and host channel adapters (HCAs))
Perform this task as if it were a new cluster installation.
All InfiniBand hardware is new to the cluster.
Adding new servers to an existing InfiniBand network
Perform this task as if it were a new cluster installation
for all new servers and HCAs added to the existing
cluster.
Adding HCAs to an existing InfiniBand network
Perform this task as if it were a new cluster installation
for all new HCAs added to the existing cluster.
Adding a subnet to an existing InfiniBand network
Perform this task as if it were a new cluster installation
for all new switches added to the existing cluster.
Adding servers and a subnet to an existing InfiniBand
network
Perform this task as if it were a new cluster installation
for all new servers and HCAs and switches added to the
existing cluster.
InfiniBand network cabling procedure
Use this procedure to cable your InfiniBand network.
It is possible to perform some of the tasks in this procedure using a method other than that which is
described. If you have other methods for cabling the InfiniBand network, you must still review a few key
points in the installation process about order and coordination of tasks and configuration settings that are
required in a cluster environment.
Note: IBM is responsible for faulty or damaged IBM part number cable replacement.
To cable your switch network, complete the following steps.
1. Obtain and review a copy of the cable plan for the InfiniBand network.
2. Label the cable ends before routing the cable.
3. Power-on the switches before attaching cables to them.
4. C1 - Route the InfiniBand cables according to the cable plan and attach them to only the switch ports.
Refer the switch vendor documentation for more information about how to plug cables.
5. C4 - Connect the InfiniBand cables to the host channel adapter (HCA) ports according to the planning
documentation.
6. If both servers and switches have power applied as you complete cable connections, you should check
the port LEDs as you plug-in the cables. Refer the switch vendor Switch Users Guide to understand the
correct LED states. Fabric Management can now be started.
Note: Depending on assigned installation responsibilities, it is possible that someone else might
perform these actions. Coordinate this with the appropriate people.
For QLogic embedded Subnet Managers use the smControl start command, the smPmBmStart enable
command and the smConfig startAtBoot yes command. This command can be issued at the switch
command line, or using Fast Fabric's cmdall command. For QLogic host-based FabricManagers under
144
Power Systems: High performance clustering
IFS 5, use the qlogic_fm start command as directed in “Installing the fabric management server” on
page 105. Contact the person installing the Fabric Management Server and indicate that the Fabric
Manager might not be started on the Fabric Management Server.
7. This procedure ends here. If you are responsible for verifying the InfiniBand network topology and
operation, you can proceed to that procedure.
Attaching cables to the InfiniBand network ends here.
Verifying the InfiniBand network topology and operation
Use this procedure to verify the network topology and operation of your InfiniBand network.
This procedure is performed by the customer.
Verifying the InfiniBand network topology and operation encompasses major tasks V1 through V3, which
are shown in the Figure 11 on page 71.
Note: This procedure cannot be performed until all other procedures in cluster installation have been
completed. These include the management subsystem installation and configuration, server installation
and configuration, InfiniBand switch installation and configuration, and attaching cables to the InfiniBand
network.
The following documents are referenced by this procedure.
v For IBM units:
– IBM host channel adapter (HCA) worldwide Customized Installation Instructions
– Server service information
v For QLogic units
– Fast Fabric Toolset Users Guide
– Switch Users Guide
– Fabric Manager and Fabric Viewer Users Guide
Note: It is possible to perform some of the tasks in this procedure by following a method other than
which is described. If you have other methods for verifying the operation of the InfiniBand network,
you still must review a few key points in this installation process regarding order and coordination of
tasks and configuration settings that are required in a cluster environment.
v This procedure cannot be performed until all other procedures in the cluster installation have been
completed. These include the following procedures.
– Management subsystem installation and configuration, including:
- Fabric Manager
- Fast Fabric Toolset
– Server installation and configuration
– InfiniBand switch installation and configuration
– Cabling the InfiniBand network
v The exceptions to what must be installed before performing this verification procedure include
installation of the IBM high-performance computing (HPC) software stack and other customer-specific
software above the driver level.
v IBM service is responsible for replacing faulty or damaged IBM cable part numbers.
v Vendor service or the customer is responsible for replacing faulty or damaged non-IBM cable part
numbers.
v Check the availability of HCAs to the operating system before any application is run to verify network
operation.
High-performance computing clusters using InfiniBand hardware
145
v If you find a problem with a link that might be caused by a faulty HCA or cable, contact your service
representative for repair.
v This is the final procedure in installing an IBM System p cluster with an InfiniBand network.
The following procedure provides additional details that can help you perform the verification of your
network.
1. To verify the network topology, complete the following steps.
a. Check all power LEDs on all of the switches and servers to ensure that they are on. See the
vendor switch Users Guide and worldwide Customized Installation Instructions or IBM systems
service documentation for information about proper LED states.
b. Check all LEDs for the switch ports to verify that they are properly lit. See the vendor switch
Users Guide and the IBM HCA worldwide Customized Installation Instructions or IBM systems
service documentation for information about proper LED states.
c. Check the Service Focal Point on the Hardware Management Console (HMC) for server and HCA
problems. Perform service before proceeding. If necessary, contact IBM Service to perform service.
d. Verify that switches have proper connectivity and setup on the management subsystem. If you
find any problems, you must check the Ethernet connectivity of the switches, management servers,
and Ethernet devices in the cluster virtual local area network (VLAN).
1) On the fabric management server, perform a pingall command to all of the switches using the
instructions found in the Fast Fabric Toolset Users Guide. Assuming you have set up the default
chassis file to include all switches, this would be the pingall -C command.
2) If available, from a console connected to the cluster VLAN, open a browser and use each
switchs IP address as a URL to verify that the Chassis Viewer is operational on each switch.
The QLogic switch Users Guide contains information about the Chassis Viewer.
3) If you have the QLogic Fabric Viewer installed, start it and verify that all the switches are
visible on all of the subnets. The QLogic Fabric Manager and Fabric Viewer Users Guide contains
information about the Fabric Viewer.
e. Verify that the switches are correctly cabled by running the baseline health check as documented
in the Fast Fabric Toolset Users Guide. These tools are run on the Fabric Management Server.
1) Clear all the error counters using the cmdall -C 'ismPortStats -clear -noprompt' command.
2) Run the all_analysis –b command.
3) Go to the baseline directory as documented in the Fast Fabric Toolset Users Guide.
4) Check the fabric.*.links files to ensure that everything is connected as it should be.
You need a map to identify the location of IBM HCA GUIDs attached to switch ports. See
“Mapping fabric devices” on page 197 for instructions on how to do this mapping.
5) If anything is not connected correctly, fix it and rerun the baseline check.
2. To verify the clusters InfiniBand fabric operation, complete the following steps.
a. Verify that the HCAs are available to the operating system in each logical partition.
For logical partitions running the AIX operating system, check the HCA status by running the
lsdev -C | grep ib command. An example of good results for verifying a GX HCA is:
iba0 Available InfiniBand host channel adapter
b. To verify that there are no problems with the fabric, complete the following steps.
1) Inspect the management server log for Subnet Manager and switch log entries. For details on
how to read the log, see “Interpreting switch vendor log formats” on page 207. If a problem is
encountered, see “Cluster service” on page 183.
2) Run the Fast Fabric Health Check using instructions found in “Health checking” on page 157.
If a problem is encountered, see “Cluster service” on page 183.
c. At this time, you should run a fabric verification application to send data on the fabric. For the
procedure to run a fabric verification application, see “Fabric verification” on page 150. This
includes steps for checking for faults.
146
Power Systems: High performance clustering
d. After running the fabric verification tool, perform the checks recommended in “Fabric verification”
on page 150.
3. After fixing the problems, run the Fast Fabric tool baseline health check one more time. This can be
used to help monitor fabric health and diagnose problems. Use the /sbin/all_analysis -b command.
4. Clear all the switch logs to start with the clean logs. However, you want to make a copy of the logs
before proceeding. To copy the logs, complete the following steps.
a. Create a directory for storing the state at the end of installation by using the following command.
/var/opt/iba/analysis/install_capture
b. If you have the /etc/sysconfig/iba/chassis file configured with all switch chassis listed, issue the
captureall –C –d command /var/opt/iba/analysis/install_capture
c. If you have another file configured with all switch chassis listed: captureall –C –F [file with all
switch chassis listed] –d /var/opt/iba/analysis/install_capture
d. Run the cmdall -C 'logClear'
5. The InfiniBand network is now installed and available for operation.
This procedure ends here
Verifying the InfiniBand network topology and operation ends here.
Note: Beyond this point are procedures that are referenced by the preceding procedures.
Installing or replacing an InfiniBand GX host channel adapter
This procedure guides you through the process for installing or replacing an InfiniBand GX host channel
adapter (HCA).
The process of installing or replacing an InfiniBand GX HCA consists of the following tasks.
v Physically installing or replacing the adapter hardware into your system unit.
v Configuring the logical partition (LPAR) profiles with a new globally unique identifier (GUID)for the
new adapter in your switch environment.
v Verifying that the HCA is recognized by the operating system.
Notes:
1. If you are considering deferred maintenance of a GX HCA, review “Deferring replacement of a failing
host channel adapter” on page 149.
2. If you replace an HCA, it is possible that the new HCA can be defective in a way that prevents the
logical partition from activating. In this case, a notification is displayed on the controlling Hardware
Management Console (HMC). If this occurs, decide if you want to replace the new-defective HCA
immediately, or if you want to defer maintenance and continue activating the logical partition. To
defer maintenance and continue activating the logical partition, you must unassign the HCA in all the
logical partition profiles that contain the HCA following the procedure found in “Recovering from an
HCA preventing a logical partition from activating” on page 235.
To install or replace an InfiniBand GX HCA, complete the following steps.
1. Obtain the installation instructions from the Worldwide Customized Installation Instructions website
and use those with these instructions.
2. If you are performing an adapter replacement, first record information about the adapter being
replaced. Important information includes: the logical partitions in which it is used, the GUID index
used in each logical partition, and the capacity used in each logical partition. Do the following from
the HMC that manages the server in which the HCA is installed.
a. Obtain the list of logical partition profiles that use the HCA. If there is no list, proceed to the next
step.
High-performance computing clusters using InfiniBand hardware
147
b. Obtain or record the GUID index and capability settings in the logical partition profiles that use
the HCA by using the following steps.
1) Go to the Systems Management window.
2) Select the Servers partition.
3) Select the server in which the HCA is installed.
4) Select the partition to be configured.
5) Expand each logical partition that uses the HCA. If you do not know that which logical
partition uses the HCA, you must expand the following for each logical partition profile, and
record which ones use the HCA, and the GUID index and capability settings.
a) Select each partition profile that uses the HCA.
b) From the menu, click Selected → Properties.
c) In the Properties dialog, click the HCA tab.
d) Using its physical location, find the HCA of interest.
e) Record the GUID index and capability settings.
3. Install or replace the adapter in the system unit. For instructions on installing an InfiniBand GX HCA
in your system unit, see the RIO/HSL or InfiniBand adapter information in the IBM Power Systems
Hardware Information Center.
Note: When an HCA is added to a logical partition, the HCA becomes a required resource for the
logical partition. If the HCA ever fails in such a way that the systems GARD function prevents it from
being used, the logical partition cannot be reactivated. If this occurs, a message is displayed on the
controlling HMC that indicates that you must unassign the HCA from the logical partition to continue
activation. The GARD function is started for serious adapter or bus failures that can impair system
operation, such as ECC errors or state machine errors. InfiniBand link errors should not start the
GARD function.
4. Update the logical partition profiles (for all logical partitions that uses the new GX HCA) with the
new GUID for the new InfiniBand GX HCA. Each InfiniBand GX HCA has a GUID that is assigned
by the manufacturer. If any of these adapters are replaced or moved, the logical partition profiles for
all logical partitions that use the new GX HCA must be updated with the new GUID. The customer
can do this from the HMC that is used to manage the server in which the HCA is installed. To update
the logical partition profiles, complete the following steps.
a. Go to the Server and Partition window.
b. Select the Server Management partition.
c. Expand the server in which the HCA is populated.
d. Expand the Partitions under the server.
e. Expand each partition that uses the HCA, and perform the following steps for each partition
profile that uses the HCA.
1)
2)
3)
4)
5)
6)
Select each partition profile that uses the HCA.
From the menu, click Selected → Properties.
In the Properties dialog, click the HCA tab.
Using its physical location, find and select the HCA of interest.
Click Configure.
Enter the GUID index and Capability settings. If this is a new installation, obtain these settings
from the installation plan information. If this is a repair, see the setting that you previously
recorded in step 2 on page 147.
7) If the replacement HCA is in a different location than the original HCA, clear the original HCA
information from the partition profile, by choosing the original HCA by its physical location
and clicking Clear.
148
Power Systems: High performance clustering
Note: If the following message occurs when you attempt to assign a new unique GUID, you
might be able to recover from this error without the help of a service representative.
A hardware error has been detected for the adapter
U787B.001.DNW45FD-P1-Cx. You cannot configure the
device at this time. Contact your service provider
The Service Focal Point, can be accessed on your HMC, see the Start of call procedure in
Service Guide for the server, and perform the indicated procedures. Check the Service Focal
Point and look for reports that are related to this error. Perform any recovery actions that are
indicated. If you cannot recover from this error, contact your service representative.
5. After the server is started, verify that the HCA is recognized by the operating system. For more
information, see “Verifying the installed InfiniBand network (fabric) in AIX” on page 150.
6. You have finished installing and configuring the adapter. If you were directed here from another
procedure, return to that procedure.
This procedure ends here.
Deferring replacement of a failing host channel adapter
If you plan to defer maintenance of a failing host channel adapter (HCA), there is a risk of the HCA
failing in such a way that it can prevent future logical partition reactivation.
To assess the risk, determine if there is a possibility of the HCA preventing the reactivation of the logical
partition. If this is possible, you must consider the probability of a reboot while maintenance is deferred.
To determine the risk, complete the following steps on the Hardware Management Console (HMC).
1. Go to the Server and Partition window.
2. Click the Server Management partition.
3. Expand the server in which the HCA is installed.
4. Expand the partitions under the server.
5. Expand each partition that uses the HCA. If you do not know that which logical partition uses the
HCA, you must expand the following for each logical partition profile, and record which logical
partitions use the HCA.
a. Select each logical partition profile that uses the HCA.
b. From the menu, click Selected → Properties.
c. In the Properties dialog, click the HCA tab.
d. Using its physical location, locate the HCA of interest.
e. Verify that the HCA is managed by the HMC.
6. To determine whether to defer maintenance, there are two possibilities:
v If you find that the HCA is not managed by the HMC, it has failed in such a way that it would be
GARDed off during the next IPL. Therefore, consider that until maintenance is performed, any of
the logical partitions using the failed HCA might not properly activate until the HCA is unassigned.
This affects future IPLs that the customer wants to perform during the deferred maintenance
period. Also, any other failure that requires a reboot also results in the partition not activating
properly. To unassign an HCA, see “Recovering from an HCA preventing a logical partition from
activating” on page 235. If you unassign the adapter while the logical partition is active, the HCA is
unassigned at the next reboot.
v If you find that the HCA is managed by the HMC, the HCA failure would not result in the
GARDing of the HCA. And deferred maintenance would not risk the prevention of logical partition
activation because of a GARDed HCA.
Installing or replacing an InfiniBand GX host channel adapter ends here.
High-performance computing clusters using InfiniBand hardware
149
Verifying the installed InfiniBand network (fabric) in AIX
Verifying the installed InfiniBand network (fabric) in AIX after the InfiniBand network is installed. The
GX adapters and the network fabric must be verified through the operating system.
Use this procedure to check the status of a GX host channel adapter (HCA) by using the AIX operating
system.
To verify the GX HCA connectivity in AIX, check the HCA status by running the lsdev -C | grep ib
script.
An example of good results for verifying a GX HCA would be similar to the following example.
iba0 Available Infiniband host channel adapter.
Fabric verification
This information describes how to run a fabric verification application and check for faults to verify fabric
operation.
Recommendations for fabric verification applications are found the IBM Clusters with the InfiniBand Switch
website referenced in IBM Clusters with the InfiniBand Switch. You can also choose to run your own
application. You must consider how much of the application environment you must start before running
your chosen application. The preferences on the IBM Clusters with the InfiniBand Switch web-site should
require a minimal application environment, and thus allow for verifying the fabric as early as possible in
the installation process.
If you choose to run your own application, use the verification steps outlined in “Fabric verification
procedure” on page 151 as part of your fabric verification procedure.
Fabric verification responsibilities
Unless otherwise agreed upon, running the Fabric Verification tool is the customers responsibility.
IBM service is responsible for replacing faulty or damaged cables with IBM part numbers that are
attached to IBM serviceable servers. Otherwise, either vendor service or the customer is responsible for
replacing faulty or damaged cables which are either non-IBM part numbers, or are attached to customer
serviceable units.
Reference documentation for fabric verification procedures
See the reference documentation for the Fabric verification procedures.
To perform fabric verification procedures, obtain the following documentation.
1. As applicable, the Fabric verification application documentation and readme.
2. Fast Fabric Toolset Users Guide
3. QLogic Troubleshooting Guide
4. QLogic Switch Users Guide
Fabric verification tasks
Use this procedure to learn how to verify the fabric operation.
To verify fabric operation, complete the following steps.
1. Install the Fabric verification application, or the customer application that is the most communication
intensive over the InfiniBand fabric. Such an application might not be a very compute intensive.
2. Set up the fabric verification application.
3. Clear error counters in the fabric to have a clean reference point for subsequent health checks.
150
Power Systems: High performance clustering
4. Perform verification by completing the following steps.
a. Run the fabric verification application
b. Look for events revealing fabric problems
c. Run a Health check
5. Repeat step 3 on page 150 and 4 until no problems are found in the fabric.
Fabric verification procedure
Use this procedure for fabric verification.
To verify fabric operation, complete the following steps.
1. Install the fabric verification application by using any instructions that come with it.
2. Clear the error counters in the fabric by using the /sbin/iba_report –C –o none script.
3. Run the fabric verification application by using any instructions that come with it. If there are
multiple passes then you can return to step 2 for each pass.
4. Check for problems by using the following steps.
a. Check serviceable events on all Hardware Management Consoles (HMC). If there is a serviceable
event reported, contact IBM Service. If you set up Service Focal Point monitoring as in “Set up
remote logging” on page 112 you can check for events on the Management Server first by using
the procedures for monitoring in the Administration Guide.
b. Check the switch and Subnet Manager logs:
1) On the xCAT/MS, check the /var/log/xcat/errorlog/[xCAT/MS hostname] log.
2) If any messages are found, diagnose them using “Table of symptoms” on page 187, and the
QLogic troubleshooting guide.
c. Run Fast Fabric Toolset health check
1) On the fabric management server, run the /sbin/all_analysis command.
2) Check results in /var/opt/iba/analysis/latest log. To interpret results use “Health checking”
on page 157 and the Fast Fabric Toolset Users Guide.
5. If a problem was found, return to step 2.
This procedure ends here.
Fabric verification ends here.
Runtime errors
Use this information to gain a high-level overview of runtime errors.
In an IBM System p high-performance computing (HPC) cluster, there are several methods for reporting
runtime errors. For more details, see “Cluster fabric management flow” on page 152 and “Cluster
service” on page 183.
The following items are some of the key runtime issues.
v IBM system runtime errors are reported to Service Focal Point with the appropriate FRU lists.
v Vendor switch runtime errors are first reported to the Subnet Manager and switch logs.
v If Fast Fabric health check is used, the output of the health check can also be used to report problems.
The user must either launch the health check manually, or script its launch through a service like cron.
High-performance computing clusters using InfiniBand hardware
151
Cluster Fabric Management
Use this information to learn about the activities, applications, and tasks required for cluster fabric
management.
This would be a lot more along the lines of theory and best practice than detailed procedures.
Documents referenced in this section can be found in “Cluster information resources” on page 2.
This chapter is broken into the following sections. A brief description of how to use each section is
included.
v “Cluster fabric management flow” illustrates an approximate flow for typical management activities in
a cluster.
v “Cluster Fabric Management components and their use” describes the various applications used for
cluster fabric management and how they can be typically used.
v “Cluster fabric management tasks” on page 155 describes how to perform various management tasks,
or where to find out how to perform those tasks. It would be referenced by the other Cluster Fabric
Management sections.
Cluster fabric management flow
Use this information to gain an understanding of the tasks involved in the cluster fabric management
flow.
The following figure shows a typical flow of cluster fabric management activities from the point of a
successful installation onward. As you work through the “Cluster fabric management tasks” on page 155,
you can refer this figure.
Figure 15. Cluster Fabric Management Flow
Cluster Fabric Management components and their use
This information describes how to use the main cluster management subsystem components.
To understand how the components for cluster fabric management work together, see “Management
subsystem function overview” on page 13.
This information describes how to use the main cluster management subsystem components. The
information is focused on the tools that can help you manage the cluster in a scalable manner.
The Chassis Viewer and switch command line are not described. They are used mainly to manage and
work with one switch at a time. The QLogic documentation can help you understand their use. For more
information, see the Switch Users Guide, and the Best Practices for Clusters Guide.
xCAT Systems Management
xCAT Systems Management application is used for the cluster.
Cluster Administration tool (xCAT) is used to loosely integrate the QLogic management subsystem with
the IBM management subsystem.
It provides two major functions that can be used to manage the fabric.
1. Remote logging and event management
2. Remote command execution
152
Power Systems: High performance clustering
Remote logging and event management is used to consolidate logs and serviceable events from the many
components in a cluster in one location - the xCAT Management Server (xCAT/MS). To set this up, see
“Set up remote logging” on page 112. For more information about how to use this monitoring capability
see “Monitoring fabric logs from the xCAT Cluster Management server” on page 156. To understand how
the logs flow from the vendors management applications to xCAT, see “Vendor log flow to xCAT event
management” on page 23.
Remote command execution (xdsh) gives you the capability to issue commands to the switches and the
fabric management server (which runs the host-based subnet manager and Fast Fabric Toolset). This
helps you to issue commands to these entities from the xCAT/MS just as you can do to the nodes in the
cluster. You can do this interactively, or you can use the capability by writing scripts that xdsh to access
the switches and Fast Fabric Toolset. Using this you to run monitoring or management scripts from the
central location of the xCAT/MS. To set up this capability see “Set up remote command processing” on
page 120. For more information about how to use remote command execution see “Remotely accessing
QLogic management tools and commands from xCAT/MS” on page 174 and “Remotely accessing QLogic
switches from the xCAT/MS” on page 175.
QLogic subnet manager
The QLogic subnet manager configures and maintains the fabric.
There might be multiple instances of the SM running on a particular InfiniBand subnet. Only one
instance can be the master at any given time. Any other instances are backups. There are two parameters
that control which one is the master at a given time.
The first is just the “priority”. When the fabric is started, the instance of the SM that has the highest
numbered priority (from 0 to 15) is the master. For IFS 5, this is controlled by the <Priority> statement in
/etc/sysconfig/qlogic_fm.config.
For IFS 5, the elevated priority statement is: <ElevatedPriority>.
To prevent this, an elevated priority scheme was implemented whereby the FM uses the elevated priority
when it takes over from another FM. This elevated priority should be higher than that of the "normal"
priority of the original master so that when the original master comes back online, its priority is lower
than that of the current master. Therefore, the current master, which was the backup, remains the master
until the user issues a command to cause the current master to use its original priority, which would then
put it at a lower priority than the original master. For details on how to issue this command, see
“Recovering the original master SM” on page 243.
The following example describes how SM_x_priority and SM_x_elevated_priority are used. It also
introduces a term called “current priority”. This is the actual priority being used by the SM at a given
time. For IFS 5, the priority and elevated_priority attributes are <Priority> and <ElevatedPriority>.
In this example, which uses the IFS 4 nomenclature, there are two instances of SM_0 on the same
InfiniBand subnet. There is one on Fabric M/S 1 and another on Fabric M/S 2. The original master is
intended to be on Fabric M/S 1, so it has the higher normal priority.
Fabric
Fabric
Fabric
Fabric
M/S
M/S
M/S
M/S
1
1
2
2
SM_0_priority = 1
SM_0_elevated_priority = 2
SM_0_priority = 0
SM_elevated_priority = 2
Event
Current® priority of SM_0
on Fabric M/S 1
Current priority of SM_0
on Fabric M/S 2
Current Master
Startup
1
0
Fabric M/S 1 SM_0
Fabric M/S 1 fails
1
2 (assumes
elevated_priority)
Fabric M/S 2 SM_0
High-performance computing clusters using InfiniBand hardware
153
Event
Current® priority of SM_0
on Fabric M/S 1
Current priority of SM_0
on Fabric M/S 2
Current Master
Fabric M/S 1 recovers
1
2
Fabric M/S 2 SM_0
Admin issues restore
priority command on
Fabric M/S 2
1
0
Fabric M/S 1 SM_0
QLogic fast fabric toolset
The Fast fabric toolset is a suite of management tools from QLogic.
The QLogic fast fabric toolset are used for managing and monitoring a cluster fabric. Reference the Fast
fabric toolset users guide for details on the commands to use. For more information about using Fast Fabric
tools, see the QLogic Best Practices for Clusters Guide.
Fast Fabric commands and tools that can be used are in the following table.
Table 75. Preferred Fast Fabric tools and commands
Tool or Command
Comments
cmdall
To issue Command Line Interface (CLI) commands to all
switches simultaneously.
Health check tools (all_analysis, fabric_analysis, and
other tools)
Use health check tools to check for problems during
installation, problem determination, and repair. You can
also run them periodically to proactively check for
problems or unexpected changes to the network by
comparing current state and configuration with a
baseline. For more information, see “Health checking” on
page 157.
captureall
Use to capture data for problem determination.
pingall
Use to ping all the switch chassis on the network to
determine if they are accessible from the fabric
management server.
iba_chassis_admin
Use primarily to update firmware and reboot switches
management firmware (switch chassis management and
embedded Subnet Manager).
iba_report
Use to generate many different reports on all facets of
fabric configuration and operation.
iba_reports
Use to run iba_report against all of the subnets attached
to an FM server. It uses the ports listed in
/etc/sysconfig/iba/ports.
fabric_info
Gives a summary of fabric information such as counts of
the number of HCAs (CAs), switch chips and links.
Fast Fabric Toolset menu (iba_config)
Fast Fabric functions can be accessed by using the Fast
Fabric Toolset menu, which is a TTY menu. This can be
especially helpful in learning the power of Fast Fabric.
Important information to remember about Fast Fabric Toolset follows:
v Do not use Fast Fabric tools to manage the IBM servers and IBM host channel adapters (HCAs).
v It runs on the fabric management server.
v It can query only host-based Subnet Managers that are on the same fabric management server.
154
Power Systems: High performance clustering
v It can query only subnets to which the fabric management server on which it is running is connected.
If you have more than four subnets, you must work with at least two different Fabric Management
Servers to get to all subnets.
v You must update the chassis configuration file with the list of switch chassis in the cluster. See
“Installing the fabric management server” on page 105.
v You must update the ports configuration file with the list of HCA ports on the fabric management
server. See “Installing the fabric management server” on page 105.
v Fast Fabric tools use the Performance Manager and other performance manager agents to collect link
statistics for health checks and iba_report results for fabric error checking. Therefore, performance
manager must be enabled for such checks to be successful.
QLogic performance manager
The performance manager is accessed indirectly. The Fabric viewer is one tool to access the performance
manager. Fast Fabrics iba_report does not access the performance manager to get link statistics.
Start the performance manager with the fabric manager.
Managing the fabric management server
Other than updating code and the operating system on the fabric management server, the only routine
maintenance item is to check the space left on the root (/) filesystem.
For example:
c938f4nm02:~ # df
Filesystem
/dev/sda2
udev
1K-blocks
153930080
2019300
Used Available Use% Mounted on
23644848 130285232 16% /
160 2019140
1% /dev
It is suggested to do this daily by using a cronjob and that a warning to be set at 90% Use%. This can
take quite some time to occur, because of the amount of disk space on this dedicated server.
If you have reached the 90% level, it is preferred that you begin to archive the following types of files,
and keep at least the previous two months worth of data readily accessible for debug purposes.
v Syslog files: /var/log/messages-[timestamp].bz2
v Health check files: /var/opt/iba/analysis/[timestamp]
v Any other files that you generate periodically, especially the files associated with hourly error reports
preferred in “Setting up periodic fabric health checking” on page 158.
For information about updating code and the operating system on the fabric management server, see
“Updating Fabric Manager code” on page 176.
Cluster fabric management tasks
Cluster fabric management tasks include how to monitor critical cluster fabric components, and how to
maintain them.
These tasks do not cover how to service or repair faults or errors, but they reference appropriate
procedures in either another document or in “Cluster service” on page 183.
Table 76. Cluster fabric management tasks
Task
Reference
Minimize IBM Systems Management effect on fabric
Reboot the entire cluster
“Restarting the cluster” on page 246
Reboot one or a few servers
“Restarting or powering off an IBM system” on page 247
Monitoring
High-performance computing clusters using InfiniBand hardware
155
Table 76. Cluster fabric management tasks (continued)
Task
Reference
Monitor for general problems
“Monitoring the fabric for problems”
Monitor for fabric-specific problems
“Monitoring fabric logs from the xCAT Cluster
Management server”
Manually querying status of the fabric
“Querying status” on page 174
Scripting to QLogic management tools and switches
“Remotely accessing QLogic management tools and
commands from xCAT/MS” on page 174
Run or update the baseline health check
“Health checking” on page 157
Diagnosing symptoms found during monitoring
“Table of symptoms” on page 187
Map IBM host channel adapter (HCA) device locations
“General mapping of IBM HCA GUIDs to physical
HCAs” on page 197
Maintenance and Changes
Code maintenance
“Updating code” on page 176
Finding and interpreting configuration changes
“Finding and interpreting configuration changes” on
page 180
Verifying that new configuration changes were done
successfully
“Verifying repairs and configuration changes” on page
245
Run or update baseline health check
“Health checking” on page 157
To set up xCAT Event Management for the fabric again.
“Reconfiguring xCAT event management” on page 232
Monitoring the fabric for problems
Use this procedure to learn several ways to monitor for problems in the fabric.
The primary method is to query logs on the xCAT/MS and use health checks on the fabric management
server. Both of which might be accomplished on the xCAT/MS by using the following procedures:
1. “Monitoring fabric logs from the xCAT Cluster Management server”
2. “Health checking” on page 157
3. “Querying status” on page 174
However, there are also other error indicators that are used less frequently and as backups to the
suggested methods shown here. These are described in service procedures found in “Fault reporting
mechanisms” on page 183.
This information addresses where to look for problems that can affect the fabric.
Monitoring fabric logs from the xCAT Cluster Management server
You can set up the xCAT/MS to automatically monitor for problems.
You can use the xCAT and RSCT infrastructure to automate the monitoring of problems. However, this
requires user setup to customize to the users environment. To accomplish this setup, see xCAT How-to
guides and RSCT guides. One possible method is to use the response script Email root anytime linked to
the LocalIBSwitchLog condition.
To set up the monitoring of fabric logs from the xCAT/MS, you must have completed the installation
procedure in “Set up remote logging” on page 112.
To check the fabric logs on the xCAT/MS, go to the /tmp/systemEvents file. This file contains log entries
from switches and Subnet Managers that might point to serviceable events in the fabric. If there are
entries in this log, see the “Table of symptoms” on page 187.
156
Power Systems: High performance clustering
If the Email root anytime response is enabled, then the fabric logs go to the root account. These might
also be interpreted by using the “Table of symptoms” on page 187.
If the LogEventToxCATDatabase response is enabled, then references to the fabric logs would be in the
xCAT database. These references point to files where the log entries are located. These might also be
interpreted by using the “Table of symptoms” on page 187.
Other fabric logs for engineering use might be stored in /var/log/xcat/syslog.fabric.info file. This is
done if you set up the switches and fabric management servers to send INFO and above messages to the
xCAT/MS while performing the procedure in “Set up remote logging” on page 112.
Health checking
Health checking provides methods to check for errors and the overall health of the fabric.
Before setting up health checking, obtain the Fast Fabric Toolset Users Guide for reference. Using the –-help
parameter on any of the referenced tools can prove helpful in understanding the available parameters.
QLogic provides health check tools as part of their Fast Fabric Toolset. The most generic health check
available is all_analysis, which is referred often in this section. Generally, this health check is run to
gather all manner of health check information from the entire fabric. However, you can also target
specific devices and ports with these commands. This includes configuration information, which has to
remain constant under normal circumstances. The health check tools with a short description of each are
listed in the following section:
v fabric_analysis queries port counters and link connectivity
v chassis_analysis checks the health and configuration of the switch chassis
v hostsm_analysis or esm_analysis checks the configuration of the subnet manager
v all_analysis runs all of the above analysis tools
v fabric_info provides a quick list of devices and links in the fabric
There are several times that health checks are done. The method for interpreting results varies depending
on what you are trying to accomplish. These times are listed in the following section.
Note: These commands must be run on each fabric management server that has a master subnet
manager running on it. So, the health check also checks the master subnet managers configuration
The health checks that commands should be run at various times as described in the following points.
v During installation or reconfiguration to verify that there are no errors in the fabric and that the
configuration is as expected. Repeat these steps until the configuration looks good.
– Run fabric_info command to determine if the correct number of devices appears on the fabric. The
following output is an example for a single subnet. The comments are not part of the output. They
are only included to help understand the output better.
SM: c999f4nm02 HCA-2 Guid: 0x0008f104039908e5 State: Master
Number of CAs: 53
# one for each HCA port; including the Fabric/MS
Number of CA Ports: 53 # same as number of CAs
Number of Switch Chips:
76 # one per IBM GX HCA port + one per switch leaf + two per switch spine
Number of Links: 249 # one per HCA port + 12 per leaf
Number of 1x Ports: 0 # should always be zero
– Run the following command repeatedly until configuration looks good:
/sbin/all_analysis -b
v Once everything is verified after an installation or repair, a baseline health check is saved for future
comparisons. Repairs that lead to serial number changes on FRUs, or movement of cables, or switch
firmware and software updates constitute configuration changes.
/sbin/all_analysis –b
High-performance computing clusters using InfiniBand hardware
157
v Periodically to monitor the fabric (For more information, see “Setting up periodic fabric health
checking”):
/sbin/all_analysis
Note: The LinkDown counter in the IBM GX+/GX++ HCAs would be reset as soon as the link goes
down. This is part of the recovery procedure. While this is not optimal, the connected switch ports
LinkDown counter provides an accurate count of the number of LinkDowns for the link.
v To check link error counters without comparing against baseline for configuration changes:
/sbin/all_analysis –e
v During debug to query the fabric. This can be helpful for performance problem debug.
To save history during debug: /sbin/all_analysis –s
v During repair verification to identify errors or inadvertent changes by comparing the latest health
check results to the baseline health check results.
– To save history during queries: /sbin/all_analysis –s
– If the configuration is changed (this includes part serial numbers, a new baseline is required:
/sbin/all_analyis –b
The following are important setup files for Fast Fabric Health Check. Details on how to set them up are
found in the Fast Fabric Toolset Users Guide. These are also referenced in “Installing the fabric management
server” on page 105.
Note: These must be modified on each fabric management server.
v /etc/sysconfig/fastfabric.conf = basic setup file
v /etc/sysconfig/iba/chassis = list of switch chassis
v /etc/sysconfig/iba/esm_chassis = list of switch chassis running embedded SM
v /etc/sysconfig/iba/ports = list of ports on Fabric/MS. (format = “hca:port” and space delimited)
v /etc/syconfig/iba/iba_mon.conf = reporting thresholds for error counters. This must be modified
Setting up periodic fabric health checking:
Set up Periodic fabric health checking to ensure that nothing has changed in the fabric that might affect
performance.
The following information is based on setting up health checking that is performed no less than once
each day, and no more frequently than once every 10 minutes.
Create a cron job to run all_analysis or a script that calls all_analysis. The frequency depends on how
pro-active the site must be for fixing fabric problems. Daily checks are preferred for all sites with the
highest frequency being once every 10 minutes.
In addition to running all_analysis periodically, it is preferred to run an iba_report every hour to collect
errors, if they be required for debug. Do the hourly gathering of errors with a thresholds configuration
file (described in the following section) that has thresholds turned off such that all errors are collected. Be
careful to ensure that you do not run two instances of all_analysis, fabric_analysis, or iba_report
simultaneously; this includes running iba_report and all_analysis simultaneously.
Because the fabric management server is a dedicated server, you do not require close management of the
file system space, even with frequent health checks occurring. However, it is preferred to periodically
check the amount of space left on the root (/) file system.
The most important aspect in determining whether a count in an error counter indicates a problem is the
error threshold count. The default counts are found in /etc/sysconfig/iba/iba_mon.conf. They are raw
counts and are not time-based. In order to simplify the interpretation of the error counts, different
158
Power Systems: High performance clustering
threshold files must be generated based on the amount of time since the most recent clearing of link
errors. Therefore, it is also important to create a cronjob (or some other method) to periodically clear port
error counters such that you can determine which threshold file to use at any given time all_analysis,
fabric_analysis or iba_report –o errors is run.
The remainder of this section addresses setting up threshold files and cronjobs.
Thresholds:
The default thresholds shipped with iba_report and Fast Fabric are set up assuming that there is no
regular clearing of error counters and that error counters might not be read on a regular basis. Therefore,
the threshold counts tend to be fairly high to avoid false error reporting. This document concerns itself
with a more regimented approach to error counter monitoring. Which includes regular clearing of error
counters and by using different sets of thresholds based on the time since the last clear of the error
counters. Therefore, a methodology and set of thresholds have been developed with certain assumptions
in mind:
1. While the InfiniBand architecture specifies a bit error rate of 10-12, the components used in an IBM
System p cluster were designed to achieve a bit error rate between 10-15 and 10-14.
2. Error monitoring is done at least once per day.
3. Error counters are cleared once per day and at a regular time.
4. The time since the last clear of error counters is deterministic.
5. If a particular links error counters are cleared at a different time than other links, it is possible to miss
a link that is performing slightly out of specification, until after the daily error clears are done. This is
because the rest of the links require a higher threshold. They require higher threshold because their
error counters were cleared before the individual links counters were cleared and thus have had more
time to accumulate errors. While this is a limitation of the iba_report use of the threshold
configuration file, a link that is performing that close to the margin must not have much impact on
performance.
The reason a links error counters might be reset while the other links error counters would be when a
CEC was power cycled, or a cable reseated for service.
6. The IBM GX LHCAs have no link error counters and are not monitored.
7. The Fast Fabric tools iba_report, all_analysis, or fabric_analysis are used to monitor error counters.
The all_analysis tool actually uses fabric_analysis, which in turn, uses iba_report to collect error
counter data.
The default threshold file used by iba_report is /etc/sysconfig/iba/iba_mon.conf. You can point to a
different threshold file with the “-c [threshold config file]” option. The best way to use the threshold
checking in iba_report is to have various iba_mon.conf files that can be used depending on the last time
error counters were cleared in the fabric. Typically, name the iba_mon.conf files with an extension
indicating the time since the last clear. Because of the nature of the design, the minimum time frame used
for thresholds is one hour. This is true even if the polling frequency of error counters is less than one
hour.
For IBM System p clusters, it is preferred that the default /etc/sysconfig/iba/iba_mon.conf file is
renamed to iba_mon.conf.original, and that a new one with thresholds set to 1 or “ignore” is used
instead. The default and preferred settings are listed in the following section:
The error counter thresholds in the default iba_mon.conf are:
# Error Counters
SymbolErrorCounter
LinkErrorRecoveryCounter
LinkDownedCounter
PortRcvErrors
PortRcvRemotePhysicalErrors
#PortRcvSwitchRelayErrors
100
3
3
100
100
100
# known Anafa2 issue, incorrectly increments
High-performance computing clusters using InfiniBand hardware
159
PortXmitDiscards
PortXmitConstraintErrors
PortRcvConstraintErrors
LocalLinkIntegrityErrors
ExcessiveBufferOverrunErrors
VL15Dropped
100
10
10
3
3
100
Note: The PortRcvSwitchRelayErrors are commented out such that they are never reported. This is
because of a known problem in the switch chip that causes this error counter to incorrectly increment.
The preferred substitute for iba_mon.conf follows. You can create this by first renaming the default
iba_mon.conf that is shipped with Fast Fabric to iba_mon.conf.original. And then copy and modify it to
these counter values.
# Error Counters
SymbolErrorCounter
LinkErrorRecoveryCounter
LinkDownedCounter
PortRcvErrors
PortRcvRemotePhysicalErrors
#PortRcvSwitchRelayErrors
PortXmitDiscards
PortXmitConstraintErrors
PortRcvConstraintErrors
LocalLinkIntegrityErrors
ExcessiveBufferOverrunErrors
#VL15Dropped
1
1
1
1
1
100
1
1
1
1
1
1
# known Anafa2 issue, incorrectly increments
Note: All error counter thresholds for errors of interest are set to 1. The VL15Dropped errors are
commented out and thus are not reported; see “VL15Dropped” on page 273. The
PortRcvSwitchRelayErrors remains commented out, because there is a bug in the switch chip that
compromises the integrity of that counter.
The following list is preferred to use for thresholds 24 hours after the last time the errors were cleared.
This is used as the basis to calculate other time periods. For more details on thresholds for individual
errors, see them in their respective sub sections under “Error counter details” on page 265. You would
create an iba_mon.conf.24 file by modifying the iba_mon.conf file to these values.
# Error Counters
SymbolErrorCounter
LinkErrorRecoveryCounter
LinkDownedCounter
PortRcvErrors
PortRcvRemotePhysicalErrors
#PortRcvSwitchRelayErrors
PortXmitDiscards
PortXmitConstraintErrors
PortRcvConstraintErrors
LocalLinkIntegrityErrors
ExcessiveBufferOverrunErrors
VL15Dropped
10 # 10
3 # 3
3 # 3
10 # 10
10 # 10
100
10 # 10
1 # 10
1 # 10
3 # 3
3 # 3
0
per day in $diffh hours
per day in $diffh hours
per day in $diffh hours
per day in $diffh hours
per day in $diffh hours
# known Anafa2 issue, incorrectly increments
per day in $diffh hours
per day in $diffh hours
per day in $diffh hours
per day in $diffh hours
per day in $diffh hours
Note: Errors that are based on individual symbol or packet errors have thresholds based on a bit error
rate between 10-15 and 10-14. Other errors that are counted because a link is considered to be noisy have a
threshold of 3 in a 24 hour period. Errors that must not occur at all and must be reported immediately
have a threshold set to 1. Errors that must not be reported are either commented out, or have a threshold
set to 0, which turns of reporting of those errors.
Typically, the threshold that you would choose for a particular error counter at a given time would be
calculated as follows. Where the preferred threshold for 24 hours and the preferred minimum threshold
for any given error counter is documented in “Error counter details” on page 265. And in the values
preferred for an iba_mon.conf.24 file, which would be used for 24 hours after the last error counter clear.
160
Power Systems: High performance clustering
Threshold = (Threshold for 24 hours) * (Number hours since last clear)/24
However, the threshold used must never be lower than the minimum threshold for the error counter.
Also, always round-up to the next highest integer.
Always set the threshold for PortRcvErrors equal to or less than PortRcvPhysicalRemoteErrors, because
PortRcvErrors is incremented for PortRcvPhysicalRemoteErrors, too. If the PortRcvErrors threshold is
greater than PortRcvPhysicalRemoteErrors, you might see only the PortRcvErrors and make the incorrect
conclusion that there is an issue with the local link instead of with a remote link.
Based on the previously mentioned rules, the error counter thresholds over a 24 hour period are given in
the following table. In order to conserve space, hours are grouped in ranges that have the same set of
thresholds. When creating individual iba_mon.conf files to be called, it might prove easier to create
identical files with different extensions for each hour. For example, iba_mon.conf.1 and iba_mon.conf.9
would have the same contents. However, it would be easier to determine programmatically which one to
use at a given point in time.
Table 77. Error Counter Thresholds over 24 hours
Counter
Hours since last error counter clear
1-9
10-11
12-14
15-16
17-19
20-21
22-23
24
SymbolErrorCounter
3
4
5
6
7
8
9
10
LinkErrorRecoveryCounter
1
1
1
1
2
2
2
3
LinkDownedCounter
1
1
1
1
2
2
2
3
PortRcvErrors
3
4
5
6
7
8
9
10
PortRcvRemotePhysicalErrors
3
4
5
6
7
8
9
10
PortRcvSwitchRelayErrors
0
0
0
0
0
0
0
0
PortXmitDiscards
3
4
5
6
7
8
9
10
PortXmitConstraintErrors
3
4
5
6
7
8
9
10
PortRcvConstraintErrors
3
4
5
6
7
8
9
10
LocalLinkIntegrityErrors
1
1
1
1
2
2
2
3
ExcessiveBufferOverrunErrors
1
1
1
1
2
2
2
3
VL15Dropped
0
0
0
0
0
0
0
0
Cronjobs:
At regular intervals, you must clear the error counters, because the thresholds are not time-based, but
simple count-based thresholds. The time period between error counter clears are every 24 hours. Two
examples would be presented: 1-querying at 4 hour intervals and 2-querying at 1 hour intervals.
The following procedure shows how to set up a 24-hour monitoring cycle at 4-hour intervals.
The default port error counter thresholds are defined in the /etc/sysconfig/iba/iba_mon.conf file.
Multiple instances of this file would be created, each configured to an appropriate set of thresholds based
on the time period which it would be used and based on the thresholds in the Table 77 table.
1. Save the original file by using the command:
cp –p /etc/sysconfig/iba/iba_mon.conf
/etc/sysconfig/iba/iba_mon.conf.original
2. Create a file for each time period throughout a 24-hour cycle. This helps you to point to a specific
threshold for that time period. This would help reduce false callouts of suspected faulty links. Because
High-performance computing clusters using InfiniBand hardware
161
you must reference these files with the all_analysis script command, name them based on the time
period in which they would be used, such as iba_mon.conf.[time period].
3. Edit to update the symbol errors threshold to the value in Table 77 on page 161. For example, in the
following you would see the default setting for SymbolErrorCounter and the setting for hour 12 in the
file /etc/sysconfig/iba/iba_mon.conf.12.
# Default SymbolErrorCounter
SymbolErrorCounter
100
Using Table 77 on page 161, for hour 12, you would have the iba_mon.conf.12, with the following
symbol error threshold setting:
# Error Counters
SymbolErrorCounter
5
4. Set up cron jobs to run the all_analysis command with different threshold files. For example, if you
start the 24-hour interval at 6 a.m., the crontab would look like the following example. Which
assumes that the switch names begin with SilverStorm*, and that at 6 a.m., the –C is used to reset the
counters:
0 6 * * * FF_FABRIC_HEALTH=” -s -C -o errors -o slowlinks -F nodepat:SilverStorm*”
/sbin/all_analysis –c /etc/sysconfig/iba/iba_mon.conf.0
0 10 * * * /sbin/all_analysis –c /etc/sysconfig/iba/iba_mon.conf.4
0 14 * * * /sbin/all_analysis –c /etc/sysconfig/iba/iba_mon.conf.8
0 18 * * * /sbin/all_analysis –c /etc/sysconfig/iba/iba_mon.conf.12
0 22 * * * /sbin/all_analysis –c /etc/sysconfig/iba/iba_mon.conf.16
0 2 * * * /sbin/all_analysis –c /etc/sysconfig/iba/iba_mon.conf.20
5. Configure a cron job to run iba_report –o errors to gather all non-zero error counters once per hour.
a. Configure a threshold file with thresholds set to 1. Name it /etc/sysconfig/iba/iba_mon.conf.low.
In the following example VL15Dropped and PortRcvSwitchRelayErrors are commented out.
# Error Counters
SymbolErrorCounter
LinkErrorRecoveryCounter
LinkDownedCounter
PortRcvErrors
PortRcvRemotePhysicalErrors
#PortRcvSwitchRelayErrors
PortXmitDiscards
PortXmitConstraintErrors
PortRcvConstraintErrors
LocalLinkIntegrityErrors
ExcessiveBufferOverrunErrors
#VL15Dropped
1
1
1
1
1
100
1
1
1
1
1
1
# known Anafa2 issue, incorrectly increments
b. Create a directory to store the output files. You can use /var/opt/iba/analysis/hourly, or any
other directory that works best for the site.
c. Create a cron entry like the following example. It runs on the quarter hour to avoid conflict with
the all_analysis cronjobs. The switch node pattern used in the following example is the default
that begins with “SilverStorm”. If you have changed the IBNodeDescription for the switches, you
must change the –F parameter. iba_reports is used, which is the plural of iba_report.
15 * * * * /sbin/iba_reports –o errors –F “nodepat:SilverStorm*” –c
/etc/sysconfig/iba/iba_mon.conf.low > [output directory]/errors.`/bin/date +”%Y%m%d_%H%M”`
Note: A more sophisticated method is to call a script that calculates the amount of time that has
passed. Since the most recent error counter clears and calls that script without the reference
specific instances of iba_mon.conf. For an example script, see “Example health check scripts” on
page 275.
The cron entry would look like: 0 2,6,10,14,18,22 * * * [script name]
The following section provides information about how to set up a 24 hour monitoring cycle at 1 hour
intervals:
162
Power Systems: High performance clustering
The default port error counter thresholds are defined in the /etc/sysconfig/iba/iba_mon.conf file, which
must be configured for each intervals threshold. Then, cronjobs must be set up that reference these
configuration files.
1. Save the original file:
cp –p /etc/sysconfig/iba/iba_mon.conf
/etc/sysconfig/iba/iba_mon.conf.original
2. Create a file for each time period throughout a 24 hour cycle. This helps you to point to a specific
threshold for that time period. This helps to reduce false callouts of suspected faulty links. Because
you must reference these files with the all_analysis script, name them based on the time period in
which they would be used: iba_mon.conf.[time period].
3. Edit to update the error counter thresholds to the value in Table 77 on page 161. For example, in the
following you would see the default setting for the SymbolErrorCounter and the preferred setting for
hour 12 in the file /etc/sysconfig/iba/iba_mon.conf.12.
# Default SymbolErrorCounter
SymbolErrorCounter
100
Using Table 77 on page 161, in the following, for hour 12, you would have a file named
iba_mon.conf.12, with the following symbol error threshold setting:
# Recommended SymbolErrorCounter
SymbolErrorCounter
5
4. Set up cron jobs to run all_analysis with different threshold files. For example, if you start the 24
hour interval at 6AM, the crontab can look like the following example. Which assumes that the switch
names begin with SilverStorm*, and that at 6AM, the –C is used to reset the counters:
0 6 * * * 'FF_FABRIC_HEALTH=” -s -C -o errors -o slowlinks -F
nodepat:SilverStorm*” /sbin/all_analysis –c /etc/syconfig/iba_mon.conf.0’
0 7-11 * * * /sbin/all_analysis –c /etc/syconfig/iba_mon.conf.1-4’
0 12-15 * * * /sbin/all_analysis –c /etc/syconfig/iba_mon.conf.8-11
0 18 * * * /sbin/all_analysis –c /etc/syconfig/iba_mon.conf.8-11
0 19-20 * * * /sbin/all_analysis –c /etc/syconfig/iba_mon.conf.13-14
0 21-22 * * * /sbin/all_analysis –c /etc/syconfig/iba_mon.conf.15-16
0 23 * * * /sbin/all_analysis –c /etc/syconfig/iba_mon.conf.17-19
0 0-1 * * * /sbin/all_analysis –c /etc/syconfig/iba_mon.conf.20-21
0 2-3 * * * /sbin/all_analysis –c /etc/syconfig/iba_mon.conf.20-21
0 4-5 * * * /sbin/all_analysis –c /etc/syconfig/iba_mon.conf.22-23
5. Configure a cron job to run iba_report –o errors to gather all non-zero error counters once per hour.
a. Configure a threshold file with thresholds set to 1. Name it /etc/sysconfig/iba/iba_mon.conf.low.
In the following example, VL15Dropped and PortRcvSwitchRelayErrors are commented out.
# Error Counters
SymbolErrorCounter
LinkErrorRecoveryCounter
LinkDownedCounter
PortRcvErrors
PortRcvRemotePhysicalErrors
#PortRcvSwitchRelayErrors
PortXmitDiscards
PortXmitConstraintErrors
PortRcvConstraintErrors
LocalLinkIntegrityErrors
ExcessiveBufferOverrunErrors
#VL15Dropped
1
1
1
1
1
100
1
1
1
1
1
1
# known Anafa2 issue, incorrectly increments
b. Create a directory to store the output files. You can use /var/opt/iba/analysis/hourly, or any
other directory that works best for the site.
c. Create a cron entry like the following example. The cron entry runs on the quarter hour to avoid
conflict with the all_analysis cronjobs. The switch node pattern used in the following example is
the default that begins with “SilverStorm”. If you have changed the IBNodeDescription for the
switches, you must change the –F parameter. In the following example iba_reports is used, which
is the plural of iba_report.
High-performance computing clusters using InfiniBand hardware
163
15 * * * * /sbin/iba_reports –o errors –F “nodepat:SilverStorm*” –c
/etc/sysconfig/iba/iba_mon.conf.low > [output directory]/errors.`/bin/date +”%Y%m%d_%H%M”`
Note: A more sophisticated method is to call a script that calculates the amount of time that has passed.
Since the most recent error counter clears and calls that script without the requirement to reference
specific instances of iba_mon.conf. For an example script, see “Example health check scripts” on page 275.
The cron entry would look like: 0 2,6,10,14,18,22 * * * [script name]
If you want to use different query intervals, be sure to create thresholds files based on Table 77 on page
161. Then, call the appropriate file at the correct time based on the time since the most recent error
counter clear.
Output files for health check:
Learn about the output files for the Fast Fabric Health Check.
The Fast Fabric Health Check output files are documented in the Fast Fabric Toolset Users Guide. The
following information provides some of the key aspects of the output files. For more information about
configuration, see “Installing the fabric management server” on page 105.
v The location of the output files is configurable in the /etc/sysconfig/fastfabric.conf file.
v The default location of output files is /var/opt/iba/analysis/[baseline | latest | <savedata>. The
$FF_ANALYSIS_DIR variable defines the output directory with the default of /var/opt/iba/analysis.
Problems reported in the baseline directory must be fixed first and then a new baseline must be taken
as instructed in “Re-establishing Health Check baseline” on page 244.
The full results of the health check, including the most recent configuration files are found in the
latest directory.
The <savedate> directories are only generated when an error is found during a health check other than
a baseline health check. Only the files that indicate problems are saved in this directory. All other files
can be assumed to match the corresponding files in the baseline directory.
v The Filename = [type of health check].[fast fabric command].[suffix]
– fabric = basically Subnet Manager queries about fabric status
– chassis = switch chassis firmware queries
– hostsm = queries about Subnet Manager configuration
– esm = queries about embedded Subnet Manager configuration
v The “fast fabric commands” used by health check are detailed in the Fast Fabric Toolset Users Guide
v The suffixes for the output files are shown in the following examples.
– .errors = errors exist in fabric;
Note: Link down errors are only reported by the switch side of an IBM GX+ HCA to switch link.
– .changes = change from baseline.
v
v
v
v
v
– .diff = change from baseline; see “Interpreting health check .diff files” on page 172.
– .stderr = error in operation of health check; call your next level of support.
Query all the output files before taking a new baseline health check to ensure that the saved
configuration information is correct.
The all_analysis utility is a wrapper for fabric_analysis, chassis_analysis, hostsm_analysis and
esm_analysis.
Configure hostsm_analysis or esm_analysis to run.
The analysis routines use iba_report to gather information.
Key output files to check for problems
– fabric*.links
164
Power Systems: High performance clustering
– fabric*.errors - Record the location of the problem and see “Diagnosing link errors” on page 210
– chassis*.errors - Record the location of the problem and see “Table of symptoms” on page 187.
– *.diff – indicates that there is a difference from the baseline to the latest health check run. See
“Interpreting health check .diff files” on page 172.
While the following information is intended to be comprehensive in describing how to interpret the
health check results, for the latest information about health check see the Fast Fabric Users Guide.
When any of the health check tools are run, the overall success or failure is indicated in the output of the
tool and its exit status. The tool indicates which areas had problems and which files must be reviewed.
The results from the latest run can be found in $FF_ANALYSIS_DIR/latest/. Many files can be found in
this directory which indicate both the latest configuration of the fabric and errors or differences found
during the health check. Should the health check fail, the following paragraphs decide an order for
reviewing these files.
If the -s option (save history) was used when running the health check, a directory would be crated with
the date and time of the failing run as the name. The directory would be created under FF_ANALYSIS_DIR,
in which case, that directory can be consulted instead of the latest directory shown in the following
examples.
First review the results for any esm (if using embedded subnet managers) or hostsm (if using host-based
subnet managers) health check failures. If the SM is misconfigured, or not running, it can cause other
health checks to fail. In which case the SM problems must be corrected first then the health check must
be rerun and other problems must then be reviewed and corrected as needed.
For a hostsm analysis, the files must be reviewed in the following order.
latest/hostsm.smstatus - ensure that this file indicates the SM is running. If no SMs are running on
the fabric, that problem must be corrected before proceeding further. After being corrected, the health
checks must be rerun to look for further errors.
latest/hostsm.smver.[changes|diff] - This file indicates the SM version has changed. If this was not
an expected change, the SM must be corrected before proceeding further. After being corrected, rerun
the health checks to look for further errors. If the change was expected and permanent, rerun a
baseline when all other health check errors have been corrected.
latest/hostsm.smconfig.diff - This file indicates that the SM configuration has changed. Review the
file and, as necessary compare thelatest/hostsm.smconfig file with baseline/hostsm.smconfig. As
necessary, correct the SM configuration. After being corrected, rerun the health checks to look for
further errors. If the change was expected and permanent, a rerun a baseline when all other health
check errors have been corrected.
For an esm analysis, the FF_ESM_CMDS configuration setting selects which ESM commands are used for
the analysis. When using the default setting for this parameter, the review the files in the following order.
latest/esm.smstatus - ensure that this file indicates the SM is running. If no SMs are running on the
fabric, correct the problem before proceeding further. After being corrected, rerun the health checks to
look for further errors.
latest/esm.smShowSMParms.[changes|diff] - This file indicates that the SM configuration has
changed. Review the file and, as necessary compare the latest/esm.smShowSMParms file with
baseline/esm.smShowSMParms. As necessary, correct the SM configuration. After being corrected, rerun
the health checks to look for further errors. If the change was expected and permanent, rerun a
baseline when all other health check errors have been corrected.
latest/esm.smShowDefBcGroup.[changes|diff] - This file indicates that the SM broadcast group for
IPoIB configuration has changed. Review the file and, as necessary, compare the latest/
esm.smShowDefBcGroup file with baseline/esm.smShowDefBcGroup. As necessary, correct the SM
configuration. After being corrected, rerun the health checks to look for further errors. If the change
was expected and permanent, rerun a baseline when all other health check errors have been corrected.
High-performance computing clusters using InfiniBand hardware
165
latest/esm.*.diff - If the FF_ESM_CMDS file has been modified, review the changes in results for those
additional commands. As necessary, correct the SM. After being corrected, rerun the health checks to
look for further errors. If the change was expected and permanent, rerun a baseline when all other
health check errors have been corrected.
Next, review the results of the fabric analysis for each configured fabric. If nodes or links are missing,
the fabric analysis detects them. Missing links or nodes can cause other health checks to fail. If such
failures are expected (for example a node or switch is offline), further review of result files can be
performed. However, the user must be aware that the loss of the node or link can cause other analysis to
also fail. The following information presents the analysis order for fabric.0.0, if other or additional fabrics
are configured for analysis, review the files in the order shown in the following section for each fabric.
There is no specific order for which fabric to review first.
latest/fabric.0.0.errors.stderr - If this file is not empty, it can indicate problems with iba_report
(such as the inability to access an SM). Which can result in unexpected problems or inaccuracies in the
related errors file. If possible, first correct the problems reported in this file. After being corrected,
rerun the health checks to look for further errors.
latest/fabric.0:0.errors - If any links with excessive error rates or incorrect link speeds are
reported then correct them. If there are links with errors, be aware that the same links might also be
detected in other reports such as the links and comps files as given in following section.
latest/fabric.0.0.snapshot.stderr - If this file is not empty, it can indicate problems with
iba_report (such as inability to access an SM). Which can result in unexpected problems or
inaccuracies in the related links and comps files. If possible, first correct the problems reported in this
file. After being corrected, rerun the health checks to look for further errors.
latest/fabric.0:0.links.stderr - If this file is not empty, it can indicate problems with iba_report,
which can result in unexpected problems or inaccuracies in the related links file. If possible, first
correct the problems reported in this file. After being corrected, rerun the health checks to look for
further errors.
latest/fabric.0:0.links.[changes|diff] - This file indicates that the links between components in
the fabric have changed, have been removed or added, or that components in the fabric have
disappeared. Review the file and, as necessary, compare the latest/fabric.0:0.links file with
baseline/fabric.0:0.links. If components have disappeared, review of the latest/
fabric.0:0.links.[changes|diff] file might be easier for such components. As necessary, correct
missing nodes and links. After being corrected, rerun the health checks to look for further errors. If
the change was expected and is permanent, rerun a baseline when all other health check errors have
been corrected.
latest/fabric.0:0.comps.stderr - If this file is not empty, it can indicate problems with iba_report
which can result in unexpected problems or inaccuracies in the related comps file. If possible, first
correct the problems reported in this file. After being corrected, rerun the health checks to look for
further errors.
latest/fabric.0:0.comps.[changes|diff] - This indicates that the components in the fabric or their
SMA configuration has changed. Review the file and, as necessary, compare the latest/
fabric.0:0.comps file with baseline/fabric.0:0.comps. As necessary correct missing nodes, ports
which are down and port misconfigurations. After being corrected, rerrun the health checks to look
for further errors. If the change was expected and permanent, rerun a baseline when all other health
check errors have been corrected.
Finally, review the results of the chassis_analysis file. If chassis configuration has changed, the
chassis_analysis chassis_analysis, the FF_CHASSIS_CMDS, and FF_CHASSIS_HEALTH configuration setting
selects which chassis commands are used for the analysis. When using the default setting for this
parameter, review the files in the following order.
latest/chassis.hwCheck - ensure that this file indicates all chassis are operating properly with the
required power and cooling redundancy. If there are problems, correct them, but other analysis files
can be analyzed first. When any problems are corrected, rerun the health checks to verify the
correction.
166
Power Systems: High performance clustering
latest/chassis.fwVersion.[changes|diff] - This file indicates the chassis firmware version has
changed. If this was not an expected change, correct the chassis firmware before proceeding further.
After being corrected, rerun the health checks to look for further errors. If the change was expected
and permanent, rerun a baseline when all other health check errors have been corrected.
latest/chassis.*.diff - These files reflect other changes to chassis configuration based on checks
selected through the FF_CHASSIS_CMDS command. Review the changes in results for these remaining
commands. As necessary correct the chassis. After being corrected, rerun the health checks to look for
further errors. If the change was expected and permanent, rerun a baseline when all other health
check errors have been corrected.
If any health checks fail, after correcting the related issues, run another health check to verify that the
issues were all corrected. If the failures are due to expected and permanent changes, when all other errors
have been corrected, rerun a baseline (all_analysis –b).
Interpreting health check .changes files:
Files with the extension .changes summarize what has changed in a configuration based on the queries
done by the health check.
If you are experienced in interpreting the output of the diff command, you might prefer to interpret
changes as they are found in files with a .diff extension. For more information, see Interpreting
“Interpreting health check .diff files” on page 172.
The format of *.changes is like:
[What is being verified]
[Indication that something in not correct]
[Items that are not correct and what is incorrect about them]
[How many items were checked]
[Total number of incorrect items]
[Summary of how many items had particular issues]
An example of fabric.*:*.links.changes follows. This demonstrates only links that were “Unexpected”.
This means that the link was not found in the previous baseline. The issue “Unexpected Link” is listed
after the link is presented.
Links Topology Verification
Links Found with incorrect configuration:
Rate MTU NodeGUID
Port Type Name
60g 4096 0x00025500105baa00
1 CA IBM G2 Logical HCA
<->
0x00025500105baa02
2 SW IBM G2 Logical Switch 1
Unexpected Link
20g 4096 0x00025500105baa02
<->
0x00066a0007000dbb
Unexpected Link
1 SW IBM G2 Logical Switch 1
4 SW SilverStorm 9080 c938f4ql01 Leaf 2, Chip A
60g 4096 0x00025500106cd200
<->
0x00025500106cd202
Unexpected Link
1 CA IBM G2 Logical HCA
2 SW IBM G2 Logical Switch 1
20g 4096 0x00025500106cd202
<->
0x00066a0007000dbb
Unexpected Link
1 SW IBM G2 Logical Switch 1
5 SW SilverStorm 9080 c938f4ql01 Leaf 2, Chip A
60g 4096 0x00025500107a7200
<->
0x00025500107a7202
Unexpected Link
1 CA IBM G2 Logical HCA
2 SW IBM G2 Logical Switch 1
20g 4096 0x00025500107a7202
<->
0x00066a0007000dbb
Unexpected Link
1 SW IBM G2 Logical Switch 1
3 SW SilverStorm 9080 c938f4ql01 Leaf 2, Chip A
High-performance computing clusters using InfiniBand hardware
167
165 of 165 Fabric Links Checked
Links Expected but Missing, Duplicate in input or Incorrect:
159 of 159 Input Links Checked
Total of 6 Incorrect Links found
0 Missing, 6 Unexpected, 0 Misconnected, 0 Duplicate, 0 Different
-------------------------------------------------------------------------------
The following table summarizes possible issues found in .changes files:
Table 78. Possible issues found in health check .changes files
Issue
Description and possible actions
Different
This indicates that an item still exists in the current
health check, but it is different from the baseline
configuration.
If the configuration has changed purposely since the
most recent baseline, and this difference is reflected here,
save the original baseline and rerun the baseline as
instructed in “Re-establishing Health Check baseline” on
page 244.
If this difference was not intended, you must rectify the
difference to prevent future health checks from reporting
the same difference from the baseline.
Look for any “Missing” or “Unexpected” items that
might correspond to this item. This would be in cases
where the configuration of an item has changed in a way
that makes it difficult to determine precisely how it has
changed.
Individual items which are Different would be reported
as “mismatched” or “Inconsistent” and are added into
the Different summary count. See “X mismatch: expected
* found: *”, or “Node Attributes Inconsistent”, or “Port
Attributes Inconsistent”, or “SM Attributes Inconsistent”.
Duplicate
This indicates that an item has a duplicate in the fabric.
This situation must be resolved such that there is only
one instance of any particular item being discovered in
the fabric.
Duplicates might be indicated if there are changes in the
fabric such as addition of parallel links. It can also be
reported when there enough changes to the fabric that it
is difficult to properly resolve and report all the changes.
It can also occur when iba_report is run with manually
generated topology input files which might have
duplicate items or incomplete specifications.
168
Power Systems: High performance clustering
Table 78. Possible issues found in health check .changes files (continued)
Issue
Description and possible actions
Incorrect Link
This applies only to links and indicates that a link is not
connected properly. This must be fixed.
It is possible to find miswires by examining all of the
Misconnected links in the fabric. However, you must
look at all of the fabric.*:*.links.changes files to find
miswires between subnets.
Look for any “Missing” or “Different” items that might
correspond to this item. This would be in cases where
the configuration of an item has changed in a way that
makes it difficult to determine precisely how it has
changed.
If the configuration has changed purposely since the
most recent baseline, and this difference is reflected here,
save the original baseline and rerun the baseline as
instructed in “Re-establishing Health Check baseline” on
page 244.
This is a specific case of “Misconnected”. See the
“Misconnected” issue.
Misconnected
This applies only to links and indicates that a link is not
connected properly. This must be fixed. Individual Links
which are Misconnected are reported as “Incorrect Link”
and are tabulated into the Misconnected summary count.
It is possible to find miswires by examining all of the
Misconnected links in the fabric. However, you must
look at all of the fabric.*:*.links.changes files to find
miswires between subnets.
Look for any “Missing” or “Different” items that might
correspond to this item. This would be in cases where
the configuration of an item has changed in a way that
makes it difficult to determine precisely how it has
changed.
Individual links which are Misconnected are reported as
“Incorrect Link” (see “Incorrect Link”) and are added
into the Misconnected summary count.
High-performance computing clusters using InfiniBand hardware
169
Table 78. Possible issues found in health check .changes files (continued)
Issue
Description and possible actions
Missing
This indicates an item that is in the baseline is not in this
instance of health check output. This might indicate a
broken item or a configuration change that has removed
the item from the configuration.
If you have deleted this item to the configuration, save
the original baseline and rerun the baseline as instructed
in “Re-establishing Health Check baseline” on page 244.
For example, if you have removed an HCA connection,
the HCA and the link to it would be shown as Missing
in fabric.*:*.links.changes and fabric.*:*.comps.changes
files.
If the item is still to be part of the configuration, check
for faulty connections or unintended changes to
configuration files on the fabric management server.
Look for any “Unexpected” or “Different” items that
might correspond to this item. This would be in cases
where the configuration of an item has changed in a way
that makes it difficult to determine precisely how it has
changed.
Node Attributes Inconsistent
This indicates that the attributes of a node in the fabric
have changed, such as NodeGuid, Node Description,
Device Type, and others. The inconsistency would be
caused by connecting a different type of device or a
different instance of the same device type. This would
also occur after replacing a faulty device.
If the configuration has changed purposely since the
most recent baseline, and this difference is reflected here,
save the original baseline and rerun the baseline as
instructed in “Re-establishing Health Check baseline” on
page 244. If a faulty device was replaced, this would be a
reason to re-establish the baseline.
If this difference was not intended, you must rectify the
difference to prevent future health checks from reporting
the same difference from the baseline.
This is a specific case of “Different”. See the “Different”
issue.
170
Power Systems: High performance clustering
Table 78. Possible issues found in health check .changes files (continued)
Issue
Description and possible actions
Port Attributes Inconsistent
This indicates that the attributes of a port on one side of
a link have changed, such as PortGuid, Port Number,
Device Type, and others. The inconsistency would be
caused by connecting a different type of device or a
different instance of the same device type. This would
also occur after replacing a a faulty device.
If the configuration has changed purposely since the
most recent baseline, and this difference is reflected here,
save the original baseline and rerun the baseline as
instructed in “Re-establishing Health Check baseline” on
page 244. If a faulty device was replaced, this would be a
reason to re-establish the baseline.
If this difference was not intended, you must rectify the
difference to prevent future health checks from reporting
the same difference from the baseline.
This is a specific case of “Different”. See the “Different”
issue.
SM Attributes Inconsistent
This indicates that the attributes of the node or port
running an SM in the fabric have changed, such as
NodeGuid, Node Description, Port Number, Device
Type, ans others. The inconsistency would be caused by
moving a cable, changing from host-based subnet
management to embedded subnet management (or vice
versa), or by replacing the HCA in the fabric
management server.
If the configuration has changed purposely since the
most recent baseline, and this difference is reflected here,
save the original baseline and rerun the baseline as
instructed in “Re-establishing Health Check baseline” on
page 244. If the HCA in the fabric management server
was replaced, this would be a reason to re-establish the
baseline.
If this difference was not intended, you must rectify the
difference to prevent future health checks from reporting
the same difference from the baseline.
This is a specific case of “Different”. See the “Different”
issue.
High-performance computing clusters using InfiniBand hardware
171
Table 78. Possible issues found in health check .changes files (continued)
Issue
Description and possible actions
X mismatch: expected * found: *
This indicates an aspect of an item has changed as
compared to the baseline configuration. The aspect which
changed and the expected and found values would be
shown. This typically indicates configuration differences
such as MTU, Speed, or Node description. It can also
indicate that GUIDs have changed, such as when
replacing a faulty device.
If the configuration has changed purposely since the
most recent baseline, and this difference is reflected here,
save the original baseline and rerun the baseline as
instructed in “Re-establishing Health Check baseline” on
page 244. If a faulty device was replaced, this would be a
reason to re-establish the baseline.
If this difference was not intended, you must rectify the
difference to prevent future health checks from reporting
the same difference from the baseline. This is a specific
case of “Different”. See the “Different” issue.
Unexpected
This indicates that an item is in this instance of health
check output, but it not in the baseline. This might
indicate that an item was broken when the baseline was
taken or a configuration change has added the item to
the configuration
If you have added this item to the configuration, save
the original baseline and rerun the baseline as instructed
in “Re-establishing Health Check baseline” on page 244.
For example, if you have added an HCA connection, it
would be shown as Unexpected in fabric.*:*.links.changes
and fabric.*:*.comps.changes files.
Look for any “Missing” or “Different” items that might
correspond to this item. This would be in cases where
the configuration of an item has changed in a way that
makes it difficult to determine precisely how it has
changed.
Interpreting health check .diff files:
This information is used to interpret the difference between the baseline health check and the current
health check.
If the results files of a Fast Fabric Health Check include any file named *.diff, then there is a difference
between the baseline and the current health check. This file is generated by the health check comparison
algorithm by using the diff command with the first file (file1) being the baseline file and the second file
(file2) being the latest file.
The default diff format that is used is with the context of one line before and after the altered data. This
is the same as a diff –C 1. This can be changed by entering your preferred diff command and options by
using the variable FF_DIFF_CMD in the fastfabric.conf file. For more details, see the Fast Fabric Toolset Users
Guide. The information that follows assumes that the default context is being used.
Entries similar to the following example are repeated throughout the *.diff file. These lines indicate how
the baseline (file1) differs from the latest (file2) health check.
172
Power Systems: High performance clustering
*** [line 1], [line 2] ****
lines from the baseline file
--- [line 1], [line 2] ---lines from the latest file
The first set of lines enclosed in asterisks (*) indicates which line numbers contain the lines from the
baseline file that have been altered. The associated line numbers and data from the latest file follow.
Use the man diff command to get more details on diff file.
Several example scenarios follow.
An example of what might be seen when swapping two ports on the same host channel adapter (HCA):
***************
*** 25,29 ****
10g 0x00025500000da080
1
- <-> 0x00066a0007000ced
8
Chip A
- 10g 0x00025500000da081
1
<-> 0x00066a00d90003d6 14
30g 0x00025500000da100
1
--- 25,29 ---10g 0x00025500000da080
1
<-> 0x00066a00d90003d6 14
+ 10g 0x00025500000da081
1
+ <-> 0x00066a0007000ced
8
Chip A 30g 0x00025500000da100
SW IBM logical switch 1
SW SilverStorm 9120 GUID=0x00066a00020001d9 Leaf 1,
SW IBM logical switch 2
SW SilverStorm 9024 DDR GUID=0x00066a00d90003d6
CA IBM logical HCA 0
SW
SW
SW
SW
IBM logical switch 1
SilverStorm 9024 DDR GUID=0x00066a00d90003d6
IBM logical switch 2
SilverStorm 9120 GUID=0x00066a00020001d9 Leaf 1,
1 CA IBM logical HCA 0
You can see in the swap in the previous example, by charting out the differences in the following table.
HCA Port
Connected to switch port in baseline Connected to switch port in latest
0x00025500000da080
1 SW
IBM logical switch 1
0x00066a0007000ced
8 SW
SilverStorm 9120
GUID=0x00066a00020001d9 Leaf 1,
0x00066a00d90003d6 14 SW
SilverStorm 9024 DDR
GUID=0x00066a00d90003d6
0x00025500000da081
1 SW IBM logical switch 2
0x00066a00d90003d6 14 SW
SilverStorm 9024 DDR
GUID=0x00066a00d90003d6
0x00066a0007000ced
8 SW
SilverStorm 9120
GUID=0x00066a00020001d9
Leaf 1,
An example of what might be seen when swapping two ports on the same switch:
***************
*** 17,19 ****
10g 0x00025500000d8b80
! <-> 0x00066a00d90003d6
10g 0x00025500000d8b81
--- 17,19 ---10g 0x00025500000d8b80
! <-> 0x00066a00d90003d6
10g 0x00025500000d8b81
***************
*** 25,27 ****
10g 0x00025500000da080
! <-> 0x00066a00d90003d6
10g 0x00025500000da081
--- 25,27 ---10g 0x00025500000da080
! <-> 0x00066a00d90003d6
10g 0x00025500000da081
1 SW IBM logical switch 1
15 SW SilverStorm 9024 DDR GUID=0x00066a00d90003d6
1 SW IBM logical switch 2
1 SW IBM logical switch 1
14 SW SilverStorm 9024 DDR GUID=0x00066a00d90003d6
1 SW IBM logical switch 2
1 SW IBM logical switch 1
14 SW SilverStorm 9024 DDR GUID=0x00066a00d90003d6
1 SW IBM logical switch 2
1 SW IBM logical switch 1
15 SW SilverStorm 9024 DDR GUID=0x00066a00d90003d6
1 SW IBM logical switch 2
High-performance computing clusters using InfiniBand hardware
173
You can see in the swap in the previous example, by charting out the differences in the following table.
The logical switch 2 lines happen to be extraneous information for this example, because their
connections are not shown by diff; this is a result of using –C 1.
Switch Port
Connected to HCA port in baseline
Connected to HCA port in latest
0x00066a00d90003d6 15 SW
SilverStorm 9024 DDR
0x00025500000d8b80
logical switch 1
1 SW IBM
0x00025500000da080
1 SW
IBM logical switch 1
0x00066a00d90003d6 14 SW
SilverStorm 9024 DDR
0x00025500000d8b80
logical switch 1
1 SW IBM
0x00025500000da080
1 SW
IBM logical switch 1
Querying status
You can query fabric status in several ways.
The following methods can be used to query the status of the fabric.
v Check logs on the xCAT/MS as described in “Monitoring fabric logs from the xCAT Cluster
Management server” on page 156.
v Perform a Fast Fabric Toolset Health Check as described in “Health checking” on page 157.
v Use the Fast Fabric Toolset iba_report command. See the Fast Fabric Toolset Users Guide for details on
iba_report command. Many of the typical checks that you would do with iba_report command are
done in the Health Check. However, you can do many more targeted queries by using the iba_report
command. For more information, see “Hints on using iba_report” on page 180. In IFS level 4.3 and
above, iba_reports is available; it issues iba_report on all fabric links on the fabric management server
v Use the Fast Fabric Toolset iba_saquery command to complement the iba_report command. For more
information about the saquery command, see the Fast Fabric Toolset Users Guide.
v Use the Chassis Viewer to query one switch at a time. For more information, see the Switch Users
Guide.
v Use Fabric Viewer to obtain a graphical user interface (GUI) representation of the fabric. For more
information, see the Fabric Viewer Users Guide.
v Fast Fabric Toolset fabric_info outputs a summary of the number of components in each subnet to
which a fabric management server is attached.
These methods do not exhaust the possible methods for querying status. Further information is available
in the Switch Users Guide, the Fabric Manager and Fabric Viewer Users Guide and the Fast Fabric Toolset
Users Guide.
Remotely accessing QLogic management tools and commands from
xCAT/MS
Remote execution of QLogic management tools from xCAT can be an important addition to the
management infrastructure. It effectively integrates the QLogic management environment with the IBM
management environment.
By using remote command execution you can do manual queries from the xCAT/MS console without
logging in the fabric management server. It also helps for writing management and monitoring scripts
that run from the xCAT/MS, which can improve productivity for administration of the cluster fabric. You
can write scripts to act on nodes based on fabric activity, or act on the fabric based on node activity.
For information about how to remotely access the fabric management server from xCAT, see “Remotely
accessing the Fabric Management Server from xCAT/MS” on page 175.
For information about how to remotely access QLogic switches from xCAT, see “Remotely accessing
QLogic switches from the xCAT/MS” on page 175.
174
Power Systems: High performance clustering
Remotely accessing the Fabric Management Server from xCAT/MS
To access any command that does not require user interaction by issuing the following dsh from the
xCAT/MS.
When you have set up remote command execution from the xCAT/MS to fabric management server as
described in “Set up remote command processing” on page 120, you can access any command that does
not require user interaction by issuing the following dsh from the xCAT/MS.
xdsh [fabric management server IP|group name] [command list]
Any other typical xdsh command string can be used.
Note: In the planning and installation phases, one or more groups were created to be able to address
multiple fabric management servers simultaneously.
Remotely accessing QLogic switches from the xCAT/MS
Remotely accessing switch commands from xCAT can be an important addition to the management
infrastructure. It effectively integrates the QLogic management environment with the IBM management
environment.
By using the remote command execution you can run manual queries from the xCAT console without
logging in the switch. You can also write management and monitoring scripts that run from the
xCAT/MS, which can improve productivity for the administration of the cluster fabric. You can write
scripts to act on nodes based on switch activity, or act on switches based on node activity.
A list of xCAT remote command capabilities that support QLogic switches:
v xdsh execution is supported for QLogic switch
v
v
v
v
updatehwdev is supported for QLogic switch to transfer ssh keys from MS to QLogic switch
xdshbak command is supported for QLogic switch
xdsh ‘-z' flag is supported for QLogic switch (Display the exit status of the last remotely run)
node group is supported for QLogic switch
The switches use a proprietary Command Line Interface (CLI). For xCAT to work with the switch CLI,
certain profiles must be set up and there is also a new dsh command parameter that must be used to
reference the switch command profile. For more details, see “Set up remote command processing” on
page 120. The following items highlight the important aspects in this setup.
v The command definition file /var/opt/xCAT/IBSwitch/QLogic/config must be created with the
following attributes.
– ssh key exchange command for CLI: ssh-setup-command=sshKey add
– So that the xdsh does not try to set environment: pre-command=NULL
– Last command for the return code: post-command=showLastRetcode -brief
v The switches can be set up as devices with the following commands.
– nodetype=switch
v Define at least one device group for all switches by using hwdefgrp command with the following
attributes.
– Example Group name = IBSwitches
v Make sure that keys are exchanged by using updatehwdev command.
After you have setup remote command execution from the xCAT/MS to switches as described in “Set up
remote command processing” on page 120, you can access any command to the switch that does not
require user interaction by issuing the following dsh command from the xCAT/MS:
xdsh [switch IP addresses|group name] –l admin -devicetype--devicetype IBSwitch::Qlogic [switch command]
High-performance computing clusters using InfiniBand hardware
175
If you want to access switch commands that require user responses, the standard technique is to write an
Expect script to interface with the switch Command Line Interface (CLI). Either xdsh on the xCAT/MS or
cmdall on the fabric management server support interactive switch CLI access.
You might want to remotely access switches to gather data or issue commands. You cannot work with
interactive commands through remote command execution.
You might choose to use some of the Fast Fabric Toolset command scripts that perform operations that
otherwise require user interaction on the switch CLI. In that case, you can still do remote command
execution from xCAT, however, you must issue the command to the Fast Fabric Toolset on the fabric
management server. For more information, see “Remotely accessing QLogic management tools and
commands from xCAT/MS” on page 174.
Updating code
Updating code mainly references component documentation describing code updates for key code that
affects the fabric.
The following table provides references and describes impacts for key code updates. In some cases, errors
might be logged because links come down as a result of a unit being rebooted or powered on again.
Table 79. Updating Code: References and Impacts
Code
Reference
Impact
xCAT
xCAT documentation
v xCAT event management is
interrupted.
v Reboot interrupts remote logging.
IBM GX/GX+ host channel adapter
(HCA) device driver
Code Release notes and operating
system manuals
v Fabric is affected.
IBM system firmware
System Service information
v Concurrent updates have no
impact.
v Reboot causes links to go down
and errors to be logged.
v Non-concurrent updates cause
links to go down and errors to be
logged.
IBM power firmware
System Service information
v Concurrent updates have no
impact.
v Non-concurrent updates might
cause links to go down and errors
to be logged.
Fabric Manager (including SM)
Fabric Manager Users Guide
Switch Chassis Management
Switch Users Guide
v No impact to the fabric.
Fast Fabric Toolset Users Guide
v If a hardware error occurs during
this time, it is not reported unless
the error still exists when the new
code comes up.
v Subnet recovery capabilities are
lost during the update. If a
Fast Fabric Toolset Users Guide
hardware error occurs at this time,
application performance might
See “Updating Fabric Manager code.”
suffer.
See “Updating switch chassis code”
on page 179.
Updating Fabric Manager code
This information provides guidance for updating Fabric Manager code.
176
Power Systems: High performance clustering
The fabric manager code updates are documented in the Fabric Manager Users Guide, but the following
items must be considered.
The following information is about the fabric management server, which includes the host-based fabric
manager and Fast Fabric Toolset.
v The main document for fabric management server code updates is QLogic OFED+ Users Guide.
v To determine the software package level on the fabric management server, use iba_config. The
software level is displayed at the top of the first screen.
v For the host-based Subnet Managers and Fast Fabric Toolset, the QLogic documentation references
concepts like “head nodes” and “other nodes”. This is because the QLogic documentation assumes the
use of the QLogic provided stack on all nodes in a cluster. IBM System p clusters do not use the
QLogic stack on any server other than the fabric management server. The fabric management server
can be considered the equivalent to the “head node” running only the OFED IB stack, QLogic IB tools,
QLogic Fast Fabric, and QLogic FM.
v If you are updating from IFS 4 to IFS 5, there is a change in the FM configuration file. The old file,
/etc/sysconfig/iview_fm.config, is a flat file with an attribute entry for each instance of the
individual components of the FM. The new file, /etc/sysconfig/qlogic_fm.xml, is an XML file that
contains sections for attributes that are common across the various components and instances of
components of FM, and sections for each instance. Review the QLogic Fabric Manager Users Guide
section on Fabric Manager Configuration. If you are familiar with IFS 4, you would want to review the
Mapping Old Parameters section of the QLogic Fabric Manager Users Guide to understand how the old
configuration file attributes map to the new ones.
v If you are updating from IFS 4 to IFS 5: OFED drivers would be updated from 1.3 to 1.4.0.2.4. The
installation performs this update.
v Additional details regarding these comments can be found in the Qlogic IFS5 "QLogic InfiniBand
Fabric Suite Software Release Notes, Rev. A"
v Also, before upgrading to a new level, always review the release notes provided with the code.
v Before upgrading to a new level, be sure to save the following file to ensure that if configuration data
is lost for any reason, you have a backup, and in case you find it necessary to downgrade the firmware
level.
/etc/sysconfig/iba/iba_mon.conf*
/etc/sysconfig/fastfabric.conf
/etc/sysconfig/iview_fm.config # for IFS 4
/etc/sysconfig/qlogic_fm.xml # for IFS 5 and beyond
/etc/sysconfig/iba_stat.conf
/etc/sysconfig/iba/ports
/etc/sysconfig/iba/chassis
/etc/sysconfig/iba/hosts
/var/opt/iba/analysis/baseline/*
/etc/syslog-ng/syslog-ng.conf # syslog config file
/etc/apparmor.d/sbin.syslog-ng # Apparmor configuration
Also, save off the crontab configuration: /usr/bin/crontab –l [file]
v The order of fabric manager server code update must be as follows:
– Save configuration files
– If necessary, update the fabric management server operating system level
–
–
–
–
Untar the IFS tarball: tar -zxvf QLogicIB-IFS.4.3.x.x.x.tgz #example
Read the Release Notes for any knyesown problems and new feature descriptions.
Move into the “QLogicIB-IFS.4.3.x.x.x” directory and run “./INSTALL”
Select Option 1 to Install/Uninstall Software
Note: The installation wrapper would uninstall the appropriate software, as necessary.
Note: The installation script automatically verifies the checksum that is shipped with the files.
High-performance computing clusters using InfiniBand hardware
177
– Choose only the following options to install or upgrade:
- OFED IB stack
- QLogic IB tools
- QLogic Fast Fabric
- Qlogic FM
Note: : All of the above plus others are set to install by default. Clear all other selections on this
screen AND on the next screen before selecting “P” to install the options. The following screen is
an example, when updating from IFS 4.2.x to 4.3.x. Nothing on screen 2 must be selected.
Please Select Install Action (screen 1 of 2):
0) OFED IB Stack
[
Install
][Available]
1) QLogic IB Tools
[
Upgrade
][Available]
2) OFED IB Development [Don’t Install][Available]
3) QLogic Fast Fabric [
Upgrade
][Available]
4) QLogic SRP
[Don’t Install][Available]
5) QLogic Virtual NIC [Don’t Install][Available]
6) OFED IP over IB
[Don’t Install][Available]
7) OFED SDP
[Don’t Install][Available]
8) OFED uDAPL
[Don’t Install][Available]
9) MVAPICH for gcc
[Don’t Install][Available]
a) MVAPICH2 for gcc
[Don’t Install][Available]
b) OpenMPI for gcc
[Don’t Install][Available]
c) MPI Source
[Don’t Install][Available]
d) QLogic FM
[
Upgrade
][Available]
1.3.1.0.4
4.3.2.0.1
1.3.1.0.4
4.3.2.0.1
1.3.1.0.3
1.3.1.0.3
1.3.1.0.4
1.3.1.0.4
1.3.1.0.4
1.3.1.0.4
1.3.1.0.4
1.3.1.0.4
1.3.1.0.4
4.3.2.0.4
– When updating from IFS 4.2.x to 4.3.x, in order to get the new versions of the updated configuration
files, answer “n” (no) to the following questions during the upgrade or install. Select the defaults for
all other questions. If updating from one 4.3.x level to another, select the defaults for all questions.
Do
Do
Do
Do
Do
you
you
you
you
you
want
want
want
want
want
to
to
to
to
to
keep
keep
keep
keep
keep
/etc/iview_fm.config? -> n
/etc/sysconfig/iba/iba_mon.conf? -> n
/etc/sysconfig/fastfabric.conf? -> n
/etc/sysconfig/iba/ports? -> n
/etc/sysconfig/iba/iba_stat.conf? -> n
– Compare the saved files with the new files for changes; the diff command is the standard method
to compare files. If no updates are present in the QLogic files, copy the saved file back to the
original filename. Otherwise, make the updates from the old copies to the new files.
/etc/sysconfig/qlogic_fm.xml # for IFS 5 and beyond
/etc/sysconfig/iba/iba_mon.conf*
/etc/sysconfig/fastfabric.conf
/etc/sysconfig/iba/ports
/etc/sysconfig/iba/iba_stat.conf
/etc/sysconfig/iba/chasis
/etc/sysconfig/iba/hosts
/var/opt/iba/analysis/baseline/*
/etc/syslog-ng/syslog-ng.conf #syslog config
/etc/apparmor.d/sbin.syslog-ng # must have "/var/log/xcat/syslog.fabric.notices wr,"
If /etc/apparmor.d/sbin.syslog-ng does not match, you must restart AppArmor or reboot the FM
server after reinstating the original. AppArmor must be restarted before syslog-ng.
/etc/init.d/boot.apparmor restart
If syslog-ng.conf does not match the original, you must restart syslog-ng or reboot the FM server
after reinstating the original.
/etc/init.d/syslog restart
– Also, check crontab to make sure that it matches the original. If not load the backup [file] by
using:/usr/bin/crontab [file]
– You must exchange ssh keys again with the switches and xCAT, because of updates to the operating
system. Therefore, test out remote command capability from xCAT, use xdsh “[fmserver IP
address]” date.
– When updating from IFS 4 to IFS 5, convert the configuration file from:
178
Power Systems: High performance clustering
/etc/sysconfig/iview_fm.config to /etc/sysconfig/qlogic_fm.xml:
fms> /opt/iba/fm_tools/config_convert /etc/sysconfig/iview_fm.config \
/usr/local/iview/etc/qlogic_fm_src.xml > my_fm_config.xml
fms > cp qlogic_fm.xml qlogic_fm.xml.save
fms > cp my_fm_config.xml qlogic_fm.xml
– Restart the Fabric Manager Server
– Check the status of the FM:
fms > /etc/init.d/qlogic_fm status
Checking QLogic Fabric Manager
Checking SM 0: fm0_sm: Running
Checking PM 0: fm0_pm: Running
Checking BM 0: fm0_bm: Running
Checking FE 0: fm0_fe: Running
Checking SM 1: fm1_sm: Running
Checking PM 1: fm1_pm: Running
Checking BM 1: fm1_bm: Running
Checking FE 1: fm1_fe: Running
Checking SM 2: fm2_sm: Disabled
Checking PM 2: fm2_pm: Disabled
Checking BM 2: fm2_bm: Disabled
Checking FE 2: fm2_fe: Disabled
Checking SM 3: fm3_sm: Disabled
Checking PM 3: fm3_pm: Disabled
Checking BM 3: fm3_bm: Disabled
Checking FE 3: fm3_fe: Disabled
v For the host-based fabric manager, use the instructions for updating the code found in the Fabric
Manager Users Guide and QLogic OFED+ Users Guide.
– Save the iview_fm.config file to a safe location so that if something goes wrong during the installation
process, you can recover this key file.
– Use remote command execution from xCAT/Ms as in the following example, where c171opsm3 is
the fabric management server address. The cd that precedes the installation command is required so
that the command is run from its path. The actual path depends on the code level.
xCAT/MS:
/root/infiniserv_software/InfiniServMgmt.4.1.1.0.15; ./INSTALL’
The following information is about clusters that use only the embedded subnet managers. This is not a
qualified solution for IBM System p HPC Clusters.
v For embedded Subnet Managers, the Fast Fabric Toolset can update code across all switches
simultaneously by using the /sbin/iba_chassis_admin command. For more information, see the Fast
Fabric Toolset Users Guide. If you must update only the code on one switch, you can do this using the
Chassis Viewer. For more information, see the Switch Users Manual.
– You must place the new embedded Subnet Manager code on the fabric management server.
– If you have multiple primary fabric management servers, you can issue the iba_chassis_admin
command from using xdsh to all of the primary fabric management servers simultaneously. This
capability must be set up using “Set up remote command processing” on page 120.
Updating switch chassis code
This information provides guidance for updating switch chassis code.
The switch chassis management code is embedded firmware that runs in the switch chassis. The fabric
manager code updates are documented in the Fabric Manager Users Guide, but the following items must
be considered.
v For the switch chassis management code, the Fast Fabric Toolset can update the code across all
switches simultaneously by using the iba_chassis_admin command or the Fast Fabric TUI (iba_config).
For more information, see the Fast Fabric Toolset Users Guide.
/sbin/iba_chassis_admin -F /etc/sysconfig/iba/chassis -P
’your-directory-where-firmware-pkg-is’ -a run upgrade
High-performance computing clusters using InfiniBand hardware
179
v If you must update only the code on one switch, you can do this using the Chassis Viewer; see the
Switch Users Manual. You must FTP the package to the server on which you are opening the browser to
connect to the Chassis Viewer. The Chassis Viewer would then allow you to move the file from the
server to the switch, and enable its use.
v You must place the switch chassis management code on the Fabric Management Server.
v If you have multiple primary Fabric Management Servers that have different switches listed in their
/etc/sysconfig/iba/chassis files, you can issue the iba_chassis_admin command from xCAT/MS by
using xdsh to all of the primary Fabric Management Servers simultaneously. This capability must be
set up by using “Set up remote command processing” on page 120.
v The installation tool in Fast Fabric automatically verifies the checksum that is shipped with the
firmware file.
Finding and interpreting configuration changes
This information can be used to find and interpret configuration changes by using the Fast Fabric Health
Check tool.
Configuration changes are best found by using the Fast Fabric Health Check tool. For more information,
see “Health checking” on page 157.
Note: If you have multiple primary fabric management servers, you must run the health check on each
primary server, because Fast Fabric can access only subnets to which its server is attached. You might
consider to use the xCAT/MS to remotely run this function to all primary Fabric Management Servers.
For more information, see “Remotely accessing QLogic management tools and commands from
xCAT/MS” on page 174.
At the end of the installation process, a baseline health check must have been taken to allow a
comparison of the current configuration with a known good configuration. Comparison results would
reveal the configuration changes. One key task before establishing a baseline is to ensure that it is
representative of the cluster. This is best done by using the fabric_info command. For more information,
see “Re-establishing Health Check baseline” on page 244.
After performing a current health check (all_analysis), you will go to the analysis directory
(/var/opt/iba/analysis/latest) and look for files ending in .changes. Using the Fast Fabric Toolset Users
Guide, you can determine what information is contained within each file. This helps you to determine
what has changed. A high-level explanation of the *.changes file format is found in “Interpreting health
check .changes files” on page 167. If you are experienced in interpreting the output of the diff command,
you might prefer to interpret changes as they are found in files with a .diff extension; see “Interpreting
health check .diff files” on page 172.
If nothing is changed, then you must change back to the original configuration.
If the configuration changes that were found are legitimate, then take a new baseline by using the
procedure in “Re-establishing Health Check baseline” on page 244.
Hints on using iba_report
The iba_report function helps you to monitor the cluster fabric resources.
While under most monitoring circumstances, you can rely on health checks as described in “Health
checking” on page 157, you might want to do some advanced monitoring by using the iba_report
function on the fabric management server.
Some suggested parameters are in the following table. You can use these parameters of iba_report to get
detailed information. Some examples of a uses of iba_report follow the table. This information is not
meant to provide exhaustive coverage of iba_report. Instead, it provides a few examples intended to
180
Power Systems: High performance clustering
illustrate how iba_report might be used for detailed monitoring of cluster fabric resources. Much more
detail is available in the QLogic Fast Fabric Users Guide.
Table 80. Suggested iba_report parameters
Parameter
Description
-d 10
This parameter provides extra detail that you would not
see at the default detail level of 2.
You might find it useful to experiment with the detail
level when developing a query. Often –d 5 is the most
detail that you can extract from a given command.
-s
This parameter includes statistics counters in the report.
In order to ensure good performance of iba_report,
anytime the “-s” parameter is used, you must use the –F
“nodepat:[switch name pattern]” parameter to avoid
querying non-existent counters in the Logical HCAs.
-i [seconds]
This parameter causes a query to statistics counters after
waiting the number of seconds specified in the
parameter. Often this is used along with the –C to clear
the counters. This implies the –s parameter
-F [focus info]
You can focus iba_report on a single resource or group
of resources that match the filter described in the focus
info.
See the Fast Fabric Users Guide for details on the many
different filters that you can use, like:
v portguid
v nodeguid
v nodepat = for patterns to search for
-h [hca] and –p [port]
Used in conjunction these points the tool to do the query
on a specific subnet connected to the indicated hca and
the port on the fabric management server. The default is
the first port on the first host channel adapter (HCA).
-o slowlinks
Look for links that are slower than expected
-o errors
Looks for links exceeding the allowed error threshold.
See the Fast Fabric Users Guide for details on error
thresholds.
Note: The LinkDown counter in the IBM GX/GX+
HCAs would be reset as soon as the link goes down.
This is part of the recovery procedure. While this is not
optimal, the connected switch ports LinkDown counter
provides an accurate count of the number of LinkDowns
for the link.
In order to ensure good performance of iba_report,
anytime the “-o errors” parameter is used, you must use
the –F “nodepat:[switch name pattern]” parameter to
avoid querying non-existent counters in the Logical
HCAs.
-o misconnlinks
Summary of links connected with mismatched speed
-o links
Summary of links, including to what they are connected
High-performance computing clusters using InfiniBand hardware
181
Table 80. Suggested iba_report parameters (continued)
Parameter
Description
-C
Clears error and statistics counters. You might use it with
–o none so that no counters are returned. Or, you might
use –o errors to get error counters before clearing them,
which is the preferred method.
In order to ensure good performance of iba_report,
anytime the “-C” parameter is used, you must use the –F
“nodepat:[switch name pattern]” parameter to avoid
querying non-existent counters in the Logical HCAs.
-o links –F “mtu:2048”
Use the –F to focus on links that are running at a
particular MTU value. The example to the left shows a
2K MTU.
Note: The iba_report is run on a subnet basis. If you want to gather data from all subnets attached to a
fabric management server, a typical technique is to use nested for loops to address the subnets through
the appropriate HCAs and ports to reach all subnets. For example:
for h in 1 2; do for p in 1 2; do iba_report –o errors –F
“nodepat:SilverStorm*”; done; done
Examples:
All of the following examples query over the first port of the first HCA in the fabric management server.
You must use –p and –h to direct the commands over a particular HCA port to reach the correct subnet.
iba_report -o comps -d 10 -i 10 -F portguid:0x0002550070011a00
The previous command gets the comps report 10 seconds after clearing the counters for the portguid:
0x002550070011a00. The –d parameter set to 10 gives enough detail to include the port traffic counter
statistics. You might use this to watch the traffic out of a particular HCA. In this case, the portguid is an
IBM GX++ HCA. See “General mapping of IBM HCA GUIDs to physical HCAs” on page 197 for
commands that can help you determine HCA GUIDs. In this case, the GUID of concern is associated with
a specific port of the HCA. While the HCA tracks most of the prescribed counters, it does not have
counters for Transmit Packets or Receive Packets.
iba_report -o route -D nodeguid:<destination NodeGUID> -S nodeguid:<source NodeGUID>
The previous command queries the state of the routes from node on the fabric to another (node is used in
the sense of a node on the fabrc, not in the sense of a logical partition or a server). You can find the node
GUIDs by using the procedure in “General mapping of IBM HCA GUIDs to physical HCAs” on page
197. Instead of doing as instructed and grepping for only the first 7 bytes of a node GUID, consider
recording all 8 bytes. You can use the iba_stat –n command for HCAs in AIX logical partitions and the
ibv_devinfo –v for HCAs in Linux logical partitions.
If you have a particular logical partition for which you want to determine routes, you can use a
portGUID instead:
iba_report -o route -D portguid:<destination portGUID> -S nodeguid:<port NodeGUID>
iba_report -d 5 -s -o nodes –F 'nodepat:IBM*Switch*’
The previous query gets node information with enough details to also get the port counters. The focus is
on any IBM logical switch, which is the basis for the IBM GX HCAs. This matchs any generation of IBM
GX HCA that happens to be in the cluster.
Note: While the HCA tracks most of the prescribed counters, it does not have counters for Transmit
Packets or Receive Packets.
182
Power Systems: High performance clustering
iba_report –C –o none –F “nodepat:SilverStorm*”
The previous query returns nothing, but it clears all of the port statistics on all switch chassis whose IB
NodeDescription begins with the default “SilverStorm”.
Cluster service
Cluster service requires an understanding of how problems are reported, who is responsible for
addressing service issues, and the procedures used to fix the problems.
Additional information about servicing your cluster environment can be found in the “Cluster
information resources” on page 2.
Cluster service overview
Servicing the cluster includes understanding the following items.
“Service responsibilities”
“Fault reporting mechanisms”
“Table of symptoms” on page 187 has several tables of symptom organized by fault reporting mechanism.
“Service procedures” on page 191 has a lookup table of service procedures.
Service responsibilities
Servicing the cluster requires the coordinated efforts of IBM service representatives, customers, and the
switch vendor.
The responsibilities for servicing cluster are dependent upon the parts being serviced. The following
information shows the general responsibilities for servicing the cluster.
v IBM service representatives are responsible for servicing IBM parts that are not customer replaceable
units (CRUs).
v The customer is responsible for servicing IBM CRUs.
v The customer or the vendor is responsible for servicing vendor switches and cables, unless otherwise
contracted.
Fault reporting mechanisms
Problems with the cluster can be identified through several mechanisms that are part of the management
subsystem.
Faults (problems) can be surfaced through the fault reporting mechanisms found in the following table.
For more details on the management subsystem that supports these reporting mechanisms see
“Management subsystem function overview” on page 13.
Additional information is available in: For xCAT/MS - “Vendor log flow to xCAT event management” on
page 23, and “Monitoring fabric logs from the xCAT Cluster Management server” on page 156.
Table 81. Fault reporting mechanisms
Reporting Mechanism
Description
Fast Fabric health check results
Used to monitor fabric port error counters, switch
hardware problems, and configuration changes. These
are located on the fabric management server in:
/var/opt/iba/analysis
High-performance computing clusters using InfiniBand hardware
183
Table 81. Fault reporting mechanisms (continued)
Reporting Mechanism
Description
xCAT Event Management Fabric Log
Used to monitor and consolidate Fabric Manager and
switch error logs.
This is located on the xCAT/MS in:
/tmp/systemEvents
or xCAT eventlog
This log is part of the standard event management
function. It is accessed by using the lsevent command. It
is a summary point for RSCT and xCAT event
management. For xCAT, it can help point to saved log
entries.
Hardware light emitting diodes (LEDs)
The switches and host channel adapters (HCAs) have
LEDs.
Service Focal Point
This is the standard reporting mechanism for IBM Power
Systems servers that are managed by HMCs.
Chassis Viewer LED
This is a graphical user interface (GUI) that runs on the
switch and is accessible from a web browser. It provides
virtual LEDs that represent the switch hardware LEDs.
Fast Fabric Toolset
There are 2 ways the Fast Fabric Toolset reports fabric
problems. The first is from a report output. The other is
in a health check output.
Customer reported problem
This is any problem that the customer reports without
using any of the reporting mechanisms.
Fabric Viewer
This is a GUI that provides a view into current fabric
status.
The following logs usually must not be accessed when remote logging and xCAT Event Management are enabled.
However, sometimes they might be required to be captured for debug purposes.
Fabric Notices log on xCAT/MS
This is an intermediate log where Notice or higher
severity log entries from switches and Subnet Managers
are received through syslogd on the xCAT/MS.
This is located on the xCAT/MS in the file.
/var/log/xcat/syslog.fabric.notices
For xCAT, this is a pipe on a Linux MS, and thus cannot
be viewed normally. Reading from the pipe causes event
management to lose events.
Info log on xCAT/MS
This is an optional intermediate log where INFO or
higher severity log entries from switches and Subnet
Managers are received through syslogd on the
xCAT/MS.
This is located on the xCAT/MS in the file.
/var/log/xcat/syslog.fabric.info
Switch log
This includes any errors reported by the chassis manager
(internal switch chassis issues such as power and
cooling, or logic errors, for example)
This is accessed through the switch command-line
interface (CLI) or Fast Fabric tools.
184
Power Systems: High performance clustering
Table 81. Fault reporting mechanisms (continued)
Reporting Mechanism
Description
/var/log/messages on fabric management server
This is the syslog on the fabric management server
where host-based Subnet Manager logs are located. This
is the log for the entire fabric management server,
therefore, there might be entries in it from components
other than Subnet Manager.
Fault diagnosis approach
Diagnosing problems can be accomplished in multiple ways.
There are several methods that can be used for fault diagnosis on your cluster environment. The
following fault diagnosis methods are intended to supplement the information in the “Table of
symptoms” on page 187.
To understand the approaches for fault diagnosis, read the following information in the order indicated.
1. “Types of events” illustrates the most common events that affect the fabric and how these events
might be reported and interpreted.
2. “Isolating link problems” on page 186 describes how to address a link problem.
3. “Restarting or repowering on scenarios” on page 187 provides information about the impact of
reboots and power-on scenarios on the fabric.
4. “The importance of NTP” on page 187 provides information about the importance of configuring
NTP on the service and cluster virtual local area networks (VLANs).
Types of events
Problems with the cluster fabric can be categorized in numerous ways.
Fabric problems can be categorized as follows:
v Link problems that are reported by Subnet manager through Remote logging to the xCAT/MS in
/tmp/systemEvents file by the Subnet Manager. Without remote logging, you must interrogate the
Subnet Manager log directly.
– If a single link is failing, this method isolates the problem to a switch port, the other side (host
channel adapter (HCA) or another switch port) and a cable.
– If multiple links are failing, a pattern might be discernible which directs you to a common field
replaceable unit (FRU), such as an HCA, a switch leaf board, or a switch spine.
v Internal failure of a switch spine or leaf board manifests as either multiple link failures, or loss of
communication between the device and the management module. Internal failures are reported
through remote logging to the xCAT/MS in /tmp/systemEvents. Without remote logging, you must
interrogate the switch log.
v Redundant switch FRU failures are reported through the syslog and into the event management
subsystem. The syslog indicates the failing FRU. For switches, this includes power supplies, fans, and
management modules. Redundant switch FRU failures are reported through remote logging to the
xCAT/MS in /tmp/systemEvents. Without remote logging, you must interrogate the switch log.
v User induced link failure events are caused by a person pulling a cable for a repair, or powering off a
switch or server, or restarting a server. Any link event must first be correlated to any user actions that
might be the root cause. The user induced event might not be reported anywhere. If a cable is pulled,
it is not reported. If a server is restarted or powered off, the server logs would record this event. The
link failure caused by the user is reported through remote logging to the xCAT/MS in
/tmp/systemEvents. Without remote logging, you must interrogate the Subnet Manager log log.
v HCA hardware failures would be reported to SFP on the managing HMC and forwarded to xCAT SFP
Monitoring. Any link event must first be correlated to any existing HCA failures that might be the root
High-performance computing clusters using InfiniBand hardware
185
v
v
v
v
v
cause. The link event caused by the user is reported through remote logging to the xCAT/MS in
/tmp/systemEvents. Without remote logging, you must have interrogated the Subnet Manager log.
Server hardware failures would be reported to SFP on the managing HMC and forwarded to xCAT
SFP Monitoring. Any link event must first be correlated to any existing server failures that might be
the root cause.
Operating system error events would be reported through errpt in AIX and /var/log/messages in
Linux. Problems with the fabric would reference either an HCA device (iba0 through iba3) or a fabric
interface (in AIX: ib0 through ib7; in Linux: ehca0 through ehca7). When isolating these issues to root
cause, start by looking for link problems or fabric device problems reported as any one of the
previously mentioned events.
Performance issues are typically reported by users. Unless one of the previously mentioned failure
scenarios is identified as the root cause, a method for checking the health of the fabric is required to
either identify an unreported problem, or to positively verify that the fabric is in good health.
Although performance problems can be complex and require remote support, some initial diagnosis
can be performed by using the procedure in “Diagnosing performance problems” on page 224.
Application crashes are typically reported by users. There are many causes for application crashes that
are outside the scope of this information. However, some initial diagnosis can be performed by using
the procedure in “Diagnosing application crashes” on page 226.
Configuration changes are typically reported by Fast Fabric Health Check. Configuration changes can
be caused by many things; some are benign and some indicate a real problem. For more details, see
“Diagnosing configuration changes” on page 213. Examples of configuration changes are:
– Inadvertently moving a cable or swapping components around
– Replacing a part with one that has a different serial number
– Leaving a device powered-off
– Link failure causing a device to be unreachable
– Firmware level change
Isolating link problems
Use this information to isolate InfiniBand fabric problems.
When you are isolating InfiniBand fabric problems, you want to check log entries that are a few minutes
before and after the event you are diagnosing. This is to see if these events are associated and which of
the entries might be the root cause.
The general InfiniBand isolation flow follows. For a detailed procedure, see “Diagnosing link errors” on
page 210.
1. Within a few minutes before or after an event, see how many other events are reported.
2. If there are multiple link errors, first check for a common source. This can be complex if
non-associated errors are reported at about the same time. For example, if a host channel adapter
(HCA) fails, and a switch link fails that is not connected to the HCA, you must be careful to not
associate the two events.
a. Map all link errors so that you can determine which switch devices and which HCAs are
involved. You must map HCA GUIDs to physical HCAs and the servers in which they are
populated so that you can check the Hardware Management Console (HMC) for serviceable events
for adapter errors that might have caused link errors. For mapping of HCAs, see “General
mapping of IBM HCA GUIDs to physical HCAs” on page 197.
b. Look for a switch internal error in the /var/log/xcat/errorlog/[xcat/MS hostname] file. This file
contains possible serviceable events from all of the Fabric Manager and switch logs in the cluster.
c. Look for an internal error on an HCA in SFP. This might bring a link down.
d. Look for a server checkstop SFP. This might bring a link down.
e. Map all internal errors to associated links by completing the following steps.
186
Power Systems: High performance clustering
1) If there is a switch internal error, determine the association based on whether the error is
isolated to a particular port, leaf board, or the spine.
2) If there is an adapter error or server checkstop, determine the switch links to which they are
associated.
f. If there are no HCA or server events reported in SFP, and you know that there was nothing
restarted that would have caused the event, and the link errors span more than one HCA, then the
problem is likely to be in the switch.
g. If neighboring links on the same HCA are failing, it can be the HCA that is faulty. Links on IBM
HCAs are in pairs. If the HCA card has four links, then T1 and T2 are a pair and T3 and T4 are a
pair.
3. If there are link problems, isolation must be done by using cable swapping techniques to see how
errors follow cables. This might affect another link that is good. If you swap cables, you can see errors
reported against the links on which you are operating.
4. After making repairs, complete the procedure in “Verifying link FRU replacements” on page 244.
Related concepts
“Hardware Management Console” on page 18
You can use the Hardware Management Console (HMC) to manage a group of servers.
Restarting or repowering on scenarios
Restarting or repowering scenarios pose a potential problem in masking a real failure.
If you restart many servers, they would probably ignore all link errors around the time of the restart. Any
unassociated link failures must occur again before the problem is recognized. To avoid this problem, use
the procedure in “Restarting the cluster” on page 246 or in “Restarting or powering off an IBM system”
on page 247.
The importance of NTP
Fabric diagnosis is dependent on network time protocol (NTP) service for all devices in the cluster.
The NTP provides correct correlation of events based on time. Without NTP, timestamps can vary
significantly and cause difficulty in associating events.
Table of symptoms
Use the symptom tables to diagnose problems reported against the fabric.
The following tables of symptoms are used to diagnose problems reported against the fabric. There is a
separate table for each reporting mechanism, in which the symptom is cross-referenced to an isolation
procedure.
The following first table is a list of the various tables of symptoms, which are organized by where the
problem is being reported. Before each following table there is a brief description of the table.
Table 82. Descriptions of Tables of Symptoms
Table
Description
Table 83 on page 188
Problems being reported through remotely logged switch and
fabric manager logs
Table 84 on page 189
Problems indicated by switch hardware LEDs.
Table 85 on page 189
Symptoms being reported by the Fast Fabric Toolset, including
those reported by periodic health checks and user run
commands.
Table 86 on page 191
Events being reported by Service Focal Point on the HMC.
High-performance computing clusters using InfiniBand hardware
187
Table 82. Descriptions of Tables of Symptoms (continued)
Table
Description
Table 87 on page 191
All other events, including those reported by the operating
system and users
The following table is used for events reported in the xCAT/MS Fabric Event Management Log
(/tmp/systemEvents on the xCAT/MS). The xCAT auditlog might point to that file. Furthermore, it is a
reflection of switch logs and Subnet Manager logs, so, this table can be used for switch logs and Subnet
Manager logs also.
For details on how to interpret the logs, see “Interpreting switch vendor log formats” on page 207.
Before performing procedures in any of these tables, familiarize yourself with the information provided
in “Cluster service” on page 183), which provides general information about diagnosing problems and
the service subsystem.
Table 83. xCAT/MS Fabric Event Management log symptoms
Symptom
Procedure or Reference
Switch Chassis Management Logs
(Has CHASSIS: string in entry)
Switch chassis log entry
See the Switch Users Manual and contact QLogic
Subnet Manager Logs
(Have SM: string in the entry)
Link down
See “Diagnosing link errors” on page 210.
Link Integrity or Symbol errors on host channel adapter
(HCA) or switch ports
See “Diagnosing link errors” on page 210.
Switch disappears
See the Switch Users Guide and contact switch service
provider
Switch port disappears
See “Diagnosing link errors” on page 210.
Logical switch disappears
See “Diagnosing link errors” on page 210.
Logical HCA disappears
See “Diagnosing link errors” on page 210.
Fabric Initialization errors on a HCA or switch port
See “Diagnosing link errors” on page 210.
Fabric Initialization errors on a switch
See Switch Users Manual and contact switch service
provider.
Then use “Diagnosing and repairing switch component
problems” on page 213.
Security errors on switch or HCA ports
Contact your next level of support
If anything is done to change the hardware or software
configuration for the fabric, use “Re-establishing Health
Check baseline” on page 244.
Events where the Subnet Manager (SM) is the node
responsible for the problem
First check for problems on the switch or the server on
which the Subnet Manager is running. If there are no
problems there, contact QLogic.
If anything is done to change the hardware or software
configuration for the fabric, use “Re-establishing Health
Check baseline” on page 244.
188
Power Systems: High performance clustering
Table 83. xCAT/MS Fabric Event Management log symptoms (continued)
Symptom
Procedure or Reference
Other exceptions on switch or HCA ports
Contact your next level of support.
If anything is done to change the hardware or software
configuration for the fabric, use “Re-establishing Health
Check baseline” on page 244.
The following table is used for any symptoms observed by using hardware light emitting diodes (LEDs)
on HCAs and switches. These include switch LEDs that are virtualized in the Chassis Viewer.
Table 84. Hardware or Chassis Viewer LEDs symptoms
Symptom
Procedure or Reference
LED is not lit on switch port.
See “Diagnosing link errors” on page 210.
LED is not lit on HCA port.
See “Diagnosing link errors” on page 210.
Red LED that is not on a switch port or HCA.
See the Switch Users Guide and the QLogic Troubleshooting
Guide.
Then use “Diagnosing and repairing switch component
problems” on page 213.
Other switch LED conditions on non-port LEDs
See the Switch Users Guide and the QLogic Troubleshooting
Guide.
Then use “Diagnosing and repairing switch component
problems” on page 213.
Other HCA LED conditions
See the IBM systems service information.
Then use “Diagnosing and repairing IBM system
problems” on page 213.
The following is a table of symptoms of problems reported by Fast Fabric tools. Health check files are
found by default on the fabric management server in the /var/opt/iba/analysis/
[baseline|latest|<savedate>]. Refer to theFast Fabric Toolset Users Guide for details.
Problems reported in the baseline directory must be fixed first and then a new baseline must be taken as
instructed in “Re-establishing Health Check baseline” on page 244.
The full results of the health check, including the most recent configuration files are found in the latest
directory.
The <savedate> directories are only generated when an error is found during a health check other than a
baseline health check. Only the files that indicate problems are saved in this directory. All other files can
be assumed to match the corresponding files in the baseline directory.
Table 85. Fast Fabric Tools symptoms
Symptom
Procedure or Reference
Health check file: fabric*link..errors
Record the location of the errors and see “Diagnosing
link errors” on page 210.
High-performance computing clusters using InfiniBand hardware
189
Table 85. Fast Fabric Tools symptoms (continued)
Symptom
Procedure or Reference
Health check file: fabric*comps.errors
1. Record the location of the errors.
2. See the Fast Fabric Toolset Users Guide for details
3. If this refers to a port, see “Diagnosing link errors” on
page 210, otherwise, see “Diagnosing and repairing
switch component problems” on page 213.
Health check file: chassis*.errors
1. Record the location of the errors.
2. See the Fast Fabric Toolset Users Guide for details.
3. If a switch component is repaired see “Diagnosing
and repairing switch component problems” on page
213.
Health check file: fabric.*.links.diff
Speed or width change indicated
Health check file:
Record the location of the change and see “Diagnosing
link errors” on page 210.
1. Record the location of the changes
fabric.*.diff
2. See the Fast Fabric Toolset Users Guide for details.
chassis*.diff
3. If the change is expected, perform “Re-establishing
Health Check baseline” on page 244.
esm*.diff
4. If the change is not expected, perform “Diagnosing
configuration changes” on page 213.
hostsm*.diff file
and indicates configuration change
Health check:
1. Record the location of the changes
chassis*.diff
2. See the Fast Fabric Toolset Users Guide for details.
esm*.diff
3. If the change is expected, perform “Re-establishing
Health Check baseline” on page 244.
hostsm*.diff file
4. If the change is not expected, perform “Updating
code” on page 176.
and indicates firmware change
Health check *.stderr file
This is a problem with health checking.
Check the link to the subnet.
Check the cluster virtual local area network (VLAN) for
problems.
Use “Capture data for Fabric Manager and Fast Fabric
problems” on page 196.
Contact your next level of support for QLogic software
problems.
Error reported on a link from health check or iba_report
See “Diagnosing link errors” on page 210.
The following table is used for symptoms found in Service Focal Point.
190
Power Systems: High performance clustering
Table 86. SFP table of symptoms
Symptom
Procedure Reference
Any eventID or reference code
Use the IBM system service information.
Then use “Diagnosing and repairing IBM system
problems” on page 213.
The following table is used for any symptoms reported outside of the previously mentioned reporting
mechanisms.
Table 87. Other symptoms
Symptom
Procedure or Reference
Fabric event reported by the operating system
“Diagnosing events reported by the operating system”
on page 223
Performance problem reported
“Diagnosing performance problems” on page 224
Application crashes – relative to the fabric
“Diagnosing application crashes” on page 226
Management Subsystem problems (including unreported
errors)
“Diagnosing management subsystem problems” on page
226
HCA preventing a logical partition from activating
“Recovering from an HCA preventing a logical partition
from activating” on page 235
Ping problems
“Diagnosing and recovering ping problems” on page 225
Not running at the required 4K maximum transfer unit
(MTU)
“Recovering to 4K maximum transfer units in the AIX”
on page 238
Bad return codes or software failure indicators for Fabric
Manager or Fast Fabric Software
Check the link to the switch.
Use “Capture data for Fabric Manager and Fast Fabric
problems” on page 196.
Contact your next level of support for QLogic software
problems.
Service procedures
Service tasks can be completed by using the procedures referenced in this information.
The following table lists the common service procedures. Use this table if you have a particular type of
service task in mind. These service procedures reference service procedures and information in other
documents, however, if there are any considerations that are unique to clusters, they are highlighted in
these procedures.
The table is broken into several sections:
v Special procedures
v Monitoring procedures
v Diagnosis procedures
v Repair procedures
v Verify procedures
If you are trying to diagnose a symptom, begin with the “Table of symptoms” on page 187 before
proceeding with this table.
High-performance computing clusters using InfiniBand hardware
191
Table 88. Service Procedures
Task
Procedure
Special procedures
Restarting the cluster
“Restarting the cluster” on page 246
Restarting or powering off an IBM system.
“Restarting or powering off an IBM system” on page 247
Getting debug data from switches and Subnet Managers
“Capturing data for fabric diagnosis” on page 193
Using the script command while collecting switch
information
“Using script command to capture switch CLI output” on
page 196
Mapping fabric devices to physical locations
“Mapping fabric devices” on page 197
Counting the number of fabric devices
“Counting devices” on page 248
Preparing for smoother handling of emergency power off “Handling emergency power off situations” on page 251
(EPO) situations
Setting up Cluster xCAT Event Management for the
fabric again.
“Reconfiguring xCAT event management” on page 232
Monitoring procedures
Best practice for monitoring the fabric
“Monitoring fabric logs from the xCAT Cluster
Management server” on page 156
General monitoring for problems
“Monitoring the fabric for problems” on page 156
Diagnosis procedures
How faults are reported
“Fault reporting mechanisms” on page 183
Diagnosing symptoms
“Table of symptoms” on page 187
Capturing data for fabric diagnosis
“Capturing data for fabric diagnosis” on page 193
Capturing data for Fabric Manager or Fast Fabric
software problem
“Capture data for Fabric Manager and Fast Fabric
problems” on page 196
Mapping devices from reports to physical devices
“Mapping fabric devices” on page 197
Interpreting the switch vendor log formats.
“Interpreting switch vendor log formats” on page 207
Diagnosing link errors
“Diagnosing link errors” on page 210
Diagnosing switch internal problems
“Diagnosing and repairing switch component problems”
on page 213
Diagnosing IBM system problems
“Diagnosing and repairing IBM system problems” on
page 213
Diagnosing configuration changes from health check
“Diagnosing configuration changes” on page 213
Diagnosing fabric events reported by the operating
system
“Diagnosing events reported by the operating system” on
page 223
Diagnosing performance problems
“Diagnosing performance problems” on page 224
Diagnosis application crashes
“Diagnosing application crashes” on page 226
Look for swapped host channel adapter (HCA) ports
“Diagnosing swapped HCA ports” on page 221
Look for swapped ports on switches
“Diagnosing swapped switch ports” on page 222
Diagnosing management subsystem problems
“Diagnosing management subsystem problems” on page
226
Ping problems
“Diagnosing and recovering ping problems” on page 225
Repair Procedures
Recovering from an HCA preventing a logical partition
from activating
192
Power Systems: High performance clustering
“Recovering from an HCA preventing a logical partition
from activating” on page 235
Table 88. Service Procedures (continued)
Task
Procedure
Repairing IBM systems
“Diagnosing and repairing IBM system problems” on
page 213
Ping problems
“Diagnosing and recovering ping problems” on page 225
Recovering ibX interfaces
“Recovering ibX interfaces” on page 235
Not running at the required 4KB MTU
“Recovering to 4K maximum transfer units in the AIX”
on page 238
Reestablishing a health check baseline
“Re-establishing Health Check baseline” on page 244
Verify Procedures
Verifying link field replaceable unit (FRU) replacements
“Verifying link FRU replacements” on page 244
Verifying other repairs
“Verifying repairs and configuration changes” on page
245
Verifying configuration changes
“Verifying repairs and configuration changes” on page
245
Capturing data for fabric diagnosis
Use this procedure to collect data that the support team might require to diagnose fabric problems.
The information that you collect can result in a large amount of data. If you want to collect a more
targeted set of data, see the various unit and application users guides and service guides for information
about how to do that.
This procedure captures data from:
1. Vendor fabric management applications and vendor switches
2. IBM systems information to reflect the state of the HCAs
A key application for capturing data for most fabric diagnosis activities is the Fast Fabric Toolset, see the
Fast Fabric Toolset Users Guide.
The Fast Fabric captureall would be used to gather:
1. Subnet Manager data
2. Switch chassis data
Pay close attention to how the command-line parameters change from which devices data is collected.
Because all of the Fabric Management Servers and switches are connected to the same service VLAN, it is
possible to collect all the pertinent data from a single fabric management server. Which can be designated
while planning the fabric management servers, see “Planning for fabric management server” on page 64
and “QLogic fabric management worksheets” on page 92.
The previously mentioned references would explain and record the configuration files required to access
the Fabric Management Servers and switches that have the required data. In particular, you must
understand the role of hosts and chassis files that list various groupings of fabric management servers
and switches.
If you are performing data collection while logged on to the management server, perform the following
procedure:
High-performance computing clusters using InfiniBand hardware
193
1. You must first have passwordless ssh set up between the fabric management server and all of the
other fabric management servers and also between the fabric management server and the switches.
Otherwise, a password prompt would appear and xdsh would not work.
2. Log on to the xCAT/MS
3. Get data from the fabric management servers by using: captureall –f <hosts file with fabric
management servers>
From xCAT/MS:xdsh –d <Primary fabric management server> “captureall –f <hosts file with
fabric management servers>”
Note: The captureall can generate many megabytes of data from fabric management servers.
Sometimes, you do not require data from all of the fabric management servers, because you are
concerned with only the subnets managed by a particular fabric management server, or the syslog
from a particular fabric management server. In this case, you can use the -h “list of fabric
management servers” parameter instead of the -f parameter to direct the capture to just that particular
fabric management server. If you also want data from a particular switch, you can use –C –H “list of
switches”. Using –C without the –H collects data from all switches listed in the /etc/sysconfig/iba/
chassis file.
v If you do not require information from all of the fabric management servers, various hosts files
must have been configured, which can help you target subsets of fabric management servers. These
files are typically named /etc/sysconfig/iba/host*.
v By default, the results would go into ./uploads directory, which is below the current working
directory. For a remote execution this would be the root directory for the user, which is most often
root. This can be something like /uploads, or /home/root/uploads, it depends on the user setup on the
fabric management server. This directory will be references as <captureall_dir>. You can also include
a file name and path to store the output file.
v For more information about captureall, see Fast Fabric Toolset documentation.
4. If you have not used captureall with the –C parameter, get data from the switches by using:
captureall –F <chassis file with switches listed>
dsh –d <Primary fabric management server>
captureall –f <chassis file with switches>
v If you do not require information from all of the switches, various chassis files must have been
configured, which can help you target subsets of switches. In order to direct data capture from
particular switches by using command-line parameters instead of a chassis file, you can use –C –H
“list of switches”.
v By default, the results would be copied to the ./uploads directory, which is below the current
working directory. For a remote command this would be the root directory for the user, which is
most often root. This can be something like /uploads, or /home/root/uploads, it depends on the user
setup on the fabric management server. This directory would be referenced as <captureall_dir>.
5. Copy data from the primary data collection Fabric Management Server to the xCAT/MS:
a. Make a directory on the xCAT/MS to store the data. This would be used for IBM systems data.
For the remainder of this procedure, the directory would be referenced as <captureDir_onxCAT>.
b. Run the following command:
For xCAT:
xdcp [fabric management server] <captureall_dir> <captureDir_onCAT>
6. Copy health check results from the Primary Fabric Management Server to the xCAT/MS. Copy over
the baseline health check and the latest. It is also advisable to copy over any recent health check
results that contain failures.
a. Make a baseline directory on the xCAT/MS: mkdir <captureDir_onxCAT>/baseline
b. Copy the baseline directory:
For xCAT:
xdcp [fabric management server] /var/opt/iba/analysis/baseline
<captureDir_onCAT>/baseline
c. Make a latest directory on the xCAT/MS: mkdir <captureDir_onxCAT>/latest
194
Power Systems: High performance clustering
d. d. Copy the latest directory from the fabric management server to the xCAT/MS
For xCAT:
xdcp [fabric management server] /var/opt/iba/analysis/latest
<captureDir_onCAT>/latest
e. e. On the xCAT/MS, make a directory for the failed health check runs: mkdir
<captureDir_onxCAT>/hc_fails
f. To get all failed directories, use xdcp (for xCAT) command. If you want to be more targeted, copy
over the directories that have the required failure data. The *-*:* would pick up the directories with
timestamp for names. If you have a date in mind you can use something like: 2010-03-19* for
March 19 2010.
For xCAT:
xdcp [fabric management server] /var/opt/iba/analysis/*-*:*
<captureDir_onCAT>/hc_fails
7. Get HCA information from the IBM systems
a. For AIX, run the following commands from the xCAT/MS by using xdsh:
1) lsdev | grep ib
2) lscfg | grep ib
3) netstat -i | egrep “ib|ml0”
4) ifconfig –a
5) ibstat -v
b. b. For Linux, run the following commands from the xCAT/MS by using xdsh:
1) lspci | grep ib
2) netstat –i | egrep “ib|ml0”
3) ibv_devinfo -v
8. tar up all of the files and directories in <captureDir_onxCAT>
This procedure ends here.
If you want to collect Subnet Manager and switch chassis data and do this on the fabric management
server, you can issue the captureall commands directly on that server:
1. Log on to the fabric management server
2. Get data from fabric management servers: captureall –f <hosts file with fabric management servers>
Note: The captureall can generate many megabytes of data from fabric management servers. If you
do not require data from all of the fabric management servers, because you are concerned with only
the subnets managed by a particular fabric management server, or the syslog from a particular fabric
management server, you can use the -h “list of fabric management servers” parameter instead of
the -f parameter to direct the capture to just that particular fabric management server. If you also
want data from a particular switch, you can use –C –H “list of switches”. Using –C without the –H
collects data from all switches listed in the /etc/sysconfig/iba/chassis file.
v Various hosts files must have been configured, which can help you target subsets of fabric
management servers. These files are typically named /etc/sysconfig/iba/host*.
v By default, the results goes into ./uploads directory, which is below the current working directory.
For a remote execution this must be the root directory for the user, which is most often root. This
can be something like /uploads, or /home/root/uploads, it depends on the user setup on the fabric
management server. This directory would be referenced as <captureall_dir>. You can also include a
file name and path to store the output file.
v For more information about captureall, see Fast Fabric Toolset documentation.
3. Get data from the switches: captureall –F <chassis file with switches listed>
Various hosts files must have been configured, which can help you target subsets of Fabric
Management Servers. In order to direct data capture from particular switches by using the
command-line parameters instead of a chassis file, you can use –C –H “list of switches”.
High-performance computing clusters using InfiniBand hardware
195
4. By default, data would be captured to files in the ./uploads directory below the current directory
when you run the command.
5. Get Health check data from:
a. Baseline health check: /var/opt/iba/analysis/baseline
b. Latest health check: /var/opt/iba/analysis/latest
c. From failed health check runs: /var/opt/iba/analysis/<timestamp>
Using script command to capture switch CLI output
You can collect data directly from a switch command-line interface (CLI).
If you are directed to collect data directly from a switch CLI, typically you would capture the output by
using the script command, which is available on both Linux and AIX. The script command captures the
standard output (stdout) from the telnet or ssh session with the switch and places it into a file.
Note: Some terminal emulation utilities would allow you to capture the terminal session into a log file.
This might be an acceptable alternative to using the script command.
To do this, perform the following steps:
1. On the host from which you will log in to the switch, run:
script /<dir>/<switchname>.capture.<timestamp>
v Choose a directory into which to store the data.
v It is good practice to have the switches name in the output file name.
v It is good practice to put a timestamp into the output file name to differentiate it from other data
collected from the same switch. If you use the following format you would be able to sort the files
easily:
<4-digit year><2-digit month><2-digit day>_<2-digit hour><2-digit minute>
2. telnet or ssh into the switches CLI by using the methods described in the Switch Users Guide.
3. Run the command to get the data that is being requested.
4. Exit from the switch.
5. Issue CTRL-D to stop the script command from collecting more data.
6. You can now forward the output file to the appropriate support team.
This procedure ends here.
Capture data for Fabric Manager and Fast Fabric problems
If there is a suspected problem with the Fabric Manager or Fast Fabric software, you can use iba_capture
to capture data for debugging purposes.
The iba_capture is documented in the Fast Fabric Users Guide.
Indications of possible software problems are:
v Bad return codes
v Commands that do not get run (hang)
v Other return data that does not
v *.stderr output file from health check
Note: Always be sure to check the switch link between the Fabric Management Server and the subnet
before concluding that you have a software problem. Not all commands check that the interface is
available.
196
Power Systems: High performance clustering
Mapping fabric devices
Describes how to map from a description or device name or other logical naming convention to a
physical location of an HCA or a switch.
Mapping of switch devices is largely done by how they are named at install/configuration time. The
switch chassis parameter for this is the InfiniBand Device name. A good practice is to create names that
are relative to the frame and cage in which it is populated so that it is easy to cross-reference Globally
Unique IDs (GUIDs) to physical locations. If this is not done correctly, it can be difficult to isolate root
causes when there are associated events being reported at the same time. For more information, see
“Planning QLogic or IBM Machine Type InfiniBand switch configuration” on page 49 and “Installing and
configuring vendor or IBM InfiniBand switches” on page 137.
Note: If it is possible to name a non- IBM GX+/GX++ HCA by using the IBNodeDescriptor, it is
advisable to do so in a manner that helps you to easily determine the server and slot in which the HCA
is populated.
Naming of IBM GX+/GX++ HCA devices by using the IBNodeDescriptor is not possible. Therefore, the
user must manually map the Globally Unique ID (GUID) for the HCA to a physical HCA. To do this you
must understand the way GUIDs are formatted in the Operating System and by vendor logs. While they
all indicate 8 bytes of GUID, they have different formats, as illustrated in the following table:
Table 89. GUID Formats
Format
Example
Where used
dotted
00.02.55.00.00.0f.13.00
AIX
hex string
0x00066A0007000BBE
QLogic logs
2 byte, colon delimited
0002:5500:000f:3500
Linux
If you must isolate both sides of link using a known device from a log or health check result, use one of
the following procedures.
Table 90. Isolating link ports based on known information
Known Information
Procedure
Logical Switch is known
“Finding devices based on a known logical switch” on
page 199
Logical HCA is known
“Finding devices based on a known logical HCA” on
page 201
Physical switch port is known
“Finding devices based on a known physical switch
port” on page 203
ibX interface is known
“Finding devices based on a known ib interface
(ibX/ehcaX)” on page 205
General mapping from HCA GUIDs to physical HCAs
“General mapping of IBM HCA GUIDs to physical
HCAs”
General mapping of IBM HCA GUIDs to physical HCAs
To map IBM HCA GUIDs to physical HCAs, you must first understand the GUID assignments based on
the design of the IBM GX+/GX++ HCA.
For information about the structure of an IBM HCA, see “IBM GX+ or GX++ host channel adapter” on
page 7.
High-performance computing clusters using InfiniBand hardware
197
With the HCA structure in mind, note that IBM HCA Node GUIDs are relative to the entire HCA These
Node GUIDs always end in "00". For example, 00.02.55.00.00.0f.13.00. The final 00 would change for each
port on the HCA.
Note: If at all possible, during installation, it is advisable to issue a query to all servers to gather the
HCA GUIDs ahead of time. If this has been done, you might then query a file for the required HCA
GUID. A method to do this is documented in “Installing the fabric management server” on page 105.
There is an HCA port for each physical port, which maps to one of the logical switch ports. There is also
an HCA port for each logical HCA assigned to an LPAR. Thus, IBM HCA Port GUIDs are broken down
as:
[7 bytes of node GUID][1 byte port id]
Examples of Port GUIDs are:
v 00.02.55.00.00.0f.13.01
v 00.02.55.00.00.0f.13.81
Because there are so many HCAs in a cluster, it is best to try and get a map of the HCA GUIDs to the
physical HCAs and store it in a file or print it out. If you do not store it, look it up each time by using
the following method.
The best way to map the HCA GUIDs to the physical HCAs is using operating system commands to
gather HCA information. You can do this using dsh to all servers simultaneously. The commands used
depend on the operating system in the LPAR.
Do the following steps for AIX LPARs:
In AIX, the following commands are used to query for port and node GUIDs from an AIX LPAR
v ibstat -n = returns overall node information
– ibstat -n | grep GUID = returns the base GUID for the HCA. You can use this to map the other
GUID information, because the last byte is the one that varies based on ports and logical HCAs. The
first 7 bytes are common across ports and logical HCAs.
v ibstat -p> = returns port information.
– ibstat -p | egrep "GUID|PORT" = returns just the port number and the GUIDs associated with that
port.
Note: It can take up to a minute for the previously mentioned commands to return.
In order to use xCAT to get all HCA GUIDs in AIX LPARs, use the following command string, which
assumes that all of your servers are running AIX. Instead of “-a”, use “–N AIXNodes ” to access just AIX
logical partitions in a mixed environment.
For xCAT:
>
xdsh [nodegroup with all servers] -v ’ibstat -n | grep GUID’
node1: Globally Unique ID (GUID):
node2: Globally Unique ID (GUID):
00.02.55.00.00.0f.13.00
00.02.55.00.00.0b.f8.00
The information mentioned in the previous paragraph would be good enough to map any HCA GUID to
a node or system. For example, the logical switch port 1 of an HCA might have a final byte of "01". So,
the node1, port 1 GUID would be: 00.02.55.00.00.0f.13.01.
If you do not have a stored map of the HCA GUIDs, but you have a GUID for which you want to search,
use the following command for AIX LPARs. Using the first 7 bytes of the GUID would allow for a match
to be made when you do not have the port GUID information available from the ibstat –n command.
198
Power Systems: High performance clustering
For xCAT:
xdsh [nodegroup with all servers] -v ’ibstat -n |
grep GUID | grep "[1st seven bytes of GUID]"’
You would have enough information to identify the physical HCA and port with which you are working.
Once you know the server in which the HCA is populated, you can issue an ibstat –p to the server and
get the information about exactly which HCA matches exactly the GUID that you have in hand.
End of AIX LPAR section
Do the following for Linux LPARs:
In Linux, the following commands are used to query port and node GUIDs from a Linux LPAR:
v ibv_devinfo -v = returns attributes of the HCAs and their ports
– ibv_devinfo -v | grep "node_guid" = would return the node GUID
– ibv_devinfo -v | egrep "GID|port:" = would return GIDs for ports. The first 8 bytes are a GID
mask, and the second are the port GUID
v ibv_devinfo -l = returns the list of HCA resources for the LPAR
v ibv_devinfo -d [HCA resource] = returns the attributes of the HCA given in [HCA resource]. The HCA
resource names are returned in ibv_devinfo -l
v ibv_devinfo -i [port number] = returns attributes for a specific port
v man ibv_devinfo = to get more details on ibv_devinfo
In order to use xCAT to get all HCA GUIDs in Linux LPARs, use the following command string, which
assumes that all of your servers are running Linux. Instead of “-a”, use “–N LinuxNodes” to access just
Linux LPARs in a mixed environment.
For xCAT:
>
xdsh [nodegroup with all servers] -v
’/usr/bin/ibv_devinfo -n | grep "node_guid"’
node1: node_guid:
node2: node_guid:
0002:5500:1002:5800
0002:5500:100b:f800
If you do not have a stored map of the HCA GUIDs, but you have a GUID for which you want to search,
use the following command for Linux LPARs. Using the first 7 bytes of the GUID would allow for a
match to be made when you do not have the port GUID information available from the ibv_devinfo –v
command.
For xCAT:
>
xdsh [nodegroup with all servers] -v
’/usr/bin/ibv_devinfo -n | grep "node_guid" | grep "[1st seven bytes of GUID]"’
You would have enough information to identify the physical HCA and port with which you are working.
Once you know the server in which the HCA is populated, you can issue an ibv_devinfo –i [port
number] to the server and get the information about exactly which HCA matches exactly the GUID that
you have in hand.
End of Linux LPAR section.
Finding devices based on a known logical switch
Use this procedure if the logical switch in an HCA is known and the attached switch and physical HCA
port must be determined.
High-performance computing clusters using InfiniBand hardware
199
This procedure applies to IBM GX HCAs. For more information about the architecture of IBM GX HCAs
and logical switches within them, see “IBM GX+ or GX++ host channel adapter” on page 7.
Note: This procedure has some steps that are specific to operating system type (AIX or Linux). This must
do with querying the HCA device from the operating system. For AIX, the adapter is called ibaX; where
X is a number 0 through 3. For Linux, the adapter is call ehcaX; where X is a number 0 through 3.
For example, a log entry like the following example is reported with the Logical switch port being
reported. Here, the Logical switch information is underlined and in bold. Note the Node type in italics; to
the InfiniBand fabric, the HCA logical switch is displayed as a switch.
Apr 15 09:25:23 c924hsm.ppd.pok.ibm.com local6:notice c924hsm
iview_sm[26012]: c924 hsm; MSG:NOTICE|SM:c924hsm:port 1|COND:#4
Disappearance from fabric|NODE:IBM G2 Logical Switch 1:port
0:0x00025500103a7202|DETAIL:Node type: switch
The following procedure would find the physical switch connection and node and HCA port and
location. The preceding log would be used as an example, and example results from any queries would
also be provided.
1. Get the Logical Switch GUID and note which logical switch it is in the HCA ->
GUID=0x00025500103a7202; logical switch number 1.
2. Log on to the fabric management server.
3. Find the Logical Switch GUID. This query returns the logical switch side of a link as the first port of
the link and the physical switch port as the second port in the link.
a. If the baseline health check has been run, use the following command. If it has not been run, use
step 3b.
grep –A 1 “0g *[GUID]” /var/opt/iba/analysis/baseline/fabric*links
b. If the baseline health check has not been run, you must query the live fabric by using the
following command.
iba_report –o links | grep –A 1 “0g *[GUID]”
Example results:
> grep –A 1 “0g *0x00025500103a7202” /var/opt/iba/analysis/baseline/fabric*links
20g 0x00025500103a7202
<-> 0x00066a00d90003d3
1 SW IBM G2 Logical Switch 1
3 SW SilverStorm 9024 DDR GUID=0x00066a00d90003d3
4. The physical switch port is in the last line of the results of the query. Get the name and port for the
switch. The name must be given such that it indicates where the switch is physically.
<->
[switch GUID]
[port] SW [switch name/IBnodeDescription]
Example results:
Port 3 on switch SilverStorm 9024 DDR GUID=0x00066a00d90003d3. This switch has not been
renamed and is using the default naming convention which includes the switch model and GUID.
5. Log on to the xCAT Management Server.
6. Find the server and HCA port location.
Note: If you have a map of HCA GUIDs to server locations, use that to find in which server the HCA
is located, and skip step 6a.
a. Convert the logical switch GUID to Operating system format, which drops the “0x” and uses a
dot or colon to delimit bytes:
v For AIX, a dot delimits each byte: 0x00025500103a7202 becomes 00.02.55.00.10.3a.72.02
v For Linux, a colon delimits 2 bytes: 0x00025500103a7202 becomes 0002:5500:103a:7202
b. Drop the last 2 bytes from the GUID (00.02.55.00.10.3a for AIX 0002.5500.103a.72 for Linux )
c. Run the following command to find the server and adapter number for the HCA.
v For AIX, use the following information:
200
Power Systems: High performance clustering
From xCAT:
xdsh [nodegroup with a list of AIX nodes]
-v ’ibstat -p | grep -p "[1st seven bytes of GUID]" | grep iba’
Example results:
>dsh -v -N AIXNodes ’ibstat -p | grep -p "00.02.55.00.10.3a.72" | grep iba’
c924f1ec10.ppd.pok.ibm.com:
c924f1ec10.ppd.pok.ibm.com:
IB PORT 1 INFORMATION (iba0)
IB PORT 2 INFORMATION (iba0)
d. For Linux, use the following information:
From xCAT:
xdsh [nodegroup with a list of Linux nodes]
-v ’ibv_devinfo| grep –B1 "[1st seven bytes of GUID]" | grep ehca’
Example results:
>dsh -v -N AIXNodes ’ibv_devinfo | grep –B1 "0002:5500:103a:72" | grep ehca’
hca_id: ehca0
e. The server is in the first field and the adapter number is in the last field.
(c924f1ec10.ppd.pok.ibm.com and iba0 in AIX, or ehca0 in Linux)
f. To find the physical location of the logical switch port, use the logical switch number and iba
device found preceding with the Table 91 on page 207.
Example Results:
iba0/ehca0 and logical switch 1 map to C65-T1
Therefore, c924f1ec10: C65-T1 is attached to port 3 of SilverStorm 9024 DDR
GUID=0x00066a00d90003d3
This procedure ends here.
Finding devices based on a known logical HCA
Use this procedure if the logical HCA in an HCA is known and the attached switch and physical HCA
port must be determined. This applies to IBM GX HCAs.
For more information about the architecture of IBM GX HCAs and logical switches within them, see
“IBM GX+ or GX++ host channel adapter” on page 7.
Note: This procedure has some steps that are specific to operating system type (AIX or Linux). This must
do with querying the HCA device from the operating system. For AIX, the adapter is called ibaX; where
X is a number 0 through 3. For Linux, the adapter is call ehcaX; where X is a number 0 through 3.
A log entry like the following example is reported with the Logical HCA being reported. Here, the
Logical HCA information is underlined and in bold. Note the Node type in italics; it is an HCA.
Apr 15 09:25:23 c924hsm.ppd.pok.ibm.com local6:notice c924hsm
iview_sm[26012]: c924
hsm; MSG:NOTICE|SM:c924hsm:port 1|COND:#4 Disappearance from
fabric|NODE:IBM G2 Log
ical HCA :port 1:0x00025500103a7200|DETAIL:Node type: hca
The following procedure would find the physical switch connection and node and HCA port and
location. The preceding log would be used as an example, and example results from any queries would
also be provided.
1. Get the Logical HCA GUID and note which logical HCA it is in the HCA; also note the port ->
GUID=0x00025500103a7200; port 1.
2. Log on to the fabric management server.
3. Find the Logical HCAGUID and port. This query returns the logical HCA side of a link as the first
port of the link and the logical switch port as the second port in the link.
High-performance computing clusters using InfiniBand hardware
201
a. If the baseline health check has been run, use the following command. If it has not been run, use
step 3b.
grep –A 1 “0g *[GUID] *[port]”
/var/opt/iba/analysis/baseline/fabric*links
b. If the baseline health check has not been run, you must query the live fabric by using the
following command.
iba_report –o links | grep –A 1 “0g *[GUID] *[port]”
Example results:
> grep –A 1 “0g 0x00025500103a7200* *1” /var/opt/iba/analysis/baseline/fabric*link
60g 0x00025500103a7200
<-> 0x00025500103a7202
1 CA IBM G2 Logical HCA
2 SW IBM G2 Logical Switch 1
4. The logical switch port is in the last line of the results of the query. Get the name for the logical
switch. This tells you which logical switch attaches to the physical switch port.
<->
[logical switch GUID]
[port] SW [logical switch name/IBnodeDescription]
Example results:
Logical Switch 1
5. Find the Logical Switch GUID. This query returns the logical switch side of a link as the first port of
the link and the physical switch port as the second port in the link.
a. If the baseline health check has been run, use the following command. If it has not been run, use
step 5b.
grep –A 1 “0g *[GUID]” /var/opt/iba/analysis/baseline/fabric*links
b. If the baseline health check has not been run, you must query the live fabric by using the
following command.
iba_report –o links | grep –A 1 “0g *[GUID]”
Example results:
20g 0x00025500103a7202
<-> 0x00066a00d90003d3
1 SW IBM G2 Logical Switch 1
3 SW SilverStorm 9024 DDR GUID=0x00066a00d90003d3
6. The physical switch port is in the last line of the results of the query. Get the name and port for the
switch. The name must be given such that it indicates where the switch is physically.
<->
[switch GUID]
[port] SW [switch name/IBnodeDescription]
7. Port 3 on switch SilverStorm 9024 DDR GUID=0x00066a00d90003d3. This switch has not been
renamed and is using the default naming convention which includes the switch model and GUID.
Find the physical switch connection.
8. Logon to the xCAT Management Server.
9. Find the server and HCA port location.
Note: If you have a map of HCA GUIDs to server locations, use that to find in which server the HCA
is located, and skip step 9a.
a. Convert the logical switch GUID to Operating system format, which drops the “0x” and uses a dot
or colon to delimit bytes:
v For AIX, a dot delimits each byte: 0x00025500103a7202 becomes 00.02.55.00.10.3a.72.02
v For Linux, a colon delimits 2 bytes: 0x00025500103a7202 becomes 0002:5500:103a:7202
b. Drop the last 2 byte from the GUID (00.02.55.00.10.3a for AIX 0002.5500.103a.72 for Linux )
c. Run the following command to find the server and adapter number for the HCA.
v For AIX, use the following information:
For xCAT:
dsh [nodegroup with AIX nodes] -v ’ibstat -p | grep -p "[1st seven bytes of GUID]" | grep iba’
Example results:
202
Power Systems: High performance clustering
>dsh -v -N AIXNodes ’ibstat -p | grep -p "00.02.55.00.10.3a.72" | grep iba’
c924f1ec10.ppd.pok.ibm.com:
c924f1ec10.ppd.pok.ibm.com:
IB PORT 1 INFORMATION (iba0)
IB PORT 2 INFORMATION (iba0)
v For Linux, use the following information:
For xCAT:
xdsh [nodegroup with Linux nodes]
-v ’ibv_devinfo| grep –B1 "[1st seven bytes of GUID]" | grep ehca’
Example results:
>dsh -v -N AIXNodes ’ibv_devinfo | grep –B1 "0002:5500:103a:72" | grep ehca’
hca_id: ehca0
d. The server is in the first field and the adapter number is in the last field.
(c924f1ec10.ppd.pok.ibm.com and iba0 in AIX, or ehca0 in Linux)
e. To find the physical location of the logical switch port, use the logical switch number and iba
device found preceding with the Table 91 on page 207.
Example Results:
iba0/ehca0 and logical switch 1 map to C65-T1
Therefore, c924f1ec10: C65-T1 is attached to port 3 of SilverStorm 9024 DDR
GUID=0x00066a00d90003d3
This procedure ends here.
Finding devices based on a known physical switch port
Use this procedure if the physical switch port is known and the attached physical HCA port must be
determined. This applies to IBM GX HCAs.
For more information about the architecture of IBM GX HCAs and logical switches within them, see
“IBM GX+ or GX++ host channel adapter” on page 7.
Note: This procedure has some steps that are specific to operating system type (AIX or Linux). This must
do with querying the HCA device from the operating system. For AIX, the adapter is called ibaX; where
X is a number 0 through 3. For Linux, the adapter is call ehcaX; where X is a number 0 through 3.
A log entry like the following example is reported with the physical being reported. Here, the physical
information is underlined and in bold. Note the Node type in italics; it is a switch.
Apr 15 09:25:23 c924hsm.ppd.pok.ibm.com local6:notice c924hsm
iview_sm[26012]: c924
hsm; MSG:NOTICE|SM:c924hsm:port 1|COND:#4 Disappearance from fabric|NODE:SW
SilverStorm 9024 DDR GUID=0x00066a00d90003d3 :port
11:0x00066a00d90003d3|DETAIL:Node type: switch
The format of the switch “node” is: [name]:[port]:[GUID]
The following procedure finds the physical switch connection and node and HCA port and location. The
preceding log would be used as an example, and example results from any queries would also be
provided.
1. Get the switch GUID and port. -> GUID=0x00066a00d90003d3 ; port 11.
2. Logon to the fabric management server.
3. Find the Logical switch name. This query returns the switch side of a link as the second port of the
link and the logical switch port as the first port in the link.
a. If the baseline health check has been run, use the following command. If it has not been run, use
step 3b.
grep –A 1 “> *[switch GUID] *[switch port]” /var/opt/iba/analysis/baseline/fabric*links
High-performance computing clusters using InfiniBand hardware
203
b. If the baseline health check has not been run, you must query the live fabric by using the
following command.
iba_report –o links | grep –A 1 “0g *[switch GUID] *[switch port]”
Example results:
> grep –A 1 “> *Courier; 0x00066a00d90003d3 *11”
/var/opt/iba/analysis/baseline/fabric*links
20g 0x00025500103a6602
<-> 0x00066a00d90003d3
1 SW IBM G2 Logical Switch 1
11 SW SilverStorm 9024 DDR GUID=0x00066a00d90003d3
4. The logical switch is in the second to last line of the results of the query. Get the name for the logical
switch. This tells you which logical switch attaches to the physical switch port.
<->
[logical switch GUID]
[port] SW [logical switch name/IBnodeDescription]
Example results:
Logical Switch 1
5. Logon to the xCAT Management Server.
6. Find the server and HCA port location
Note: If you have a map of HCA GUIDs to server locations, use that to find in which server the HCA
is located, and skip step 6a.
a. Convert the logical switch GUID to Operating system format, which drops the “0x” and uses a dot
or colon to delimit bytes:
v For AIX, a dot delimits each byte: 0x00025500103a7202 becomes 00.02.55.00.10.3a.72.02
v For Linux, a colon delimits 2 bytes: 0x00025500103a7202 becomes 0002:5500:103a:7202
b. Drop the last 2 byte from the GUID (00.02.55.00.10.3a for AIX 0002.5500.103a.72 for Linux)
c. Run the following command to find the server and adapter number for the HCA.
v For AIX, use the following information:
For xCAT:
dsh [nodegroup with AIX nodes] -v ’ibstat -p | grep -p "[1st seven bytes of GUID]" | grep iba’
Example results:
>dsh -v -N AIXNodes ’ibstat -p | grep -p "00.02.55.00.10.3a.72" |
grep iba’
c924f1ec10.ppd.pok.ibm.com:
c924f1ec10.ppd.pok.ibm.com:
IB PORT 1 INFORMATION (iba0)
IB PORT 2 INFORMATION (iba0)
d. For Linux, use the following information:
For xCAT:
dsh [nodegroup with Linux nodes] -v ’ibv_devinfo| grep –B1 "[1st seven bytes of GUID]" | grep ehca’
Example results:
>dsh -v -N AIXNodes ’ibv_devinfo | grep –B1 "0002:5500:103a:72" |
grep ehca’
hca_id: ehca0
e. The server is in the first field and the adapter number is in the last field.
(c924f1ec10.ppd.pok.ibm.com and iba0 in AIX, or ehca0 in Linux)
f. To find the physical location of the logical switch port, use the logical switch number and iba
device found preceding with the Table 91 on page 207.
Example results:
iba0/ehca0 and logical switch 1 map to C65-T1
Therefore, c924f1ec10: C65-T1 is attached to port 3 of SilverStorm 9024 DDR
GUID=0x00066a00d90003d3
204
Power Systems: High performance clustering
This procedure ends here.
Finding devices based on a known ib interface (ibX/ehcaX)
Use this procedure if the ib interface number is known and the physical HCA port and attached physical
switch port must be determined.
This applies to IBM GX HCAs. For more information about the architecture of IBM GX HCAs and logical
switches within them, see “IBM GX+ or GX++ host channel adapter” on page 7.
Note: This procedure has some steps that are specific to operating system type (AIX or Linux). This must
do with querying the HCA device from the operating system. For AIX, the adapter is called ibaX; where
X is a number 0 through 3. For Linux, the adapter is call ehcaX; where X is a number 0 through 3.
For example, if there is a problem with ib0, use the following procedure to determine the physical HCA
port and physical switch port associated with the problem.
1. Record the ib interface number and server: For example: ib1 on c924f1ec09
2. Log on to the server with the ib interface of interest.
3. From netstat, get the Logical HCA GUID associated with the ib interface:
v For AIX use: netstat –I [ib interface]; you must add leading zeros to bytes that are returned
with single digits. You need the last 8 bytes of the Address.
Example results:
> netstat –I ib1
Name
Coll
ib1
65
ib1
0
Mtu
65532
0
65532
Network
link#3
7
0
192.168.9
Address
Ipkts Ierrs
Opkts Oerrs
0.0.0.b.fe.80.0.0.0.0.0.1.0.2.55.0.10.24.d9.1
0
192.168.9.65
65
0
7
0
GUID = 0.2.55.0.10.24.d9.1 = 00.02.55.00.10.24.d9.01
v For Linux use: ifconfig [ib interface];
Example results:
> ifconfig ib0 | grep inet6
inet6 addr: fe80::202:5500:1024:d900/64 Scope:Link
GUID = 02:5500:1024:d900 => add the leading zeroes to get 0002:5500:1024:d900
4. Get the adapter device
v For AIX, use the following information:
ibstat -p | grep -p "[1st seven bytes of GUID]" | grep iba
Example results:
> ibstat -p | grep -p "00.02.55.00.10.24.d9" | grep iba
IB PORT 1 INFORMATION (iba0)
IB PORT 2 INFORMATION (iba0)
Device = iba0
v For Linux, use the following information:
ibv_devinfo| grep –B1 "[1st seven bytes of GUID]" | grep ehca
Example results:
ibv_devinfo | grep –B1 "02:5500:1024:d9" | grep ehca
hca_id: ehca0
Device = ehca0
5. Find the logical switch associated with logical HCA for the interface.
High-performance computing clusters using InfiniBand hardware
205
6. Log on to the fabric management server.
7. Translate the operating system representation of the logical HCA GUID to the subnet manager
representation of the GUID.
a. For AIX reported GUIDs, delete the dots: 00.02.55.00.10.24.d9.00 becomes 000255001024d900
b. For Linux reported GUIDs, delete the colons: 0002:5500:1024:d900 becomes 000255001024d900
8. Find the logical HCA GUID connection to the logical switch:
a. If the baseline health check has been run, use the following command. If it has not been run, use
step b.
grep –A 1 “0g *[GUID] *[port]” /var/opt/iba/analysis/baseline/fabric*links
b. If the baseline health check has not been run, you must query the live fabric by using the
following command.
iba_report –o links | grep –A 1 “0g *[GUID] *[port]”
Example results:
> grep –A 1 “0g 0x00025500103a7200* *1” /var/opt/iba/analysis/baseline/fabric*link
60g 0x000255001024d900
<-> 0x000255001024d902
1 CA IBM G2 Logical HCA
2 SW IBM G2 Logical Switch 1
9. The logical switch port is in the last line of the results of the query. Get the name for the logical
switch. This tells you which logical switch attaches to the physical switch port. Also record the
logical switch GUID.
<->
[logical switch GUID]
[port] SW [logical switch name/IBnodeDescription]
Example results:
Logical Switch 1; Logical Switch GUID= 0x0025501024d902
10. To find the physical location of the logical switch port, use the logical switch number and iba device
found preceding with the Table 91 on page 207.
Example Results:
iba0/ehca0 and logical switch 1 map to C65-T1
11. Find the physical switch connection to the logical switch:
a. If the baseline health check has been run, use the following command. If it has not been run, use
step b.
grep –A 1 “0g *[GUID]” /var/opt/iba/analysis/baseline/fabric*links
b. If the baseline health check has not been run, you must query the live fabric by using the
following command.
iba_report –o links | grep –A 1 “0g *[GUID]”
Example results:
> grep –A 1 “0g * 0x00025500103a7202” /var/opt/iba/analysis/baseline/fabric*links
20g 0x000255001024d902
<-> 0x00066a00d90003d3
1 SW IBM G2 Logical Switch 1
3 SW SilverStorm 9024 DDR GUID=0x00066a00d90003d3
The physical switch port is in the last line of the results of the query. Get the name and port for
the switch. The name must be given such that it indicates where the switch is physically.
<->
[switch GUID]
[port] SW [switch name/IBnodeDescription]
Example results:
Port 3 on switch SilverStorm 9024 DDR GUID=0x00066a00d90003d3. This switch has not been
renamed and is using the default naming convention which includes the switch model and
GUID.
12. Therefore, for ib0 in the server, the C65-T1 HCA port is attached to port 3 of SilverStorm 9024 DDR
GUID=0x00066a00d90003d3
This procedure ends here.
206
Power Systems: High performance clustering
IBM GX HCA Physical port mapping based on device number
Use this information to find the IBM GX HCA physical port based on the iba device and logical switch
number.
Use the following table is to find IBM GX HCA physical port based on iba device and logical switch
number. For more information about the structure of the IBM GX HCA, see “IBM GX+ or GX++ host
channel adapter” on page 7.
Table 91. IBM GX HCA physical port mapping from iba device and logical switch
Device (iba)
Logical Switch
9125-F2A
8203-E4A
8204-EA8
iba0/ehca0
1
C65-T1
Cx-T1
Cx-T1
iba0/ehca0
2
C65-T2
Cx-T2
Cx-T2
iba1/ehca1
1
C65-T3
iba1/ehca1
2
C65-T4
iba2/ehca2
1
C66-T1
iba2/ehca2
2
C66-T2
iba3/ehca3
1
C66-T3
iba3/ehca3
2
C66-T4
Interpreting switch vendor log formats
There are several methods available to help you interpret switch logs from vendor companies.
Log severities
Use this information to find log severity levels used by QLogic switches and Subnet Managers.
These severities are standard syslog priority levels. Priority is the term that is used to refer the severity in
a syslog entry.
Table 92. QLogic log severities
Severity
Significance
Example
Error
v Actionable events
The voltage level is outside
acceptable operating range
v Need immediate action
v Have severity level above
Information, Notice, and Warning
Temperature rose above the critical
threshold
v Logged to xCAT event
management
Warning
v Actionable events
v Action can be deferred
v Have severity level above
Information, Notice, and below
Error
The field replaceable unit (FRU) state
changed from online to offline
Power Supply N+1 redundancy not
available
v Logged to xCAT event
management
High-performance computing clusters using InfiniBand hardware
207
Table 92. QLogic log severities (continued)
Severity
Significance
Example
Notice
v Actionable events
Switch chassis management software
rebooted
v Can be a result of user action or
actual failure
v Have severity level above
Information and below Warning
and Error
FRU state changed from not-present
to present
v Logged to xCAT event
management
Information
v Events which do not require any
action
v Have severity level below Notice,
Warning, and Error
I2C system passes POST
telnetd: connection requested by
<ip_address>
v Provide advanced level of
engineering debug information
useful for postmortem analysis
Switch chassis management log format
The switch chassis management code logs problems with the switch chassis for things like power and
cooling and logic issues, or other hardware failures not covered by the Subnet Manager.
The source for switch chassis management logs is on the switch. When remote logging and xCAT event
management is set up as in “Set up remote logging” on page 112 these are also available on the
xCAT/MS. For more information, see “Vendor log flow to xCAT event management” on page 23.
The log format for switch chassis management logs is as follows. The key to recognizing a switch chassis
log is that it contains the string “|CHASSIS: “ after the “MSG: <msgType>” string.
Note: This format is for entries with a severity of Notice or higher. INFO messages are not bound by this
format, and are for engineering use.
<prefix>;MSG: <msgType>| CHASSIS: <location>|COND: <condition>|FRU:
<fru>|PN: <part number>|DETAIL: <details>
<prefix> = timestamp and card slot number and IP-address of the unit
reporting the error.
<msgType> is one of the following values: Error, Warning, Notice,
INFORMATION
<location> is the value from the user settable field called InfiniBand
Node Description on the System tab of the GUI or via the CLI command
“setIBNodeDesc”. Up to 64 characters. Defaults to GUID.
<condition> is one of the conditions from the CHASSIS Reporting Table.
Text includes a unique ID number
<fru> associated with the condition.
<part number> is an ASCII text field which identifies the QLogic part
number for the associated FRU.
<details> is optional information that is relevant to the particular
event.
Example switch chassis management log entry:
208
Power Systems: High performance clustering
Oct 9 18:54:37 slot101:172.21.1.29;MSG:NOTICE|CHASSIS:SilverStorm 9024
GUID=0x00066a00d8000161|COND:#9999 This is a notice event test|FRU:Power
Supply 1|PN:200667-000|DETAIL:This is an additional information about the
event
Subnet Manager log format
The Subnet Manager logs information about the fabric. This includes events like link problems, devices
status from the fabric, and information regarding when it is sweeping the network.
The Subnet Manager log can be either on a switch in the same log as the Switch Chassis Management
Log (for embedded Subnet Managers) or in the syslog (/var/log/messages) of the fabric management
server (for Host-based Subnet Managers).
When remote logging and xCAT event management is set up as in “Set up remote logging” on page 112
the Subnet Manager logs are also available on the xCAT/MS. For more information, see “Vendor log flow
to xCAT event management” on page 23.
The format of the Subnet Manager log is as follows. The key to recognizing a Subnet Manager log entry
is the string “|SM: “ following the string “MSG: <msgType>”.
Note: This format is for entries with a severity of Notice or higher. INFO messages are not bound by this
format, and are for engineering use.
<prefix>;MSG:<msgType>| SM:<sm_node_desc>:port <sm_port_number>|
COND:<condition>|NODE:<node_desc>:port <port_number>:<node_guid>|
LINKEDTO:<linked_desc>:port <linked_port>:<linked_guid>|DETAIL:<details>
<prefix> timestamp and card slot number OR hostname and IP-address of the
unit reporting the msg
<msgType> is one of the following values: Error, Warning, Notice,
INFORMATION
<sm_node_desc> and <sm_port_number> indicate the node name and port number
of the SM that is reporting the message. For ESM, port number=0.
<condition> is one of the conditions from the event SM Reporting Table
text includes a unique ID #
<node_desc>, <port_number>, and <node_guid> are the InfiniBand Node
Description, Port Number and Node GUID of the port and node that are
primarily responsible for the event.
<linked_desc>:<linked_port>:<linked_guid> are optional fields describing
the other end of the link described by the <node_desc>, <port_number>, and
<node_guid> fields. These fields and the 'LINKEDTO’ keyword will only
appear in applicable messages.
<details> is an optional free-form field with additional information
for diagnosing the cause.
Example Subnet Manager log entry:
High-performance computing clusters using InfiniBand hardware
209
Oct 10 13:14:37 slot 101:172.21.1.9; MSG:ERROR| SM:SilverStorm 9040
GUID=0x00066a00db000007 Spine 101, Chip A:port 0| COND:#99999 Link
Integrity Error| NODE:SilverStorm 9040 GUID=0x00066a00db000007 Spine 101,
Chip A:port 10:0x00066a00db000007 | LINKEDTO:9024 DDR
GUID=0x00066a00d90001db:port 15:0x00066a00d90001db|DETAIL:Excessive Buffer
Overrun threshold trap received.
Diagnosing link errors
This procedure is used to isolate link errors to a field replacement unit (FRU).
Symptoms that lead to this procedure include:
Symptom
Reporting mechanism
Port Error counters
Fast Fabric health check results on fabric management
server: /var/opt/iba/analysis/[dir]/
fabric.*:*.errors;
Output from iba_report –o errors.
Link down message; HCA resource (logical switch,
logical HCA, end node) disappearance reported
xCAT/MS log containing QLogic logs:
/tmp/systemEvents
HCA resource (logical switch, logical HCA, node)
disappearance reported
FastFabric health checking with .diff file
LED on switch or HCA showing link down
LEDs; Chassis Viewer; Fabric Viewer
Use the following procedure to isolate a link error to a FRU. Be sure to record which steps you have
taken in case you must contact your next level of support, or in case QLogic must be contacted.
The basic flow of the procedure is:
1. If the problem was reported because of error counters being non-zero, determine if they are above
threshold and if a pattern of errors is present. To do this, use the procedures in “Interpreting error
counters” on page 255.
2. Determine if the link errors might merely be symptoms caused by a user action (like a reboot) or
another component failing (like a switch, or a server).
3. Determine the physical location of both ends of the cable.
4. Isolate to the FRU
5. Repair the FRU
6. Verify that the link is fixed
7. Verify that the configuration was not inadvertently changed
8. If a switch component, or HCA was replaced, take a new health check baseline
9. Exit the procedure
Notes:
1. This procedure might have you swap ports to which a cable end is connected. Be sure that you do not
swap ports with a link connected to a fabric management server. This would jeopardize fabric
performance and also capability to do some verification procedures.
2. When the problem is fixed, or cannot find a problem after doing anything to disturb the cable, HCA,
or switch components associated with the link, it is important to perform the Fast Fabric Health
210
Power Systems: High performance clustering
Check prescribed in step 18 on page 213 to ensure that you have returned the cluster fabric to the
intended configuration. The only changes in configuration would be VPD information from replaced
parts.
3. If you replace the managed spine for the switch chassis, you must redo the switch chassis setup for
the switch as prescribed in “Installing and configuring vendor or IBM InfiniBand switches” on page
137.
1. If this is a switch to switch link, use the troubleshooting guide from QLogic. Engage QLogic service
and exit this procedure.
2. If this is a switch to switch link and the switches are an IBM machine type and model.
And, if the problem was reported because of error counters exceeding threshold as reported by
health checks or iba_report, use the procedures in “Interpreting error counters” on page 255.
3. If this is an IBM HCA to switch link, continue to the next step.
4. If the problem was reported because of error counters exceeding threshold as reported by health
checks or iba_report, use the procedures in “Interpreting error counters” on page 255.
5. Map the IBM HCA GUID and port information to a physical location and determine the switch
physical location by using the procedure in “Mapping fabric devices” on page 197.
6. Before proceeding, check for other link problems in the xCAT Event Management Log.
7. If there is an appearance notification after a disappearance notification for the link, it is possible that
the HCA link bounced, or the node has rebooted.
8. If every link attached to a server is reported as down, or all of them have been reported
disappearing and then appearing do the following steps:
a. Check to see if the server is powered-off or had been rebooted. If this is true, the link error is not
a serviceable event, then end this procedure.
b. The server is not powered-off nor had it been rebooted. The problem is with the HCA. Replace
the HCA by using the Repair and Verify procedures on the Hardware Management Console
(HMC) which manages the server in which the HCA is populated, and exit this procedure.
9. If every link attached to the switch chassis has gone down, or all of them have been reported
disappearing and then appearing, do the following dteps:
a. Check to see if the switch chassis is powered-off or was powered-off at the time of the error. If
this is true, the link error is not a serviceable event, then end this procedure.
b. If the switch chassis is not powered-off nor was it powered-off at the time of the error, the
problem is in the switch chassis. Engage QLogic service and exit this procedure.
10. If more than two links attached to a switch chassis have gone down, but not all of the links with
cables have done down or been reported disappearing and then appearing the problem is in the
switch chassis. Engage QLogic service and exit this procedure.
11. Check the HMC for serviceable events against the HCA. If the HCA was reported as part of a FRU
list in a serviceable event. This link error is not a serviceable event; therefore, no repair is required in
this procedure. If you replace the HCA or a switch component based on the serviceable event, go to
step 18 on page 213 in this procedure. Otherwise, exit this procedure.
12. Check the LEDs of the HCA and switch port comprising the link. Use the IBM system Manual to
determine if the HCA LED is in a valid state and use the QLogic switch Users Guide to determine if
the switch port is in a valid state. In each case, the LED would be lit if the link is up and unlit if the
link is down.
13. Check the seating of the cable on the HCA and the switch port. If it appears unseated, reseat the
cable and do the following steps. Otherwise go to the next step.
a. Check the LEDs.
b. If the LEDs light, the problem is resolved. Go to step 18 on page 213.
c. If the LEDs do not light, go to the next step.
14. Check the cable for damage. If the cable is damaged, perform the following procedure. Otherwise,
proceed to the next step.
High-performance computing clusters using InfiniBand hardware
211
a. Replace the cable. Before replacing the cable, check the manufacturer and part number to ensure
that it is an approved cable. Approved cables are available in the IBM Clusters with the InfiniBand
Switch web-site referenced in “Cluster information resources” on page 2.
Perform the procedure in “Verifying link FRU replacements” on page 244.
If the problem is fixed, go to step 18 on page 213. If not, go to the next step.
there are open ports on the switch, do the following steps. Otherwise, go to step 16.
Move the cable connector from the failing switch port to the open switch port.
In order to see if the problem has been resolved, or it has moved to the new switch port, use the
procedure in “Verifying link FRU replacements” on page 244.
c. If the problem was “fixed”, then the failing FRU is on the switch. Engage QLogic for repair.
When the repair has been made, go to step 18 on page 213. If the problem was not fixed by
swapping ports, proceed to the next step.
d. If the problem was not “fixed” by swapping ports, then the failing FRU is either the cable or the
HCA. Return the switch port end of the cable to the original switch port.
e. If there is a known good HCA port available for use, swap between the failing HCA port cable
end to the known good HCA port. Then, do the following steps. Otherwise proceed to the next
step.
b.
c.
15. If
a.
b.
1) Use the procedure in “Verifying link FRU replacements” on page 244.
2) If the problem was “fixed”, replace the HCA by using the Repair and Verify procedures for
the server and HCA. When the HCA is replaced, go to step 18 on page 213.
3) If the problem was not “fixed”, the problem is the cable. Engage QLogic for repair. When the
repair has been made, go to step 18 on page 213.
f. If there is not a known good HCA port available for use, and the problem has been determined to
be the HCA or the cable, replace the FRUs is the following order:
1) Engage QLogic to replace the cable, and verify the fix by using the procedure in “Verifying
link FRU replacements” on page 244. If the problem is fixed, go to step 18 on page 213.
Note: Before replacing the cable, check the manufacturer and part number to ensure that it is
an approved cable. Approved cables are available in the IBM Clusters with the InfiniBand Switch
web-site referenced in “Cluster information resources” on page 2.
2) If the cable does not fix the problem, replace the HCA, and verify the fix by using the
procedure in “Verifying link FRU replacements” on page 244. If the problem is fixed, go to
step 18 on page 213.
3) If the problem is still not fixed, call your next level of support. If any repairs are made under
direction from support, go to step 18 on page 213 when they have been made.
16. If there are open ports or known good ports on the HCA, do the following steps. Otherwise, go to
the next step.
a. Move the cable connector from the failing HCA port to the open or known good HCA port.
b. In order to see if the problem has been resolved, or it has moved to the new HCA port, use the
procedure in “Verifying link FRU replacements” on page 244. If the problem is fixed, go to step
18 on page 213.
c. If the problem was “fixed”, then the failing FRU is the HCA, replace the HCA by using the
Repair and Verify procedures for the server and HCA. After the HCA has been replaced, go to
step 18 on page 213.
d. If the problem was not “fixed”, then the failing FRU is the cable or the switch. Engage QLogic
for repair. When the problem is fixed, go to step 18 on page 213.
17. There are no open or available ports in the fabric, or the problem has not been isolated yet. Do the
following steps:
a. Engage QLogic to replace the cable, and verify the fix by using the procedure in “Verifying link
FRU replacements” on page 244. If the problem is fixed, go to step 18 on page 213.
212
Power Systems: High performance clustering
b. If the cable does not fix the problem, replace the HCA, and verify the fix by using the procedure
in “Verifying link FRU replacements” on page 244. If the problem is fixed, go to step 18.
c. If the HCA does not fix the problem, engage QLogic to work on the switch. When the problem is
fixed, go to step 18.
18. If the problem has been fixed, run Fast Fabric Health check and check for .diff files. Be especially
aware of any inadvertent swapping of cables. For instructions on interpreting health check results,
see “Health checking” on page 157.
a. If the only difference between the latest cluster configuration and the baseline configuration is
new part numbers or serial numbers related to the repair action, run a new Health Check
baseline to account for the changes.
b. If there are other differences between the latest cluster configuration and baseline configuration,
perform the procedure in “Re-establishing Health Check baseline” on page 244. This will pick up
the new baseline so that future health checks will not show configuration changes.
c. If there were link errors reported in the health check, you must go back to step 1 on page 211 of
this procedure and isolate the problem.
This procedure ends here.
Related concepts
“Hardware Management Console” on page 18
You can use the Hardware Management Console (HMC) to manage a group of servers.
Diagnosing and repairing switch component problems
Use this procedure if you must diagnose and repair switch component problems.
Switch internal problems can surface in the xCAT/MS /tmp/systemEvents file or in Fast Fabric tools
reports or health checks.
If a switch component problem is being reported, do the following procedure:
1. Contact QLogic with the log or report information. Or use the repair and troubleshooting procedures
in the Switch Users Guide or the QLogic Troubleshooting Guide.
2. If any repair is made, or if anything is done to change the hardware or software configuration for the
fabric, use “Re-establishing Health Check baseline” on page 244.
This procedure ends here
Diagnosing and repairing IBM system problems
System problems are most often reported on the Hardware Management Console (HMC) through
serviceable events. If an IBM system problem is reported, the repair action might affect the fabric.
Use the procedure found in “Restarting or powering off an IBM system” on page 247.
Diagnosing configuration changes
Use the fast fabric health check to determine configuration changes in the fabric.
Configuration changes in the fabric can be determined by using Fast Fabric Health Check. For details, see
“Health checking” on page 157.
1. If you were directed here because you noted that HCA ports might have been swapped, see
“Diagnosing swapped HCA ports” on page 221.
2. If you have been directed here because you noted that switch ports might have been swapped, see
“Diagnosing swapped switch ports” on page 222.
High-performance computing clusters using InfiniBand hardware
213
3. If you see configuration changes, do one of the following steps. To determine the nature of the change
see “Health checking” on page 157.
a. Look for a health check output file with the extension of .changes or .diff on the fabric
management server, in one of the following directories: /var/opt/iba/analysis/latest or
/var/opt/analysis/[recent timestamp]
b. Execute all_analysis (or a script that calls it), and look for a health check output file with the
extension of .changes or .diff on the fabric management server, in one /var/opt/iba/analysis/
latest
This procedure ends here.
Checking for hardware problems affecting the fabric
Use this information to find out how to check for hardware problems that might affect the fabric.
To check for hardware problems that might affect the fabric, perform the following steps:
1. Open Service Focal point on all HMCs and perform prescribed service any open serviceable events. If
you have redundant HMCs configured, you need open Service Focal Point only on one HMC in each
set of redundant HMCs.
2. Check for switch or Subnet Manager errors on the Cluster Management Server: For xCAT, check the
xCAT/MS in /tmp/systemEvents for any serviceable events that might not have been addressed, yet.
Use the procedures in “Table of symptoms” on page 187 to diagnose problems reported in this log.
Look especially at Table 83 on page 188.
Note: If xCAT Event Management is not setup, you can still use the preceding table of symptoms.
However, you must go directly to the switch and Subnet Manager logs as they are documented in the
vendors Switch Users Guide and Fabric Manager Users Guide.
3. Inspect the LEDs for the devices on the network and perform prescribed service procedures; see
Table 84 on page 189.
4. Look for driver errors that do not correspond to any hardware errors reported in SFP or the switch
and subnet management logs. Perform appropriate service actions for the discovered error codes, or
call your next level of support.
For AIX, use “errpt –a” on the LPARs that are exhibiting a performance problem.
For Linux, look at “/var/log/messages” on the logical partitions that are exhibiting a performance
problem.
This procedure ends here.
Checking for fabric configuration and functional problems
Use this information to learn how to check for fabric configuration and functional problems.
To check for fabric configuration and functional problems, perform the following procedure.
On the fabric management server run the all_analysis fast fabric health check command. For details, see
“Health checking” on page 157. To diagnose symptoms reported by health check see Table 85 on page
189.
Note: The health check would be most effective for checking for configuration problems if a baseline
health check has been taken and is stored in the /var/opt/iba/analysis/baseline directory on the fabric
management server. Otherwise changes in configuration cannot be sensed.
If there is no baseline health check for comparison, you must perform the same type of configuration
checks that were done during installation, see “Installing and configuring the InfiniBand switch” on page
138. For the host-based Subnet Managers, also use “Installing the fabric management server” on page 105.
214
Power Systems: High performance clustering
You must check that the following configuration parameters match the installation plan. A reference or
setting for IBM System p and IBM Power Systems HPC Clusters is provided for each parameter that you
can check.
Table 93. Health check parameters
Parameter
Reference
GID prefix
The GID prefix must be different for each subnet. For
details, see “Planning for global identifier prefixes” on
page 52.
LMC
Must be 2 for IBM system p HPC Clusters.
MTU
“Planning maximum transfer unit (MTU)” on page 51.
This is the fabric MTU and not the MTU in the stack,
which can be a much greater number.
Cabling plan
Vendor's Switch Users Guide and Planning and Installation
Guide
Balanced Topology
It is best to ensure that you have distributed the HCA
ports from the servers in a consistent manner across
subnets. For example, all corresponding ports on HCAs
within servers would connect to the same subnet; like, all
HCA 1 port 1's should connect to subnet 1, and all HCA
1 port 2's should connect to port 2.
Full bandwidth topology?
Did you choose to implement a Full-bandwidth topology
by using the vendor recommendations found in the
vendors Switch Users Guide and Planning and Installation
Guide?
This task ends here.
Checking InfiniBand configuration in AIX
This procedure checks for HCA availability and configuration in AIX.
Perform the following operations from the xCAT/MS.
Verify HCAs are visible to LPARs:
1. Get the number of HCAs:
For xCAT: xdsh [nodegroup with all nodes] –v “lsdev –Cc adapter | grep iba” | wc -l
2. If the number returned by the system:
v Matches the number of ibas in the cluster, continue with the procedure to verify that all HCAs are
available to the LPARs
v Does not match the number of HCAs, continue with this procedure
3. To store the list of HCAs, run the following command:
For xCAT: xdsh [nodegroup with all nodes] –v “lsdev –Cc adapter | grep iba” > iba_list
4. Open the generated file, iba_list, and look at the number of HCAs that are visible to the system.
HCAs that are visible to the system are listed as Defined or Available. For each LPAR having HCAs
that are not visible, check to see if the HCA was assigned to that LPAR:
Using the HMC GUI on the HMC controlling each server:
a. Verify that the HCA has been assigned to the LPAR. If this is not the case, see “Installing or
replacing an InfiniBand GX host channel adapter” on page 147.
b. After you assign the HCA to the correct LPAR, run the following command:
High-performance computing clusters using InfiniBand hardware
215
For xCAT: xdsh [nodegroup with all nodes that had previously missing HCAs] –v “lsdev –Cc
adapter | grep iba”
c. If the HCA:
v Is still not visible to the system, continue with the step 5
v Is visible to the system, continue with the procedure to verify that all HCAs are available to
the LPARs
5. If you have an HCA that was assigned to an LPAR but the HCA is not visible to the system:
a. Go to SFP on the HMC controlling each server and review the error logs.
b. Fix any events that are reported against each server or HCAs in that server.
Perform the following recovery procedure:
c. If all of the interfaces in an LPAR are not configured, use the procedure in “Recovering all of the
ibX interfaces in an LPAR in the AIX” on page 236.
d. If only a single interface in an LPAR is not configured, use the procedure in “Recovering a single
ibX interface in AIX” on page 235.
Verify all HCAs are available to the LPARs:
6. Run the following command to determine how many HCA interfaces are available for use:
For xCAT:
xdsh [nodegroup with all nodes]
-v "lsdev -Cc adapter | grep ib | grep Available" | wc -
7. If the number returned by the system:
v Matches the number of HCAs in the cluster, continue with the procedure to with Verify all HCAs
are available to the LPARs.
v Does not match the number of HCAs, continue with this procedure.
8. Verify that all servers are powered on.
9. Run the following command to see which HCAs are visible to the system but are not available for
use:
For xCAT: xdsh [nodegroup will all nodes] -v "lsdev -Cc adapter | grep sn | grep -v
Available"
10. Reboot LPARs linked to an HCA that is listed as not available.
11. When all HCAs are listed as available to the operating system, continue with the procedure to verify
HCA numbering and the netid for the LPAR.
12. Check HCA allocation across LPARs. For HPC Cluster, there can be only one active LPAR and the
HCA can be Dedicated to it.
13. Assure that the fabric is balanced across the subnets. The following command string gathers the
GID-prefixes for the ib interfaces. These would be consistent across all LPARs.
For xCAT:
xdsh [nodegroup with all nodes] –v 'netstat -i | grep ’ib.*link’ | awk \’{split($4,a,".");
for (i=5;i<=12;i++){printf a[i]}; printf "\n"}\’’
14. Verify that the tcp_sendspace and tcp_recvspace attributes are set properly:
Because superpackets must be on, the expected attribute value results are tcp_sendspace=524288 and
tcp_recvspace=524288.
For xCAT: xdsh [nodegroup with all nodes] –v “ibstat –v | grep 'tcp_send.*tcp_recv’”
15. Verify that the IP MTU is configured properly. All ibX interfaces must be defined with
superpacket=on., which results in an IP MTU of 65532. The IP MTU is different from the InfiniBand
fabric MTU.
For xCAT: dsh [nodegroup with all nodes] –v “netstat -i | grep ’ib.*link’ ” | awk ’{print
$1” ”$2}’ | grep –v ”65532”
216
Power Systems: High performance clustering
16. Verify that the network interfaces are recognized as being up and available. The following command
string must return no interfaces. If an interface is marked down, it returns the LPAR and ibX
interface.
For xCAT: xdsh [nodegroup with all nodes] –v '/usr/bin/lsrsrc IBM.NetworkInterface Name
OpState | grep -p"resource" -v "OpState = 1" | grep ib’
Verify HCAs ends here.
Checking system configuration in AIX
You can use the AIX operating system to check system configuration.
Related concepts
“Hardware Management Console” on page 18
You can use the Hardware Management Console (HMC) to manage a group of servers.
Verifying the availability of processor resources
To check system configuration in AIX, perform the following procedures, on the xCAT/MS.
1. Run the command to get a count of processors in the cluster:
For xCAT: xdsh [nodegroup with all nodes] –v "lsdev -C | grep proc | grep AVAILABLE" | wc –l
2. This command must return the total number of processors available in the cluster, if it does not:
a. Verify that all servers are powered on
b. Fix any problems with dsh not being able to reach all LPARs
c. Determine which processors are having problems by running the command:
For xCAT: xdsh [nodegroup with all nodes] –v "lsdev -C | grep proc | grep -v AVAILABLE"
d. After you have identified the problem processors, check SFP on the HMC controlling the server
and complete the required service actions. If no serviceable events are found, try any isolation
procedures for unconfigured processors that are found in the System Service Guide.
e. When all processors are available, continue with the procedure to verify memory.
3. If processor deconfiguration persists, call your next level of hardware support.
4. Verify that processors are running at expected frequencies:
For xCAT: xdsh [nodegroup with all nodes] –v “/usr/pmapi/tools/pmcycles –M”
Verify processors ends here.
Verifying the availability of memory resources
To verify the availability of memory resources, perform the following steps:
1. Run the following command to see the differences between physical memory size and available
memory size:
For xCAT:
xdsh [nodegroup with all nodes] –v "lsattr -E -l mem0 |
awk ’{ if (\$1 ~/goodsize/ ) { g=\$2} else { p=\$2 }}END{d=p-g; print d}’" | grep -v ": 0"
Note: The result of the awk parameter is the difference between physical memory and available
memory. Unless there is unconfigured memory, if you remove the grep -v ": 0" portion of the
command, every logical partition must return 0 (zero).
2. If the operating system has access to all memory resources, you would be returned to a command
prompt without data. You can exit the diagnostic tests.
Memory requires configuration, check SFP on the HMC controlling the server LPAR and service as
instructed.
High-performance computing clusters using InfiniBand hardware
217
Note: Before you perform a memory service action, ensure that the memory was not unconfigured
for a specific reason. If the network still has performance problems call your next level of support.
3. If no problems are found in SFP, perform any System Service Guide instructions for diagnosing
unconfigured memory.
4. If the memory deconfiguration persists, call your next level of support.
Verify Memory ends here.
Checking InfiniBand configuration in Linux
This procedure checks for HCA availability and configuration in Linux.
Verify HCAs:
This verifies that HCAs are available and configured properly.
Perform the following operations from the xCAT/MS.
Verify HCAs are visible to LPARs:
1. Run the following command to count the number of HCA devices:
For xCAT: xdsh [nodegroup with all nodes] -v "ibv_devices | grep ehca" | wc –l
2. If the number returned by the system:
v Matches the number of HCAs in the cluster, continue with the procedure to Verify all HCAs are
available to the LPARs.
v Does not match the number of HCAs, continue with this procedure
3. Run the following command to generate a list of HCAs visible to the LPARs including the HCA
GUID:
For xCAT: xdsh [nodegroup with all nodes] -v "ibv_devices | grep ehca" > hca_list
4. Open the generated file, hca_list, and compare with the list of all expected HCAs by their GUID. For
each LPAR having HCAs that are not visible, check to see if the HCA was assigned to that LPAR:
Using the HMC GUI on the HMC controlling each server:
a. Verify that the HCA has been assigned to the LPAR. If this is not the case, see “Installing or
replacing an InfiniBand GX host channel adapter” on page 147.
The device was not assigned to the LPAR, see “Installing the operating system and configuring
the cluster servers” on page 128. After you assign the HCA to the LPAR, return to this location.
b. After you assign the HCA to the correct LPAR, run the following command:
For xCAT: xdsh [nodegroup with all nodes that had an issue with the lhca] -v "find
/sys/bus/ibmebus/devices -name ’lhca*’ -print"
c. If the HCA:
v Is still not visible to the system, continue with the step 5
v Is visible to the system, continue with step 6 on page 219 to verify that all HCAs are available
to the LPARs
5. If you have an HCA that was assigned to an LPAR but the HCA is not visible to the system:
a. Go to SFP on the HMC controlling each server and review the error logs
b. Fix any events that are reported against each server or HCAs in that server
Perform the following recovery procedure:
c. If all of the interfaces in an LPAR are not configured, use the procedure in “Recovering all of the
ibX interfaces in an LPAR in the Linux” on page 238.
d. If only a single interface in an LPAR is not configured, use the procedure in “Recovering a single
ibX interface in Linux” on page 237.
218
Power Systems: High performance clustering
Verify all HCAs are available to the LPARs:
6. Run the following command to count the number of active HCA ports:
For xCAT: xdsh [nodegroup with all nodes] -v "ibv_devinfo | grep PORT_ACTIVE" | wc -l
Note: An HCA has two ports.
7. If the number returned by the system divided by two:
v Matches the number of HCAs in the cluster, continue with the procedure Verify all HCAs are
available to the LPARs.
v Does not match the number of HCAs, determine the inactive ports, and check their cabling state
by following step 8.
v Does not match the number of HCAs and the ports are properly connected, continue with step 10.
8. Verify that all ports are active by running the command:
For xCAT: xdsh [nodegroup with all nodes] -v "ibv_devinfo | egrep
'hca_id|node_guid|port:|PORT_DOWN’"
9. For each port listed by the system ensure that the respective cable is connected firmly to the adapter
and with the switch.
v If there are ports unused by purpose, you might want to consider enabling the auto-port-detection
feature of eHCA, especially. In order to enable that feature add the following line to the file
/etc/modprobe.conf.local:
options ib_ehca nr_ports=-1
10.
11.
12.
13.
14.
v In order to get a full list of supported options, run the command: modinfo ib_ehca
Verify that all servers are powered on
Run the following command to return the list of HCAs that are visible to the system but not
available:
For xCAT: xdsh [nodegroup with all nodes] -v "lsdev -Cc adapter | grep ib | grep -v
Available"
Restart any LPAR linked to an HCA that is listed as not available.
When all HCAs are listed as available to the operating system, continue with the procedure to verify
HCA numbering and the netid for LPAR.
Check HCA allocation across LPARs. For HPC Cluster, there must be only one active LPAR and the
HCA must be Dedicated to it.
15. Ensure that the fabric is balanced across the subnets. The following command string gathers the
GID-prefixes for the ib interfaces. These must be consistent across all LPARs.
For xCAT: xdsh [nodegroup with all nodes]–v 'netstat -i | grep ’ib.*link’ | awk
\’{split($4,a,"."); for (i=5;i<=12;i++){printf a[i]}; printf "\n"}\’’
Verify that the IP MTU is configured properly:
16. Run the following command to list the MTUs:
For xCAT: xdsh [nodegroup with all nodes] –v “find /sys/class/net -name ’ib*’ | xargs -I dn
cat dn/mtu”
17. If the MTU returned
v Matches the expected MTU value, continue with step 19.
v Does not match the expected MTU value, continue with step 18.
18. For each HCA ibX having the wrong MTU, run the command on the respective LPAR: echo <right
value> > /sys/class/net/ibX/mtu
Verify that the network interfaces are recognized as up and available:
19. The following command string must return no interfaces. If an interface is marked down, it returns
the LPAR and ibX interface.
For xCAT: xdsh nodegroup with all nodes] –v '/usr/bin/lsrsrc IBM.NetworkInterface Name
OpState | grep -p"resource" -v "OpState = 1" | grep ib’
High-performance computing clusters using InfiniBand hardware
219
Verify HCAs ends here.
Checking system configuration in Linux
You can check your system configuration with the Linux operating system.
Verifying the availability of processor resources
To verify the availability of processor resources, perform the following steps:
1. Run the following command:
For xCAT: xdsh [nodegroup with all nodes] –v "grep processor /proc/cpuinfo" | wc –l
2. This command must return the total number of processors available in the cluster, if it does not:
a. Verify that all servers are powered on
b. Fix any problems with dsh or xdsh not being able to reach all logical partitions
c. Find out which processors are not available, by first determining which servers do not have the
full number of processors configured:
For xCAT: xdsh [nodegroup with all nodes] –v "grep processor /proc/cpuinfo | wc –l” |
grep –v “[correct number of processors]”
d. When you have narrowed down the problem to particular nodes, run the following command and
determine which processors are missing:
For xCAT: xdsh [nodegroup with nodes with a problem] –v "grep processor /proc/cpuinfo"
e. After you have identified the problem processors, check SFP on the HMC controlling the server
and complete the required service actions. If no serviceable events are found, try any isolation
procedures for unconfigured processors that are found in the System Service Guide.
f. When all processors are available, continue with the procedure to verify memory.
3. If processor deconfiguration persists, call your next level of hardware support.
4. Verify that processors are running at expected frequencies by using the following command:
For xCAT: xdsh [nodegroup with all nodes] –v “egrep 'processor|clock’ /proc/cpuinfo”
Verify processors ends here.
Verifying the availability of memory resources
To verify the availability of memory resources, perform the following steps:
1. Run the following command:
For xCAT: xdsh [nodegroup with all nodes] –v “grep MemTotal /proc/meminfo”
2. If:
v The operating system has access to all memory resources, the system returns you to a command
prompt without returning data. You might exit now.
v Memory requires configuration, check SFP on the HMC controlling the server logical partition and
service as instructed
Note: Before you perform a memory service action, make certain that the memory was not
unconfigured for a specific reason.
3. If no problems are found in SFP, perform any System Service Guide instructions for diagnosing
unconfigured memory.
4. If the memory deconfiguration persists, call your next level of support.
Verify Memory ends here
220
Power Systems: High performance clustering
Checking multicast groups
Use this procedure to check multicast groups for correct membership.
To check multicast groups for correct membership, perform the following procedure:
1. If you are running a host-based Subnet Manager, to check multicast group creation, on the Fabric
Management Server run the following commands. Remember that, for some commands, you must
provide the HCA and port through which the Subnet Manager connects to the subnet.
For IFS 5, use the following steps:
a. Check for multicast membership. At least one group must be returned per InfiniBand subnet:
iba_showmc | egrep "Fabric|GID"
Fabric 1:1 Multicast Information:
GID: 0xff12601bffff0000:0x0000000000000016
GID: 0xff12401bffff0000:0x0000000000000016
Fabric 1:2 Multicast Information:
GID: 0xff12601bffff0000:0x0000000000000016
GID: 0xff12401bffff0000:0x0000000000000016
Fabric 2:1 Multicast Information:
GID: 0xff12601bffff0000:0x0000000000000016
GID: 0xff12401bffff0000:0x0000000000000016
Fabric 2:2 Multicast Information:
GID: 0xff12601bffff0000:0x0000000000000016
GID: 0xff12401bffff0000:0x0000000000000016
b. Check for MTU and link rate. Typically, you use the MTU and rate that are considered to be in
error, because that must return fewer things. Generally, these would return only the fabric
management server HCA links. The following example shows checking for 2 K MTU and SDR
speeds.
iba_reports –o links –F “mtu:2048” # To check for MTU of 2048
iba_reports –o links –F “rate:10g” # To check for SDR speeds
2. If you are running an embedded Subnet Manager, to check multicast group creation, run the
following command on each switch with a master Subnet Manager. If you have set it up, you might
use dsh from the xCAT/MS to the switches. For details, see “Set up remote command processing” on
page 120. For xCAT, remember to use –l admin --devicetype IBSwitch::Qlogic when pointing to the
switches.
for i in [list of SM instances; typically 0 1 2 3];
do /usr/local/util/sm_query –i $i smShowGroups; done
There must be just one group with all the HCA devices on the subnet being part of the group. mtu=5
indicates 4 K. mtu=4 indicates 2 K. The following example shows 4 K MTU.
0xff12401bffff0000:00000000ffffffff (c000)
qKey = 0x00000000 pKey = 0xFFFF mtu = 5 rate = 3 life = 19 sl = 0
0x00025500101a3300 F 0x00025500101a3100 F 0x00025500101a8300 F
0x00025500101a8100 F 0x00025500101a6300 F 0x00025500101a6100 F
0x0002550010194000 F 0x0002550010193e00 F 0x00066a00facade01 F
This procedure ends here.
Diagnosing swapped HCA ports
Use this procedure to diagnose swapped HCA ports.
If you swap ports, it might be inconsequential or it might cause performance problems, depending on
which ports were swapped. An in-depth analysis of whether a swap can cause performance problems is
outside of the scope of this document. However, a rule of thumb applied here is that swapping ports
between subnets is not desirable.
If HCA ports have been swapped, this would be uncovered by the Fast Fabric Health Check when it
compares the latest configuration with the baseline configuration. You must interpret the diff output
between the latest and baseline configuration to see if a port swap has occurred.
High-performance computing clusters using InfiniBand hardware
221
In general, when HCA ports are swapped, they are swapped on the same HCA, or perhaps on HCAs
within the same IBM server. Any more sophisticated swapping would likely be up for debate with
respect to if it is a switch port swap or an HCA port swap, or just a complete reconfiguration.
You must reference the Fast Fabric Toolset Users Guide for details on health checking.
Note: This assumes that a baseline health check has been taken previously; see “Health checking” on
page 157.
1. Run all_analysis
2. Go to /var/opt/iba/analysis/latest (default output directory structure)
3. Look for fabric.X:Y.links.diff or fabric.X:Y.links.changes, where X is the HCA and Y is the HCA port on
the fabric management server that is attached to the subnet. This helps you map directly to the subnet
with the potential issue. Presumably, this is not the same HCA which you are trying to diagnose.
4. If there is no fabric.X:Y.links.diff or fabric.X:Y.links.changes file, there is no port swap. Exit this
procedure.
5. If there is a fabric.X:Y.links.diff or fabric.X:Y.links.changes, there might be a port swap. Continue to the
next step.
6. Use the procedure in “Interpreting health check .changes files” on page 167. If there is no .changes file
and there is a .diff file, use the procedure in“Interpreting health check .diff files” on page 172 and the
procedures in the Fast Fabric Toolset Users Guide to interpret the .diff file.
7. If you intended to swap ports, do the following. Otherwise, go to the next step.
a. You will need to take another baseline so that future health checking will not fail. Use the
procedure in “Re-establishing Health Check baseline” on page 244.
b. Inspect the cable labels. If necessary, change them to reflect the latest configuration.
c. Then, exit this procedure.
8. If you did not intend to swap ports, swap them back, and go back to the beginning of this procedure
to verify that you have been successful in swapping the ports back to their original configuration.
This procedure ends here.
Diagnosing swapped switch ports
Swapping of ports might be inconsequential or it might cause performance problems; it all depends on
which ports get swapped.
An in-depth analysis of whether a swap can cause performance problems is outside of the scope of this
document. However, a rule of thumb applied here is that swapping ports between subnets is not
desirable.
If switch ports have been swapped, this would be uncovered by the Fast Fabric Health Check when it
compares the latest configuration with the baseline configuration. You must interpret the diff output
between the latest and baseline configuration to see if a port swap has occurred.
In general, when switch ports are swapped, they are swapped between ports on the same switch chassis.
Switch ports that appear swapped between switch chassis can be caused by swapping HCA ports on an
HCA or between ports in the same IBM server. Any more sophisticated swapping would likely be up for
debate with respect to if it is a switch port swap or an HCA port swap, or just a complete
reconfiguration.
You must reference the Fast Fabric Toolset Users Guide for details on health check.
1. Run all_analysis
2. Go to /var/opt/iba/analysis/latest (default output directory structure)
222
Power Systems: High performance clustering
3. Look for fabric.X:Y.links.diff or fabric.X:Y.links.changes, where X is the HCA and Y is the HCA port on
the fabric management server that is attached to the subnet. This helps you map directly to the subnet
with the potential issue.
4. If there is no fabric.X:Y.links.diff or fabric.X:Y.links.changesfile, there is no port swap. Exit this procedure.
5. If there is a fabric.X:Y.links.diff or fabric.X:Y.links.changes, there may be a port swap. Continue to the
next step.
6. Use the procedure in “Interpreting health check .changes files” on page 167. If there is no .changes file
and there is a .diff file, use the procedure in“Interpreting health check .diff files” on page 172 and the
procedures in the Fast Fabric Toolset Users Guide to interpret the .diff file.
7. If you intended to swap ports, do the following steps. Otherwise, go to the next step.
a. You must take another baseline so that future health checks will not fail. Use the procedure in
“Re-establishing Health Check baseline” on page 244.
b. Inspect the cable labels. If necessary, change them to reflect the latest configuration.
c. Then, exit this procedure.
8. If you did not intend to swap ports, swap them back, and go back to the beginning of this procedure.
This is to verify that you have been successful in swapping the ports back to their original
configuration.
This procedure ends here.
Diagnosing events reported by the operating system
This section provides information about how to determine if fabric errors have caused errors to be
reported in the server operating system.
When an InfiniBand interface problem is reported, either the interface identifier or an identifier for the
HCA:
v ibX identifies an interface in AIX or Linux; where X is 0 through 7
v ibaX identifies an HCA in AIX; where X is 0 through 3
v ehcaX identifies an HCA in Linux; where X is 0 through 3
If operating system event does not reference an interface or HCA, then, perform the following procedures
for each InfiniBand interface in the server.
The first thing to do is to determine the switch link associated with the operating system event:
1. If the operating system event references an HCA, you must run the next step for both interfaces
associated with that HCA. Typically, the following maps the HCAs to interfaces: iba0/ehca0 = ib0 and
ib1; iba1/ehca1 = ib2 and ib3; iba2/ehca2 = ib4 and ib5; iba3/ehca3 = ib6 and ib7.If you do not know
if the typical mapping was done, use ifconfig to determine the actual mapping.
2. Find the nodeGUID for the HCA interface and the switch link to which the ibX or ehcaX device is
connected by using “Finding devices based on a known ib interface (ibX/ehcaX)” on page 205. For
the switch link, be sure to record the switch IBNodeDescription, leaf, and port number.
To determine if the problem is with a link that is local to the server, you must map the interface or HCA
reported by the operating system to a switch link and look for problems with that link as they are
reported in /var/log/messages on the fabric management server, or by error counter queries (iba_report
or all_analysis or fabric_analysis). Perform the following procedure:
1. Look for link errors reported by health checking as reported in:
/var/opt/iba/analysis/latest/fabric.*.errors
or
/var/opt/iba/analysis/[timestamp]
High-performance computing clusters using InfiniBand hardware
223
, where [timestamp] is a timestamp after the timestamp for the operating system event, and for any
errors found associated with the switch link recorded previously, run the procedure in “Interpreting
error counters” on page 255.
2. Look for link errors reported by the fabric manager in /var/log/messages by searching on the HCA
nodeGUID and the associated switch port information as recorded previously. You might also look on
the xCAT/MS in /tmp/systemEvents if remote event logging has been configured for this cluster. If
any entries are found, use the procedure found in “Interpreting switch vendor log formats” on page
207.
a. Search for the first 7 bytes of the HCA nodeGUID: grep [7 bytes of nodeGUID]
/var/log/messages
b. Search for the switch link: grep “[switch IB Node Description]” /var/log/messages | egrep
“[pP]ort $portnumber” | egrep “[Ll]eaf $leafnumber”
c.
3. Look for current errors by using /sbin/all_analysis, or if created for the local site, a health check
control script like the one found in Example Health Check Scripts, 372. After running the command,
look for /var/opt/iba/analysis/latest/fabric.*.errors, and for any errors found associated with
the switch link recorded previously, run the procedure in “Interpreting error counters” on page 255.
4. Look for a problem with the switch chassis reported around the time of the operating system event.
a. Log on to the xCAT/MS
b. Look for a switch chassis remote event log entry by using the switch IBNodeDescription recorded
previously. If a log entry is found around the time of the operating system event, use the
procedure found in “Interpreting switch vendor log formats” on page 207.
For xCAT: grep [switch IBNodeDescription] /tmp/systemEvents
If the problem is remote from the server, it is much more difficult to link to the interface or HCA
reported by the operating system. Perform the following procedure:
1. Look for any fabric error counters that exceed threshold in /var/opt/iba/analysis/latest/
fabric.*.errors or /var/opt/iba/analysis/[timestamp], where [timestamp] is a timestamp after the
timestamp for the operating system event, and for any errors found associated with the switch link
recorded previously, run the procedure in “Interpreting error counters” on page 255.
2. Look for a pattern of errors that can be traced back to the switch link associated with the operating
system event. Use the technique found in “Interpreting remote errors” on page 260.
3. If no pattern of errors is discernible and there are no local switch link errors that can isolate to a root
cause for the operating system event, call your next level of service.
Diagnosing events reported by the operating system ends here.
Diagnosing performance problems
This is a generic procedure for isolating performance problems.
Performance degradation can result from several different problems, including:
v a hardware failure
v Installation problems
v Configuration issues
Before calling your next level of service, do the following to isolate a performance problem.
The detailed procedure follows:
1. Look for hardware problems by using the procedure in “Checking for hardware problems affecting
the fabric” on page 214.
224
Power Systems: High performance clustering
2. Look for fabric configuration problems by using the procedure in “Checking for fabric configuration
and functional problems” on page 214.
3. Look for configuration problems in the IBM systems:
Check for HCA availability, processor availability, and memory availability.
a. For AIX LPARs, see:
1) “Checking InfiniBand configuration in AIX” on page 215
2) “Checking system configuration in AIX” on page 217
b. For Linux LPARs, see:
1) “Checking InfiniBand configuration in Linux” on page 218
2) “Checking system configuration in Linux” on page 220
4. If performance problems persist, call your next level of support.
This procedure ends here.
Diagnosing and recovering ping problems
If there is a problem pinging between IP Network Interfaces (ibX), it is necessary to check the fabric
configuration parameters and HCA configuration. This test is to ensure that the problem is not caused by
faulty configuration.
Check the IBM Clusters with the InfiniBand Switch web-site referenced in “Cluster information resources” on
page 2, for any known issues or problems that would affect the IP Network Interfaces.
To recover from the problem, complete the following steps:
1. Ensure that the device drivers for the HCAs are at the latest level. This is especially important for any
fixes that would affect IP. Check IBM Clusters with the InfiniBand Switch web-site referenced in “Cluster
information resources” on page 2.
2. Check IBM Clusters with the InfiniBand Switch web-site referenced in “Cluster information resources” on
page 2, for any known issues or problems that would affect the IP Network Interfaces. Make any
required changes.
3. Look for hardware problems by using the procedure in “Checking for hardware problems affecting
the fabric” on page 214.
4. Check the HCA configuration for the interfaces that cannot ping:
v For AIX use: “Checking InfiniBand configuration in AIX” on page 215.
v For Linux use: “Checking InfiniBand configuration in Linux” on page 218.
5. Check for fabric configuration and functional problems by using the procedure in “Checking for fabric
configuration and functional problems” on page 214.
6. Check multicast group membership at the subnet managers by using the procedure in “Checking
multicast groups” on page 221. If there is a problem, re-create the problem interfaces as described in
one of the following procedures:
v For AIX and ibX interfaces: “Recovering ibX interfaces” on page 235.
v For Linux and ehcaX interfaces: “Recovering ehcaX interfaces in Linux” on page 237
7. Reboot LPARs. If this resolves the problem, call your next level of support.
8. Recycle the subnet managers. If this resolves the problem, call your next level of support.
a. Bring down the fabric managers on all Fabric Management Servers:
For IFS 5: /etc/init.d/qlogic_fm stop
Verify that the Subnet Manager is stopped by running: ps –ef|grep iview
b. Restart the fabric managers on all fabric management servers:
For IFS 5: /etc/init.d/qlogic_fm start
High-performance computing clusters using InfiniBand hardware
225
This procedure ends here.
Diagnosing application crashes
Use this procedure to diagnose application crashes.
Diagnosing application crashes with respect to the cluster fabric is similar to diagnosing performance
problems as in “Diagnosing performance problems” on page 224. However, if you know the endpoints
involved in the application crash, you can check the state of the routes between the two points to see if
there might be an issue. You can do this with Fast Fabric command: iba_report -o route -D
<destination> -S <source>
There are many ways to format the destination and route query. Only a few examples are here. The Fast
Fabric Users Guide has more details.
For a particular HCA port to HCA port route query, it is suggested that you use the NodeGUIDs:
iba_report -o route -D nodeguid:<destination NodeGUID> -S nodeguid:<source
NodeGUID>
You can find the node GUIDs by using the procedure in “General mapping of IBM HCA GUIDs to
physical HCAs” on page 197. Instead of doing as instructed and grepping for only the first 7 bytes of a
node GUID, consider recording all 8 bytes. You can use iba_stat –n for HCAs in AIX LPARs and
ibv_devinfo –v for HCAs in Linux LPARs.
If you have a particular LPAR for which you want to determine routes, use a portGUID instead:
iba_report -o route -D portguid:<destination portGUID> -S nodeguid:<port
NodeGUID>
You can find the portGUIDs by using the procedure in “General mapping of IBM HCA GUIDs to
physical HCAs” on page 197. Use ibstat –p for HCAs in AIX LPARs and ibv_devinfo –v for HCAs in
Linux LPARs.
If the preceding procedure for checking routes does not yield a solution, go to “Diagnosing performance
problems” on page 224.
Diagnosing management subsystem problems
These are procedures to debug management subsystem problems. These concentrate on IBM-vendor
management subsystem integration issues. Individual units and applications have their own
troubleshooting guides.
Problem with event management or remote syslogging
Use this procedure to help you determine where to look when expected events are not appearing in logs.
For details on the flow of logs, seeo:
v For xCAT: “Vendor log flow to xCAT event management” on page 23
Note: The term “source” is used in this section to generically see where the log entry must have been
originally logged. This would typically either be a fabric management server (for host-based Subnet
Manager logs) or a switch (for switch chassis logs, or embedded Subnet Manager logs).
If you have a problem with event management or remote syslogging picking up Subnet Manager or
switch events use this procedure. Start with the following table of symptoms:
Symptom
Procedure
xCAT users
226
Power Systems: High performance clustering
Symptom
Procedure
Event is not in the /tmp/systemEvents on the xCAT/MS
“Event not in xCAT/MS:/tmp/systemEvents”
Event is not in /var/log/xcat/syslog.fabric.notices on the
xCAT/MS
“Event not in xCAT/MS:
/var/log/xcat/syslog.fabric.notices” on page 228
Event is not in /var/log/xcat/syslog.fabric.info on the
xCAT/MS
“Event not in xCAT/MS:
/var/log/xcat/syslog.fabric.info” on page 230
Event is not in the log on the fabric management server
“Event not in log on fabric management server” on page
231
Event is not in the log on the switch
“Event not in switch log” on page 232
Event not in xCAT/MS:/tmp/systemEvents:
Use this procedure if an expected event is not in the xCAT/MS log file.
If an expected event is not in the /var/log/xcat/errorlog/[xCAT/MS hostname] file, complete the following
steps:
1. Log on to the xCAT/MS.
2. Start by looking at the log on the device that is logging the problem and make sure that it is there:
a. For the fabric management server, look at the /var/log/messages file.
b. For switches, log on to the switch and look at the log. If necessary use the switch command-line
help, or the switch Users Guide for how to do this.
3. Verify that you can ping the source, which must be either the fabric management server or the switch
service VLAN IP address.
a. If you cannot ping the source device, then use standard network debug techniques to isolate the
problem on the service VLAN. Consider, the xCAT/MS connection, the fabric management server
connection, the switch connection, and any Ethernet devices on the network. Also, ensure that the
addressing has been set up properly.
4. If this is xCAT on AIX, open the file that Event Management is monitoring on the xCAT/MS and look
for the log entry. This is /var/log/xcat/syslog.fabric.notices. If it is not in there, go to “Event not in
xCAT/MS: /var/log/xcat/syslog.fabric.notices” on page 228. If this is xCAT on Linux, go to the next
step.
5. If this is xCAT on Linux, tail the file that Event Management is monitoring on the xCAT/MS and look
for the log entry. This is /var/log/xcat/syslog.fabric.notices. If it is not in there, go to “Event not in
xCAT/MS: /var/log/xcat/syslog.fabric.notices” on page 228. If this is xCAT on Linux, go to the next
step.
Note: The tail yields only results if there was nothing in the /tmp/systemEvents file, and the syslog
daemon had tried to write to:
/var/log/xcat/syslog.fabric.notices
6. Check the event management sensor-condition-response setup. See the xCAT documentation for
InfiniBand support and the man pages for details.
The following table reminds you which sensors, conditions, and responses apply to various xCAT
configurations:
High-performance computing clusters using InfiniBand hardware
227
xCAT Config
Sensor
Condition
Response
xCAT on AIX and
xCAT/MS is not a
managed node
IBSwitchLogSensor
LocalIBSwitchLog
Log event anytime
Email root anytime
(optional)
LogEventToxCATDatabase
(optional)
xCAT on AIX and
xCAT/MS is a managed
node
IBSwitchLogSensor
LocalIBSwitchLog
Log event anytime
Email root anytime
(optional)
LogEventToxCATDatabase
(optional)
xCAT on Linux and
xCAT/MS is not a
managed node
IBSwitchLogSensor
LocalIBSwitchLog
Log event anytime
Email root anytime
(optional)
LogEventToxCATDatabase
(optional)
xCAT on Linux and
xCAT/MS is a managed
node
IBSwitchLogSensor
LocalIBSwitchLog
Log event anytime
Email root anytime
(optional)
LogEventToxCATDatabase
(optional)
a.
Make sure that the sensor is set up with: /usr/bin/lssensor
v Use it without a parameter to see which sensors are set up
v Use it with the required sensor name to see details on where that sensor is being run
v Unless you have chosen to set it up otherwise, it must be sensing /var/log/xcat/syslog.fabric.notices
v If there is a problem with the setup of the sensor recover by using the procedure in
“Reconfiguring xCAT event management” on page 232.
b. Make sure that the condition is set up with: /usr/bin/lscondition
v use it without a parameter to check the state of the various conditions → Monitored or Not
Monitored
v use it with the specific condition as a parameter. The SelectionString tells you which sensor it is
monitoring.
v The condition must be associated with the sensor
c. Make sure that the response is linked to the condition with: /usr/bin/lscondresp
v Use it without a parameter to see the complete list of condition-response combinations
v Use it with a specific condition as a parameter and you would get a list of responses associated
with that condition
v The response and condition must be linked
7. You must restart the RSCT subsystem according to the RSCT Users Guide.
8. If the problem has not been fixed, call your next level of support.
Event not in xCAT/MS: /var/log/xcat/syslog.fabric.notices:
Use this procedure if an expected event is not in the remote syslog file.
228
Power Systems: High performance clustering
If an expected event is not in the remote syslog file for notices on the xCAT/MS (/var/log/xcat/
syslog.fabric.notices), do the following procedure.
Note: This assumes that you are using syslogd for syslogging. If you are using another syslog
application, like syslog-ng, then you must alter this procedure to account for that. However, the
underlying technique for debug remains the same.
1. Log on to the xCAT/MS.
2. Verify that you can ping the source, which must be either the fabric management server or the switch
cluster VLAN IP address.
a. If you cannot ping the source device, then use standard network debug techniques to isolate the
problem on the cluster VLAN. Consider, the xCAT/MS connection, the fabric management server
connection, the switch connection, and any Ethernet devices on the network. Also, ensure that the
addressing has been set up properly.
3. If you are using xCAT on Linux, check the Apparmor configuration with syslog-ng to ensure that "
/var/log/xcat/syslog.fabric.notices wr," is in the /etc/apparmor.d/sbin.syslog-ng file. If it is, continue
to the next step. If it is not perform the following procedure:
a. Add the line "/var/log/xcat/syslog.fabric.notices wr," to the /etc/apparmor.d/sbin.syslog-ng file
before the "}". You must remember the comma at the end of the line.
b. Restart AppArmor by using: /etc/init.d/boot.apparmor restart
c. Restart syslog-ng by using: /etc/init.d/syslog restart
d. If this fixes the problem, end this procedure. Otherwise, go to the next step.
4. Check the syslog configuration file and verify that the following entry is in there. If the xCAT/MS is
running AIX, it is using syslog (not syslog-ng) and the following line must be in /etc/syslog.conf.
Otherwise, after finishing this step, go to step 5.
# all local6 notice and above priorities go to the following file
local6.notice /var/log/xcat/syslog.fabric.notices
5. If the entries are not there, perform the procedure in “Reconfiguring xCAT event management” on
page 232. If this fixes the problem, end this procedure. If the entries are there, go to the next step.
6. Look at the log on the device that is logging the problem and make sure that it is there.
a. For the fabric management server, look at the /var/log/messages file
b. For switches, log on to the switch and look at the log. If necessary use the switch command-line
help, or the switch Users Guide for how to do this.
7. If the setup on the xCAT/MS has proven to be good and the log entry is in the source log, check to
see that the source is set up for remote logging:
a. For a fabric management server running syslog (not syslog-ng), check /etc/syslog/syslog.conf for
the following line. If /etc/syslog.conf does not exist, go to step 7b. Otherwise, after you finish this
step, go to step 8 on page 230.
local6.*
@[put xCAT/MS IPp-address]
Note: Restart the syslogd by using: / etc/init.d/syslog restart
b. For a fabric management server running syslog-ng, check /etc/syslog-ng/syslog-ng.conf for the
following lines. Assure that the destination definition uses the same protocol and port as is
expected on the xCAT/MS; the definition shown here is “udp” on port 514. The xCAT/MS
information must have been noted in step 3. The standard syslogd uses udp.
filter f_fabinfo
{ facility(local6) and level(info, notice, alert, warn,
err, crit) and not filter(f_iptables); };
destination fabinfo_xcat { udp("[xCAT/MS IP-address]" port(514)); };
log { source(src); filter(f_fabinfo); destination(fabinfo_xcat); };
Note: Restart the syslogd by using: / etc/init.d/syslog restart
c. For a switch, check that it is configured to log to the xCAT/MS by using logSyslogConfig on the
switch command line. Check that the following information is correct. If it is not, update it using:
High-performance computing clusters using InfiniBand hardware
229
logSyslogConfig –h [host] –p 514 –f 22 –m 1
v The xCAT/MS is the host IP address
v The port is 514 (or other than that you have chosen to use)
v The facility is local6
8. If the problem persists, then try restarting the syslogd on the xCAT/MS and also resetting the source's
logging:
a. Log on to the xCAT/MS.
b. For AIX xCAT, run refresh -s syslogd
c. For Linux xCAT, run /etc/init.d/syslog restart
d. If the source is Subnet Manger running on a Fabric Management Server, log on to the fabric
management server and run /etc/init.d/syslog restart
e. If the source is a switch, reboot the switch by using the instructions in the Switch Users Guide
(using reboot on the switch CLI), or Fast Fabric Users Guide (using ibtest on the fabric management
server).
9. If the problem has not been fixed, call your next level of support
Event not in xCAT/MS: /var/log/xcat/syslog.fabric.info:
Use this procedure if an expected event is not in the xCAT/MS error log.
If and expected event is not in the remote syslog file (/var/log/xcat/syslog.fabric.info), perform the following
steps:
Note: This assumes that you are using syslogd for syslogging. If you are using another syslog
application, like syslog-ng, then you must alter this procedure to account for that. However, the
underlying technique for debug remains the same.
1. Log on to the xCAT/MS.
2. Verify that you can ping the source, which must be either the fabric management server or the switch
cluster VLAN IP address.
a. If you cannot ping the source device, then use standard network debug techniques to isolate the
problem on the service VLAN. Consider, the xCAT/MS connection, the fabric management server
connection, the switch connection, and any Ethernet devices on the network. Also, ensure that the
addressing has been set up properly.
3. Check the syslog configuration file and verify that the following entry is in there.
a. If the xCAT/MS is using syslog (not syslog-ng), the following line must be in /etc/syslog.conf. If
/etc/syslog.conf does not exist, go to step 3b.
# all local6 info and above priorities go to the following file
local6.info /var/log/xcat/syslog.fabric.info
b. If the xCAT/MS is using syslog-ng, the following lines must be in /etc/syslog-ng/syslog-ng.conf:
filter f_fabinfo
{ facility(local6) and level(notice, alert, warn,
err, crit) and not filter(f_iptables); };
destination fabnotices_fifo { pipe("/var/log/xcat/syslog.fabric.notices"
group(root) perm(0644)); };
log { source(src); filter(f_fabnotices); destination(fabnotices_fifo); };
udp(ip("0.0.0.0") port(514));
tcp(ip("0.0.0.0") port(514));
Note: If the Fabric Management Server is using onlyudp as the transfer protocol for log entries,
then the tcp line is not needed. Step 6 on page 231 Indicates how to check this. In either case,
make note of the protocols and ports and IP addresses in these lines. Using 0.0.0.0 would accept
logs from any address. If you wanted more security, have a line for each switch and fabric
230
Power Systems: High performance clustering
management server from which you want to receive logs. If you have a specific address named,
ensure that the source of the log has an entry with its address. Switches use udp. Fabric
management servers are configurable for tcp or udp.
4. If the entries are not there, complete the following steps:
a. Edit the /etc/syslog.conf (or syslog-ng.conf) file and add it to end of the file.
b. Restart the syslogd. For AIX hosts, run refresh -s syslogd. For Linux hosts, run /etc/init.d/syslog
restart.
5. Look at the log on the device that is logging the problem and make sure that it is there.
a. For the fabric management server, look at the /var/log/messages file
b. For switches, log on to the switch and look at the log. If necessary use the switch command-line
help, or the switch Users Guide for how to do this.
6. If the setup on the xCAT/MS has proven to be good and the log entry is in the source log, check to
see that the source is set up for remote logging by logging on to the source and checking on of the
following steps:
a. For a fabric management server running syslog (not syslog-ng), check /etc/syslog/syslog.conf for
the following line. If /etc/syslog.conf does not exist, go to step 6b.
local6.*
@[put xCAT/MS IPp-address]
Note: If you make a change, you must restart the syslogd.
b. For a fabric management server running syslog-ng, check /etc/syslog-ng/syslog-ng.conf for the
following lines. Assure that the destination definition uses the same protocol and port as is
expected on the xCAT/MS; the definition shown here is “udp” on port 514. The xCAT/MS
information must have been noted in step 3 on page 230. The standard syslogd uses udp. Other
syslogd's, like syslog-ng, might use either tcp or udp.
filter f_fabinfo
{ facility(local6) and level(info, notice, alert, warn,
err, crit) and not filter(f_iptables); };
destination fabinfo_xcat { udp("[xCAT/MS IP-address]" port(514)); };
log { source(src); filter(f_fabinfo); destination(fabinfo_xcat); };
Note: If you make a change, you must restart the syslogd.
c. For a switch, check that it is configured to log to the xCAT/MS by using logSyslogConfig on the
switch command line. Check that the following information is correct:
v xCAT/MS is the host IP address
v The port is 514 (or other than you have chosen to use)
v The facility is 22
v The mode is 1
7. If the problem persists, then try restarting the syslogd on the xCAT/MS and also resetting the source's
logging:
a. Log on to the xCAT/MS.
b. For AIX hosts, run refresh -s syslogd.
c. For Linux hosts, run /etc/init.d/syslog restart.
d. If the source is the Fabric Management Server, use /etc/init.d/syslog restart
e. If the source is a switch, reboot the switch by using the instructions in the Switch Users Guide.
8. If the problem has not been fixed, call your next level of support.
Event not in log on fabric management server:
Use this procedure if an expected log entry is not in the log on the fabric management server.
If the expected log entry is not in the log for the fabric management server (/var/log/messages), perform the
following steps:
High-performance computing clusters using InfiniBand hardware
231
Note: This procedure assumes that you are using syslogd for syslogging. If you are using another syslog
application, like syslog-ng, then you must alter this procedure for that to account. However, the
underlying technique for debugging remains the same.
1. Log on to the fabric management server.
2. Open the /var/log/messages file and look for the expected log entry.
3. If the log entry is in the /var/log/messages file, the problem is not with the log on the fabric
management server.
4. If the log entry is not in the source syslog, then the problem is with the logging subsystem.
a. If you are testing a log entry by using the logger command, or some similar command, check your
syntax and try the command again if it was incorrect.
b. If the source is the fabric management server, check to make sure that the syslogd is running by
using ps.
1) If syslogd is not running, start it using /etc/init.d/syslog start
c. If you are missing Subnet Manager logs, then verify that the fabric manager is running, and start it
if it is not. Use the vendors Fabric Manager Users Guide.
d. If syslogd is running and the Subnet Manager is running and you did not have a problem with
syntax for the logger command, then try restarting syslogd by using /etc/init.d/syslog restart
e. Verify that there is an entry in syslog.conf or syslog-ng.conf that directs logs to
/var/log/messages
f. If the fabric management server is still not logging properly, call your next level of support, or try
troubleshooting techniques documented for syslogd in the operating system documentation.
Event not in switch log:
Use this procedure if an expected event is not in the switch log.
If the expected log entry is not in the switch log, complete the following steps:
1. Log on to the switch and look at the log by using the command in the vendors Switch Users Guide or
found in the command-line help.
2. If you are expecting Subnet Manager log entries in the log, and they are not there, then start the
Subnet Manager. The instructions are provided in the vendors Switch Users Guide or found in the
command-line help.
3. If there is still a problem with logging on a switch, call your next level of support.
Reconfiguring xCAT event management
This procedure is used to reconfigure a xCAT event management environment that has lost its original
configuration.
When a xCAT event management environment loses its configuration, it might be necessary to
unconfigure it and reconfigure it. The procedure to use depends on whether the xCAT is running on the
AIX operating system or the Linux operating system.
Reconfiguring xCAT on the AIX operating system:
To reconfigure xCAT event management on the AIX operating system, complete the following steps.
1. Log on to xCAT/MS
2. Run the lscondresp command to determine which condition and responses you are using. The
typical condition name is either LocalIBSwitchLog for a xCAT/MS. The typical response name is
usually Log event anytime. Email root anytimeor LogEventtoxCATDatabase might also be configured.
Finally, the system administrator might have defined another response to be used specifically at this
site.
3. Stop the condition response by using the following command.
232
Power Systems: High performance clustering
stopcondresp <condition name> <response_name>
4. Delete all the xCAT related entries from the /etc/syslog file. These entries are defined in “Set up
remote logging” on page 112. The commented entry might not exist.
# all local6 notice and above priorities go to the following file
local6.notice /var/log/xcat/syslog.fabric.notices
5. Restart syslogd by using the /etc/init.d/syslog restart command.
6. Set up the IBSwitchLogSensor again by completing the following steps.
a. Copy the old sensor into a new definition file by using the lsrsrc -i -s "Name=
IBSwitchLogSensor" IBM.Sensor > /tmp/IBSwitchLogSensor command.
b. Edit the /tmp/IBSwitchLogSensorDef file.
c. Change the command to "/opt/ xcat/sbin/rmcmon/monaixsyslog -p “local6.notice” -f
/var/log/xcat/syslog.fabric.notices".
d. After creating and editing the /tmp/AIXSyslogSensorDef file, remove the sensor by using the
command.
rmsensor IBSwitchLogSensor
Note: If the sensor did not exist, you can still continue to the next step.
e. Create the sensor and keep the management scope set to local using the following command.
CT_MANAGEMENT_SCOPE=0 mkrsrc –f /tmp/IBSwitchLogSensorDef IBM.Sensor
Note: Local management scope is required or you would get an error indicating that the node
(xCAT/MS) is not in the NodeNameList file.
7. Delete everything in the error monitoring directory by using the /var/opt/xcat_aix_syslog
command.
8. Restart condition response association by using the startcondresp <condition name> <response
name> command.
9. A short time later the file monaixsyslog_run-local6.notice--var-log-xcat-syslog.fabric. notices
is displayed in /var/opt/xcat_err_mon file.
10. Check the /etc/syslog.conf configuration file to ensure that the appropriate entries were added by
the monaixsyslog command. Ensure that there is only one such entry in the configuration file.
local6.notice /var/log/xcat/syslog.fabric.notices
Reconfiguring xCAT on the AIX operating system ends here.
Reconfiguring xCAT on the Linux operating system:
To reconfigure xCAT event management on the Linux operating system, complete the following steps.
1. Log on to the xCAT/MS.
2. Run the lscondresp command to determine which condition and responses you are using. The
typical condition name is either LocalIBSwitchLog for a xCAT/MS. The typical response name is
usually Log event anytime. Email root anytimeor LogEventtoxCATDatabase might also be configured.
Finally, the system administrator might have defined another response to be used specifically at this
site.
3. Stop the condition response by using the following command.
stopcondresp <condition name> <response_name>
4. Delete all the xCAT related entries from /etc/syslog.conf file or the /etc/syslog-ng/syslogng.conf file. These conditions are defined in “Set up remote logging” on page 112. Typically, the
entries look like the following example. However, the monerrorlog parameter uses a different name
from fabnotices_fifo parameter in the destination and log entries. It uses a pseudo-random name
that looks similar to fifonfJGQsBw.
High-performance computing clusters using InfiniBand hardware
233
destination fabnotices_fifo { pipe("/var/log/xcat/syslog.fabric.notices" group(root) perm(0644)); };
log { source(src); filter(f_fabnotices); destination(fabnotices_fifo); };
5. Ensure that the f_fabnotices filter remains in the /etc/syslog-ng/syslog-ng.conf file by using the
following command.
filter f_fabnotices
{ facility(local6) and level(notice, alert, warn, err,
crit) and not filter(f_iptables); };
6. Restart syslogd by using the /etc/init.d/syslog restart command.
7. Set up the ErrorLogSensor again by using the following steps.
a. Copy the old sensor into a new definition file by using the lsrsrc -i -s "Name=
’IBSwitchLogSensor’" IBM.Sensor > /tmp/IBSwitchLogSensorDef command.
b. Edit the /tmp/IBSwitchLogSensorDef file.
c. Change the command to "/opt/xcat/sbin/rmcmon/monerrorlog -p f_fabnotices -f
/var/log/xcat/syslog.fabric.notices".
d. After creating and editing the /tmp/ErrorLogSensorDef file, you can remove the sensor by using
the following command.
rmsensor IBSwitchLogSensor
Note: If the sensor did not exist, you can still continue to the next step.
e. Create the ErrorLogSensor and keep the management scope local using the following command.
CT_MANAGEMENT_SCOPE=0 mkrsrc –f /tmp/IBSwitchLogSensorDef IBM.Sensor
Note: Local management scope is required or you would get an error indicating that the node
(xCAT/MS) is not in the NodeNameList file.
f. Run the following command.
/opt/xcat/sbin/rmcmon/monerrorlog -f "/var/log/xcat/syslog.fabric.notices" -p "f_fabnotices"
Note: Notice that the –p parameter points to the f_fabnotices entry that was defined in
/etc/syslog-ng/syslog-ng.conf
g. If you get an error back from monerrorlog indicating a problem with syslog, then a typing error
is probably in the /etc/syslog-ng/syslog-ng.conf file. The message would have a form similar
to the one shown in the following example. The key is that “syslog” is in the error message
screen. The * is a wildcard.
monerrorlog: * syslog *
1) Look for the mistake in the /etc/syslog-ng/syslog-ng.conf file by reviewing the previous
steps that you have taken to edit the syslog-ng.conf file.
8.
9.
10.
11.
12.
2) Remove the destination and log lines from the end of syslog-ng.conf entry.
3) Rerun the /opt/xcat/sbin/rmcmon/monerrorlog -f "/var/log/xcat/syslog.fabric.notices"
-p "f_fabnotices" command.
4) If you get another error, examine the file again and repeat the recovery procedures.
Delete everything in the error monitoring directory /var/opt/xcat_err_mon.
Edit the AppArmor setup file for syslog-ng by using the/etc/apparmor.d/sbin.syslog-ng command.
Ensure that "/var/log/xcat/syslog.fabric.notices wr," is in the file before the "}". You must
remember the comma at the end of the line.
If you changed sbin.syslog-ng, restart apparmor by using the /etc/init.d/boot.apparmor restart
command.
Restart condition response association by using the startcondresp <condition name> <response
name> command.
13. A short time later the following file is displayed in the /var/opt/xcat_err_mon file.
.monerrorlog_run-f_fabnotices--var-log-xcat-syslog.fabric. notices
234
Power Systems: High performance clustering
14. Check the /etc/syslog-ng/syslog-ng.conf configuration file to ensure that the appropriate entries
were added by monerrorlog. Typically, the entries look similar to the following example. However,
monerrorlog uses a different name from fabnotices_fifo in the destination and log entries. It uses a
pseudo-random name that looks similar to fifonfJGQsBw.
destination fabnotices_fifo { pipe("/var/log/xcat/syslog.fabric.notices" group(root) perm(0644)); };
log { source(src); filter(f_fabnotices); destination(fabnotices_fifo); };
Reconfiguring xCAT on the Linux operating system ends here,
Recovering from an HCA preventing a logical partition from activating
Use this procedure to recover a logical partition when a failed host channel adapter (HCA) is preventing
the partition from activating.
During initial program load (IPL), a logical partition can be prevented from activating because an HCA
has failed. To unassign HCAs from partition profiles, complete the following steps on the Hardware
Management Console (HMC):
1.
2.
3.
4.
5.
Go to the Server and Partition window.
Click the Server Management partition.
Expand the server in which the HCA is installed.
Expand the partitions under the server.
Complete the following steps for each partition profile that uses the HCA. If you do not know that
which partitions use the HCA, you must perform the following steps for each partition profile.
a. Select each partition profile that uses the HCA.
b. From the menu, click Selected → Properties.
c. In the Properties dialog, click the HCA tab.
d. Using its physical location, find the HCA of interest.
e. Highlight the HCA of interest and then click the Clear. The HCA GUID Index, GUID, and
Capability fields change to Unassigned. Then click OK.
Note: A failing HCA can be unassigned from the logical partition profile while the logical
partition is active, hung, or inactive. If the logical partition is currently active, the logical partition
must be shut down and then activated for this update to take effect. If you are deferring
maintenance on an HCA, do not reactivate the logical partition. By changing the defective HCA to
Unassigned in the partition profile, you ensure that the next activation is not prevented by a
failing HCA.
This procedure ends here.
Recovering ibX interfaces
There are several levels at which you can recover ibX interfaces. ibX are the interfaces to the host channel
adapter (HCA) by using the AIX operating system.
You can recover a single ibX interface or all of the ibX interfaces by using the following procedures.
v “Recovering a single ibX interface in AIX”
v “Recovering all of the ibX interfaces in an LPAR in the AIX” on page 236
Before performing any of the preceding procedures, check if you have GPFS.
Recovering a single ibX interface in AIX
This procedure is used to recover a single ibX interface when using the AIX operating system.
To recover a single ibX interface, run the ifconfig [ib interface] up command.
High-performance computing clusters using InfiniBand hardware
235
If the ifconfig [ib interface] up command does not recover the ibX interface, you must completely remove
and rebuild the interface by using the following command:
rmdev –l [ibX]
chdev –l [ibX] -a superpacket=on –a state=up -a tcp_sendspace=524288 -a
tcp_recvspace=524288 –a srq_size=16000
mkdev –l [ibX]
Recovering all of the ibX interfaces in an LPAR in the AIX
If you must recover all of the ibX interfaces in a server, it is probable that you must remove the interfaces
and rebuild them.
Before using this procedure, try to recover the ibX interface by using the procedure in “Recovering a
single ibX interface in AIX” on page 235.
The following commands can be run individually, but the following example uses loops on the command
line. The procedure must be modified based on the number of ibX interfaces in the server. The following
procedure is an example for a server with eight ib interfaces.
# get original set of ibX interfaces
a=`lsdev | grep InfiniBand | awk ’{print $1}’ | egrep -v "iba|icm”`
# remove the ibX interfaces
for i in `lsdev | grep Infiniband | awk ’{print $1}’ | egrep -v "iba|icm"`
do
# rmdev is only used for recovery purposes, and not during installation
rmdev -l $i -d
done
# remove the iba(s)
for I in `lsdev | egrep “iba[0-9]” | awk ’{print $1}’`
do
rmdev –l $i –d
done
# remove the icm
rmdev –l icm -d
# map the ib interfaces to iba(s) and addresses
ib0=iba0; ib1=iba0
ib2=iba1; ib3=iba1
ib4=iba2; ib5=iba2
ib6=iba3; ib7=iba4
# addresses are just examples
ib0addr=192.168.1.1; ib1addr=192.168.2.1
ib2addr=192.168.3.1; ib3addr=192.168.4.1
ib4addr=192.168.5.1; ib5addr=192.168.6.1
ib6addr=192.168.7.1; ib7addr=192.168.8.1
cfgmgr
# re-create the icm
mkdev -c management -s infiniband -t icm
# re-make the iba(s) – this loop really just indicates to step through
# all of the iba(s) and indicate the appropriate ibXs for each
# There should be two ibX interfaces for each iba.
for i in $a
do
eval “iba=\$${i}”
eval “ib_addr=\$${i}addr”
# you must provide the ibX interface number (ib0-7) and address
# for each ibX interface separately.
236
Power Systems: High performance clustering
mkiba –A $iba –i $i –a $ib_addr –p 1 –P 1 –S up –m 255.255.255.0
done
# Re-create the ibX interfaces properly
# This assumes that the default p_key (0xffff) is being used for
# the subnet
for i in `lsdev | grep Infiniband | awk ’{print $1}’ | egrep -v "iba|icm"`
do
chdev -l $i -a superpacket=on –a tcp_recvspace=524288 –a
tcp_sendspace=524288 –a srq_size=16000 -a state=up
done
Recovering an ibX interface tcp_sendspace and tcp_recvspace
Perform the following to recover the tcp_sendspace and tcp_recvspace attributes for an ibX interface.
Setting the ibX interface to superpacket=on accomplishes this as well. Setting the interface to
superpacket=on would not work if the interface had previously been set to superpacket=on and the
tcp_sendpace or tcp_recvspace attribute values have been changed. Use the following command to set the
tcp_sendpace or tcp_recvspace attribute values.
# ibX = ib0, ib1, ib2, ib3, ib4, ib5, ib6 or ib7
chdev –l ibX –a tcp_sendspace=524288 –a tcp_recvspace=524288
Recovering ml0 in AIX
This procedure provides the commands required to recover mI0 when using the AIX operating system.
To recover the ml0 interface in AIX, remove and rebuild it using the following command.
rmdev -l ml0 –d
cfgmgr
# $ml0ip = the ip address of ml0 in this LPAR
chdev -l ml0 -a netaddr=$ml0ip -a netmask=255.255.255.0 -a state=up
Recovering icm in AIX
This information provides direction to recover icm when using the AIX operating system.
Recovering the icm in the AIX operating system involves removing all InfiniBand interfaces and then
rebuilding them along with the icm. This procedure is shown in “Recovering all of the ibX interfaces in
an LPAR in the AIX” on page 236.
Recovering ehcaX interfaces in Linux
There are several levels at which you can recover ehcaX interfaces, which are the interfaces to the host
channel adapter (HCA) in the Linux operating system.
You can recover a single ehcaX interface or all of the ehcaX interfaces by using the following procedures:
1. “Recovering a single ibX interface in Linux”
2. “Recovering all of the ibX interfaces in an LPAR in the Linux” on page 238
Recovering a single ibX interface in Linux
This procedure is used to recover a single ibX interface when using the Linux operating system.
To recover a single ibX interface in the Linux operating system, perform the following procedure:
1. To recover a single ibX interface, first try to take down the interface and then bring it back up using
the following commands.
a. ifconnfig ibX down
b. ifconfig ibX up
High-performance computing clusters using InfiniBand hardware
237
2. If these commands do not recover the ibX interface, check for any error messages in the dmesg resp
attribute in the /var/log/messages file. And perform the appropriate service associated with the error
messages.
3. If the problem persists, contact your next level of support.
Recovering all of the ibX interfaces in an LPAR in the Linux
Use this procedure to recover all of the ibX interfaces in a logical partition in the Linux operating system.
To recover all of the ibX interfaces in a Linux partition, complete the following steps:
1. Run the /etc/init.d/openibd restartcommand
Note: This stops all devices, remove all OFED modules and reload them.
2. Verify that the interfaces are up and running by using theifconfig | grep ib command.
3. If the interfaces are not started yet, run the /etc/init.d/network restartcommand to power on the
network of ibX interfaces.
Recovering to 4K maximum transfer units in the AIX
Use this procedure if your cluster is running with 4 KB maximum transfer units (MTUs), but it has
already been installed and is not currently running at 4K MTU. This procedure is only valid for clusters
by using the AIX operating system.
To
1.
2.
3.
complete the recovery to 4K MTU, the following overall tasks must be completed:
Configure the Subnet Manager to 4K MTU
Set the host channel adapter (HCAs) to 4K MTU
Verify that the subnet is set up properly
The detailed procedures for these tasks are given in the following section:
1. Configure the Subnet Manager for 4K MTU.
If you are running a host-based Subnet Manager, complete the following steps.
Note: These instructions are written for recovering a single fabric management server subnet at a
time.
a. Log on to the fabric management server.
b. Stop the Subnet Manager by using the following command:
For IFS 5: /etc/init.d/qlogic_fm stop
c. Verify that the Subnet Manager is stopped by running the ps –ef|grep iviewcommand.
d. If you are using IFS 5, edit the fabric manager configuration file (/etc/sysconfig/qlogic_fm.xml)
and, as needed, update the lines defining <MTU> to 4096. Update all Subnet Manager instances
which must be configured for 4K MTU. This might be done in the common SM definition section
under <MulticastGroup>. The following example of a single Subnet Manager instance in the
configuration file. Do the same for the rate and ensure that it matches what was planned in
“Planning maximum transfer unit (MTU)” on page 51, where 10g = SDR and 20g = DDR.
<!-- Common SM (Subnet Manager) attributes -->
<Sm>
. . .
<Multicast>
. . .
<MulticastGroup>
. . .
<MTU>4096</MTU>
<Rate>20g</Rate>
<!— or 10g . . .
</MulticastGroup>
238
Power Systems: High performance clustering
. . .
</Multicast>
. . .
</Sm>
e. Start the Subnet Manager by using the following command:
For IFS 5: /etc/init.d/qlogic_fm start
If you are running an embedded Subnet Manager, complete the following steps:
Note: These instructions are written for recovering a single subnet at a time.
Log on to the switch command-line interface (CLI), or issue these commands from the fabric
management server by using cmdall, or from the xCAT/MS by using xdsh. If you use xdsh, use the
parameter, –l admin --devicetype IBSwitch::Qlogic, as outlined in “Remotely accessing QLogic
switches from the xCAT/MS” on page 175
a. Stop the Subnet Manager by using the following command.
For IFS 5: /etc/init.d/qlogic_fm stop
b. Set up the broadcast or multicast group MTU by using the smDefBcGroup 0xffff 5 command.
c. Enable the broadcast or multicast group by using the smDefBcGroup enable command.
d. Start the Subnet Manager by using the following command.
For IFS 5: /etc/init.d/qlogic_fm start
2. If your server is running the AIX operating system, you must do the following to properly set up for
4K MTU. To determine if you must be using 4K MTU, see “Planning maximum transfer unit (MTU)”
on page 51 and the “QLogic and IBM switch planning worksheets” on page 83. To set up the 4K
MTU, complete the following steps:
a. Do not proceed to do a mkiba until you have properly set up your Subnet Managers for 4K MTU.
For host-based Subnet Managers, see “Installing the fabric management server” on page 105. For
embedded Subnet Managers, see “Installing and configuring vendor or IBM InfiniBand switches”
on page 137.
b. If you had previously defined the HCA devices, remove them using the following command:
for i in `lsdev | grep Infiniband | awk ’{print $1}’`
do
rmdev -l $i -d
done
Note: The preceding command removes all of the HCA devices. To remove a specific device
(such as, ib0) use the rmdev –l ib0 –d command, where x = the HCA device number.
c. Run the cfgmgr command.
d. Run the mkdev command for the icm.
e. Run the mkiba command for the devices.
f. After the HCA device driver is installed and the mkiba command is done, run the following
commands to set the device MTU to 4K and turn enable super-packets
for i in `lsdev | grep Infiniband | awk ’{print $1}’ | egrep -v "iba|icm"`
do
chdev -l $i -a superpacket=on –a tcp_recvspace=524288
–a tcp_sendspace=524288 –a srq_size=16000 -a state=up
done
Note: The preceding command modifies all of the HCA devices. To modify a specific device (such
as, ib0) use a command similar to the following example.
chdev -l ib0 --a superpacket=on –a tcp_recvspace=524288
–a tcp_sendspace=524288 –a srq_size=16000 -a state=up
3. Verify the configuration by using the following steps:
a. Verify that the device is set so that superpackets are on:
High-performance computing clusters using InfiniBand hardware
239
for i in `lsdev | grep Infiniband | awk ’{print $1}’ | egrep -v "iba|icm"`
do
echo $i
lsattr -El $i | egrep " super"
done
Note: To verify a single device (such as, ib0), use the lsattr - El ib0 | egrep "mtu|super"
command. The MTU must return 65532.
b. Now you can check the interfaces for the HCA devices (ibx) and ml0 by using the following
command:
netstat -in | grep -v link | awk ’{print $1,$2}’
The results must look like the following example, where the MTU value is in the second column:
Name Mtu
en2 1500
ib0 65532
ib1 65532
ib2 65532
ib3 65532
ib4* 65532
ib5 65532
ib6 65532
ib7 65532
ml0 65532
lo0 16896
lo0 16896
c. If you are running a host-based Subnet Manager, to check multicast group creation, on the fabric
management server run the following command.
For IFS 5, use the following steps:
1) Check for multicast membership. At least one group must be returned per InfiniBand subnet:
iba_showmc | egrep "Fabric|GID"
Fabric 1:1 Multicast Information:
GID: 0xff12601bffff0000:0x0000000000000016
GID: 0xff12401bffff0000:0x0000000000000016
Fabric 1:2 Multicast Information:
GID: 0xff12601bffff0000:0x0000000000000016
GID: 0xff12401bffff0000:0x0000000000000016
Fabric 2:1 Multicast Information:
GID: 0xff12601bffff0000:0x0000000000000016
GID: 0xff12401bffff0000:0x0000000000000016
Fabric 2:2 Multicast Information:
GID: 0xff12601bffff0000:0x0000000000000016
GID: 0xff12401bffff0000:0x0000000000000016
2) Check for MTU and link rate. Typically, you use the MTU and rate that are considered to be in
error, because that must return fewer things. Generally, these returns only the fabric
management server HCA links. The following example shows checking for 2K MTU and SDR
speeds.
iba_reports –o links –F “mtu:2048” # To check for MTU of 2048
iba_reports –o links –F “rate:10g” # To check for SDR speeds
d. d. If you are running an embedded Subnet Manager, to check multicast group creation, run the
following command on each switch with a master Subnet Manager. If you have set it up, you
might use dsh from the xdsh from the xCAT/MS to the switches (see “Set up remote command
processing” on page 120). If you use xdsh, use the parameters: -l admin --devicetype
IBSwitch::Qlogic, as outlined in “Remotely accessing QLogic switches from the xCAT/MS” on
page 175.
for i in [list of SM instances; typically 0 1 2 3]; do
/usr/local/iview/util/sm_query –i $i smShowGroups; done
There must be just one group with all the HCA devices on the subnet being part of the group.
mtu=5 indicates 4K. mtu=4 indicates 2K.
240
Power Systems: High performance clustering
0xff12401bffff0000:00000000ffffffff (c000)
qKey = 0x00000000 pKey = 0xFFFF mtu = 5 rate = 3 life = 19 sl = 0
0x00025500101a3300 F 0x00025500101a3100 F 0x00025500101a8300 F
0x00025500101a8100 F 0x00025500101a6300 F 0x00025500101a6100 F
0x0002550010194000 F 0x0002550010193e00 F 0x00066a00facade01 F
Recovering to 4K maximum transfer units in the Linux
Use this procedure if your cluster must be running with 4K maximum transfer units (MTUs), but it has
already been installed and is not currently running at 4K MTU. This is only valid for clusters by using
the Linux operating system.
To
1.
2.
3.
complete the recovery to 4K MTU, the following overall tasks must be completed.
Configure the Subnet Manager to 4K MTU
Set the host channel adapter (HCAs) to 4K MTU
Verify that the subnet is set up properly
The detailed procedures for these tasks are provided in the following section.
1. Configure the Subnet Manager for 4K MTU.
If you are running a host-based Subnet Manager, complete the following steps:
Note: These instructions are written for recovering a single fabric management server subnet at a
time.
a. Log on to the fabric management server.
b. Stop the Subnet Manager by using the following command:
For IFS 5: /etc/init.d/qlogic_fm stop
c. Verify that the Subnet Manager is stopped by running the ps –ef|grep iview command.
d. If you are using IFS 5, edit the fabric manager configuration file (/etc/sysconfig/qlogic_fm.xml)
and, as needed, update the lines defining <MTU> to 4096. Update all Subnet Manager instances
which must be configured for 4K MTU. This might be done in the common SM definition section
under <MulticastGroup>. The following example of a single Subnet Manager instance in the
configuration file. Do the same for the rate and ensure that it matches what was planned in
“Planning maximum transfer unit (MTU)” on page 51, where 10g = SDR and 20g = DDR.
<!-- Common SM (Subnet Manager) attributes -->
<Sm>
. . .
<Multicast>
. . .
<MulticastGroup>
. . .
<MTU>4096</MTU>
<Rate>20g</Rate>
<!— or 10g . . .
</MulticastGroup>
. . .
</Multicast>
. . .
</Sm>
e. Start the Subnet Manager:
For IFS 5: /etc/init.d/qlogic_fm start
If you are running an embedded Subnet Manager, complete the following steps:
Note: Instructions are written for recovering a single subnet at a time.
High-performance computing clusters using InfiniBand hardware
241
Log on to the switch CLI, or issue these commands from the Fabric Management Server by using
cmdall, or from the xCAT/MS by using xdsh. If you use xdsh, use the parameters, -l admin
--devicetype IBSwitch::Qlogic, as outlined in “Remotely accessing QLogic switches from the
xCAT/MS” on page 175.
1) Stop the Subnet Manager by using the smControl stop command.
2) Set up the broadcast or multicast group MTU by using the smDefBcGroup 0xffff 5 command.
3) Enable the broadcast or multicast group by using the smDefBcGroup enable command.
4) Start the Subnet Manager by using the smControl start.
2. If your server is running the Linux operating system, you must do the following to properly set up
for 4K MTU. To determine if you must use 4K MTU, see “Planning maximum transfer unit (MTU)”
on page 51, and the “QLogic and IBM switch planning worksheets” on page 83.
a. Do not proceed to do a mkiba until you have properly setup your Subnet Managers for 4K MTU.
For host-based Subnet Managers, see “Installing the fabric management server” on page 105. For
embedded Subnet Managers, see “Installing and configuring vendor or IBM InfiniBand switches”
on page 137.
b. Set up the /etc/sysconfig/network/ifcfg-ibX configuration files for each ib interface such that
the MTU='4096'
A server with two ib interfaces (ib0 and ib1) can have files similar to the following example.
[root on c697f1sq01][/etc/sysconfig/network] => cat ifcfg-ib0
BOOTPROTO=’static’
BROADCAST=’10.0.1.255’
IPADDR=’10.0.1.1’
MTU=’4096’
NETMASK=’255.255.255.0’
NETWORK=’10.0.1.0’
REMOTE_IPADDR=’’
STARTMODE=’onboot’
[root on c697f1sq01][/etc/sysconfig/network] => cat ifcfg-ib1
BOOTPROTO=’static’
BROADCAST=’10.0.2.255’
IPADDR=’10.0.2.1’
MTU=’4096’
NETMASK=’255.255.255.0’
NETWORK=’10.0.2.0’
REMOTE_IPADDR=’’
STARTMODE=’onboot’
c. Restart the server.
3. Verify the configuration
a. Verify that the device is set so that superpackets are on:
for i in `lsdev | grep Infiniband | awk ’{print $1}’ | egrep -v "iba|icm"`
do
echo $i
lsattr -El $i | egrep " super"
done
Note: To verify a single device (like ib0), use lsattr -El ib0 | egrep "mtu|super" command.
The MTU must return 65532.
b. Now you can check the interfaces for the HCA devices (ibx) and ml0 by using the following
command.
netstat -in | grep -v link | awk ’{print $1,$2}’
The results must look like the following example, where the MTU value is in the second column:
Name Mtu
en2 1500
ib0 65532
ib1 65532
242
Power Systems: High performance clustering
ib2 65532
ib3 65532
ib4* 65532
ib5 65532
ib6 65532
ib7 65532
ml0 65532
lo0 16896
lo0 16896
c.
If you are running a host-based Subnet Manager, to check multicast group creation, on the fabric
management server run the following commands.
For IFS 5, use the following setps:
1) Check for multicast membership. At least one group must be returned per InfiniBand subnet:
iba_showmc | egrep "Fabric|GID"
Fabric 1:1 Multicast Information:
GID: 0xff12601bffff0000:0x0000000000000016
GID: 0xff12401bffff0000:0x0000000000000016
Fabric 1:2 Multicast Information:
GID: 0xff12601bffff0000:0x0000000000000016
GID: 0xff12401bffff0000:0x0000000000000016
Fabric 2:1 Multicast Information:
GID: 0xff12601bffff0000:0x0000000000000016
GID: 0xff12401bffff0000:0x0000000000000016
Fabric 2:2 Multicast Information:
GID: 0xff12601bffff0000:0x0000000000000016
GID: 0xff12401bffff0000:0x0000000000000016
2) Check for MTU and link rate. Typically, you use the MTU and rate that are considered to be in
error, because that must return fewer things. Generally, these would return only the fabric
management server HCA links. The following example shows checking for 2K MTU and SDR
speeds.
iba_reports –o links –F “mtu:2048” # To check for MTU of 2048
iba_reports –o links –F “rate:10g” # To check for SDR speeds
d. If you are running an embedded Subnet Manager, to check multicast group creation, run the
following command on each switch with a master Subnet Manager. If you have set it up, use xdsh
from the xCAT/MS to the switches (see “Set up remote command processing” on page 120.
for i in [list of SM instances; typically 0 1 2 3]; do
/usr/local/util/sm_query –i $i smShowGroups; done
There must be just one group with all the HCA devices on the subnet being part of the group.
mtu=5 indicates 4K. mtu=4 indicates 2K.
0xff12401bffff0000:00000000ffffffff (c000)
qKey = 0x00000000 pKey = 0xFFFF mtu = 5 rate = 3 life = 19 sl = 0
0x00025500101a3300 F 0x00025500101a3100 F 0x00025500101a8300 F
0x00025500101a8100 F 0x00025500101a6300 F 0x00025500101a6100 F
0x0002550010194000 F 0x0002550010193e00 F 0x00066a00facade01 F
Recovering the original master SM
To revert to the original master and recover the original master SM.
To revert to the original master after a backup has taken over and assumed its elevated priority as its
current priority, log on to the current master Fabric Management Server and use the following command:
/usr/local/iview/util/sm_diag -i [instance of SM] smRestorePriority
The [instance of SM] is a number from 0 to 3. This must be the instance of the SM on the Fabric
Management Server which is now acting as master, but is normally the backup. In many cases, you must
restore the priority of multiple SMs on the same Fabric Management Server. In such cases, you must run
the command for each separate instance.
High-performance computing clusters using InfiniBand hardware
243
In many cases, it is acceptable to loop through all instances of the subnet manager on all fabric
management servers to ensure that they are running under the original priority. Assuming you have four
subnet managers running on a fabric management server, you would use the following command-line
loop:
for i in 0 1 2 3; do /usr/local/iview/util/sm_diag -i $i smRestorePriority; done
Re-establishing Health Check baseline
After changing the fabric configuration in any way, use this procedure to reestablish a health check
baseline.
The following activities are examples of ways in which the fabric configuration might be changed:
v Repairing a faulty leaf-board, which leads to a new serial number for that component.
v Updating switch firmware or the Subnet Manager.
v Changing time zones in a switch.
v Adding or deleting a new device or link to a fabric.
v A link fails and its devices are removed from the Subnet Manager database.
To reestablish the health check baseline, complete the following steps.
1. Ensure that you have fixed all problems with the fabric, including inadvertent configuration changes
before proceeding.
2. Verify that the fabric configured is as expected. The simplest way to do this is to run fabric_info.
This returns information for each subnet to which the fabric management server is connected. The
following example is an output for a single subnet. The comments are not part of the output. They are
only included to help understand the output better.
SM: c999f4nm02 HCA-2 Guid: 0x0008f104039908e5 State: Master
Number of CAs: 53
# one for each HCA port; including the Fabric/MS
Number of CA Ports: 53 # same as number of CAs
Number of Switch Chips: 76 # one per IBM GX HCA port + one per switch leaf + two per switch spine
Number of Links: 249 # one per HCA port + 12 per leaf
Number of 1x Ports: 0
3. Save the old baseline. This might be required for future debugging. The old baseline is a group of
files in the /var/opt/iba/analysis/baseline file.
4. Run the all_analysis –b command.
5. Check the new output files in the /var/opt/iba/analysis/baseline file to verify that the
configuration is as you expect it. See the Fast Fabric Toolset Users Guide for more details.
Verifying link FRU replacements
This procedure is used to verify link field replaceable unit (FRU) replacements.
This procedure relies on you having recorded the light emitting diode (LED) states before the fix.
Note: Proceed only if you have replaced a link FRU.
1. Check the LEDs at each end of the cable.
2. If the LEDs are not lit, the problem is not fixed. Return to the fault isolation procedure that sent you
here. Otherwise, proceed to the next step.
3. If the LEDs are not lit before replacing the cable and they are now lit, the problem is fixed. Return to
the fault isolation procedure that sent you here. Otherwise, proceed to the next step.
4. Log on to the fabric management server, or have the customer log on and perform the remaining
steps.
5. Run the /sbin/iba_report –o errors –C command to check and clear the error counters.
6. Wait several minutes to allow new errors to accumulate.
244
Power Systems: High performance clustering
7. Run the /sbin/iba_report –o errors command again.
8. If the link reports errors, the problem is not fixed. Otherwise, the problem is fixed.
This procedure ends here. Return to the fault isolation procedure that sent you here
Verifying repairs and configuration changes
Use this procedure to verify repairs and configurations changes that have taken place with your cluster.
After a repair or configuration change has been made, it is good practice to verify that:
1. A repair has fixed the problem and that no other faults have been introduced as a result of the repair.
2. A configuration change has not resulted in any faults or inadvertent configuration changes.
It is important to understand that configuration changes include any change that results in different
connectivity, fabric management code levels, part numbers, serial numbers, and any other such changes.
See the Fast Fabric Toolset Users Guide for the types of configuration information that is checked during
health checking.
To verify repairs and configuration changes, complete the following procedure.
Note: As devices come online, there would be appearance Notices from the Subnet Manager or
Managers. You can count the number of devices and ensure that the count corresponds to the appropriate
number of devices that you have in the IBM systems that has been restarted. For more information, see
“Counting devices” on page 248. The devices might come up over several scans of the fabric by the
Subnet Managers, so you must add up the appearance counts over several log entries. However, the
following health checking procedure checks for any missing devices.
1. Check light emitting diodes (LEDs) on the device ports and any port connected to the device. See the
System Users Guide and the Switch Users Guide for information about LED states. If a problem is found,
see the “Table of symptoms” on page 187.
2. Run the /sbin/iba_report –C –o none command to clear error counters on the fabric ports before
doing a health check on the current state. Otherwise, there would be errors caused by the restart.
3. If possible, wait approximately 10 minutes before you can run health check to look for errors and
compare against the baseline configuration. The wait period is to allow for error accumulation.
Otherwise, run the health check now to check for configuration changes, which includes any nodes
that have fallen off the switch.
a. Run the all_analysis command. For more information, see “Health checking” on page 157 and the
Fast Fabric Toolset Users Guide.
b. Look for configuration changes and fix any that you find. For more information, see “Finding and
interpreting configuration changes” on page 180. You might see new part numbers, serial
numbers, and GUIDs for repaired devices. Fan trays do not have electronic VPD, and thus would
not indicate these types of changes in configuration.
c. Look for errors and fix any that you find. For more information, see the “Table of symptoms” on
page 187.
4. If you did not wait 10 minutes before running the health check, rerun it after about 10 minutes to
check for errors.
a. Run the all_analysis command, or the all_analysis -e command. For more information, see “Health
checking” on page 157 and the Fast Fabric Toolset Users Guide.
b. Look for errors and fix any that you find. For more information, see the “Table of symptoms” on
page 187.
c. If you did not use the –e parameter, look for configuration changes and fix any unexpected ones
that you find. For more information, see “Finding and interpreting configuration changes” on page
180. Expected configuration changes are those that relate to repaired devices or intended
configuration changes.
High-performance computing clusters using InfiniBand hardware
245
5. If any problems were found, fix them and restart this procedure. Continue to fix them and restart this
procedure until you are satisfied that a repair is successful. Or continue to fix them and restart this
procedure till a configuration change has been successful, and that neither has resulted in unexpected
configuration changes.
6. If there were expected configuration changes, perform the procedure in “Re-establishing Health Check
baseline” on page 244.
This procedure ends here.
Restarting the cluster
Use this procedure if you have performed maintenance that requires a restart of the entire cluster.
If you are performing maintenance that requires you to restart an entire cluster, the following items must
be considered.
Note: When all analysis is referenced, if you have created a script to run all_analysis, substitute that in
the procedure. For an example of such a script, see “Healthcheck control script” on page 277. When you
are asked to clear errors, you might want to use a script like that described in “Error counter clearing
script” on page 276.
1. Ensure that you have a baseline health check that can be used to check against when the cluster is
operational again.
2. Consider disabling the Subnet Managers before proceeding with the restarts. This prevents new log
entries caused by the restart process. While it also suppresses real problems, those would be
uncovered in the subsequent health check-in step 7.
3. Restart the cluster, but make sure the LPARs stop at LPAR standby mode.
4. When the IBM systems are at LPAR standby mode, restart the Subnet Managers.
a. As devices come back online, there would be appearance Notices from the Subnet Managers. You
can count the number of devices and make sure that the count corresponds to the appropriate
number of devices that you have in the IBM systems that has been restarted. For more
information, see “Counting devices” on page 248. Keep in mind that the devices might come up
over several scans of the fabric by the Subnet Managers, so add up the appearance counts over
several log entries. However, the following health check takes care of checking for any missing
devices.
5. Run the /sbin/iba_report –C –o none command to clear error counters on the fabric ports before
doing a health check on the current state. Otherwise, the restart would cause errors.
6. Continue to restart the IBM systems through the operating system load.
7. If possible, wait approximately 10 minutes before you can run health check to look for errors and
compare against the baseline configuration. The wait period allows for error accumulation. Otherwise,
run the health check now to check for configuration changes, which includes any nodes that have
fallen off of the switch.
a. Run the all_analysis command. For more information, see “Health checking” on page 157 and the
Fast Fabric Toolset Users Guide.
b. Look for configuration changes and fix any that you find. For more information, see “Finding and
interpreting configuration changes” on page 180.
c. Look for errors and fix any that you find. For more information, see the “Table of symptoms” on
page 187.
8. If you did not wait 10 minutes before running the health check, rerun it after about 10 minutes to
check for errors.
a. Run the all_analysis command, or the all_analysis -e command. For more information, see “Health
checking” on page 157 and the Fast Fabric Toolset Users Guide.
b. Look for errors and fix any that you find. For more information, see the “Table of symptoms” on
page 187.
246
Power Systems: High performance clustering
c. If you did not use the –e parameter, look for configuration changes and fix any that you find. For
more information, see “Finding and interpreting configuration changes” on page 180.
This procedure ends here.
Restarting or powering off an IBM system
If you are restarting or powering off an IBM system for maintenance or repair, use this procedure to
minimize impacts on the fabric, and to verify that the system host channel adapters (HCAs) have rejoined
the fabric.
To restart or power off an IBM system for maintenance or repair, complete the following procedure to
minimize impacts on the fabric and to verify that the system HCAs have rejoined the fabric.
Note: When all analysis is referenced, if you have created a script to run all_analysis, substitute that in
the procedure. For an example of such a script, see “Healthcheck control script” on page 277. When you
are asked to clear errors, you might want to use a script like that described in “Error counter clearing
script” on page 276.
1. Restart the IBM system.
a. Errors are logged for the HCA links going down and for the logical switches and logical HCAs
disappearing.
b. You can ensure that the number of devices disappearing corresponds to the appropriate number
relative to the number of HCAs that you have in your IBM systems that have been restarted. For
more information, see “Counting devices” on page 248. In this way, ensure that nothing
disappeared from the fabric that was not in the restarted IBM system or connected to the IBM
system. If you do not check this at this time, the health check completed later in this procedure
will check for any missing devices, but detection of the problem will be delayed until after the
IBM system has restarted.
c. If devices disappear that are not in the IBM systems or are not connected to the IBM systems, see
the “Table of symptoms” on page 187.
2. Wait for the IBM system to restart through the operating system load.
a. As devices come back online, there would be appearance Notices from the Subnet Managers. You
can count the number of devices and make sure that the count corresponds to the appropriate
number of devices that you have in the IBM systems that have been restarted. For more
information, see “Counting devices” on page 248. Keep in mind that the devices might come up
over several scans of the fabric by the Subnet Managers, so add up the appearance counts over
several log entries. However, the following health check takes care of checking for any missing
devices.
3. Run the /sbin/iba_report –C –o none command to clear error counters on the fabric ports before
doing a health check on the current state. Otherwise, the reboot might have errors.
4. If possible, wait about 10 minutes before you can run health check to look for errors and compare
against the baseline configuration. The wait period is to allow for error accumulation. Otherwise, run
the health check now to check for configuration changes, which include any nodes that have fallen off
the switch.
a. Run the all_analysis command. For more information, see “Health checking” on page 157 and the
Fast Fabric Toolset Users Guide.
b. Look for configuration changes and fix any that you find. For more information, see “Finding and
interpreting configuration changes” on page 180.
c. Look for errors and fix any that you find, For more information, see the “Table of symptoms” on
page 187.
5. If you did not wait 10 minutes before running the health check, rerun it after approximately 10
minutes to check for errors.
High-performance computing clusters using InfiniBand hardware
247
a. Run the all_analysis command, or the all_analysis -e command. For more information, see “Health
checking” on page 157 and the Fast Fabric Toolset Users Guide.
b. Look for errors and fix any that you find. For more information, see the “Table of symptoms” on
page 187.
c. If you did not use the –e parameter, look for configuration changes and fix any that you find. For
more information, see “Finding and interpreting configuration changes” on page 180.
6. If you repaired an HCA, the latest health check identifies that you have a new GUID in the fabric.
You must perform the procedure in “Re-establishing Health Check baseline” on page 244. However,
do only that after you have run a health check against the old baseline to ensure that the repair action
resulted in no inadvertent configuration changes, such as a swapping of cables.
This procedure ends here.
Counting devices
When faults or user actions cause devices appear and disappear from the fabric, you can use this
information to count the devices that you expect to be part of your fabric.
Subnet Managers in the industry tend to report resources at a low level.
The virtualization capabilities of the IBM GX host channel adapters (HCAs) complicate the counting of
devices because of how logical devices are interpreted by the Subnet Manager.
The following resources are generally reported by the Subnet Manager when they appear or disappear.
Even if the exact resource is not always given, there is a count given.
v Switches
v HCAs or channel adapters (CAs)
v End ports
v Ports
v Subnet Managers
Note: The count of the number of resources is given by an individual Subnet Manager. If there are
multiple subnets, you must add up the results from the master Subnet Manager on each subnet.
Counting switches
Use this procedure to count the number of switches on your fabric.
Physical switches generally come in two varieties:
1. 24-port base switch
2. Director level switches with spines and leafs. These are composed of 48 ports or more.
With the IBM GX host channel adapter (HCA), you can get a logical switch per each physical port. This is
what connects the logical HCAs to the physical ports, which yield the capability to virtualize the HCA.
A physical switch is constructed by using one or more switch chips. A switch chip has 24 ports used to
construct the fabric. A base 24-port switch, needs only one switch chip to yield 24 ports.
The director level switches (such as the 9120) use cascading switch chips that are interconnected to yield
a larger number of ports supported by a given chassis. This introduces the concept of leaf-boards that
have the cables and then spines that interconnect the various leaf-boards, thus allowing where the data
can flow in any cable port of the switch and out to any other cable port. The key is to remember that
there are 24 ports on a switch.
248
Power Systems: High performance clustering
Each spine has two switch chips. To maintain cross-sectional bandwidth performance, you want a spine
port for each cable port. So, a single spine can support up to 48 ports. The standard sizes are 48, 96, 144,
and 288 port switches and the switches require 1, 2, 3 and 6 spines.
A leaf-board has a single switch chip. A standard spine has (12) 4x cable connectors. The number of
required leafs is calculated by dividing (the number of cables) by 12. After using 12 switch chip ports for
cable connections, there are 12 left over for connecting to spine chips.
With one spine, there are two switch chips, yielding 48 ports on the spines. With 12 ports per leaf, that
means a spine can support four leafs. You can see that this works out to requiring 1/2 a spine switch
chip per leaf.
Table 94. Counting Switch Chips in a Fabric
Number ports
Number leafs
Number spines
Switch chips
48
4
1
4*1 + 2*1 = 6
96
8
2
8*1 + 2*2 = 10
144
12
3
12*1 + 2*3 = 18
288
24
6
24*1 + 2*6 = 36
Counting logical switches
Use this information to count the number of logical switches on your fabric.
The number of logical switches is equal to the number of IBM GX+ or GX++ host channel adapter (HCA)
ports. The logical switch is the virtualization device on the GX+ or GX++ HCA. For more information,
see “IBM GX+ or GX++ host channel adapter” on page 7.
Counting host channel adapters
Use this information to count the number of host channel adapters (HCAs) on the fabric. The number of
HCAs depends on the type of HCAs used.
There is one HCA per physical PCI HCA card. Do not forget the HCAs used in the InfiniBand
Management nodes.
The number of HCAs per IBM GX+ or GX++ HCA depends on the number of logical partitions defined.
There is a logical HCA per each logical partition defined to use the HCA. For more information, see “IBM
GX+ or GX++ host channel adapter” on page 7.
Counting end ports
Use this information to count the number of end ports on the fabric. The end ports depend on the type of
host channel adapters (HCAs) used and the number of cables that are connected.
The number of end ports for PCI HCAs is equal to the number of connected cable connectors on the PCI
HCAs.
The IBM GX+ or GX++ HCA has two ports connected to logical HCAs.
Counting ports
Use this information to count the number of ports on the fabric.
The total number of ports is composed of all the ports from all of the devices in the fabric. In addition,
there is a port used for management of the device. This is not to be confused with a switch management
port that connects to a cluster virtual local area network (VLAN). Instead, each switch chip and HCA
device has a management port associated with it, too.
High-performance computing clusters using InfiniBand hardware
249
Table 95. Counting Fabric Ports
Device
Number of ports
Spine switch chip
25 = 24 for fabric + 1 for management
Leaf switch chip
13 + (number of connected cables) = 12 connected to spines + 1 for management + (number
of connected cables)
24-port switch chip
1 + (number of connected cables) = 1 for management + (number of connected cables)
PCI HCAs
Number of connected cables
Logical switch
1 + 1 + (number of LPARs = 1 physical port + 1 for management + 1 for each LPAR that
uses this HCA
Counting Subnet Managers
Use this information to count the number of Subnet Managers on the fabric.
The number of Subnet Managers is equal to one master plus the number of standbys on the subnet.
Counting devices example
This example shows how the number of devices on a fabric is calculated.
For this example, the configuration for the subnet is shown in the following table.
Table 96. Example configuration
Quantity
Devices
Connectivity
1
9024 switch
5 HCA connections + 4 connections
to the 9120
1
9120 switch
5 HCA connections + 4 connections
to the 9024
3
9125-F2A
(1) IBM GX HCAs per node
3
IBM GX host channel adapters (HCAs)
1 connection to 9024; 1 connection
to 9120
2
InfiniBand Management Hosts
(1) two-port PCI HCA per host
2
PCI HCAs
1 connection to 9024; 1 connection
to 9120
The resulting report from the master Subnet Manager is shown in the following table.
DETAIL:25 SWs, 5 HCAs, 10 end ports, 353 total ports, 4 SM(s)
Table 97. Report from the master Subnet Manager
Resource
Count
Calculation
Switches
25
HCAs
5
(2) PCI HCAs + (3) IBM GX HCAs
End ports
10
5 HCAs * 2
Ports
353
See the following example ports for calculation
Subnet Managers
4
(1) Master + (3) Standbys
(1) per 9024
# 12 leaf chips per 9120 +
# 2 chips * 3 spines per 9120 +
# 2 logical switch per HCAs * 3 GX HCAs
= 1 + 12 + 6 + 6 = 25
The following table illustrates how the number of ports were calculated.
250
Power Systems: High performance clustering
Table 98. Number of ports calculation
Device
Ports
Calculation
9024
10
9120 spines
150
9120 leafs
165
Logical switches
18
3 ports * 6 logical switches
Logical HCAs
6
2 ports * 3 logical HCAs
PCI HCAs
4
2 ports * 2 HCAs
(3)
(2)
(4)
(1)
connections to GX HCAs +
connections to PCI HCAs +
switch to switch connections +
management port
25 ports * 3 spines * 2 switch chips per spine
(13 ports * 12 leaf chips) +
(3) connections to GX HCAs +
(2) connections to PCI HCAs +
(4) switch to switch connections
Total Port Count = 10 + 150+165+18+6+4 = 353
Handling emergency power off situations
This information provides guidelines for setting up a procedure to handle power off situations.
Emergency Power-off (EPO) situations are typically rare events. However, some sites do experience more
power issues than others for various reasons, including power grid considerations. It is good practice for
each site to develop an EPO procedure.
This is a sample procedure that can be used with QLogic switches assuming that you have an issue with
the external 480 V ac power to the servers. Details on how to complete each step have been omitted. To
finalize the procedure, you need the vendor switch User Manual, the Fabric Management Users Guide and
the server service information. Example commands are shown, but they must be verified with the latest
User Manuals and service information.
If there is a compelling reason for completing a certain step, or for doing a step at a certain time in the
procedure, a comment follows it with the reason why.
1. To reduce the number of events in the logs for the resulting link downs, shut down the Subnet
Managers.
v Why? Excessive log entries can mask real problems later and also cause problems with extensive
debugging by upper levels of support.
2. EPO the IBM systems running on external 480 V ac power. Depending on the nature of the EPO, you
can leave the switches up (if adequate cooling and power can be supplied to them).
a. If you cannot leave the switches running, then, if you have stopped the embedded Subnet
Managers, you can shut down the switches at any time. You must either power off at a
circuit-breaker or remove all of the switch power cables, because they have no physical or virtual
power switches.
b. If you must power off the fabric management servers and you can do it before the IBM systems
and the vendor switches that would eliminate the requirement to shut down Subnet Managers.
v Why? Consider the implications of excessive logging if you leave Subnet Managers running
while shutting down devices on the fabric.
3. Press the 480 V ac external power wall EPO switch.
4. When the situation is resolved, restore wall power and restart the servers.
5. After the servers are operational, check the LEDs for indications of problems on the servers and
switches and switch ports.
High-performance computing clusters using InfiniBand hardware
251
6. Start the Subnet Managers. If you had powered off the fabric management server running Subnet
Managers, and the Subnet Managers were configured to auto-start, all you must do is start the fabric
management server after you start the other servers. If the switches have embedded Subnet Managers
configured for auto-start, then the Subnet Managers restarts when the switches come back online.
7. Run health check against the baseline to see if anything is missing (or otherwise changed).
8. Reset link error counters. All of this EPO activity can cause link error counters to advance because the
EPO is occurring at any time, even during applications passing data on the fabric.
a. On the fabric management server running the Fast Fabric Toolset run the iba_report –C –o none
command. If you have more subnets than it can be managed from one Fabric Management Server,
you must run the command from all of the master Fabric Management Servers.
9. Are there other resets that you can do for recovery?
Monitoring and checking for fabric problems
Fabric problems can surface in several different ways. While the Subnet Manager and switch logging are
the main reporting mechanisms, there are other methods for checking for problems.
To monitor and check for fabric problems, complete the following steps.
1. Inspect the xCAT/MS /var/log/xcat/errors/[xcat/MS hostname] log for Subnet Manager and switch
log entries.
2. Run the Fast Fabric Health Check tool.
Retraining 9125-F2A links
It has been determined that copper cables on 9125-F2A links must be retrained after any action that
brings a link down. Actions such as CEC power cycles, cable reseats, leaf reseats, and others.
The odds of this being required have been decreased, but not eliminated, by the switch firmware
allowing external port SERDES settings to be modified by the user. This was introduced in switch
firmware level 4.2.3.x.x, which introduced the capability to change the amplitude settings for switch
ports. This must have been done during installation of the switches; see “Installing and configuring
vendor or IBM InfiniBand switches” on page 137.
How to retrain 9125-F2A links
For retraining 9125-F2A links. If you can run an application that stresses the fabric in between retraining
sessions, this would be best.
The following procedure is for retraining 9125-F2A links:
1. Clear all errors by using either the following command, or a script like the one in “Error counter
clearing script” on page 276. iba_reports –o none –C –F “nodepat:[switch IB Node Description
pattern]”
2. Run an application that stresses the network, and wait 10 - 15 minutes and check errors by using
either iba_report, fabric_analysis, all_analysis, or a script like the one described in “Healthcheck
control script” on page 277.
3. Retrain any links that meet the retraining criteria in “When to retrain 9125-F2A links” on page 254,
and are connected to 9125-F2A HCAs.
a. If you have QLogic Fast Fabric code level before 4.3, you must reseat cables to cause link to
retrain. After reseating, go to step 4. If you have QLogic Fabric code level of 4.3 or higher,
continue with this procedure.
b. Record the switch nodeGUID and port, which are the second and third fields in the error counter
report, and has a form like 0x00066a0007000de7. The following example is of an IBM HCA Logical
Switch reporting symbol errors, and the switch nodeGUID and port are underlined and in a bold
font. In this case, the nodeGUID is 0x00066a0007000de7 and the port is 3.
252
Power Systems: High performance clustering
20g 2048 0x00025500106d1602
1 SW IBM G2 Logical Switch 1
SymbolErrorCounter: 1092 Exceeds Threshold: 6
<->
0x00066a0007000de7
3 SW SilverStorm 9080 c938f4ql01 Leaf 3, Chip
c. Find the LID associated with this nodeGUID by substituting $nodeGUID in the following
iba_report command. In this example, the LID is 0x000c. Also note the subnet in which it was
found. In this case it is 1:1, or HCA=1
> cnm02:~ # for h in 1 2; do for p in 1 2; do echo "$h:$p";
iba_report -h $h -p $p -o comps 2>&1 |
egrep "NodeGUID:.*Type: SW|LID:.*Linear" |
grep -A 1 "$nodeGUD" | grep LID;done;done
1:1
LID: 0x000c LinearFDBCap: 49152 LinearFDBTop:
467 MCFDBCap:
1:2
2:1
2:2
1024
d. Disable the switch port by using the switch LID, switch port, and the fabric manager HCA and
port mentioned in the preceding section found: /sbin/iba_portdisable –l $lid –m $switch_port
–h $h –p $p.
e. Re-enable the switch port by using the switch LID, switch port, and the fabric manager HCA and
port mentioned in the preceding section found: /sbin/iba_portenable –l $lid –m $switch_port
–h $h –p $p
4. Clear all errors by using either the following command, or a script like the one in “Error counter
clearing script” on page 276. iba_reports –o none –C –F “nodepat:[switch IB Node Description
pattern]”
5. Run an application that stresses the network, and wait 10 - 15 minutes and check errors by using
either iba_report, fabric_analysis, all_analysis, or a script like the one described in “Healthcheck
control script” on page 277.
6. Retrain any links that meet the retraining criteria in “When to retrain 9125-F2A links” on page 254,
and are connected to 9125-F2A HCAs.
a. If you have QLogic Fast Fabric code level before 4.3, you must reseat cables to cause link to
retrain. After reseating, go to step 4. If you have QLogic Fabric code level of 4.3 or higher,
continue with this procedure.
b. Record the switch nodeGUID and port, which are the second and third fields in the error counter
report, and has a form like 0x00066a0007000de7. The following example is of an IBM HCA Logical
Switch reporting symbol errors, and the switch nodeGUID and port are underlined and in a bold
font. In this case, the nodeGUID is 0x00066a0007000de7 and the port is 3.
20g 2048 0x00025500106d1602
1 SW IBM G2 Logical Switch 1
SymbolErrorCounter: 1092 Exceeds Threshold: 6
<->
0x00066a0007000de7
3 SW SilverStorm 9080 c938f4ql01 Leaf 3, Chip
c. Find the LID associated with this nodeGUID by substituting $nodeGUID in the following
iba_report command. In this example, the LID is 0x000c. Also note the subnet in which it was
found. In this case it is 1:1, or HCA=1
> cnm02:~ # for h in 1 2; do for p in 1 2; do echo "$h:$p";
iba_report -h $h -p $p -o comps 2>&1 |
egrep "NodeGUID:.*Type: SW|LID:.*Linear" |
grep -A 1 "$nodeGUD" | grep LID;done;done
1:1
LID: 0x000c LinearFDBCap: 49152 LinearFDBTop:
467 MCFDBCap:
1:2
2:1
2:2
1024
d. Disable the switch port by using the switch LID, switch port, and the fabric manager HCA and
port mentioned in the preceding section found: /sbin/iba_portdisable –l $lid –m $switch_port
–h $h –p $p
High-performance computing clusters using InfiniBand hardware
253
e. Re-enable the switch port by using the switch LID, switch port, and the fabric manager HCA and
port mentioned in the preceding section found: /sbin/iba_portenable –l $lid –m $switch_port
–h $h –p $p
7. Clear all errors by using either the following command, or a script like the one in “Error counter
clearing script” on page 276. iba_reports –o none –C –F “nodepat:[switch IB Node Description
pattern]”
8. Run an application that stresses the network, and wait 10 - 15 minutes and check errors by using
either iba_report, fabric_analysis, all_analysis, or a script like the one described in “Healthcheck
control script” on page 277.
9. If errors persist on the same link, there is a problem with the link that retraining cannot solve. Return
to the procedure that led you to this procedure.
When to retrain 9125-F2A links
This information provides details on when to retrain 9125-F2A links.
Check port error counters to determine if retraining is necessary. Check after any one of the following
events that cause a link to go down and come back up again:
v Cluster power cycling
v CEC cycling or rebooting, not including partition rebooting
v Switch rebooting/power cycling
v Replacing/Reseating/Moving switch cables
v Replacing/reseating a leaf
v Other service actions that might have caused a cable to have been reseated
v Any other action that would cause a link to go down and come back up again.
Port error counters can be checked by using iba_report, all_analysis, fabric_analysis, or a script like the
one described in “Healthcheck control script” on page 277.
If any one of the following retraining criteria is met, retrain the link according to the procedure in “How
to retrain 9125-F2A links” on page 252.
Note: This is assuming that you have checked within 10-15 minutes of up time. Longer up time must
follow criteria in parentheses.
v More than 3 HCA SymbolErr (> 10/day)
v More than 2 SW SymbolErr (> 10/day)
v More than 1 PortRcv w/o PortRcvPhysicalRemoteErrors (>10/day)
v Any LinkErrRecov (> 2/day)
v Any LinkDown (> 2/day). Make sure that the link does not have 88-99 SymbolErrs reported by the
HCA. If it does, it might not have been cleared (> 2/day)
v Any LocalLinkIntegrityErrors (>2/day)
v Do not retrain because of: PortRcvRemotePhysicalErrors, PortXmitDiscards, *ConstraintErrors*
Error counters
This section provides information about the port error counters that are tracked at the switch and HCA
ports.
Error counters overview
Error counters include understanding the following items:
v “Interpreting error counters” on page 255
254
Power Systems: High performance clustering
v “Diagnose a link problem based on error counters” on page 264
v “Error counter details” on page 265
v “Clearing error counters” on page 274
Interpreting error counters
If the only problems that exist in a fabric involve the occasionally faulty link which results in excessive
SymbolErrors or PortRcvErrors, interpreting error counters can be routine.
Difficulties arise when a link gets so bad that there are downstream or upstream effects that impact
packets that are strewn throughout the fabric. Or if a chip fails in a manner that is only detectable
through by interpreting a combination of events whose pattern reveal a root cause. Furthermore, it is
important to keep in mind that there are multiple locations for failures to be reported (syslogs, errpt, and
SFP) and that those would be checked as part of diagnosing the most complex problems.
The following high-level procedure must be used to help categorize errors and recognize patterns:
Note: It is important for error counters to be reset or cleared on a regular basis so that you might
understand the rate of error. Thresholding relies on this. See “Setting up periodic fabric health checking”
on page 158. Also, see “Clearing error counters” on page 274.
1. Categorize errors according to the Category column in the following table:
Table 99. Error Counter Categories
Error Counter
Category
LinkDownedCounter
Link Integrity
LinkErrorRecoveryCounter
Link Integrity
LocalLinkIntegrityErrors
Link Integrity
ExcessiveBufferOverrunErrors
Link Integrity
SymbolErrorCounter
Link Integrity
PortRcvErrors
Link Integrity
PortRcvRemotePhysicalErrors
Remote Link Integrity
PortXmitDiscards
Congestion or Remote Link Integrity
PortXmitConstraintErrors
Security
PortRcvConstraintErrors
Security
VL15Dropped
SMA Congestion
PortRcvSwitchRelayErrors
Routing
2. Check syslogs, check errpt, and check SFP for any CEC, HCA, or power events that might cause the
link to go down.
3. Regardless of any other errors on the link, report any “Security” errors (PortXmitConstraintErrors,
PortRcvConstraintErrors) immediately as a bug with the IB fabric. These must not occur until after the
4.4 release of the HSM.
4. Address Link Integrity errors (LinkDowned, LinkErrorRecovery, SymbolErrors, PortRcvErrors,
LocalLinkIntegrityErrors, and ExcessiveBufferOverruns)
a. The order of severity of the link integrity errors from most severe to least severe is: LinkDowned,
ExcessiveBufferOverruns, LinkErrorRecovery, LocalLinkIntegrityErrors, PortRcvErrors, SymbolErrs
b. Use the isolation procedure in “Interpreting link Integrity errors” on page 256.
5. When the link integrity errors have been addressed, address Congestion (PortXmitDiscards) and
Remote Link Integrity (PortRcvRemotePhysical) errors can be grouped into a category of Remote
Errors.
High-performance computing clusters using InfiniBand hardware
255
a. Determine if pattern of errors leads you through the fabric to a common point exhibiting link
integrity problems.
b. If there are no link integrity problems, see if there is a pattern to the errors that has a common leaf
or spine, or if there is some configuration problem that is causing the error.
c. Use the isolation procedure in “Interpreting remote errors” on page 260.
6. For VL15 Drops (SM congestion) -> Normally these can be ignored and the threshold must be set to 0
or commented out. However, under engineering direction, you might be watching these errors to
isolate problems with the SM that appear to be caused by congestion.
7. Ignore any PortRcvSwitchRelayErrors. The HCAs do not record them, and the switch chips have a
bug that increments them incorrectly. The threshold for these errors must be 0 or commented out.
Note: For individual details on the various error counters, see “Error counter details” on page 265.
Interpreting link Integrity errors
This information provides details on inspecting link integrity errors.
When inspecting link integrity errors, perform do the following procedure. This procedure is illustrated
in Figure 16 on page 259, which can be used as a reference for the experienced user, and helps a new user
to understand the procedure.
If there is a LinkDowned error, determine the reason for the error. Otherwise go to step 2.
Note: For more details on LinkDowned errors, see “LinkDownedCounter” on page 266.
Determine if the link might have gone down because of one of the following user, CEC, or power events.
If any of these have been taken since the last inspection of the error counters, you must reset the error
counters for that link (or, if local policy dictates, for all links), and take no action for the error. If there
was no Linked Down error go to step 2.
v CEC power cycle
v CEC checkstop
v
v
v
v
v
v
A cable being pulled or reseated
A switch being power-cycled or rebooted
A leaf being reseated
An event in SFP that has the HCA in the FRU list
A power event that would have brought down the CEC
A power event in the switch
1. If the LinkDowned error is not explained by any outside events, perform the procedures to isolate
(see “Diagnose a link problem based on error counters” on page 264). The other link integrity errors
can be ignored.
2. For ExcessiveBufferOverruns, first check to see if the FM has had manual overrides leading to a
configuration problem. This can happen only by altering the MTU or VL buffering scheme on an
active link. Check that the configuration as follows:
Note: For more details on ExcessiveBufferOverrun errors, see “ExcessiveBufferOverrunErrors” on
page 267.
a. Log on to the switch that has one of the ports on the link that is in error.
b. Run “ismChassisSetMtu” (use help chassisSetMtu to understand the output)
c. Ensure that the values are as expected according to the plan (2K MTUCap=4; 4K MTUCap=5; VL
Buffering -> 1=1 VL; 2=2 VLs; 3 = 4 VLs). If these are different from the expected values, this can
explain the buffer overrun. An example of the output is:
L11P01
S3BL19
256
MTUCap=5(4096 bytes) VLCap=3(4 VLs)
<- Leaf 11 Port 11; 4K MTU and 4 VLs
MTUCap=5(4096 bytes) VLCap=3(4 VLs) <- Spine 3 chip B to Leaf 19 interface
Power Systems: High performance clustering
d. If the configuration has been changed it must be changed back again by using the
ismChassisSetMtu command.
e. If there is no issue with the configuration, then perform the procedures to isolate local link
integrity errors (“Diagnose a link problem based on error counters” on page 264). Otherwise, go to
step 3.
3. If there are Symbol Errors reported by the HCA, and if there are somewhere between 85 - 100 errors,
do the following steps. Otherwise, go to step 4.
Note: For more details on Symbol Errors, see “SymbolErrorCounter” on page 269.
a. Determine if a user, CEC, or power event might have brought the link down (see the list of
example events).
b. If there were outside events that caused the link down, clear the error counters on the link; see
“Clearing error counters” on page 274.
c. If there were no outside events, then monitor the link to see if the number of errors increases. If
the number of symbol errors does not increase in about two hours, and there are no
LinkErrorRecovery errors increasing during that time period, clear the error counters on the link;
see “Clearing error counters” on page 274. The assumption is that there was an outside event that
had not been properly determined in the previous steps.
Note: It is possible to see the symbol error count decrease if there are LinkErrorRecovery errors,
because a link recovery sequence includes a clear of the symbol error counter.
d. If the number of symbol errors increase, or other errors increase go to step 4.
4. If there are HCA reported PortRcvErrors being reported and there are also
PortRcvRemotePhysicalErrors, do the following steps. Otherwise go to step 5.
Note:
v For more details on PortRcvErrors, see “PortRcvErrors” on page 268. For more details on
PortRcvRemotePhysicalErrors, see “PortRcvRemotePhysicalErrors” on page 271.
v The HCA increments PortRcvErrors when various other link integrity problems are discovered.
These include PortRcvRemotePhysicalErrors.
a. If the count of PortRcvErrors and PortRcvRemotePhysicalErrors is the same, then ignore the
PortRcvErrors and address only the PortRcvRemotePhysicalErrors. Instructions for interpreting
PortRcvRemotePhysicalErrors are in “Interpreting remote errors” on page 260. If you have other
link integrity errors on this link, continue through this procedure to address those first.
b. If the count of PortRcvErrors is higher than PortRcvRemotePhysicalErrors, then proceed with step
5 of this procedure. However, first determine and subtract the number of
PortRcvRemotePhysicalErrors from the number of PortRcvErrors to determine how many of the
PortRcvErrors correspond to the local link instead of a remote problem. Then determine if the
local PortRcvErrors exceeds the threshold.
5. For LinkErrorRecovery, LocalLinkIntegrityErrors, PortRcvErrors and SymbolErrs not attributable to
link training or rebooting, and ExcessiveBufferOverruns not attributed to configuration problems. You
must isolate the problem by performing the procedure in “Diagnose a link problem based on error
counters” on page 264. However, first decide the severity of the situation to determine if it is
necessary to isolate and repair the problem immediately, or if it might be deferred.
Note: For more details on LinkErrorRecover, see “LinkErrorRecoveryCounter” on page 266. For more
information about LocalLinkIntegrityErrors, see “LocalLinkIntegrityErrors” on page 267.
a. If an IBM GX HCA is reporting only SymbolErrors, the problem might be deferred until the next
maintenance window, or until the HCA begins reporting other errors. This is because the errors
are occurring only on idle characters and are not impacting performance. If the SymbolErrs are
being reported at a high rate, there is more probability that data packets would eventually be
affected. This does not apply to switch reported SymbolErrors.
High-performance computing clusters using InfiniBand hardware
257
Note: By design, the IBM GX HCA increases the PortRcvError count if SymbolErrors occur on
data packets. If a SymbolError occurs on an idle character, the PortRcvError would not be
incremented. Therefore, HCA SymbolErrors reported in the absence of other errors, indicates that
the errors are occurring only on idle patterns and therefore are not impacting performance.
b. Any LinkErrorRecovery, ExcessiveBufferOverruns not attributed to configuration problems,
LocalLinkIntegrityErrors must be addressed as soon as possible, because they indicate noisy links.
c. PortRcvErrors and SymbolErrors reported by switches might be deferred if there are no observable
performance issues being reported. However, watch the links closely.
6. Any other issues with the Link Integrity category of errors are not covered here. I must be reported to
your next level of support along with the following information:
a. A copy of the error report
b. The time of the last clear of the error counters
c. Any actions that were taken
d. Information about any outside events that might influence the state of the link, such as:
v CEC power cycle - CEC checkstop
v A cable being pulled or reseated
v A switch being power-cycled or rebooted
v
v
v
v
A leaf being reseated
An event in SFP that has the HCA in the FRU list
A power event that would have brought down the CEC
A power event in the switch
The following figure is intended as a high-level reference for those who already have a working
knowledge of the details and theories in the preceding procedure. The novice might also find it useful in
learning the preceding procedure.
258
Power Systems: High performance clustering
Figure 16. Reference for Link Integrity Error Diagnosis
High-performance computing clusters using InfiniBand hardware
259
Interpreting remote errors
Both PortXmitDiscards and PortRcvRemotePhysicalErrors are considered to be “Remote Errors” in that
they most often indicate a problem elsewhere in the fabric.
If PortXmitDiscards, a problem elsewhere is preventing the progress of a packet to such a degree that its
lifetime in the fabric exceeds the timeout values of a packet in a chip or in the fabric.
The PortRcvRemotePhysicalErrors occur when a port before the final destination in the path detects an
error and marks the packet bad. If the head of the packet is found bad, the chip can drop it as the
remainder of the packet comes through. When a packet is strewn between multiple chips in the fabric
and the error is found on one of the chips that contains the rear of the packet, it cannot drop the packet
or else a false error would be generated downstream. Therefore, it can mark only it bad as it passes it on
so that as downstream ports receive the packet. It is known to be bad for a reason not associated with the
link that is local to the current port detecting the problem.
Although they are generally a simple indication of some remote link with link integrity problems. If this
is not the case, remote errors can be complex to analyze to root cause. It is an acceptable practice to first
isolate and repair all link integrity problems before looking into rarer instances of failed components
causing what appear to be remote errors.
If there are PortXmitDiscards, perform the following steps:
Note: For more details on PortXmitDiscards, see “PortXmitDiscards” on page 271.
1. For HCAs reporting PortRcvRemotePhysicalErrors, there must be a corresponding PortRcvError for
every PortRcvRemotePhysicalError. There might be more PortRcvErrors that are unrelated to the
PortRcvRemotePhysicalErrors. This is not the case with the switch ports. The switch ports count only
a PortRcvRemotePhysicalError and they will not increment the PortRcvError counter.
2. Determine if there is a pattern of errors emanating from a single link in the subnet that has link
integrity errors, or a link that is attached to an HCA that has experienced an event that would bring
down the interface (for example CEC recycle or checskstop), and thus cause a packet to timeout
before it reaches its destination. For examples on typical patterns, see “Example PortXmitDiscard
analyses” on page 261.
3. If there is no pattern that leads to a link with errors or a link that went down, but the pattern leads to
a particular chip, then it might be that the chip is the root cause. For an example, see Figure 19 on
page 262. Before proceeding to replace the FRU with the suspected failing chip, perform the following
steps:
a. Ensure that the thresholds on other errors are not masking the root cause. Masking can occur if
the thresholds for any of the link integrity errors are larger than the total number of
PortRcvRemotePhysicalErrors being seen.
b. If the thresholds were too large, rerun the error gathering and point to an iba_mon.conf* file with
smaller thresholds. If the problem persists and there are no other errors being reported, continue
with step c.
c. If the thresholds are displayed small enough, reduce them all to 1 and gather errors for the subnet
and forward them to support along with the reasoning behind your conclusion that you have
found a faulty chip. Then, call your next level of support.
4. If there is no pattern that leads to either a common link problem or a common chip, it is possible that
there is an HCA with a bad CRC generator that fails under specific conditions. For an example, see
Figure 23 on page 264. Such a failure is a difficult problem to isolate, because the problem is not
detected at the source nor along the way. It reveals only itself at the destinations with no typical way
to trace the problem back to the source. In such a situation, contact your next level of support. They
would either require low-level logs, tracing, or queries that are not normally available in the field, or
experiments must be done with changing combinations of nodes to isolate a common source in all
failing cases.
260
Power Systems: High performance clustering
Example PortXmitDiscard analyses:
Several figures would be presented with descriptions preceding them.
The following figure is an example of an HCA detecting problem with a link and the pattern of
PortXmitDiscards leading to the conclusion that the link errors are the root cause of the
PortXmitDiscards. The first key clue is a PortXmitDiscard on the leaf port connected to the HCA
detecting link errors. Then, the spines connected to that leaf are reporting PortXmitDiscards. This is
enough to indicate the root cause is Link1. The other PortXmitDiscards leading from another HCA and
through another leaf are further evidence, but not required to make the conclusion.
Figure 17. Leaf-HCA link causing PortXmitDiscards
The following figure shows a spine to leaf link with errors that is causing PortXmitDiscards. The first
indication of this is the PortXmitDiscards being reported by leaf ports connected to the same spine. The
PortXmistDiscard reported by the HCA in the figure is not necessary in finding root cause. However, you
can see how you can lead back from the spine to the leaf and then to the HCA.
Figure 18. Leaf-Spine link causing PortXmitDiscards
The following figure is an example of all PortXmitDiscards being associated with a single leaf and there
are no link errors to which to attribute them. You can see the transmit discards “dead-ending” at the leaf
chip. It is important to first ensure yourself that all of the other errors in the network have a low enough
threshold to be seen. Otherwise, the thresholds being used might be masking the root cause.
High-performance computing clusters using InfiniBand hardware
261
Figure 19. Failing leaf chip causing PortXmitDiscards
Example PortRcvRemotePhysicalErrors analyses:
Several figures would be presented with descriptions preceding them.
The following figure is an example of an HCA detecting problem with a link and the pattern of
PortRvcRemotePhysicalErrors leading to the conclusion that the link errors are the root cause of the
PortRvcRemotePhysicalErrors. The first key clue is a PortRvcRemotePhysicalErrors on the spine ports
connected to the leaf that has a port detecting PortRcvErrs. This is enough to indicate the root cause is
Link1. The other PortRvcRemotePhysicalErrors leading back through to another HCA and a leaf are
further evidence, but not necessary to leading to this root cause. However, it is important to note that if
the other Leaf and HCA was not leading back through one of the spines.
Figure 20. Leaf-HCA link causing PortRcvRemotePhysicalErrors
The following figure shows a spine to leaf link with errors that is causing PortRcvRemotePhysicalErrors.
The first indication of this is the PortRcvRemotePhysicalErrors being reported by leaf ports connected to
the same spine. The PortRcvRemotePhysicalErrors reported by the HCA in the figure is not necessary in
finding root cause. However, you can see how you can lead back from the spine to the leaf and then to
the HCA, and it is possible that the only set of PortRcvRemotePhysicalErrors seen lead you from the
spine to one leaf and then one HCA.
262
Power Systems: High performance clustering
Figure 21. Leaf-Spine link causing PortRcvRemotePhysicalErrors
The following figure is an example of all PortRcvRemotePhysicalErrors being associated with a single leaf
and there are no link errors to which to attribute them. You can see the transmit discards “dead-ending”
at the leaf chip. It is important to first ensure yourself that all of the other errors in the network have a
low enough threshold to be seen. Otherwise, the thresholds being used might be masking the root cause.
Figure 22. Failing leaf chip causing PortRcvRemotePhysicalErrors
High-performance computing clusters using InfiniBand hardware
263
Figure 23. Failing HCA CRC generator causing PortRcvRemotePhysicalErrors
Interpreting security errors
Security errors do not apply to clusters running SubnetManager code at the 4.3.x level or previous levels.
Call your next level of support upon seeing PortXmitConstraintErrors, or PortRcvConstraintErrors.
Diagnose a link problem based on error counters
You would have been directed here from another procedure.
To diagnose a link problem, perform the following steps:
Note: Whenever you are instructed to retrain a link, see “Retraining 9125-F2A links” on page 252
1. If it is connected to an IBM GX++ HCA in a 9125-F2A, and the link has not been retrained since the
last power-cycle or maintenance action, retrain it. Otherwise, go to step 2.
a. If the switch firmware is at the 4.2.1.1.1 level, you must reseat the cable, or use a special script
b. If the switch firmware is at the 4.3 level or greater, retrain the link by using iba_port_disable and
iba_port_enable by targeting the leaf port of the link.
2. If the problem continues, reseat the cable at both ends. If this resolves the problem, go to step 5.
3. If the problem continues and you can swap the cable between HCAs and switch ports, do the
following:
a. Swap the cable around between ports until you can isolate if it is the cable, leaf, or HCA. You are
looking for whether the problems moves with the cable, the leaf port, or HCA port. This indicates
the failing FRU.
b. After each movement of the cable, you must reset the counters on the link. You might also retrain
the link to ensure yourself that any errors that arise are caused by the cable movement and not by
a training issue. See “Clearing error counters” on page 274.
c. Go to step 5
4. If you cannot swap the cable, you cannot truly isolate to the failing FRU, so you must replace FRUs
according to order of probability of failure balanced with ease of replacement.
a. Replace the cable.
b. Clear errors and retrain if necessary. If the problem persists, continue to the next step.
264
Power Systems: High performance clustering
c. For links to HCAs, replace the HCA. (impacts fewer CECs). For spine to leaf links, it is easier to
replace the spine first. This affects performance on all nodes, but replacing a leaf might stop
communication altogether on nodes connected to that leaf.
d. Clear errors and retrain if necessary. If the problem persists, continue to the next step.
e. Replace the switch leaf. (If the problem is on a switch to switch link, replace the leaf opposite to
the side that is reporting the problem. This is because it is more likely for transmitters to fail than
receivers).
f. Clear errors and retrain if necessary. If the problem persists, continue to the next step.
5. Reset the counters on the link. For more information, see “Clearing error counters” on page 274.
6. Watch for problems and retrain as necessary.
Note: Typically, in the absence of any other indicator, and an inability to do cable or part swapping,
and reseating is not acceptable. You must replace the FRU associated with the port connected to the
port detecting the error, and not the FRU connected with the port reporting the error. For example, if
Switch 2 Leaf 3 Port 16 is detecting an error and it is attached to Switch 2 Spine 2 Port 19, the spine is
the first to be replaced in the FRU list. The leaf is the secondary FRU. If a link with a cable, the cable
is generally the first suspect.
This procedure ends here.
Return to the procedure which referenced to this procedure.
Error counter details
The following subsections addresses categorization of errors, first, and then the details of each particular
error.
Common content for error details includes:
v A description of the error
v Detail on how to diagnose the error and how it might relate to other errors
v Performance impact
v “Threshold: minimum actionable” is the minimum number of occurrences of a particular type of error
that must be seen over a given time period since the counters were last cleared. This is used with the
“maximum in 24 hours” to determine the threshold at a given time period
v “Threshold: maximum in 24 hours” is the maximum number of allowable occurrences of a particular
type of error over a 24 hour time period
Categorizing Error Counters
This topic provides a table which categorizes error counters.
The following table categorizes error counters.
Table 100. Error Counter Categories
Error
Counter Category
e
Link Integrity
LinkErrorRecoveryCounter
Link Integrity
LocalLinkIntegrityErrors
Link Integrity
ExcessiveBufferOverrunErrors
Link Integrity
SymbolErrorCounter
Link Integrity
PortRcvErrors
Link Integrity
PortRcvRemotePhysicalErrors
Remote Link Integrity
High-performance computing clusters using InfiniBand hardware
265
Table 100. Error Counter Categories (continued)
Error
Counter Category
PortXmitDiscards
Congestion or Remote Link Integrity
PortXmitConstraintErrors
Security
PortRcvConstraintErrors
Security
VL15Dropped
SMA Congestion
PortRcvSwitchRelayErrors
Routing
Link Integrity Errors
These are errors that are localized to a particular link.
If they are not caused by some user action or outside event influencing the status of the link, these are
generally indicative of a problem on the link.
LinkDownedCounter:
The link is not able to maintain connectivity. This ca be a catastrophic link failure or it can be because of
some outside user action or event.
Examples of events that take down links are:
v CEC power cycle
v CEC checkstop
v A cable being pulled or reseated
v A switch being power-cycled or rebooted
v A leaf being reseated
v An event in SFP that has the HCA in the FRU list
v A power event that would have brought down the CEC
v A power event in the switch
v A port on the link is disabled
If the link seems to be going down on its own without outside influences listed the preceding list, typical
link isolation techniques must be used. For more information, see “Diagnose a link problem based on
error counters” on page 264.
Performance impact: Because a link down is often associated with either a link that is taking many errors,
or one that has stopped communicating, there would be a performance impact for any communication
going over the link that went down.
Threshold: minimum actionable = 2
Threshold: maximum in 24 hours = 3
LinkErrorRecoveryCounter:
The link is taking many errors and has gone through a state to re-train to attempt to establish better
connectivity. Except for the LinkDownedCounter, this results in the other link error counters being reset.
This can also be caused by the re-training sequence being initiated.
266
Power Systems: High performance clustering
If it appears that the link is recovering on its own without outside influences, typical link isolation
techniques must be used. For more information, see “Diagnose a link problem based on error counters”
on page 264.
Performance impact: Because a link error recovery error is often associated with either a link that is
taking many errors, or one that has stopped communicating, there would be a performance impact for
any communication going over the link experiencing these errors.
Threshold: minimum actionable = 2
Threshold: maximum in 24 hours = 3
LocalLinkIntegrityErrors:
The link is experiencing excessive errors and is attempting link recovery.
You might see occasionally during link training after one of the following actions or events:
v CEC power cycle
v CEC checkstop
v A cable being pulled or reseated
v A switch being power-cycled or rebooted
v A leaf being reseated
v
v
v
v
An event in SFP that has the HCA in the FRU list
A power event that could have brought down the CEC
A power event in the switch
A port on the link is disabled
If it appears that the link did not experience one of the outside influences listed the preceding list, typical
link isolation techniques must be used. For more information, see “Diagnose a link problem based on
error counters” on page 264.
Performance impact: Because a link integrity error is associated a link that is taking many errors, there
would be a performance impact for any communication going over the link experiencing these errors.
Threshold: minimum actionable = 2
Threshold: maximum in 24 hours = 3
ExcessiveBufferOverrunErrors:
Typically, ExcessiveBufferOverrunErrors indicate a manual override of the SM config or poor link quality
resulting in mismatched credit counts between transmitter and receiver.
Configuration changes affecting the buffers are MTU changes or VL buffer changes. For switches, use
“ismChassisSetMtu” to query that the MTU and VL buffers are set to the appropriate values. Because this
command is chassis wide, it is likely that such a change would be noticed chassis wide. Alternatively, if
you have a good health check baseline generated by all_analysis or chassis_analysis (/var/opt/iba/
analysis/baseline/*), a new health check run must indicate that the MTU or VL buffer settings have
changed.
The results of are as expected according to the plan. (2K MTUCap=4; 4K MTUCap=5; VL Buffering -> 1=1
VL; 2=2 VLs; 3 = 4 VLs) If these are different from the expected values, this would explain the buffer
overrun. An example of a output is:
High-performance computing clusters using InfiniBand hardware
267
L11P01
S3BL19
MTUCap=5(4096 bytes) VLCap=3(4 VLs) <- Leaf 11 Port 11; 4K MTU and 4 VLs
MTUCap=5(4096 bytes) VLCap=3(4 VLs) <- Spine 3 chip B to Leaf 19 interface
The default for VlCap is 3. The default for MTUCap is 4. However, typically, clusters with all DDR HCAs
are configured with an MTUCap of 5.
In the absence of any changes to the SM config or use of stand-alone tools to change VLs, typical link
isolation techniques must be used. For more information, see “Diagnose a link problem based on error
counters” on page 264.
Performance impact: Because ExcessiveBufferOverrunErrors indicate problems lead to dropped packets,
there would be a performance impact for any communication going over the link experiencing these
errors.
Threshold: minimum actionable = 2
Threshold: maximum in 24 hours = 3
PortRcvErrors:
PortRcvErrors are incremented differently in the IBM GX HCA from how they are incremented in other
HCA or the switch.
While the architecture defines PortRcvErrors as covering the following conditions, the non IBM GX HCA
components in the fabric only increment PortRcvErrors when another error counter does not cover the
condition. The IBM GX HCA will increment both the PortRcvError and the other counter:
v Local physical errors (ICRC, VCRC, FCCRC, and all physical errors that cause entry into the BAD
PACKET or BAD PACKET, which include SymbolErrors; however, the CRC errors are not necessarily
covered by SymbolErrors.
v DISCARD states of the packet receiver state machine) – which include PortRcvRemotePhysicalErrors
v Malformed data packet errors (LVer, length, VL)
v Malformed link packet errors (operand, length, VL)
v Packets discarded due to buffer overrun (ExcessiveBufferOverrunErrors)
For IBM GX HCAs, the combined reporting of PortRcvErrors and SymbolErrors is important to
understand. If a SymbolError occurs on a data cycle, as opposed to an idle cycle, a PortRcvError would
also be recorded. Knowledge of this behavior can be useful in determining the urgency of isolation and
repair. For example, if you are seeing only SymbolErrors on an IBM GX HCA port, it is likely that no
data transfers are being affected. Therefore, if the number of SymbolErrors is fairly low, maintenance can
be deferred to a more convenient time. As the number of SymbolErrors increases, this must be reassessed,
because the probability of impacting data transfers increases.
Typically, the number of SymbolErrors would be equal to or greater than the number of PortRcvErrors. It
is possible that the number of PortRcvErrors is greater than the number of SymbolErrors. The size of the
difference can indicate different root causes. This assumes that the PortRcvErrors are not being
incremented because of PortRcvRemotePhysicalErrors or ExcessiveBufferOverrunErrors.
If the number of PortRcvErrors is slightly higher than the number of SymbolErrors, this can be explained
by some double bit errors that SymbolError checkers would not detect. However, it is unlikely that this
would happen often. It is more likely that SymbolErrors would be detected at nearly the same rate as
PortRcvErrors.
If the number of PortRcvErrors is much higher than the number of SymbolErrors, and there are not
enough corresponding PortRcvRemotePhysicalErrors or ExcessiveBufferOverrunErrors to explain the
difference, it is possible that there is some remote, source HCA adapter that is corrupting a CRC that is
268
Power Systems: High performance clustering
only checked at the destination HCA. This is a difficult situation to isolate to root cause. The technique is
to do methodical point to point communication and note which combination of HCAs causes the errors.
Also, for every PortRcvRemotePhysical reported by an IBM Galaxy HCA, a PortRcvError would be
reported.
Also, for every ExcessiveBufferOverrunError reported by an IBM Galaxy HCA, a PortRcvError would be
reported.
Figure 24. PortRcvErrors
Note: One important consideration in investigating combinations of errors is to ensure that you
understand the thresholds that are being used. Thresholds used by iba_report are included in the output.
You do not want to be in a situation where the threshold for PortRcvErrors is considerably different from
the threshold for SymbolErrors. In fact, the two thresholds must typically be the same.
InfiniBand Trade Association spec allows 10-12 bit error rate. However, the QLogic and IBM component
designs are such that the expected bit error is between 10-15 and 10-14. This translates into an error
threshold of 10 errors over a 24 hour period.
Performance impact: Because PortRcvErrors occur only on data transfers, there is a performance impact
caused by them. It is possible that multiple packets beyond the corrupted packet must be retransmitted to
guarantee in order delivery. Therefore, the impact is very much dependent on the application traffic
pattern.
Threshold: minimum actionable = 2
Threshold: maximum in 24 hours = 10
SymbolErrorCounter:
The SymbolErrorCounter is the most basic and common indicator of errors on a link.
High-performance computing clusters using InfiniBand hardware
269
It indicates that an invalid combination of bits was received. While it is possible to get other link integrity
errors on a link without SymbolErrors, this is not typical. Often if zero SymbolErrors are found, but there
are LinkDowns, or LinkErrorRecoveries, another read of the SymbolError counter will reveal that you just
happened to read it after it had been reset on a link recovery action.
Because of the training methods implemented on an IBM GX HCA port, SymbolErrors are detected as
part of the normal training. Furthermore, the implementation does not clear the errors after the final
training sequence. Therefore, there are somewhere between 88 - 102 SymbolErrors left in the counter after
every training sequence with the typical counts being in the 90s. This will occur after every CEC power
cycle, cable reseat, switch power cycle, or leaf reseat. Therefore, error counters must be cleared after any
one of these actions.
On an IBM GX HCA port, a SymbolError during a data transfer cycle would also result in a
PortRcvError. This is not the case on a switch port, or a non-IBM GX HCA port. More information about
interpreting SymbolErrors in combination with PortRcvErrors is available in “PortRcvErrors” on page 268.
While SymbolErrors are indicative of a noisy link, you can use the knowledge of the relationship between
SymbolErrors and PortRcvErrors reported by an IBM GX HCA port. This is to interpret if data is being
corrupted or if the problem is only on idle cycles.
It has been observed that sometimes SymbolErrors on idle increases when application workload increases.
This probably indicates that the move from data transfer to idle sets up the conditions that cause the
SymbolErrors.
Furthermore, IBM GX HCA ports might be observed to take two SymbolErrors in a short time period. It
is not possible to read the errors at a rapid enough rate to distinguish when the SymbolErrors occur
relative to each other. However, it is possible that these are occurring because of noise that affects two
symbols being received contiguously. This is why the minimum threshold is suggested to be 3.
Knowing the relationship between SymbolErrors and PortRcvErrors it is tempting to subtract the number
of PortRcvErrors from the number of SymbolErrors and use the difference to determine how many
SymbolErrors occurred on idle. However, because there are other causes for PortRcvErrors, this is not
advisable.
In any case, an increasing number of SymbolErrors during idle cycles will indicate an increased
probability of SymbolErrors during future data cycles. Therefore, SymbolErrors can be used as a method
to determine how immediate is to service the link.
The InfiniBand Trade Association spec allows 10-12 bit error rate. However, the QLogic and IBM
component designs are such that the expected bit error is between 10-15 and 10-14. This translates into an
error threshold of 10 errors over a 24 hour period.
Performance impact:
On a switch port or a non-IBM GX HCA port, it is difficult to assess whether SymbolErrors are
affecting performance. Because they can be logged during idle cycles and data transfer cycles,
and you cannot differentiate between the two. A more reliable clue is if you can trace Remote
Link Errors (PortRcvRemotePhysicalErrors or PortXmitDiscards) back to a link that has
SymbolErrors. More information about Remote Link Errors is available in “Remote Link Errors
(including congestion and link integrity)” on page 271.
On an IBM GX HCA port, it is easier to assess the impact of SymbolErrors. If a SymbolError
occurs on a data packet, the PortRcvError counter would be incremented, too. If a SymbolError
occurs on an idle cycle, only the SymbolError would be incremented. Therefore, with respect to
past performance impact, the PortRcvError counter must be considered instead of the
SymbolError counter. The SymbolError counter can be used as an indicator of the health of the
link and as the number of SymbolErrors increase, the odds of impacting performance increase.
Threshold: minimum actionable = 32
270
Power Systems: High performance clustering
Threshold: maximum in 24 hours = 10
Remote Link Errors (including congestion and link integrity)
The errors (PortRcvRemotePhysicalErrors and PortXmitDiscards) are typically indicative of an error on a
remote link that is affecting a local link.
PortRcvRemotePhysicalErrors:
PortRcvRemotePhysicalErrors indicate that a received packet was marked bad.
Depending on where the head of the packet is within the fabric and relative to this port, because of
cut-through routing, the packet might have been forwarded on toward the destination. In this case the
packet cannot be discarded. It must be marked bad so that the destination knows that it has been
corrupted elsewhere in the fabric.
Typically, this indicates that some remote port has taken a link integrity error and flagged the packet as
being bad. In such cases, you must be able to trace the PortRcvRemotePhysicalErrors in the fabric back to
a particular port that has taken link integrity errors. For more information, see “Example
PortRcvRemotePhysicalErrors analyses” on page 262.
If there are no link integrity errors that appear to have caused the PortRcvRemotePhysicalErrors, first
check the thresholds being used by iba_report to ensure that the link integrity errors are not being
masked because their thresholds are too high.
Although it is a relatively low probability, it is possible that a failing chip might cause the
PortRcvRemotePhysicalErrors to be detected by neighboring ports. Typically, in such cases, all of the
PortRcvRemotePhysicalErrors are being reported by ports connected to a particular leaf or spine and
there are no link integrity errors being reported anywhere in the fabric.
It has not been seen before, but if a leaf port connected to an HCA is reporting the
PortRcvRemotePhysicalErrors, it is possible that the HCA is faulty.
For more information, see “Example PortRcvRemotePhysicalErrors analyses” on page 262.
Performance impact: PortRcvRemotePhysicalErrors have performance impacts because they indicate
packets that would be dropped. For relatively low numbers of PortRcvRemotePhysicalErrors, it is
possible that there would be no observable impact to performance.
Threshold: minimum actionable = 4 (2)
Threshold: maximum in 24 hours = 100 (10)
The suggested thresholds were set with the intention of revealing problems that are not related to
downstream link integrity issues. Therefore, they might mask some of the more subtle problems. If this is
unacceptable, then you might use the thresholds in parentheses. However, this results in the requirement
to interpret more events and possibly needless complexity in interpreting error counters.
Upper level protocols might indicate that there are packet losses and there a no PortXmitDiscards or
PortRcvRemotePhysicalErrors being reported. In this case, you must temporarily reduce the thresholds to
see them.
PortXmitDiscards:
PortXmitDiscards indicate that a packet cannot progress beyond this output port and it must therefore be
discarded to make way for other packets that might be able to progress.
High-performance computing clusters using InfiniBand hardware
271
There are several reasons for such XmitDiscards:
v The packet switch lifetime limit has been exceeded. This is the most common issue and is caused by
congestion or a downstream link that went down. It can be common for certain applications with
communication patterns like All-to-All or All-to-one.
v The output port in inactive state. In other words, the link went down.
v The packet length exceeded neighbor MTU. This would be caused by a configuration problem.
v A packet timeout was changed in the SM configuration file to a value that is too low for the size of the
fabric that has been installed. Typically, the default values are used.
The most common reasons for a PortXmitDiscard are congestion, or a local or remote link going down, or
a link in the path to destination that is taking many errors and causing congestion.
The simplest thing to check is for link integrity errors downstream from the port reporting the
PortXmitDiscards. For more information, see “Example PortXmitDiscard analyses” on page 261.
Congestion is much more difficult to diagnose. Start by reading the fabric data and packet counters by
using a command like: iba_report –o comps –d 5 –s –F “nodepat:[switch IBNodeDescription
pattern]”. You can then look for hotspots where much more data might be flowing. Without knowing
the route being taken, you can look only for high-level patterns that might point to downstream
congestion.
Another technique for diagnosing congestion is to decrease the timeouts and see how the pattern of
PortXmitDiscards changes within the fabric. However, for each iteration of the experiment, this requires a
restart of the SM. In addition, the granularity of timeout changes is by powers of 2. Therefore, often, by
the time you have decreased the timeouts to a point where more than the original set of ports with
PortXmitDiscards is being recorded, almost every port starts reporting PortXmitDiscards, which is not
useful. Because of the complexity, this must be done under development direction.
Although it is a low probability, it is possible that a failing chip might cause the PortXmitDiscards to be
detected by neighboring ports. In such cases, all of the PortXmitDiscards are being reported by ports
connected to a particular leaf or spine and there are no link integrity errors being reported anywhere in
the fabric.
It has not been seen before, but if an HCA port is reporting the PortXmitDiscards, and there are no other
issues in the fabric, it is possible that the HCA is faulty.
For more information, see “Example PortXmitDiscard analyses” on page 261.
Performance impact: Because PortXmitDiscards indicate dropped packets, they can be indicators of
performance problems or the potential for performance problems. For relatively low numbers of
PortXmitDiscards, it is possible that there would be no observable impact to performance.
Threshold: minimum actionable = 4 (2)
Threshold: maximum in 24 hours = 100 (10)
The suggested thresholds were set with the intention of revealing problems that are not related to
downstream link integrity issues. Therefore, they may mask some of the more subtle problems. If this is
unacceptable, then you might use the thresholds in parantheses. However, this results in the required to
interpret more events and possibly needless complexity in interpreting error counters.
If the upper level protocols are indicating that there are packet losses and there a no PortXmitDiscards or
PortRcvRemotePhysicalErrors being reported, you must temporarily reduce the thresholds to see them.
272
Power Systems: High performance clustering
Security errors
Security errors (PortXmitConstraintErrors and PortRcvConstraintErrors) do not apply until the QLogic
code level reaches 4.4.
PortXmitConstraintErrors:
Indicates Partition Key violations, not expected with 4.3 and earlier SM.
For QLogic 4.4 and later SM can indicate incorrect Virtual Fabrics Config or Application Config
inconsistent with SM config.
Performance impact: PortXmitConstraintErrors can result in performance problems because they result in
dropped packets. In fact, the implication is that no packets would get through between the
source-destination pair associated with the affected packet.
Threshold: minimum actionable = 1
Threshold: maximum in 24 hours = 1
PortRcvConstraintErrors:
Indicates Partition Key violations, not expected with 4.3 and earlier SM.
For QLogic 4.4 and later SM can indicate incorrect Virtual Fabrics Config or Application Config
inconsistent with SM config.
Performance impact: PortRcvConstraintErrors can result in performance problems because they result in
dropped packets. In fact, the implication is that no packets would get through between the
source-destination pair associated with the affected packet.
Threshold: minimum actionable = 1
Threshold: maximum in 24 hours = 1
Other error counters
These error counters are of lesser importance.
VL15Dropped:
VL15Dropped errors indicate packets have been dropped on Virtual Lane 15, which is reserved for SM
traffic.
This is not unusual, especially when the SM is issuing multiple, concurrent SMA packets during
discovery and fabric sweeps. Therefore, the counter is normally ignored, except when debugging
problems that might be related to dropping SM packets, such as the SM marking available HCA ports as
having disappeared. Therefore, the need for debug is driven off seeing truly available fabric resources
disappearing in the SM logs.
If you must debug VL15Dropped errors, one technique is to create an iba_mon.conf file that sets the
VL15Dropped counter threshold to a non-zero value and run iba_report –o errors in a cronjob to track
the VL15Dropped errors. However, be sure to use the –F parameter on iba_report, and pick a time for the
cronjob that would not conflict with other cronjobs running iba_report, all_analysis or fabric_analysis
Performance impact: Because SMA packets are small, the retransmits that occur when there are
VL15Drops rarely hass no impact to application performance, unless the SM is incorrectly noting the
disappearance of fabric resources.
High-performance computing clusters using InfiniBand hardware
273
Threshold: minimum actionable = IGNORE except under debug.
Threshold: maximum in 24 hours = IGNORE except under debug.
PortRcvSwitchRelayErrors:
PortRcvSwitchRelayErrors indicate the number of discarded packets.
Note: There is a known bug in the Anafa2 switch chip that incorrectly increments for this counter for
multicast traffic (for example IPoIB). Therefore, it must be ignored
The counter is supposed to indicate the number of discarded packets because of:
v A problem with DLID mapping
v Virtual Lane mapping
v The packet looping between the input port and the output port
Performance impact: In the switch chips, the counter is incorrectly incremented. Therefore, you cannot
make any conclusions based on it being incremented.
Threshold: minimum actionable = IGNORE
Threshold: maximum in 24 hours = IGNORE
Clearing error counters
After the following actions/events on links with an IBM GX HCA port, error counters must be cleared.
These are all actions or events that cause a link to go down and come back up again.
v CEC power cycle
v CEC checkstop
v
v
v
v
v
v
A cable being pulled or reseated
A switch being power-cycled or rebooted
A leaf being reseated
An event in SFP that has the HCA in the FRU list
A power event that would have brought down the CEC
A power event in the switch
If you manually clear the error counters, the choice of thresholds for the periodic health checks can be
out-of-sync until the periodic clear described in the following is run. This can mask some links that are
running slightly above threshold until the next day. This is because the error thresholds that will be used
will be slightly higher because they are based on clearing the errors at a time before the manual clear.
This would most likely not be of consequence to the performance of the cluster. If the link is taking
enough errors to affect performance, then the higher thresholds being used would be exceeded and the
error would be surfaced. For example, if you manually clear the errors 12 hours after the periodic clear,
then when the health check is run one hour later, the symbol error threshold that the health check will
choose will be 5, instead of 3.
This problem of out-of-sync thresholds can be avoided if you use a health check wrapper script and error
clearing wrapper script as described in “Healthcheck control script” on page 277 and “Error counter
clearing script” on page 276.
You must also clear error counters before you read them the first time after installation.
274
Power Systems: High performance clustering
It is further suggested that you clear all error counters every 24 hours at a regular interval. There are
several ways to accomplish clear all error counters:
v The simplest method is to run a cronjob by using the iba_report in the following to reset errors on the
entire fabric. As noted in the following section, you would want to use “-o errors”, so that you do not
lose any errors that occur between the previous read and the clear. And you would probably also want
to point to the iba_mon.conf.24 file, as it would generally be 24 hours since the previous clear of the
error counters. The iba_mon.conf.24 file is explained in “Setting up periodic fabric health checking” on
page 158.
v Alternatively, in the cronjob, you might call “all_analysis” with a preceding setting of the
FF_FABRIC_HEALTH environment variable to cause the clear and the use of the iba_mon.conf.24 file.
v You might create a couple of scripts to track the clearing of errors and determine which iba_mon.conf.*
file to use, and call them in a cronjob.
Error counters for an entire subnet must be cleared with the following command:
iba_report –o none* –C –a –h [hca] –p [port] –F “nodepat:[switch IBNodeDescription pattern]”
[hca] = the HCA on the FM Server that is connected to the subnet
[port] = the port on the HCA on the FM Server that is connected to the subnet
Note:
v If you are using iba_report in a cronjob to reset errors, it is a good idea to use “-o errors” instead of “-o
none”. This is because it allows you another opportunity to read error counters. DO NOT include the
asterisk (*) as part of the command.
v Beginning with Fast Fabric 4.3, you can use iba_reports (plural of iba_report) to affect all subnets
attached to a Fabric Management Server (MS). Previously, it was common practice to build nested
loops to loop through each hca and port on the Fabric MS.
To reset counters on individual ports, you must use a focus (-F) with the nodeguid and port of the switch
port on the link:
iba_report –o none –C –a –h [hca] –p [port] –F “nodeguid:[switch chip GUID]:port:[switch chip port]”
[hca] = the HCA on the FM Server that is connected to the subnet
[port] = the port on the HCA on the FM Server that is connected to the subnet
Note: The –a might not be necessary for all levels of GFW code. However, it is safer to stay in the habit
of using it.
For an error counter clearing script that tracks when the most recent error counter clear was done, see
“Error counter clearing script” on page 276.
Example health check scripts
This section provides example health check scripts.
Because of the requirement to call all_analysis or iba_report with a configuration file containing the
correct error counter thresholds based on the last time error counters were cleared, setting up cron can be
rather complex and involve multiple entries. However, by creating a few simple scripts and by using
them for health checks, error counter reading, and error clearing, you can simplify cron and get more
accurate error counter monitoring.
The list of important scripts is:
v A script to clear all error counters and record when those errors were last cleared.
v A script to call all_analysis or fabric_analysis with appropriate parameters based on how long since the
last error clear. And keep a log file to get a quick history of health checks and their success.
v A set of iba_mon.conf files which include one file for every hour since the last clear was done – up to
24 hours.
High-performance computing clusters using InfiniBand hardware
275
v A configuration script that is called by the other scripts to set up common variables.
One key thing to remember is that these sets of scripts also must be run from cron. Therefore, full path
information is important.
This set of scripts does not address how to deal with more accurate error counter thresholds for
individual links that have had their error counters cleared at a different time from the other links. This
might happen after power cycling a CEC, or reseating a cable because of a service action. To account for
such situations, more guidance is given in “Improved healthcheck” on page 279.
Configuration script
This configuration script makes it easier to set up common variables for any special scripts that are
written for health checks.
This script is included in the other scripts.
#!/bin/bash
# Name of script: config
# fill in a full path to a file that “clearerrors” uses to track when
# errors have been cleared. This will also be used by the healthcheck
# script
CLEARFILE=”[full path to a file]”
# Fill in the pattern that matches all of the switches’
# IB Node Descriptions (also known as switch names)
swpat=”[matching pattern for switch IB node description]”
# CONFIGFILES is where you store the iba_mon.conf files
CONFIGFILES=”[where you store the iba_mon.conf files]”
# A log file for the healthcheck script.
ANALYSISLOG="/var/opt/iba/analysis/all_analysis.log"
# This is the default list of Fabric MS ports. Alter if necessary.
PORTSF=”/etc/sysconfig/iba/ports”
Error counter clearing script
A key aspect of this script is to store the timestamp when the counters were cleared.
This is dependent on “Configuration script”
#!/bin/bash
# Name of script: clearerrors
#---------------------------------------------------------------# Include the configuration script. Assume that it is in the same
# directory as this script.
. ${0%/*}/config
# Store the epoch for the date. This will be used for the
echo `date +"%s"` > $CLEARFILE
# Loop through the ports in the ports file
# If you have Fast Fabric 4.3 or later, you can use “iba_reports” instead
# instead of a loop -> remove the for, the done, and the set of $h and $p
for ps in `cat $PORTSF | grep -v "#"`; do
h=${ps:0:1}; p=${ps:2:1};
iba_report -C -a -o errors -h $h -p $p -F "nodepat:$swpat";
e
276
Power Systems: High performance clustering
Healthcheck control script
This script not only chooses the appropriate iba_mon.conf file and calls all_analysis, but it also adds
entries to a log file ($ANALYSISLOG, which is set up in the configuration file).
It is assumed that the user has set-up /etc/sysconfig/fastfabric.conf appropriately for his configuration.
The user would check the $ANALYSISLOG file on a regular basis to see if there are problems being
reported. An example of $ANALYSISLOG entries are found after the script.
It is dependent on “Configuration script” on page 276 and “Error counter clearing script” on page 276.
The error counter clearing script is especially important for the health check control scripts ability to
calculate the time since the most recent clearing of error counters.
#!/bin/bash
# Name of script: healthcheck
#---------------------------------------------------------------# Include the configuration script. Assume that it is in the same
# directory as this script.
. ${0%/*}/config
# The base iba_mon.conf file name
IBAMON="$CONFIGFILES/iba_mon.conf"
# Get current timestamp information – in epoch and human readable time
now=`date +"%s"`
timestamp=`date +"%H:%M:%S %m/%d/%y"`
# Get the timestamp of the last clear.
# If there was not one done, set it to zero.
prev=`cat $CLEARFILE`
if [[ $prev == "" ]]; then
prev=0
fi
# Calculate the difference between now and the last clear
((diff=($now-$prev)))
(( diffh=$diff/3600 ))
(( diffr=$diff%3600 ))
if (( diffr >= 1800 )); then
((diffh=$diffh+1))
fi
if [[ $diffh -gt 24 ]]; then
diffh=24
fi
#------------------------------------------------------------------------# If it’s been less than 24 hours since the last clear, simply read the
# error counters.
# If it’s been 24 or more hours since the last clear, read and clear the
# error counters.
#------------------------------------------------------------------------if [[ $diffh -lt 24 ]]; then
#------------------------# Log what is being done
#------------------------echo "###############################################################" >> $ANALYSISLOG
echo "# $timestamp : ~$diffh hours since last recorded counter clear" >> $ANALYSISLOG
echo "# using $IBAMON.$diffh for thresholds" >> $ANALYSISLOG
echo “###############################################################" >> $ANALYSISLOG
High-performance computing clusters using InfiniBand hardware
277
#---------------------------------------------------------------# Run all_analysis with the appropriate iba_mon file based on the
# number of hours since the last clear ($diffh).
# This relies on the default set up for FF_FABRIC_HEALTH in the
# /etc/sysconfig/fastfabric.conf file.
#
# Log the STDOUT and STDERR of all_analysis.
#---------------------------------------------------------------/sbin/all_analysis -s -c $IBAMON.$diffh >> $ANALYSISLOG 2>&1
#---------------------------------------------------------------------# Else, it’s been more than 24 hours since the last clear.
# Read and clear the error counters.
#---------------------------------------------------------------------else
#---------------------------------------------------------------# Log the information regarding clearing of the errors
#---------------------------------------------------------------echo $now > $CLEARFILE
echo "###############################################################" >> $ANALYSISLOG
echo "# $timestamp : 24 hours since last recorded counter clear" >> $ANALYSISLOG
echo "# CLEARING COUNTERS on the run" >> $ANALYSISLOG
echo "###############################################################" >> $ANALYSISLOG
#---------------------------------------------------------------# Run all_analysis with the appropriate iba_mon file based on the
# number of hours since the last clear (24). Clear the error
# counters after that.
#
# Feed all_analysis the appropriate FF_FABRIC_HEALTH settings.
# This is pretty close to what should be the default in the
# /etc/sysconfig/fastfabric.conf file. The only difference is
# the use of the –C parameter to clear the errors.
#
# Log the STDOUT and STDERR of all_analysis.
#---------------------------------------------------------------FF_FABRIC_HEALTH=" -s -C -a -o errors -o slowlinks
-F nodepat:$swpat" /sbin/all_analysis -s -c $IBAMON.24 >> $ANALYSISLOG 2>&1
fi
Keeping in mind that the healthcheck script calls all_analysis, if there are no errors reported. The
following example is what would be seen in $ANALYSISLOG. It starts out with the comment about
when the script was run and how many hours since the last error counter clear, along with which
threshold file it is going to pass to all_analysis. Note, that all_analysis has returned “All OK”.
###############################################################
# 19:00:01 03/06/09 : ~1 hours since last recorded counter clear
# using /root/fmtools/health/Configfiles/iba_mon.conf.1 for thresholds
###############################################################
fabric_analysis: Fabric(s) OK
chassis_analysis: Chassis OK
all_analysis: All OK
The following example illustrates errors being found several hours after the last error counter clear. In
this case, the subnet connected to the Fabric MS HCA 2, port 2, has errors that are recorded in
/var/opt/iba/analysis/2009-03-06-18:00:01/fabric.2:2.errors.
###############################################################
# 21:00:01 03/06/09 : ~3 hours since last recorded counter clear
# using /root/fmtools/health/Configfiles/iba_mon.conf.3 for thresholds
###############################################################
fabric_analysis: Port 2:2: Fabric possible errors found.
278
Power Systems: High performance clustering
See /var/opt/iba/analysis/latest/fabric.2:2.errors
fabric_analysis: Failure information saved to: /var/opt/iba/analysis/2009-03-06-21:00:01/
fabric_analysis: Possible fabric errors or changes found
chassis_analysis: Chassis OK
all_analysis: Possible errors or changes found
The following example illustrates reading error counters 24 hours since the last error counter clear, which
triggers healthcheck to call all_analysis to also clear the errors after reading them.
###############################################################
# 14:00:01 04/13/09 : 24 hours since last recorded counter clear
# CLEARING COUNTERS on the run
###############################################################
fabric_analysis: Fabric(s) OK
chassis_analysis: Chassis OK
all_analysis: All OK
Cron setup on the Fabric MS
This information provides up details on the cron set on the Fabric MS.
The following entry in cron on the Fabric MS would run the healthcheck script every hour, on the hour.
0 * * * * /root/fmtools/health/healthcheck
The healthcheck script must be run at least once per day.
If you are running the healthcheck only a few times a day, it is preferred that you also run an error
counter collection every hour and store the results for future reference during more advanced debugging.
The following entry in cron uses iba_reports to accomplish this. This would work only for FastFabric 4.3
and later. For older versions of FastFabric, a script must be written to loop through all of the 30 * * * *
/sbin/iba_reports –o errors –F “nodepat:[switch name pattern” > [output directory].
Improved healthcheck
For even more accurate error monitoring, you can also track the clearing of specific error counters. And
target those links that must have lower error counter thresholds based on their last error counter clears,
and run targeted error queries against them.
Example scripts for this would not be provided, but some ideas on algorithms would be presented. It is
assumed that you are already familiar with the methods and scripts presented in “Example health check
scripts” on page 275.
To clear errors on a specific link, instead of issuing iba_report –C with the usual –F “nodepat:$swpat”
parameter, you can use the nodeguid and port of a switch port on the link for the Focus. For example,
the following command can be used, to reset port 3 associated with node GUID 0x00066a0007000de7:
iba_report –o errors –C –F “nodeguid: 0x00066a0007000de7:port:3”
The script that clears a link error counters must write the timestamp to a file that includes the node
GUID and port in its name, so that a health check script can refer to it. This file would be called a
link-clear file.
When the script that clears all error counters runs, it must delete link-clear files for the individual links
that were cleared in the time between the last all error counter clear and the current one.
When the health check script runs, it must look for any link-clear files and extract the node GUID and
port, and the timestamp of the clear. It must then run a targeted report on each link separately. It is
possible that the same link would be called out more than once.
High-performance computing clusters using InfiniBand hardware
279
Finally, in order to ensure that data is lost between calls of all_analysis, there must be a sleep between
each call. The sleep must be at least one second to ensure that error results are written to a separate
directory.
The following section illustrates the logic described in the preceding paragraph.
v Clearerrors:
Store epoch time in “lastclear” file. (date +”%s”)
Run iba_report –o errors –C on all subnets connected to Fabric MS
v Clearlinkerrors:
#----------------------------------------------------------------------# The link-clear filename is constructed using all of the significant
# information required
#----------------------------------------------------------------------Take switch node GUID ($nodeguid) and port ($nodeport),
and Fabric MS HCA ($hca) and port ($hcaport) as input parameters.
Store epoch time in “lastclear.$nodeguid:$nodeport.$hca:$hcaport” file (date +”%s”)
On all subnets, run iba_report –o errors –C –h $hca –p $hcaport –F “nodepat:$swpat”
(use iba_reports for FF 4.3 and later)
v Healthcheck:
#----------------------------------------------------------------------# Review the simpler healthcheck provided in: 8.3 Healthcheck control script.
# Similar techniques are used here and anything for logging and running
# full error counter queries and clears can be the same.
#----------------------------------------------------------------------# There are multiple ways to achieve an equivalent result. The main
# decision point is how to handle the single link-clear files relative to
# the full clear after 24 hours. You either have to separate the clear
# from the full read and do it last, or, first read the single link errors
# based on the list of existing single link-clear files.
# In any case, if the 24 hour point has been reached, when you get to the
# end of script, you will clear out the single link error files.
#
# This example script will read the full errors first, then the single
# link errors and finishes with the full clear (if required).
# This is done so that it may also ignore any single link-clear files
# for links that are already reported in the full error counter query.
#---------------------------------------------------------------------#
#
#
#
For brevity, full pathnames to files and utilities are not used.
It is assumed that you know those paths, and will program them as
required; keeping in mind that healthcheck will be run by cron and
full pathnames are most likely a requirement.
$HEALTHY=1
# Assume that everything will be okay
As in 8.3 Healthcheck control script, calculate the number of hours
since the last full clear of error counters, using the “last clear file”,
and store in $diffh. If > 24 hours, set $diffh=24.
Set the iba_mon file to iba_mon.conf.$diffh (store in $IBAMON)
Write info to the analysis log file regarding current timestamp,
time since last clear and chosen iba_mon.conf.* file.
Run /sbin/all_analysis -s -c $IBAMON
(Redirect STDOUT and STDERR to the analysis log file.)
Determine if there were any fabric errors reported by checking the
analysis log file. If the result is “all_analysis: All OK”,
set $ERRORS=”NONE”. If the analysis log file has a
“fabric.*.errors” file listed, get the directory into which it is stored,
and keep that directory name in $ERRORS. Use the directory with the
280
Power Systems: High performance clustering
timestamp in the name, not the one with “latest” in the name.
Also, if the result does not have “all_analysis: All OK”, set $HEALTHY=0.
Run ls lastclear.*:* to get the list of link-clear files
Loop through the list of link-clear files {
Get the nodeguid ($nodeguid), the node port ($nodeport),
the Fabric MS HCA ($hca) and HCA port ($hcaport) from the link-clear filename
# needs the space before $nodeport
Determine if the link already has an error reported by the
full error counter query. Use, grep “$nodeguid.* $nodeport SW” $ERRORS/fabric*
(It will be report
if link not already reported in full error report { # else skip it
# Sleep – just to differentiate the timestamps for error output
# directories.
sleep 1
Get current time in epoch and timestamp
$epoch=`date +”%s”`
$timestamp=`date +”%Y-%m-%d-%H:%M:%S”
Calculate the time difference between now and the time the link was cleared.
Store result in $diffh.
Set the iba_mon file to iba_mon.conf.$diffh (store in $IBAMON)
Write info to the analysis log file regarding current
$nodeguid:$nodeport, $hca:$hcaport, timestamp,
time since last clear and chosen iba_mon.conf.* file.
#
#
#
#
#
running all_analysis is problematic when targeting a
specific link. Furthermore, it queries much more than
is required to cover just the error counter.
Therefore, you want to mimic the all_analysis output
format, but use iba_report.
iba_report –o errors –c $IBAMON –h $hca –p $hcaport > [TMPFILE]
If any errors reported in the tempfile {
Write to analysis log that there are errors that will be listed in
/var/opt/iba/analysis/$timestamp/fabric.$hca:$hcaport.errors
Copy the temp file to a permanent record using:
mv [TMPFILE] /var/opt/iba/analysis/$timestamp/fabric.$hca:$hcaport.errors
Set $HEALTHY=0
} else {
Write to analysis log that there were no errors found.
}
}
}
# See if need to do full error clear. This will also drive deleting any
# existing link-clear files
if $diffh == 24 {
Run clearerrors script
Delete all link-clear files (from list that was found above)
High-performance computing clusters using InfiniBand hardware
281
}
if $HEALTHY == 0 {
write to analysis log file, 'HEALTHCHECK problems’
} else {
write to analysis log file, 'HEALTHCHECK “All OK”’
}
282
Power Systems: High performance clustering
Notices
This information was developed for products and services offered in the U.S.A.
The manufacturer may not offer the products, services, or features discussed in this document in other
countries. Consult the manufacturer's representative for information on the products and services
currently available in your area. Any reference to the manufacturer's product, program, or service is not
intended to state or imply that only that product, program, or service may be used. Any functionally
equivalent product, program, or service that does not infringe any intellectual property right of the
manufacturer may be used instead. However, it is the user's responsibility to evaluate and verify the
operation of any product, program, or service.
The manufacturer may have patents or pending patent applications covering subject matter described in
this document. The furnishing of this document does not grant you any license to these patents. You can
send license inquiries, in writing, to the manufacturer.
The following paragraph does not apply to the United Kingdom or any other country where such
provisions are inconsistent with local law: THIS INFORMATION IS PROVIDED “AS IS” WITHOUT
WARRANTY OF ANY KIND, EITHER EXPRESS OR IMPLIED, INCLUDING, BUT NOT LIMITED TO,
THE IMPLIED WARRANTIES OF NON-INFRINGEMENT, MERCHANTABILITY OR FITNESS FOR A
PARTICULAR PURPOSE. Some states do not allow disclaimer of express or implied warranties in certain
transactions, therefore, this statement may not apply to you.
This information could include technical inaccuracies or typographical errors. Changes are periodically
made to the information herein; these changes will be incorporated in new editions of the publication.
The manufacturer may make improvements and/or changes in the product(s) and/or the program(s)
described in this publication at any time without notice.
Any references in this information to Websites not owned by the manufacturer are provided for
convenience only and do not in any manner serve as an endorsement of those Websites. The materials at
those Websites are not part of the materials for this product and use of those Websites is at your own
risk.
The manufacturer may use or distribute any of the information you supply in any way it believes
appropriate without incurring any obligation to you.
Any performance data contained herein was determined in a controlled environment. Therefore, the
results obtained in other operating environments may vary significantly. Some measurements may have
been made on development-level systems and there is no guarantee that these measurements will be the
same on generally available systems. Furthermore, some measurements may have been estimated through
extrapolation. Actual results may vary. Users of this document should verify the applicable data for their
specific environment.
Information concerning products not produced by this manufacturer was obtained from the suppliers of
those products, their published announcements or other publicly available sources. This manufacturer has
not tested those products and cannot confirm the accuracy of performance, compatibility or any other
claims related to products not produced by this manufacturer. Questions on the capabilities of products
not produced by this manufacturer should be addressed to the suppliers of those products.
All statements regarding the manufacturer's future direction or intent are subject to change or withdrawal
without notice, and represent goals and objectives only.
© Copyright IBM Corp. 2011
283
The manufacturer's prices shown are the manufacturer's suggested retail prices, are current and are
subject to change without notice. Dealer prices may vary.
This information is for planning purposes only. The information herein is subject to change before the
products described become available.
This information contains examples of data and reports used in daily business operations. To illustrate
them as completely as possible, the examples include the names of individuals, companies, brands, and
products. All of these names are fictitious and any similarity to the names and addresses used by an
actual business enterprise is entirely coincidental.
If you are viewing this information in softcopy, the photographs and color illustrations may not appear.
The drawings and specifications contained herein shall not be reproduced in whole or in part without the
written permission of the manufacturer.
The manufacturer has prepared this information for use with the specific machines indicated. The
manufacturer makes no representations that it is suitable for any other purpose.
The manufacturer's computer systems contain mechanisms designed to reduce the possibility of
undetected data corruption or loss. This risk, however, cannot be eliminated. Users who experience
unplanned outages, system failures, power fluctuations or outages, or component failures must verify the
accuracy of operations performed and data saved or transmitted by the system at or near the time of the
outage or failure. In addition, users must establish procedures to ensure that there is independent data
verification before relying on such data in sensitive or critical operations. Users should periodically check
the manufacturer's support websites for updated information and fixes applicable to the system and
related software.
Trademarks
IBM, the IBM logo, and ibm.com are trademarks or registered trademarks of International Business
Machines Corp., registered in many jurisdictions worldwide. Other product and service names might be
trademarks of IBM or other companies. A current list of IBM trademarks is available on the Web at
Copyright and trademark information at www.ibm.com/legal/copytrade.shtml.
Adobe, the Adobe logo, PostScript, and the PostScript logo are either registered trademarks or trademarks
of Adobe Systems Incorporated in the United States, and/or other countries.
INFINIBAND, InfiniBand Trade Association, and the INFINIBAND design marks are trademarks and/or
service marks of the INFINIBAND Trade Association.
Intel, Intel logo, Intel Inside, Intel Inside logo, Intel Centrino, Intel Centrino logo, Celeron, Intel Xeon,
Intel SpeedStep, Itanium, and Pentium are trademarks or registered trademarks of Intel Corporation or its
subsidiaries in the United States and other countries.
Linux is a registered trademark of Linus Torvalds in the United States, other countries, or both.
Microsoft, Windows, Windows NT, and the Windows logo are trademarks of Microsoft Corporation in the
United States, other countries, or both.
Red Hat, the Red Hat "Shadow Man" logo, and all Red Hat-based trademarks and logos are trademarks
or registered trademarks of Red Hat, Inc., in the United States and other countries.
UNIX is a registered trademark of The Open Group in the United States and other countries.
284
Power Systems: High performance clustering
Java and all Java-based trademarks and logos are trademarks or registered trademarks of Oracle and/or
its affiliates.
Other product and service names might be trademarks of IBM or other companies.
Electronic emission notices
When attaching a monitor to the equipment, you must use the designated monitor cable and any
interference suppression devices supplied with the monitor.
Class A Notices
The following Class A statements apply to the IBM servers that contain the POWER7 processor and its
features unless designated as electromagnetic compatibility (EMC) Class B in the feature information.
Federal Communications Commission (FCC) statement
Note: This equipment has been tested and found to comply with the limits for a Class A digital device,
pursuant to Part 15 of the FCC Rules. These limits are designed to provide reasonable protection against
harmful interference when the equipment is operated in a commercial environment. This equipment
generates, uses, and can radiate radio frequency energy and, if not installed and used in accordance with
the instruction manual, may cause harmful interference to radio communications. Operation of this
equipment in a residential area is likely to cause harmful interference, in which case the user will be
required to correct the interference at his own expense.
Properly shielded and grounded cables and connectors must be used in order to meet FCC emission
limits. IBM is not responsible for any radio or television interference caused by using other than
recommended cables and connectors or by unauthorized changes or modifications to this equipment.
Unauthorized changes or modifications could void the user's authority to operate the equipment.
This device complies with Part 15 of the FCC rules. Operation is subject to the following two conditions:
(1) this device may not cause harmful interference, and (2) this device must accept any interference
received, including interference that may cause undesired operation.
Industry Canada Compliance Statement
This Class A digital apparatus complies with Canadian ICES-003.
Avis de conformité à la réglementation d'Industrie Canada
Cet appareil numérique de la classe A est conforme à la norme NMB-003 du Canada.
European Community Compliance Statement
This product is in conformity with the protection requirements of EU Council Directive 2004/108/EC on
the approximation of the laws of the Member States relating to electromagnetic compatibility. IBM cannot
accept responsibility for any failure to satisfy the protection requirements resulting from a
non-recommended modification of the product, including the fitting of non-IBM option cards.
This product has been tested and found to comply with the limits for Class A Information Technology
Equipment according to European Standard EN 55022. The limits for Class A equipment were derived for
commercial and industrial environments to provide reasonable protection against interference with
licensed communication equipment.
European Community contact:
IBM Deutschland GmbH
Notices
285
Technical Regulations, Department M456
IBM-Allee 1, 71139 Ehningen, Germany
Tele: +49 7032 15-2937
email: [email protected]
Warning: This is a Class A product. In a domestic environment, this product may cause radio
interference, in which case the user may be required to take adequate measures.
VCCI Statement - Japan
The following is a summary of the VCCI Japanese statement in the box above:
This is a Class A product based on the standard of the VCCI Council. If this equipment is used in a
domestic environment, radio interference may occur, in which case, the user may be required to take
corrective actions.
Japanese Electronics and Information Technology Industries Association (JEITA)
Confirmed Harmonics Guideline (products less than or equal to 20 A per phase)
Japanese Electronics and Information Technology Industries Association (JEITA)
Confirmed Harmonics Guideline with Modifications (products greater than 20 A per
phase)
Electromagnetic Interference (EMI) Statement - People's Republic of China
Declaration: This is a Class A product. In a domestic environment this product may cause radio
interference in which case the user may need to perform practical action.
286
Power Systems: High performance clustering
Electromagnetic Interference (EMI) Statement - Taiwan
The following is a summary of the EMI Taiwan statement above.
Warning: This is a Class A product. In a domestic environment this product may cause radio interference
in which case the user will be required to take adequate measures.
IBM Taiwan Contact Information:
Electromagnetic Interference (EMI) Statement - Korea
Germany Compliance Statement
Deutschsprachiger EU Hinweis: Hinweis für Geräte der Klasse A EU-Richtlinie zur
Elektromagnetischen Verträglichkeit
Dieses Produkt entspricht den Schutzanforderungen der EU-Richtlinie 2004/108/EG zur Angleichung der
Rechtsvorschriften über die elektromagnetische Verträglichkeit in den EU-Mitgliedsstaaten und hält die
Grenzwerte der EN 55022 Klasse A ein.
Um dieses sicherzustellen, sind die Geräte wie in den Handbüchern beschrieben zu installieren und zu
betreiben. Des Weiteren dürfen auch nur von der IBM empfohlene Kabel angeschlossen werden. IBM
übernimmt keine Verantwortung für die Einhaltung der Schutzanforderungen, wenn das Produkt ohne
Zustimmung von IBM verändert bzw. wenn Erweiterungskomponenten von Fremdherstellern ohne
Empfehlung von IBM gesteckt/eingebaut werden.
Notices
287
EN 55022 Klasse A Geräte müssen mit folgendem Warnhinweis versehen werden:
"Warnung: Dieses ist eine Einrichtung der Klasse A. Diese Einrichtung kann im Wohnbereich
Funk-Störungen verursachen; in diesem Fall kann vom Betreiber verlangt werden, angemessene
Maßnahmen zu ergreifen und dafür aufzukommen."
Deutschland: Einhaltung des Gesetzes über die elektromagnetische Verträglichkeit von Geräten
Dieses Produkt entspricht dem “Gesetz über die elektromagnetische Verträglichkeit von Geräten
(EMVG)“. Dies ist die Umsetzung der EU-Richtlinie 2004/108/EG in der Bundesrepublik Deutschland.
Zulassungsbescheinigung laut dem Deutschen Gesetz über die elektromagnetische Verträglichkeit von
Geräten (EMVG) (bzw. der EMC EG Richtlinie 2004/108/EG) für Geräte der Klasse A
Dieses Gerät ist berechtigt, in Übereinstimmung mit dem Deutschen EMVG das EG-Konformitätszeichen
- CE - zu führen.
Verantwortlich für die Einhaltung der EMV Vorschriften ist der Hersteller:
International Business Machines Corp.
New Orchard Road
Armonk, New York 10504
Tel: 914-499-1900
Der verantwortliche Ansprechpartner des Herstellers in der EU ist:
IBM Deutschland GmbH
Technical Regulations, Abteilung M456
IBM-Allee 1, 71139 Ehningen, Germany
Tel: +49 7032 15-2937
email: [email protected]
Generelle Informationen:
Das Gerät erfüllt die Schutzanforderungen nach EN 55024 und EN 55022 Klasse A.
Electromagnetic Interference (EMI) Statement - Russia
Terms and conditions
Permissions for the use of these publications is granted subject to the following terms and conditions.
Personal Use: You may reproduce these publications for your personal, noncommercial use provided that
all proprietary notices are preserved. You may not distribute, display or make derivative works of these
publications, or any portion thereof, without the express consent of the manufacturer.
Commercial Use: You may reproduce, distribute and display these publications solely within your
enterprise provided that all proprietary notices are preserved. You may not make derivative works of
these publications, or reproduce, distribute or display these publications or any portion thereof outside
your enterprise, without the express consent of the manufacturer.
288
Power Systems: High performance clustering
Except as expressly granted in this permission, no other permissions, licenses or rights are granted, either
express or implied, to the publications or any information, data, software or other intellectual property
contained therein.
The manufacturer reserves the right to withdraw the permissions granted herein whenever, in its
discretion, the use of the publications is detrimental to its interest or, as determined by the manufacturer,
the above instructions are not being properly followed.
You may not download, export or re-export this information except in full compliance with all applicable
laws and regulations, including all United States export laws and regulations.
THE MANUFACTURER MAKES NO GUARANTEE ABOUT THE CONTENT OF THESE
PUBLICATIONS. THESE PUBLICATIONS ARE PROVIDED "AS-IS" AND WITHOUT WARRANTY OF
ANY KIND, EITHER EXPRESSED OR IMPLIED, INCLUDING BUT NOT LIMITED TO IMPLIED
WARRANTIES OF MERCHANTABILITY, NON-INFRINGEMENT, AND FITNESS FOR A PARTICULAR
PURPOSE.
Notices
289
290
Power Systems: High performance clustering