1
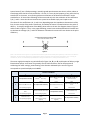
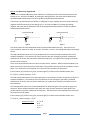
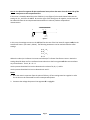
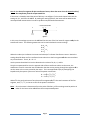
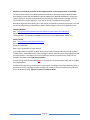
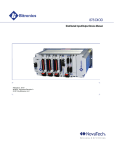
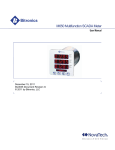
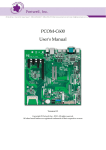
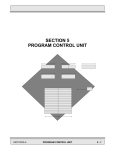
Objective: Calculate the settings required to configure an M650 so its power and energy measure‐
ments represent the power and energy at some Point of Delivery, other than the location where the meter is actually connected, compensating for losses between the two points. Loss compensation on the M650 takes the following general form: PCOM = PUNC + A∙I2 + B∙V2 + E∙PUNC QCOM = QUNC + C∙I2 + D∙V4 + E∙QUNC Where: PCOM Compensated three‐phase total watts. Note the accumulators for +kWh and –kWh in the M650 are calculated by integrating the PCOM measurement over time. PUNC Uncompensated three‐phase total watts measured at the point where the meter is connected. QCOM Compensated three‐phase total VARs. Note the accumulators for +kVARh and –kVARh in the M650 are calculated by integrating the QCOM measurement over time. QUNC Uncompensated three‐phase total VARs measured at the point where the meter is connected. I RMS line current measured at the point where the meter is connected. V RMS line‐line voltage measured at the point where the meter is connected. A Meter setting that accounts for the sum of the load‐related‐watt‐losses from all sources. B Meter setting that accounts for the transformer’s no‐load‐watt‐losses. C Meter setting that accounts for the sum of the load‐related‐VAR‐losses from all sources. D Meter setting that accounts for the transformer’s no‐load‐VAR‐losses. E Meter setting that accounts for any “system” losses, proportional to the uncompensated power. Configuring the meter to perform loss compensation simply requires the user to calculate the coefficients A, B, C, D, and E defined above, and enter them in the appropriate fields in the M650’s webserver interface. (See Figure 1.) Figure 1. Loss Compensation Settings on the M650 The sign of the settings A, B, C, D, and E determines whether losses will be added to or subtracted from the uncompensated measurements in order to determine the compensated power and energy. To add losses, be sure the settings are all positive. To subtract losses, be sure the settings are all negative. Settings should always have the same sign. Making all of the settings equal to zero turns off loss compensation. Page1
System losses (E) are a fixed percentage, mutually agreed upon between two electric utilities, about an interchange point that lies on a branched line. As such, E is not a physical property of any particular line, transformer or the meter, so no further guidance on how best to calculate the coefficient E can be provided here. All instructions following will be concerned only with the calculation of the coefficients A, B, C, and D. Users who do not intend to use system losses should simply set E equal to zero. The values for the coefficients A, B, C, and D vary depending upon the impedance characteristics of the lines, the test results of the power transformer, and where the meter is located relative to the point of delivery. To simplify configuration of the M650, please refer to the one‐line diagram shown in Figure 2 and the table in Figure 3. Then, in the pages following, several cases are described which illustrate how to calculate the settings A, B, C, and D for whatever orientation the meter will have relative to the point of delivery. Figure 2. (Note: The notation used in Figure 1 to represent the locations of the meter and the point of delivery is the lower‐case letters a through d. On the previous page the four configuration settings use upper case italic letters A through D. This is strictly for convenience, there is no relationship implied between setting A and location a, setting B and location b, etc.) The meter might be located at any point defined in Figure 2; a, b, c, or d; and the point of delivery might likewise be at a, b, c, or d. Power may actually flow in either direction. But for the purposes of calculating the meter settings, power flowing in the direction indicated by the arrow in Figure 2 corresponds to a positive display on the M650. Location of the Meter
a
Point of Delivery
a
b
No compensation necessary.
Subtract Line ab losses only.
b
c
d
Add Line ab losses only.
Add Line ab and Transformer losses.
Add Line ab, Line cd, and Transformer losses.
Case 1
Case 3
Case 5
Add Transformer losses only.
Add Transformer and Line cd losses.
Case 4
Same as Case 2
No compensation necessary.
Case 1 (settings negative)
c
d
Subtract Line ab and Transformer Subtract Transformer losses only.
losses.
Case 2 (settings negative)
Case 4 (settings negative)
Subtract Line ab, Line cd, and Transformer losses.
Subtract Transformer and Line cd losses.
Same as Case 3 (settings negative)
Case 5 (settings negative)
Figure 3. Page2
No compensation necessary.
Add Line cd losses only.
Same as Case 1
Subtract Line cd losses only.
Same as Case 1 (settings negative)
No compensation necessary.
Case 1: Line losses only, segment ab. If the meter is located at b and the point of delivery is at a (Figure 4) the results shown below are the settings A, B, C, and D for the M650. By making the settings positive, the losses will be added to the uncompensated measurements in order to produce compensated measurements. If the meter is at a and the point of delivery is at b (Figure 5) then multiply the results shown below by negative one before entering as the settings A, B, C, and D on the M650. By making the settings negative, the losses will be subtracted from the uncompensated measurements in order to produce compensated measurements. Direction of power flow.
a
b
Point of
Delivery
M
c
Figure 4 Direction of power flow.
d
a
b
c
M
Point of
Delivery
d
Figure 5 Line losses consist of load‐related‐watt‐losses and load‐related‐VAR‐losses only. There are no line losses, either for watts or for VARs, at no‐load. Therefore, in Case 1, the settings B and D are both equal to zero. The load‐related‐watt‐losses of a line are proportional to its resistance (real‐component of the line’s complex impedance). The resistivity of a line (resistance per unit of length) is generally a published characteristic of the line, but may also be measured empirically. So in general the setting A just equals the line’s total resistance. There are a couple possible sources of error to watch out for, however. When multiple conductors per‐
phase are used, the total resistance of each phase is the parallel resistance of all the conductors on that phase. The resistance of a three‐phase line is the sum of the resistance of each phase. If the resistivity (r/l) of the line is given, and the length (L) of the line from a to b is known, then R = (r/l) x L, and the setting A = 3 x R. The load‐related‐VAR‐losses of a line are proportional to its reactance (reactive‐component of the line’s complex impedance). The reactivity of a line (reactance per unit of length) is generally a published characteristic of the line, but may also be measured. So in general the setting C just equals the line’s total reactance. The same potential sources of error described above for determining the line’s resistance apply to its reactance: When multiple conductors per‐phase are used, the total reactance of each phase is the parallel reactance of all the conductors on that phase. The reactance of a three‐phase line is the sum of the reactance of each phase. If the reactivity (x/l) of the line is given, and the length (L) of the line from a to b is known, then X = (x/l) x L, and the setting C = 3 x X. Results for Case 1: A = 3 x R B = 0 C = 3 x X D = 0 Page3
Case 2: Line losses for segment ab plus transformer losses, where the meter is on the same side of the transformer as the compensated line. If the meter is located at a and the point of delivery is at c (Figure 6) the results shown below are the settings A, B, C, and D for the M650. Be sure the signs of the settings are all negative, so the losses will be subtracted from the uncompensated measurements in order to produce compensated measurements. Direction of power flow.
a
M
b
c
d
Point of
Delivery
Figure 6 In this case, the settings to enter on the M650 will be the sum of the line losses for segment ab plus the transformer losses. (See note 2, below.) The following statements can be used calculate the meter settings. A = AT + AL B = BT C = CT + CL D = DT Where the subscript L indicates Line Losses and subscript T indicates Transformer Losses. Notice the settings B and D above are for transformer losses alone since the line segment ab does not contribute any no‐load‐losses. That is, BL = DL = 0. Use the process described in Case 4 to determine the values of AT, BT, CT, and DT. Use the process described in Case 1 to determine AL and CL. Notes: 1. Since the meter is upstream from the point of delivery, all four settings must be negative in order for the losses to be subtracted from the uncompensated power. 2. Presumes the voltage drop across line segment ab is negligible. Page4
Case 3: Line losses for segment ab plus transformer losses, where the meter is on the opposite side of the transformer from the compensated line. If the meter is located at c and the point of delivery is at a (Figure 7) the results shown below are the settings A, B, C, and D for the M650. By making the settings positive, the losses will be added to the uncompensated measurements in order to produce compensated measurements. Direction of power flow.
a
Point of
Delivery
b
c
d
M
Figure 7 In this case, the settings to enter on the M650 will be the sum of the line losses for segment ab plus the transformer losses. The following statements can be used calculate the meter settings. A = AT + AL B = BT C = CT + CL D = DT Where the subscript L indicates Line Losses and subscript T indicates Transformer Losses. Notice the settings B and D above are for transformer losses alone since the line segment ab does not contribute any no‐load‐losses. That is, BL = DL = 0. Use the process described in Case 4 to determine the values of AT, BT, CT, and DT. Since the compensated line is on the opposite side of the transformer relative to the meter, the coefficients AL and CL must take into consideration that the current passing through line segment ab is not the same as the current sensed by the meter. This is accomplished simply by multiplying line impedance by the square of the turns ratio of the power transformer: AL = 3 x R x ( Vc / Vb )2 CL = 3 x X x ( Vc / Vb )2 Where R is the total resistance of one phase of line segment ab, X is the total reactance of the line segment, and ( Vc / Vb ) is the turns ratio of the power transformer. Note: Since the meter is downstream from the point of delivery, all four settings must be positive in order for the losses to be added from the uncompensated power. Page5
Case 4: Transformer losses only. If the meter is located at c and the point of delivery is at b (Figure 8) the results shown below are the settings A, B, C, and D for the M650. If the meter is at b and the point of delivery is at c (Figure 9) then multiply the results shown below by negative one before entering as the settings A, B, C, and D. Direction of power flow.
a
b
c
Point of
Delivery
M
Figure 8 Direction of power flow.
d
a
b
c
M
Point of
Delivery
Figure 9 d
Transformer losses consist of load‐related‐watt‐losses and load‐related‐VAR‐losses due to I2R losses in the windings and also no‐load‐watt‐losses and no‐load‐VAR‐losses due mainly to eddy currents and hysteresis in the core. By conducting short‐circuit testing and open‐circuit testing at the time a transformer is manufactured, the supplier can publish the performance characteristics of the transformer. The full‐load and no‐load losses in terms of watts are generally stated explicitly, but the losses in terms of VARs must generally be derived from the watt‐losses combined with the transformer’s other operational ratings. The test results and operating characteristics of the transformer shown in Table 1, below, are required in order to calculate the meter settings A, B, C, and D. Table 1 (1) Full‐load (Cu) loss in watts (2) No‐load (Fe) loss in watts (3) Percent‐Impedance (4) Percent‐Excitation (5) Total 3‐phase VA rating of the transformer (6) Rated voltage (L‐L) (7) Turns ratio of the transformer ( VHI / VLO ) The A setting: The Watt‐Losses resulting from the load on a transformer are proportional to the square of the current. The meter calculates the load‐related‐watt‐losses by measuring the RMS current, squaring it, then multiplying the result by the setting A. Therefore, the setting A is the ratio of the rated full‐load‐watt‐
losses divided by the square of the transformer’s rated full‐load current. The rated full‐load‐watt‐losses, (1) in Table 1 above, are given in the transformer’s datasheet. Make sure the losses are expressed in units of watts, and that they represent the total three‐phase losses. If expressed in kW, multiply by 1000 to get units of watts. If expressed in terms of per‐phase losses, multiply by three to get total three‐phase losses. The transformer’s full‐load current must be derived from the transformer’s VA rating, (5) in Table 1, and its rated voltage, (6) in Table 1. To get the average per‐phase current, first divide the total VA rating by three to get the per‐phase VA rating. Next, divide the rated voltage (expressed as line‐line voltage) by the square root of three to give the equivalent line‐neutral volts. This is done regardless of whether the Page6
transformer is delta or wye connected. Finally, divide the per‐phase VA rating by the equivalent line‐
neutral voltage in order to get the rated full‐load current. Note: When calculating the rated full‐load current, make sure to use the rated voltage on the side of the transformer where the meter will be connected. Example: Given that: From Table 1: (1) Full‐load (Cu) loss in watts is 41.427 kW (5) Total 3‐phase VA rating of the transformer is 10 MVA (6) Rated voltage (L‐L) is 69.00 kV on the high side and 12.47 kV on the low side Calculate the meter setting A (accounts for load‐related‐watt‐losses) if the meter will be connected to the low side of the transformer. Begin with the definition: The setting A is the ratio of the rated full‐load‐watt‐losses divided by the square of the transformer’s rated full‐load current. Per‐phase VA rating is: 10 MVA / 3 phases = 3,333,333 VA per phase Equivalent line‐neutral voltage on the low‐side is: 12.47 kV / SQRT(3) = 7,200 V So the average per‐phase current on the low (voltage) side when operating at full‐load is: 3,333,333 VA / 7,200 V = 463 A Then the ratio of the rated full‐load‐watt‐losses divided by the square of the transformer’s rated full‐load current is: 41,427 W / (463 A)2 = 193.3 x 10‐3 Ω So the meter setting A should be 193.3E‐3 if the meter will be connected on the low‐side of the transformer. The B setting: The Watt‐Losses at no load on a transformer are proportional to the square of the voltage. The meter calculates the no‐load‐watt‐losses by measuring the RMS line‐line voltage, squaring that, then multiplying the result by the setting B. Therefore, the setting B is the ratio of the rated no‐load‐watt‐
losses divided by the square of the transformer’s rated line‐line voltage. The rated no‐load‐watt‐losses, (2) in Table 1, are given in the transformer’s datasheet. Make sure the losses are expressed in units of watts, and that they represent the total three‐phase losses. If expressed in kW, multiply by 1000 to get units of watts. If expressed in terms of per‐phase losses, multiply by three to get total three‐phase losses. The transformer’s rated line‐line voltage is given, (6) in Table 1. Be sure to use the rated voltage on the side of the transformer where the meter will be connected. Page7
Example: Given that: From Table 1: (2) Full‐load (Fe) loss in watts is 9.878 kW (6) Rated voltage (L‐L) is 69.00 kV on the high side and 12.47 kV on the low side Calculate the meter setting B (accounts for no‐load‐watt‐losses) if the meter will be connected to the low side of the transformer. Begin with the definition: The setting B is the ratio of the rated no‐load‐watt‐losses divided by the square of the transformer’s rated line‐line voltage. Then the ratio of the rated no‐load‐watt‐losses divided by the square of the transformer’s rated line‐line voltage is: 9,878 W / (12,470 V)2 = 63.52 x 10‐6 W/V2 So the meter setting B should be 63.52E‐6 if the meter will be connected on the low‐side of the transformer. The C setting: The VAR‐Losses resulting from the load on a transformer are proportional to the square of the current. The meter calculates the load‐related‐VAR‐losses by measuring the RMS current, squaring it, then multiplying the result by the setting C. Therefore, the setting C is the ratio of the rated full‐load‐VAR‐
losses divided by the square of the transformer’s rated full‐load current. Full‐load VAR losses (result)
The rated full‐load‐VAR‐losses are not given in the transformer’s datasheet as watt‐losses are. They must be derived. That is done by solving the “power triangle” for VAR‐losses where the watt‐losses and the VA‐losses are known. Watt‐losses, (1) in Table 1, are given in the transformer’s datasheet. VA‐
losses are the product of the transformer’s VA rating, (5) in Table 1, times the percent impedance, (3) in Table 1. This is illustrated in Figure 10, below. Full‐load watt losses (given)
Figure 10. Deriving Full‐load‐VAR‐Losses. When solving for VAR losses, make sure to express watt‐losses in units of watts and the VA‐rating in units of VA, and that both represent three‐phase total values. Then the result will be the three‐phase total VAR losses expressed in units of VARs. Once the full‐load‐VAR‐losses are derived, divide it by the square of the full‐load current (derived above) to get the setting C. Page8
Example: Given that: From Table 1: (1) Full‐load (Cu) loss in watts is 41.427 kW (3) Percent‐Impedance is 6.92% (5) Total 3‐phase VA rating of the transformer is 10 MVA (6) Rated voltage (L‐L) is 69.00 kV on the high side and 12.47 kV on the low side Calculate the meter setting C (accounts for load‐related‐VAR‐losses) if the meter will be connected to the low side of the transformer. Begin with the definition: The setting C is the ratio of the rated full‐load‐VAR‐losses divided by the square of the transformer’s rated full‐load current. In order to derive the rated full‐load‐VAR‐losses, we first need to know the full‐load‐VA‐losses: 10 MVA x 6.92% = 692,000 VA. This is the hypotenuse of the power triangle. The horizontal leg of the power triangle is the full‐load watt losses (given): 41,427 W So the vertical leg of the power triangle is the full‐load‐VAR‐losses: SQRT [ (692,000 VA)2 – (41,427 W)2 ] = 690,759 VARs The full‐load current on the low side of the transformer was derived above: 3,333,333 VA / 7,200 V = 463 A Then the ratio of the rated full‐load‐VAR‐losses divided by the square of the transformer’s rated full‐load current is: 690,759 VARs / (463 A)2 = 3.222 ΩR So the meter setting C should be 3.222 if the meter will be connected on the low‐side of the transformer. The D setting: The VAR‐Losses at no load on a transformer are proportional to the voltage raised to the fourth power. The meter calculates the no‐load‐VAR‐losses by measuring the RMS line‐line voltage, raising it to the fourth power, then multiplying the result by the setting D. Therefore, the setting D is the ratio of the rated no‐load‐VAR‐losses divided by the transformer’s rated line‐line voltage raised to the fourth power. The rated no‐load‐VAR‐losses are not given in the transformer’s datasheet as watt‐losses are. They must be derived. That is done by solving the power triangle for VAR‐losses where the watt‐losses and the VA‐losses are known. Watt‐losses, (2) in Table 1, are given in the transformer’s datasheet. VA‐
losses are the product of the transformer’s VA rating, (5) in Table 1, times the percent excitation, (4) in Table 1. This is illustrated in Figure 11, below. Page9
No‐load VAR losses (result)
No‐load watt losses (given)
Figure 11. Deriving No‐load‐VAR‐Losses. When solving for VAR losses, make sure to express watt‐losses in units of watts and the VA‐rating in units of VA, and that both represent three‐phase total values. Then the result will be the three‐phase total VAR losses expressed in units of VARs. Once the no‐load‐VAR‐losses are derived, divide it by the line‐line voltage raised to the fourth power to get the setting D. Example: Given that: From Table 1: (2) No‐load (Fe) loss in watts is 9,878 W (4) Percent‐Excitation is 0.38% (5) Total 3‐phase VA rating of the transformer is 10 MVA (6) Rated voltage (L‐L) is 69.00 kV on the high side and 12.47 kV on the low side Calculate the meter setting D (accounts for no‐load‐VAR‐losses) if the meter will be connected to the low side of the transformer. Begin with the definition: The setting D is the ratio of the rated no‐load‐VAR‐losses divided by the transformer’s rated line‐line voltage raised to the fourth power. In order to derive the rated no‐load‐VAR‐losses, we first need to know the no‐load‐VA‐losses: 10 MVA x 0.38% = 38,000 VA. This is the hypotenuse of the power triangle. The horizontal leg of the power triangle is the no‐load watt losses (given): 9,878 W So the vertical leg of the power triangle is the no‐load‐VAR‐losses: SQRT [ (38,000 VA)2 – (9,878 W)2 ] = 36,694 VARs The line‐line voltage on the low side of the transformer is given: 12,470 V Then ratio of the rated no‐load‐VAR‐losses divided by the transformer’s rated line‐line voltage raised to the fourth power is: 36,694 VARs / (12,470 V)4 = 1.517 x 10‐12 VARs/V4 So the meter setting D should be 1.517E‐12 if the meter will be connected on the low‐side of the transformer. Page10
Case 5: Line losses for segment ab plus transformer losses plus line losses for segment cd. If the meter is located at d and the point of delivery is at a (Figure 12) the results shown below are the settings A, B, C, and D for the M650. Be sure the signs of the settings are all positive, so the losses will be added to the uncompensated measurements in order to produce compensated measurements. Direction of power flow.
a
b
c
Point of
Delivery
d
M
Figure 12 In this case, the settings to enter on the M650 will be the sum of the line losses for segment ab plus the transformer losses plus the line losses for segment cd. (See note 2, below.) The following statements can be used calculate the meter settings. A = Aab + AT + Acd B = BT C = Cab + CT + Ccd D = DT Where the subscripts ab and cd indicate Line Losses for the respective segments, and subscript T indicates Transformer Losses. Notice the settings B and D above are for transformer losses alone since the lines do not contribute any no‐load‐losses. That is, Bab = Bcd = Dab = Dcd = 0. Use the process described in Case 4 to determine the values of AT, BT, CT, and DT. Use the process described in Case 1 to determine Acd and Ccd. Since the line segment ab is on the opposite side of the transformer relative to the meter, the coefficients Aab and Cab must take into consideration that the current passing through line segment ab is not the same as the current sensed by the meter. This is accomplished simply by multiplying line impedance by the square of the turns ratio of the power transformer: Aab = 3 x Rab x ( Vc / Vb )2 Cab = 3 x Xab x ( Vc / Vb )2 Where R is the total resistance of one phase of line segment ab, X is the total reactance of the line segment, and ( Vc / Vb ) is the turns ratio of the power transformer. Notes: 1. Since the meter is downstream from the point of delivery, all four settings must be positive in order for the losses to be added to the uncompensated power. 2. Presumes the voltage drop across line segment cd is negligible. Page11
If the meter is located at a and the point of delivery is at d (Figure 13) the results shown above are still the settings A, B, C, and D for the M650. But when the meter is upstream from the point of delivery, be sure the signs of the settings are all negative, so the losses will be subtracted from the uncompensated measurements in order to produce compensated measurements. (See note 4, below.) Direction of power flow.
a
b
c
Point of
Delivery
M
d
Figure 13 Use the process described in Case 4 to determine the values of AT, BT, CT, and DT. Use the process described in Case 1 to determine Aab and Cab. Since the line segment cd is on the opposite side of the transformer relative to the meter, the coefficients Acd and Ccd must take into consideration that the current passing through line segment cd is not the same as the current sensed by the meter. This is accomplished simply by multiplying line impedance by the square of the turns ratio of the power transformer: Acd = 3 x Rcd x ( Vb / Vc )2 Ccd = 3 x Xcd x ( Vb / Vc )2 Where R is the total resistance of one phase of line segment cd, X is the total reactance of the line segment, and ( Vb / Vc ) is the turns ratio of the power transformer. (Note that this is the inverse of the turns ratio used when the meter was at d and the point of delivery was at a, in the example just above.) Notes: 3. Since the meter is upstream from the point of delivery, all four settings must be negative in order for the losses to be subtracted from the uncompensated power. 4. Presumes the voltage drop across line segment ab is negligible. Page12
Appendix: Testing the M650 Loss Compensation Functionality Against Predicted Values The following procedure will demonstrate the Loss Compensation function on the Bitronics M650 Panel Meter and prepare it to be installed in the field. 1. Resources to Familiarize yourself with the implementation of Loss Compensation on the M650. 2. Calculate the five settings required to make the M650 compensate its power and energy measurements for Line, Transformer, and System Losses. 3. Configure the M650, Part 1: Enter the Loss Compensation settings, the CT and PT ratio, and configure the meter for connection to a delta or wye oriented line. 4. Configure the M650, Part 2: Enable a local display of uncompensated Watts and VARs for the purpose of testing. 5. Use a three‐phase relay test set to inject signals simulating a range of normal operating conditions.
Page13
1. Resources to familiarize yourself with the implementation of Loss Compensation on the M650. The overall functionality of the M650 is described in Bitronics document number ML0035, M650 User Manual, and the DNP and Modbus Protocol supplements, ML0036 and ML0037, respectively. These manuals are available for download from the company website and are included in the CD entitled “Bitronics Product Manuals”. One copy of the CD is included with every order. Beyond the high‐level description given in the manual, functionality related to transformer, line, and system loss compensation is described in greater detail on pages 1 and 2 of this application note. Company Website: URL: http://www.novatechweb.com/utility/50‐series‐scada‐meters‐and‐indicators/ Registration and log‐in are required to download manuals. Click on the tab marked “Documentation” and look for the model you expect to use (e.g. M650, M651, M653, etc.) Public FTP Site: URL: ftp://support.novatechps.com/bitronics Username: its2\Bitronics.support Password: b@7PaBth Note: Log‐in credentials are case sensitive. Loss Compensation is available on M65x family meters with the option code M3 running firmware v3.08 and later. Older M65x family meters having the option code M3 may be field‐upgraded to add loss compensation. The latest revision of the 50 Series firmware is posted on the public FTP site, located in the folder called \\50 Series Firmware. A meter having model number M650M3P511, for example, has the M3 option code and can support loss compensation. All information specifically related to Loss Compensation, including a copy of this application note, a spread sheet to help calculate the meter settings and firmware v3.08 are located on the public FTP site in the directory called \\Bryan's Posts\Loss Comp on M650. Page14
2. Calculate the five settings required to make the M650 compensate its power and energy measurements for Line, Transformer, and System Losses. Use the diagram in Figure 2 and the table in Figure 3 in this application note to decide how the M650 meter will be oriented relative to the point of delivery, observing the direction of power flow intended to display as positive on the meter. From this perspective, determine which “case” best fits your application (pages 3 – 12). Read and follow the directions for that case. A spread sheet (see Figure A1, below, file name: Comp Testing r0.xlsx) is available to help prevent simple math errors and omissions in calculating the settings A, B, C, and D. The spread sheet may be downloaded from the public FTP Site. Obviously, the spread sheet will only prevent errors when properly used. Potential errors can be minimized through familiarity with Cases 1 through 5. Figure A1. The Comp Testing r0.xlsx Spread Sheet. There are two tabs (worksheets) in the Comp Testing spread sheet. One is for calculating all the settings related to Line Losses. The other tab (shown) is for calculating all the settings related to Transformer Losses, for entering the System Losses, and for reading the Results. The results given in the spread sheet are the five settings to be entered in the M650 configuration. Cells highlighted in yellow in the Comp Testing spread sheet require user input. These are generally the impedance characteristics of any lines, the test data for the transformer, the CT and VT ratios of the instrument transformers. There are also cells available where you can enter the signals that you plan to inject into the meter when commissioning the meter. Just below the space for the injected values, there is a section indicating the predicted values for uncompensated total watts, uncompensated total VARs, uncompensated total VA, compensated total watts, and compensated total VARs. All cells not highlighted in yellow are protected in order to prevent accidentally overwriting a formula used for calculations. You are free to edit the spreadsheet, however. If you care to modify a protected cell, simply unprotect the sheet first. No password is needed to unprotect the sheet. All cells containing numbers in boldface red type must be entered as configuration settings in the M650. These are generally the results of calculations, but also include the CT and VT ratios. Page15
3. Configure the M650, Part 1: Enter the Loss Compensation settings, the CT and PT ratio, and configure the meter for connection to a delta or wye oriented line. After calculating the settings you want to enter, make an Ethernet connection to the M650. Open a web browser and type the meter’s IP address into the address bar of the browser. If the meter’s IP address has not been changed, the factory default IP address is 192.168.0.171. If you are not sure of the IP address, and the meter does not answer to its default address, you can determine the IP address from the keypad interface on the meter’s face plate. To do that, or to set a new address without a need for a network connection, follow the directions in the video “Bitronics 50 Series SCADA Meter Configuration” on the company website (click on the tab for Videos). The video is also available on You Tube at URL: http://www.youtube.com/watch?v=wbOIZHS7m6I. In the M650’s webserver interface, go to the Settings tab and click on the hyperlink for Input. The screen will look something like Figure A2. Under Input Configuration, select 2 Element for monitoring delta‐
connected lines, or 3 Element for wye‐connected lines. Caution: 2½‐Element configuration is used exclusively on wye‐
connected lines when only two line‐neutral‐connected PTs are available. It is not for use with delta‐connected lines. Even when delta connections use three CTs but only two PTs, these PTs are connected line‐line and so do not work with 2½‐Element‐configured meters. Enter the VT Ratio and the CT Ratio in the corresponding fields. Then under Loss Compensation, enter the settings you calculated. Notice that the meter accepts settings in scientific notation (e.g. 1.517E‐12 = 1.517 x 10‐12) as these settings may be very small. Note the settings A, B, C, D, and E are entered in that order, from top to bottom even though the setting names are spelled‐out as follows: A B C D E is called (Copper Watt Loss) / (Test Current)2 is called (Iron Watt Loss) / (Rated Voltage)2 is called (Copper Var Loss) / (Test Current)2 is called (Iron Var Loss) / (Rated Voltage)4 is called System Loss Figure A2. Apply the settings before moving to a new page, then reset the meter when prompted to do so. Page16
4. Configure the M650, Part 2: Enable a local display of uncompensated Watts and VARs for the purpose of testing. When loss compensation settings other than zero are entered on the M650 as shown in step 3, the calculation of three‐phase total watts, three‐phase total VARs, and the four‐quadrant energy registers (+kWh, ‐kWh, +kVARh, and ‐kVARh) are all populated only with compensated values. All measurement of per‐phase watts, per‐phase VARs, per‐phase VA, and three‐phase total VA remain uncompensated regardless of the loss compensation settings entered in configuration. When performing commissioning testing, it is helpful to be able to look at both the compensated and the uncompensated values of watts and VARs at the same time in order to compare those measurements with the predicted values when the volts, amps and phase angle injected into the meter are manipulated, usually with a relay test set. The Comp Testing spread sheet may be used to calculate the predicted values for any combination of the settings A, B, C, D, and E, and injected voltage, current and phase angle. With its default configuration, the M650 display will scroll through a sequence of “screens” including three‐phase total watts and VARs. This screen represents the compensated watts and VARs if non‐
zero compensation settings are entered on the Settings/Input page. In order to see the uncompensated watts and VARs, you must first create and then enable a custom screen on the display. After testing is completed, the custom screen may remain configured for use later, but removed from the scrolling sequence to avoid confusion during normal operation. In the webserver interface, go to the Settings/Custom Display Screens page, Figure A3. Figure A3. Use the drop‐down menus to select the measurement “Uncompensated RMS Watts Total” for Line 1, and “Uncompensated RMS VARs Total” for Line 2. Line 3 may remain blank (NONE, by default). You may type anything you like for the Alphanumeric Label but the space is limited to a maximum of eight characters, so you may need to be a little creative (e.g. “uMW uVAR” above). Then click on the Next> button. In the window that appears, Figure A4, click Apply. Page17
Figure A4. When prompted “Pending changes will not take effect until after IED is reset” click the Reset button. The meter will take a few seconds to reboot. When the webserver interface reappears, go to the page: Settings/Screen Enable. This page lists all the screens possible for the meter to scroll through. The custom screen you just created is now the final entry at the bottom of the page, Figure A5. Verify your custom screen is enabled (check‐mark in the box next to it) and take a moment to decide which other screens in the list should be displayed and which you would prefer not to see. Figure A5. If you make any changes on this page, be sure to Apply the changes and Reset the meter when prompted. You are now ready to begin your test. Return to this page in the webserver interface after the completion of the test and uncheck the box next to the custom screen if you prefer not to see uncompensated watts and VARs in the display scrolling sequence during normal operation. Page18