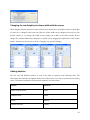
1
End value in first quartile
q1
First value in fourth quartile
q4
Minimum of the values
min
Maximum of the values
max
Minimum limit for outlier detection as defined
minOutlier
from user settings
Maximum limit for outlier detection as defined maxOutlier
from user settings
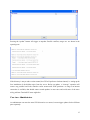
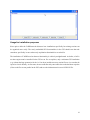
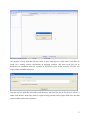
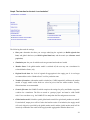
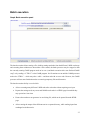
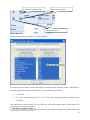
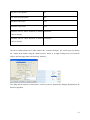
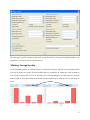
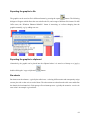
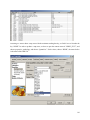
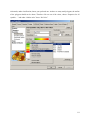
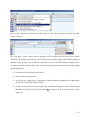
The above related options can be either found in the “customize dialogue” box, which opens by clicking
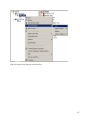
the button on the toolbar, using the “define statistics” button, or by right clicking on any cell inside the
table to open the popup menu, and choosing “Statistics”.
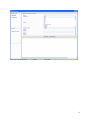
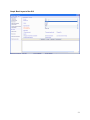
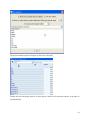
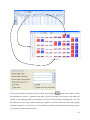
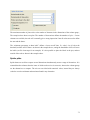
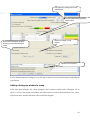
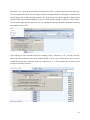
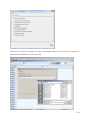
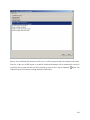
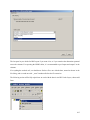
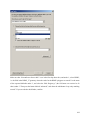
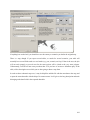
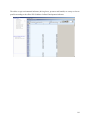
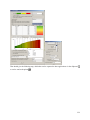
The dialog has the options as shown below, which in parts are dynamically changing depending on the
detection algorithm.
61