1
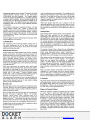
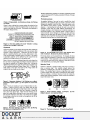
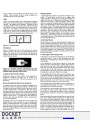
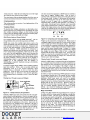
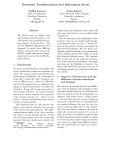
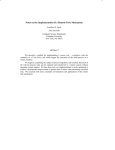
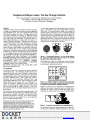
Toolglass and Magic Lenses: The See-Through Interface
Eric A. Bier, Maureen C. Stone, Ken Pier, William Buxtont, Tony D. DeRoset
Xerox PARC, 3333 Coyote Hill Road, Palo Alto, CA 94304
tUniversity of Toronto, tUniversity of Washington
Abstract
Toolglass™ widgets are new user interface tools that can appear,
as though on a transparent sheet of glass, between an application
and a traditional cursor. They can be positioned with one hand
while the other positions the cursor. The widgets provide a rich
and concise vocabulary for operating on application objects.
These widgets may incorporate visual filters, called Magic Lens™
filters, that modify the presentation of application objects to
reveal hidden information, to enhance data of interest, or to
suppress distracting information. Together, these tools form a
see-through interface that offers many advantages over traditional
controls. They provide a new style of interaction that better
exploits the user's everyday skills. They can reduce steps, cursor
motion, and errors. Many widgets can be provided in a user interface, by designers and by users, without requiring dedicated
screen space. In addition, lenses provide rich context-dependent
feedback and the ability to view details and context simultaneously. Our widgets and lenses can be combined to form operation
and viewing macros, and can be used over multiple applications.
CR Categories and Subject Descriptors: 1.3.6 [Computer
Graphics]: Methodology and Techniques-interaction techniques;
R.5.2 [Information Interfaces and Presentation]: User Interfaces-interaction
styles;
1.3.3
[Computer
Graphics]:
Picture/Image Generation-viewing algorithms; 1.3.4 [Computer
Graphics]: Graphics Utilities-graphics editors
Key Words: multi-hand, button, lens, viewing filter, control
panel, menu, transparent, macro
A set of simple widgets called click-through buttons is shown in
figure 1. These buttons can be used to change the color of objects
below them. The user positions the widget in the vicinity and
indicates precisely which object to color by clicking through the
button with the cursor over that object, as shown in figure l(b).
The buttons in figure 1(c) change the outline colors of objects. In
addition, these buttons include a filter that shows only outlines,
suppressing filled areas. This filter both reminds the user that
these buttons do not affect filled areas and allows the user to
change the color of outlines that were obscured.
(a)
(b)
(c)
Figure 1. Click-through buttons. (al Six wedge objects.
(b) Clicking through a green fill-color button. (cl Clicking
through a cyan outline-color button.
Many widgets can be placed on a single sheet, as shown in figure
2. The user can switch from one command or viewing mode to
another simply by repositioning the sheet.
1. Introduction
We introduce a new style of graphical user interface, called the
see-through interface. The see-through interface includes semitransparent interactive tools, called Toolglass™ widgets, that are
used in an application work area. They appear on a virtual sheet
of transparent glass, called a Toolglass sheet, between the application and a traditional cursor. These widgets may provide a
customized view of the application underneath them, using
viewing fil~ers called Magic Lens™ filters. Each lens is a screen
region together with an operator, such as "magnification" or
"render in wireframe," performed on objects viewed in the
region. The user positions a Toolglass sheet over desired objects
and then points through the widgets and lenses. These tools
create spatial modes that can replace temporal modes in user interface systems.
Two hands can be used to operate the see-through interface. The
user can position the sheet with the non-dominant hand, using a
device such as a trackball or touchpad, at the same time as the .
dominant hand positions a cursor (e.g., with a mouse or stylus).
Thus, the user can line up a widget, a cursor, and an application
object in a single two-handed gesture.
Figure 2. A sheet of widgets. Clockwise from upper left:
color palette, shape palette, clipboard, grid, delete button,
and buttons that navigate to additional widgets.
Widgets and lenses can be composed by overlapping them,
allowing a large number of specialized tools to be created from a
small basic set. Figure 3 shows an outline color palette over a
magnifying lens, which makes it easy to point to individual edges.
Pennission to copy without fee all or part ofthis material is granted
provided that the copies are not made or distributed for direct
commercial advantage, the ACM copyright notice and the title ofthe
publication and its date appear, and notice is given that copying is by
pennission ofthe Association for Computing Machinery, To copy
otherwise, or to republish, requires a fee and/or specific pennission.
©1993 ACM-Q-89791-601-8/93/008 ... $1.50
Figure 3. An outline color palette over a magnifying lens.
The see-through interface has been implemented in the Multi-Device Multi-User Multi-Editor (MMM) frameworkS in the Cedar
73
f
HCL0000968
Find authenticated court documents without watermarks at docketalarm.com.
programming language and environment,24 running on the SunOS
work area make these menus transparent. For example, the Alto
Markup system l8 displays a menu of modes when a mouse button
goes down. Each menu item is drawn as an icon, with the space
between icons transparent. Bartlett's transparent controls for
interactive graphics use stipple patterns to get the effect of
transparency in X Windows. 2
UNIx™t compatible operating system on Sun Microsystems
SPARCstations and other computers. The Gargoyle graphics
editor,2° as integrated into MMM, serves as a complex application
on which to test our interface. We use a standard mouse for the
dominant hand and a MicroSpeed FastTRAPTM trackball for the
non-dominant hand. The trackball includes three buttons and a
thumbwheel, which can be used to supply additional parameters
to the interface.
While these systems allow the user to continue to see the
underlying application while a menu is in place, they don't allow
the user to interact with the application ,through the menu and they
don't use filters to modify the view of the application, as does our
interface.
The remainder of this paper is organized as follows. The next
section describes related work.
Section 3 describes some
,examples of the tools we have developed. Section 4 discusses
general techniques for using the see-through interface. Section 5
discusses some advantages of this approach. Section 6 describes
our implementation. Sections 7 and 8 present our conclusions and
plans for future work.
Viewing Filters
Many existing window systems provide a pixel magnifier. Our
Magic Lens filters generalize the lens metaphor to many
representations other than pixels and to many operations other
than magnification. Because they can access application-specific
data structures, our lenses are able to perform qualitatively different viewing operations, including showing hidden information
and showing information in a completely different format. Even
when the operation is magnification, our lenses can produce
results of superior quality, since they are not limited to processing
data at screen resolution.
Except for figures 12 and 16, all of the figures in this paper reflect
current capabilities of our software.
2. Related Work
The components of the see-through interface combine work in
four areas: simultaneous use of two hands, movable tools,
transparent tools, and viewing filters. In this section, we describe
related work in these four areas.
The concept of using a filter to change the way information is
visualized in a complex system has been introduced before. 25 ,10,14
Recent image processing systems support compostition of
overlapping filters. 23 However, none of these systems combine
the filtered views with the metaphor of a movable viewing lens.
Multi-Handed Interfaces
Several authors have studied interfaces that interpret continuous
gestures of both hands. In Krueger's VIDEOPLACEs system,15 the
position and motion of both of a participant's hands, as seen by a
video camera, determine the behavior of a variety of on-screen
objects, including animated creatures and B-spline curves.
Buxton and Myers discovered that users naturally overlap the use
of both hands, when this is possible, and that, even when the two
hands are used sequentially, there is still a performance advantage
over single-hand use. 7,8
Other systems provide special-purpose lenses that provide more
detailed views of state in complex diagrams. For example, a
fisheye lens can enhance the presentation of complicated
graphs. 21 The bifocal display22 provides similar functionallity for
viewing a large space of documents. The MasPar Profiler3 uses a
tool based on the magnifying lens metaphor to generate more
detail (including numerical data) from a graphical display of a
program.
Other work characterizes the situations under which people
successfully perform two-handed tasks. Guiard presents evidence
that people are well-adapted to tasks where the non-dominant
hand coarsely positions a context and the dominant hand performs
detailed work in that context. 4 Similarly, Kabbash presents
evidence that a user's non-dominant hand performs as well or
better than the dominant hand on coarse positioning tasks. 13
Magic Lens filters combine viewing filters with interaction and
composition in a much broader way than do previous systems.
They are useful both as a component of the see-through interface
and as a general-purpose visualization paradigm, in which the
lenses become an integral part of the model being viewed.
Our system takes full advantage of a user's two-handed skills; the
non-dominant hand sets up a context by coarsely positioning the
sheet, and the dominant hand acts in that context, pointing
precisely at objects through the sheet.
3. Examples
This section shows several tools that demonstrate features of the
see-through interface. Because we have implemented primarily in
the graphical editing domain, most of these tools are tailored to
that application. However, the see-through interface can be used
in a wide variety of other application domains.
Movable Tools
Menus that pop up at the cursor position are movable tools in the
work area. However, such a menu's position is determined by the
cursor position before it app<;ars, making it difficult to position it
relative to application objects.
Shape and Property Palettes
Palettes are collections of objects or properties that can be added
to a scene. Figure 1 showed two widgets that apply color to
shapes. Similar tools can be designed to apply other graphical
properties, such as type and line styles to an illustration, shading
parameters to a 3D model, or initial values to a simulation. Figure
4 illustrates a widget containing graphical shapes that can be
"pushed through" from the tool into the illustration below. In
figure 4(a), the user has positioned a shape palette widget (shown
in cyan) over an illustration (shown in magenta). When the user
clicks on a shape on the tool, a copy of that shape is added to the
illustration. The widget attaches the copied shape to the cursor
for interactive dragging until the final shape position is achieved
(figure 4(b)).
Several existing systems provide menus that can be positioned in
the same work area as application objects. For example,
MacDraw "tear-off menus" allow a pull-down menu to be
positioned in the work area and repositioned by clicking and
dragging its headerY Unfortunately, moving these menus takes
the cursor hand away from its task, and they must be moved
whenever the user needs to see or manipulate objects under them.
Toolglass sheets can be positioned relative to application objects
and moved without tying up the cursor.
Transparent Tools
Some existing systems that allow menus to be positioned over the
74
f
HCL0000969
Find authenticated court documents without watermarks at docketalarm.com.
Besides implementing graphical cut and paste, clipboards provide
a general mechanism for building customized libraries of shapes
and properties.
· ~. IIIIIIIf
~
(a)
Previewing Lenses
(b)
In graphical editing, a lens can be used to modify the visual
properties of any graphical object, to provide a preview of what
changing the property would look like. Properties include color,
line thickness, dash patterns, typeface, arrowheads and drop
shadows. A previewing lens can also be used to see what an
illustration would look like under different circumstances; for
example, showing a color illustration as it would be rendered on a
black/white display or on a particular printer. Figure 8 shows a
Celtic knotwork viewed through two lenses, one that adds drop
shadows and one that shows the picture in black and white. The
achromatic lens reveals that the drop shadows may be difficult to
distinguish from the figure on a black/white display.
Figure 4. Shape palette. (a) Choosing a shape. (b) Placing
the shape.
Figure 5 shows a design for a property palette for setting the face
of text in a document. Each face (regular, bold, etc.) has an active
region on the right side of the tool. Selecting the text displayed in
this region changes its face.
I
I
regular
I italic
I bold
bold italic
temporal modes and modes created
by holding down a keyboard key Iv ith
spatial modes. Because these spa ial
modes can be changed directly in the
application work area, the cursor nd
the user's attentIOn can remam on the
Figure 5. Font face palette. The word "directly" is being
selected and changed to bold face.
Clipboards
Clipboard widgets pick up shapes and properties from underlying
objects, acting as visible instantiations of the copy and paste keys
common in many applications. Clipboards can pick up entire
objects or specific properties such as color, dash pattern or font.
They can hold single or multiple copies of an object. The objects
or properties captured on the clipboard can be copied from the
clipboard by clicking on them, as in the palette tools.
Figure 8. An achromatic lens over a drop shadow lens
over a knotwork. (Knotwork by Andrew Glassner)
Previewing lenses can be parameterized. For example, the drop
shadow lens has parameters to control the color and displacement
of the shadow. These parameters can be included as graphical
controls on the sheet near the lens, attached to input devices such
as the thumbwheel, or set using other widgets.
Figure 6 shows a symmetry clipboard that picks up the shape that
the user clicks on (figure 6(a» and produces all of the rotations of
that shape by multiples of 90 degrees (figure 6(b». Moving the
clipboard and clicking on it again, the user drops a translated copy
of the resulting symmetrical shape (figure 6(c». Clicking the
small square in the upper left comer of the widget clears the
widget so that new shapes can be clipped.
Selection Tools
Selection is difficult in graphical editing when objects overlap or
share a common edge. Our selection widgets address this
problem by modifying the view and the interpretation of input
actions. For example, figure 9 shows a widget that makes it easy
to select a shape vertex even when it is obscured by other shapes.
This tool contains a wire-frame lens that reveals all vertices by
making shape interiors transparent. Mouse events are modified to
snap to the nearest vertex.
~~~
(a)
(b)
(c)
Figure 6. Symmetry clipboard. (a) Picking up an object.
(b) Rotated copies appear. (c) The copies are moved and
pasted.
Figure 7 shows an example of a type of clipboard that we call a
mbbing. It picks up the fill color of an object when the user
clicks on that object through the widget (figure 7(a». The widget
also picks up the shape of the object as a reminder of where the
color came from (figure 7(b». Many fill-color rubbings can be
placed on a single sheet, allowing the user to store several colors
and remember where they came from. The stored color is applied
to new shapes when the user clicks on the applicator nib of the
rubbing (figure 7(c».
(a)
(b)
(c)
Figure 9. Vertex selection widget. (a) Shapes.
widget is placed. (c) A selected vertex.
Figure 7. Fill-color rubbings. (a) Lifting a color. (b) Moving
the clipboard. (c) Applying the color.
(b) The
Figure 10. The local scaling lens. (Tiling by Doug Wyatt)
75
f
HCL0000970
Find authenticated court documents without watermarks at docketalarm.com.
Managing Sheets
Figure 10 shows a lens that shrinks each object around its own
centroid. This lens makes it easy to select an edge that is
coincident with one or more other edges.
A typical application will have a large number of widgets in its interface. To avoid clutter, we need a way to organize these
widgets and sheets. One approach is to put all of the widgets on a
single sheet that can be navigated by scrolling and zooming.
Perlin and Fox's paper in these proceedings 19 describes techniques for creating and navigating unlimited structures on a single
sheet. A second approach is to have a master sheet that generates
other sheets. Each of these sheets could generate more sheets,
like hierarchical menus. A third technique, used in our prototype,
is to allow a single sheet to show different sets of widgets at different times. The set to display can be selected in several ways:
the user can click a special widget in the set, like the arrows in
'HyperCard,TM ll that jumps to another set. In addition, a master
view provides a table of contents of the available sets allowing the
user to jump to anyone. To use different sets simultaneously, the
user creates additional sheets.
Grids
Figure 11 shows three widgets, each of which displays a different
kind of grid. The leftmost two grids are rectangular with different
spacings. The rightmost grid is hexagonal. Although each grid
only appears when the lens is in place, the coordinates of the grid
are bound to the scene, so that grid points do not move when the
sheet moves. By clicking on the grid points and moving the
widget, the user can draw precise shapes larger than the widget.
If the sheet is moved by the non-dominant hand, the user can
quickly switch between the grids during an editing motion.
Customizing Sheets
Because sheets can contain an unlimited number of widgets, they
provide a valuable new substrate on which users can create their
own customized widgets and widget sets. In effect, the sheets can
provide a user interface editor, allowing users to move and copy
existing widgets, compose macros by overlapping widgets, and
snap widgets together in new configurations. Indeed, with the
techniques described in this paper, one Toolglass sheet could even
be used to edit another.
Figure 11. Three grid tools.
Visualization
Figure 12 illustrates the use of tools and lenses to measure
Gaussian curvature in the context of a shaded rendering of a 3D
model. The pseudo-color view indicates the sign and relative
magnitude of the curvature,9 and the evaluation tool displays the
value at the point indicated.
5. Advantages of See-Through Tools
In this section, we describe some advantages we see for using the
see-through interface. Most of these advantages result from
placing tools on overlapping layers and from the graphical nature
of the interface.
In most applications, a control panel competes for screen space
with the work area of the application. Toolglass sheets exist on a
layer above the work area. With proper management of the
sheets, they can provide an unlimited space for tools. The widgets
in use can take up the entire work area. . Then, they can be
scrolled entirely off the screen to provide an unobstructed view of
the application or space for a different set of widgets.
Figure 12. Gaussian curvature pseudo-color lens with
overlaid tool to read the numeric value of the curvature.
(Original images courtesy of Steve Mann)
4. Using the See-Through Interface
The see-through user interface can be used on tiny displays, such
as notebook computers or personal digital assistants, that have
little screen real estate for fixed-position control panels. It can
also be used on wall-sized displays, where a fixed control panel
might be physically out of reach from some screen positions.
These tools can move with the user to stay close at hand.
Widgets and lenses are most effective when supported by
appropriate conventions specifYing how to position, size,
organize, and customize them. This section discusses a few of
these issues.
Moving and Sizing the Sheet or the Application
A user interface layer over the desktop provides a natural place to
locate application-independent tools, such as a clipboard that can
copy material from one window to another.
A Toolglass sheet can be moved by clicking and dragging on its
border with a mouse or by rolling the trackball. The sheet and all
its widgets can stretch and shrink as a unit when the user works a
a second controller such as a thumbwheel. With these moving
and sizing controls, the user can center a widget on any application object and size the widget to cover any screen region. Large
widgets can be used to minimize sheet motion when applying a
widget to several objects. A widget that has been stretched to
cover the entire work area effectively creates a command mode
over the entire application.
These widgets can combine multiple task steps into a single step.
For example, the vertex selection widget of figure 9 allows the
user to tum on a viewing mode (wire-frame), tum on a command
mode (selection), and point to an object in a single two-handed
gesture.
Most user interfaces have temporal modes that can cause the same
action to have different effects at different times. With our interface, modes are defined spatially by placing a widget and the
cursor over the object to be operated on. Thus, the user can easily
see what the current mode is (e.g., by the label on the widget) and
how to get out of it (e.g., move the cursor out of the widget). In
addition, each widget can provide customized feedback for its operation. For example, a widget that edits text in an illustration can
include a lens that filters out all the objects except text. When
several widgets are visible at once, the feedback in each one
By clicking a button on the trackball, the user can disconnect the
trackball from the sheet and enable its use for scrolling and
zooming a selected application area. If a sheet is over this application, the user can now move an application object to a widget
instead of moving a widget to an object. This is a convenient way
to use the see-through interface on illustrations that are too large
to fit on the screen.
76
f
HCL0000971
Find authenticated court documents without watermarks at docketalarm.com.
serv~s a dual role. It helps the user make proper use of the widget
and It helps the user choose the correct widget.
The data structure that represents an MMM event is modified in
three ways to support Toolglass sheets. First, an event is
annotated with a representation of the parts of the application tree
it has already visited. In figure 13, this prevents the root application from delivering the event to the sheet more than once.
Second, an event is tagged with a command string to be
interpreted when it reaches its final application. For example, a
color palette click-through button annotates each mouse-click
event with the command name "FillColor" followed by a color.
Finally, if the widget contains a lens, the mouse coordinates of an
event may be modified so the event will be correctly directed to
the object that appears under the cursor through that lens.
The visual nature of the see-through interface also allows users to
construct personalized collections ofwidgets as described above.
6. Implementation
This section provides an overview of our implementation of the
see-through interface.
. Toolglass Sheets
We describe three Toolglass subsystems: one that handles simultaneous input from two pointing devices and updates the screen
after multiple simultaneous changes, one that modifies pointing
events as they pass through widgets, and one that modifies graphical output as it passes up through each widget.
DDO
(a)
Multi-Device Input and Screen Refresh
MMM takes events from multiple input devices, such as the
mouse and trackball, keeps track of which device produced which
event, and places all events on a single queue. It dequeues each
event in order and determines to which application that event
should be delivered. MMM applications are arranged in a
hierarchy that indicates how they are nested on the screen. Each
event is passed to the root application, which may pass the event
on to one of its child applications, which may in tum pass the
event on down the tree. Mouse events are generally delivered to
the most deeply nested application whose screen region contains
the mouse coordinates. However, when the user is dragging or
rubberbanding an object in a particular application, all mouse coordinates go to that application until the dragging or
rubberbanding is completed. Keyboard events go to the currently
selected application.
Filtering Output Through Lenses and Widgets
Ordinarily, MMM output is composed from the leaf applications
up. To support lenses, the normal screen refresh composition has
been extended to allow information to flow down and across the
tree as well as up. For example, if the. widgets in figure 13
contain one or more lenses, and if any of those lenses is situated
over the graphical editor, each lens must examine the contents of
the graphical editor (which is the lens's sibling in the hierarchy) in
order to draw itself.
To support Toolglass sheets, MMM's rules for handling trackball
input were modified. When a sheet is movable', trackball and
!humbwheel events go to the top-level application, which
mterprets them as commands to move or resize the sheet
respectively. When the sheet is not movable, the trackball and
thu~b,:heel events are delivered to the selected application,
wh~ch mterprets them as commands to scroll or zoom that applicatIon.
In addition, to improve performance, MMM applications compute
the rectangular bounding box of the regions that have recently
changed, and propagate this box to the root application, which
determines which screen pixels will need to be updated.
Generally, this bounding box is passed up the tree, transformed
along the way by the coordinate transformation between each application and the next one up the tree. However, lenses can
modify the set of pixels that an operation affects. A magnifying
lens, for example, generally increases the number of pixels
affected. As a result, the bounding box must be passed to all
lenses that affect it to determine the final bounding box.
Filtering Input Through Lenses and Widgets
Root Application
rL-.p.p,.,l.,.-.Jt.ld
(a)
'~Edito'
T••
Sheet
(c)
Figure 14. Composing color-changing widgets.
Widgets can be composed by overlapping them. When a stack of
overla~ped widgets receives input (e.g., a mouse click), the input
event IS passed top-to-bottom through the widgets. Each widget
in tum modifies the command string that has been assembled so
far. For example, a widget might concatenate an additional command onto the current command string. In figure 14, a widget
that changes fill colors (figure l4(a» is composed with a widget
that changes line colors (figure 14(b» to form a widget that
changes both fill and line colors (figure l4(c». If the line color
widget is on top, then the command string would be "LineColor
blue" after passing through this widget, and "LineColor blue'
FillColor cyan" after both widgets.
'
Our Toolglass software uses the MMM framework. s The seethrough interface relies on the following features ofMMM.
r-l-,.......",....I-Ii;;L.t;;-jllo
(b)
G rap h"lcaI Ed"ltor
(b)
Magic Lens Filters
A Magic Lens filter modifies the image displayed on a region of
the screen, called the viewing region, by applying a viewing filter
to objects in a model. The input region for the lens is defined by
the viewing region and the viewing filter. It may be the same size
as the viewing region, or different, as in the magnification lens.
For a 3D model, the input region is a cone-shaped volume defined
by the eye point and the viewing region. Input regions can be
used to cull away all model objects except those needed to
produce the lens image. Our current implementations do not
perform this culling; as described below, there are advantages to
lenses that operate on the entire model.
Figure 13. A simple hierarchy of applications
Ordinarily, MMM input events move strictly from the root application towards the leaf applications. However, to support the seethrough interface, input events must be passed back up this tree.
For example, figure 13(b) shows an application hierarchy. The
left-to-right order at the lower level of this tree indicates the topto-bottom order of applications on the screen. Input events are
first delivered to the Toolglass sheet to determine if the user is
interacting with a widget or lens. If so, the event is modified by
the sheet. In any case, the event is returned to the root application, which either accepts the event itself or passes it on to the
child applications that appear farther to the right in the tree.
When several lenses are composed, the effect is as though the
77
f
HCL0000972
Find authenticated court documents without watermarks at docketalarm.com.
Explore Litigation
Insights
Docket Alarm provides insights to develop a more
informed litigation strategy and the peace of mind of
knowing you’re on top of things.
Real-Time Litigation Alerts
Keep your litigation team up-to-date with real-time
API
alerts and advanced team management tools built for
Docket Alarm offers a powerful API
the enterprise, all while greatly reducing PACER spend.
(application programming inter-
Our comprehensive service means we can handle Federal,
State, and Administrative courts across the country.
Advanced Docket Research
With over 230 million records, Docket Alarm’s cloud-native
docket research platform finds what other services can’t.
face) to developers that want to
integrate case filings into their apps.
LAW FIRMS
Build custom dashboards for your
attorneys and clients with live data
direct from the court.
Coverage includes Federal, State, plus PTAB, TTAB, ITC
Automate many repetitive legal
and NLRB decisions, all in one place.
tasks like conflict checks, document
Identify arguments that have been successful in the past
with full text, pinpoint searching. Link to case law cited
within any court document via Fastcase.
Analytics At Your Fingertips
Learn what happened the last time a particular judge,
opposing counsel or company faced cases similar to yours.
Advanced out-of-the-box PTAB and TTAB analytics are
management, and marketing.
FINANCIAL INSTITUTIONS
Litigation and bankruptcy checks
for companies and debtors.
E-DISCOVERY AND
LEGAL VENDORS
Sync your system to PACER to
automate legal marketing.
always at your fingertips.
WHAT WILL YOU BUILD? | [email protected] | 1-866-77-FASTCASE
®