1
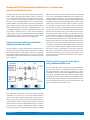
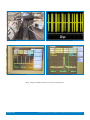
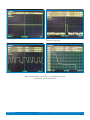
Application Note
Boonton 4540 RF Power Meter Application in a
Transponder Type Pulsed Radar System
Michael Mallo, Rockee Zhang and AndrewHuston
Radar Innovations Laboratory, the University of Oklahoma
Abstract
The Boonton model 4540 Series is the instrument of choice for capturing, displaying and analyzing RF power in both the time and statistical domains. Applications
include pulsed RF signals such as radar, TDMA and GSM, and pseudorandom or
noise-like signals such as CDMA, WLAN and WiMAX. The 4540 Series is a single or
dual channel RF Power Meter that can measure modulated or CW signals using peak
and average Boonton power sensors. This application paper focuses on discussing
the usage of the 4540 Series RF power meter in advanced radar system test and
development, especially in developing and testing a transponder type radar system
for aviation scenarios.
Boonton 4540 RF Power Meter Application in a Transponder
Type Pulsed Radar System
Generally, radars use both continuous wave (CW) and pulsed waveforms to detect and track targets. Similar to wireless communications, complicated modulations may be applied to the signal waveforms to improve range resolution and detection performance.
The power sensors within the 4540 Series can cover the frequency
band from 500 Hz to Ku band (18 GHz), which is the operating frequency band for most tracking radars and ground based weather
radars. The high dynamic range (-70 to +44 dBm CW power or -55
to +20 dBm pulsed power) is useful for debugging the power level
at all ranges of the RF sections in a radar system. Compared to
similar products on the market, the 4540 Series has the advantage
of time resolution (0.2ns), which can be useful to observe the detailed and transient power structures of the radar signal.
Using the Boonton 4540 series at different
stages of the radar transceiver
The block diagram of a generic pulsed Doppler radar transceiver is
shown in Fig 1, where the baseband waveform generator produces
the required waveforms and modulation schemes, the intermediate (IF) stage modulates the baseband waveforms up to the transmit frequency band and demodulate the received RF waveforms
back to baseband.
dB), which fits within the dynamic range performance of the 4540
Series. It is recommended that modulated mode is used when complicated baseband modulations, such as phase modulations, are
involved and pulse mode is used when the baseband waveforms
are pulsed with a relatively wide bandwidth. At the IF stages, signal
powers before and after the mixers, which are primary concerns,
are measured to ensure that the conversion loss falls within the
required system budget. To address this problem, the power meter and sensor need to be well-calibrated before the measurement.
Checking with the linearity data on the reference level test document (along with the user’s manual) is a good approach. Finally,
at the RF stage, the frequency is the highest and the signal power
level can vary. It is necessary to check the projected power level
at the desired measurement point to make sure there will be no
damage to the power sensor. Another important application of the
power meter at the RF front end is the transceiver self-calibration/
test functions widely used in today’s weather radars. For this case,
a portion of the transmit power is sampled and looped back into
the receiver channels, comparing the received power with expectation gives a good indication of the transceiver RF chain. A wellcalibrated power meter is a good tool to give a fast diagnosis of the
RF system budget and is useful for field-inspection at all stages of
the transceiver chain.
Measuring the Transponder-Radar Signal
using the Boonton 4540 series
This section introduces a practical example of using the 4540 series
power meter to measure a combined transponder-radar system.
The signal waveforms of this system are organized in a complicated fashion: The RF section provides 1090 MHz transmit and receive signals at standard transponder operating frequency, which
is a pulsed waveform encoded as Pulse-Position Modulation (PPM)
with 0.5 μs pulse widths. The pulses are transmitted in bursts every second, with each burst lasting 112 μs. The profile of the radar
transceiver system is shown in the Fig. 2(a).
Fig 1 - A generic diagram of pulsed Doppler radar transceiver
Even though the power meter is a relatively simple instrument
compared to an oscilloscope, it can be used at the baseband to
check: (1) the required waveform power level for the IF and conversion stages, (2) the ‘power profile’ of the baseband signal (associated with the waveform envelope) with respect to time, and
(3) the power level before the ADC and DSP stages. This stage has
a lower frequency coverage (< 200 MHz), but requires a relatively
large dynamic range due to the IF amplification (generally 70-100
Application Note
Boonton 4540 RF Power Meter Application in a Transponder Type Pulsed Radar System
2
(a) System setup (b) Time-domain waveform (from oscilloscope)
(c) Measuring transponder ‘bursts’
(d) Measuring sub-pulses within a signal burst
Fig. 2 - Using the 4540 RF Power Meter to measure baseband pulses
Application Note
Boonton 4540 RF Power Meter Application in a Transponder Type Pulsed Radar System
3
The Boonton 4540 RF power meter is used in the testing and debugging of the baseband and RF signal levels from the transceiver
outputs (before transmit to high power amplifiers). The following
detailed steps are followed during the measurements:
1. Calibration
Two types of power sensors are used: 57318 Peak Power Sensor
(peak power) and 51075A Power Sensor (CW average power).
Both sensors fit the transponder frequency requirement (L-band)
and the transceiver power level requirements. The special aspect
of the waveform modulation in this case (PPM + short pulse PM)
makes both sensors useful for power measurements. Boonton provides a sensor calibration measurement table along with the quick
start guide. However, following the standard sensor calibration
procedure in the manual first is recommended to guarantee accuracy. Ensure the system is warmed up at least 3 minutes before the
calibration. The AutoCal option, accessible via the Calibration menu,
performs the sensor calibration automatically.
2. Pre-checking power levels
The signal power level from the transmitter output should not exceed 0 dBm. Be aware that the sensor itself cannot handle more
than 20 dBm peak power. Maintaining transmitter output power
below 10 dBm is preferable. Also, signals below -40 dBm peak
power or -70 dB CW power cannot be sensed (only the instrument
noise floor will be visible).
3. Selecting the pulsed, CW power or statistical mode
The greatest challenge with this measurement is the need to check
the ‘burst’ of pulses (1 sec period and 100 μs length) rather than
a single sub-pulse within the burst. Pulsed mode is the best option
for measuring this particular type of radar waveform. The reason
is the power sensor limits the rise time (in this case approximately
100 ns), while a single pulse has a rise time of about 10 ns and a
pulse width of 500 ns. Using modulated mode is better for looking
at continuously modulated periodic signals. The 4540’s statistical
mode is an appropriate option for noise radar, which is continuous
with a randomly fluctuating signal power.
+100 dBm). Furthermore, the Units (dBm, Watts, Volts, dBV, dBmV,
and dBμV) can be selected from the Main/Channel/Extensions
menu. While in statistical mode, the Time option on the Main menu
is replaced with the Stat option. This new menu allows the user to
adjust the horizontal axis, which is actually the power axis in statistical mode, via the Horiz. Scale (0.1, 1, 2, or 5 dB/Div) and Horiz.
Offset (-50.00 to +50.00 dB) options. The vertical axis in statistical
mode displays the range from 0.0001% to 100.0%.
5. Observing power profile of pulse burst and single sub-pulse
In this specific radar application, several parameters are required
due to the complexity of the signal. Total average power is always
desirable, and was easily obtained in modulated mode using the
51075A Power Sensor, and is shown in Fig. 3(a). This mode displays the average power of -48.858 dBm as measured over the
entire PRT (1 sec). This signal in particular is comprised of a 112 μs
train of 112 sub-pulses. Each sub-pulse has a pulse-width of 0.5 μs
and is positioned in either the first half or second half of each microsecond interval using PPM. Because of these signal parameters,
it is desirable to obtain the characteristics of the pulse-train as well
as the individual sub-pulses. These measurements are made using
the 57318 Peak Power Sensor.
Fig. 3(b) shows an entire pulse-train in pulse mode. Notice the
width of the ‘pulse’ at the top left corner of the screen (112 μs).
Also given are the peak and average powers over the course of
the pulse train. Fig. 3(c) illustrates the time-resolution of the 4540
series. In this figure, the pulse-train is expanded so that several
sub-pulses are visible. Notice that some are approximately 0.5
while others appear to be double that length. This is due to the PPM
method used. The chosen parameters (pulse-width, rise-time, falltime, peak power, pulse average power, and marker power ratio)
are displayed at the top of the screen. The final measurement was
performed in statistical mode using the 57318 Peak Power Sensor.
This mode gives the probability as a percentage in the vertical logarithmic scale that the signal contains certain relative power levels.
4. Adjusting time and power scales
Adjusting the time and power scales of the display area is a simple
yet crucial task. A proper choice of axes is integral to effectively
illustrate data. The available options depend upon the mode in
use. While in modulated mode or pulse mode, the Time option is
available from the Main menu. Within the Time menu are options
to adjust the Time Base (10 ns/Div to 1 min/Div), Position (either
Middle, Right, or Left or +/-30 div), Trig Delay (0 ns to 100 μs),
and Position Control (Preset or Vernier). To adjust the power scale
while in modulated mode or pulse mode, the user must navigate to
the Main/Channel menu and then select the desired input channel
(Channel 1 or Channel 2). This brings up the options to adjust the
Vert. Scale (0.1 to 50 dB/Div) and the Vert. Center (-100 dBm to
Application Note
Boonton 4540 RF Power Meter Application in a Transponder Type Pulsed Radar System
4
(a) Average power measurement of pulse-
(b) Power measurements of one burst of train in modulated mode
pulse-train in pulse mode
(c) Pulse-train sub-pulse power measurements in pulse mode
(d) Power measurements of pulse-train in statistical mode
Fig. 3 - Using the 4540 RF Power Meter in (a) modulated mode, (b) and
(c) pulse mode, and (d) statistical mode
Application Note
Boonton 4540 RF Power Meter Application in a Transponder Type Pulsed Radar System
5
Summary
Power meter is an important tool for radar engineering. Boonton model 4540 Series Peak Power meter is a powerful yet lowcost tool for advanced radar system development and trouble
shooting. Using this power meter for measuring a transpondertype radar signal with complicated pulse modulation scheme is
demonstrated in this application note. Performing appropriate
calibration, selecting correct measurement mode/power sensor,
and correctly controlling the user interfaces are the key steps
to ensure accurate power measurements. Comparing to similar
product we have been used, this power meter has nice graphic interface, comprehensive functionality and easy-to-learn features,
which are very appropriate for university laboratories and engineer training programs.
Wireless Telecom Group Inc.
25 Eastmans Rd
Parsippany, NJ
United States
Tel:
+1 973 386 9696
Fax:
+1 973 386 9191
www.boonton.com
© Copyright 2010
All rights reserved.
Note: Specifications, terms and conditions
are subject to change without prior notice.