1
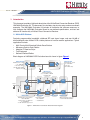
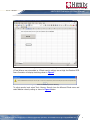
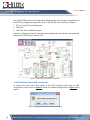
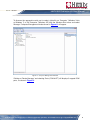
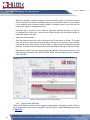
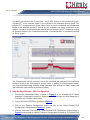
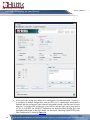
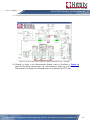
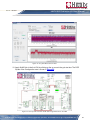
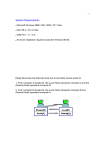
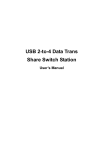
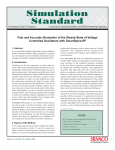
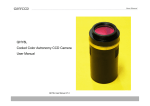
Analog Devices Welcomes Hittite Microwave Corporation NO CONTENT ON THE ATTACHED DOCUMENT HAS CHANGED www.analog.com www.hittite.com THIS PAGE INTENTIONALLY LEFT BLANK HMC6383 Evaluation Kit Analog, Digital & Mixed-Signal ICs, Modules, Subsystems & Instrumentation User Manual Software & Hardware Installation Order On-Line at: www.hittite.com Receive the latest product releases - click on “My Subscription” 20 Alpha Road Chelmsford, MA 01824 Phone: 978-250-3343 • Fax: 978-250-3373 • [email protected] Part # 140-00038-00 Rev. A - v00.0711 ECN# CP111219 HMC6383 Evaluation Kit User Manual Rev. A - v00.0711 Table of Contents 1. 1.1 2. 2.1 2.2 3. 4. 4.1 5. 6. 7. 7.1 7.2 7.3 7.4 7.4.1 8. 8.1 9. 10. 2 Introduction. . . . . . . . . . . . . . . . . . . . . . . . . . . . . . . . . . . . . . . . . . . . . . . . . . . . . . . . . . . . . . . 3 Hittite DCR Platform . . . . . . . . . . . . . . . . . . . . . . . . . . . . . . . . . . . . . . . . . . . . . . . . . . . . . . . . 3 HMC6383 Evaluation Kit Contents. . . . . . . . . . . . . . . . . . . . . . . . . . . . . . . . . . . . . . . . . . . . 4 Hardware. . . . . . . . . . . . . . . . . . . . . . . . . . . . . . . . . . . . . . . . . . . . . . . . . . . . . . . . . . . . . . . . . 4 Software. . . . . . . . . . . . . . . . . . . . . . . . . . . . . . . . . . . . . . . . . . . . . . . . . . . . . . . . . . . . . . . . . . 4 Operating Environment. . . . . . . . . . . . . . . . . . . . . . . . . . . . . . . . . . . . . . . . . . . . . . . . . . . . . 4 Setup and Installation . . . . . . . . . . . . . . . . . . . . . . . . . . . . . . . . . . . . . . . . . . . . . . . . . . . . . . 5 User Provided Equipment. . . . . . . . . . . . . . . . . . . . . . . . . . . . . . . . . . . . . . . . . . . . . . . . . . . . 5 Hardware Setup . . . . . . . . . . . . . . . . . . . . . . . . . . . . . . . . . . . . . . . . . . . . . . . . . . . . . . . . . . . 5 Software Installation/Uninstallation . . . . . . . . . . . . . . . . . . . . . . . . . . . . . . . . . . . . . . . . . . . 6 Get Started with Hittite DCR Eval Software . . . . . . . . . . . . . . . . . . . . . . . . . . . . . . . . . . . . . 6 DCR Evaluation Board Receiver Configuration. . . . . . . . . . . . . . . . . . . . . . . . . . . . . . . . . . 6 DCR Evaluation Board ADC Configuration . . . . . . . . . . . . . . . . . . . . . . . . . . . . . . . . . . . . 10 Configuration of EasySuite for DCR . . . . . . . . . . . . . . . . . . . . . . . . . . . . . . . . . . . . . . . . . . 12 EasySuite Features. . . . . . . . . . . . . . . . . . . . . . . . . . . . . . . . . . . . . . . . . . . . . . . . . . . . . . . . 13 Digital Image Rejection . . . . . . . . . . . . . . . . . . . . . . . . . . . . . . . . . . . . . . . . . . . . . . . . . . . . 14 Step-By-Step Example - DCR Configuration . . . . . . . . . . . . . . . . . . . . . . . . . . . . . . . . . . . 15 Receiver Calibration . . . . . . . . . . . . . . . . . . . . . . . . . . . . . . . . . . . . . . . . . . . . . . . . . . . . . . 32 Low Pass Filter (HMC900LP5E) Calibration - Step-By-Step Example . . . . . . . . . . . . . 45 Conclusion. . . . . . . . . . . . . . . . . . . . . . . . . . . . . . . . . . . . . . . . . . . . . . . . . . . . . . . . . . . . . . . 52 Order On-Line: www.hittite.com. For technical application questions: Tel: 978-250-3343 or [email protected] Rev. A - v00.0711 HMC6383 Evaluation Kit User Manual 1. Introduction This document provides a high level description of the Hittite Direct Conversion Receiver (DCR) HMC6383 Evaluation Kit. The document also includes step-by-step setup and measurement examples. The HMC6383 Evaluation Kit includes all hardware and software necessary to fully configure the HMC6383 Evaluation Board to user defined specifications, and test and observe full functionality of Hittite’s Direct Conversion Receiver. 1.1Hittite DCR Platform Precisely programmable bandwidth, wideband RF input signal range, and over 80 dB of distributed gain make Hittite’s DCR a viable platform for various receiver applications. Typical applications include: • Multi-Carrier Multi-Standard Cellular Base Stations • Microwave Point-to-Point Radios 1. Introduction • Adaptive IF Receiver Strips •This Test Equipment document provides test setup instructions and a high level description of Hittite Direct •Conversion Software Receiver Defined Radios (DCR) Evaluation Kit. Block DCR in Evaluation board is shown in figure Figure 1. Blockdiagram diagramofofHMC6383 DCR is shown figure xxxx. HMC830LP6GE Wideband PLL + VCO • 25 - 3000 MHz • Low Phase Noise (-141 dBc/Hz @ 2 GHz & 10 kHz Offset) PLL LO REF HMC830LP6GE Wideband PLL + VCO • 25 - 3000 MHz • Low Jitter (112 fs RMS Jitter) PLL REF CLOCK ADC CLOCK HMC900LP5E Dual Baseband LPF • 3.5 to 50 MHz, 3 dB BW • +30 dBm OIP3 FPGA / DSP ADC RFIN 0 90° ADC HMC597LP4E Wideband Direct Demodulator • 100 - 4000 MHz • High Linearity: +25 dBm IIP3 & + 60 dBM IIP2 • 55 dB Sideband Suppression HMC960LP4E Dual Channel VGA • DC - 100 MHz • +30 dBm OIP3 HMC960LP4E HMCAD1520 Multi-Channel A/D Converter • 12/14-Bit @ 320/105 MSPS Figure 1. Hittite Direct Conversion Receiver Block Diagram the functionality of Hittite Direct Conversion Receiver (DCR) Evaluation Kit, and provides high level instructions for using the Kit. This kit includes PC compatible software that enables the user to configure and control all parts of the DCR. Order On-Line: www.hittite.com. For technical application questions: Tel: 978-250-3343 or [email protected] 3 Rev. A - v00.0711 HMC6383 Evaluation Kit User Manual DCR platform includes the following features: • Wideband, covering RF input frequencies of 700 MHz to 3000 MHz. • Precisely programmable 3 dB bandwidth, anywhere from 3.5 MHz to 50 MHz baseband (7 MHz to 100 MHz IF) within +/- 2.5%. • Over 80 dB of distributed gain that enables flexibility for various configurations to optimize Noise Figure and/or blocker sensitivity. And consists of the following major blocks: • Two HMC830LP6GE Wideband, Low Noise Fractional-N PLLs with integrated VCOs • HMCAD1520 high speed multi-mode 8/12/14-bit 1000/640/105 MSPS A/D • HMC900LP5E 50 MHz Dual Programmable Low Pass Filter with Driver • Two HMC960LP4E DC-100 MHz Dual Digital Variable Gain Amplifiers with Driver • HMC597LP4E 100 MHz to 4000 MHz Wideband Direct Demodulator Detailed information about each component is available in the individual component data sheets, and can be accessed by clicking on the component name above, and selecting ‘Data Sheet’. 2. HMC6383 Evaluation Kit Contents 2.1Hardware Item Quantity Hittite Direct Conversion Receiver Evaluation Board 1 Xilinx SP601 Evaluation Kit 1 USB Interface Board 1 6’ USB A Male to USB B Male Cable 1 CD ROM (Contains User Manual, DCR Schematic, and software) 1 Note: Xilinx SP601 Evaluation Kit is pre-configured with FPGA core necessary to interface with Hittite HMCAD1520 Analog-To-Digital Converter (ADC), and Hittite DCR Evaluation Software package. It also includes all of the necessary interface cables including a USB cable, and a power supply cable. 2.2Software Hittite DCR Evaluation Software. Used to enable communication between a PC and Hittite DCR Evaluation Board. 3. Operating Environment The HMC6383 Evaluation Kit is designed for use in a laboratory setting at ambient room temperature (25 °C) and is not protected against moisture. The USB Interface Board has an ESD rating of ±3000 V, however individual components may have a lower rating (check the product’s data sheet for its specific ESD rating). Use appropriate ESD procedures and precautionary measures when handling all electronic hardware. 4 Order On-Line: www.hittite.com. For technical application questions: Tel: 978-250-3343 or [email protected] Rev. A - v00.0711 HMC6383 Evaluation Kit User Manual 4. Setup and Installation 4.1User Provided Equipment In addition to the items provided in the Kit, the user must provide the following equipment to communicate with Hittite DCR evaluation board. • DC Power Supply • DC Cables • Computer (PC) with Standard USB ports, Windows XP OS or later, Microsoft Excel 2003 or later. • Signal Generator (700 MHz to 3000 MHz) USB Interface Board DCR Power Supply (5.5 V) Xilinx SP601 Evaluation Board DCR Evaluation Board Power Switch Xilinx AC Power Supply Signal Generator USB interface With HMCAD1520 USB Interface with Analog Section of DCR Evaluation Board Figure 2. Hardware Setup 5. Hardware Setup Setup all hardware according to Figure 1. • Connect USB interface board to DCR Evaluation board • Connect the DCR Evaluation board to Xilinx SP601 Evaluation Board • Connect the provided USB cable to USB Interface board, and a PC. • Connect J9 of Xilinx SP601 Evaluation Board to the PC using provided USB cable. • Power up Xilinx SP601 Evaluation Board. • Apply +5.5 V to TP5 (TP6 is GND) on DCR Evaluation board. Supply current should be ~1.2 A after configuring all parts. Order On-Line: www.hittite.com. For technical application questions: Tel: 978-250-3343 or [email protected] 5 HMC6383 Evaluation Kit User Manual Rev. A - v00.0711 6. Software Installation/Uninstallation Double click on “Hittite DCR Evaluation Software Installer.exe” and follow the installation/ uninstallation wizard. Note: Installation requires administrative privileges. 7. Get Started with Hittite DCR Eval Software 1. Launch Hittite DCR Demo software from Start, Hittite Microwave Corp, Hittite DCR Demo on your computer, or by double clicking on the shortcut on PC desktop. The main window should open. See figure Figure 3 below. Figure 3. Hittite DCR Demo Start Dialog 2. To configure analog portion of the DCR evaluation board click on ‘Receiver Configuration’ button. 3. To view and receive data and to configure the ADC portion of the DCR evaluation board click on ‘ADC Configuration’ button. 7.1 DCR Evaluation Board Receiver Configuration To configure analog portion of the DCR evaluation board click on ‘Receiver Configuration’ button. Microsoft Excel window ‘DCR Demo Controller_v0.4.xls’ will appear as shown in the Figure 4 below. 6 Order On-Line: www.hittite.com. For technical application questions: Tel: 978-250-3343 or [email protected] Rev. A - v00.0711 HMC6383 Evaluation Kit User Manual Figure 4. Hittite DCR Demo Start Dialog If Excel Macros are not enabled, or if Excel security settings are set high, the Receiver DCR Demo Controller will display the dialog shown in Figure 5 . Figure 5. Hittite DCR Security-Macro Warning To adjust security level select Tools, Macros, Security from the Microsoft Excel menu and select Medium security setting as shown in Figure 6 below. Order On-Line: www.hittite.com. For technical application questions: Tel: 978-250-3343 or [email protected] 7 HMC6383 Evaluation Kit User Manual Rev. A - v00.0711 Figure 6. Microsoft Excel Security Setting Then, save and close ‘DCR Demo Controller_v04.xls’. Restart ‘DCR Demo Controller_v04.xls’ by clicking on ‘Receiver Configuration’ in the ‘Hittite DCR Demo’ dialog in Figure 3. Following dialog may appear. Figure 7. Microsoft Excel Security Warning Click on ‘Enable Macros.’ ‘DCR Demo Controller_v04.xls’ (Figure 4) will open. Click the ‘Run GUI’ button. The ‘Hittite Detailed DCR Configuration’ dialog shown in Figure 8 will appear. 8 Order On-Line: www.hittite.com. For technical application questions: Tel: 978-250-3343 or [email protected] Rev. A - v00.0711 HMC6383 Evaluation Kit User Manual Figure 8. Hittite Detailed DCR Configuration Dialog ‘Detailed DCR Configuration’ dialog enables complete and detailed configuration of all analog parts of the DCR. Load from file button allows quick configuration of all analog parts of the DCR. Initial default configuration file is installed as part of the software installation package and is available at “C:\Program Files\Hittite Microwave Corp\Hittite DCR Demo\Config.txt”. The user can click the ‘Save to File’ button to save a user defined configuration to a file that can be quickly loaded at a later time using the ‘Load from File’ button. For manual writes to individual parts of the DCR, the device to be configured is selected by selecting an appropriate radio button in the ‘SPI Chip Enable Select’ part of the ‘Detailed DCR Configuration’ dialog. Then by selecting appropriate Register Addresses, and Chip Addresses in hex all registers of each components can be written to or read from by clicking on ‘Manual Write’ or ‘Manual Read’ buttons respectively. Chip addresses of each part are automatically populated by the ‘Detailed DCR Configuration’ dialog once the appropriate radio button from the ‘SPI Chip Enable Select’ menu is selected. All of the details are provided in individual data sheets of each part. Clicking on ‘Main GUI’ button will open ‘Hittite DCR System View Configuration’ dialog shown in Figure 9. Order On-Line: www.hittite.com. For technical application questions: Tel: 978-250-3343 or [email protected] 9 HMC6383 Evaluation Kit User Manual Rev. A - v00.0711 The ‘Hittite DCR System View Configuration’ dialog enables quick change in configuration of the DCR. By changing the appropriate values in the GUI the user can quickly configure: 1. PLL (LO and ADC clock frequencies), 2. VGA Gain 3. Low Pass Filter bandwidth and gain Clicking on ‘Read All’ button will read the current configuration of all devices and update the display in the ‘DCR Demo Controller’ GUI. Figure 9. Hittite DCR System View Configuration 7.2DCR Evaluation Board ADC Configuration To interact with and control ADC portion of the DCR evaluation board click on ‘ADC Configuration’ button shown in Figure 3. Serial port selection dialog shown in Figure 10 will appear. Figure 10. Hittite DCR ADC Serial Port Selection Dialog 10 Order On-Line: www.hittite.com. For technical application questions: Tel: 978-250-3343 or [email protected] Rev. A - v00.0711 HMC6383 Evaluation Kit User Manual To discover the appropriate serial port to select, right-click on ‘Computer’ (Windows Vista or Windows 7) or ‘My Computer’ (Windows XP) from the Windows Start menu and select ‘Manage.’ Computer Management window shown in Figure 11 will appear. Figure 11. Computer Management Window Clicking on ‘Device Manager’ and selecting ‘Ports (COM &LPT)’ will display all mapped COM ports, as shown in Figure 12. Order On-Line: www.hittite.com. For technical application questions: Tel: 978-250-3343 or [email protected] 11 HMC6383 Evaluation Kit User Manual Rev. A - v00.0711 Figure 12. Windows Device Manager The appropriate port number corresponding to Hittite ADC device is the port number associated with ‘Silicon Labs CP210x USB to UART Bridge’ in the case of Figure 12 ‘COM3’. Selecting ‘TEST’ in Figure 10 will run ‘EasySuite’ (Hittite ADC control software) in test mode without establishing a connection with the ADC under evaluation. Selecting COM3 in Figure 10 will load Hittite ‘EasySuite’ Figure 13. EasySuite enables full control/configuration of the HMCAD1520. For detailed configuration/ performance information please see the HMCAD1520 data sheet. 7.3Configuration of EasySuite for DCR DCR EasySuite configuration setup is shown in Figure 13. The user must: 12 • Select CH1 to be INP1 and CH2 to be INP4 in ‘Input Configuration’ menu. • Select LVDS in the ‘Output Configuration’ menu. • Program the appropriate clock frequency in Hz, in the ‘Sampling Speed’ menu. This clock rate must correspond to the frequency programmed in the ADC LO PLL in the analog portion of the DCR. In case of Figure 13, the clock frequency of 158.3E6 is set. This is clock frequency is by default programmed to DCR ADC PLL when default register file is loaded. Order On-Line: www.hittite.com. For technical application questions: Tel: 978-250-3343 or [email protected] Rev. A - v00.0711 HMC6383 Evaluation Kit User Manual Figure 13. Hittite EasySuite 7.4EasySuite Features Clicking on ‘Open’ in the ‘Measurement Window’ menu will open the ‘EasySuite - Wave Plotting’ dialog shown in Figure 14. The ‘EasySuite - Wave Plotting’ dialog enables users to • View ADC output in time and frequency domain Order On-Line: www.hittite.com. For technical application questions: Tel: 978-250-3343 or [email protected] 13 HMC6383 Evaluation Kit User Manual Rev. A - v00.0711 • Select the number of plotted samples in the time domain graph. This feature enables users to increase the number of plotted samples to ensure that the ADC is not saturated, it also enables users to observe smaller number of samples (zoom in) to ensure that the time domain signal is the appropriate one. • Interactive plots. All plots in easy suite are interactive allowing the users to zoom in by dragging the mouse over a specific area. Right-clicking over the graph displays all interactive options available. • Select the active channel • Save measurement data into a file by clicking on the ‘Save results as’ button. The output data can also be saved for post processing by clicking the ‘Auto-store measurements’ radio button. Each data iteration can be stored in a separate file by selecting ‘Auto-step filename. The path for the saved data file can be specified by clicking on ‘Set path’ button. • Measurement values menu on the left hand side provides measured parameters of the received signal including: SNR, SNDR, ENOB, SFDR, and estimated distortion including: HD2, and HD3. Figure 14. Hittite EasySuite - Wave Plotting Dialog 7.4.1 Digital Image Rejection Hittite’s DCR platform features built-in receiver image rejection. Clicking on ‘Open’ button in the ‘Compensation’ menu opens ‘ComplexFft’ tab of EasyView - Wave Plotting window shown in Figure 15. 14 Order On-Line: www.hittite.com. For technical application questions: Tel: 978-250-3343 or [email protected] Rev. A - v00.0711 HMC6383 Evaluation Kit User Manual ComplexFft tab allows users to view both I and Q ADC outputs in the time domain graph. Complex FFT of the received signal is also available in the frequency domain graph. The complex FFT frequency domain graph allows users to view the calibrated and uncalibrated image of the received waveform, caused by the amplitude and phase imbalance of the receiver. The result of calibrated image rejection can be viewed in the FFT window by clicking on ‘Autotune’ button in the ‘Compensation control’. Uncalibrated data is available by clicking on ‘Reset’ button. Figure 15. Hittite EasySuite - Wave Plotting Dialog, ComplexFft Tab The ‘Compensation control’ menu also shows the calculated and calibrated Gain and Phase mismatch shown in the ‘Compensation control’ menu. In addition, the ‘Measurement values’ also show calculated image rejection before calibration (after clicking on ‘Reset’ button) and after calibration (after clicking on ‘Autotune’ button). 8. Step-By-Step Example - DCR Configuration 1. Connect the measurement setup as shown in Figure 2. In this example the RF Signal generator is configured to transmit a single carrier WCDMA signal at carrier frequency of 2120 MHz and -60 dBm output power. 2. Launch the Hittite DCR Demo application (Figure 3). 3. Click on the ‘Receiver Configuration’ button and wait for the ‘Hittite Detailed DCR Configuration’ dialog shown in Figure 8 to appear. 4. Click on ‘Load from File’ button in ‘Hittite Detailed DCR Configuration’ dialog shown in Figure 8, and navigate to a default ‘Config.txt’ configuration file found on ‘C:\Program Files Order On-Line: www.hittite.com. For technical application questions: Tel: 978-250-3343 or [email protected] 15 HMC6383 Evaluation Kit User Manual Rev. A - v00.0711 (x86)\Hittite Microwave Corp\Hittite DCR Demo\Config.txt’ on x64 operating systems or ‘C:\Program Files\Hittite Microwave Corp\Hittite DCR Demo\Config.txt’ on x86 operating systems, and select open (Figure 16). Figure 16. Loading a default ‘Config.txt’ file into Hittite Detailed DCR Receiver Configuration dialog 5. Now that the default configuration file is loaded, and analog section of the DCR is configured, click on ‘Main GUI’ in the ‘Hittite Detailed DCR Configuration’ dialog in Figure 3 and Figure 16 to open the ‘DCR System Veiw Configuration’ dialog. As shown in Figure 17, the ‘Hittite DCR System View Configuration’ is configured to the following settings by default: - 2800 MHz LO frequency - 158.33 MHz ADC clock frequency (2850 MHz / 18 = 158.33 MHz) - 6 dB gain in each of the two VGAs - 28 MHz low pass filter (HMC900LP5E) bandwidth 16 Order On-Line: www.hittite.com. For technical application questions: Tel: 978-250-3343 or [email protected] Rev. A - v00.0711 HMC6383 Evaluation Kit User Manual Figure 17.DCR Default Configuration After Loading the Config File 6. Now that the Analog portion of the DCR is configured to default configuration, to configure the ADC portion click on ‘ADC Configuration’ button in the ‘Hittite DCR Demo’ dialog in Figure 3 to open Hittite EasySuit ADC control software. 7. Follow instructions in section 7.2 to select the appropriate serial port for communication between EasySuite and the DCR. 8. Once EasySuite opens, to configure it for operation with default settings of the DCR adjust the following parameters: - Select ‘LVDS’ radio button in the ‘Output configuration’ menu - Select INP4 as CH2 and INP1 as CH1 in the ‘Input configuration’ menu - Enter 158.33 MHz (158.3E6) in ‘CLK’ text box in ‘Sampling Speed’ menu Configured ‘EasySuit ADC configuration’ window is shown in Figure 18. Order On-Line: www.hittite.com. For technical application questions: Tel: 978-250-3343 or [email protected] 17 HMC6383 Evaluation Kit User Manual Rev. A - v00.0711 Figure 18. EasySuite Configured ADC Configuration Window 9. At this point the analog part needs to be configured to the desired setup. Currently, it is configured to default configuration, and the ADC part is appropriately configured to interface with the analog part (input channels have been chosen, and the clock rate has been set). To configure the analog part of the DCR for the test input signal, program the LO PLL to 2110 MHz (for 10 MHz IF frequency) and leave the other settings (gain and bandwidth) unchanged so that their effects can be viewed. Resulting ‘Hittite DCR System View Configuration’ is shown in Figure 19. 18 Order On-Line: www.hittite.com. For technical application questions: Tel: 978-250-3343 or [email protected] Rev. A - v00.0711 HMC6383 Evaluation Kit User Manual Figure 19. Hittite System View Configuration Dialog Configured with LO = 2110 MHz 10.Clicking on ‘Open’ in the ‘Measurement Window’ menu of EasySuite in Figure 18, opens the EasySuite ‘Measurement’ tab. Then clicking on ‘Single run’ in the EasyView’s ‘Measurement’ tab displays the following results in time domain and FFT plots. Order On-Line: www.hittite.com. For technical application questions: Tel: 978-250-3343 or [email protected] 19 HMC6383 Evaluation Kit User Manual Rev. A - v00.0711 Figure 20.Resulting EasySuite Measurement View 11. At this point there is about 12 dB of gain applied at the receiver. To check used dynamic range of the ADC, click on the ‘Samples to plot’ drop down menu in ‘Plot control’ menu of the EasySuite ‘Measurement’ tab and select maximum number of samples. Observe in the Figure 21 that the occupied ADC range is between 2020 and 2032, and keep in mind that HMCAD1520 is a 12 bit ADC with a range from 0 to 4096. Also observe that the DC offset is roughly in the middle of the ADC range. Therefore the ADC is not saturated and gain can be applied. 20 Order On-Line: www.hittite.com. For technical application questions: Tel: 978-250-3343 or [email protected] Rev. A - v00.0711 HMC6383 Evaluation Kit User Manual Figure 21. EasySuite Measurement View 12.Apply 20 dB Gain in the first VGA by clicking on the up arrow in the gain text box. The DCR System View Configuration now is shown in Figure 22. Figure 22. DCR System View with 20 dB Gain Programmed in the first VGA Order On-Line: www.hittite.com. For technical application questions: Tel: 978-250-3343 or [email protected] 21 HMC6383 Evaluation Kit User Manual Rev. A - v00.0711 13.Clicking on ‘Single run’ in the in the ‘EasySuite’ ‘Measurement’ tab window now shows that the resulting signal (Figure 23) is indeed amplified. The utilized ADC dynamic range is larger than previous ( from 1190 to 2012), while the DC is still around 2000. Clearly, more gain can be applied. Figure 23. Observed result after 20 dB of gain in the first VGA 14.Applying more gain to the first VGA (21.5 dB), low pass filter (10 dB) and finally second VGA (10 dB) results in the DCR System View Configuration window shown in Figure 24. The reason for distributing the gain in such a way is apparent after reading the HMC900LP5E and HMC960LP4E data sheets. The VGA data sheet (HMC960LP4E) shows that the part has best Noise Figure at gain settings greater then 20 dB. Hence it makes sense to use the first VGA in around 20 dB of gain setting for optimal receiver performance. 10 dB of filter gain was applied to further improve Noise Figure, and finally the 10 dB of gain in the last VGA was added to maximize the SNR at the ADC. 22 Order On-Line: www.hittite.com. For technical application questions: Tel: 978-250-3343 or [email protected] Rev. A - v00.0711 HMC6383 Evaluation Kit User Manual Figure 24. Applying distributed gain to the DCR 15.Applying more gain to the filter and the second VGA results in the observed signal in Figure 25. The ADC DC offset has moved down to approximately 1425 which will limit any further gain that can be applied. The frequency domain graph shows that the signal is now amplified further, it also clearly shows the baseband filters effect. Note that the baseband filter bandwidth is set to 28 MHz (Figure 24). The observed result in Figure 25 clearly shows that the noise in the passband of the filter is also amplified. Order On-Line: www.hittite.com. For technical application questions: Tel: 978-250-3343 or [email protected] 23 HMC6383 Evaluation Kit User Manual Rev. A - v00.0711 Figure 25. Observed results after applying distributed gain in the DCR 16.Applying 5 dB of further gain in the DCR as shown in Figure 26 results in observations in Figure 27. Figure 26.DCR System View Configuration dialog showing addition of 5 dB of more gain in the second VGA 24 Order On-Line: www.hittite.com. For technical application questions: Tel: 978-250-3343 or [email protected] Rev. A - v00.0711 HMC6383 Evaluation Kit User Manual 17. As shown in Figure 27 in the time domain plot the ADC DC offset has moved further down to around 950. The ADC lower range is near 750. Clearly the ADC DC offset is moving closer to the lower limit. ‘Samples to plot’ setting in Figure 27 has been reduced in order to observe time domain signal more closely. Figure 27.Observed result as a consequence of adding 15 dB of gain in the second VGA 18. Adding further 5 dB of gain in the second VGA (a total of 20) as shown in Figure 28, results in DCR saturation. As can be observed in Figure 29, both time domain and frequency domain graphs show that the ADC is saturated. The time domain plot shows ADC reaching its upper limit (4096). Signal distortion is clearly observable in the frequency domain plot. At this point the DCR is configured for 51.5 dB of post demodulator gain, which is equivalent to a DC gain of 376x. Knowing that full scale saturation of the ADC occurs at ~2 Vppd (1 V differential), the resulting DC offset at the input to the first VGA can be calculated to be around 1/376 = 2.7 mV differential. It is important to note that the DCR platform is DC coupled, and that it is possible to use an AC coupled design for decreased sensitivity to DC offsets, and increased receiver dynamic range, if the system design permits AC coupling. Order On-Line: www.hittite.com. For technical application questions: Tel: 978-250-3343 or [email protected] 25 HMC6383 Evaluation Kit User Manual Rev. A - v00.0711 Figure 28.DCR System View Configuration dialog showing addition of further 5 dB of gain in the second VGA Figure 29.EasySuit view showing the effects of too much gain and saturation 26 Order On-Line: www.hittite.com. For technical application questions: Tel: 978-250-3343 or [email protected] Rev. A - v00.0711 HMC6383 Evaluation Kit User Manual 19.Restoring earlier gain settings with second VGA gain now set at 10 dB, but reducing the low pass filter bandwidth to 5 MHz (input signal is single channel WCDMA signal with bandwidth of 3.84 MHz) is shown in Figure 30. Figure 30. System View Configuration dialog showing restored gain settings and 5 MHz LPF bandwidth setting 20.The effect of reducing the filter bandwidth is shown in Figure 31. Clearly the noise in the passband (5 MHz) has been amplified, and the signal centered at 10 MHz has been attenuated by approximately 35 to 40 dB. Order On-Line: www.hittite.com. For technical application questions: Tel: 978-250-3343 or [email protected] 27 HMC6383 Evaluation Kit User Manual Rev. A - v00.0711 Figure 31. EasySuite showing the results of reduced bandwidth setting (5 MHz). A Signal of bandwidth 3.84 MHz is centered at 10 MHz. 21.Figure 32 illustrates the DCR System View Configuration where the LO is adjusted to generate a frequency of 2117.5 MHz which is mixed with a signal frequency of 2120 MHz and demodulated down to 2.5 MHz shown in Figure 33. The filter bandwidth is set to 5 MHz, and as can be seen in Figure 33 does not impact the spectrum of the received signal. 28 Order On-Line: www.hittite.com. For technical application questions: Tel: 978-250-3343 or [email protected] Rev. A - v00.0711 HMC6383 Evaluation Kit User Manual Figure 32.Programming the LO frequency to 2117.5 MHz to convert the signal centered at 2120 to baseband Figure 33.Signal received at baseband (centered at 2.5 MHz) with filter bandwidth set to 5 MHz Order On-Line: www.hittite.com. For technical application questions: Tel: 978-250-3343 or [email protected] 29 HMC6383 Evaluation Kit User Manual Rev. A - v00.0711 22.Figure 34 and Figure 35 show the DCR System View Configuration and resulting waveforms when the gain of the second VGA is further increased by 5 dB (total of 15 dB). Figure 34. System View dialog showing Filter bandwidth set to 5 MHz with additional 5 dB of gain in second VGA Figure 35. Observed results when second VGA gain increased by 5 dB with filter bandwidth set to 5 MHz 30 Order On-Line: www.hittite.com. For technical application questions: Tel: 978-250-3343 or [email protected] Rev. A - v00.0711 HMC6383 Evaluation Kit User Manual 23.Effect of maintaining identical settings, but increasing filter bandwidth by 2.5 MHz to 7 MHz is shown in Figure 36 and Figure 37. Figure 37 shows unchanged signal spectrum and amplification of noise at frequencies less than 7 MHz (programmed low pass filter bandwidth. Figure 36. System View dialog showing filter bandwidth set to 7 MHz Order On-Line: www.hittite.com. For technical application questions: Tel: 978-250-3343 or [email protected] 31 HMC6383 Evaluation Kit User Manual Rev. A - v00.0711 Figure 37. System View dialog showing the effect of increasing the filter bandwidth to 7 MHz 8.1Receiver Calibration Decreasing the filter bandwidth back to 5 MHz is shown in the System View Configuration dialog in Figure 38. Resulting EasySuite Measurement tab is shown in Figure 39. The plot is identical to Figure 35 earlier. Hittite’s DCR includes image rejection receiver calibration. The received signal and its’ image are clearly visible from the complex FFT graph available for viewing by clicking on the ‘Open’ button in ‘Compensation’ menu in the EasySuite Wave Plotting dialog (‘Measurement’ tab). The complex FFT graph and time domain I and Q signals are shown in Figure 40. Figure 40 shows the received signal and its uncalibrated image. The uncalibrated image rejection observed in Figure 40 is around -20 dBc. Hittite’s image calibration algorithm can be executed by clicking on ‘Autotune’ button in ‘Compensation control’ menu of the ‘ComplexFft’ tab in Figure 40. The resulting calibrated image rejection is shown in Figure 41 after clicking on the ‘Autotune’ button. Clicking ‘Autotune’ button again will run the calibration algorithm on the same data a second time. Figure 41 shows that the image calibration practically eliminated the image on the first pass. The calculated/calibrated amplitude and phase miss match is displayed in the ‘Compensation control’ menu of the ‘ComplexFft’ tab in EasySuite (Figure 41). It shows a gain mismatch of -0.146 dB and a phase mismatch of -7.68 degrees. After executing the calibration algorithm the second time (Figure 42) only a marginal improvement is observed (amplitude mismatch of -0.448 and unchanged phase miss match of -7.68 degrees), meaning that image calibration was effective the first time. 32 Order On-Line: www.hittite.com. For technical application questions: Tel: 978-250-3343 or [email protected] Rev. A - v00.0711 HMC6383 Evaluation Kit User Manual Hittite’s image calibration algorithm is executed in real time on received data signal, in this case 1 channel WCDMA signal. In order to test how well the image calibration holds from measurement to measurement, it is possible to memorize the calibration settings (amplitude and phase mismatch), independent set of data, and manually apply previously calibrated settings to observe the resulting image rejection. Next few slides will do exactly that. Figure 38. System View dialog showing the measurement setup of the DCR Order On-Line: www.hittite.com. For technical application questions: Tel: 978-250-3343 or [email protected] 33 Rev. A - v00.0711 HMC6383 Evaluation Kit User Manual Figure 39. System View dialog showing observations in the ‘Measurement’ tab Signal Uncalibrated Image Figure 40. EasySuite ComplexFft tab showing time domain I & Q signals and complex FFT showing the signal and its image caused by amplitude and phase mismatch in the receiver 34 Order On-Line: www.hittite.com. For technical application questions: Tel: 978-250-3343 or [email protected] Rev. A - v00.0711 HMC6383 Evaluation Kit User Manual Signal Calibrated Image after 1st Pass, Noise x 41.5dB Gain Figure 41. EasySuite image calibration, after performing image calibration algorithm once. Order On-Line: www.hittite.com. For technical application questions: Tel: 978-250-3343 or [email protected] 35 Rev. A - v00.0711 HMC6383 Evaluation Kit User Manual 0 dBFS = −3 dBVrms 16000 pt FFT at 158.33 MSPS 1bin = 9.664 kHz = 39.9 dBHz Quantization Noise (dBFS) f = Full Scale − SNR _ ADC − S + Bin Size (dBHz) 2 158.33 × 10⁶ + 39.9 = 20 log10 ( 0.7 ) − 60 − 20 log10 2 = −96 dBV / Hz Signal Calibrated Image, 2nd Pass Thermal Noise (dBFS) = Full Scale − KTFG + Bin Size (dBHz) ( ) = 20 log10 ( 0.7 ) − 20 log10 0.44 × 10⁻⁹ + 15 + 46.5 + 39.9 = −82.6 dBV / Hz Figure 42.EasySuite image calibration, after performing image calibration algorithm second time. 24.Remembering calibrated amplitude mismatch of -0.448 dB, and phase mismatch of -7.68 degrees, and maintaining same input signal as in Figure 38, pressing the ‘Reset’ button in the ‘Compensation menu’ of ‘ComplexFft’ tab of EasySuit will recapture new and uncalibrated set of data shown in Figure 43. 36 Order On-Line: www.hittite.com. For technical application questions: Tel: 978-250-3343 or [email protected] Rev. A - v00.0711 HMC6383 Evaluation Kit User Manual Figure 43. EasySuite ComplexFft tab after pressing ‘Reset’ and ‘Capture’ buttons showing signal and its image 25.Then manually entering the remembered amplitude (-0.448 dB) and phase (-7.68 degrees) mismatch in the ‘Compensation control’ menu of ‘ComplexFft’ tab of EasyView, Figure 44 is generated, illustrating that previously calibration is valid across independent set of data. Order On-Line: www.hittite.com. For technical application questions: Tel: 978-250-3343 or [email protected] 37 Rev. A - v00.0711 HMC6383 Evaluation Kit User Manual Figure 44. EasySuite image rejection result after manually entering previously calculated amplitude calibration values 26.Figure 45 shows the result of not changing the DCR setup in any way but changing the input signal from one carrier WCDMA to 4 carrier WCDMA signal. Figure 45 clearly shows the effect of 5 MHz setting of the low pass filter, one of the WCDMA channels is practically invisible. 38 Order On-Line: www.hittite.com. For technical application questions: Tel: 978-250-3343 or [email protected] Rev. A - v00.0711 HMC6383 Evaluation Kit User Manual Figure 45. EasySuite result showing not changing the DCR configuration but changing the input signal to 4 carrier WCDMA (Filter bandwidth setting is 5 MHz) 27.After changing the filter bandwidth to 20 MHz as shown in Figure 46, it is apparent that there are four WCDMA carriers (Figure 47). Figure 46. DCR System View Configuration showing adjustment of filter bandwidth to 20 MHz Order On-Line: www.hittite.com. For technical application questions: Tel: 978-250-3343 or [email protected] 39 HMC6383 Evaluation Kit User Manual Rev. A - v00.0711 Figure 47. EasySuite ComplexFft observation as a result of adjusting the filter bandwidth to 20 MHz 28.The data observed in Figure 47 is not correctly demodulated to baseband. It is actually a 20 MHz bandwidth signal demodulated to 2.5 MHz. In order to correct that, the LO is programmed to 2110 MHz (input signal is 4 carrier CDMA centered at 2120 MHz and approximate bandwidth of 20 MHz), so that the signal is received at baseband centered at 10 MHz, with 20 MHz bandwidth. The DCR System View Configuration is shown in Figure 48 and the resulting received signal is shown in Figure 49. 40 Order On-Line: www.hittite.com. For technical application questions: Tel: 978-250-3343 or [email protected] Rev. A - v00.0711 HMC6383 Evaluation Kit User Manual Figure 48. DCR System View Configuration showing the LO programmed to 2110 MHz Figure 49. DCR EasySuite showing received four carrier WCDMA signal with image Order On-Line: www.hittite.com. For technical application questions: Tel: 978-250-3343 or [email protected] 41 HMC6383 Evaluation Kit User Manual Rev. A - v00.0711 29.Remembering calibration calculation above using 1 carrier WCDMA signal, and applying it to uncalibrated four carrier WCDMA signal in Figure 49, Figure 50 is observed. Figure 50 shows that DCR calibration holds, independent of input signal and bandwidth. It shows that once calibrated settings from one carrier WCDMA data are applied to independent signal made up of four carrier WCDMA data, the image is virtually eliminated. Figure 50. DCR EasySuite showing received four carrier WCDMA signal, with applied previously calibrated amplitude and phase miss match (-0.448 dB amplitude and -7.68 degrees phase) calculated using one carrier WCDMA data. The figure shows that calibration setting is not dependent on input data. 30.In fact pressing ‘Autotune’ (Figure 51) to execute the calibration algorithm again, shows that the calibrations settings have not changed at all. Figure 51 shows newly calibrated amplitude miss match of -0.439 dB and phase mismatch -7.56 degrees, which is virtually identical to values calculated with single-carrier WCDMA signal previously. FFT of the same signal (Figure 52) can be observed by clicking on the ‘Measurement’ tab in EasySuite -Wave Plotting window. 42 Order On-Line: www.hittite.com. For technical application questions: Tel: 978-250-3343 or [email protected] Rev. A - v00.0711 HMC6383 Evaluation Kit User Manual Figure 51.DCR EasySuite showing received four carrier WCDMA signal after executing calibration algorithm. The image is eliminated and calculated amplitude and phase miss match is virtually identical to those calculated using single-carrier WCDMA signal earlier. Order On-Line: www.hittite.com. For technical application questions: Tel: 978-250-3343 or [email protected] 43 HMC6383 Evaluation Kit User Manual Rev. A - v00.0711 Figure 52.DCR EasySuite measurement window showing received 4 carrier WCDMA signal FFT and time domain 31.To save the current DCR setup for future use click on ‘ Manual IO’ button in the ‘Hittite DCR System View Configuration’ dialog to open the ‘Hittite Detailed DCR Configuration’ dialog. Then click on the ‘Save to File’ button and navigate to the desired location. Save the file as a text file. Figure 53 shows the saved configuration file. When opened (Figure 53), the configuration file shows all programmed registers of all components of the DCR. In a similar way the corresponding observed data can be stored locally for post processing by clicking on the ‘Set path’ button and selecting ‘Auto-store measurements’ radio button. The data will be stored in the desired location, with auto increment of name if the user so desires ‘Auto-step filename’ radio button. 44 Order On-Line: www.hittite.com. For technical application questions: Tel: 978-250-3343 or [email protected] Rev. A - v00.0711 HMC6383 Evaluation Kit User Manual Figure 53.Saved test setup configuration file 9. Low Pass Filter (HMC900LP5E) Calibration - Step-By-Step Example The low pass filter (HMC900LP5E) on the DCR evaluation board can be calibrated for precise bandwidth accuracy. Programmable bandwidth from 3.5 MHz to 50 MHz baseband (7 MHz to 100 MHz IF) with bandwidth accuracy of +/- 2.5 %. In order to complete calibration, and only during the calibration process, the HMC900LP5E requires a calibration clock. On the DCR evaluation board an external calibration clock source should be applied to pin 2 of J6 of the DCR evaluation board schematic. The details of the required clock source are available in HMC900LP5E data sheet. The Following example calibrates the HMC900LP5E on the DCR evaluation board by following the HMC900LP5E data sheet instructions. 1. Program the clock period in picoseconds to Reg05h of the HMC900LP5E. 1/50 MHz = 20000 picoseconds = 4E20h, as shown in Figure 54, and press manual write. To confirm, that the data is correctly written use the ‘Manual Read’ button to read back the same register in ‘Hittite Detailed DCR Configuration’ dialog, as shown in Figure 54. Order On-Line: www.hittite.com. For technical application questions: Tel: 978-250-3343 or [email protected] 45 HMC6383 Evaluation Kit User Manual Rev. A - v00.0711 Figure 54.Program and read back calibration clock period in picoseconds (Reg05h of HMC900LP5E) 2. Read Reg01h of HMC900LP5E (Figure 55) to make sure that the clock doubler is not enabled (It is not needed for 50 MHz clock), and to enable the RC calibration circuit. 46 Order On-Line: www.hittite.com. For technical application questions: Tel: 978-250-3343 or [email protected] Rev. A - v00.0711 HMC6383 Evaluation Kit User Manual Figure 55. Read Reg01h[5] to make sure that Reg01h[5] = 0. In this case Reg01h[5] was read to be 1 and programmed to Reg01h[5] = 0. 3. Now write the calibration register Reg04h to execute calibration, as shown in Figure 56. Order On-Line: www.hittite.com. For technical application questions: Tel: 978-250-3343 or [email protected] 47 HMC6383 Evaluation Kit User Manual Rev. A - v00.0711 Figure 56.Write Reg04h = 1h of HMC900LP5E to execute calibration routine. 48 Order On-Line: www.hittite.com. For technical application questions: Tel: 978-250-3343 or [email protected] Rev. A - v00.0711 HMC6383 Evaluation Kit User Manual Figure 57.Read Reg09h (calibration result) of HMC900LP5E 4. Calculate ctune = Cal_count (Figure 57)/10370000 = 10470000(9FC270h)/10370000 = 1.0964. If the desired frequency is 16 MHz (as an example) then normalized desired frequency is 16 MHz x ctune = 17.5424 MHz. Therefore, according to Table 9 in HMC900LP5E data sheet on page 16, the coarse_bandwidth_code = 0101 for desired frequency of 16 MHz. Then according to the HMC900LP5E data sheet the fine tuning factor is fBW_norm/fnom = 16 MHz/20 MHz = 0.8. The fine bandwidth code can be observed from Table 10 of the HMC900LP5E data sheet on page 17 to be ‘0000’b. 5. Finally execute step 3 of filter calibration in HMC900LP5E data sheet on page 17. Write coarse bandwidth code to Reg02h[9:6] as per Figure 58. Initially read Reg02h value from HMC900LP5E in order to ensure that other Reg02h values are not changed when writing bits[9:6] as per Figure 58. The value read from Reg02h was Reg02h = 185h. Therefore in order to write Reg02h[9:6] = 0h, Reg02h = 145h needs to be written as per Figure 58. Order On-Line: www.hittite.com. For technical application questions: Tel: 978-250-3343 or [email protected] 49 HMC6383 Evaluation Kit User Manual Rev. A - v00.0711 Figure 58. Program coarse_bandwidth_code to HMC900LP5E 6. Then write fine_bandwidth_code to Reg03h of the HMC900LP5E as per Figure 59. 50 Order On-Line: www.hittite.com. For technical application questions: Tel: 978-250-3343 or [email protected] Rev. A - v00.0711 HMC6383 Evaluation Kit User Manual Figure 59. Program fine_bandwidth_code to HMC900LP5E 7. FInally, to instruct the HMC900LP5E to use the desired setting program Reg01h[4] = 1. Initially as per Figure 60, Reg01h is read so that values other than Reg01h[4] can be left unchanged. Order On-Line: www.hittite.com. For technical application questions: Tel: 978-250-3343 or [email protected] 51 HMC6383 Evaluation Kit User Manual Rev. A - v00.0711 Figure 60. Program Reg01h[4] = 1h to make sure that the HMC900LP5E uses calibrated bandwidth settings 10.Conclusion These examples briefly illustrate some of the features of the ICs that make up the DCR evaluation platform. More complete information can be found online at the respective data sheets: 52 • HMC830LP6GE • HMCAD1520 • HMC900LP5E • HMC960LP4E • HMC597LP4E • HMC860LP3E • HMC976LP3E Order On-Line: www.hittite.com. For technical application questions: Tel: 978-250-3343 or [email protected] Order On-Line at: www.hittite.com Receive the latest product releases - click on “My Subscription” 20 Alpha Road Chelmsford, MA 01824 Phone: 978-250-3343 • Fax: 978-250-3373 • [email protected]