1
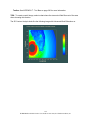
HURRTRAK & Global
Tracker
User’s Manual
Professional Hurricane/Typhoon
Tracking and Analysis System
Copyright 1992-2012, PC Weather Products, Inc.
2
HURRTRAK & Global Tracker Users Guide 1992-2012, PC Weather Products, Inc.
HURRTRAK EM/Pro 2012
HURRTRAK RM/Pro 2012
Global Tracker EM/Pro 2012
Global Tracker RM/Pro 2012
HURRTRAK Advanced 2012
Users Guide
Getting Started
System Components
FAQ
Technical Support
Copyrights and Trademarks
HURRTRAK EM/Pro, HURRTRAK RM/Pro, Global Tracker EM/Pro,
Global Tracker RM/Pro and Hurrtrak Advanced are trademarks of PC
Weather Products, Inc. The software and any authorization codes are
licensed property of PC Weather Products, Inc., and are copyright 19922012 by PC Weather Products, Inc. This manual, or portions thereof, may
not be reproduced in any form without written permission of PC Weather
Products.
3
HURRTRAK & Global Tracker Users Guide 1992-2012, PC Weather Products, Inc.
Table of Contents
GETTING STARTED:
ABOUT THIS DOCUMENTATION
INTRODUCTION
SYSTEM REQUIREMENTS
INSTALLATION
SYSTEM COMPONENTS
HURRICANE TRACKING
FILE MENU OPTIONS
View Email Outbox
Database
New Storm
Open Storm
Delete Storm
Rename Storm
Copy Storm
Export Wind Data
Export to Shape file
Forecast Rainfall
QuickPlot
System Setup
Database Backup
Custom Map Maker
SloshView
H*Wind
Hurricane Reconnaissance
Hurricane History
Model Plot
Location Import Utility
Inland Wind Model
Advisory Ticker
Send Email Message
Print Setup
Display log
Exit
EDIT (DATA MAINTENANCE)
User Diary Maintenance
Observation Maintenance
Official Forecast Maintenance
Hurricane Model Forecast
Climatology Forecast Maintenance
NHC Advisory Maintenance
Watch and Warning Maintenance
REPORTS
E-Z Report
Report Map Select
GOOGLE EARTH EXPORT
TOOLS
4
HURRTRAK & Global Tracker Users Guide 1992-2012, PC Weather Products, Inc.
9 9 9 10 10 11 11 14 14 14 14 14 14 15 15 15 15 15 15 15 15 15 15 15 15 15 15 15 15 16 16 16 16 16 17 17 18 21 23 24 26 27 28 29 32 33 36 Setup "What if" scenario
Setup Post Storm Analysis
Summary Report Setup (Automated)
Email Alert Setup (Automated)
“Other” Automations Setup
Tools - Options (User Preferences)
Animation options
Automation/Alert options
Email address book
Email General Setup
Flood Index / Surge Probability Options
Fonts Options
General Options
Hurrtrak Online Options
Impact Analysis/ Reporting Options
Plotting Options
Strike/Wind Probability Options
Unit of Measure Options
Wind Band Options
Setup Application Appearance
HELP OPTIONS
INFORMATION TABS
General Information Tab
Risk/Impact Tab
HURRTRAK ONLINE Tab
INTERNET Tab
ExpertEase Tab
Map Selection Tab
“Variable Tracking Chart”/Map Selection Tab
Fixed/Favorite Tracking Chart Tab
Wind Band Analysis Tab
Strike/Wind Probability Analysis Tab
Forecast Rainfall Analysis Tab
Animation Tab
Forecast Position Tab
Wind Surface Tab
Tropical Weather Outlook Tab
Public Advisory Tab
Forecast Advisory Tab
Forecast Discussion Tab
Probability Advisory Tab
User Comments (Diary) Tab
Observation Worksheet Table Tab
Official Forecast Table Tab
Climate Forecast Table Tab
Watch and Warning Table Tab
Wind Speed Graph Tab
Central Pressure Graph Tab
Location Group Summary Impact Report Tab
County Summary Report Tab
Zip Code Summary Report Tab
Detailed Location/County/Zip Hourly Report Tab
County/Zip Impact Analysis Report Tab
Strike Probability Report Tab
Wind Probability Report Tab
5
HURRTRAK & Global Tracker Users Guide 1992-2012, PC Weather Products, Inc.
37 38 39 44 50 56 57 59 61 63 66 67 68 78 82 84 92 93 94 95 97 98 99 100 102 103 104 105 107 109 113 115 117 120 122 124 126 127 128 129 130 131 132 133 134 135 136 137 138 141 143 145 147 148 149 Surge Probability Report Tab
Detailed Location/County/Zip Wind Graph Tab
Detailed Location/County/Zip Flood Index Graph Tab
County/Zip Wind Thematic Tab
MISCELLANEOUS OPTIONS IN SUPPORT OF TAB FUNCTIONS
Email Outbox
Send Email
Tracking Chart Display Options
Chart Plot options
Wind Band Display Options
Strike/Wind Probability Tab Display Options
Strike/Wind Probability Tab Plot Options
Thematic Tab Display Options
Decision Arc Pop-up Input Example
Annotate Chart
Print/Export Options (Graphics)
Print/Export Options (Reports/Text)
Save Image Options
Additional Toolbar Options:
Chart Display "options"
NON TAB BASED REPORTS
FORECAST LOCATION RISK/IMPACT REPORT (NON TAB)
SYSTEM SETUP
SYSTEM PREFERENCE SETUP
Database Maintenance
Database Compact and Repair
Database Backup
Database Restore
Remove Reconnaissance Data
Remove Rain Forecast Data
Remove Forecast Model Data
Remove HWIND Data
Remove Wind Probability Data
Remove Surge Probability Data
System Options
User Fields
Forecast Error
48 / 120 Hour Estimating Parameters
USER Maintenance
Location Maintenance Options
Location ("City") Maintenance
Advanced Location Data Entry (Default)
Advanced Location Data Entry (Legacy)
Define Action Points
Location Group
Location Group Association
County Maintenance
Zip Code Maintenance
TRACKING CHART MAINTENANCE
WATCH AND WARNING AREA POINT MAINTENANCE
FLOOD POINT MAINTENANCE
CUSTOM MAP MAKER
QUICKPLOT
HURRICANE/TROPICAL CYCLONE HISTORICAL ANALYSIS SYSTEM
SET BASIN
6
HURRTRAK & Global Tracker Users Guide 1992-2012, PC Weather Products, Inc.
150 151 152 153 154 154 156 157 159 160 162 163 164 165 166 167 168 169 170 170 172 172 178 179 179 179 180 180 180 180 180 180 180 180 181 182 183 184 185 186 187 190 192 195 197 198 199 201 203 205 207 210 212 216 217 SELECTION METHODS
Select Storm by Location (set distance)
Select Storm by Location (variable distance) - RM/Pro only
Select by Storm Name
Select by Year
Select by Strength
DISPLAY STORMS
PLOT (STORM PLOT SELECTION)
MISCELLANEOUS ANALYSIS
Formation Point Selection
Location Historical Analysis
SLOSHVIEW - SLOSH & INUNDATION ANALYZER
SLOSHVIEW TUTORIAL
SLOSHVIEW MAIN CHART SELECT DISPLAY (MOM MODE)
SLOSHVIEW DATA DISPLAY (MOM MODE)
SLOSHVIEW MAIN CHART SELECT DISPLAY (MEOW MODE)
SLOSHVIEW DATA DISPLAY (MEOW MODE)
SLOSH REPORT
SLOSH / INUNDATION OPTIONS
SLOSHVIEW CONSIDERATIONS
H*WIND DISPLAY
HURRICANE RECONNAISSANCE
HURRICANE MODEL PLOT
DESKTOP SATELLITE
TRAY ALERT MESSAGING
LOCATION IMPORT UTILITY
INLAND WIND MODEL
APPENDIXES
APPENDIX A: INITIAL SYSTEM SETUP ITEMS
APPENDIX A2: HURRTRAK ONLINE TIMER
APPENDIX B: DECISION SUPPORT CAPABILITIES
APPENDIX C: STATUS BARS / GENERAL INFORMATION
APPENDIX D: EMAIL SETUP AND CAPABILITIES
APPENDIX DD: MICROSOFT OUTLOOK CONSIDERATIONS
APPENDIX E: AUTOMATED EMAIL ALERTS
APPENDIX F: AUTOMATED SUMMARY REPORTS
APPENDIX F2: “OTHER” AUTOMATIONS
APPENDIX F3: NARRATIVE IMPACT STATEMENTS
APPENDIX G: FLOOD INDEX SUMMARY
APPENDIX H: SLOSH DATA SUMMARY
APPENDIX I: SLOSH INUNDATION ANALYSIS
APPENDIX I2: STORM SURGE PROBABILITIES
APPENDIX J: LEGACY PAN AND ZOOM MAPPING
APPENDIX J1: HURRRAK MAPS / TRACKING CHARTS
APPENDIX K: E-Z MAP OPTION
APPENDIX L: GIS WIND BAND EXPORT
APPENDIX M: RAINFALL FORECAST CAPABILITIES
APPENDIX N: HURRICANE MODEL FORECAST
APPENDIX NN: GOOGLE EARTH INTERFACE
APPENDIX O: NHC WIND RADII FORECAST CONSIDERATIONS
APPENDIX OO: INTERACTIVE CHART NOTES
APPENDIX P: DEPICTION OF STORM’S EYE, EYE WALL AND WIND FIELD
7
HURRTRAK & Global Tracker Users Guide 1992-2012, PC Weather Products, Inc.
217 218 220 221 221 221 222 226 230 230 233 234 234 237 239 241 243 245 246 249 250 253 258 260 262 264 267 268 268 269 270 273 276 279 280 284 290 291 292 293 295 297 298 299 301 302 304 305 306 308 309 310 APPENDIX PP: MULTI-COLORED WIND VECTOR DISPLAY
APPENDIX Q: ADVANCED WIND ESTIMATION
APPENDIX QA: ADVANCED WIND ESTIMATION CONSIDERATIONS
APPENDIX QQ: WIND PATTERN DISPLAY
APPENDIX R: RISK ALERT
APPENDIX S: USER INTERFACE CONSIDERATIONS
APPENDIX T: TOOL BARS
APPENDIX T1: DEFAULT VS. HURRTRAK ONLINE DATABASE
APPENDIX T2: WEBCAM/LOCATION IMAGES
APPENDIX T3: CROSS WIND CALCULATION, SETUP AND USE
APPENDIX T4: USING GOOGLE EARTH EXTERNAL DATA
APPENDIX T5: DAMAGE COMMENTS
APPENDIX T6: DAMAGE ESTIMATE REPORT (ADVANCED ONLY)
APPENDIX T7: SHAPE FILE EXPORT
APPENDIX T8: OVERLAY CONTROL CENTER
APPENDIX U: NETWORK INSTALLATIONS
APPENDIX V: GLOBAL TRACKER CONSIDERATIONS
APPENDIX W: TECHNICAL SUPPORT
APPENDIX X: SOFTWARE LICENSE & SERVICES AGREEMENT
APPENDIX Z: FAQ & TROUBLESHOOTING
8
HURRTRAK & Global Tracker Users Guide 1992-2012, PC Weather Products, Inc.
313 314 319 321 323 325 326 328 330 332 334 336 339 341 343 346 348 350 351 354 Getting Started:
Welcome to the Hurricane/Tropical Cyclone Tracking
Systems from PC Weather Products!
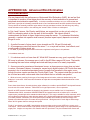
About this documentation
This documentation covers the functions and features of the HURRTRAK EM/Pro,
HURRTRAK RM/Pro and Hurrtrak Advanced systems. Items specific to RM/Pro and
Hurrtrak Advanced will be shown in red while items unique to Hurrtrak Advanced will be
shown in green. Other differences will be noted as required.
ONLINE Video Training
While this documentation is an excellent way to become more familiar with the software, we
strongly suggest that you go through the online training which is available on the web at
http://www.pcwp.com/training.html. There are over 16 hours of training modularized in a
manner which allows the trainee to cover the various topics at their own pace. Access to these
modules is free because we want everyone to take this training.
Introduction
The hurricane tracking products from PC Weather Products represent the most advanced and
easy to use Tropical Cyclone Tracking and Analysis Systems available. It has assisted
emergency planning professionals and risk managers around the world for years.
Our software products, HURRTRAK RM/Pro and HURRTRAK EM/Pro offer an advanced set of
functions and capabilities related to the analysis of Atlantic tropical systems as well as their
potential impact to land/sea areas. HURRTRAK-ONLINE is the company's on-line service which
provides all of the latest National Hurricane Center / JTWC / NOAA information, via an Internet
connection, to the HURRTRAK Systems. In addition, PC Weather Products offers Global Tropical
Cyclone Tracking Systems which track and analyze tropical cyclones around the world.
The main components of the system are Graphical and Reporting.
Graphical:
Highly detailed tracking charts
Ability to show counties and roadways on charts
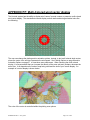
Graphical representation of the storm's eye, eyewall, gale, storm and hurricane force
Ability to plot storm track on satellite or radar tracking charts
Wind Field" analysis that displays the likely wind speed and wind direction conditions at any point
Ability to display the NHC forecast path on any chart
Ability to display a storm's forecasted position & wind field at any hour
Ability to calculate/display a climatology based forecast
Display the areas of hurricane and tropical storm watches and warnings
Display the storm's past and forecasted wind band analysis
Display the average forecast error along with the official NHC forecast
Graphically depict internally calculated Strike Probabilities
Animate the storm's past and forecasted motion
Ability to print historical tracks on the same tracking chart as a current storm
SLOSH Inundation Analysis
SLOSH MOM and MEOW Inundation Analysis
9
HURRTRAK & Global Tracker Users Guide 1992-2012, PC Weather Products, Inc.
Reporting/Decision Support:
Ability to compute a Location Impact Summary report
Ability to compute a detailed Location Impact Analysis report
Historical analysis program included to analyze past storm patterns
RiskAlert feature
Email Alerts
Automatically create and email summary reports and other automation outputs for a set of locations.
Create a Location Impact Summary Report for a large number of locations
Calculate a county 'impact analysis" which analyzes the storm impact by numbers of people and
households
Display hourly wind profiles for selected locations
Maintain EM user "diary" documenting the emergency actions taken
Display internally calculated Strike Probabilities for a set of locations
Display wind probability report
Display Surge Probability report
Enhanced Decision Support capabilities with action point and decision arc support
"What IF capabilities"
Zip Code Analysis
Ability to define up to 10 custom county / zip code fields used in the impact summary report
Advanced Wind Estimation
Damage Estimate Report
Other:
Ability to customize the application skin and tracking chart colors
Ability to add/change any location in the vast 20,000 location database
Ability to define location groups
Text size, font and color can be customized
You will learn more about these and other system features in the following pages.
System Requirements
To use the system, the minimal requirements are:
A PC with at least 4 GB of RAM
Hard disk space required: 5 GB
Windows XP, VISTA, Release 7
A Pentium class processor with a CD Drive
An Internet connection
Installation
1. If a CD was shipped, insert CD into your computer CDROM drive.
2. Browse the CD if shipped or, if downloaded, locate the install.exe file.
3. Follow the install directions entering the unlock key when requested. It is usually best to copy and
paste this key, if possible, to avoid key entry errors. The install key is all numeric.
4. When the installation is complete, reboot.
5. If the instructions call for the installation of a 2nd CD, please follow them.
Notes: The installation key that was shipped/sent with the order is required to install the system, please
make a note of it.
You are now ready to start using the system. Let’s review each of the system’s main
components.
10
HURRTRAK & Global Tracker Users Guide 1992-2012, PC Weather Products, Inc.
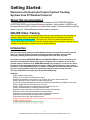
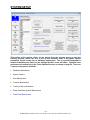
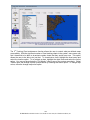
SYSTEM COMPONENTS
HURRICANE TRACKING
This is the “heart” of the system. It is the Hurricane / Tropical Cyclone Tracking &
Analysis component. It is designed to track current storms and analyze their past and
forecast movement.
The “Tab Interface” places all of the storm graphics, text and report data on individual
tabs. Many of the tabs (like advisory data, wind speed graphs, etc.) are automatically
created for the user. Others (reports, special graphics…) … are created by a user
action… while there are additional tabs that will “create/update” themselves when the
system is started or the data is updated via Hurrtrak Online. See APPENDIX S: User
Interface Considerations on page 325 for more information.
We will then review the system in two sections.
-
First, we will cover all of the system’s menu/toolbar functions in detail. In many
cases, these functions will create output that necessitates the creation/display of
a new tab.
-
Then, we will describe every possible “information tab” and detail the options
available.
11
HURRTRAK & Global Tracker Users Guide 1992-2012, PC Weather Products, Inc.
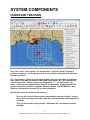
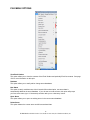
Let’s first examine the Standard (always there) Menu Options.
Standard Menu Commands:
FILE
View Email Outbox
Database
New Storm
Open Storm
Delete (storm name)
Rename (storm name)
Copy Storm
Export Wind Data
Export to Shape File
Rainfall Forecast
QuickPlot
System Setup
Database Backup
Custom Map Maker
Send Email Message
SloshView
H*Wind Display
Hurricane Reconnaissance
Hurricane History
Model Plot
Location Import Utility
Inland Wind Model
Advisory Ticker
Send Email Message
Print Setup
Display Log
Exit
EDIT
User Diary
Observations
Official Forecast
Model Forecast
Climatology Forecast
NHC Advisories
Watches & Warnings
REPORTS
Process Email Alert
Process Automation
Process Summary Report
Forecast E-Z Report
Forecast Location Strike Probabilities
Forecast Location Wind Probabilities
Forecast Location Wind Profile
Forecast Location Surge Probabilities
Forecast Location Risk/Impact
Forecast Location Executive Summary
Forecast County Wind Profile
Forecast Zip Code Wind Profile
Forecast Damage Estimate Report
Forecast Map Select Location Wind Profile
Actual Location Wind Profile
Actual County Wind Profile
Actual Zip Code Wind Profile
Actual Map Select Location Wind Profile
Actual Damage Estimate Report
GOOGLE EARTH EXPORT
Current Storm Track & Observations
Current Wind Radii (poly)
Current Wind Field (points)
Current Wind Pattern (poly)
Current Watch and Warning area
Official Forecast path (track and points)
Official Forecast Average Error
Latest Climate Forecast
Latest Model Plots
Latest Rainfall Forecast
Latest Animation Forecast
Official Forecast Wind Radii
Official Forecast Wind Field Grid
Official Forecast Wind Pattern
Rainfall Forecast (latest)
Latest Animated Forecast
Latest Animated Wind Arrow Forecast
Latest Wind Band Forecast
Report (Impact Summary)
County Impact Summary
Zip Code Impact Summary
All above selected outputs (Open, Save, Email,
Save to Email Outbox)
Prior Official Forecast Track
Prior Official Forecast Average Error
Official Forecast Wind Radii
Official Forecast Wind Field Grid
Official Forecast Wind Pattern
Animation
Wind Band
All Preferred Outputs
External Google Earth data
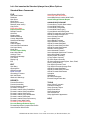
TOOLS
Setup "What if" scenario
Post Storm Analysis
Setup Summary Report
Setup Email Alerts
Setup Automations
User Preferences
Setup Application Appearance
HELP
12
HURRTRAK & Global Tracker Users Guide 1992-2012, PC Weather Products, Inc.
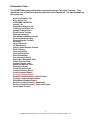
Information Tabs:
The HURRTRAK system information is presented using a "tab style" interface. This
allows the user to easily and quickly create and view information. The tabs available on
the system are:
General Information Tab
Risk / Impact Tab
HURRTRAK ONLINE Tab
Internet Tab
ExpertEase (Analysis) Tab
Tracking Chart Select Tab
Variable Tracking Chart
Fixed/Favorite Tracking
Wind Band Analysis
Strike/Wind Probability Analysis
Forecast Rainfall Analysis
Forecast Rainfall Thematic
Animation
Forecast Position
3D Wind Surface
Latest Tropical Weather Outlook
Public Advisory
Forecast Advisory
Forecast Discussion
Strike Probabilities
User Comments (Diary)
Observation Worksheet Table
Official Forecast Table
Climate Forecast Table
Watch and Warning Table
Wind Speed Graph
Central Pressure Graph
Location Summary Report
County Summary Report
Zip Code Summary Report
Detailed Location/County/Zip Hourly Report
County/Zip Impact Analysis Report
Strike/Wind Probability Report
Detailed Location/County/Zip Wind Graph
Detailed Location/County/Zip Flood Index Graph
County Wind Thematic
13
HURRTRAK & Global Tracker Users Guide 1992-2012, PC Weather Products, Inc.
FILE MENU OPTIONS
View Email Outbox
This option allows you to view the contents of the Email Outbox and optionally Email its contents. See page
154 for more information on this topic.
Database
This option allows you to easily add or change storm databases.
New Storm
This option is rarely used because, with a Hurrtrak Online subscription, new storm data is
automatically added to the storm database. If you do want to create a storm, this option will prompt
you for a storm name (up to 12 characters) and then take you to a data entry screen.
Open Storm
This option allows you to open an existing storm in the current storm database.
Delete Storm
This option deletes the current storm and all its associated data.
14
HURRTRAK & Global Tracker Users Guide 1992-2012, PC Weather Products, Inc.
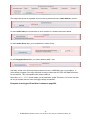
Rename Storm
This option renames the current storm. This is useful when a tropical depression becomes a named storm.
Copy Storm
This option allows the user to copy the current storm to the same or different database. This may be useful
when creating an "exercise" storm where you would like to use the current storm as its "base".
Export Wind Data
This option allows the user to export the actual, forecast or both actual and forecast wind band data into a
ArcInfo™ GIS importable format. See APPENDIX L: GIS Wind Band Export on page 302 for more
information.
Export to Shape file
This option allows the user to export various storm, actual and forecast, parameters to ESRI ™ Shape File
Format. See page APPENDIX T7: Shape File Export on page 341 for more information.
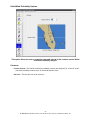
Forecast Rainfall
This option displays forecast rainfall on a county thematic chart for the next 3 days. You can display either
each 24 hours period or a cumulative 3 day total. This option IS available even if no storm is loaded. You
are required to either turn automated downloading on or manually select “retrieve forecast rainfall data” via
the Hurrtrak Online tab.
QuickPlot
This option takes the user to the QuickPlot function.
System Setup
This option takes the user to the system setup function. See page 178 for more information.
Database Backup
This option takes the user to the database maintenance portion of the system.
Custom Map Maker
This option takes the user to the custom map creation function. See page 210 for more information.
SloshView
This option takes the user to the Slosh View program. See page 233 for more information.
H*Wind
This option takes the user to the H*wind display program. See page 250 for more information.
Hurricane Reconnaissance
This option takes the user to the Hurricane Reconnaissance program. See page 250 for more details.
Hurricane History
This option takes the user to the Hurricane History program. See page 216 for more information.
Model Plot
This option takes the user to the Model Plot program. See page 258 for more information
Location Import Utility
This option takes the user to the Location Import program. It will force the Hurrtrak Tracking program to
exit. See page 262 for more information.
Inland Wind Model
15
HURRTRAK & Global Tracker Users Guide 1992-2012, PC Weather Products, Inc.
This option takes the user to the Inland Wind Model function. See page 267 for more information.
Advisory Ticker
This option rolls the text of the Public Advisory across the bottom of the screen.
Send Email Message
This option allows the user to send a general email message not associated to a particular storm.
Print Setup
This option allows the user to set up the printer for printing. Many print options throughout the system allow
the user to setup before printing initiates.
Display log
This option allows the user to view system log messages. They are sometimes useful when debugging
automatic operations.
Exit
This option exits the system. The current storm will automatically be reloaded when it is started again.
16
HURRTRAK & Global Tracker Users Guide 1992-2012, PC Weather Products, Inc.
EDIT (DATA MAINTENANCE)
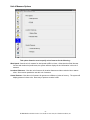
User Diary Maintenance
This option allows the user to enter free form comments related to action taken at this advisory.
This option allows the user to enter free form comments related to action taken at this advisory.
Options Include:
Options - Allows the user to alter the font
Help - Displays the help text
Other commands are Undo all changes, Clear and Exit.
In addition, typical Windows right click options are available (cut, copy, paste)
17
HURRTRAK & Global Tracker Users Guide 1992-2012, PC Weather Products, Inc.
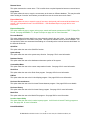
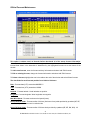
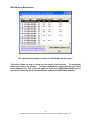
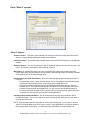
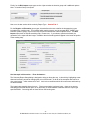
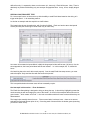
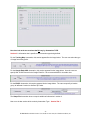
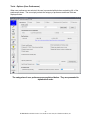
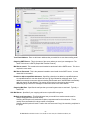
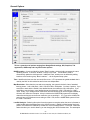
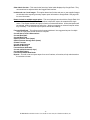
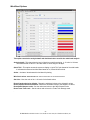
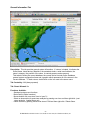
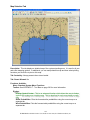
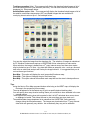
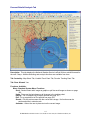
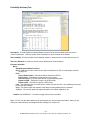
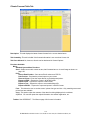
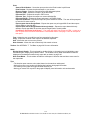
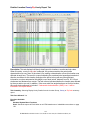
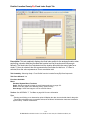
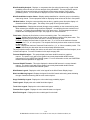
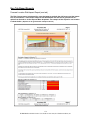
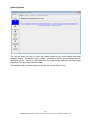
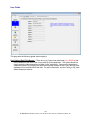
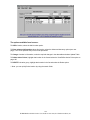
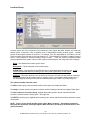
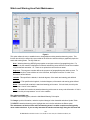
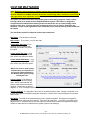
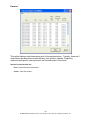
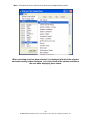
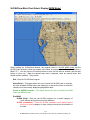
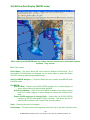
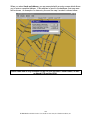
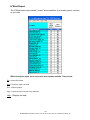
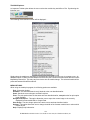
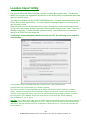
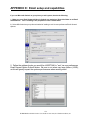
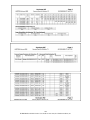
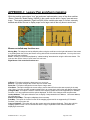
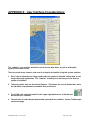
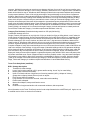
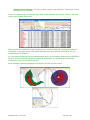
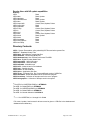
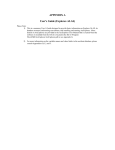
Observation Maintenance
This option is not typically used, as Hurrtrak Online updates all of the storm observation
information. It does, however, allow the user to enter, change or delete any of the storm's observation
data. The observation data shown in the data field boxes is determined by the highlighted observation row
at the bottom of the window.
Figure 1
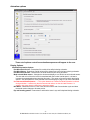
To add new observation data, fill in all of the required data and whatever portion of the optional data you
wish, then select ADD Observation If you are adding data to an existing storm set, the latest observation
information will be pre-loaded into the data field boxes, making for easier data entry.
To edit a prior observation, select that observation row at the bottom of the window, make the necessary
changes, then select EDIT Observation
To clear all fields, select that option.
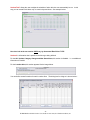
To perform a GRID table update, similar to a spreadsheet, select GRID UPDATE. All changes made in
grid mode will be updated into the storm database. Note: No data edit checks are done in GRID mode, so
be very careful.
Select CANCEL/EXIT to exit out of this update function.
18
HURRTRAK & Global Tracker Users Guide 1992-2012, PC Weather Products, Inc.
To delete a prior observation, select that observation at the bottom of the window and then select
DELETE OBSERVATION. Remember deleting an observation will also delete all of its associated data.
This includes the official forecast, climatology forecast and advisory information for that observation.
There are two "levels" of wind field data entry, standard and advanced. This is set in the user preferences
option. While the advanced is more complex it allows you to do a more detailed analysis of the storm's
wind field than the standard.
The data entry window contain the following data
Adv. No. - The advisory number of the observation.
Date - The date of the observation either in UTC or local. The date/time preference is set in the system
setup portion of the system.
Time - The time of the observation either in UTC or local time. The date/time preference is set in the
system setup portion of the system. (HHMM)
Latitude - The latitude position of the center of the storm entered in decimal degrees. Northern Latitudes
are positive.
Longitude - The longitude position of the center of the storm entered in decimal degrees. WESTERN
LONGITUDES ARE ENTERED AS A NEGATIVE.
Max wind - The maximum wind speed of the storm. The unit used (MPH or KTS) is set within the UOM
options function.
Central Pressure - The central pressure of the storm. Pressure must be entered in millibars.
Eye Diameter - The diameter of the eye (nautical miles). The eye is assumed to be closed and circular.
Default values are 18 nautical miles. If there is no eye, a zero should be entered in this field.
Eye Wall Width - The width of the eye wall (nautical miles). The default value is 9 nautical miles. Valid
range 1 - 100 miles. If there is no eye, a zero should be entered in this field.
Radius of 74 MPH / 64 Knot Winds (NE Sector) - The distance (nautical miles) that hurricane force winds
extend from the center of the storm on the Northeast side of the storm.
Radius of 74 MPH / 64 Knot Winds (SE Sector) - The distance (nautical miles) that hurricane force winds
extend from the center of the storm on the Southeast side of the storm.
Radius of 74 MPH / 64 Knot Winds (SW Sector) - The distance (nautical miles) that hurricane force winds
extend from the center of the storm on the Southwest side of the storm.
Radius of 74 MPH / 64 Knot Winds (NW Sector) - The distance (nautical miles) that hurricane force winds
extend from the center of the storm on the Northwest side of the storm.
Radius of 58 MPH / 50 Knot Winds (NE Sector) - The distance (nautical miles) that 50 knot winds extend
from the center of the storm on the Northeast side of the storm.
Radius of 58 MPH / 50 Knot Winds (SE Sector) - The distance (nautical miles) that 50 knot winds extend
from the center of the storm on the Southeast side of the storm.
Radius of 58 MPH / 50 Knot Winds (SW Sector) - The distance (nautical miles) that 50 knot winds extend
from the center of the storm on the Southwest side of the storm.
Radius of 58 MPH / 50 Knot Winds (NW Sector) - The distance (nautical miles) that 50 knot winds extend
from the center of the storm on the Northwest side of the storm.
19
HURRTRAK & Global Tracker Users Guide 1992-2012, PC Weather Products, Inc.
Radius of 39 MPH / 34 Knot Winds (NE Sector) - The distance (nautical miles) that 34 knot winds extend
from the center of the storm on the Northeast side of the storm.
Radius of 39 MPH / 34 Knot Winds (SE Sector) - The distance (nautical miles) that 34 knot winds extend
from the center of the storm on the Southeast side of the storm.
Radius of 39 MPH / 34 Knot Winds (SW Sector) - The distance (nautical miles) that 34 knot winds extend
from the center of the storm on the Southwest side of the storm.
Radius of 39 MPH / 34 Knot Winds (NW Sector) - The distance (nautical miles) that 34 knot winds extend
from the center of the storm on the Northwest side of the storm.
20
HURRTRAK & Global Tracker Users Guide 1992-2012, PC Weather Products, Inc.
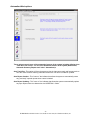
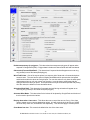
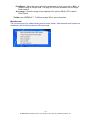
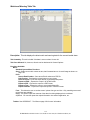
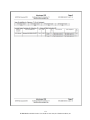
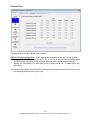
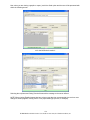
Official Forecast Maintenance
This option is seldom used, as Hurrtrak Online downloads all of the storm forecast information.
However, it does allow the user to enter, change or delete any of the storm's official forecast data. The
forecast data shown in the data table is determined by the highlighted forecast row at the bottom of the
window.
To Add a new forecast, enter the forecast advisory information and select Add / Edit forecast.
To Edit an existing forecast, change the forecast information and select Add / Edit forecast.
To Delete a forecast, highlight that row in the table at the end of the window and select Delete forecast.
The data fields for each forecast position from initial to 120 hours:
Date - Forecast date (UTC) entered as MM/DD/YY.
Time - Forecast time (UTC) entered as HHMM.
Latitude - Forecast latitude. North latitudes are positive.
Longitude - Forecast longitude. West longitudes are negative.
Max Wind Speed - Forecast maximum wind speed (knots).
Area of 64 knot winds - Forecast radius of 64 knot (Hurricane force) winds provided by quadrant (NE, SE,
SW, NW). All distances are in nautical miles.
Area of 50 knot winds - Forecast radius of 50 knot winds provided by quadrant (NE, SE, SW, NW). All
21
HURRTRAK & Global Tracker Users Guide 1992-2012, PC Weather Products, Inc.
distances are in nautical miles.
Area of 34 knot winds - Forecast radius of 34 knot (tropical storm force) winds provided by quadrant (NE,
SE, SW, NW). All distances are in nautical miles.
Options Available:
Help - Displays this help text.
Clear all fields - Clears all of the forecast data fields.
22
HURRTRAK & Global Tracker Users Guide 1992-2012, PC Weather Products, Inc.
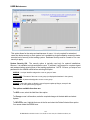
Hurricane Model Forecast
HURRTRAK ONLINE imports many of the hurricane model forecast data into the system. This
option only needs to be used if the user wants to include other forecast model information. The
forecast data shown in the data table is determined by the highlighted forecast row at the bottom of the
window.
To Add a new forecast, select Add Model forecast. You will be prompted for the name of the model,
initial Data/Time (ENTERED IN UTC TIME ONLY), and initial latitude and longitude. After entering this
data, a forecast record will be shown on the grid. It will need to be edited to include forecast
information.
To Edit an existing forecast, change the forecast information and select Edit forecast detail.
To Delete a forecast, highlight that row in the table at the bottom and select Delete Selected Model
Forecast.
The data fields for each forecast position from initial to 120 hours (not all columns need to be
entered):
Latitude - Forecast latitude. North latitudes are positive.
Longitude - Forecast longitude. West longitudes are negative.
Max Wind Speed - Forecast maximum wind speed (knots). This data is usually not included in the
hurricane model forecast.
Options Available:
Help - Displays this help text.
Clear all fields - Clears all of the forecast data fields.
23
HURRTRAK & Global Tracker Users Guide 1992-2012, PC Weather Products, Inc.
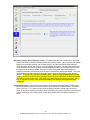
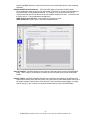
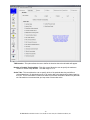
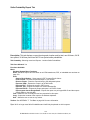
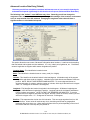
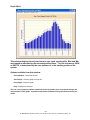
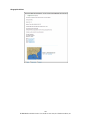
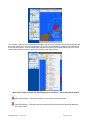
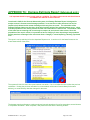
Climatology Forecast Maintenance
This option allows the user to calculate or delete any of the storm's calculated climatology forecast data.
The forecast data shown in the data table is determined by the highlighted forecast row at the bottom of the
window.
To Calculate a new forecast, select the advisories row at the bottom of the windows and select Calculate
Climatological Forecast. This will display a new window, as shown on the next page that displays the
forecast calculations along with the option to save. When the forecast is saved, it will then appear as a new
entry in this window’s table.
To Delete a forecast, highlight that row in the table at the end of the window and select Delete
Climatological Forecast.
Note: This forecast can also be calculated interactively while performing the PLOT - Climatology Forecast
function by selecting the "Latest" option.
24
HURRTRAK & Global Tracker Users Guide 1992-2012, PC Weather Products, Inc.
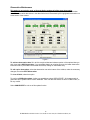
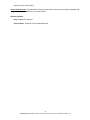
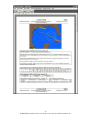
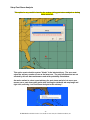
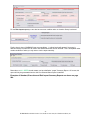
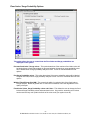
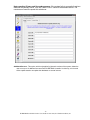
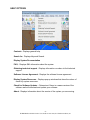
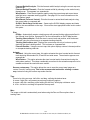
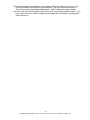
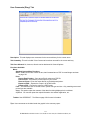
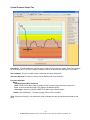
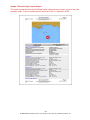
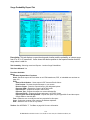
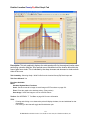
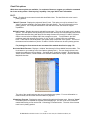
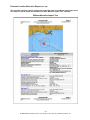
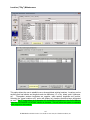
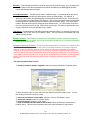
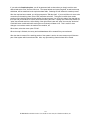
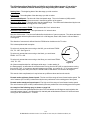
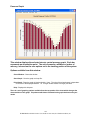
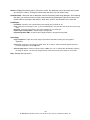
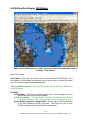
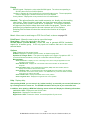
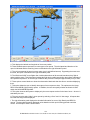
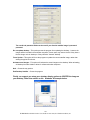
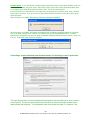
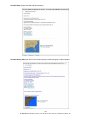
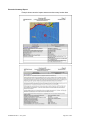
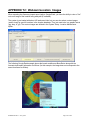
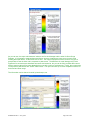
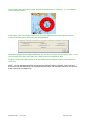
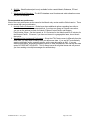
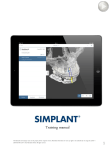
Calculate Climatological Forecast
The calculate
Climatological
Forecast option
analyzes the storm's
current movement
and all "similar"
storms in the
historical database to
compute a blended
climatological
forecast track. The
historical database is
analyzed for every 6
hour forecast position
to determine the next
forecast position.
This is iterated
(repeated) 14 times
to compute a 120
hour forecast track.
When the forecast
calculation is
complete, forecast
comments are
displayed along with
Figure 2
forecast positions,
number of similar
storms found, and whether the comparison criteria needed to be expanded to include a larger
sample of storms.
Options available:
Help - Displays this help text.
Print - Prints the contents of the forecast to the Windows printer.
NOTE: The Climatological forecast is based solely on the historical
database information. Movement of past storms, while sometimes a good
predictor of the movement of a current storm, should not be relied upon.
25
HURRTRAK & Global Tracker Users Guide 1992-2012, PC Weather Products, Inc.
NHC Advisory Maintenance
This option typically applies to older PCs with limited hard drive space.
This option allows the user to delete the text portion of the advisory. The associated
observation data is not affected. To delete, highlight the desired advisory and select
Delete Advisory Text. This option only applies to users of the HURRTRAK ONLINE service
who have all of the text advisories automatically added to the HURRTRAK database.
26
HURRTRAK & Global Tracker Users Guide 1992-2012, PC Weather Products, Inc.
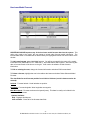
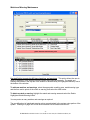
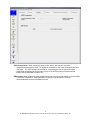
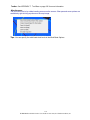
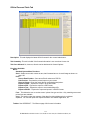
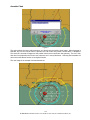
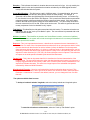
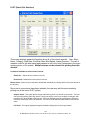
Watch and Warning Maintenance
Hurrtrak Online imports the US based watches and warnings. This option allows the user to
enter or delete any of the storm's Hurricane Watch and Warning area data. The watch and
warning data shown in the top half of the window is determined by the highlighted advisory row at
the bottom of the window.
To add new watches and warnings, select the appropriate coastline area, watch/warning type
and the from and to points of the watch or warning, and select the ADD button.
To delete a watch or warning, highlight the watch and warning area and select the Delete
Highlighted Watch/Warning button.
You may enter as many watches and warnings as required.
The pre-defined set of watch and warning points are maintained in the system setup portion of the
system. Please go to page 205 to find out more about how this data is structured.
27
HURRTRAK & Global Tracker Users Guide 1992-2012, PC Weather Products, Inc.
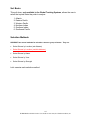
REPORTS
The Reports Include:
The first 3 selections are in their own category and allow the user to create/test pre-defined Automatic Email
Alerts, Automatic Summary Reports and “other” Automatic outputs.
-
Process Email Alerts - See page 280 for more information on the capabilities of Email Alerts.
Process Automation - see page 290 for more information on these outputs.
Process Summary Report(s) - see page 284 for more information on automatic Summary Reports.
The reports described below are typically shown on an informational tab. Some however are shown in their
own print preview type format and are noted as such.
Forecast Reports:
1. E-Z Report (print preview format) – see next page
2. Location Strike Probabilities (see page 148)
3. Location Wind Probabilities (see page 149)
4. Location Wind Profile (see page 138)
5. Location Surge Probabilities (see page 150)
6. Location Risk/Impact Report (see page 172) – (print preview format)
7. Location Executive Report (see page 174) – (print preview format)
8. County Wind Profile / Analysis (see page 141.)
9. Zip code Wind Profile / Analysis (RM/Pro) (see page 143)
10. Map Select Location – see page 32.
11. Damage Estimate Report – see page 339. – (print preview format)
Actual Impact Reports:
Location Wind Profile (see page 138)
County Wind Profile / Analysis (see page 141)
28
HURRTRAK & Global Tracker Users Guide 1992-2012, PC Weather Products, Inc.
Zip code Wind Profile / Analysis (RM/Pro) (see page 143)
Map Select Location - see page 32.
Damage Estimate Report – see page 339 – (print preview format)
Some of these are described in much more detail on the cross referenced pages noted above.
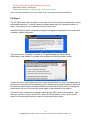
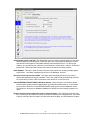
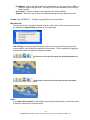
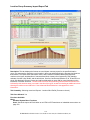
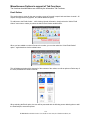
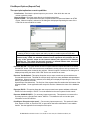
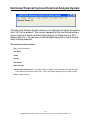
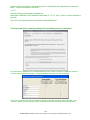
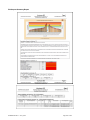
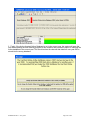
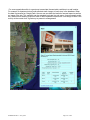
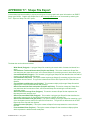
E-Z Report
The E-Z Report was initially designed for new users of the Hurrtrak system to assist them in being
immediately productive... by easily creating a forecast impact report for a particular location. In
reality, it has turned out to be a useful tool for all levels of users.
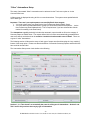
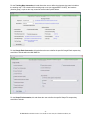
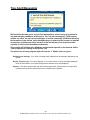
When the EZ-Report option is selected, a dialog box will appear prompting the user to enter basic,
or detailed, address information.
The user can enter a zip code, a city/state or a complete address (as shown above).
After finding a valid address, the system will then present the following options screen.
It allows the user to select the portions of the report they would like to include. As indicated above,
the report can optionally include a tracking map, the location's hourly impact details (in addition to
the summary impact which is included by default), and the Public Advisory text. By selecting the
bottom option, the user will not see this screen again for the remainder of the session.
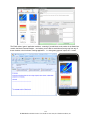
The report is then created and presented in a print preview PDF format as shown below... from
which you can send (e-mail), save as PDF, save to the E-mail outbox, or print. This is a great
option for new users and anyone who wants to create ad-hoc type reports.
29
HURRTRAK & Global Tracker Users Guide 1992-2012, PC Weather Products, Inc.
30
HURRTRAK & Global Tracker Users Guide 1992-2012, PC Weather Products, Inc.
31
HURRTRAK & Global Tracker Users Guide 1992-2012, PC Weather Products, Inc.
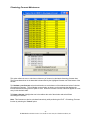
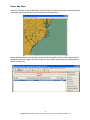
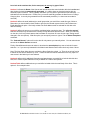
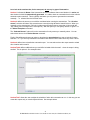
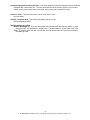
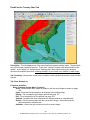
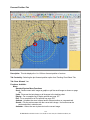
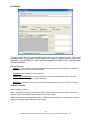
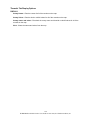
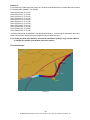
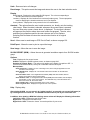
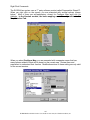
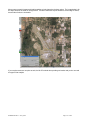
Report Map Select
When the Forecast or Actual Map Select Location Report is selected, the user is presented with a
map where a point can be select by left clicking your mouse button.
When satisfied with the point selected, choose the Accept option and the location report tab will
be displayed and will support all of the functions of the location group summary impact report as
shown on page 138 .
32
HURRTRAK & Global Tracker Users Guide 1992-2012, PC Weather Products, Inc.
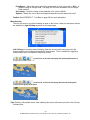
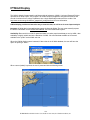
GOOGLE EARTH EXPORT
The Google Earth export menu option exports KML to Google Earth (GE) and is available whenever
there is an open storm. The data that is available for export is dependent on how current the storm
forecast and other data is… but most of the export options are typically available. For most of the
selections the user must mark each type of output they would like to create before selecting one of
the creation options (Open (GE), Save, Send, Save to E-mail outbox). The available type of data you
can export are listed below.
The options below must be "marked" for creation and then created, as one KML/KMZ file, by the
"ALL above selected outputs" selections.
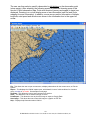
Current Storm Track and Observations – This option exports the storm track and observations as KML
for Google Earth (GE).
Current Wind Radii – When selecting this option, the system will export KML which contains up to 3
polygons representing the current 34, 50 and 64 knot wind areas.
Current Wind Field – This option will export a “grid” of points across the entire current wind field. When
viewed on GE, it shows up as point values or points which can then be interrogated (clicked on). This is
controlled by the Hurrtrak User Preferences – General Options.
Current Wind Pattern – This option export up to 10 polygons representing different wind levels of a storm.
The levels are is determined via the Wind Pattern Levels tab of the Plotting User Options. Advanced Wind
33
HURRTRAK & Global Tracker Users Guide 1992-2012, PC Weather Products, Inc.
Estimation (AWE) is not used in this export regardless of the AWE settings elsewhere. This is because
AWE wind calculations would invalidate the concept of a polygon.
Current Watch and Warning areas – As the same suggests, this option exports the current NHC watches
and warnings.
Official Forecast Path (track and points) – This exports the storm’s forecast track and the forecast points.
The user can select to export the current or any prior forecast tracks.
Official Forecast Average Error – This option will export an area which represents the forecast’s average
error. The user can select to export the current or any prior forecast average error. This may take a few
seconds to run.
Latest Climate Forecast –When selecting this option, the latest climate forecast will be exported and
shown on GE.
Latest Model Forecast –When selecting this option, all of the latest forecast model tracks will be exported
and shown on GE.
Latest Rainfall Forecast – This option will exports 3 sets of KML files which represent the forecast rainfall
for the next 3 days. They are shown as unfilled polygons.
Latest Animation Forecast – This is a powerful option which allows the user to export the forecast wind
radii, and view it using GE’s animation capability.
Latest Animated "arrows" Forecast – This allows the user to export the forecast animated wind arrows
and view it using GE’s animation capability.
Wind Bands – This option allows the user to export the latest forecast wind bands to a 3D KML file for
viewing on GE. The creating of this export may take a few minutes depending on the number of levels
defined for export. This is controlled in the Hurrtrak User Preferences – General Options.
Report (impact summary) – This is another powerful feature whereby you can export location forecast
impact summary data to a point type KML file. When viewed on Google Earth, all of the summary data
information is shown with a simple click on that location’s point icon.
County Report (impact summary) – This is another powerful feature whereby you can export County
forecast impact summary data to a point type KML file. When viewed on Google Earth, all of the summary
data information is shown with a simple click on that location’s point icon.
Zip Code Report (impact summary) – This is another powerful feature whereby you can export Zip Code
forecast impact summary data to a point type KML file. When viewed on Google Earth, all of the summary
data information is shown with a simple click on that location’s point icon.
ALL above selected outputs (Open Google Earth) - Creates a Google Earth (KML/KMZ) file for all
"checked" outputs above ... and then opens Google Earth.
ALL above selected outputs (Save Google Earth File) - Creates a Google Earth (KML/KMZ) file for all
"checked" outputs above ... and then saves the file to a specified location.
ALL above selected outputs (EMail Google Earth File) - Creates a Google Earth (KML/KMZ) file for all
"checked" outputs above ... and then EMails the file to selected recipients.
ALL above selected outputs (Save to EMail Outbox) - Creates a Google Earth (KML/KMZ) file for all
"checked" outputs above ... and then saves the file to the EMail Outbox for later Emailing.
34
HURRTRAK & Global Tracker Users Guide 1992-2012, PC Weather Products, Inc.
The options below are selected and created one at a time... this is because these selection require
additional criteria.
Official Forecast (prior) – This exports the storm’s forecast track and the forecast points. The user can
select to export the current or any prior forecast tracks.
Official Forecast Average Error – This option will export an area which represents the forecast’s average
error. The user can select to prior advisories forecast average error. This may take a few seconds to run.
Official Forecast Wind Radii – When selected, the system will export KML which contains up to 3
polygons representing the forecast 34, 50 and 64 knot wind areas… for a specific hour in the forecast.
Official Forecast Wind Field Grid – This option will export a “grid” of points across the entire forecast wind
field… at a specific forecast hour. When viewed on GE, it shows up as point values or points which then
can be interrogated.
Official Forecast Wind Pattern – This option export up to 10 polygons representing different wind levels of
a storm for a specific forecast hour. The levels are is determined via the Wind Pattern Levels tab of the
Plotting User Options. Advanced Wind Estimation (AWE) is not used in this export regardless of the AWE
settings elsewhere. This is because AWE wind calculations would invalidate the concept of a polygon.
Animation – This is a powerful option which allows the user to export the entire past or forecast wind radii,
animated wind arrows and view it using GE’s animation capability. The latest version of GE is required to
support this capability.
Wind Bands – This option allows the user to export the past or forecast wind bands to a 3D KML file for
viewing on GE. The creating of this export may take a few minutes depending on the number of levels
defined for export. This is controlled in the Hurrtrak User Preferences – General Options.
All Preferred Outputs – This allows the user to create any/all of the outputs with a single selection. The
data that is included with this “batch” export is controlled within the Hurrtrak User Preferences – General
Options. Depending on what is included, this option may take a few minutes to complete.
External (non Hurrtrak) Google Earth Data - This option allows the user to export National Weather
Service and other weather data onto Google Earth. When hurricane information is also exported from the
Hurrtrak system, it allows the user to integrate the 2 sources of data on the same Google Earth interface.
See page 306 and page 334 for more information on this topic.
35
HURRTRAK & Global Tracker Users Guide 1992-2012, PC Weather Products, Inc.
TOOLS
The tools function allows the user to…
override the official forecast with Setup “What if” analysis
conduct post storm analysis
setup Automated Summary reports
setup Email Alerts
setup Additional Automations
define user preferences
setup Application Appearance (skins, toolbar options).
36
HURRTRAK & Global Tracker Users Guide 1992-2012, PC Weather Products, Inc.
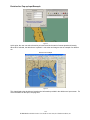
Setup "What if" scenario
"What if" Options:
Activate "what if" - This option, when selected, will change the official forecast path of the current
storm to a motion directly towards the location selected below.
Selected Location - This identifies the selected location that the official forecast will now be adjusted
towards.
Selection Criteria - The user can select the "what if" location by keying in all or part of a county or city
name. The location is selected by double clicking on its row.
Map Select - By selecting this option, the user is presented with a large map covering the entire
tropical storm basin. By left clicking on a map location, and selecting Accept, this location (Latitude
and Longitude) will be the selected target point.
Storm intensity and wind field method - There are 3 intensity options when selecting the Direct To
Point tool.
- To maintain the storm's current intensity through 120 hours regardless of the official forecast
intensity and wind field projections, as well as ignoring landfall effects, etc.
- To utilize the official forecast intensity and wind field projections throughout the 120 hour
forecast period. This method should only be used when the "what if" deviation from official
forecast is relatively small and landfall times, etc. are similar to the official forecast track.
- To override the official forecast motion, intensity and wind field projections. When this option
is selected, the user can then override the forecast parameters.
Intensity and wind field information - This is the area where the user can override the official
forecast information. The user can adjust the storm's forward speed, wind intensity, and areas of
64, 50 and 34 knot winds.
NOTE: All reports and most functions will now use the new forecast path. A new option to plot the
“what if” forecast is added to the PLOT menu function. Some data which is not directly related to
the forecast path is not changed…i.e. Wind and Surge Probabilities, Forecast Rainfall, etc..
37
HURRTRAK & Global Tracker Users Guide 1992-2012, PC Weather Products, Inc.
Setup Post Storm Analysis
This option is very useful in learning the system, doing post storm analysis or during
storm exercises
This option resets what the system "thinks" is the latest advisory. The user must
select the advisory number to use as the latest one. The only functions that are not
affected by this are data maintenance and strike probability calculations.
An easier method to select a past advisory for post storm analysis is to move your
mouse over a past observation point while viewing the database tab map image and
right click, selecting “set Post Storm Analysis to this advisory”.
38
HURRTRAK & Global Tracker Users Guide 1992-2012, PC Weather Products, Inc.
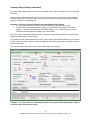
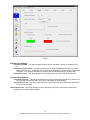
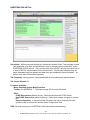
Summary Report Setup (Automated)
The setup of automated summary reports can be selected via the Tools menu option or via the Command
Bar Icons.
A dialog screen is displayed showing all of the current summary reports. The system comes predefined
with one of each type of summary report. Feel free to use the copy command to copy these predefined
reports to create your personalized one.
Important: There are 2 pre-requirements to successfully Email these reports.
1. You need to have setup your Email via the User Preferences Option (EMAIL Setup).
2. You must define the email addresses or groups you would like have the ability to send these
reports to… via the User Preferences (Email Addressbook). This is required even if you have
selected the Outlook method for emailing in the Email setup.
There are 3 types of automatic summary reports… Regular (Location based), Executive (Location Group
based) and Risk Impact (Location Group).
The following section will discuss the setup of each type of report as well as discussing the “error catching”
feature of the setup option. Please note that the definition of Email Alerts and “Other” Automations have a
similar look and feel.
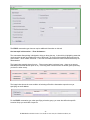
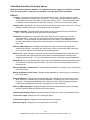
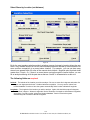
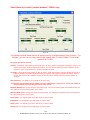
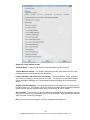
The Automated Summary Report Setup screen looks similar to the following.
Sections 1, 2, 3, Tabs 6 and 7 are essentially the same for all 3 types of Summary Reports. Section
4 and Tab 5 may vary by type of report.
39
HURRTRAK & Global Tracker Users Guide 1992-2012, PC Weather Products, Inc.
Let’s look at the sections that do not vary by type of report.
Section 1 indicates the Name of the report as well as indicators that control whether this report is active
and also whether it should be automatically generated. It is valid to have a report that is active with the
automatic option turned off. This is typically used when you only want to generate the report manually… i.e.
selected from the Hurrtrak menu.
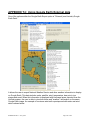
Section 2 defines the storms you would like considered when running the report. The “all active storms”
selection will select only storms that are currently having advisories issued for them. When you manually
run the report, it will only include storms that have data no more than 18 hours old (the “age” setting can be
changed in the user options). With this option you can specify storms to “ignore” via the Select Exceptions
command.
The “Selected Storms” option will run the report for only storms you manually select. You can select
those storms via the Select Storms command.
Finally, Global/Advanced users can select or de-select the storm basins they want to include for storm
selection. i.e. if you are only interested in the Atlantic and Western Pacific then check only those 2 items.
Section 3 defines how you want to handle the report output and in some cases, its format. The valid
options are to Print to the default printer, Preview it on your screen, Email it as a PDF file or Email as
HTML. A couple of notes here… First, when testing your reports, we suggest you use the Preview option.
Also.. we suggest you Email the summary reports in PDF format, as they are much more attractive in that
format. If you select the Email option, you need to select an email address or group.
Section/Tab 6 defines additional text you would like included within the email body. This is optional. See
example below.
40
HURRTRAK & Global Tracker Users Guide 1992-2012, PC Weather Products, Inc.
Section/Tab 7 allows the user to adjust the schedule of when this report can automatically be run. In this
way you can have the report only created on certain days and times. See example below.
Now let’s look at the sections and tabs that DO vary by Automated Summary Report TYPE.
Section 4 is information that is specific to the report type being defined.
For the Regular (location based) report type, it looks like the image below. As you can see, you can
define the location (or location group) you want to create the report for as well as additional details of what
sections you would like included. FYI… you do not have to define a location for this report to run.. It will just
contain general information about the storm not specific to a location.
For the Executive (location group based) report type, section 4 looks like the image below. It is similar to
the Regular report but expects the user to define the location group they would like to create a report for.
Also… just like the regular report, you do not have to define a location group for this report to run. It will
only contain general information.
41
HURRTRAK & Global Tracker Users Guide 1992-2012, PC Weather Products, Inc.
Finally, for the Risk Impact report type, section 4 just contains the location group and 3 additional options.
Note.. A Location Group is required.
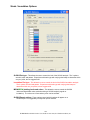
Now on to the last section which varies by Report Type... Section/Tab 5.
For the Regular and Executive report types, this tab allows the user to define the elements they want
included on the tracking map. This includes which tracking map to use (we suggest BEST CHART), the
locations (location group) to plot on the map, as well as several other obvious options below. The Risk
Impact report does not include a tracking map. Please note... if you select to plot the wind band, the
generation of the report will take longer. In addition the wind band legend will appear in the lower left portion
of the tracking map.
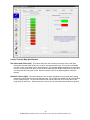
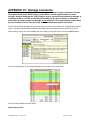
One last topic in this section…. Error Assistance…
The Summary Report Setup dialog is designed to help you along the way. It does this by highlighting areas
that need correcting as well as changing the color of the border. So far all of the examples above show a
nice green border… which means “all is well”. Let’s look at conditions which will cause errors and how they
are demonstrated.
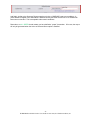
The image below actually shows 3 errors… First no storm basin is selected, next… there are no storms
selected (the Selected Storms option is on) and finally no Email address is defined when the output type
specifies EMAIL. Correcting each of these will turn the border green.
42
HURRTRAK & Global Tracker Users Guide 1992-2012, PC Weather Products, Inc.
For the Risk Impact report you can also have an error condition when no Location Group is selected.
Finally, there is also a “WARNING” type error conditions. A yellow border will appear if the report is
defined correctly but either the ACTIVE or AUTOMATION boxes are not checked. This is acceptable under
certain conditions of when you only want to run the report manually.
Remember, an ALL GREEN border means you have defined a “proper” Summary Report. Of course, this
report will only be generated when the Active or Selected Storm option is satisfied.
Examples of Standard, Executive and Risk Impact Summary Reports are shown on page
284.
43
HURRTRAK & Global Tracker Users Guide 1992-2012, PC Weather Products, Inc.
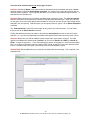
Email Alert Setup (Automated)
The setup of automated Email Alerts can be selected via the Tools menu option or via the Command Bar
Icons.
A dialog screen is displayed showing all of the current Email Alerts. The system comes predefined with one
of each type.
Important: There are 2 pre-requirements to successfully Email these Alerts.
1. You need to have setup your Email via the User Preferences Option (EMAIL Setup).
2. You must define the email addresses or groups you would like to send these reports to… via the
User Preferences (Email Addressbook). This is required even if you have selected the Outlook
method for emailing in the Email setup.
There are 6 types of automatic Email Alerts… All updates, New Storm, Category Change, Location,
Location Group, Geographical Area.
The following section will discuss the setup of each type of alert as well as discussing the “error catching”
feature of the setup option. Please note that the definition of Automatic Summary Reports and “Other”
Automations have a similar look and feel.
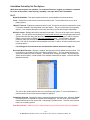
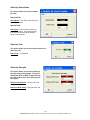
The Automated Email Alert Setup screen looks similar to the following.
Section 1, 2, 3, 4, Tabs 6 and 7 are essentially the same for all 6 types of Email Alerts. Section 5 is
the only section that varies by type of Alert.
44
HURRTRAK & Global Tracker Users Guide 1992-2012, PC Weather Products, Inc.
Let’s look at the sections that, for the most part, do not vary by type of Alert.
Section 1 indicates the Name of the Alert as well as indicators that control whether this alert is active and
also whether it should be automatically generated. It is valid to have an alert that is active with the
automatic option turned off. This is typically used when you only want to generate the Alert manually… i.e.
selected from the Hurrtrak menu. Please note, you cannot manually generate the New Storm or Change
Category Alert. It can only be generated from the automated processes (i.e. when new storm data is
received).
Section 2 defines the email address(s) or email groups that you would like to send this type of Alert to.
Remember you need to define these emails or group to the Hurrtrak system via the User Preferences /
Email addressbook option. Obviously at least one email address must be selected for this alert to be
defined correctly.
Section 3 defines the storms you would like considered when running the alert. The “all active storms”
selection will select only storms that are currently having advisories issued for them. When you manually
run the alert, it will only include storms that have data no more than 18 hours old (the “age” setting can be
changed in the user options). With this option you can specify storms to “ignore” via the Select Exceptions
command.
The “Selected Storms” option will run the alert for only storms you manually select. You can select those
storms via the Select Storms command.
Finally, Global/Advanced users can select or de-select the storm basins they want to include for storm
selection. i.e. if you are only interested in the Atlantic and Western Pacific then check only those 2 items.
Note: The New Storm Alert does not consider the Storm Selection criteria. i.e. There is no point of having
to define the new storms before they occur. It does consider the basins selected as it will only report on
new storms in the basins you have selected.
Section 4 defines which additional information and attachments you would like to include with this alert.
Note, the Location Impact Statement is only available for Location Group Alerts.
Section/Tab 6 defines additional text you would like included within the email body of the Alert. This is
optional. See example below.
45
HURRTRAK & Global Tracker Users Guide 1992-2012, PC Weather Products, Inc.
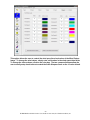
Section/Tab 7 allows the user to adjust the schedule of when this alert can automatically be run. In this
way you can create Email alerts only on certain days and times. See example below.
Now let’s look at the one section DOES vary by Automated Email Alert TYPE.
Section 5 is information that is specific to the Alert type being defined.
For the ALL Update, Category Change and New Storm Alerts, this section is disabled… i.e. no additional
information is needed.
For the Location Alert, this section appears like the image below.
You can define several locations for each Location Alert. The dialog box for doing so is shown below…
46
HURRTRAK & Global Tracker Users Guide 1992-2012, PC Weather Products, Inc.
To add locations, select the Add New Location and answer the questions on the setup “wizard”. If you
select multiple locations for the Location Alert, an separate email will be sent for each one to each Email
address you defined (assuming the trigger has been met for the location). i.e. if you have 5 locations
defined but only 1 is expected to be impacted (triggered), then only 1 Email will be sent. There is one
special case related to this we will discuss at the end of this section. Note: There is absolutely no problem
with defining only one location per Location Alert.. It may, in fact, simplify things a bit.
As mentioned earlier, the criteria available for location alerts are Wind speed, Timing of wind, Rainfall, Wind
probability and “closest point of approach” (of the center of the storm).
For the Location Group Alert, this section appears like the image below. It only needs the Location Group
you are defining this alert for and the minimum wind speed (at any of the locations) that will trigger this alert.
i.e. if you are only interested when any of “your” locations will be impacted by 50 knot winds, then change
the default wind speed to 50 knots. This is for sustained winds only, not gusts.
Finally, for the Geographical Alert type, section 5 allows the user to define the geographical area they are
interested in receiving alerts for.
You can define several areas for each Geographical Alert. The dialog box for doing so is shown below…
To add additional areas, select the Add New Geo/Area and answer the questions on the setup “wizard”. If
you select multiple areas for the Geographical Alert, an separate email will be sent for each one to each
Email address you defined (assuming the trigger has been met for the area). i.e. if you have 5 areas
47
HURRTRAK & Global Tracker Users Guide 1992-2012, PC Weather Products, Inc.
defined but only 1 is expected to have an active storm in it, then only 1 Email will be sent. Note: There is
absolutely no problem with defining only one area per Geographical Alert.. It may, in fact, simplify things a
bit.
SPECIAL LOCATION ALERT TYPE:
For “more expert” users, we have come up with the ability to send Email alerts based on the timing of a
trigger wind speed… in an escalating manner.
Let look at an example and then explain how it will behave.
The image below shows a location alert, with 5 entries for Miami. Each one has the same wind speed
criteria (34 knots) but the timing for these winds vary for each entry.
As a storm is forecasted to impact Miami, initially the longest period alert will be sent (120 hours). As the
storm approaches, the lower period alerts will be sent instead… i.e. in this example, 96, 72, 48 and 24
hours.
One last thing has to be set for this to work properly. One the main Email Alert setup screen, you must
select the option “Only send the Alert with the lowest ‘wind period”.
This is a special situation that most users will not necessarily require.
One last topic in this section…. Error Assistance…
The Email Alert Setup dialog is designed to help you along the way. It does this by highlighting areas that
need correcting as well as changing the color of the border. So far all of the examples above show a nice
green border… which means “all is well”. Let’s look at conditions which will cause errors and how they are
demonstrated.
The image below actually shows 2 errors… First no storm basin is selected, next… there are no storms
selected (the Selected Storms option is on). Correcting each of these will turn the border green (assuming
you have no other errors).
48
HURRTRAK & Global Tracker Users Guide 1992-2012, PC Weather Products, Inc.
The image below shows the important error of not having selected at least 1 email address to send to.
For the Location alert you can also have an error condition if no locations have been defined.
For the Location Group alert, you must define the Location Group
For the Geographical Area Alert, you need to define at least 1 area.
And finally, similar to the Summary Report setup there is also a “WARNING” type error conditions. A
yellow border will appear if the report is defined correctly but either the ACTIVE or AUTOMATION boxes
are not checked. This is acceptable under certain conditions.
Remember, an ALL GREEN border means you have defined a “proper” Email Alert. Of course, this Alert
will only be created when the storm and trigger settings are satisfied.
Examples of each type of Email Alert is shown on page 280.
49
HURRTRAK & Global Tracker Users Guide 1992-2012, PC Weather Products, Inc.
“Other” Automations Setup
The setup of automated “Other” Automations can be selected via the Tools menu option or via the
Command Bar Icons.
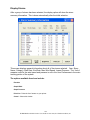
A dialog screen is displayed showing all of the current Automations. The system comes predefined with
one of each type.
Important: There are 2 pre-requirements to successfully Email these outputs.
1. You need to have setup your Email via the User Preferences Option (EMAIL Setup).
2. You must define the email addresses or groups you would like to send these reports to… via the
User Preferences (Email Addressbook). This is required even if you have selected the Outlook
method for emailing in the Email setup.
The Automations capability basically includes other automatic output that did not fit into the category of
Summary Report or EMAIL Alerts. The outputs defined in this function are automatically generated when
new storm data is received and can be saved to a hard drive location and/or sent via Email. There are
4 types of “other” Automations.
The following section will discuss the setup of each type of output as well as discussing the “error catching”
feature of the setup option. Please note that the definition of Automatic Summary Reports and Email Alerts
have a similar look and feel.
The Automations Setup screen looks similar to the following.
Section 1, 2, 4, Tabs 6 and 7 are essentially the same for all 4 types of Automations. Section 3 and
Tab 5 are the only sections that vary by type of Automation.
50
HURRTRAK & Global Tracker Users Guide 1992-2012, PC Weather Products, Inc.
Let’s look at the sections that, for the most part, do not vary by type of Automation.
Section 1 indicates the Name of the Automation as well as indicators that control whether it is active and
also whether it should be automatically generated. It is valid to have an automation that is active with the
automatic option turned off. This is typically used when you only want to generate the automation
manually… i.e. selected from the Hurrtrak menu.
Section 2 defines the storms you would like considered when running the automations. The “all active
storms” selection will select only storms that are currently having advisories issued for them. When you
manually run the automations, it will only include storms that have data no more than 18 hours old (the
“age” setting can be changed in the user options). With this option you can specify storms to “ignore” via
the Select Exceptions command.
The “Selected Storms” option will run the automations for only storms you manually select. You can
select those storms via the Select Storms command.
Finally, Global/Advanced users can select or de-select the storm basins they want to include for storm
selection. i.e. if you are only interested in the Atlantic and Western Pacific then check only those 2 items.
Section 4 defines how to handle the automatic output. You can select to have the output saved to a hard
drive location and/or email it.
Section/Tab 6 defines additional text you would like included within the email… when the output is being
emailed. This is optional. See example below.
Section/Tab 7 allows the user to adjust the schedule of when this automation can run. In this way you can
create this outputs only on certain days and times. See example below.
51
HURRTRAK & Global Tracker Users Guide 1992-2012, PC Weather Products, Inc.
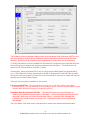
Now let’s look at the two sections that DO vary by Automation TYPE.
Section 3 is information that is specific to the Automation type being defined.
For the Tracking Map Automation, this section appears like the image below. The user can select the type
of image format they prefer.
For the Google Earth KML Automation, this section appears like the image below. Here the user can
specify KML or KMZ format for the Google Earth file. We recommend KMZ for its smaller size.
For the EXCEL Automation, this section appears like the image below. The user can specify a location
group, all affected Counties or all affect Zip Codes.
The Shape File Automation does not require additional information in section 3.
Now on to the last section which varies by Automation Type... Section/Tab 5.
52
HURRTRAK & Global Tracker Users Guide 1992-2012, PC Weather Products, Inc.
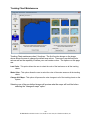
For the Tracking Map Automation, this tab allows the user to define the elements they want included on
the tracking map. This includes which tracking map to use (we suggest BEST CHART), the locations
(location group) to plot on the map, as well as several other options below.
For the Google Earth Automation, this tab allows the user to define the specific Google Earth outputs they
would like to include within the KML/KMZ file.
For the Shape File Automation, this tab allows the user to define the specific Shape File outputs they
would like to include.
53
HURRTRAK & Global Tracker Users Guide 1992-2012, PC Weather Products, Inc.
The EXCEL automation type does not require additional information on this tab.
One last topic in this section…. Error Assistance…
The Automations Setup dialog is designed to help you along the way. It does this by highlighting areas that
need correcting as well as changing the color of the border. So far all of the examples above show a nice
green border… which means “all is well”. Let’s look at conditions which will cause errors and how they are
demonstrated.
The image below actually shows 2 errors… First no storm basin is selected, next… there are no storms
selected (the Selected Storms option is on). Correcting each of these will turn the border green (assuming
you have no other errors).
The image below shows the error condition of selecting to Email the Automation output but not yet
specifying an email address.
For the EXCEL automation type, when specifying a location group, you must also define the specific
Location Group you would like a report for.
54
HURRTRAK & Global Tracker Users Guide 1992-2012, PC Weather Products, Inc.
And finally, similar to the Summary Report setup there is also a “WARNING” type error conditions. A
yellow border will appear if the Automation is defined correctly but either the ACTIVE or AUTOMATION
boxes are not checked. This is acceptable under certain conditions.
Remember, an ALL GREEN border means you have defined a “proper” Automation. Of course, the output
will only be generated when the Active or Selected Storm option is satisfied.
55
HURRTRAK & Global Tracker Users Guide 1992-2012, PC Weather Products, Inc.
Tools - Options (User Preferences)
When user preferences are selected, the user is presented with windows containing ALL of the
preferences shown. The user simply selects the category of preference and those fields are
displayed below.
The categories of user preferences are explained below. They are presented in
alphabetical order.
56
HURRTRAK & Global Tracker Users Guide 1992-2012, PC Weather Products, Inc.
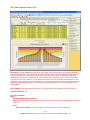
Animation options
These set of options control how animation sequences will appear to the user.
Display Options:
Wind Radii Animation Options:
Plot Wind Field Circles – Determines if the wind circles will plot during animation.
Plot Wind Values - Determines if wind values will be shown next to the wind arrow during animation.
Plot Wind Field Arrows – Determines if the wind arrows will plot during animation.
Multi-colored Wind vectors - Changes the wind arrow display to one which has multi-colored arrows.
The size and color of the wind vector is associated with the location’s wind speed. It is best to
increase the arrow density when choosing this option. The arrow colors are set within the plotting
options. See APPENDIX PP: Multi-Colored wind vector display on page 313 for more information.
Use Advanced Wind Estimates… – This option determines if Advanced Wind Estimation is utilized
during animation. It affects only the wind arrows and values, not the wind radii forecast. In
addition, this slows down the initial loop’s animation speed.
Bell Noise - Determines if the PC “bell” noise will sound at the end of an animation cycle and when
the actual motion changes to forecast motion.
Eye wall shading pattern - Determines if and how the storm’s eye wall is depicted during animation.
57
HURRTRAK & Global Tracker Users Guide 1992-2012, PC Weather Products, Inc.
Shared Animation Options (wind radii and wind pattern):
Wind arrow size - Sets the size of the wind arrows during animation.
Wind Arrow density - Sets the density of the wind arrow pattern during animation.
Plot Locations - Determines if a location group will be shown during animation. If so, the user must
select the desired location group. If location distances are to be shown, check that option.
Animation speed - This option controls the speed of animation. Select the speed that best suits your
processor. Note: The first animation loop may be slow due to the building of the animation file.
Wind Pattern Animation Options:
Plot wind values with wind pattern animation – Will plot the wind speed values while creating the
Wind pattern animation.
Plot wind arrows with wind pattern animation – Will plot the wind vectors while creating the Wind
pattern animation.
Advanced Wind Estimation – This option determines if Advanced Wind Estimation is utilized during
the creation of wind patterns and wind pattern animation.
58
HURRTRAK & Global Tracker Users Guide 1992-2012, PC Weather Products, Inc.
Automation/Alert options
These options control some of the automation features of the system including defining when
“new data” has arrived… for use in the Automatic features of the system (Email Alerts,
Automatic Summary Reports and “other” Automations)>
Auto Track Plot - This option will force the system to plot the latest storm track and forecast track on
all of the visible "favorite" tracking chart tabs whenever a new storm is loaded or updated.
Auto Report Creation - This "turns on" the indicator that allows the system to automatically create
any “previously” opened reports when a storm is loaded.
Auto Report Updating - This "turns on" the indicator that allows the system to automatically update
any open reports when new data arrives via HURRTRAK - Online.
59
HURRTRAK & Global Tracker Users Guide 1992-2012, PC Weather Products, Inc.
Alert and Summary Report Advisory Criteria - This data allows the user to define what criteria the
system should use to initiate Automated Alert and Summary Reports. We recommend the minimal
selection be the Public Advisory, the Forecast Advisory, and the Intermediate Public Advisory.
These advisories contain the critical current and forecast information. Be aware that selecting all
of the advisories may result in a delay of any automated processing as the system waits for all of
the advisories to become available. Selection of "ANY" on the other hand would cause the
initiation of automatic process every time any type of new advisory becomes available. This is not
recommended as multiple Alerts and Summary reports would be generated for each advisory
package. A special note about Wind Probability data… While the Wind Probability Advisory data
comes in as part of the NHC advisory package with the other text advisories, the Wind Probability
data can be issued at a later time. The timing of this data may lag the advisory text data. Due to
this, we suggest you do not select the Wind Probability Data option until this becomes better
established.
Active Storm Criteria - Storm Active Age is used by the Automatic Summary Report, E-MAIL Alert,
and Automations processes to determine when a storm should be considered active. The default
value is 18 hours... i.e. a storm is active when an advisory has been issued within the last 18
hours. This value is really only meaningful when running the "automatic" processes manually since
a storm is obviously active if the system creates these reports when new data is received on a
storm.
60
HURRTRAK & Global Tracker Users Guide 1992-2012, PC Weather Products, Inc.
Email address book
This option allows the user to define email addresses to the system. This is not required if you
are exclusively using the Outlook to send email AND not using the automated features of
the system (Email Alerts, Automatic Summary reports, “Other” Automations). i.e. you must
define the email addresses for anyone you wish to receive these automated outputs.
Email address/ group name - The Email address of a potential recipient OR the name of a Email
Group. The type of Addressbook entry is defined by the type field (Individual or Group). A typical
individual email address has a name and a domain, i.e. [email protected]. A group
name is a short identifier for the group, i.e. WX Group.
Name/Description - The name of the individual (if Type is an individual) or the description of the
group (if Type is a group). This information is informational only and is not used by the system.
Type - Identifies the type of addressbook entry. Ind. is an individual Email recipient, while Group is a
list of Email recipients.
Commands
Add new Email address
- This option adds a new Hurrtrak Email address.
61
HURRTRAK & Global Tracker Users Guide 1992-2012, PC Weather Products, Inc.
Add new Outlook address - This option adds a new MS Outlook address to the Hurrtrak Email
database. This is only necessary if you plan on setting up alerts or
summary reports for this Email address.
Add Recipients to Group - This option allows the user to easily associate and disassociate individual
Hurrtrak Email recipients to Hurrtrak Email groups. This does not apply to
MS Outlook Email addresses.
Delete Current row
- This option deletes the selected rows (Email addresses).
62
HURRTRAK & Global Tracker Users Guide 1992-2012, PC Weather Products, Inc.
Email General Setup
This option allows the user to define how they want to send email within the system.
Email send preference - Specifies whether to allow MS Outlook to send email from HURRTRAK and
if so, the default/preferred method to send email. MS Outlook users may find it much easier to
select the Outlook option, as it removes the requirement of setting up your SMTP server
information, etc. When you send email, you may change the send method. This is just the default
method the system will assume.
Default Signature/Identifier - Contains the default signature you would like to appear at the end of
your email notices. This can be blank, if desired.
E-mail Image Format - Identifies the type of image you would like to send when attaching graphics to
an email note. This applies to both manual and automatic generation of email. We recommend
BMP format. For smaller file sizes, select the RLE Bitmap option in the general options. PDF is
also a “non image” option for users that would rather send their images using Adobe Acrobat..
Animated GIF frame interval / file size limit - These options control the size of the animated gif file
created when sending an animation sequence. You can control the animation interval by sliding
the control left or right. A longer animation frame interval will result in a smaller number of frames
and a smaller file size. You can also specify the "warning" file size... Any files above this limit will
generate a warning message before sending to confirm that the user really does want to send a
file above this size. Generally, you should avoid sending animations where the background is a
satellite, radar or landsat image.
63
HURRTRAK & Global Tracker Users Guide 1992-2012, PC Weather Products, Inc.
Your Email Address - Enter a valid return address that you would like to use when sending email.
Outgoing SMTP Server - This is the name of the server where you send your messages to. The
name of this server is SMTP (Simple Mail Transfer Protocol).
Mail Server userid - This contains the userid needed to send email via the SMTP server. This is not
required in most cases.
Mail Server Password - This is the password needed to send email via the SMTP server. In most
cases this is not needed.
Domain to add to unqualified addresses - Specifies a domain to be added to unqualified names.
An unqualified name is one that doesn't have an "@" sign followed by a domain name. If you
address a message to someone without including their domain name, HURRTRAK automatically
adds this domain to that address. This setting can be used as a time-saving device when
addressing large numbers of messages to users who reside in the same domain.
Outgoing Mail Port - Specifies the mail port that your email system uses to send mail. Typically, a
value of 25.
SSL Mail Server - Specifies if your outgoing mail server requires SSL encryption.
Multiple recipient options - This field indicates how you would like to send automatic email to
multiple recipients within an Email Group.
Selecting the TO option will send each recipient a separate email to the mail server. This is
usually not recommended for a large number of recipients.
Selecting the CC option will send 1 email to the mail server and "copy" the remaining recipients in
the group.
64
HURRTRAK & Global Tracker Users Guide 1992-2012, PC Weather Products, Inc.
Selecting the BCC will send 1 email to the mail server and send "blind copies" to the remaining
recipients.
Additional SMTP Send Parameters – (This does NOT apply to email sent via MS Outlook)
These parameters allow the user to limit the number of recipients in a single email regardless of
the total number of email addresses defined. For example, if an email is being sent to 95
recipients and the send limit is defined at 50, two separate emails will be sent… one with 50 and
the other with 45. The two parameters available are
SMTP multiple recipient limit – max number of recipients in a send.
SMTP pause time – time to wait, in seconds, between batches.
Save Sent Option - Specifies whether e-mail send via Outlook should be saved in Outlook's SENT
folder. This is useful if you would like to keep a record of all email sent from the HURRTRAK
system.
Outlook Folders - Specifies the folders that the user would like to be included in the address book
search when sending email. DO NOT specify very large folders (>5000 addressbook entries) as it
will greatly impact the performance of this function. If you have large Contact folders, you might
want to copy your "key" contacts to a separate smaller folder (for use with HURRTRAK).
65
HURRTRAK & Global Tracker Users Guide 1992-2012, PC Weather Products, Inc.
Flood Index / Surge Probability Options
This option allows the user to control how the Flood Index and Surge probabilities are
displayed on the system.
Plot max flood index / Psurge values - This option determines if the maximum flood index value will
be labeled when a flood index analysis is done and whether the maximum surge probability value
will be labeled when a surge probability analysis is done. Its font is controlled within the font
options.
Plot Surge Probability values - This option determines if the surge probability values will be labeled,
at regular intervals, when a surge probability analysis is done. Its font is controlled within the font
options.
Width of Flood/PSurge Plot (NM) - This controls the width (in nautical miles) of the flood index or
Psurge analysis. Widths of greater than 10 miles are not allowed, due to the degradation in the
quality of the plot.
Flood Index Values, Surge Probability values and Colors - This allows the user to change the flood
index and Surge Probability values and associated colors. Any positive, ascending set of values
can be used and any color (within the limits of the color mode your system is set at).
66
HURRTRAK & Global Tracker Users Guide 1992-2012, PC Weather Products, Inc.
Fonts Options
This option allows the user to set the text properties for the display of locations, county
names, chart notes, user notes, lat./ long values, wind arrow values, flood index, SLOSH
MOM and strike probability values. These properties include the font name, size, color and
whether it should be printed in bold and/or italic.
67
HURRTRAK & Global Tracker Users Guide 1992-2012, PC Weather Products, Inc.
General Options
This is a general set of options ranging from Google Earth settings, GIS, Graphics, Tab
appearance, AWE setup and a myriad of other options.
BASE Location - A user can identify a primary "Base" location, which typically represents the users
operating location. It can be a "location", County or Zip Code. This location is used to
automatically update the risk/impact tab. Additional “base” locations can be defined by adding
locations to the location group “Base Locations”… via the System Setup option.
Time - Identifies the time zone the user would like to use. UTC represents the global standard that is
used by the NHC in their advisories and is time zone independent.
Map Resolution - Other than the pan and zoom mapping, the system includes 3 sizes of standard
tracking charts... 640 x 480 pixels, 1024 x 768 and 1400 x 1048 pixels. You have 3 options. If you
would like to work with the smaller, less detailed charts, then select the 640 x 480 option. If you
would like to use the larger, more detailed charts, then select the 1024 X 768 option or 1400 x
1048. Finally, if you change screen resolutions often and would like to use the largest available at
all times, then select the 3rd option. Keep in mind that the HURRTRAK system will not display
charts that are larger than the screen resolution you are working in. I.E. If you select 1400X1048
and only have your Windows screen setting at 1024 X 768, then the HURRTRAK system will use
the 1024 X 768 charts.
Landfall Analysis - Selecting this option forces the system to recognize when the storm is forecast to
make landfall and make adjustments to the official forecast. Landfall is defined as the first hourly
position over land that is followed by at least four more overland positions. CAUTION: Please be
aware that when you use this feature, you are changing the official forecast data. The assumption
68
HURRTRAK & Global Tracker Users Guide 1992-2012, PC Weather Products, Inc.
that a storm will maintain its intensity until landfall is not always valid. For more information, see
Common Questions.
Estimate 48, 72, 96 and 120 hour forecast winds - Selecting this option forces the system to
estimate the 34 and 64 knot wind field for the 48, 72, 96 and 120 hour forecast position. A
hierarchy of algorithms is used to do the estimate. CAUTION: Please be aware that when you
use this feature, you are adding information to the official forecast data. Estimates are just
a guess based on past patterns of wind fields and should not be relied on.
Enable all system sounds - This option turns on/off the system sounds.
Enable Logging - This option "turns on" system logging. It reports on the status of incomplete
automation options, as well as start and ending times of sessions
Do not calculate strike probabilities - This option "turns off" the system calculation of strike
probabilities. This may be required on 64 bit operating systems.
Estimate 25 knot wind radii - This option allow the system to estimate the wind speeds around the
storm down to 25 knots, rather than the 34 knot wind radii that the National Hurricane Center
provides. This will be reflected in the wind pattern, wind field analysis and impact reports.
Spell Checker Dictionary - This option "turns on" and selects the language you would like to use for
spell checking. The options are None, English and Spanish.
Display Map Navigation on Map - This option controls whether the user wants visible map navigation
aids for panning a tracking chart map. This can be set based on user preference, but is not
enabled by default.
Maintain Map Selection Locations on plotting maps - This option allows the location names that
are visible on the Map Selection Tab to also appear on all tracking chart maps generated from this
tab. This is not enabled by default.
Map Delay - This option controls the delay, in seconds, that the system will use when plotting a new
panned or zoomed map. Depending on your system's video capabilities, you may have to adjust
this slightly upward to allow the system time to plot the land masses correctly.
Start Desktop Satellite on Windows Startup - This option "turns on" the Desktop Satellite program
which will update the desktop background image with a current satellite image. We recommend
that you set the windows display properties to CENTER the image.
3D Options:
3D Image Interactive Image Scrolling - This determines if the 3D surface graph will “redraw” every
time the horizontal or vertical controls are changed. Unless you are running a very fast processor
or have the resolution set very low, this option should remain unchecked. Selecting the OK
command will cause the graph to redraw instead.
Resolution of 3D surface graph - This sets the resolution of the 3D surface graph. High values will
cause very slow responses and more detail, while low values will allow for faster response and
less detail.
69
HURRTRAK & Global Tracker Users Guide 1992-2012, PC Weather Products, Inc.
TAB Location - This option allows the user to define the location where the tab labels will appear.
Number of Variable Tracking Maps - This slide control allows the user to specify the maximum
number of variable maps allowed. The valid range is 1 to 3.
Active Tabs - This area allows the user to specify which of the optional tabs they would like to
activate/deactivate. By deactivating a tab, it will not be able to be viewed until activated again by
the user. This is useful when a user never wants to see certain information shown on a particular
tab. Otherwise we recommend that you keep most of these tabs active.
.
70
HURRTRAK & Global Tracker Users Guide 1992-2012, PC Weather Products, Inc.
JPEG Compression - When images are saved in JPG format, the user can control the
compression/quality factors used. The higher the compression, the lower the image quality and
vice-versa. The JPEG format is best suited for compressing the size of high-color images.
HURRTRAK images do not contain many colors, so the JPEG format is not recommended.
Instead, use the RLE BMP format or GIF.
BMP Format - When images are saved in BMP format, the user can control whether to save as RGB
or with RLE compression. Most applications accept RLE type bitmap files, so this is
recommended due to the much smaller file sizes.
71
HURRTRAK & Global Tracker Users Guide 1992-2012, PC Weather Products, Inc.
GIS Wind Band Export Directory - This option allows the user to identify the directory location to
build the GIS wind band export files. If this is left blank, it will default to the application’s Temp
directory.
Wind Field grid size - This value determines the density of the exported Wind Field Shape file. The
default value of .1 will generate a point value at every .1 degree of latitude and longitude. This
would result in 100 points per 1 degree square. Hurrtrak Advanced only.
Wind Band Smoothing Factor - This factor determines how much smoothing to apply to the exported
wind band data and applies to both the text data export and Shape File export (Advanced). If you
choose a smoothing factor that causes wind band lines to intersect, then this value should be
reduced.
Export Wind Levels - This option allows the user to identify the 10 wind band levels used when
creating the GIS wind band export files. It must be entered in knots (MPH are shown for
convenience)
72
HURRTRAK & Global Tracker Users Guide 1992-2012, PC Weather Products, Inc.
Eye Diameter Options: These options allow the system to take into account storms with very
small or very large eye diameters as they progress through the forecast period.
Eye Diameter Transition Period - This option works with the default eye diameter value. It defines
the number of hours, into the forecast period, that it will take for a storm’s non-default eye size to
transition to the default size. The system uses this information to perform forecast wind
estimations.
Default Eye Diameter - This option defines the default, or normal, eye diameter size. It works with the
prior “transition period” option.
Advanced Wind Estimation Options: These options define how and where the system will use
Advanced Wind Estimation.
Advanced Wind Estimation (Locations) - This option activates the Advanced Wind Estimation for all
Location and Map Select Location reports.
Advanced Wind Estimation (Counties) - This option activates the Advanced Wind Estimation for all
counties. This should be used with great caution as countywide wind estimation may not be valid
for many coastal counties.
Advanced Wind Estimation (Zips Codes) - This option activates the Advanced Wind Estimation for
all counties. This should be used with great care as zip code wide wind estimation may not be
valid for many coastal zip codes.
73
HURRTRAK & Global Tracker Users Guide 1992-2012, PC Weather Products, Inc.
Advanced Wind Estimation Mousepointer/Wind Arrows - This option activates Advanced Wind
Estimation for the mousepointer/wind arrow and Wind Pattern displays.
Advanced Wind Estimation for animation - This option activates Advanced Wind Estimation for the
Animation wind arrow displays.
Advanced Wind Estimation for Wind Pattern / Wind Pattern Animation - This option activates
Advanced Wind Estimation for the Wind Pattern displays and Wind Pattern Animation
74
HURRTRAK & Global Tracker Users Guide 1992-2012, PC Weather Products, Inc.
.
Default transparency for polygons – This determines how transparent polygons will appear when
exported to Google Earth (KML). Polygon data includes such data as wind radii and wind bands.
Observation/Forecast Wind Radii – This determines if exported wind radii appear as an outer ring
only (unfilled) or as a filled area (filled polygon).
Wind Field Points – One of the export options is to export a grid of observed or forecast wind points
across a storm. The user has the option of display wind barbs which represent the wind speed
and direction and/or the values at each grid point. You can also select to only have the wind speed
value appear when you roll your mouse over the point. It may be best to experiment with this
setting to determine what you prefer. Since performance may be somewhat impacted with plotting
all of the values, the default is mouse activated values.
Animation Wind Radii - This determines if exported wind radii during animation will appear as an
outer ring only (unfilled) or as a filled area (filled polygon).
Animated Wind Barbs - This determines if wind values will be plotted by Google Earth and the size of
the font used to plot the wind values.
Display observation ‘chart notes’ - This allows the user to control the amount, if any, of the chart
notes to appear next to a storms observation points. ALL will obviously show all of them, SOME
will show every other one, and NONE is self explanatory. This does not apply to forecast points.
Chart Notes font size - This controls the default font size of the chart notes.
75
HURRTRAK & Global Tracker Users Guide 1992-2012, PC Weather Products, Inc.
Other labels font size – This controls the font size of other labels displayed by Google Earth. They
can sometimes be adjusted within the Goggle Earth interface.
Include web cam / local images - This option determines if either web cam or user-supplied images
are included when exporting summary impact report information to Google Earth. See page 330
for more information.
Data to include in multiple export option – This set of options has to do with the Google Earth “ALL
Selected Outputs function”. This feature allows multiple GE exports be created with a single
action. The exports available through this function are described below. All checked options will
be exported, while unchecked ones will not be. We do not suggest you select all outputs unless
truly necessary. The automatic export options include the following:
Forecast Wind Band – This will export the forecast wind band. Not suggested as part of multiple
output as it may take several minutes to complete.
Current Storm Track & Observations
Current Wind Radii
Current Wind Field
Official Forecast Track (latest)
Official Forecast Average Error (latest)
Climate Forecast
Current model forecast
Watches & Warnings
Forecast Storm Animation
Current rainfall forecast (3 days)
Current Wind Pattern
Forecast Animated Wind Barbs
Reports – This will create an impact report for a set of locations, all counties, all zip codes based on
the selections chosen.
76
HURRTRAK & Global Tracker Users Guide 1992-2012, PC Weather Products, Inc.
This set of options controls what will be plotted when selecting the EZ Map option.
Please note that selecting official forecast cone, counties or roads may cause the
map plotting to take a few seconds longer. Note: Non-Atlantic storms can only be
plotted with the Global versions of the system.
77
HURRTRAK & Global Tracker Users Guide 1992-2012, PC Weather Products, Inc.
Hurrtrak Online Options
This option allows the user to define their Hurrtrak Online information to the system. It includes
userid, password, update schedule and specific connection parameters such as proxy server
definition.
USERID/Password – This is where you enter your HURRTRAK ONLINE userid and password
assigned by PC Weather Products.
Active Storm Database Name - This option allows the user to select the database in which all current
and manually downloaded data will be loaded. It is recommended that this match the current year.
PCWP Server Name - Enter the primary and secondary Internet server address supplied to you by PC
Weather Products. This information will rarely change
Directory - Enter the primary and secondary Internet server directory supplied to you by PC Weather
Products. This information will rarely change.
Timeout - This represents the maximum amount of time the system will wait for an online task to
complete. Currently, this parameter is ignored as all timeouts are set to 60 seconds. This may be
changed in future versions.
Western Pacific & Indian Ocean Storm Name option – Selecting this option will force the system to
use the long names assigned by the JTWC rather than the number/letter identifiers. i.e. Monica
rather than 23P. This only applies to the Global Versions of the Hurrtrak Software.
78
HURRTRAK & Global Tracker Users Guide 1992-2012, PC Weather Products, Inc.
Note regarding Primary and Secondary servers: If the system fails to successfully retrieve
data from the primary server, it will AUTOMATICALLY switch to the alternate server. The
user does not need to request this switchover.
Additional Servers - This option, which only applies for Network versions of the system, allows the
user to set up to 10 additional servers where HURRTRAK is installed. In this way, one Hurrtrak
Online update session can update the databases on several servers.
79
HURRTRAK & Global Tracker Users Guide 1992-2012, PC Weather Products, Inc.
Proxy Selection – Select the type of connection required for your system to access the internet
(HTTP retrieves). Start with the NO Proxy setting and then try the 2 Auto Detect options, testing
the connection with each option. If the test connection fails, then manually define your Proxy
server information.
The manual options include…
Proxy Server Type - This option specifies whether your HTTP proxy server is an NTLM type or a
basic type. Check with your network administrator for this information.
Proxy Server Name - This field contains the domain name of your HTTP proxy server. If this is
entered, you do not need to enter information into the proxy server IP address field. Check with
your network administrator for this information
Proxy Server IP Address - This field contains the IP address of your HTTP proxy server. If this is
entered, then you do not need to enter information into the Proxy Server Name field. Check with
your network administrator for this information.
Proxy Port - This field contains the port number for your HTTP proxy server. This defaults to the
standard port of 80, although your port number may be different. Check with your network
administrator for this information.
Proxy USERID - you have an authenticating proxy server. This field allows you to enter the userid
required for access to the proxy server. Check with your network administrator for this information
Proxy Password - If you have an authenticating proxy server. This field allows you to enter the
password required for access to the proxy server. Check with your network administrator for this
information.
Tunnel – Select this option if your proxy server requires SSL tunneling. Check with your network
administrator for this information.
80
HURRTRAK & Global Tracker Users Guide 1992-2012, PC Weather Products, Inc.
Automatically poll for new data - This data allows the user to select automatic polling for new data
and also specify the polling internal. When this option is on, the system will attempt to retrieve
new data when the system is first started and then at the specified interval. For dial-up type
systems, you must define your connection in the Windows - Control Panel - Internet - Connection
preferences. Global users have access to the data in the Pacific and Indian Oceans.
Quiet Updates - This option, when checked, will prevent the system from showing the data update
progress box. “New data” messages will continue to be displayed, however.
Disconnect from Internet after update - This option will automatically disconnect your dial-up
session after polling/retrieving any new data. This is only valid for Dial Up Networking Accounts.
Do not set this if you have a direct connection to the Internet or an error will occur.
Start HURRTRAK ONLINE TIMER at Windows Startup - When this option is checked, a special
Hurrtrak Online update program is started when your Windows system starts up. It will interact,
via an Internet connection, to HURRTRAK ONLINE, keeping your hurricane database current.
This allows you to keep your databases updated even though the main tracking program is not
active.
Bypass Hurrtrak online configuration load on program startup - This field prevents the program
from connecting to the Internet on startup to retrieve the latest online configuration file. If you have
a dial up connection and only want to connect when retrieving data, you should select this option.
81
HURRTRAK & Global Tracker Users Guide 1992-2012, PC Weather Products, Inc.
Impact Analysis/ Reporting Options
This option allows the user to specify impact analysis threshold values and certain reporting
options.
Impact analysis report values:
Wind threshold #1,2,3 (knots) - This option allows the user to set the wind ranges (knots) for the
impact analysis report which is available after doing a county or zip code analysis report. The
impact analysis report displays the total population and number of households that are forecast to
be affected by certain levels of wind. See the county or zip code analysis report for more
information.
Report wind threshold - This option allows the user to set the wind threshold (knots) at which they
want to see summary information on the location analysis impact summary report. Locations that
are not forecast to reach this level of wind will not appear on the summary report. If using the
Advanced Wind Estimation capabilities of the system, it is recommended that this value be set at 5.
In this way, locations that have maximum winds of less than 34 knots will still get reported. Setting
this field to zero will force every location to appear in the summary wind analysis reports. It is not
recommended that you do this for the county and zip code reports.
Automatically Determine States - Enabling this option allows the system to determine the affected
states, rather than the user having to determine this for each storm / report. Enabling this option is
highly recommended.
States to include in County Impact Analysis - Use this option to specify which states you
would like to include in the County Wind Profile Analysis report. If you have interest in only a few
states, then you can check only those states. This will improve the performance in generating the
county wind report. You may also choose the MAP SELECT option which will allows the user to
choose states graphically.
States to include in Zip Code Impact Analysis - Use this option to specify which states you
would like to include in the Zip Code Wind Profile Analysis report. If you have interest in only a few
states, then you can check only those states. This will improve the performance in generating the
zip code wind report. You may also choose the MAP SELECT option which will allows the user to
choose states graphically.
82
HURRTRAK & Global Tracker Users Guide 1992-2012, PC Weather Products, Inc.
Display Wind Gusts - Selecting this option allows the system to display both sustained winds and
wind gusts in all location, county or zip code reports. This should be used with caution as the wind
gusts estimated away from the immediate coastline will likely be overestimated. We recommend
that this option only be "on" when you are using the Advanced Wind Estimation capabilities of
RMPRO.
Plot/Use real zip codes only - This option determines if only populated zip codes will be reported in
the zip code report. This will eliminate PO Boxes and corporate zip codes.
Show all times - This option determines if the detailed impact reports will include times when no
forecast wind exists.
Export Option - This option will remove all non-numeric data from the Impact Report EXCEL export.
This option has been added for users who use the data export feature as input into other programs
which cannot handle alpha data in certain fields. Most users will not use this option.
Damage Standard to use in wind impact reports – This option allows the user to select which
damage scale they would like to see referenced on wind impact reports. See page 336 for more
information on the damage comments.
83
HURRTRAK & Global Tracker Users Guide 1992-2012, PC Weather Products, Inc.
Plotting Options
This allows the user to define numerous options related to the functions available when plotting
items on a tracking chart.
Display Track “Chart Notes” - This indicator determines if the storm's chart notes will automatically be
displayed after the track is drawn.
Display Official Forecast “Chart Notes” - This indicator determines if the storm's official forecast chart
notes will automatically be displayed after the track is drawn. The day of the week is included on
smaller scale maps.
Display Climate Forecast “Chart Notes” - This indicator determines if the storm's climatological forecast
chart notes will automatically be displayed after the track is drawn.
Display "what if" Forecast “Chart Notes” - This indicator determines if the storm's "what if" chart notes
will automatically be displayed after the track is drawn.
Plot observation points with “circles” - This indicator determines if the storm's observation points will be
designated with a small circle
Plot/export latest model forecast only - This indicator controls whether the system will plot or export
more than one of the same forecast model outputs. If checked, only the latest forecast model will be
shown. I.E. only the latest GFDL, not the last 2 or 3)
Model Age (hours) - This indicator controls which models will plot based on their age in hours. Any
models initialized greater than this value will not be plotted. This option is utilized in both the Hurrtrak
program and the RECON Plot module.
Eye wall shading pattern - This determines how the storm’s eye wall will be depicted on tracking charts.
84
HURRTRAK & Global Tracker Users Guide 1992-2012, PC Weather Products, Inc.
Automatically Display location distances - This option determines if location distances are automatically
displayed after a storm track plot. The user can also define which location groups to use for maps
smaller (small map location) and greater (large map location) than 20 degrees in width.
Road Line Color - This allows the user to set the color that the road
lines are drawn.
Latitude / Longitude Grid - This controls the pattern and color of the
latitude/longitude grid lines
Watch and Warning Options:
Width of Warning Area - This value determines how wide the watch and warning "ribbon" is drawn
along the coast. It is expressed in nautical miles. The watch ribbon is 1/2 the width of this value.
Color - This option allows the user to modify the colors of the Hurricane and Tropical Storm Watch
and Warning Areas.
85
HURRTRAK & Global Tracker Users Guide 1992-2012, PC Weather Products, Inc.
Wind Circle/Area Options:
Circle/Shaded Area Option - This option allows the user to change/set the way that the storm wind
areas are displayed. If "wind circle" is selected, then the entire storm track along with its latest
position is shown, with the 34, 50 and 64 knot wind boundaries displayed. If "wind area" is
selected, then only the storm's latest position is shown with the 34, 50 and 64 knot wind areas
displayed as solid shaded areas. If none is selected, then only the center point is displayed.. with
no wind areas depicted.
Colors - Sets the colors for the eye wall and 35, 50 and 64 knot wind “circles”.
Track Colors:
Set Color - Sets the color of the storm track by category of storm, the official forecast, the
climatological forecast and what if forecast.
Reset Defaults - Resets the track colors to the shipped defaults.
Forecast Line Width – Controls the width of the forecast track (pixels).
Wind Arrows:
Plot Multi-colored wind vectors – This option allows the user to display a pattern of wind vector that
represent the storm’s wind circulation. The color and size of the arrows are determined by the wind
speed at each vector location. It is recommended that the arrow density is increased when using
this option. See APPENDIX PP: Multi-Colored wind vector display on page 313 for more
information.
Multi-colored arrow color – This option allows the user to control the multi-colored wind vector
colors. The value cannot be changed and is set to the Saffir-Simpson scale.
Wind arrow size – Sets the size of the wind arrows.
Density of arrow plots - Controls the density of the arrow plots when the “display wind field” is
selected.
Set Color - Sets the color of the wind arrows.
86
HURRTRAK & Global Tracker Users Guide 1992-2012, PC Weather Products, Inc.
Figure 3
Decision Arc Options:
Decision Arc Width - This option allows the user to specify the width, in pixels, of the decision arc
line.
Decision Arc Plot Location - This is the location that you have designated as the one to use when
drawing decision arcs. You MUST have an action point defined for a location before it will appear
in this list. For a complete discussion of decision arcs and decision support, see page 268.
Decision Arc Color - This option allows the user to specify the color of the official forecast error.
Forecast Error Options:
Forecast Error hours – This option allows the user to specify whether they would like to show the 72
hour average forecast error and/or the 120 hour forecast error when plotting.
Forecast Error Color - This option allows the user to specify the color of the official forecast error for
the 72 or 120 hour plots
Rain Contour Color - This option allows the user to specify the color of the rain contours used for the
analysis type of forecast rainfall display.
87
HURRTRAK & Global Tracker Users Guide 1992-2012, PC Weather Products, Inc.
County Thematic Map Wind Options:
Set Values and Colors (left) - This option allows the user to define the specific colors used when
plotting the maximum wind values on a county or zip code thematic map. This function is available
from the County or Zip Wind Profile / Analysis report. The standard default wind/colors are a gradient
from 0 to 150 knots and from green to red, while the Saffir-Simpson default wind/colors are from 34 to
135 knots and also from green to red. When this option is active, the defined gradient colors are
ignored.
Gradient Colors (right) - This option allows the user to define a gradient of colors used when plotting
the maximum wind values on a county thematic map. This function is available from the County Wind
Profile / Analysis report. The user can select the low color and the high color, as well as the wind
range used for each color. When this option is active, the set values and colors defined are ignored.
88
HURRTRAK & Global Tracker Users Guide 1992-2012, PC Weather Products, Inc.
This option allows you to change the colors of the forecast model tracks as well as
disabling specific forecast model. To change the color, simply left click on the model
name. To disable or re-enable a model, right click on the model name. Disabled models
will have a black background.
In addition, by selecting “Max’s favorite models” you can select to disable all of the
models except for the ones preferred by Max Mayfield.
Finally, you can control the width of the model plot by selecting the pixel width desired via
the Model Line Width option. This only controls the model line width in the main tracking
program.
89
HURRTRAK & Global Tracker Users Guide 1992-2012, PC Weather Products, Inc.
This option allows the user to control the wind speed level and colors of the Wind Pattern
Image. To change the wind values, simply enter valid values in the wind speed data fields.
To change the color scheme, click on the color box. The two command buttons allow the
user to easily setup levels/colors to match the Saffir-Simpson Scale or the 16 color default.
90
HURRTRAK & Global Tracker Users Guide 1992-2012, PC Weather Products, Inc.
The rendering of the wind pattern display when using Advanced Wind Estimation (AWE) is very
time consuming as each location’s roughness index is calculated as determined by the wind
direction. Run times of 20 minutes or more, depending on screen size, are not uncommon.
To rectify this problem, we have created Pre-Processed RI (roughness index) files that will allow
the rendering logic to bypass this lengthy roughness index calculation. This reduces the runtimes from 20 minutes down to less than 1 minute.
Unfortunately, these processed RI files are very large as all coastal states are represented by
over 1 GB of data files. Rather than attempt to install or download all of these RI files (by state),
the solution we have devised is to allow the user to download RI files only for states that they will
typically use the Wind Pattern feature.
There are only two options available on this screen.
Use processed RI files - This option allows the user to turn on and off the option of using these
processing RI files. The only advantage to not checking this option is that the resultant display is slightly
smoother when allowing the system to calculate RI “on the fly”.
Download State Pre-Processed RI files – This selection opens an Internet Explorer (or
whatever your default Internet browser is) web page. You can download state files from this
web page. Make sure you follow the directions exactly… particularly the message that
indicates where (folder location) to save the file. Repeat this option for each state being
downloaded.
The list of states, with check boxes, indicates which states have already been downloaded.
91
HURRTRAK & Global Tracker Users Guide 1992-2012, PC Weather Products, Inc.
Strike/Wind Probability Options
This option allows the user to select the color and interval of the contours used in Strike
and Wind Probability analysis.
Contours:
Contour Interval - The interval at which the probability contours are analyzed (I.E. a value of 20 will
plot strike probability contours at 20, 40, 60 and 80 percent levels.
Set Color - This sets the color of the contours.
92
HURRTRAK & Global Tracker Users Guide 1992-2012, PC Weather Products, Inc.
Unit of Measure Options
This option allows the user to specify unit of measure for the following…
Wind Speed - Sets the unit of measure for wind speed at MPH or Knots. Other than the official forecast
function and certain wind preferences, the system will then display all wind information in this unit of
measure.
Locations Distances: - Sets the unit of measure for location distances at either nautical miles or statute
miles. Storm motion speed also uses this unit of measure.
Central Pressure - Sets the unit of measure for pressure to millibars or inches of mercury. The system will
display pressure in these units. Data entry of pressure remains in MB.
93
HURRTRAK & Global Tracker Users Guide 1992-2012, PC Weather Products, Inc.
Wind Band Options
This option controls the analysis detail and wind band colors used for the wind band analysis.
Analysis detail - This determines the level of detail to use while analyzing. A 10 value is 10 times
more detailed than a value of 1 and also takes 10 times longer to analyze.
Quick TAU – This option causes the system to display a “quick TAU” plot instead of the wind bands.
It indicates the observed and forecasted areas of 34, 50 and 64 knot winds.
Active – Activates / deactivates this wind band for plotting
Wind level values - Wind level #1-10 - Sets the wind value for the wind band levels.
Set Color - Sets the color of the 1-10 levels of wind band values.
Reset 3 band value/color defaults - Resets the wind band values to the shipped 3 values.
Reset 10 band value/color defaults - Resets the wind band values to the shipped 10 values.
Reset Saffir-Simpson scale – Set the values and colors to the Saffir Simpson scale.
Reset Texas Tech scale – Set the values and colors to the Texas Tech damage scale.
.
94
HURRTRAK & Global Tracker Users Guide 1992-2012, PC Weather Products, Inc.
Setup Application Appearance
This option allows the user to change the overall appearance of the application by
- Changing the “skin” of the application
- Changing the size of the command/toolbar buttons
- Changing the colors of the command/toolbar
The following screen is presented to the user when this option is selected.
The user can select from the available skins and also select the size of the icons and the color of
the toolbar. These settings are saved from one session to the next. You can use your own skins
by putting them into the “SKINS” folder within the Hurrtrak installation folder.
On the following page is an example of an Office 2007 blue skin with large toolbar icons.
95
HURRTRAK & Global Tracker Users Guide 1992-2012, PC Weather Products, Inc.
96
HURRTRAK & Global Tracker Users Guide 1992-2012, PC Weather Products, Inc.
HELP OPTIONS
Contents - Displays general help.
Search for.. Displays Keyword Search.
Display System Documentation
FAQ - Displays Q&A information about the system.
Obtaining technical support - Displays information on where to find technical
support.
Software License Agreement - Displays the software license agreement.
Display System Resources - Displays pop-up windows that show the values of
some key system resources.
Check for Software Updates – Determines if there is a newer version of the
software and will download and update your software.
About - Displays information about the version of the system you are running.
97
HURRTRAK & Global Tracker Users Guide 1992-2012, PC Weather Products, Inc.
INFORMATION TABS
The HURRTRAK system information is presented using a "tab style" interface. This
allows the user to easily and quickly create and view information. The tabs available on
the system are:
General Information Tab
Risk/Impact Tab
HURRTRAK ONLINE Tab
Internet Tab
ExpertEase
Tracking Chart Select Tab
Variable Tracking Chart
Fixed/Favorite Tracking Chart
Wind Band Analysis
Strike/Wind Probability Analysis
Forecast Rainfall Analysis
Forecast Rainfall Thematic
Animation
Forecast Position
3D Wind Surface
Latest Tropical Weather Outlook
Public Advisory
Forecast Advisory
Forecast Discussion
Wind Probabilities
User Comments (Diary)
Observation Worksheet Table
Official Forecast Table
Climate Forecast Table
Watch and Warning Table
Wind Speed Graph
Central Pressure Graph
Location Impact Summary Report
County Impact Summary Report
Zip Code Impact Summary Report
Detailed Location/County/Zip Hourly Report
County/Zip Impact Analysis Report
Strike/Wind Probability Report
Detailed Location/County/Zip Wind Graph
Detailed Location/County/Zip Flood Index Graph
County Wind Thematic
And will be examined individually below.
98
HURRTRAK & Global Tracker Users Guide 1992-2012, PC Weather Products, Inc.
General Information Tab
Description: This tab provides general system information. If a storm is loaded, it indicates the
Storm Name, latest advisory date/time, the sustained winds, a wind trend indicator, the
storm’s category, the position of the storm, its central pressure and movement.
This tab also shows the current database, the current Active Hurrtrak Online Database,
general system configuration items and a graphic which represents all of the storms in the
current database. To load a storm, double click on the icon next to the storm name.
Tab Created by: N/A (always present)
Tab Closed Allowed: No
Functions Available:
- Standard system menu functions.
- Basin Select (Global versions)
- Mouse double click on a storm icon to “open” it.
- Select an observation for post storm analysis by passing over icon and then right-click / post
storm analysis. Loaded storm only.
- Delete a storm by passing mouse over storm ICON and then right-click / Delete Storm.
99
HURRTRAK & Global Tracker Users Guide 1992-2012, PC Weather Products, Inc.
Risk/Impact Tab
Description: This tab provides risk/impact information for the defined base location(s). It shows
the risk alert “bars”, narrative impact statement, wind probabilities, surge probabilities, wind
impact summary / detail and a forecast wind speed and direction graph for the displayed base
location. The user can move through each of the base location via the next and prior buttons,
displaying the impact information for each site.
Tab Created by: Tab is active when at least 1 base location is defined and a storm is loaded
Tab Closed Allowed: No
Functions Available:
Menu:
Standard System Menu Functions
Print/Send – Prints or sends a report for the displayed location, all impacted locations or
all base locations.
Commands: (only available when more than 1 base location is defined)
First – Displays the risk/impact information for the first (alpha) location
Prior Impacted – Displays the prior (alpha) impacted location in the set of base locations
Prior – Displays the prior location in the set of base locations
Next – Display the next base location
100
HURRTRAK & Global Tracker Users Guide 1992-2012, PC Weather Products, Inc.
Next Impacted – Displays the next impacted location
Last – Displays the last location
Toolbar:
See APPENDIX T: Tool Bars on page 326 for more information.
NOTE: To have multiple base locations appear on this tab you need to add locations to the
location group called “Base Location” via the System Setup option.
Miscellaneous:
- Right Clicking on the Narrative impact statement will allow the user to copy or email the
narrative text.
- Selecting the drop down arrow on the row that says “Detailed hourly information for…” will
display the “hourly” details for this location.
- Moving the mouse over a point on the graph will display information about that observation.
- Left –clicking on the graph will toggle the wind direction plot
- For more information on the risk alert bars, see page 323 .
101
HURRTRAK & Global Tracker Users Guide 1992-2012, PC Weather Products, Inc.
HURRTRAK ONLINE Tab
Description: While we recommend that you utilized the Hurrtrak Online Timer program to keep
your databases up to date, this tab allows the user to manually retrieve information via the
HURRTRAK ONLINE service. The user can select from a PCWP data list (Hurricane info) or
a “Non PCWP list" which contains links to Internet sites. This tab also indicates when the
storm databases were last updated and when they are scheduled to be next updated.... as
well as some other informational type data.
Tab Created by: Always present, unless deselected via user preferences general options.
Tab Closed Allowed: No
Functions Available:
Menu: Standard System Menu Functions
Toolbar: See APPENDIX T: Tool Bars on page 326 for more information.
Other:
PCWP Data retrieve (dblclick left list) - Retrieves data from the PCWP Server.
Non PCWP Data retrieve (dblclick right list) - Opens your browser and goes to Internet
link.
Retry configuration - If Internet link fails, this allows the user to manually force the
system to retry to retrieve the Hurrtrak Online Configuration Data.
TIPS: Be sure to setup your HURRTRAK online options before downloading.
102
HURRTRAK & Global Tracker Users Guide 1992-2012, PC Weather Products, Inc.
INTERNET Tab
Description: This tab allows the user to display an Internet web page. Typical uses include a
link to your favorite satellite image, hurricane site, etc. This is not meant to be a full service web
browser, but rather a simple way to show Internet information within the HURRTRAK system
without having to start a separate browser. The sat images dropdown lists primarily satellite
image Internet links which are provided via the HURRTRAK Online service.
Tab Created by: Always present unless deselected via general options.
Tab Closed Allowed: No
Functions Available:
Menu: Standard System Menu Functions
Toolbar: See APPENDIX T: Tool Bars on page 326 for more information.
Other Commands:
Set as default - Sets the current URL displayed as the default location shown when the
system is started. This does not affect your regular browsers home location.
Back – Goes back 1 page
Forward – Goes forward 1 page
Home - goes to default home page.
Refresh – refreshes current page. Page will update automatically every 15 minutes.
Save to Email Outbox – Adds image to the Email outbox
Active option - this option allows the user to turn off the web browser feature.
Tip: Copy and paste you favorite web address from your web browser into the address field.
Check out the Satellite Image dropdown list for a list of our favorite satellite images.
103
HURRTRAK & Global Tracker Users Guide 1992-2012, PC Weather Products, Inc.
ExpertEase Tab
Description: This tab contains the latest video discussion from one of the PC Weather Products
meteorologist. It is typically updated daily by noon EDT and contains information about conditions
in the tropics and focuses on any active tropical cyclones. This feature is available to all Hurrtrak
users who have the latest version of the software and have an active Hurrtrak Online subscription.
Tab Created by: Always present unless deselected via general user options.
Tab Closed Allowed: No
Functions Available:
Reload Video - Restarts the video from the start
Special Considerations: Adobe FLASH Player must be installed on your system before the
video will play correctly. It is best if you install Adobe Flash player via an Internet Explorer
session and not via the Hurrtrak Interface. You can download and install Adobe Flash from
http://get.adobe.com/flashplayer/ .
104
HURRTRAK & Global Tracker Users Guide 1992-2012, PC Weather Products, Inc.
Map Selection Tab
Description: This tab displays a detailed map of the systems tracking area. It is used in all pan
and zoom mapping options. In additional, you can manipulate this map and then select plotting
functions you would like to plot on this map.
Tab Created by: Always present when storm loaded.
Tab Closed Allowed: No
Functions Available:
Menu: Standard System Menu Functions
Toolbar: See APPENDIX T: Tool Bars on page 326 for more information.
Display:
Overlay Control Center – This is an advanced function which allows the user to display
various GIS overlays on a tracking map. This is described in much more detail on page
343.
Strike Probabilities- Plots the forecast strike probabilities using the current map on a
separate tab.
Wind Probabilities- Plots the forecast wind probabilities using the current map on a
separate tab.
105
HURRTRAK & Global Tracker Users Guide 1992-2012, PC Weather Products, Inc.
Forecast Rainfall Analysis - Plot the forecast rainfall analysis using the current map on a
separate tab.
Forecast Rainfall Thematic - Plots the forecast rainfall by showing a color-coded county
thematic map. This appears in a separate tab.
Wind Pattern – Plots the wind pattern graphic using the current map and current storm
wind field onto a separate tracking type tab. See page 321 for more information on the
Wind Pattern image.
Wind Bands (Forecast / Actual) - Plots the forecast or actual wind band analysis using
the current map on a separate tab.
SLOSH / Storm Surge for this area – Opens up the SLOSH display program and loads
data for the area selected on the map. You must be at an appropriate zoom level to select
this option.
Plot:
EZ Map - Automatically creates a tracking map with several plotting options as defined in
the General User Options. See page 301 for more information on the EZ Map function.
Tracking Chart with plot - Plots the storm's current track and position, with wind areas
depicted, using the current map on a separate tracking chart tab.
Tracking Chart with no plot - Displays the current map with only a hurricane symbol
depicting the storm's latest position. This is shown on a separate tab.
Forecast Position - Using the current map, this option displays a storm's forecast position
on a separate tracking chart tab.
Animate
Standard - Using the current map, this option animates the storm's actual and/or forecast
track depicting the standard 34, 50 and 64 knot wind areas. The animation appears on a
separate tab.
Wind Pattern – This option animates the storm’s actual and/or forecast track using the
wind pattern method. This takes considerably more time for the animation sequence to be
created and should be used with some caution.
Save as custom map - This option allows the user to save the current map image as a
custom "favorite" tracking map. This is the recommended method for creating a custom
map, instead of using the custom map maker function.
Tips:
Zoom in by doing a mouse <left click> and drag, outlining the desired area.
A mouse <right click> will present several map positioning options.
A mouse <left click> and drag, while holding the shift key, will display a distance vector.
A <Ctrl> <left click> and drag will reposition the map area.
Misc:
The image on this tab is automatically used when using the Pan and Zoom options from a
tracking chart.
106
HURRTRAK & Global Tracker Users Guide 1992-2012, PC Weather Products, Inc.
“Variable Tracking Chart”/Map Selection Tab
Description: This tab displays the map selected from the map selection tab or when a map is replotted due to pan and zoom. Many storm tracking and analysis functions are available from
here. Up to three of the variable tracking chart tabs are available. These maps are dynamic and
are not part of the system's permanent (fixed/favorite) tracking chart selection.
Tab Created by: Selecting a tracking option from the Map Selection tab.
Tab Close Allowed: Yes
Functions Available:
Menu: Standard System Menu Functions
Send - Sends current tab’s image as graphic or pdf via email image as shown on page
156.
Undo - Removes the last change or all changes to the tracking chart.
Display - For a complete list of display options see page 157.
Plot - For a complete list of Plot options see page 159.
Animate - Animates the storm’s actual and/or forecast motion on a separate tab. The
user can select to plot a standard or wind pattern animation on the same chart or one
with a refreshed un-plotted image.
107
HURRTRAK & Global Tracker Users Guide 1992-2012, PC Weather Products, Inc.
Stretch - Fills the entire screen with the current tab’s image. No functions can be
performed while in stretch mode.
Annotate – Allows the user to place text on the current image.
Print/Export – Allows the user to print the current image in color, gray scale, or B&W.. or
send the image to Google Earth. See page 306 for more information on the Google
Earth interface.
Save Image – Saves the image to the clipboard or file (color or B&W), pdf or adds to
Email Outbox.
Options – Allows the user to show mousepointer data and turn the status bar on/off.
Toolbars: See APPENDIX T: Tool Bars on page 326 for more information.
Miscellaneous:
The user can zoom in by rubber-banding an area on the screen. Other pan and zoom options
are available by right clicking anywhere on the map image.
Left Clicking on a tracking map will display either the current wind vector (arrow) for the
mouse position or the forecast wind speed for that location. This is controlled by toggling a
toolbar button which is located on the primary toolbar.
- In this mode, a left click will display the wind speed/direction at
that point, at the current time.
- In this mode, a left click will display the forecast wind speeds
(sustained and gusts) at the point.
108
HURRTRAK & Global Tracker Users Guide 1992-2012, PC Weather Products, Inc.
Fixed/Favorite Tracking Chart Tab
Description: This tab displays one of the many fixed area system tracking charts. These include
any custom maps created by the user. There are 3 "favorite" tracking chart tabs available to the
system.. one of which is a "multiple storm" tracking chart. Many storm tracking and analysis
functions are available from here, including the ability to plot a track on a satellite or radar image.
Tab Created by: Always there, when storm is loaded, unless specified otherwise by User General
Options.
Tab Close Allowed: No
Functions Available:
Menu: Standard System Menu Functions
Send - Sends current tab’s image as graphic or pdf via email image as shown on page
156.
Undo - Removes the last change or all changes to the tracking chart.
Display - For a complete list of display options see page 157.
Plot - For a complete list of Plot options see page 159.
Animate - Animates the storm’s actual and/or forecast motion on a separate tab.
Stretch - Fills the entire screen with the current tab’s image. No functions can be
performed while in stretch mode.
Annotate – Allows the user to place text on the current image.
109
HURRTRAK & Global Tracker Users Guide 1992-2012, PC Weather Products, Inc.
Print/Export – Allows the user to print the current image in color, gray scale, or B&W.. or
send the image to Google Earth. See page 306 for more information on the Google
Earth interface.
Save Image – Saves the image to the clipboard or file (color or B&W).
Options – Allows the user to show mousepointer data and turn the status bar on/off.
Toolbar: See APPENDIX T: Tool Bars on page 326 for more information.
Miscellaneous:
The user can zoom in by rubber-banding an area on the screen. Other pan and zoom options
are available by right clicking anywhere on the map image.
Left Clicking on a tracking map will display either the current wind vector (arrow) for the
mouse position or the forecast wind speed for that location. This is controlled by toggling a
toolbar button which is located on the primary toolbar.
- In this mode, a left click will display the wind speed/direction at
that point, at the current time.
- In this mode, a left click will display the forecast wind speeds
(sustained and gusts) at the point.
Other:
If you right click anywhere on the tracking map near the forecast path, you have the option
to create an impact report for that location.
110
HURRTRAK & Global Tracker Users Guide 1992-2012, PC Weather Products, Inc.
Tracking map option / List - This command will display the thumbnail sized images of all of
the fixed tracking chart for your selection (dbl click). You can also select the chart from the
dropdown list. See example below.
Satellite/Radar option / List – This command will display the thumbnail sized images of all of
the satellite, sea surface temperature (SST) and Radar images that are available for
overlaying storm tracks on top of. See example below…
You can also select the image from the dropdown list. The selection of images is maintained
by PC Weather Products and requires a HURRTRAK Online subscription to make active.
Upon selection, the image is loaded from a 3rd party Internet source and then storm tracks
may be plotted on top of it. Note.. Any plots that floods an area with color.. such as a forecast
track error or wind band analysis will overlay the image behind it. It is suggested that you do
not use these type functions.
.
Next Map - This option will display the next (sequential) fixed area map.
Prior Map - This option will display the prior fixed area map.
Best Map - This option selects the smallest scale map that has the storm's latest position on
it.
Tips:
Using the Next or Prior Map command buttons after being on the BEST map, will display the
first map in the sequence (full area map).
The map dropdown list is the fastest way to get to a specific desired tracking chart.
You can specify how many favorite tracking charts you would like to have available in the user
general options.
The multiple storm tracking chart tab is special in that it is NOT refreshed when a new storm
or database is loaded. This allows the user to plot more than one storm track on it.
The satellite/Radar image dropdown list is maintained via HURRTRAK Online and may
change during the hurricane season. The images are downloaded from 3rd party Internet
sites which are generally very reliable.. but occasionally they may not be available.
111
HURRTRAK & Global Tracker Users Guide 1992-2012, PC Weather Products, Inc.
The satellite and radar thumbnails are set to update via Hurrtrak Online every 3 hours. This
can be controlled via the settings in general options. The age of the thumbnail has no
effect on the image downloaded and displayed... which is always the latest available.
You cannot add your favorite satellite image to the list of tracking chart satellite images. If you
have a good source for satellite images and the images are in a Mercator map projection,
please contact us.
112
HURRTRAK & Global Tracker Users Guide 1992-2012, PC Weather Products, Inc.
Wind Band Analysis Tab
Description: This tab displays the actual and/or forecast wind band analysis information for the
current loaded storm. Additional storm tracking and analysis functions are available from here.
Tab Created by: Map Select Tab, Variable Track Chart Tab, Favorite Tracking Chart Tab
Tab Close Allowed: Yes
Functions Available:
Menu: Standard System Menu Functions
Send - Sends current tab’s image as graphic or pdf via email image as shown on page
156.
Undo - Removes the last change or all changes to the tracking chart.
Display - For a complete list of display options see page 160.
Plot - For a complete list of Plot options see page 159.
Stretch - Fills the entire screen with the current tab’s image. No functions can be
performed while in stretch mode.
Annotate – Allows the user to place text on the current image.
Print/Export – Allows the user to print the current image in color, gray scale, or B&W.. or
send the image to Google Earth. See page 306 for more information on the Google
Earth interface.
Save Image – Saves the image to the clipboard or file (color or B&W), pdf or add to Email
Outbox.
113
HURRTRAK & Global Tracker Users Guide 1992-2012, PC Weather Products, Inc.
Toolbar: See APPENDIX T: Tool Bars on page 326 for more information.
Miscellaneous:
The user can zoom in by rubber-banding an area on the screen. Other pan and zoom options are
available by right clicking anywhere on the map image.
Tips: You can specify the wind band wind levels in the Wind Band Options
114
HURRTRAK & Global Tracker Users Guide 1992-2012, PC Weather Products, Inc.
Strike/Wind Probability Analysis Tab
Description: This tab displays two types of probabilities. It graphically displays either the total,
next 24 hours, 24-36 hour period, 36-48 hour period or 48-72 hour period strike probabilities OR
the total 34 knot, 50 knot or 64 knot wind probabilities… on a tracking chart. The values are
contoured as set in the Strike/Wind Probabilities Option. Additional storm tracking and analysis
functions are available from here. Note: the Strike Probabilities are no longer used by the
National Hurricane Center and will likely be phased out of this system.
Tab Created by: Map Select Tab, Variable Track Chart Tab, Favorite Tracking Chart Tab
Tab Close Allowed: Yes
Functions Available:
Menu: Standard System Menu Functions
Send - Sends current tab’s image as graphic or pdf via email image as shown on page
156.
Undo - Removes the last change or all changes to the tracking chart.
Display - For a complete list of display options see page 162.
Plot - For a complete list of Plot options see page 163.
Stretch - Fills the entire screen with the current tab’s image. No functions can be
performed while in stretch mode.
Annotate – Allows the user to place text on the current image.
115
HURRTRAK & Global Tracker Users Guide 1992-2012, PC Weather Products, Inc.
Print/Export – Allows the user to print the current image in color, gray scale, or B&W.. or
send the image to Google Earth. See page 306 for more information on the Google
Earth interface.
Save Image – Saves the image to the clipboard or file (color or B&W), PDF or add to
Email Outbox.
Toolbar: See APPENDIX T: Tool Bars on page 326 for more information.
Miscellaneous:
The user can zoom in by rubber-banding an area on the screen. Other pan and zoom options are
available by right clicking anywhere on the map image.
116
HURRTRAK & Global Tracker Users Guide 1992-2012, PC Weather Products, Inc.
Forecast Rainfall Analysis Tab
Description: This tab displays the National Weather Service's official 24-hour rainfall forecast for
the next 3 days. Additional tracking and analysis functions are available from here.
Tab Created by: Map Select Tab, Variable Track Chart Tab, Favorite Tracking Chart Tab
Tab Close Allowed: Yes
Functions Available:
Menu: Standard System Menu Functions
Send - Sends current tab’s image as graphic or pdf via email image as shown on page
156.
Undo - Removes the last change or all changes to the tracking chart.
Display - For a complete list of display options see page 157.
Plot - For a complete list of Plot options see page 159.
Stretch - Fills the entire screen with the current tab’s image. No functions can be
performed while in stretch mode.
Annotate – Allows the user to place text on the current image.
117
HURRTRAK & Global Tracker Users Guide 1992-2012, PC Weather Products, Inc.
Print/Export – Allows the user to print the current image in color, gray scale, or B&W.. or
send the image to Google Earth. See page 306 for more information on the Google
Earth interface.
Save Image – Saves the image to the clipboard or file (color or B&W), pdf or add to Email
outbox.
Toolbar: See APPENDIX T: Tool Bars on page 326 for more information.
Miscellaneous:
The user can zoom in by rubber-banding an area on the screen. Other pan and zoom options are
available by right clicking anywhere on the map image.
118
HURRTRAK & Global Tracker Users Guide 1992-2012, PC Weather Products, Inc.
Forecast Rainfall Thematic Tab
Description: This tab displays the National Weather Service's official 24 or 72-hour rainfall
forecast for the next 3 days in a county thematic fashion. Additional tracking and analysis
functions are available from here.
Tab Created by: Map Select Tab, Variable Track Chart Tab, Favorite Tracking Chart Tab
Tab Close Allowed: Yes
Functions Available:
Menu: Standard System Menu Functions
Send - Sends current tab’s image as graphic or pdf via email image as shown on page
156.
Display - For a complete list of wind band display options see page 164.
Annotate – Allows the user to place text on the current image.
Print/Export – Allows the user to print the current image in color, gray scale, or B&W.. or
send the image to Google Earth. See page 306 for more information on the Google
Earth interface.
Save Image – Saves the image to the clipboard, image file, pdf or Add to Email Outbox.
Toolbar: See APPENDIX T: Tool Bars on page 326 for more information.
119
HURRTRAK & Global Tracker Users Guide 1992-2012, PC Weather Products, Inc.
Animation Tab
Description: This tab displays an animation of the storm’s motion either as wind radii OR as a
wind pattern. Additional tracking and analysis functions are available from here.
Tab Created by: Map Select Tab, Variable Track Chart Tab, Favorite Tracking Chart Tab, and
Animation Tab (when selecting Create Wind Pattern Animation)
Tab Close Allowed: Yes
Functions Available:
Menu: Standard System Menu Functions
Next Position - When in single step mode, this moves the storm forward 1 hour.
Prior Position - When in single step mode, this moves the storm backward 1 hour.
Start/Stop - When in single pass or continuous loop mode this option will stop or start the
animation.
Send - Sends current tab’s image or animation sequence via email. Animation file
characteristics are controlled by the User Preferences – Email setup option.
Print/Export – Allows the user to print the current image in color, gray scale, or B&W.. or
send the image to Google Earth. See page 305 for more information on the Google
Earth interface.
Save Image – Saves the image or animation sequence to a file, the clipboard, pdf file,
animated GIF or add to Email Outbox.
120
HURRTRAK & Global Tracker Users Guide 1992-2012, PC Weather Products, Inc.
-
-
Create Animated Wind Pattern – This option will stop the current animation and
build/display a Wind Pattern Animation sequence. This can be a very time consuming
process and no new animations can be started. If you are going to use this function, it
is imperative that you download the processed RI files. You can find out more about
the Processed RI files on the topic of Plotting Options on page 84.
Stop Processing – This option is only available when a Wind Pattern Animation is
being built (first loop). It will stop the current operation and display the wind pattern
animation that has been built so far. You cannot resume the wind pattern animation
build after it has been stopped.
Toolbar: See APPENDIX T: Tool Bars on page 326 for more information.
Miscellaneous:
The user can zoom in by rubber-banding an area on the screen or selecting one of the zoom out
or pan options. You need to stop the animation before performing any of these actions.
Tips:
- The first loop of either the wind radii animation or the wind pattern animation builds the
animation frame file. After the first loop, the animation speed is based on the settings in
your user preferences (animation options). The first loop of the wind pattern animation
may take a very long time.
- There is a complete set of animation options which are set in user preferences - animation
options.
- Selecting the animate option presents the user with the option of animating on the current
chart or a refreshed chart (one with just the base geographical map). Selecting the option
to animate using the current chart as the animation chart allows the user to first plot
desired "background" items such as forecast tracks, range rings, etc., and have those
appear during the animation.
- Animation files can be very large. For smaller file sizes, do not animate on Satellite, Radar
or Landsat images.
- If you want to save an animation, be sure to select that option, as otherwise, they are
deleted when you are done viewing them. This is especially important to keep in mind
when creating wind pattern animations due to the amount of time they take to create.
121
HURRTRAK & Global Tracker Users Guide 1992-2012, PC Weather Products, Inc.
Forecast Position Tab
Description: This tab displays the 1 to 120 hour forecast position of a storm.
Tab Created by: Selecting the plot forecast position option from Tracking Chart Select Tab.
Tab Close Allowed: Yes
Functions Available:
Menu:
Standard System Menu Functions
Send - Sends current tab’s image as graphic or pdf via email image as shown on page
156.
Undo - Removes the last change or all changes to the tracking chart.
Display - For a complete list of display options see page 157.
Plot - For a complete list of Plot options see page 159.
Animate - Animates the storm’s actual and/or forecast motion on a separate tab.
Stretch - Fills the entire screen with the current tab’s image. No functions can be
performed while in stretch mode.
Annotate – Allows the user to place text on the current image.
122
HURRTRAK & Global Tracker Users Guide 1992-2012, PC Weather Products, Inc.
Print/Export – Allows the user to print the current image in color, gray scale, or B&W.. or
send the image to Google Earth. See page 306 for more information on the Google
Earth interface.
Save Image – Saves the image to the clipboard or file (color or B&W).
Options – Allows the user to show mousepointer data and turn the status bar on/off.
Toolbar: See APPENDIX T: Tool Bars on page 326 for more information.
Miscellaneous:
The user can zoom in by rubber-banding an area on the screen. Other pan and zoom options
are available by right clicking anywhere on the map image.
Left Clicking on a tracking map will display either the current wind vector (arrow) for the
mouse position or the forecast wind speed for that location. This is controlled by toggling a
toolbar button which is located on the primary toolbar.
- In this mode, a left click will display the wind speed/direction at
that point, at the current time.
- In this mode, a left click will display the forecast wind speeds
(sustained and gusts) at the point.
Tips: Selecting "all possible times” when selecting this option will present you with a list of hourly
forecast times.
123
HURRTRAK & Global Tracker Users Guide 1992-2012, PC Weather Products, Inc.
Wind Surface Tab
Description: This tab displays a 3D wind surface image of the current storm. The 3D wind
surface lets the user visualize the wind structure of the storm in a 3-dimensional manner. You
can "move around" the storm by moving the horizontal sliding scale. The default "view" is from
the South (180). You can also move "up and down" by moving the vertical sliding scale. The
default elevation is 0. There are several controls that set in the General Options which determine
how this function operates. One which determines the density or level of detail of the graph and
the other sets how the image is to be updated (with the movement of the sliding scale or by
pressing the OK button).
Tab Created by: Variable tracking chart Tab, Favorite Tracking Chart Tab
Tab Close Allowed: Yes
Functions Available:
Menu:
Standard System Menu Functions
3D Style - Allows the user to change the 3D surface graph to a 2D “contour" analysis or back
to the default surface analysis.
Send - Sends current tab’s image as graphic or pdf via email image as shown on page 156.
Print - Prints an image of the graph to the windows printer.
Save Image - Saves the image to a BMP file or adds it to the Email Outbox.
124
HURRTRAK & Global Tracker Users Guide 1992-2012, PC Weather Products, Inc.
Toolbar: See APPENDIX T: Tool Bars on page 326 for more information.
TIPS: To create a useful image, select a chart where the storm wind field fills most of the area
when choosing this function.
The 2D Contour Analysis looks like the following image with Advanced Wind Estimation on.
125
HURRTRAK & Global Tracker Users Guide 1992-2012, PC Weather Products, Inc.
Tropical Weather Outlook Tab
Description: This tab displays the latest Tropical Weather Outlook. If a global system, this tab will show
the tropical weather outlooks for all of the tropical basins. In addition to the text, it will also show the new
Graphical TWO product. Global / Hurrtrak Advanced users will also see the graphical outlooks for the
Western Pacific and Indian Ocean.
Tab Created by: Visible if the latest tropical weather outlook is no more than 30 days old unless deselected
in General Options.
Tab Close Allowed: No
Functions Available:
Menu:
Standard System Menu Functions
Send - Sends current tab’s content as text, html formatted text or via email image as shown on
page 156.
Print:
Save to Email Outbox – Saves the text portion to the Email Outbox.
Print Preview - Previews the printed output on your screen.
Direct to Printer - Prints the output directly to the designated printer.
Export to HTML – Exports the output in an HTML format.
Export to PDF – Exports the output to a PDF format.
Font - This allows the user to set the screen / printer font type and size. Only matching screen and
printer fonts are available. If you want to print out the data in portrait mode, and it does not fix
across 1 page, you may need to temporarily reduce the font size before printing.
Copy - This option copies the tropical weather outlook text to the windows clipboard. You can then
paste the copied information into another application, etc.
Toolbar: See APPENDIX T: Tool Bars on page 326 for more information.
126
HURRTRAK & Global Tracker Users Guide 1992-2012, PC Weather Products, Inc.
Public Advisory Tab
Description: This tab displays the latest National Hurricane Center Public Advisory for the current loaded
storm. This may contain JTWC information for storms outside of the Atlantic.
Tab Created by: This tab is visible if the Public Advisory is present and is not more than 6 hours old.
Tab Close Allowed: No, however, this tab can be deselected in General Options so that it would never
appear.
Functions Available:
Menu:
Standard System Menu Functions
Send - Sends current tab’s content as text, html formatted text or PDF via email image as shown
on page 156.
Print:.
Save to Email Outbox – Save text to Email outbox as a PDF file
Print Preview - Previews the printed output on your screen
Direct to Printer - Prints the output directly to the designated printer.
Export to HTML – Exports the output in an HTML format.
Export to PDF – Exports the output to a PDF format.
Font - This allows the user to set the screen / printer font type and size. Only matching screen and
printer fonts are available
Copy - This option copies the contents of the data form being displayed to the windows
clipboard. You can then paste the copied information into another application, etc.
Toolbar: See APPENDIX T: Tool Bars on page 326 for more information.
Tips:
- You can view the earlier advisories by selecting the prior and next advisory buttons.
- When you are viewing an earlier advisory, the background color changes to a manila color.
127
HURRTRAK & Global Tracker Users Guide 1992-2012, PC Weather Products, Inc.
Forecast Advisory Tab
Description: This tab displays the latest National Hurricane Center Forecast Advisory for the current
loaded storm. This may contain JTWC information for storms outside of the Atlantic.
Tab Created by: This tab is visible if the Forecast Advisory is present and is not more than 6 hours old.
Tab Close Allowed: No, however, this tab can be deselected in General Options.
Functions Available:
Menu:
Standard System Menu Functions
Send - Sends current tab’s content as text, html formatted text or PDF via email image as shown
on page 156.
Print:.
Save to Email Outbox – Save text to Email outbox as a PDF file
Print Preview - Previews the printed output on your screen
Direct to Printer - Prints the output directly to the designated printer.
Export to HTML – Exports the output in an HTML format.
Export to PDF – Exports the output to a PDF format.
Font - This allows the user to set the screen / printer font type and size. Only matching screen and
printer fonts are available
Copy - This option copies the contents of the data form being displayed to the windows
clipboard. You can then paste the copied information into another application, etc.
Toolbar: See APPENDIX T: Tool Bars on page 326 for more information.
Tips: You can view the earlier advisories by selecting the prior and next advisory buttons. When you are
viewing an earlier advisory, the background color changes to a manila color
128
HURRTRAK & Global Tracker Users Guide 1992-2012, PC Weather Products, Inc.
Forecast Discussion Tab
Description: This tab displays the latest National Hurricane Center Forecast Discussion for the current
loaded storm. This may contain JTWC information for storms outside of the Atlantic.
Tab Created by: This tab is visible if the Discussion is present and is not more than 6 hours old.
Tab Close Allowed: No, however, this tab can be deselected in General Options.
Functions Available:
Menu:
Standard System Menu Functions
Send - Sends current tab’s content as text, html formatted text or PDF via email image as shown
on page 156.
Print:.
Save to Email Outbox – Save text to Email outbox as a PDF file
Print Preview - Previews the printed output on your screen
Direct to Printer - Prints the output directly to the designated printer.
Export to HTML – Exports the output in an HTML format.
Export to PDF – Exports the output to a PDF format.
Font - This allows the user to set the screen / printer font type and size. Only matching screen and
printer fonts are available
Copy - This option copies the contents of the data form being displayed to the windows
clipboard. You can then paste the copied information into another application, etc.
Toolbar: See APPENDIX T: Tool Bars on page 326 for more information.
Tips: You can view the earlier advisories by selecting the prior and next advisory buttons. When you are
viewing an earlier advisory, the background color changes to a manila color
129
HURRTRAK & Global Tracker Users Guide 1992-2012, PC Weather Products, Inc.
Probability Advisory Tab
Description: This tab displays the latest National Hurricane Center Wind Probability Advisory for the
current loaded storm. This may contain JTWC information for storms outside of the Atlantic.
Tab Created by: This tab is visible if the Probability Advisory is present and is not more than 6 hours old.
Tab Close Allowed: No, however, this tab can be deselected in General Options.
Functions Available:
Menu:
Standard System Menu Functions
Send - Sends current tab’s content as text, html formatted text or PDF via email image as shown
on page 156.
Print:.
Save to Email Outbox – Save text to Email outbox as a PDF file
Print Preview - Previews the printed output on your screen
Direct to Printer - Prints the output directly to the designated printer.
Export to HTML – Exports the output in an HTML format.
Export to PDF – Exports the output to a PDF format.
Font - This allows the user to set the screen / printer font type and size. Only matching screen and
printer fonts are available
Copy - This option copies the contents of the data form being displayed to the windows
clipboard. You can then paste the copied information into another application, etc.
Toolbar: See APPENDIX T: Tool Bars on page 326 for more information.
Tips: You can view the earlier advisories by selecting the prior and next advisory buttons. When you are
viewing an earlier advisory, the background color changes to a manila color
130
HURRTRAK & Global Tracker Users Guide 1992-2012, PC Weather Products, Inc.
User Comments (Diary) Tab
Description: This tab displays user comments for the current advisory for the current storm.
Tab Created by: This tab is visible if User Comments have been entered for the current advisory.
Tab Close Allowed: No, however, this tab can be deselected in General Options.
Functions Available:
Menu:
Standard System Menu Functions
Send - Sends current tab’s content as text, html formatted text or PDF via email image as shown
on page 156.
Print:.
Save to Email Outbox – Save text to Email outbox as a PDF file
Print Preview - Previews the printed output on your screen
Direct to Printer - Prints the output directly to the designated printer.
Export to HTML – Exports the output in an HTML format.
Export to PDF – Exports the output to a PDF format.
Font - This allows the user to set the screen / printer font type and size. Only matching screen and
printer fonts are available
Copy - This option copies the contents of the data form being displayed to the windows
clipboard. You can then paste the copied information into another application, etc.
Toolbar: See APPENDIX T: Tool Bars on page 326 for more information.
Tips: User comments are included under the graphic in the summary report
131
HURRTRAK & Global Tracker Users Guide 1992-2012, PC Weather Products, Inc.
Observation Worksheet Table Tab
Description: This tab displays the observations for the current loaded storm.
Tab Created by: This tab is visible if a storm is loaded.
Tab Close Allowed: No, however, this tab can be deselected in General Options.
Functions Available:
Menu:
Standard System Menu Functions
Send - Sends current tab’s content as text, html formatted text or PDF via email image as shown
on page 156.
Print:.
Save to Email Outbox – Save text to Email outbox as a PDF file
Print Preview - Previews the printed output on your screen
Direct to Printer - Prints the output directly to the designated printer.
Export to HTML – Exports the output in an HTML format.
Export to PDF – Exports the output to a PDF format.
Export to Text – Exports the output to a comma delimited file.
Export to EXCEL – Exports the output and opens it in EXCEL format.
Font - This allows the user to set the screen / printer font type and size. Only matching screen and
printer fonts are available
Copy - This option copies the contents of the data form being displayed to the windows
clipboard. You can then paste the copied information into another application, etc.
Toolbar: See APPENDIX T: Tool Bars on page 326 for more information.
Tips: The observation rows are color-coded based on wind speed.
132
HURRTRAK & Global Tracker Users Guide 1992-2012, PC Weather Products, Inc.
Official Forecast Table Tab
Description: This tab displays the latest official forecast for the current loaded storm.
Tab Created by: This tab is visible if the forecast information is not more than 6 hours old.
Tab Close Allowed: No, however, this tab can be deselected in General Options
Functions Available:
Menu:
Standard System Menu Functions
Send - Sends current tab’s content as text, html formatted text or via email image as shown on
page 156.
Print:.
Save to Email Outbox – Save text to Email outbox as a PDF file
Print Preview - Previews the printed output on your screen
Direct to Printer - Prints the output directly to the designated printer.
Export to HTML – Exports the output in an HTML format.
Export to PDF – Exports the output to a PDF format.
Export to Text – Exports the output to a comma delimited file.
Export to EXCEL – Exports the output and opens it in EXCEL format.
Font - This allows the user to set the screen / printer font type and size. Only matching screen and
printer fonts are available
Copy - This option copies the contents of the data form being displayed to the windows
clipboard. You can then paste the copied information into another application, etc.
Toolbar: See APPENDIX T: Tool Bars on page 326 for more information.
133
HURRTRAK & Global Tracker Users Guide 1992-2012, PC Weather Products, Inc.
Climate Forecast Table Tab
Description: This tab displays the latest climate forecast for the current loaded storm.
Tab Created by: This tab is visible if the forecast information is not more than 6 hours old.
Tab Close Allowed: No, however, this tab can be deselected in General Options
Functions Available:
Menu:
Standard System Menu Functions
Send - Sends current tab’s content as text, html formatted text or via email image as shown on
page 156.
Print:.
Save to Email Outbox – Save text to Email outbox as a PDF file
Print Preview - Previews the printed output on your screen
Direct to Printer - Prints the output directly to the designated printer.
Export to HTML – Exports the output in an HTML format.
Export to PDF – Exports the output to a PDF format.
Export to Text – Exports the output to a comma delimited file.
Export to EXCEL – Exports the output and opens it in EXCEL format.
Font - This allows the user to set the screen / printer font type and size. Only matching screen and
printer fonts are available
Copy - This option copies the contents of the data form being displayed to the windows
clipboard. You can then paste the copied information into another application, etc.
Toolbar: See APPENDIX T: Tool Bars on page 326 for more information.
134
HURRTRAK & Global Tracker Users Guide 1992-2012, PC Weather Products, Inc.
Watch and Warning Table Tab
Description: This tab displays the latest watch and warning data for the current loaded storm.
Tab Created by: This tab is visible if the data is not more than 6 hours old.
Tab Close Allowed: No, however, this tab can be deselected in General Options
Functions Available:
Menu:
Standard System Menu Functions
Send - Sends current tab’s content as text, html formatted text or via email image as shown on
page 156.
Print:.
Save to Email Outbox – Save text to Email outbox as a PDF file
Print Preview - Previews the printed output on your screen
Direct to Printer - Prints the output directly to the designated printer.
Export to HTML – Exports the output in an HTML format.
Export to PDF – Exports the output to a PDF format.
Export to Text – Exports the output to a comma delimited file.
Export to EXCEL – Exports the output and opens it in EXCEL format.
Font - This allows the user to set the screen / printer font type and size. Only matching screen and
printer fonts are available
Copy - This option copies the contents of the data form being displayed to the windows
clipboard. You can then paste the copied information into another application, etc.
Toolbar: See APPENDIX T: Tool Bars on page 326 for more information.
135
HURRTRAK & Global Tracker Users Guide 1992-2012, PC Weather Products, Inc.
Wind Speed Graph Tab
Description: This tab displays the selected storm's maximum wind speed graph. The unit of measure,
MPH or Knots, is based on the UOM options for wind speed.
Tab Created by: This tab is visible if there is more than one storm observation
Tab Close Allowed: No, however, this tab can be deselected in General Options.
Functions Available:
Menu:
Standard System Menu Functions
Send - Sends current tab’s image as graphic of PDF via email image as shown on page on page 156.
Print - Prints the graph to the windows printer. Print Preview.
Save Image - Saves the image to a BMP file or adds image to Email Outbox.
Toolbar: See APPENDIX T: Tool Bars on page 326 for more information.
TIPS: Pointing and clicking on an observation point will display the date, time and wind data for that point.
136
HURRTRAK & Global Tracker Users Guide 1992-2012, PC Weather Products, Inc.
Central Pressure Graph Tab
Description: This tab displays the selected storm's observed central pressure graph. Each bar represents
an observation point. The unit of measure, millibars or inches, is based on the UOM option for pressure.
Tab Created by: This tab is visible if there is more than one storm observation
Tab Close Allowed: No, however, this tab can be deselected in General Options.
Functions Available:
Menu:
Standard System Menu Functions
Send - Sends current tab’s image as graphic of PDF via email image as shown on page 156..
Print - Prints a black/white image of the graph to the windows printer.
Save Image - Saves the image to a BMP file or adds image to Email Outbox.
Toolbar: See APPENDIX T: Tool Bars on page 326 for more information.
TIPS: Pointing and clicking on an observation point will display the date, time and pressure data for that
point.
137
HURRTRAK & Global Tracker Users Guide 1992-2012, PC Weather Products, Inc.
Location Group Summary Impact Report Tab
Description: This tab displays the forecast or actual impact summary report for the specified location
group. It is generated by examining every location in the group and determining the forecast wind impact to
that location. The report shows the location name, state, maximum sustained wind speed expected,
maximum wind gusts, day/date/time of max sustained wind, closest point of approach (CPA), damage
estimate, forecast 3 day rainfall, and the arrival time, first time, last time and duration of 34, 50 and 64 knot
winds. See National Hurricane Center wind radii considerations on page 308 for more information on the
limitations of forecast wind radii. Locations that have been analyzed using Advanced Wind Estimation are
indicated by their location name in red and in the title of the report, as well as including an additional column
showing the maximum non-AWE wind. See Advanced Wind Estimation in the appendix for more
information.
Tab Created by: Selecting menu item Reports - Location Wind Profile (Forecast or Actual).
Tab Close Allowed: Yes
Functions Available:
Menu:
Standard System Menu Functions
Send - Sends the report via Email either as an HTML or PDF attachment or imbedded text as shown on
page 156.
138
HURRTRAK & Global Tracker Users Guide 1992-2012, PC Weather Products, Inc.
Print
Save to Email Outbox - Saves the report portion to the Email outbox in pdf format.
Print Preview - Previews the printed output on your screen.
Direct to Printer - Prints the output directly to the designated printer.
Export to HTML - Exports the output in an HTML format.
Export to PDF – Exports the output in PDF format.
Export to Text – Exports the output to a comma delimited file.
Export to EXCEL – Exports the output and opens it in EXCEL format.
Export to SHAPE file – Exports the report to a point SHAPE file format. The user will be prompted
to enter the file name to save.
Export report data to Google Earth – Exports the report to a point type KML file and then opens
Google Earth to view this data.
Export report data to Google Earth with hourly details – Exports the report data with hourly
details to a point type KML file and then opens Google Earth to view this data.
Print/Export “Executive Style Report” – The option will either Print, Export to HTML, or save as a
PDF a report which has been reformatted in a non-tabular fashion. See page 174 for an example of
this report.
Font - Allows the user to modify the text font properties for this report.
Copy - Copies the contents of the report to the windows clipboard.
Sort - Allows the user to sort on any column.
Hide Columns - Allows the user to selectively hide certain columns.
Toolbar: See APPENDIX T: Tool Bars on page 326 for more information.
Other:
Display Hourly Details - This is selected by double-clicking on a location (row) or highlighting a row
and selecting the "display hourly details" button. The location’s hourly detail information will then be
displayed on the detailed location hourly report tab, as shown on page 145.
Hide Chart Below – This checkbox will hide the wind speed / direction chart and leave more room for
the report data.
Tips:
- The location report rows are color-coded, based on the maximum wind speed.
- Moving from one row to another will display that locations wind graph information
- Left clicking on the graph will toggle the wind direction plot
- Moving you mouse over a point on the graph will display more information on that observation
139
HURRTRAK & Global Tracker Users Guide 1992-2012, PC Weather Products, Inc.
Sample “Executive Style” Impact Report
This report is generated from the Print/Export option while viewing a location, county or zip code
summary report. It can be emailed, printed, saved as a PDF, or exported to HTML.
140
HURRTRAK & Global Tracker Users Guide 1992-2012, PC Weather Products, Inc.
County Summary Report Tab
Description: This tab displays the forecast or actual impact summary report for the counties specified in
Impact Analysis Option. This report is generated by examining every county location and determining the
wind impact to that location. The report shows the county name, state, maximum wind speed expected,
day/date/time of maximum sustained winds / gusts, closest point of approach (CPA) and the arrival time,
first time, last time and duration of 34, 50 and 64 knot winds. See National Hurricane Center wind radii
considerations for more information on the limitations of forecast wind radii. If advanced wind estimation is
on, it will be indicated in the report header.
Tab Created by: Selecting menu item Reports - County Wind Profile Analysis (Forecast or Actual).
Tab Close Allowed: Yes
Functions Available:
Menu:
Standard System Menu Functions
Send - Sends the report via Email either as an HTML or PDF attachment or imbedded text as shown on
page 156.
Print
Save to Email Outbox - Saves the report portion to the Email outbox in pdf format.
Print Preview - Previews the printed output on your screen.
Direct to Printer - Prints the output directly to the designated printer.
141
HURRTRAK & Global Tracker Users Guide 1992-2012, PC Weather Products, Inc.
Export to HTML - Exports the output in an HTML format.
Export to PDF – Exports the output in PDF format.
Export to Text – Exports the output to a comma delimited file.
Export to EXCEL – Exports the output and opens it in EXCEL format.
Export to SHAPE file – Exports the report to a point SHAPE file format. The user will be prompted
to enter the file name to save.
Export report data to Google Earth – Exports the report to a point type KML file and then opens
Google Earth to view this data.
Export report data to Google Earth with hourly details – Exports the report data with hourly
details to a point type KML file and then opens Google Earth to view this data.
Print/Export “Executive Style Report” – The option will either Print, Export to HTML, or save as a
PDF a report which has been reformatted in a non-tabular fashion. See page 174 for an example of
this report.
Font - Allows the user to modify the text font properties for this report.
Copy - Copies the contents of the report to the windows clipboard.
Sort - Allows the user to sort on any column.
Hide Columns - Allows the user to selectively hide certain columns.
Impact Summary – See page 147.
Thematic Map – See page 153.
Toolbar: See APPENDIX T: Tool Bars on page 326 for more information.
Other:
Display Hourly Details - This is selected by double-clicking on a location (row) or highlighting a row
and selecting the "display hourly details" button. The location’s hourly detail information will then be
displayed on the detailed location hourly report tab, as shown on page 145.
Hide Chart Below – This checkbox will hide the wind speed / direction chart and leave more room for
the report data.
Tips:
- The location report rows are color-coded, based on the maximum wind speed.
- Moving from one row to another will display that locations wind graph information
- Left clicking on the graph will toggle the wind direction plot
- Moving you mouse over a point on the graph will display more information on that observation
142
HURRTRAK & Global Tracker Users Guide 1992-2012, PC Weather Products, Inc.
Zip Code Summary Report Tab
Description: This tab displays the forecast or actual impact summary report for the zip codes specified in
Impact Analysis Option. This report is generated by examining every zip code and determining the wind
impact to that area. The report shows the zip code, city name, state, maximum wind speed expected,
day/date/time of maximum sustained winds / gusts, closest point of approach (CPA) and the arrival time,
first time, last time and duration of 34, 50 and 64 knot winds. See NHC wind radii considerations for more
information on the limitations of forecast wind radii. The zip codes that are examined are determined by the
settings in Impact Analysis Options. If advanced wind estimation (AWE) is on, it will be indicated in the
report header.
Tab Created by: Selecting menu item Reports - Zip Code Wind Profile Analysis (Forecast or Actual).
Tab Close Allowed: Yes
Functions Available:
Menu:
Standard System Menu Functions
Send - Sends the report via Email either as an HTML or PDF attachment or imbedded text as shown on
page 156.
Print
Save to Email Outbox - Saves the report portion to the Email outbox in pdf format.
143
HURRTRAK & Global Tracker Users Guide 1992-2012, PC Weather Products, Inc.
Print Preview - Previews the printed output on your screen.
Direct to Printer - Prints the output directly to the designated printer.
Export to HTML - Exports the output in an HTML format.
Export to PDF – Exports the output in PDF format.
Export to Text – Exports the output to a comma delimited file.
Export to EXCEL – Exports the output and opens it in EXCEL format.
Export to SHAPE file – Exports the report to a point SHAPE file format. The user will be prompted
to enter the file name to save.
Export report data to Google Earth – Exports the report to a point type KML file and then opens
Google Earth to view this data.
Export report data to Google Earth with hourly details – Exports the report data with hourly
details to a point type KML file and then opens Google Earth to view this data.
Print/Export “Executive Style Report” – The option will either Print, Export to HTML, or save as a
PDF a report which has been reformatted in a non-tabular fashion. See page 174 for an example of
this report.
Font - Allows the user to modify the text font properties for this report.
Copy - Copies the contents of the report to the windows clipboard.
Sort - Allows the user to sort on any column.
Hide Columns - Allows the user to selectively hide certain columns.
Impact Summary – See page 147.
Thematic Map – See page 153.
Toolbar: See APPENDIX T: Tool Bars on page 326 for more information.
Other:
Display Hourly Details - This is selected by double-clicking on a location (row) or highlighting a row
and selecting the "display hourly details" button. The location’s hourly detail information will then be
displayed on the detailed location hourly report tab, as shown on page 145.
Hide Chart Below – This checkbox will hide the wind speed / direction chart and leave more room for
the report data.
Tips:
- The location report rows are color-coded, based on the maximum wind speed.
- Moving from one row to another will display that locations wind graph information
- Left clicking on the graph will toggle the wind direction plot
- Moving you mouse over a point on the graph will display more information on that observation
144
HURRTRAK & Global Tracker Users Guide 1992-2012, PC Weather Products, Inc.
Detailed Location/County/Zip Hourly Report Tab
Description: This tab displays half-hourly detail report for locations, counties and zip codes.
When a location, county or zip code is selected, the system examines the actual storm
characteristics for every hour of the storm's life, making a determination of how this location was
affected at each hour. The result is a report indicating the sustained wind speed/gusts and wind
direction conditions for this location throughout the period, along with any other pertinent
information, such as astronomical tide height, cross wind values, distance from 34, 50, 64 knot
wind areas and distance from center. The last column indicates whether the location was affected
by the eye and/or eye wall. In addition, if the cross wind flow angle has been set for this location,
the cross wind component is included. If advanced wind estimation (AWE) is on, it will be
indicated in the report header.
Tab Created by: Selecting Display Hourly Details from the Location Group, County or Zip Code summary
report.
Tab Close Allowed: Yes
Functions Available:
Menu:
Standard System Menu Functions
Send - Sends the report via Email either as an HTML attachment or imbedded text as shown on page
156.
145
HURRTRAK & Global Tracker Users Guide 1992-2012, PC Weather Products, Inc.
Print
Save to Email Outbox - Saves the report to the Email outbox in pdf format.
Print Preview - Previews the printed output on your screen.
Direct to Printer - Prints the output directly to the designated printer.
Export to HTML - Exports the output in an HTML format.
Export to PDF – Exports the output in PDF format.
Export to Text – Exports the output to a comma delimited file.
Export to EXCEL – Exports the output and opens it in EXCEL format.
Font - Allows the user to modify the text font properties for this report.
Copy - Copies the contents of the report to the windows clipboard.
Graph
Graph Wind Profile – Displays a wind speed graph for the analyzed location (see page 151).
Graph Flood Profile (1 or 3 hour total) – Displays a flood index graph for the analyzed location.
See page 152.
Toolbar: See APPENDIX T: Tool Bars on page 326 for more information.
Tips:
-
The report rows are color-coded, based on the wind speed for that time.
Damage estimates are located in the comments column (last).
Action points are shown in the next to last column is active
Cross Wind Component is included if the cross wind has been defined for this location.
146
HURRTRAK & Global Tracker Users Guide 1992-2012, PC Weather Products, Inc.
County/Zip Impact Analysis Report Tab
Description: This report is generated by examining every county's or zip code's forecast
maximum wind speed and tallies the total population and number of households (county only) that
are expected to be affected by a user-defined level of wind. The wind thresholds used in this
report are set in the Impact Analysis Option. In addition to population and households(county
only), this report will also total the optional user-defined fields. Up to 10 user-defined fields can be
established (3 in EM/Pro) within the System Setup program.
Tab Created by: Selecting Impact Analysis from the County or Zip Code Summary Reports.
Tab Close Allowed: Yes
Functions Available:
Menu:
Standard System Menu Functions
Send - Sends the report via Email either as an HTML attachment, PDF, or imbedded text as shown on
page 156.
Print
Save to Email Outbox – Saves report in PDF format to Email outbox.
Print Preview - Previews the printed output on your screen.
Direct to Printer - Prints the output directly to the designated printer.
Export to HTML - Exports the output in an HTML format.
Export to PDF – Exports the output in PDF format.
Export to Text – Exports the output to a comma delimited file.
Export to EXCEL – Exports the output and opens it in EXCEL format.
Font - Allows the user to modify the text font properties for this report.
Copy - Copies the contents of the report to the windows clipboard.
Toolbar: See APPENDIX T: Tool Bars on page 326 for more information.
Tips: The wind thresholds used in this report are set in the Impact Analysis Option.
147
HURRTRAK & Global Tracker Users Guide 1992-2012, PC Weather Products, Inc.
Strike Probability Report Tab
Description: This tab displays a report showing each location and its total, next 24 hours, 24-36
hour period, 36-48 hour period and 48-72 hour period strike probabilities.
Tab Created by: Selecting menu item Reports - Location Strike Probabilities.
Tab Close Allowed: Yes
Functions Available:
Menu:
Standard System Menu Functions
Send - Sends the report via Email either as an HTML attachment, PDF, or imbedded text as shown on
page 156.
Print
Save to Email Outbox – Saves report in PDF format to Email Outbox
Print Preview - Previews the printed output on your screen.
Direct to Printer - Prints the output directly to the designated printer.
Export to HTML - Exports the output in an HTML format.
Export to PDF – Exports the output in PDF format.
Export to Text – Exports the output to a comma delimited file.
Export to EXCEL – Exports the output and opens it in EXCEL format.
Export report data to Google Earth – Exports the report to a point type KML file and then opens
Google Earth to view this data.
Font - Allows the user to modify the text font properties for this report.
Copy - Copies the contents of the report to the windows clipboard.
Sort – Allows the user to sort on any column.
Toolbar: See APPENDIX T: Tool Bars on page 326 for more information.
Tips: NHC no longer uses Strike Probabilities and it will likely be phased out in this system.
148
HURRTRAK & Global Tracker Users Guide 1992-2012, PC Weather Products, Inc.
Wind Probability Report Tab
Description: This tab displays a report showing each location and its total 34 knot, 50 knot and
64 knot wind probabilities.
Tab Created by: Selecting menu item Reports - Location Strike Probabilities.
Tab Close Allowed: Yes
Functions Available:
Menu:
Standard System Menu Functions
Send - Sends the report via Email either as an HTML attachment, PDF, or imbedded text as shown on
page 156.
Print
Save to Email Outbox – Saves report in PDF format to Email Outbox
Print Preview - Previews the printed output on your screen
Direct to Printer - Prints the output directly to the designated printer.
Export to HTML - Exports the output in an HTML format.
Export to PDF – Exports the output in PDF format.
Export to Text – Exports the output to a comma delimited file.
Export to EXCEL – Exports the output and opens it in EXCEL format.
Export report data to Google Earth – Exports the report to a point type KML file and then opens
Google Earth to view this data.
Font - Allows the user to modify the text font properties for this report.
Copy - Copies the contents of the report to the windows clipboard.
Sort – Allows the user to sort on any column.
Toolbar: See APPENDIX T: Tool Bars on page 326 for more information.
149
HURRTRAK & Global Tracker Users Guide 1992-2012, PC Weather Products, Inc.
Surge Probability Report Tab
Description: This tab displays a report showing each location and the probability of a storm surge
from 2’ to 25’ in 2’ increments. It also shows the relative position to the reported location that this
surge value is valid for.
Tab Created by: Selecting menu item Reports - Location Surge Probabilities.
Tab Close Allowed: Yes
Functions Available:
Menu:
Standard System Menu Functions
Send - Sends the report via Email either as an HTML attachment, PDF, or imbedded text as shown on
page 156.
Print
Save to Email Outbox – Saves report in PDF format to Email Outbox
Print Preview - Previews the printed output on your screen
Direct to Printer - Prints the output directly to the designated printer.
Export to HTML - Exports the output in an HTML format.
Export to PDF – Exports the output in PDF format.
Export to Text – Exports the output to a comma delimited file.
Export to EXCEL – Exports the output and opens it in EXCEL format.
Export report data to Google Earth – Exports the report to a point type KML file and then opens
Google Earth to view this data.
Font - Allows the user to modify the text font properties for this report.
Copy - Copies the contents of the report to the windows clipboard.
Sort – Allows the user to sort on any column.
Toolbar: See APPENDIX T: Tool Bars on page 326 for more information.
150
HURRTRAK & Global Tracker Users Guide 1992-2012, PC Weather Products, Inc.
Detailed Location/County/Zip Wind Graph Tab
Description: This tab graphically displays the wind speed profile for the analyzed location when
performing a location analysis. Wind speeds are not calculated until the location falls within the
area of gale force winds. This is indicated by the sharp increase and decrease in winds on both
sides of the curve
Tab Created by: Selecting Graph - Wind Profile from the Location/County/Zip Detail report tab.
Tab Close Allowed: Yes
Functions Available:
Menu:
Standard System Menu Functions
Send - Sends current tab’s image via email image or PDF as shown on page 156.
.
Print - Prints the graph to the windows printer. (Print preview)
Save Image - Saves the image to a file or to Email Outbox.
Toolbar: See APPENDIX T: Tool Bars on page 326 for more information
TIPS:
-
Pointing and clicking on an observation point will display the date, time and wind data for that
observation.
Left clicking on the chart will toggle the Wind direction plot.
151
HURRTRAK & Global Tracker Users Guide 1992-2012, PC Weather Products, Inc.
Detailed Location/County/Zip Flood Index Graph Tab
Description: This tab graphically displays the flood index profile for the analyzed location when
performing a location analysis (provided that location has had its onshore wind flow angle
defined). The flood index is not calculated until the location falls within the area of gale force
winds. If 1-hour is selected, then this represents the flood index for that hour. If 3-hour is
selected, then the value represents a 3 hour cumulative total.
Tab Created by: Selecting Graph - Flood Profile from the Location/County/Zip Detail report tab.
Tab Close Allowed: Yes
Functions Available:
Menu:
Standard System Menu Functions
Send - Sends current tab’s image via email image as shown on page 156.
Print - Prints the graph to the windows printer. (Print Preview)
Save Image - Saves the image to a file or to Email Outbox.
Toolbar: See APPENDIX T: Tool Bars on page 326 for more information
Tips:
- Pointing and clicking on an observation point will display the date, time and wind data for that point..
- Flood index calculations are not possible unless the location's flood direction has been identified in
system setup - location maintenance.
152
HURRTRAK & Global Tracker Users Guide 1992-2012, PC Weather Products, Inc.
County/Zip Wind Thematic Tab
Description: This tab depicts the forecast or actual wind speeds in a county or zip code thematic
type format. The colors used are controlled within the plotting options.
Tab Created by: Selecting the Thematic Map option from the County or Zip Code Summary Report tab.
Tab Close Allowed: Yes
Functions Available:
Menu:
Standard System Menu Functions
Send - Sends current tab’s image via graphics or pdf via email image as shown on page 156..
Display - For a complete list of display options, see page 164.
Annotate – Allows the user to place text on the current image.
Print/Export – Allows the user to print the current image in color, gray scale, or B&W.. or send the
image to Google Earth. See page 306 for more information on the Google Earth interface.
Save Image – Saves the image to the clipboard, PDF, Image file or to Email Outbox.
Toolbar: See APPENDIX T: Tool Bars on page 326 for more information
Tip: You can pan and zoom this map image by right clicking on the image.
153
HURRTRAK & Global Tracker Users Guide 1992-2012, PC Weather Products, Inc.
Miscellaneous Options in support of Tab Functions
The functions described below are utilized by the Information Tab Functions.
Email Outbox
The email outbox is a way for the user to select a group of Hurrtrak “outputs” and send them via email. All
outputs are supported from graphics, text, tabular data and reports.
To add items to the Email Outbox… while viewing Hurrtrak information, simply select the “Add to Email
Outbox” menu item or easier yet, select the Add to Email Outbox toolbar button.
When you have added a number of items to the outbox, you can then select the “View Email Outbox”
option... again best done via the toolbar button.
This will display a window which shows all of the contents of the outbox, as well as options to Delete any of
the items, and Email the Outbox contents.
When selecting the Email option, the user will be presented with the following screen allowing them to add
the Email subject, text and recipients.
154
HURRTRAK & Global Tracker Users Guide 1992-2012, PC Weather Products, Inc.
The Email outbox “spans” application modules... meaning if you add items to the outbox in the SloshView
module, the Model Forecast module… and others, you are able to email them all as a group from any of
those modules or the Hurricane Tracking application... i.e. mixing many types of output, all in 1 email.
155
HURRTRAK & Global Tracker Users Guide 1992-2012, PC Weather Products, Inc.
Send Email
This option allows the user to send graphics and/or text to a user or group of users. This screen
is displayed when a user makes a send request when viewing a graphic (tracking chart) or text
report data. See APPENDIX D: Email setup and capabilities on page 276 for more information
on Email capabilities.
The data fields are:
Subject - The information you would like to appear in the subject line of the email note. It defaults to
the current storm name, but can be overwritten.
Comments - The text portion of the email note.
Include Latest Advisories - The user may choose to attach the latest Public Advisory, Forecast
Advisory, Forecast Discussion, or Strike Probability.
Recipients - Select the users or group of users that you would like to send, CC or BCC the email to.
Commands available:
Exit - Exits without sending.
Save – Saves Email to the MS Outlook “drafts” folder. This allows the user to later edit the email before
sending. This is only available when choosing the MS Outlook option.
Send - Sends Email to the designated recipients. When the email is being sent, a confirmation window is
displayed in the lower right of the user’s screen display.
156
HURRTRAK & Global Tracker Users Guide 1992-2012, PC Weather Products, Inc.
Tracking Chart Display Options
While these menu options are available... for a subset of these we suggest you utilize the command
bar icons as they utilize a "data layering" capability. See page 326 for more information.
DISPLAY:
Locations - Displays all of the locations in the selected location group. The text properties used for
displaying the location names is set in font options. The user can optionally display the distance of
a location from the center of the storm or just plot the locations “point”. The unit of measure used
for distance, as well as the font size and color of locations, is set in the unit of measure options.
County Names - Displays all of the county names for the counties visible on the current chart. The text
properties used for printing the county names is set in font options
Latitude/ Longitude - Displays latitude and longitude grid along the sides and top of the tracking
chart. The text properties of these values are set in font options.
Chart Notes - Displays storm observation information (date, time, wind, pressure) next to the
observation points. If the points are close together, some chart notes will not plot to prevent
overwriting. The text properties of chart notes are set in font options. See APPENDIX OO:
Interactive Chart Notes on page 309 for more information on an alternative method of displaying
chart notes.
Wind Field - Displays a pattern of wind arrows that indicate the likely wind speed and direction at that
point. You may also "force" a wind arrow plot by clicking the left mouse button while over a point on
the chart. Wind field arrows are only shown for areas that fall within the radius of 34, 50 and 64
knot winds. The size, density, color of the arrows, as well as the text properties of the wind value,
are set in Options.
Wind Pattern – The wind pattern, different from the wind field, is a continuous color-shaded image that
better represents the estimated wind speed across a region. When using AWE, the wind pattern
shows the effects of surface friction on the wind speeds around a tropical cyclone. See APPENDIX
QA: Advanced Wind Estimation Considerations on page 319 for more information on the Wind
Pattern image.
Watch and Warning Areas - If available, this displays the areas of hurricane and tropical storm
watches and warnings. The width of the warning color is twice as wide as the width of the watch
color. The color and size of these areas are set in plotting options
Decision Arc - When this option is selected, a popup input area is displayed which allows the user to
select the action point and override the current storm's forecasted speed and intensity before
displaying the decision arc. For more information on this topic, see Decision Support Capabilities
Range Rings - This option displays range rings (circles of equal distance) centered at the base location
or storm center, as defined in general options. The color of the circle is determined by the color of
the decision arc.
Wind Bands - This option displays the observed and/or forecast coverage of the areas of 3 wind
fields. The system defaults to 34 knot, 50 knot and 64 knot wind bands, however, it can be
modified in the wind band options.
Strike Probability Analysis - Displays, on a separate chart (but using the same map), a grid of strike
probability values, as well as a contour analysis of the strike probabilities. The text properties used
to display the values, as well as the color and density of the contour analysis, is set in strike
probability options. You can choose to display the total strike probability analysis, or the next 24
hours only, or the period from 24-36 hours only, 36-48 hours only, or 48-72 hours only.
Strike Probabilities Location Values - Displays strike probabilities for a location group on the tracking
chart being viewed. The text properties used for displaying these values can be set in font options.
157
HURRTRAK & Global Tracker Users Guide 1992-2012, PC Weather Products, Inc.
Wind Probability Analysis - Displays, on a separate chart (but using the same map), a grid of wind
probability values as well as a contour analysis of the probabilities. The text properties used to
display the values, as well as the color and density of the contour analysis, is set in strike
probability options. You can choose to display the 34, 50 or 64 knot total wind probabilities.
Wind Probabilities Location Values - Displays wind probabilities for a location group on the tracking
chart being viewed. The text properties used for displaying these values can be set in font options.
3D Wind Surface - Using the current tracking chart as the x-y graphing area, this option display a 3dimensional wind surface graph. The density of the graph is set in general options.
Surge Probabilities – Displays the selected (footage) surge probability on the current tracking chart.
When selected, the available surge levels are displayed… thus allowing the user to select one of
the levels. i.e. Display Surge probability for a 8 foot storm surge. The percentages at selected
locations are also displayed on the map. See page 297 for more information.
Flood Index - Displays the flood index on the current tracking chart. The sub-options are:
Current - Displays the flood index for the current (as indicated on tracking chart) observation. This
analysis should only be done when the storm is currently affecting an area.
Forecast - Displays the flood index for either the next 1, 2, or 3 hours or the maximum forecast
flood index for a 1, 2, or 3-hour period. This analysis should only be done when a storm is forecast
to affect an area.
Actual - Displays the maximum "observed" flood index for a 1, 2, or 3-hour cumulative period. This
analysis should only be done when the storm has already affected an area.
The text properties used to display the values, as well as the color and width of the flood analysis, is set
in flood index options. For more information on this topic see page 290.
Forecast Rainfall Analysis - This option displays the latest rainfall forecast in a graphical
manner. The option is only active if the system has recently downloaded rainfall forecast
information from the HURRTRAK ONLINE system. For more information on this, see HURRTRAK
Rainfall Forecast capabilities on page 304.
Forecast Rainfall Thematic - This option displays the latest rainfall forecast in a county thematic
manner. The option is only active if the system has recently downloaded rainfall forecast
information from the HURRTRAK ONLINE system.
Wind Pattern Legend - Display the wind / color legend for the Wind Pattern Display image.
Watch and Warning Legend - Displays the legend for the NHC watch and warning areas indicating
the type of watch and warning and the color used to depict it.
Surge Probability Legend - Displays the color-coded surge probability legend.
Flood Legend - Displays the color-coded flood index legend.
Track Color Legend - Displays the color-coded track legend.
Forecast Error Legend – Displays the color coded forecast error legend.
Wind Field Legend – Displays the color coded legend for wind radii.
158
HURRTRAK & Global Tracker Users Guide 1992-2012, PC Weather Products, Inc.
Chart Plot options
While these menu options are available... for a subset of these we suggest you utilize the command
bar icons as they utilize a "data layering" capability. See page 326 for more information.
PLOT:
Track - Re-plots the current storm's track with wind field circles. The wind field circle color is set in
plotting options.
"What If" Forecast - Displays the projected "what if" track. This option can only be selected if the
"what if" has been enabled in the Setup What If Scenario Option. The color of the track is set in
plotting options. For a complete discussion of this and other items, see Decision Support
Capabilities.
Official Forecast - Displays the storm's selected forecast track. The color of the track is set in plotting
options. The sub options include plotting the forecast with average error which displays the storm's
selected forecast track along with the area of average forecast error through 72 and/or 120 hours
OR the user can select to display ONLY the average error area. . For the Atlantic, the NHC
publishes yearly their average error for the 12, 24, 36, 48, 72, 96 and 120 hours verification
times. These values can be adjusted in the System Setup component of the system. The color of
the areas as well as whether to plot the 72 and/or 120 hour forecast can be set in plotting options.
For plotting prior forecast tracks we recommend the method described on page 170.
Hurricane Model Forecast - Displays a “window” that shows all of the available forecast models. The
list is based on your settings in the User Options (plotting-Tab 1). The user simply selects or deselects the models they want to display… and when done, closes the “window”. By Selecting the
"Max's favorite models", a small subset of the available models will be display. Yes these are Max
Mayfield's favorites.
The color of the model tracks are also set in the plotting user options. For more information on
model forecast, see hurricane forecast models on page 305.
Climatology Forecast - Displays the storm's selected climatological forecast track. Selecting "latest"
forces the system to calculate the forecast before displaying it. This is a much more convenient
method than having to first use the Edit - Climatology Forecast function. The color of the forecast
track is set in plotting options.
159
HURRTRAK & Global Tracker Users Guide 1992-2012, PC Weather Products, Inc.
Wind Band Display Options
While these menu options are available... for a subset of these we suggest you utilize the command
bar icons as they utilize a "data layering" capability. See page 326 for more information.
DISPLAY:
Locations - Displays all of the locations in the selected location group. The text properties used for
displaying the location names is set in font options. The user can optionally display the distance of
a location from the center of the storm or just plot the locations “point”. The unit of measure used
for distance, as well as the font size and color of locations, is set in the unit of measure options.
County Names - Displays all of the county names for the counties visible on the current chart. The text
properties used for printing the county names is set in font options
Latitude/ Longitude - Displays latitude and longitude grid along the sides and top of the tracking
chart. The text properties of these values are set in font options.
Chart Notes - Displays storm observation information (date, time, wind, pressure) next to the
observation points. If the points are close together, some chart notes will not plot to prevent
overwriting. The text properties of chart notes are set in font options. See APPENDIX OO:
Interactive Chart Notes on page 309 for more information on an alternative method of displaying
chart notes.
Wind Field - Displays a pattern of wind arrows that indicate the likely wind speed and direction at that
point. You may also "force" a wind arrow plot by clicking the left mouse button while over a point on
the chart. Wind field arrows are only shown for areas that fall within the radius of 34, 50 and 64
knot winds. The size, density, color of the arrows, as well as the text properties of the wind value,
are set in Options.
Watch and Warning Areas - If available, this displays the areas of hurricane and tropical storm
watches and warnings. The width of the warning color is twice as wide as the width of the watch
color. The color and size of these areas are set in plotting options
Decision Arc - When this option is selected, a popup input area is displayed which allows the user to
select the action point and override the current storm's forecasted speed and intensity before
displaying the decision arc. For more information on this topic, see Decision Support Capabilities
Range Rings - This option displays range rings (circles of equal distance) centered at the base location
or storm location, as defined in general options. The color of the circle is determined by the color of
the decision arc.
Strike Probability Analysis - Displays, on a separate chart (but using the same map), a grid of strike
probability values, as well as a contour analysis of the strike probabilities. The text properties used
to display the values, as well as the color and density of the contour analysis, are set in strike
probability options. You can choose to display the total strike probability analysis, or the next 24
hours only, or the period from 24-36 hours only, 36-48 hours only, or 48-72 hours only.
Strike Probabilities Location Values - Displays strike probabilities for a location group on the tracking
chart being viewed. The text properties used for displaying these values can be set in font options.
Wind Probability Analysis - Displays, on a separate chart (but using the same map), a grid of wind
probability values, as well as a contour analysis of the probabilities. The text properties used to
display the values, as well as the color and density of the contour analysis, is set in strike
probability options. You can choose to display the 34, 50 or 64 knot total wind probabilities.
Wind Probabilities Location Values - Displays wind probabilities for a location group on the tracking
chart being viewed. The text properties used for displaying these values can be set in font options.
160
HURRTRAK & Global Tracker Users Guide 1992-2012, PC Weather Products, Inc.
Surge Probabilities – Displays the selected (footage) surge probability on the current tracking chart.
When selected, the available surge levels are displayed… thus allowing the user to select one of
the levels. i.e. Display Surge probability for a 8 foot storm surge. The percentages at selected
locations are also displayed on the map. See page 297 for more information.
Flood Index - Displays the flood index on the current tracking chart. The sub-options are:
Current - Displays the flood index for the current (as indicated on tracking chart) observation. This
analysis should only be done when the storm is currently affecting an area.
Forecast - Displays the flood index for either the next 1, 2, or 3 hours or the maximum forecast
flood index for a 1, 2, or 3-hour period. This analysis should only be done when a storm is forecast
to affect an area.
Actual - Displays the maximum "observed" flood index for a 1, 2, or 3-hour cumulative period. This
analysis should only be done when the storm has already affected an area.
The text properties used to display the values, as well as the color and width of the flood analysis, are
set in flood index options. For more information on this topic, see page 290.
Wind Band Legend - Displays the wind level and color legend for the wind pattern display image.
Wind Band Legend - Displays a legend showing the wind speeds analyzed and associated plot
colors. The colors and wind speeds are set in wind band options. Does not apply with a QUICK
TAU plot.
Sea Height Legend - Displays a legend showing the likely sea heights and associated plot colors. This
only applies over open ocean/sea areas. Does not apply with a QUICK TAU plot.
Watch and Warning Legend - Displays the legend for the NHC watch and warning areas indicating
the type of watch and warning and the color used to depict it.
Surge Probability Legend - Displays the color-coded surge probability legend.
Flood Legend - Displays the color-coded flood index legend.
Track Color Legend - Displays the color-coded track legend.
Forecast Error Legend – Displays the color coded forecast error legend.
Wind Field Legend – Displays the color coded legend for wind radii.
161
HURRTRAK & Global Tracker Users Guide 1992-2012, PC Weather Products, Inc.
Strike/Wind Probability Tab Display Options
While these menu options are available... for a subset of these we suggest you utilize the command
bar icons as they utilize a "data layering" capability. See page 326 for more information.
DISPLAY:
Locations - Displays all of the locations in the selected location group. The text properties used for
displaying the location names is set in font options. The user can optionally display the distance of
a location from the center of the storm or just plot the locations “point”. The unit of measure used
for distance, as well as the font size and color of locations, is set in the unit of measure options.
County Names - Displays all of the county names for the counties visible on the current chart. The text
properties used for printing the county names are set in font options
Latitude/ Longitude - Displays latitude and longitude grid along the sides and top of the tracking
chart. The text properties of these values are set in font options.
Chart Notes - Displays storm observation information (date, time, wind, pressure) next to the
observation points. If the points are close together, some chart notes will not plot to prevent
overwriting. The text properties of chart notes are set in font options. See APPENDIX OO:
Interactive Chart Notes on page 309 for more information on an alternative method of displaying
chart notes.
Watch and Warning Areas - If available, this displays the areas of hurricane and tropical storm
watches and warnings. The width of the warning color is twice as wide as the width of the watch
color. The color and size of these areas are set in plotting options
Decision Arc - When this option is selected, a popup input area is displayed which allows the user to
select the action point and override the current storm's forecasted speed and intensity before
displaying the decision arc. For more information on this topic, see Decision Support Capabilities
Range Rings - This option displays range rings (circles of equal distance) centered at the base location
or storm center as defined in general options. The color of the circle is determined by the color of
the decision arc.
Strike Probabilities Location Values - Displays strike probabilities for a location group on the tracking
chart being viewed.
Wind Probabilities Location Values - Displays wind probabilities for a location group on the tracking
chart being viewed.
Surge Probabilities – Displays the selected (footage) surge probability on the current tracking chart.
When selected, the available surge levels are displayed… thus allowing the user to select one of
the levels. i.e. Display Surge probability for a 8 foot storm surge. The percentages at selected
locations are also displayed on the map. See page 297 for more information.
Watch and Warning Legend - Displays the legend for the NHC watch and warning areas indicating
the type of watch and warning and the color used to depict it.
Flood/Surge Probability Legend - Displays the legend for the flood or storm surge probability colors.
Track Color Legend - Displays the color-coded track legend.
Forecast Error Legend – Displays the color coded forecast error legend.
Wind Field Legend – Displays the color coded legend for wind radii.
162
HURRTRAK & Global Tracker Users Guide 1992-2012, PC Weather Products, Inc.
Strike/Wind Probability Tab Plot Options
While these menu options are available... for a subset of these we suggest you utilize the command
bar icons as they utilize a "data layering" capability. See page 326 for more information.
PLOT:
Replot Probabilities - This option replots the strike or wind probability contours and values.
Track - Replots the current storm's track with wind field circles. The wind field circle color is set in
plotting options.
"What If" Forecast - Displays the projected "what if" track. This option can only be selected if the "what
if" has been enabled in the Setup What If Scenario Option. The color of the track is set in plotting
options. For a complete discussion of this and other items, see Decision Support Capabilities.
Official Forecast - Displays the storm's selected forecast track. The color of the track is set in plotting
options. The sub options include plotting the forecast with average error which displays the storm's
selected forecast track along with the area of average forecast error through 72 and/or 120 hours
OR the user can select to display ONLY the average error area. . For the Atlantic, the NHC
publishes yearly their average error for the 12, 24, 36, 48, 72, 96 and 120 hours verification
times. The color of the areas as well as whether to plot the 72 and/or 120 hour forecast can be set
in plotting options.
For plotting prior forecast tracks we recommend the method described on page 170.
Hurricane Model Forecast - Displays a “window” that shows all of the available forecast models. The
list is based on your settings in the User Options (plotting-Tab 1). The user simply selects or deselects the models they want to display… and when done, closes the “window”. By Selecting the
"Max's favorite models", a small subset of the available models will be display. Yes these are Max
Mayfield's favorites.
The color of the model tracks are also set in the plotting user options. For more information on
model forecast, see hurricane forecast models on page 305.
Climatology Forecast - Displays the storm's selected climatological forecast track. Selecting "latest"
forces the system to calculate the forecast before displaying it. This is a much more convenient
method than having to first use the Edit - Climatology Forecast function. The color of the forecast
track is set in plotting options.
Past Storm track(s) - Allows the user to select and plot any past storm(s) from the history database.
163
HURRTRAK & Global Tracker Users Guide 1992-2012, PC Weather Products, Inc.
Thematic Tab Display Options
DISPLAY:
County Names - Plots the names of all of the counties on the map.
County Values - Plots the wind or rainfall values for all of the counties on the map.
County names and values - Plots both the county name and the wind or rainfall values for all of the
counties on the map.
Clear - Clears the names and values from the map.
164
HURRTRAK & Global Tracker Users Guide 1992-2012, PC Weather Products, Inc.
Decision Arc Pop-up Input Example
Figure 4
At this point, the user can select the action point and override the storm's forecast speed and intensity.
When OK is selected, the decision arc is plotted. Look at the next image to see an example of a decision
arc.
Decision Arc Example
Figure 5
This chart displays the decision arc based on the information provided in the decision arc input screen. For
more information on this topic, see page 268.
165
HURRTRAK & Global Tracker Users Guide 1992-2012, PC Weather Products, Inc.
Annotate Chart
Figure 6
This option allows the user to add comments, etc. directly onto the tracking chart image. When Annotate is
selected, any time the mouse button is pressed, the user notes entry screen, shown above, is displayed.
The text that is entered will appear at the position where the mouse button was pressed. The size, color
and other font properties used for the user notes are set in user preferences. Selecting End Annotate will
return the mouse button function to its original function.
The next image is an example of an annotated chart.
166
HURRTRAK & Global Tracker Users Guide 1992-2012, PC Weather Products, Inc.
Print/Export Options (Graphics)
Color - Prints the current image in color.
Gray Scale - Prints the current in pre-determined gray scale.
Fax - Prints the current image after automatically modifying the image to “line art" as shown
below. All colors are changed to black, while the Ocean and Land areas are set to
white. (Not available for H*Wind, Wind Band and Thematic Maps).
Export to Google Earth - Exports the displayed image to Google-Earth.
Sample Fax Print Image
Figure 7
167
HURRTRAK & Global Tracker Users Guide 1992-2012, PC Weather Products, Inc.
Print/Export Options (Reports/Text)
The report print option has several capabilities.
Print Preview - Previews the printed output on your screen. After which the user can
review or print the output.
Direct to Printer - Prints the output directly to the designated printer.
Export to HTML - This option allows the user to export certain text reports and data to an HTML
format. When this option is selected, a file dialog box is displayed requesting the name of the
HTML file the user would like to create.
Special HTML Considerations: The size of the HTML files created can be very large. Avoid
creating HTML for lengthy reports and mainly use this on smaller reports and text data.
Special License Agreement Considerations: Although we provide the ability to create
"Internet ready" HTML, the standard software license agreement still prohibits the use
of any of the system's output on the Internet without prior approval of PC Weather
Products, Inc. The output may be used, however, on internal Intranet sites, since that
stays within the provisions of the license agreement.
Export to PDF file - This option allows the user to export certain text reports and data to an Adobe
Acrobat PDF format. PDF files have become a standard in sharing reports, as they maintain their
intended formatting when viewed by the recipient. When this option is selected, a file dialog box is
displayed requesting the name of the HTML file the user would like to create.
Export to Text Delimited - This option allows the user to export certain text reports and data to a
comma-delimited format. This data file will then easily import into many database and spreadsheet
applications. When this option is selected, a file dialog box is displayed requesting the name of the
file the user would like to create.
Special Export Considerations: The first line of the exported data file contains the field names of the
subsequent data. Some applications will accept this first line of data as the name of the database
field.
Export to EXCEL - This option allows the user to export certain text reports and data to Microsoft
EXCEL for further analysis. EXCEL™ must be installed on the user’s system for this to work.
Export to GOOGLE EARTH - For summary impact reports only. This exports the contents of the
summary report to a Google Earth “native” KML file. This allows the user to view the report
information on the GE interface.
Print/Export “Executive style report” – For summary impact reports only. This option will either
Print, Export to HTML, or save as a PDF, a report which has been reformatted in a non-tabular
fashion. See the Appendix for an example of this report.
168
HURRTRAK & Global Tracker Users Guide 1992-2012, PC Weather Products, Inc.
Save Image Options
Copy to Clipboard - Copies the current image to the windows clipboard for pasting into most graphics
applications.
Save to File - Saves the current image to a GIF, BMP, PCX, TIF or JPG file. Most all windows
graphics and word processing applications accept BMP files.
Save fax image to File - Saves the current image to a GIF, BMP, PCX, TIF, or JPG file after
automatically modifying the image to "line art". All colors are changed to black, while the Ocean
and Land areas are set to white.
Save to PDF File - Saves the current image to an Adobe Acrobat PDF format. PDF files have
become a standard in sharing reports, as they maintain their intended formatting when viewed by
the recipient.
Save to Email Outbox - Saves the current image to the Email Outbox. See page 154 for more
information on this function.
Save to Animated GIF - (Animation only) - If saving an animation, this option saves the current
animation to an animated GIF file. Animated GIF's can be viewed with Internet Explorer, as well as
some other software.
169
HURRTRAK & Global Tracker Users Guide 1992-2012, PC Weather Products, Inc.
Additional Toolbar Options:
Prior Forecast – While viewing most tracking charts, the user can easily display prior forecast tracks
for the storm by selecting the command bar icon (highlighted) shown below.
This will bring up a menu whereby you can then select / deselect the prior forecast tracks
you would like to display.
Chart Display "options"
MousePointer - While viewing a tracking chart, the user can display cursor positional information by
selecting any (or all) of the following items:
Show Wind / Wind Forecast Value – When in the default mode, it displays the likely wind speed
values at that location. When the user toggles the toolbar button to “Show Forecast winds”, this will
show the forecast sustained wind and gust for that location. The toolbar icon is located on the
primary toolbar.
- In this mode, the mouse will display the wind speed at that point, at
the current time.
170
HURRTRAK & Global Tracker Users Guide 1992-2012, PC Weather Products, Inc.
- In this mode, the mouse will display the forecast wind speeds
(sustained and gusts).
Show Distance to Center - Displays the distance to the center of the storm from that location.
Show Latitude - Displays the latitude of the cursor position.
Show Longitude - Display the longitude of the cursor position.
The unit of measure for the MousePointer data is not shown, but is defined in user options
.
Status bar - This option allows the user to switch the status bar from cursor positional data to general
storm information data.
171
HURRTRAK & Global Tracker Users Guide 1992-2012, PC Weather Products, Inc.
Non Tab Based Reports
Forecast Location Risk/Impact Report (non tab)
The Risk / Impact report is designed for users that want to see both the risk factors and the impact
to a set of locations. It mirrors the output on the Risk/Impact Tab and can be generated as an
option from that tab or via the Reports Menu dropdown. An example of this report for one location
is shown below. (Reports can be generated for multiple locations)
172
HURRTRAK & Global Tracker Users Guide 1992-2012, PC Weather Products, Inc.
173
HURRTRAK & Global Tracker Users Guide 1992-2012, PC Weather Products, Inc.
Forecast Location Executive Report (non tab)
The executive summary report is designed for users that prefer a non-tabular impact type report.
An example of this is shown below without and with “Narrative Impact Text” selected.
Without Narrative Impact Text
174
HURRTRAK & Global Tracker Users Guide 1992-2012, PC Weather Products, Inc.
175
HURRTRAK & Global Tracker Users Guide 1992-2012, PC Weather Products, Inc.
With Narrative Impact Text
176
HURRTRAK & Global Tracker Users Guide 1992-2012, PC Weather Products, Inc.
177
HURRTRAK & Global Tracker Users Guide 1992-2012, PC Weather Products, Inc.
SYSTEM SETUP
This portion of the system, which can be started from the program group or from the
tracking program, allows the user to set up and maintain some of the global system
parameters as well as take care of database maintenance. This is especially important in
network installations as these are the settings that ALL users will share. Individual user
preferences are maintained in the Tools-Options function, as shown on page 56. There are
7 system setup options available:
Database Maintenance
System Options
User Maintenance
Location Maintenance
Tracking Chart maintenance
Watch and Warning Area Maintenance
Flood Point Maintenance
178
HURRTRAK & Global Tracker Users Guide 1992-2012, PC Weather Products, Inc.
System Preference Setup
Database Maintenance
This option allows the user to create or delete storm databases as well as establishing the default and
Hurrtrak Online Database. To establish a new database, select the Add New Database option and then
change the database name. To make a database the current default, highlight the database name and
select the ‘Select new default database’ option. To select which database you want Hurrtrak Online
updates to be applied to, again highlight the database name and select the ‘Select new Hurrtrak Online
database’ option. For more information on the difference between the default database and the Current
Hurrtrak Online Active Database, please review the appendix topic Default vs. Hurrtrak Online Active
database on page 328.
It is advised that you create a new database for each Hurricane Season. i.e. 2009, 2010, etc. To add a
new database, key in the new name and select the CREATE option. To delete a database and all its
content, select that database and the DELETE option.
In addition, you can perform optional database maintenance including database backup / restore and
compaction and repair. Finally to reduce the size of some of your databases, you can select the Record
Maintenance set of options. More information on those functions is described below:
Database Compact and Repair
This option compresses and repairs the system’s databases. It is a utility that reorganizes the databases
taking advantage of empty space in the database file. The result should be a smaller database file (.MDB).
The compress should be done only when there has been significant activity, especially adding and deleting
of records, to the database. Once a week during very active periods and once a month at other times is
sufficient.
179
HURRTRAK & Global Tracker Users Guide 1992-2012, PC Weather Products, Inc.
Database Backup
This option will backup all of the system and storm MS Access (.mdb) files and stores
them in a compressed format in a location specified by the user. We recommend an
initial and then frequent backups of the system.
Database Restore
This option allows the user to restore the system's MS Access database files from a
previous backup.
Remove Reconnaissance Data
This option allows the user to selectively, by date, remove hurricane reconnaissance
records from the system. This is suggested when the recon.mdb database begins to get
large.
Remove Rain Forecast Data
This option allows the user to selectively, by date, remove rainfall forecast records from
the system. This is suggested when the qpf.mdb database begins to get large.**
Remove Forecast Model Data
This option allows the user to selectively, by date, remove hurricane forecast mode
records from the system. This is suggested when the model.mdb database begins to get
large.
Remove HWIND Data
This option allows the user to selectively, by date, remove Hwind records from the
system. This may become necessary as this database can become very large.
Remove Wind Probability Data
This option allows the user to selectively, by date, remove wind probability records from
the system. This is suggested when the windprob.mdb database begins to get large.
Remove Surge Probability Data
This option allows the user to selectively, by date, remove surge probability records from
the system. This is suggested when the psurge.mdb database begins to get large.
** Note.. the Surge Prob, Wind Prob and rain forecast databases are likely to get large
quicker than the other databases.
180
HURRTRAK & Global Tracker Users Guide 1992-2012, PC Weather Products, Inc.
System Options
The first tab allows the user to select the update interval for the active satellite and radar
thumbnail images. The default is every 6 hours. A selection of 999 will prevent thumbnails from
downloading at all… which is a valid option since the system always downloads the latest image
regardless of the age of the thumbnail image.
The thumbnails will not update unless you activate the Hurrtrak Online Timer.
181
HURRTRAK & Global Tracker Users Guide 1992-2012, PC Weather Products, Inc.
User Fields
This page sets the following global system options:
User Defined Data Field Names - There are up to 3 extra user data fields (10 in RM/Pro) that
can be defined by the user in the County and Zip Code databases. This option allows the
user to enter the name/description of these "extra" data fields. Care must be taken when
establishing these, as changing the fields later requires the data in the County and Zip code
databases to be reinitialized for this data. For more information, see the County or Zip code
data maintenance section.
182
HURRTRAK & Global Tracker Users Guide 1992-2012, PC Weather Products, Inc.
Forecast Error
This page sets the following global system options:
Official Forecast Average Error - These data values correspond to the NHC official forecast
average error (10 year average) for the 12, 24, 36, 48, 72, 96 and 120 hour verification times.
The Global user is allowed to enter different values for each tropical cyclone basin. #1 Atlantic, #2 - East Pacific, #3 - West Pacific, #4 - N. Indian Ocean, #5 - S. Indian Ocean, #6 SW Pacific
The values for the Atlantic and the Eastern Pacific basins are updated yearly by the NHC.. but do
not change significantly from year to year.
183
HURRTRAK & Global Tracker Users Guide 1992-2012, PC Weather Products, Inc.
48 / 120 Hour Estimating Parameters
This page sets the following global system options:
This option allows the user to vary the estimating parameters used to determine the likely areas of
34, 50 and 64 knot winds at the 48, 72, 96 and 120 hour forecast positions.
The parameters represent the average radius of 34 and 50 knot winds by maximum wind
speed. They are used in certain circumstances when estimating the 48, 72, 96 and 120 hour 34,
50 and 64 knot wind area. These values should not be altered unless directed by PC Weather
Products.
184
HURRTRAK & Global Tracker Users Guide 1992-2012, PC Weather Products, Inc.
USER Maintenance
This option allows for the setup and maintenance of users. It is only required for networked
users who desire security on their system, but is available to single workstation users who desire
an extra level of security to the tracking system. Database Security must be "turned on" for user
security to apply.
System Security ON: The security option is typically used only for network installations;
however, it is available to single workstation users. If selected, it will prompt for a system signon
and password when entering most of the tracking applications. NOTE: Be sure you setup a new
password for the ADMIN userid before selecting this option.
USER ID - A unique identifier assigned to a user or group of users.
USER NAME - The name of the user or user group (not displayed elsewhere in the system).
PASSWORD - A password assigned to a user or user group.
UPDATE - Select this option to allow the user all system update privileges, except for the
ability to run the system setup program.
The options available from here are:
To ADD a user, select the Add New User option.
To Change a user’s information, make the required changes in the data table and select
Update.
To DELETE a user, highlight that user in the list and select the Delete Selected User option.
You cannot delete the ADMIN user.
185
HURRTRAK & Global Tracker Users Guide 1992-2012, PC Weather Products, Inc.
Location Maintenance Options
This portion of the system allows the user to set up and maintain location information.
There are 4 options available:
Location maintenance
Location Group maintenance
County / Parish maintenance
Zip Code maintenance
186
HURRTRAK & Global Tracker Users Guide 1992-2012, PC Weather Products, Inc.
Location ("City") Maintenance
This option allows the user to establish new or change/delete existing locations. Locations can be
anything that has latitude and longitude and size attributes. I.E. a city, island, point, lighthouse,
etc..
Remember western longitudes are negative, while eastern longitudes are positive.
Selecting the "home locations only" option will display only locations that have been designated
as such. The 2nd image above is an example of 2 user-defined oil platforms in the Gulf of Mexico.
Note the “OFFSHORE LOCATION” column is checked. This will allow the system to calculate
wave heights for this location.
187
HURRTRAK & Global Tracker Users Guide 1992-2012, PC Weather Products, Inc.
Name - This identifies the location's name.
State - This identifies the location's state or country code (2 or 3 digits).
Latitude - This identifies the location's latitude in decimal degrees. All latitudes north of the equator are
positive and those south are negative. Latitudes for the North Atlantic and Eastern Pacific are positive.
NOTE: DO NOT USE DEGREES AND MINUTES. To convert degrees/minutes to degrees and tenths
of a degree, take the number of minutes, divide by 60 and add it to the degree value. I.E. 29 degrees
36 minutes is 29.6 degrees.
Longitude - This identifies the location's longitude in decimal degrees. All Western longitudes are
negative, while all Eastern longitudes are positive. Longitude values for the Atlantic and Eastern Pacific
locations are negative. NOTE: DO NOT USE DEGREES AND MINUTES. To convert
degrees/minutes to degrees and tenths of a degree, take the number of minutes, divide by 60 and add
it to the degree value. I.E. -78 degrees 54 minutes is -78.9 degrees.
Plot Size - This represents the circular size of this location. This can range anywhere from 0 to 100
nautical miles. A zero value will not draw any circle, thus being well suited for geographical landmarks
like points, bays, etc. Other values will draw circles or points depending on the size of the location and
size of the map they are plotted on.
Plot Font – This option allows the user to specify the font type, size and color which will be used when
plotting this locations name on a tracking map. It overrides the location group and default location
fonts. It can be changed by clicking on it and can be cleared by selecting the SHIFT key and clicking
on it.
Elevation – This indicates the location’s elevation above mean sea level in feet. It is only used by the
SLOSH report function and supersedes the elevation calculated by the DEM (digital elevation model)
data included with the system.
Cross Wind Direction – This field can be used in 2 different ways. If a coastal location, this can be
used to identify the wind direction that typically causes the most flooding. For example, in Savannah a
direct East wind (090 degrees) is the direction that flooding occurs. In Panama City, FL, the direction is
more like SSW or 200 degrees. This is used in the detail location reports when calculating onshore
wind flow and also the location report flood index graph. If this is an airport location, this field can be
used to identify the cross wind direction. i.e. a 360 runway would have the max cross wind from 270 or
090. Either value can be used. This will then generate the cross runway component of wind on
detailed “hourly” reports.
If the Legacy AWE menu option is selected the following additional field is displayed.
AWE Location - This indicates whether this location "qualifies" for Advanced Wind Estimation. If
information has been added via the advanced data entry option, this option will be checked. This is a
read only indicator.
Image – This field allows the user to identify a web or local image file to the system which is used
when exporting report data to Google Earth. For more information, see the appendix topic Webcam /
Location Images on page 330.
Tide Station - This identifies the tide station associated with this location. To associate a location
to a tide station, click on this data cell. The user will then be presented with the tide selection
update window shown on the next page.
Offshore Location - This identifies the location as a fixed offshore location, such as an oil
platform, etc. When checked, the system will include wave height calculations in the summary and
detailed impact report for this location.
188
HURRTRAK & Global Tracker Users Guide 1992-2012, PC Weather Products, Inc.
The options available from here are:
To ADD a location, select the Add Location option.
To Enter advanced information about this location, select the Advanced data entry option (see next
page). One of two possible entry forms will be presented.
To Change a location's information, make the required changes in the data table and select Update Table.
To Define Action Points, highlight that location in the list and select the View/Define Action Point option on
page 195.
To DELETE a location group, highlight that location in the list and select the Delete option.
** Note: you can quickly find a location by using the search fields
189
HURRTRAK & Global Tracker Users Guide 1992-2012, PC Weather Products, Inc.
Advanced Location Data Entry (Default)
Data entry on this form should be considered with extreme care as it can result in lowering the
estimated wind speeds significantly for this location on all reports (Advanced Wind Estimation).
The following is the “default” / new AWE data entry form. Generally you will not change the
roughness index values on this form unless you have good knowledge of the locations environment
or are in areas outside of the US mainland. Changing the roughness index value will have a
significant effect on calculated wind speeds.
This option allows the user to enter "advanced" information about locations. Locations can be anything
that has latitude and longitude and size attributes. I.E. a city, island, point, lighthouse, etc. Remember,
western longitudes are negative while eastern longitudes are positive.
Location Name - This identifies the location's name.
State - This identifies the location's state or country code (2 or 3 digits).
Latitude - This identifies the location's latitude in decimal degrees. All latitudes north of the equator
are positive and those south are negative. Latitudes for the North Atlantic and Eastern Pacific are
positive. NOTE: DO NOT USE DEGREES AND MINUTES. To convert degrees/minutes to
degrees and tenths of a degree, take the number of minutes, divide by 60 and add it to the degree
value. I.E. 29 degrees 36 minutes is 29.6 degrees.
Longitude - This identifies the location's longitude in decimal degrees. All Western longitudes are
negative, while all Eastern longitudes are positive. Longitude values for the Atlantic and Eastern
Pacific locations are negative. NOTE: DO NOT USE DEGREES AND MINUTES. To convert
degrees/minutes to degrees and tenths of a degree, take the number of minutes, divide by 60 and
add it to the degree value. I.E. -78 degrees 54 minutes is -78.9 degrees.
Plot Size - This represents the circular size of this location. This can range anywhere from 0 to 100
nautical miles. A zero value will not draw any circle, thus being well suited for geographical
landmarks like points, bays, etc. Other values will draw circles or points depending on the size of
the location and size of the map they are plotted on.
190
HURRTRAK & Global Tracker Users Guide 1992-2012, PC Weather Products, Inc.
Elevation – This indicates the location’s elevation above mean sea level in feet. It is only used by the
SLOSH report function and supersedes the elevation calculated by the DEM (digital elevation
model) data included with the system.
Cross Wind Direction – This field can be used in 2 different ways. If a coastal location, this can be
used to identify the wind direction that typically causes the most flooding. For example, in
Savannah a direct East wind (090 degrees) is the direction that flooding occurs. In Panama City,
FL, the direction is more like SSW or 200 degrees. This is used in the detail location reports when
calculating onshore wind flow and also the location report flood index graph. If this is an airport
location, this field can be used to identify the cross wind direction. i.e. a 360 runway would have
the max cross wind from 270 or 090. Either value can be used. This will then generate the cross
runway component of wind on detailed “hourly” reports.
Tide Station - This identifies the tide station associated with this location. To associate a location to a
tide station, click on the "Look up Tide Station" option. The user will then be presented with a tide
station selection window.
Offshore Location - This identifies the location as a fixed offshore location, such as an oil platform,
etc. When checked, the system will include wave height calculations in the summary and detailed
impact report for this location
Roughness Index (by direction) - This is an important data element. It describes the exposures that
are characteristic for this location. For each of the 16 compass directions, the average roughness
index for 2 NM in this direction is shown. These values have been pre-calculated for the default
locations. If you add a new location and do not choose the "Estimate Roughness Index" option, the
system will prompt the user to automatically calculate the roughness indices upon exit of this screen.
If you update a location's position (Lat, Long), the user should select the "estimate roughness indices"
option. These values have a significant impact on the wind speeds estimated by Advanced Wind
Estimation.
The options available from here are:
To lookup a location's latitude / longitude, select the Lookup Latitude and Longitude option.
To select a location’s lat / lon via a map select the “Select Location from Map” option. You can
then simply point at the location on a map.
To associate a location to a tide station, select the "Look up Tide Station" option.
To accept the changes, select the "Accept" option.
To reject all changes, select the "Quit" option.
To clear all advanced location data for this location, select the "Reset to non-advanced
location" option. This will clear all exposure and terrain type information for this location.
191
HURRTRAK & Global Tracker Users Guide 1992-2012, PC Weather Products, Inc.
Advanced Location Data Entry (Legacy)
Data entry on this form should be considered with extreme care as it can result in lowering the
estimated wind speeds significantly for this location on all reports (Advanced Wind Estimation).
The following is the legacy / prior AWE data entry form. We recommend you use the previously
described “Default” Advanced Data Entry. It is included to support the prior version’s AWE
capability. Usage of this form and filling in exposure and terrain type information requires an
excellent knowledge of the locations environment. Changing the roughness index value will
significantly affect calculated wind speeds.
This option allows the user to enter "advanced" information about locations. Locations can be anything
that has latitude and longitude and size attributes. I.E. a city, island, point, lighthouse, etc. Remember,
western longitudes are negative while eastern longitudes are positive.
Location Name - This identifies the location's name.
State - This identifies the location's state or country code (2 or 3 digits).
Latitude - This identifies the location's latitude in decimal degrees. All latitudes north of the equator
are positive and those south are negative. Latitudes for the North Atlantic and Eastern Pacific are
positive. NOTE: DO NOT USE DEGREES AND MINUTES. To convert degrees/minutes to
degrees and tenths of a degree, take the number of minutes, divide by 60 and add it to the degree
value. I.E. 29 degrees 36 minutes is 29.6 degrees.
Longitude - This identifies the location's longitude in decimal degrees. All Western longitudes are
negative, while all Eastern longitudes are positive. Longitude values for the Atlantic and Eastern
Pacific locations are negative. NOTE: DO NOT USE DEGREES AND MINUTES. To convert
degrees/minutes to degrees and tenths of a degree, take the number of minutes, divide by 60 and
add it to the degree value. I.E. -78 degrees 54 minutes is -78.9 degrees.
Plot Size - This represents the circular size of this location. This can range anywhere from 0 to 100
nautical miles. A zero value will not draw any circle, thus being well suited for geographical
landmarks like points, bays, etc. Other values will draw circles or points depending on the size of
the location and size of the map they are plotted on.
192
HURRTRAK & Global Tracker Users Guide 1992-2012, PC Weather Products, Inc.
Elevation – This indicates the location’s elevation above mean sea level in feet. It is only used by the
SLOSH report function and supersedes the elevation calculated by the DEM (digital elevation
model) data included with the system.
Cross Wind Direction – This field can be used in 2 different ways. If a coastal location, this can be
used to identify the wind direction that typically causes the most flooding. For example, in
Savannah a direct East wind (090 degrees) is the direction that flooding occurs. In Panama City,
FL, the direction is more like SSW or 200 degrees. This is used in the detail location reports when
calculating onshore wind flow and also the location report flood index graph. If this is an airport
location, this field can be used to identify the cross wind direction. i.e. a 360 runway would have
the max cross wind from 270 or 090. Either value can be used. This will then generate the cross
runway component of wind on detailed “hourly” reports.
Tide Station - This identifies the tide station associated with this location. To associate a location to a
tide station, click on the "Look up Tide Station" option. The user will then be presented with a tide
station selection window.
Offshore Location - This identifies the location as a fixed offshore location, such as an oil platform,
etc. When checked, the system will include wave height calculations in the summary and detailed
impact report for this location.
Exposure - This is an important data element. It describes the exposures that are characteristic for
this location. For each of the 8 compass directions where there is an open exposure within 5 miles,
the user should mark that direction as well as indicate (in feet) the distance from that exposure.
Open exposures include large lakes (> 3 miles) or ocean/sea areas. In the example above, we are
describing a location that has an open ocean exposure nearby to the east (500 feet) and less of an
exposure in other directions (N, S, NE, SE). All western directions are not exposed. This value has
an impact on the wind speeds estimated by Advanced Wind Estimation.
Terrain Type - This is also an important data field. It describes the frictional characteristics of the
location's area. The user should select the option that best describes the location's environment. It
is highly suggested that the user initially "under value" frictional (lower friction) considerations until
experience indicates otherwise. This value has a large impact on the estimated wind speeds
calculated by Advanced Wind Estimation.
Wind Analysis Elevation - Not to be confused with the location's elevation above sea level. This
value indicates the elevation above ground level that the user would like used in Advanced Wind
Estimation. A standard of 10 meters is the default; however, you can change this from 5 to 999
feet AGL.
The options available from here are:
To lookup a location's latitude / longitude, select the Lookup Latitude and Longitude option.
To associate a location to a tide station, select the "Look up Tide Station" option.
193
HURRTRAK & Global Tracker Users Guide 1992-2012, PC Weather Products, Inc.
To accept the changes, select the "Accept" option.
To reject all changes, select the "Quit" option.
To clear all advanced location data for this location, select the "Reset to non-advanced
location" option. This will clear all exposure and terrain type information for this location.
194
HURRTRAK & Global Tracker Users Guide 1992-2012, PC Weather Products, Inc.
Define Action Points
Figure 8
This option allows the user to establish and maintain action points for a specific location or county.
Name - This identifies the action point's name.
Description - This field contains a description of the Action Point. Multi-line input is accepted.
Trigger - The event that triggers the action point. The options are the arrival of 34, 50 or 64 knot winds.
Decision Arc - This option specifies whether the user will ever request to draw a decision arc for this
action point. It may not make sense to draw some action points with large lead times.
Lead Times (Cat. 0-5) - These data fields specify the lead time in hours by category of storm. This
information, in combination with the trigger data, is all that is needed to determine the timing of the
action point.
Functions Available:
Menu Items
Exit - Exits this option.
Help - This Help.
Copy Action Points - This function copies all of the current location's action points to be pasted to
another location at a later time.
Paste Action Points - This function takes a previously copied set of action points and pastes them to the
current location.
195
HURRTRAK & Global Tracker Users Guide 1992-2012, PC Weather Products, Inc.
The options available from here are:
To ADD an Action Point, select the Add New Action Point option.
To Change an Action Point’s information, make the required changes in the data table and select Update
Table.
To DELETE an Action Point, highlight that Action Point in the list and select the Delete Selected Action
Point option.
For more information on the system’s decision support capabilities, see page 270.
196
HURRTRAK & Global Tracker Users Guide 1992-2012, PC Weather Products, Inc.
Location Group
Location groups are a key component of the system as many reports and other analysis are created by
location group. It allows the user to establish new or change/delete existing location groups. Location
groups are any logical collection of locations. For example, if you are responsible for 10 locations, you can
create a location group that has all of those locations in it. The association of location to location groups is
done in "Add Locations to selected Location Group" function. There are several pre-defined location
groups supplied with the system, some of which cannot be deleted (small map, large map, base locations).
Name - This identifies the location group's name.
Description - A short description of the location group.
SLOSH Basin – This identifies the SLOSH basin that is associated with this location group. It only
needs to be specified when the location group is being used to generate a SLOSH report.
Plot Font – This option allows the user to specify the font type, size and color which will be used when
plotting the locations in this location group on a tracking map. It overrides the default location font. It
can be changed by clicking on it and can be cleared by selecting the SHIFT key and clicking on it.
The options available from this report:
To ADD a location group, select the Add Location Group option and modify data fields.
To Change a location group's information, make the required changes and select the Update Table option.
To Add Locations to a Location Group, highlight that location group in the list and select the Add
Location to selected Location Group option. See page 198.
To DELETE a location group, highlight that location group in the list and select the Delete selected Location
Group option.
NOTE: There is a very special location group called “Base Locations”. Associating locations to
that group will impact the Tracking Program’s Risk Alert tab by including all of the locations in this
group on that tab.
197
HURRTRAK & Global Tracker Users Guide 1992-2012, PC Weather Products, Inc.
Location Group Association
This option allows the user to easily associate and un-associate locations to location groups.
To add a location(s) to a location group, simply click on the desired location and click on the
"hand" arrow to move it into the group. You may select multiple locations by using the ctrl or shift
key. Please hold down the shift key until you have clicked on the “hand”.
To remove a location from a group, again click on the desired location in the selected list and
click on the Delete selected Location option. This does not remove the location from the location
database, but only disassociates it from the location group.
To narrow your view of locations, enter partial names in the location lists search area.
198
HURRTRAK & Global Tracker Users Guide 1992-2012, PC Weather Products, Inc.
County Maintenance
This option allows the user to establish new or change/delete existing counties. The latitude and
longitude values are the geographical center position of the county. Remember, western
longitudes are negative, while eastern longitudes are positive.
Name - This identifies the county's name.
State - This identifies the county's state code (2 digits).
Latitude - This identifies the county's geographical center latitude in decimal degrees. All latitudes
north of the equator are positive and those south are negative. Latitudes for the North Atlantic and
Eastern Pacific are positive. NOTE: DO NOT USE DEGREES AND MINUTES. To convert
degrees/minutes to degrees and tenths of a degree, take the number of minutes, divide by 60 and add
it to the degree value. I.E. 29 degrees 36 minutes is 29.6 degrees.
Longitude - This identifies the county's geographical center longitude in decimal degrees. All Western
longitudes are negative, while all Eastern longitudes are positive. Longitude values for the Atlantic and
Eastern Pacific locations are negative. NOTE: DO NOT USE DEGREES AND MINUTES. To convert
degrees/minutes to degrees and tenths of a degree, take the number of minutes, divide by 60 and add
it to the degree value. I.E. -78 degrees 54 minutes is -78.9 degrees.
Population - This represents the population of the county.
Households - This represents the number of households in the county.
Cross Wind Direction – This field can be used in 2 different ways. If a coastal location, this can be
used to identify the wind direction that typically causes the most flooding. For example, in Savannah a
direct East wind (090 degrees) is the direction that flooding occurs. In Panama City, FL, the direction is
more like SSW or 200 degrees. This is used in the detail location reports when calculating onshore
wind flow and also the location report flood index graph. If this is an airport location, this field can be
199
HURRTRAK & Global Tracker Users Guide 1992-2012, PC Weather Products, Inc.
used to identify the cross wind direction. i.e. a 360 runway would have the max cross wind from 270 or
090. Either value can be used. This will then generate the cross runway component of wind on
detailed “hourly” reports.
Tide Station - This identifies the tide station associated with this location. To associate a location to
a tide station, click on this data cell. The user will then be presented with the tide selection
window.
Average Roughness Index - This represents the average roughness index for this county. This is
used for the county wind impact report when Advanced Wind Estimation (for counties) is active
(ON). This value has been pre-calculated and should be changed with care.
User defined field 1 - This represents numerical data that is defined by the user. In the example
shown here, we picked data fields that may be of interest to the insurance industry. If you have a large
quantity of user data that you would like to import into the database, it may be best to use MS ACCESS
to do the chore rather than hand data entry. Call PC Weather Products for assistance in doing this.
User defined fields 2-3 - This represents numerical data that is defined by the user as described
above.
User defined fields 4-10 - This represents numerical data that is defined by the user as described
above (RM/PRO).
The options available from here are:
To ADD a county, select the Add County option.
To Change a county's information, make the required changes in the data table and select Update
Table.
To Maintain action points for a county, highlight that county in the list and select the View/Define Action
Points option. See page 195.
To DELETE a county, highlight that county in the list and select the Delete option.
* Note: To find a county, use the search fields.
200
HURRTRAK & Global Tracker Users Guide 1992-2012, PC Weather Products, Inc.
Zip Code Maintenance
This option allows the user to establish new or change/delete existing zip codes. The latitude and
longitude values are the geographical center position of the zip code. Remember western
longitudes are negative, while eastern longitudes are positive. The RM/Pro versions of the
system use the zip code information in its impact analysis.
Zip Code - This identifies the zip code.
State - This identifies the zip code's state code (2 digits).
Post Office - This represents the post office city associated with the zip code.
Latitude - This identifies the zip code's geographical center latitude in decimal degrees. All latitudes
north of the equator are positive and those south are negative. Latitudes for the North Atlantic and
Eastern Pacific are positive. NOTE: DO NOT USE DEGREES AND MINUTES. To convert
degrees/minutes to degrees and tenths of a degree, take the number of minutes, divide by 60 and add
it to the degree value. I.E. 29 degrees 36 minutes is 29.6 degrees.
Longitude - This identifies the zip code's geographical center longitude in decimal degrees. All
Western longitudes are negative, while all Eastern longitudes are positive. Longitude values for the
Atlantic and Eastern Pacific locations are negative. NOTE: DO NOT USE DEGREES AND MINUTES.
To convert degrees/minutes to degrees and tenths of a degree, take the number of minutes, divide by
60 and add it to the degree value. I.E. -78 degrees 54 minutes is -78.9 degrees.
Population - This represents the population of the zip code. Note: some population figures are 0
because they are not "inhabited" zip codes.. I.E. Post Offices.
Cross Wind Direction – This field can be used in 2 different ways. If a coastal location, this can be
used to identify the wind direction that typically causes the most flooding. For example, in Savannah a
direct East wind (090 degrees) is the direction that flooding occurs. In Panama City, FL, the direction is
201
HURRTRAK & Global Tracker Users Guide 1992-2012, PC Weather Products, Inc.
more like SSW or 200 degrees. This is used in the detail location reports when calculating onshore
wind flow and also the location report flood index graph. If this is an airport location, this field can be
used to identify the cross wind direction. i.e. a 360 runway would have the max cross wind from 270 or
090. Either value can be used. This will then generate the cross runway component of wind on
detailed “hourly” reports.
Tide Station - This identifies the tide station associated with this location. To associate a location to a
tide station, click on this data cell. The user will then be presented with the tide selection update
window.
Average Roughness Index - This represents the average roughness index for this zip code. This is
used for the zip code wind impact report when Advanced Wind Estimation (for zips) is active (ON).
This value has been pre-calculated and should be changed with care.
User defined field 1 - This represents numerical data that is defined by the user. In the example
shown here, we picked data fields that may be on interest to the insurance industry. If you have a large
quantity of user data that you would like to import into the database, it may be best to use MS ACCESS
to do the chore rather than hand data entry. Call PC Weather Products for assistance in doing this.
User defined fields 2-10 - This represents numerical data that is defined by the user as described
above.
The options available from here are:
To ADD a zip code, select the Add Zip Code option.
To Change a zip code's information, make the required changes in the data table and select Update
Table.
To DELETE a zip code, highlight that zip code in the list and select the Delete option.
* Note: To find a zip code, use the search fields.
202
HURRTRAK & Global Tracker Users Guide 1992-2012, PC Weather Products, Inc.
Tracking Chart Maintenance
Tracking Chart maintenance has 2 functions.. The first function shown on the image
above allows the user to change the default map colors. There are 9 pre-defined color
sets as well as the capability to define your own custom colors. The options on this page
are:
Land Color - This option allows the user to select the color of the land areas on all the tracking
charts.
Water Color - This option allows the user to select the color of the water areas on all the tracking
charts.
Change ALL Maps - This option will process the color changes to all of the tracking charts on the
system.
Selecting one of the pre-defined images will preview what the maps will look like before
selecting the “change all maps” option..
203
HURRTRAK & Global Tracker Users Guide 1992-2012, PC Weather Products, Inc.
The 2nd Tracking Chart maintenance function allows the user to control what pre-defined maps
are available. With the significant number of fixed tracking charts in the system, some users may
find it beneficial to be able to de-activate certain charts that they would never use. This option
allows the user to be able to do just that. To de-activate a chart, highlight the chart name and
select the Inactive option. To re-activate a chart, highlight the chart name and select the Active
option. You may not de-activate the "Full Atlantic" chart or any of the custom map charts. Global
Tracker users can change tropical cyclone basins by selecting that menu option. To change map
colors, utilize the change map colors option.
204
HURRTRAK & Global Tracker Users Guide 1992-2012, PC Weather Products, Inc.
Watch and Warning Area Point Maintenance
Figure 9
This option allows the user to establish new or change/delete existing watch and warning points. This
function should only be utilized by users outside of the USA who want the ability to graphically depict the
watch and warning areas. The key fields are...
Area - Watch and warning AREAS group together a contiguous series of geographical points. For
example, the US coastline is defined as one watch and warning area, while the Puerto Rico coastline
might be defined as another. I.E. There are no points that connect the two areas.
Sequence - The sequence number defines the sequence of geographical points within an area. To
define an area from Texas to Maine as in the USA area, the sequence must be "in order" from
Brownsville to Bar Harbour.
Latitude - This specifies the latitude, in decimal degrees, of the watch and warning point defined.
Longitude - This specifies the longitude, in decimal degrees, of the watch and warning point defined.
Name - The name field contains the watch and warning point’s name. If this is blank, then this point
represents a "curve" in the coastline.
State - The state field contains the watch and warning point’s state or county code information. If this is
blank, then this point represents a "curve" in the coastline.
The options available are:
To ADD a watch/warning point, select the Add Watch/Warning Point option.
To Change a point’s information, make the required changes in the data table and select Update Table.
To DELETE a watch and warning point, highlight that row in the list and select the Delete option.
The maintenance of the hurricane watch and warning areas is a rather complex one and typically
never needs to be done. If you are only interested in watches and warnings along the US coast and
205
HURRTRAK & Global Tracker Users Guide 1992-2012, PC Weather Products, Inc.
the National Hurricane Center does not deviate from their "standard" set of watch and warning
points, then you will never have to maintain this data set.
There are several circumstances where you will need to maintain this data set.
1. If the NHC uses a non-standard location along the US coastline. For example, if they specify Mobile, AL
as an end point for an area of watch or warning, you will need to insert that location into the database.
(The other option in this case is to simply specify the nearest standard location to Mobile.)
2. If you need to display the watches and warnings for non US coastline areas, you will need to predefine
those watch and warning areas before using this feature. The National Hurricane Center does NOT
use a standard set of watch and warning points for areas outside of the US coastline, so any watches
and warnings issued for these areas will have to be pre-defined.
The database is organized sequentially by area and sequence number, and contains latitude, longitude and
location name information. An ascending sequence within an area defines that area's coastline. In the
sample on page 205, we see the set of points that make up the coastline from Everglades City, FL to Key
Largo, FL within the USA area. The records that have a location name and state are the predefined NHC
watch and warning points. The records in between those points represent the "curves" in the coastline in
between the locations. See the chart on page 206 to get a better understanding of what this area of the
coastline looks like.
Let’s look at a couple of examples of how you could change the data set.
Example 1:
Let say the NHC decided to issue a watch or warning from Big Pine Key to Jacksonville. Since Big Pine
Key is not one of the pre-defined points, you would have to insert Big Pine Key into this data set. By
examining the above table, you could add that location in area USA with a sequence number of 4115.
Example 2:
If you wanted to create a watch and warning area for all of Cuba, you would have to define the entire
coastline of Cuba and then specify the watch and warning locations that you will use. So you may define 25
points that roughly define the coast and then specify 10 geographical locations to be used as the end points
of the watch and warning areas. The 25 points and 10 geographical locations are just used as an example.
Watch and warning sample data
Figure 10
This chart has been annotated to show some of the sequence numbers in the USA watch and warning
area. Note how by connecting the points, a rough coastline is defined.
206
HURRTRAK & Global Tracker Users Guide 1992-2012, PC Weather Products, Inc.
Flood Point Maintenance
Figure 11
This option allows the user to establish new or change/delete existing watch and warning points. The key
fields are...
Basin - Basin identifies the hurricane basin that the flood point "coastline" is in. The Atlantic Basin is 1,
East Pacific = 2, West Pacific = 3, N. Indian = 4, S. Indian = 5, SW Pacific = 6
Area - A Flood Point AREA groups together a contiguous series of geographical points. For example,
the US coastline is defined as one Flood Point area, while the Puerto Rico coastline might be defined as
another. I.E. There are no points that connect the two areas.
Sequence - The sequence number defines the sequence of geographical points within an area. To
define an area from Texas to Maine, as in the USA1 area, the sequence must be "in order" from
Brownsville to Bar Harbour.
Latitude - This specifies the latitude, in decimal degrees, of the flood point defined.
Longitude - This specifies the longitude, in decimal degrees, of the flood point defined.
Flood Direction - The onshore flood direction for this flood point. I.E. The direction that flooding would
"come from". The direction is defined by the compass where East is 090, South is 180, West is 270
and North is 360 (0 is defined as having no value). For most coastal areas, this direction would be
perpendicular to the coast. For example, Miami would be 090 (east), Panama City, FL would be 200
(SSW), Galveston, TX would be 135 (SE), etc. There are some cases, like inlets and bays where the
flood direction (maximum flooding) is due to funneling of water into the inlet or bay. Tampa Bay is an
example of this where its maximum flooding occurs due to a SW flow.
The options available are:
207
HURRTRAK & Global Tracker Users Guide 1992-2012, PC Weather Products, Inc.
To ADD a flood point, select the Add Floodpoint option.
To Change a point's information, make the required changes in the data table and select Update Table.
To DELETE a flood point, highlight that row in the list and select the Delete Floodpoint option.
The maintenance of the flood point areas is a rather complex one. Luckily, there are only a few
circumstances that require you to maintain this data set.
1. If you need to display the flood index for un-analyzed coastal areas. Although, we have "digitized" flood
points for all of the large to medium sized coastal areas, including some inland lakes, we have not
attempted to analyze every coastal area, like small islands. They present a special problem in that
their onshore wind direction in reality is... "all directions". A storm surge coming in from the Southeast
may inundate the entire island. You can, however, create a separate "flood" area for a specific island.
2. If you would like to modify the "digitized" flood points. Again, although we have digitized at a fairly detail
level, your knowledge of local flood patterns like inlets, rivers, etc., may make it desirable to add more
detail to the coastal flood point pattern.
In the sample on page 207, we see some of the flood points that define the coastline of North Carolina
within the USA1 area. See the sample chart on page 209 to get a better idea of how this looks for that
area.
Example 1:
If you wanted to add Smith Island (Cape Fear) to the flood point data base you would need to add new
records with a unique area name. For example:
Area, Seq., Lat., Long, Onshore Flood Direction
SMITH,01,33.88,-78.02,270
SMITH,02,33.89,-78.00,329
SMITH,03,33.90,-77.99,360
SMITH,04,33.89,-77.97,050
SMITH,05,33.90,-77.96,310
SMITH,06,33.91,-77.95,102
SMITH,07,33.89,-77.96,102
SMITH,08,33.87,-77.96,102
SMITH,09,33.86,-77.96,090
SMITH,10,33.85,-77.97,197
SMITH,11,33.86,-77.99,197
SMITH,12,33.86,-78.01,197
SMITH,13,33.88,-78.02,270
define the points for Smith Island. Once these are entered in to the database, Smith Island would then be
included in the Flood Point analysis.
208
HURRTRAK & Global Tracker Users Guide 1992-2012, PC Weather Products, Inc.
Example 2:
If you wanted to include Cape Fear Inlet (river) into the flood point data base you would add new records to
the existing USA1 database. For example:
USA1,52700,33.98,-77.92,180
USA1,52701,34.07,-77.93,180
USA1,52702,34.12,-77.93,180
USA1,52703,34.15,-77.95,180
USA1,52704,34.19,-77.96,180
USA1,52705,34.17,-77.97,180
USA1,52706,34.12,-77.95,180
USA1,52707,34.04,-77.95,180
USA1,52708,33.99,-77.95,180
USA1,52709,33.94,-77.98,180
USA1,52800,33.90,-77.95,180
would be inserted into the database in the appropriate sequence. (I have made an assumption that a due
South (180) wind flow would result in the largest flooding in Cape Fear Inlet.)
If you modify the flood point database, we would be interested in getting a copy of these additions
or changes for possible incorporation into future releases.
Flood Index Sample
Figure 12
209
HURRTRAK & Global Tracker Users Guide 1992-2012, PC Weather Products, Inc.
CUSTOM MAP MAKER
Note: While this original method of creating custom maps is still supported, we recommend that
you create your custom maps in a different manner. Simply select the “save as custom map” menu
function available on the Map Selection tab and the current image will be saved as a custom map.
See page 104 for more information on this.
This option, accessible from the main program group or the tracking program, creates custom
tracking charts (up to 5) that become integrated with the system. This feature is designed to
complement the predefined fixed tracking charts and allows the user to create tracking charts
specific to their area. You may select the custom map area in one of 2 ways. Data Entry and
Graphical. Please review page 298 for more information on the various tracking charts available to
the system
The data fields required to initiate the custom map creation are:
Map Name - The identifier for this map.
Map number - The number (1 to 5) of this map.
Create 640 X 480 Chart - If you
primarily use the smaller scale
640x480 pixel charts, then select
this option.
Create 1024 X 768 Chart - If you
primarily use the large 1024X768
pixel charts, then select this option.
Create 1400 X 1048 Charts – If you
primarily use the larger 1400x 1048
pixel charts, then select this option.
Which size chart is used is partly
determined by user selection in
the general options and also by
the desktop areas (pixels) being
used by the user.
Center Latitude - The latitude of
the center of the desired tracking
chart. NOTE: North latitudes are
positive, while South latitudes are
negative. Please enter in decimal
degrees, i.e. 25.6, not degrees and minutes.
Center Longitude - The longitude of the center of the desired tracking chart. Western Longitudes, as in
the US, are negative and Eastern longitudes are positive. Please enter in decimal degrees, not degrees
and minutes.
Map Width - The width of the desired tracking chart in degrees longitude. One degree of longitude is
typically 60 statute miles (varies by latitude). This value can range from .1 (6 miles) to 100 (6000 miles)
degrees wide. It is advised that you use this feature for smaller scale charts that complement the large
number of charts that are included with the system (Custom map example).
210
HURRTRAK & Global Tracker Users Guide 1992-2012, PC Weather Products, Inc.
If you select the Graphical option, you will be presented with a chart where you simply mark the area
desired and select “next” from the menu bar. The center latitude and center longitude, as well as the map
width data, will be transferred to the equivalent data fields. Selecting OK will initiate the creation process.
After the map has been created, you will be prompted to "Edit the chart". If you would like to do some color
corrections to the tracking chart, select YES, otherwise select NO. This option is useful when certain
portions of the chart like lakes and other bodies of water that were "cut off" by the edge of the chart did not
turn blue and you would like to correct these before saving the chart. Clicking on the left mouse button will
"paint" the selected area blue, while clicking of the right mouse button will "paint" the area the "land color".
A shift-left button combination while moving the cursor slowly will draw a line. This is useful if minor
changes or corrections need to be made to the coastline, etc.
When done, select the menu option "Finish".
When the map is finished, the county and road databases will be created if they were selected.
After the chart is created, if the tracking portion of the system is active, the new custom map will become
part of that system within several seconds. Also, any open tracking chart windows will be closed.
211
HURRTRAK & Global Tracker Users Guide 1992-2012, PC Weather Products, Inc.
QUICKPLOT
QuickPlot allows the user to find out exactly what is going on... FAST.
It quickly displays a single tracking chart image showing all of the "current"
storms. From here, the user can opt to use the full capabilities of the entire
HURRTRAK system with the simple click of the mouse. The key functions of Email
sending, printing and saving of images is available allowing the user to easily
share the information.
QuickPlot is typically selected from the desktop. However, it can also be initiated
from within the main HURRTRAK program.
When using QuickPlot, the HURRTRAK ONLINE Timer program should be active to
keep all of the databases current. See notes below.
212
HURRTRAK & Global Tracker Users Guide 1992-2012, PC Weather Products, Inc.
The functions available from QuickPlot include:
Toolbar
The Toolbar functions are duplicated menu bar functions except for the following:
Add to Email Outbox – This option adds the current image to the Email outbox.
View Email Outbox – This option views the contents of the Email outbox and optionally allows the
user to Email them.
More information on the Email Outbox function is available on page 154.
The other toolbar functions include a convenient way to change hurricane basins (global versions) and
select plotting options.
Menu
Basin – With Global systems, this option allows the user to change to a different tropical cyclone
basin
Toolbar Color – This is a separate setting from the rest of the Hurrtrak System. We suggest you
use a color that accents “depressed” command icons.. i.e. orange background when pressed.
Send - Sends the current image via email image as shown on page 156..
Print/Export – Allows the user to print the current image in color, gray scale or B&W or export the
image to Google-Earth. See page 306 for more information on Google Earth.
Save (image) – Saves the current image to the clipboard or file (color or B&W).
Advisory Text – Instructs the user to right click on a storm to display its NHC advisory text.
Options – This selection is mostly redundant with the toolbar functions. It allows the user to
specify the plotting options.
All of the options are on/off type and include:
- Automatically save image to desktop when new data arrives: When this option is
selected, the current image is saved to the users Windows desktop when new information
has been plotted.
213
HURRTRAK & Global Tracker Users Guide 1992-2012, PC Weather Products, Inc.
-
-
-
Change number of hours to look back: This determines the storms that will be displayed,
based on their age. For example, if this value is set at 48 hours, only storm that are less
than 48 hours old will be shown. We suggest keeping this value at 24-48 hours.
Plot Track: If selected, the actual track will be shown
Plot Track Chart Notes: If selected, the chart notes are indicated.
Plot Observation Point “circles”. If selected, each of the storm’s observation points are
plotted with circles. If showing an entire season or multiple storms, it is sometimes best to
de-select this option.
Plot Wind Radii: If this option is selected, the storm’s latest position is indicated with the
traditional wind areas. If not, then a storm icon is shown instead.
Plot Forecast Track only: If selected, the storm’s forecast track is shown.
Plot Forecast Track Error: If this option is “on” then the forecast track along with average
error area is plotted.
Label Storms: This option determines if the storm name is shown next to the storm. The
font used is the same as the annotation font set in the main system.
Display Base (home) Location: Determines if the system’s base location is plotted on the
map. The base location is set in the main system’s user preferences.
Display Watch/Warning Areas: If selected, all current watch and warning areas are
shown.
Save Image to Desktop – This will immediately save the current image to the user’s Windows
desktop.
Tropical Weather Outlook – This option will display a text box which displays the latest tropical
weather outlook. From here, the user can then send (email) and/or print the tropical weather
outlook text
Other Functions:
Map Selection – The user can select the best map to use via the map dropdown list in the upper
left hand corner of the current image. Only standard (“fixed”) tracking charts are available.
Double Click (near a storm) – If the user performs a mouse “double click” near a storm, QuickPlot
will close and automatically load the main Hurrtrak system with that storm loaded. This allows the
user to easily access the advanced features of the main system.
Right Click (away from the storm) – If the user performs a mouse “right click” away from a storm
position, the option menu will display. This allows for quick option changes without having to
navigate to the menu.
Right Click (near a storm) – If the user performs a mouse “right click” near a storm position, the
advisory text for that storm will display in a text box.
QuickPlot Notes:
1. All of the user options and current tracking map set during a session are saved. Subsequent
sessions will start with the saved preferences.
2. In order to gain the most benefit from QuickPlot, the user should specify that the HURRTRAK
ONLINE timer program be started with Windows startup. This can be done in the Hurrtrak Online
user preferences, as described on page 77.
3. QuickPlot is an easy way to show the entire hurricane season. At the end of the season (or during),
simply set the “number of hours to look back” to a large number… like 5000. This will force the
system to show all of the storms. By selecting certain options, you can create an image like the
one below.
214
HURRTRAK & Global Tracker Users Guide 1992-2012, PC Weather Products, Inc.
All storms in the 2005 hurricane season
215
HURRTRAK & Global Tracker Users Guide 1992-2012, PC Weather Products, Inc.
Hurricane/Tropical Cyclone Historical Analysis System
The Historical Analysis System allows you to analyze past storm information
from 1851 to the present. The system operates by the user first selecting a
storm or group of storms and then taking actions on that group (i.e. Plot,
display data, etc.) The amount of data available depends on which tropical
basin is being analyzed.
The menu selections include:
Exit - Exits the program
Set Basin
Select
Display
Plot Storms
Misc. Analysis
Options: Plot with thin lines. This option forces the system to plot historical tracks with fine (thin)
lines rather than the normal thicker lines. This is useful when plotting a large number of tracks.
Help - Displays help text
216
HURRTRAK & Global Tracker Users Guide 1992-2012, PC Weather Products, Inc.
Set Basin
This pull down, only available in the Global Tracking Systems, allows the user to
select the tropical basin they wish to analyze.
1- Atlantic
2- Eastern Pacific
3- Western Pacific
4- Northern Indian
5- Southern Indian
6- Southwest Pacific
Selection Methods
HURRHIST has several methods for selection a storm or group of storms. They are:
Select Storms by Location (set distance)
Select Storms by Location (variable distance)
Select Storms by Name
Select Storms by Year
Select Storms by Strength
Let’s examine each selection method.
217
HURRTRAK & Global Tracker Users Guide 1992-2012, PC Weather Products, Inc.
Select Storm by Location (set distance)
Figure 13
By far the most complex selection method, selecting a group of storms by location allows the user
to do a very detailed analysis of how an area historically has been affected by storms and also do
some real-time comparison to a current storm situation. For example, you can see how many
storms have passed within 60 miles of the nearest whole latitude / longitude point that had winds
greater than 74 mph. Or, if there is a current storm moving through the Lesser Antilles, you can
do an analysis showing all of the past storms that are "similar" in characteristics as this one.
The following fields are required:
Latitude - The latitude of the location you wish to analyze. Be sure to enter this in degrees and tenths of a
degree, not degrees and minutes. Northern latitudes are positive. You may use the “select from
location database” function to have the system automatically find a location’s latitude & longitude.
Longitude - The longitude of the location you wish to analyze. Again, this should be entered in degrees
and tenths of a degree. Western Longitudes, like the Americas, are negative, while Eastern longitudes
are positive. You may use the “select from location database” function to have the system
automatically find a location’s latitude & longitude.
218
HURRTRAK & Global Tracker Users Guide 1992-2012, PC Weather Products, Inc.
The following optional data fields are initially set to their widest ranges. If you wish to
"narrow" the number of storms selected, you may modify their values. They include:
Starting Date - The beginning date of the date range you wish to select.
Ending Date - The ending date of the date range you wish to select.
Minimum Wind Speed - The low end of the wind speed range. The unit of measure (UOM) used is
determined by the user preferences as set in the tracking portion of the system .
Maximum Wind Speed - The high end of the wind speed range. The UOM used is determined by the user
preferences as set in the tracking portion of the system.
Direction of movement - FROM - This represents the “from” azimuth value
Direction of movement - TO - This represents the “to” azimuth value.
Direction of Movement - The prior two fields define the direction of storm movement. The values are based
off of a compass azimuth system where North is 0 or 360 degrees, East is 090, South is 180 and West is
270 degrees.
The direction of movement is defined from the FROM value clockwise to the TO value.
This is best explained with examples:
360
To select only storms that were moving to the NW, you would enter FROM 270, TO - 360. See Figure 14.
To select only storms that were moving to the North, you would enter
FROM - 315. TO - 045.
To select only storms that were moving to the West, you would enter FROM
- 225, TO - 315.
270
090
180
Figure 14
All of these examples allow for a 90-degree wide range. In other words, for
the East example, we will select all storms that were moving from the NE (045) to ones that were moving
from the SE (135). If you want to narrow this range even further, you may do so. I.E. If you want storms
that were coming from nearly due East, the FROM could be 080 and the TO could be 100 degrees.
This area is a little complicated, so it may be best to try different values and see the results.
Forward motion minimum forward speed - The low end of the range of storm forward motion speed. The
unit of measure (KTS or MPH) is determined by the user preferences in the tracking part of the system.
Forward motion maximum forward speed - The high end of the range of storm forward motion speed.
The unit of measure (KTS or MPH) is determined by the user preferences in the tracking part of the system.
An example of the following query is shown on page 218.
Select all the storms that passed within 60 miles of 26 north latitude and 80 degrees west longitude, that
occurred between August 1 and September 30, that had peak winds between 50 and 150 knots and were
moving from the southeast at 5 - 15 knots.
219
HURRTRAK & Global Tracker Users Guide 1992-2012, PC Weather Products, Inc.
Select Storm by Location (variable distance) - RM/Pro only
Figure 15
This selection method allows the user to select storms by a variable distance from a location. For
example, you can see how many storms have passed within 27 miles of Miami, FL had winds
greater than 74 MPH.
The following fields are required:
Latitude - The latitude of the location you wish to analyze. Be sure to enter this in degrees and tenths of a degree, not
degrees and minutes. Northern latitudes are positive. You may use the “select from location database” function
to have the system automatically find a location’s latitude & longitude.
Longitude - The longitude of the location you wish to analyze. Again, this should be entered in degrees and tenths of
a degree. Western Longitudes, like the Americas, are negative, while Eastern longitudes are positive. You may
use the “select from location database” function to have the system automatically find a location’s latitude &
longitude.
Search Distance - The distance you would like to use in the query.
The following optional data fields are initially set to their widest ranges. If you wish to "narrow" the number of
storms selected, you may modify their values. They include:
Minimum Wind Speed - The low end of the wind speed range. The unit of measure (UOM) used is determined by the
user options as set in the tracking portion of the system .
Maximum Wind Speed - The high end of the wind speed range. The UOM used is determined by the user options as
set in the tracking portion of the system.
Starting Date - The beginning date of the date range you wish to select.
Ending Date - The ending date of the date range you wish to select.
Starting Year - The beginning year of the date range you wish to select.
Ending Year - The ending year of the date range you wish to select.
220
HURRTRAK & Global Tracker Users Guide 1992-2012, PC Weather Products, Inc.
Select by Storm Name
This option allows you to select storms
by name.
Required field:
Storm Name - The name of the storm you
would like to select.
Optional field:
Storm Year - The year of the storm you
would like to select. If this field is empty,
then all of the storms with the desired
name will be selected.
Select by Year
This option allows you to select all the storms for a
particular year.
Storm Year - Year desired
Select by Strength
This option allows you to select storms by
their maximum wind strength. The unit of
wind speed (KTS or MPH) is determined by
the user preferences in the tracking part of
the system.
Minimum Wind Speed - The low end of the
wind speed range.
Maximum Wind Speed - The high end of the
wind speed range.
221
HURRTRAK & Global Tracker Users Guide 1992-2012, PC Weather Products, Inc.
Display Storms
After a group of storms has been selected, the display option will show the storm
summary information. This is done automatically after the initial selection.
This screen displays general information about all of the storms selected. Year, Storm
Name, Category, Start Date, End Date, Max Wind Speed, Lowest Pressure. The Unit of
measure used for the wind speed and pressure is set in the User Preferences in the main
tracking portion of the system.
The options available from here include:
Examine
Graph Wind
Graph Pressure
Print List - Prints the list of storms on your printer.
Cancel - Closes this window.
222
HURRTRAK & Global Tracker Users Guide 1992-2012, PC Weather Products, Inc.
Examine
This option displays each observation point for the selected storm. Typically, there are 4
observations per day which include the date, time, position (latitude, Longitude),
maximum wind speed, central pressure and forward motion of the storm.
Options from this window are:
Print - Print all the storm observations.
Cancel - Close this window.
223
HURRTRAK & Global Tracker Users Guide 1992-2012, PC Weather Products, Inc.
Graph Wind
This window displays the selected storm’s max. wind speed profile. Max and Min
wind speed is indicated by the horizontal dashed lines. The unit of measure, MPH
or KNOTS, is determined by the user options set in the tracking portion of the
system.
Options available from this window:
Close Window - Closes the window.
Save Graph – Save the graph to a bmp file.
Print Graph - Prints the graph.
Help - Displays this help text.
There is a set of graphing options available from the top portion of the chart which changes the
characteristics of the graph. Experiment with these to determine the graph that best suits your
needs.
224
HURRTRAK & Global Tracker Users Guide 1992-2012, PC Weather Products, Inc.
Pressure Graph
This window displays the selected storm’s central pressure graph. Each bar
represents an observation point. The unit of measure, millibars or inches of
mercury, is based on the user options set in the tracking portion of the system.
Options available from this window:
Close Window - Closes the window.
Save Graph – Save the graph to a bmp file.
Print Graph - Prints the graph in black and white. Note: The size of the printed output is dependent
on the size of the displayed window. I.E. A larger window results in a larger print area.
Help - Displays this help text.
There is a set of graphing options available from the top portion of the chart which changes the
characteristics of the graph. Experiment with these to determine the graph that best suits your
needs.
225
HURRTRAK & Global Tracker Users Guide 1992-2012, PC Weather Products, Inc.
PLOT (Storm Plot Selection)
This screen displays general information about all of the storms selected. Year, Storm
Name, Category, Start Date, End Date, Max Wind Speed, Lowest Pressure. The unit of
measure used for the wind speed and pressure is set in the User Preferences in the main
tracking portion of the system. Multiple storms can be selected for plotting from this
window.
Commands available from this window include:
Select ALL - Selects all of the storms in the list.
Deselect All - Deselects all of the storms in the list.
Mouse Select - Storms may be selected or deselected individually by clicking with the left mouse button on
the list entry.
Once one or more storms have been selected, the user may plot the storm tracks by
picking one of the menu PLOT options.
Graphic Select - This option places a large scale tracking chart in a window on the screen. The user
can select the tracking chart they want to view by moving the cursor over the black "rectangles" that
represent all of the available tracking charts. When the desired rectangle is highlighted, clicking the
left mouse causes this chart to be selected. The red circle indicates the latest position of the current
storm.
Full Chart - This option displays the largest available tracking chart for this tropical basin
226
HURRTRAK & Global Tracker Users Guide 1992-2012, PC Weather Products, Inc.
Menu - This allows the user to select from the entire list of available tracking charts.
When a tracking chart has been selected, it is displayed with all of the selected
hurricane tracking charts displayed. Let’s take a look at the options available to
the user when displaying these charts.
227
HURRTRAK & Global Tracker Users Guide 1992-2012, PC Weather Products, Inc.
Chart Display Options
While viewing storm plots on a tracking chart, there are several menu options available.
They include:
Close Window - Closes this window.
DISPLAY:
Display Locations - Displays all of the locations for the selected location group.
Display Counties - Displays the county lines
Display Roadways - Displays the significant roadways. This may take several seconds.
Display Latitude/ Longitude values - Displays latitude and longitude labels along the sides and top of the
tracking chart.
Display Chart Notes - Displays storm observation information next to the observation points. If the points are
close together, some chart notes will not plot to prevent overwriting.
Display Track Color Legend – Displays the color-coded storm track legend.
Forecast Error Legend – Displays the color coded forecast error legend.
Wind Field Legend – Displays the color coded legend for wind radii.
228
HURRTRAK & Global Tracker Users Guide 1992-2012, PC Weather Products, Inc.
Stretch - Displays the tracking chart in "full screen" mode. No operations can be done while in this mode
as it is only for viewing. Clicking the mouse button will return you from stretch mode.
Annotate Chart - Allows the user to add his/her notes to the tracking chart being displayed. After selecting
this option, you select the point you wish to add comments by pressing the right mouse button on the
screen and then entering the text desired. When done, click on "end annotate" on the menu bar.
Print/Export:
Print Setup – Allows the user to define which printer settings they would like to use.
Color - Prints the current image in color. If you have a B/W printer, your print driver will convert the colors to gray
scale.
Grayscale - Prints the current image in gray scale regardless of your printer type.
Export image to Google Earth – exports Image to Google Earth.
Export Google Earth KML – Exports all of the displayed tracks to Google Earth using KML.
Save Image:
Copy to Clipboard - Copies the current image to the windows clipboard for pasting into most graphics
applications.
Save to File - Saves the current image to a BMP, PCX, TIF or JPG file. Most all windows graphics and word
processing applications accept BMP files.
Save fax image to File - Saves the current image to a BMP, PCX, TIF, or JPG file after automatically modifying
the image to "line art". All colors are changed to black, while the Ocean and Land areas are set to white.
Help - Displays this help screen.
229
HURRTRAK & Global Tracker Users Guide 1992-2012, PC Weather Products, Inc.
Miscellaneous Analysis
This Menu option allows the user to do the following additional analysis:
Formation Point
Location Analysis
Formation Point Selection
This option allows the
user to select a group of
storms based on
intensity and date range
and then display their
formation points on the
large tracking chart. If
the user selects "Storm
Formation Points", all of
the storms’ formation
points will be displayed.
If one of the "Class"
(Storm classification 1 5) options are selected,
then what will be
displayed is the point
when those storms first
attained that class.
Entering information
into the following date
fields can optionally
narrow the selection:
Start Date - The starting date range of the selection criteria, Month/Day.
Ending Date - The ending date range of the date selection criteria, Month/Day.
For example, to display all the locations where class 4 hurricanes attained that level
between August 1st and September 30th, you would select "Class 4 Formation Points"
and enter 08/01 in the starting date field and 09/30 in the ending date field. The results of
this query are shown on the next page.
230
HURRTRAK & Global Tracker Users Guide 1992-2012, PC Weather Products, Inc.
Formation points chart
This window displays the results of the formation point select query. It shows a
white circle for every storm that attained the level specified in the selection.
Options available include:
Close Window - Closes this window.
Undo – Undoes last action (1 level only)
DISPLAY:
Display Locations - Displays the locations in the selected location group.
Display Latitude/ Longitude values - Displays latitude and longitude labels along the sides and top of
the tracking chart.
Replot – Allows the user to re-plot the formation points in smaller or larger sizes.
Stretch - Displays the tracking chart in "full screen" mode. No operations can be done while in this mode,
as it is only for viewing. Clicking the mouse button will return you from stretch mode.
Annotate Chart - Allows the user to add his/her notes to the tracking chart being displayed. After selecting
this option, you select the point you wish to add comments by pressing the right mouse button on the
screen and then entering the text desired. When done, click on "end annotate" on the menu bar.
231
HURRTRAK & Global Tracker Users Guide 1992-2012, PC Weather Products, Inc.
Print/Export:
Print Setup – Allows the user to define which printer settings they would like to use.
Color - Prints the current image in color. If you have a B/W printer, your print driver will convert the colors to gray
scale.
Grayscale - Prints the current image in gray scale regardless of your printer type.
Export image to Google Earth – exports Image to Google Earth.
Export Google Earth KML – Exports all of the displayed formation points to Google Earth using KML.
Save Image:
Copy to Clipboard - Copies the current image to the windows clipboard for pasting into most graphics
applications.
Save to File - Saves the current image to a BMP, PCX, TIF or JPG file. Most all windows graphics
and word processing applications accept BMP files.
Save fax image to File - Saves the current image to a BMP, PCX, TIF, or JPG file after automatically
modifying the image to "line art". All colors are changed to black, while the Ocean and Land areas
are set to white.
Help - Displays this help screen.
232
HURRTRAK & Global Tracker Users Guide 1992-2012, PC Weather Products, Inc.
Location Historical Analysis
This option is only active when a group of storms has been selected via the "select
storms by location" method. It displays the storm group trend information indicating what
percent strengthened, weakened and remained the same for the prior 6 hours, next 6, 12
and 24 hours. This is useful when using the system to compare the historical data to a
current storm situation.
Options available from here include:
PRINT - Print the current information.
Cancel - Close this window.
233
HURRTRAK & Global Tracker Users Guide 1992-2012, PC Weather Products, Inc.
SLOSHView - SLOSH & Inundation Analyzer
SLOSHVIEW Tutorial
SLOSHView is a module in the HURRTRAK system which gives the user great flexibility in
viewing the SLOSH MOM and MEOW storm surge data.
In addition to displaying the "raw" SLOSH values, the system will also calculate and
graphically display the inundation analysis... which is the potential water level above
ground, as well as generate a SLOSH report indicating potential flood levels for specific
locations. All of this is done on user-selectable maps that can be drawn down to the street
level. The mapping database also includes landmarks, such as cities, railroads, airports,
pipelines, power lines, and more. For information on Inundation Analysis, see page 295.
There are three key databases installed in order to do the SLOSHView Inundation Analysis:
1. NWS SLOSH Basin Analysis - This data is provided courtesy of the National Weather Service.
Will Shaffer of the NWS has been very helpful. For more information on SLOSH and how it is
derived, see page 293.
2. USGS Digital Elevation Model database - This data was procured from the USGS and contains
elevation information for all coastal areas on a 1 arc second grid. This equates to a data point
about every 100 ' or so.
3. US mapping Information - This database was procured from a 3rd party vendor. It contains
detailed road atlas mapping information (street level).
By combining the detailed mapping with the SLOSH and elevation data, the SLOSHView program
allows the user to depict potential storm surge flooding areas on very detailed maps. See an
example below.
When starting the SLOSH View Module, the SLOSH basin analyzed, when the program last
closed, is presented (the initial default location is Miami, FL). At this point, the user may "zoom"
down to the desired level of detail to analyze. In the following example, we used Tampa, FL.
234
HURRTRAK & Global Tracker Users Guide 1992-2012, PC Weather Products, Inc.
When the user selects the area of Tampa Bay, they do a MOM SLOSH analysis which shows the
raw SLOSH values.
Or, they may do a MOM inundation analysis for the same area which takes into account the land
elevation.
235
HURRTRAK & Global Tracker Users Guide 1992-2012, PC Weather Products, Inc.
The user zooms down some more to the City of Tampa and now does a MEOW inundation
analysis for a Cat 4 storm moving NNE at 15 MPH during high tide.
Finally, the user exports the Cat 4 MEOW polygons to Google Earth to view the data in 3D using
the GE interface.
Obviously, a certain amount of care must be taken when zooming down
to very small (street level) maps. The SLOSH analysis and USGS data
are not exact enough to narrow flooding areas down to individual streets.
236
HURRTRAK & Global Tracker Users Guide 1992-2012, PC Weather Products, Inc.
SLOSHView Main Chart Select Display (MOM Mode)
When starting the SLOSHView Module, the program starts in SLOSH MOM mode and the
SLOSH basin analyzed, when the program last closed, is presented (the initial default location is
Miami, FL). You may use the left mouse button to zoom into the area of interest (use the right
button to zoom out). When the desired map area is displayed, there are several menu and
toolbar options available. They include:
Exit - Exits the SLOSHView program.
Select Basin – This option allows the user to select the SLOSH basin to examine.
All of the available SLOSH basins are displayed, as well as the option to select the
closest one to the currently displayed geographical area.
Switch to MEOW Analysis – This option allows the user to switch from MOM
mode into MEOW mode.
Plot MOM
SLOSH (Raw) - Plots the raw SLOSH polygons for a certain category of
storm without taking into account land elevation.
SLOSH (Inundation) – Plots the SLOSH inundation level (above ground
level) for a certain category of storm, taking into account the elevation of
the land
237
HURRTRAK & Global Tracker Users Guide 1992-2012, PC Weather Products, Inc.
Export SLOSH polygons to Google Earth – Exports the raw SLOSH
polygons to GE with associated SLOSH level data. This allows the user
to view SLOSH information with Google Earth’s terrain feature.
SLOSH Report (MOM) - Allows the user to generate MOM inundation reports for a
location group.
Options
Font - Displays the font control screen, as shown on page 67..
SLOSH - Displays the SLOSH options screen, as shown on page 246.
Optimize for Google Earth – This option only applies to the export of graphics to
GE. It removes all streets and labels, so they do not interfere with the GE layers.
Mousepointer:
Show Picture Icon - Displays an icon of "flooding" home, which changes appearance as
the inundation value changes.
Show SLOSH value - Displays the "raw" SLOSH value for that location for the last basin
analyzed.
Show Inundation value - If the Digital Elevation Model (DEM) data was installed, this will
display the inundation value for that location.
Show Elevation value - If the Digital Elevation Model (DEM) data was installed, this will
display the elevation in feet of the cursor position. The DEM data only covers the
Atlantic and Gulf Coast of the US, PR and the USVI.
Show Latitude value - Displays the latitude of the cursor position.
Show Longitude value - Displays the longitude of the cursor position.
Help - Displays help.
An additional set of options is available by right mouse clicking any area of the map image
BEFORE plotting SLOSH. See page 247 for more information.
Street Atlas data is only available for the US Gulf and East Coastal States, as well
as Hawaii, PR and the USVI
238
HURRTRAK & Global Tracker Users Guide 1992-2012, PC Weather Products, Inc.
SLOSHView Data Display (MOM Mode)
While viewing SLOSH plots on a chart, there are several menu and toolbar options
available. They include:
Exit - Exits system.
Select Basin – This option allows the user to select a different SLOSH basin. All of
the available SLOSH basins are displayed, as well as the option to select the closest
one to the currently displayed geographical area.
Switch to MEOW Analysis – This option allows the user to switch from MOM mode
into MEOW mode.
Plot MOM
SLOSH (Raw) - Plots the raw SLOSH polygons for a certain category of storm
without taking into account land elevation.
SLOSH (Inundation) – Plots the SLOSH inundation level (above ground level)
for a certain category of storm, taking into account the elevation of the land
Export SLOSH polygons to Google Earth – Exports the raw SLOSH polygons
to GE with associated SLOSH level data. This allows the user to view
SLOSH information with Google Earth’s terrain feature.
239
HURRTRAK & Global Tracker Users Guide 1992-2012, PC Weather Products, Inc.
Undo - Removes last or all changes.
Reset Image - This option resets the image and returns the user to the chart selection mode.
Display
MOM Legend - Displays the color-coded SLOSH legend. The colors corresponding to
SLOSH values are set in SLOSH Options.
Locations - Displays all of the locations in the selected location group. The text properties
used for displaying the location names are set in Font Options.
County Names - Displays the county names for the US coastal states
Annotate - This option allows the user to add comments, etc. directly onto the tracking
chart image. When Annotate is selected, whenever the mouse button is pressed,
the user notes entry screen, shown above, is displayed. The text that is entered
will appear at the position where the mouse button was pressed. The size, color,
and other font properties used for the user notes are set in Font Options.
Selecting End Annotate will return the mouse button function to its original
function.
Send - Allows user to send image or PDF file via Email, as shown on page 156.
Print/Export - Allows the user to print or export the image.
Save Image - Allows the user to save the image..
SLOSH REPORT (MOM) – Allows the user to generate inundation reports for a SLOSH location
group.
Options:
Font - Displays the font control screen.
SLOSH - Displays the SLOSH options screen, as shown on page 246.
Optimize for Google Earth – This option only applies to the export of graphics to GE. It
removes all streets and labels, so they do not interfere with the GE layers.
Mousepointer:
Show Picture Icon - Displays an icon of "flooding" home, which changes appearance as the
inundation value changes.
Show SLOSH value - Displays the "raw" SLOSH value for that location for the last basin
analyzed.
Show Inundation value - If the Digital Elevation Model (DEM) data was installed, this will
display the inundation value for that location.
Show Elevation value - If the Digital Elevation Model (DEM) data was installed, this will display
the elevation, in feet, of the cursor position. The DEM data only covers the Atlantic and
Gulf Coast of the US, PR and the USVI.
Show Latitude value - Displays the latitude of the cursor position.
Show Longitude value - Displays the longitude of the cursor position.
Help - Displays help.
After plotting SLOSH, you can zoom in by “rubber banding” an area with your mouse (left button) or
by selecting zoom in or zoom out. The SLOSH information will re-plot at your new zoom level.
In addition, when plotting a MOM the following mouse actions will display the following information.
Left Click + Shift – Displays the raw SLOSH value
Right Click – Displays the Inundation level
Right Click + Shift – Places the “house” icon at the position of your cursor
240
HURRTRAK & Global Tracker Users Guide 1992-2012, PC Weather Products, Inc.
SLOSHView Main Chart Select Display (MEOW Mode)
While switching to SLOSH MEOM mode, the options available are a little different because the
user has to specify the storm motion and strength, so the system can display the correct MEOW.
You may use the left mouse button to zoom into the area of interest (use the right button to zoom
out). When the desired map area is displayed, there are several menu and toolbar options
available. They include:
Exit - Exits the SLOSHView program.
Select Basin – This option allows the user to select the SLOSH basin to examine.
All of the available SLOSH basins are displayed, as well as the option to select the
closest one to the currently displayed geographical area.
Switch to MOM Analysis – This option allows the user to switch from MEOW
mode into MOM mode.
Plot MEOW
241
HURRTRAK & Global Tracker Users Guide 1992-2012, PC Weather Products, Inc.
SLOSH (Raw) - Plots the raw SLOSH MEOW polygons for a certain category
of storm, without taking into account land elevation.
SLOSH (Inundation) – Plots the SLOSH MEOW inundation level (above
ground level) for a certain category of storm, taking into account the
elevation of the land.
Export SLOSH polygons to Google Earth – Exports the raw SLOSH
MEOW polygons to GE with associated SLOSH level data. This allows
the user to view SLOSH information with Google Earth’s terrain feature.
SLOSH Report (Current MEOW) - Allows the user to generate MEOW inundation
reports for a location group. It will only report on locations that are in the current
selected basin.
Options
Font - Displays the font control screen..
SLOSH - Displays the SLOSH options screen, as shown on page 246.
Optimize for Google Earth – This option only applies to the export of graphics to
GE. It removes all streets and labels so they do not interfere with the GE layers.
Mousepointer:
Show Picture Icon - Displays an icon of "flooding" home, which changes appearance as
the inundation value changes.
Show SLOSH value - Displays the "raw" SLOSH value for that location for the last basin
analyzed.
Show Inundation value - If the Digital Elevation Model (DEM) data was installed, this will
display the inundation value for that location.
Show Elevation value - If the Digital Elevation Model (DEM) data was installed, this will
display the elevation in feet of the cursor position. The DEM data only covers the
Atlantic and Gulf Coast of the US, PR and the USVI.
Show Latitude value - Displays the latitude of the cursor position.
Show Longitude value - Displays the longitude of the cursor position.
Help - Displays help.
In MEOW mode, an additional set of options is shown on the right side of the screen. They
include:
Storm Motion Compass – Select the direction in which the storm situation being analyzed is
moving. i.e. A storm moving towards the NNE should have NNE selected.
Storm Category – Select the category of the storm situation being analyzed.
Storm Speed/Tide – Select the storm’s forward motion and tide (if available).
Command buttons available:
Plot MEOW SLOSH (raw) – This matches the Plot MEOW menu command and is put on the right side
panel for convenience.
Plot MEOW Inundation – This matches the Plot MEOW menu command and is put on the right side panel
for convenience.
Export MEOW SLOSH Polygons to Google Earth - This matches the Plot MEOW menu command and is
put on the right side panel for convenience.
Finally, by checking the “Close this Window” option in the upper right hand portion of the panel,
the right side panel will be hidden when doing the analysis. Selecting RESET Image will unhide
the panel, so that the user can select different analysis options.
242
HURRTRAK & Global Tracker Users Guide 1992-2012, PC Weather Products, Inc.
SLOSHView Data Display (MEOW mode)
While viewing SLOSH MEOW plots on a chart, there are several menu and toolbar options
available. They include:
Exit - Exits system.
Select Basin – This option allows the user to select a different SLOSH basin. All of
the available SLOSH basins are displayed, as well as the option to select the closest
one to the currently displayed geographical area.
Switch to MEOW Analysis – This option allows the user to switch from MEOW mode
into MOM mode.
Plot MEOW
SLOSH (Raw) - Plots the raw SLOSH MEOW polygons for a certain category of
storm, without taking into account land elevation.
SLOSH (Inundation) – Plots the SLOSH MEOW inundation level (above ground
level) for a certain category of storm, taking into account the elevation of the
land.
Export SLOSH polygons to Google Earth – Exports the raw SLOSH MEOW
polygons to GE with associated SLOSH level data. This allows the user to
view SLOSH information with Google Earth’s terrain feature.
Undo – Removes the last or all changes.
Reset Image - This option resets the image and returns the user to the chart selection mode.
243
HURRTRAK & Global Tracker Users Guide 1992-2012, PC Weather Products, Inc.
Display
MEOW Legend - Displays the color-coded SLOSH legend. The colors corresponding to
SLOSH values are set in SLOSH Options.
Locations - Displays all of the locations in the selected location group. The text properties
used for displaying the location names are set in Font Options.
County Names - Displays the county names for the US coastal states.
Annotate - This option allows the user to add comments, etc. directly onto the tracking
chart image. When Annotate is selected, any time the mouse button is pressed,
the user notes entry screen, shown above, is displayed. The text that is entered
will appear at the position where the mouse button was pressed. The size, color
and other font properties used for the user notes are set in Font Options.
Selecting End Annotate will return the mouse button function to its original
function.
Send - Allows user to send image or PDF file via Email, as shown on page 156.
Print/Export - Allows the user to print or export the image .
Save Image - Allows the user to save the image.
SLOSH Report (Current MEOW) - Allows the user to generate MEOW inundation
reports for a location group. It will only report on locations that are in the current
selected basin.
Options:
Font - Displays the font control screen.
SLOSH - Displays the SLOSH options screen, as shown on page 246.
Optimize for Google Earth – This option only applies to the export of graphics to GE. It
removes all streets and labels, so they do not interfere with the GE layers.
Mousepointer:
Show Picture Icon - Displays an icon of "flooding" home, which changes appearance as the
inundation value changes.
Show SLOSH value - Displays the "raw" SLOSH value for that location for the last basin
analyzed.
Show Inundation value - If the Digital Elevation Model (DEM) data was installed, this will
display the inundation value for that location.
Show Elevation value - If the Digital Elevation Model (DEM) data was installed, this will display
the elevation in feet of the cursor position. The DEM data only covers the Atlantic and Gulf
Coast of the US, PR and the USVI.
Show Latitude value - Displays the latitude of the cursor position.
Show Longitude value - Displays the longitude of the cursor position.
Help - Displays help.
After plotting SLOSH, you can zoom in by “rubber banding” an area with your mouse (left button) or
by selecting zoom in or zoom out. The SLOSH information will re-plot at your new zoom level.
In addition, when plotting a MOM the following mouse actions will display the following information.
Left Click + Shift – Displays the raw SLOSH value
Right Click – Displays the Inundation level
Right Click + Shift – Places the “house” icon at the position of your cursor
244
HURRTRAK & Global Tracker Users Guide 1992-2012, PC Weather Products, Inc.
SLOSH REPORT
The SLOSH REPORT show the potential inundation levels (ft ASL) for specific locations. It
can be run in both MOM and MEOW mode. The only difference is that, while in MEOW
mode, the report will only include locations “within” the currently selected basin’s area.
In order to create a Slosh Report, the user must do one of the following:
1
2
3
4
From System Setup, location maintenance, define a SLOSH location group, associating it to a
SLOSH basin. See page 197.
Associate specific locations to this location group. See page 198.
If desired, specify the elevation for the locations added to the location group. See page 187.
From SloshView, select Slosh Report.
OR
From SloshView, select SLOSH report for any location group. Make sure that the location in this group
has been accurately defined for location and elevation.
You can send, print, copy or Export this report to Google Earth.
In MOM mode, locations without designated SLOSH basins will be assigned one by the system
based on distance (i.e. the system will pick the closest one). Caution must be exercised when
viewing the results of this data, as the SLOSH analysis errors increase as the location’s distance
from the SLOSH basin “center” increases.
245
HURRTRAK & Global Tracker Users Guide 1992-2012, PC Weather Products, Inc.
Slosh / Inundation Options
SLOSH Plot type - This allows the user to control the look of the SLOSH analysis. The 3 options
are solid, web, and pattern. Experiment with each type with varying sized maps to determine which
one you prefer, but we suggest solid.
Inundation Plot type - This allows the user to control the look of the SLOSH Inundation analysis.
The 2 options are solid and pattern. Experiment with each type with varying sized maps to
determine which one you prefer, but we suggest solid
MOM/MEOW plotting levels and colors - This allows the user to control the SLOSH
values and associated colors used when doing a SLOSH analysis (regular or
inundation). The values are in feet and any color can be selected.
SLOSH Report options - These options control which locations will appear on a
SLOSH report. It is suggested you keep both option checked.
246
HURRTRAK & Global Tracker Users Guide 1992-2012, PC Weather Products, Inc.
Right Click Commands
The SLOSHView system uses a 3rd party software product called Pepperwhite Streets™.
When you right click on the screen, you are presented with several options (shown
below). Most of them are self-explanatory, except for Configure Map and Look Up
Address. In the Hurrtrak module, the base mapping control is only visible via the
Map Selection Tab.
When you select Configure Map, you are presented with a separate screen that has
many options related to what will be drawn on the current map. Review them and
experiment to understand their function. Modifications done to these setting are only valid
for the current session.
247
HURRTRAK & Global Tracker Users Guide 1992-2012, PC Weather Products, Inc.
When you select Look up Address, you are presented with an entry screen which allows
you to enter a complete address. If this address is found in the database, that map area
will be shown. An example of a data entry line and the map it created is shown below.
Street Atlas data is only available for the US Gulf and East Coastal States, as well
as Hawaii, PR and the USVI.
248
HURRTRAK & Global Tracker Users Guide 1992-2012, PC Weather Products, Inc.
SLOSHView Considerations
Performance:
Due to the large number of calculations required to do a SLOSHView analysis, performance
may be a consideration. An inundation analysis performed on a 1024 X 768 chart will result in
786,432 separate inundation calculation iterations. If you want to speed up the analysis, there
are 4 ways to improve performance:
1. Get the fastest processor you can
2. Run your system in true color mode (24+ bit).
3. Smaller maps. A 640 X 480 map will do 60% fewer calculations than a 1024x768 one.
4. Run the system local and not through a network server.
DETAILS:
While it is tempting to "zoom" down to a very detailed "street" level of chart, it is dangerous to
go too far. Neither the SLOSH data nor the elevation data is resolved to a sufficient level of
detail to do these street level comparisons. Some of this is dependent on how far the area
being analyzed is from the SLOSH basin center, in addition to the topographical nature of the
area.
249
HURRTRAK & Global Tracker Users Guide 1992-2012, PC Weather Products, Inc.
H*Wind Display
The NOAA's Atlantic Oceanographic and Meteorological Laboratory (AOML), Hurricane Research Division
operates the H*Wind Project. The purpose is to devise computer programs to integrate wind data in and
around a hurricane from a variety of platforms into a single wind analysis reduced to the surface. See
http://www.aoml.noaa.gov/hrd/Storm_pages/surf_background.html for more information.
H*Wind display provides an interactive way to view this data, as well as to do some impact analysis.
Important: H*Wind data is imported into the system via Hurrtrak Online. The user must manually request
the latest H*Wind data via the HURRTRAK ONLINE Tab in the HURRTRAK system.
Availability: Because this is not NHC operational data, but rather experimental data put out by AOML, data
availability is highly variable and at the discretion of AOML. We will make data available as it becomes
available to the "public" at the AOML web site.
When the H*Wind display system is started, if data exists in the H*Wind database, the user will have the
option of opening a "storm".
When a storm (Isabel) is opened, the user is presented with the following screen.
250
HURRTRAK & Global Tracker Users Guide 1992-2012, PC Weather Products, Inc.
The user can then select a specific observation by left clicking on the observation point
(storm center). After selecting, the following screen is presented showing some of this
storm's H*Wind observation data. Point wind direction (arrows) and speed (in knots) are
displayed. Zooming in or out will display more or less information (see Pan and Zoom
mapping for more information). In addition, mouse cursor position information of latitude,
longitude, wind speed and direction are shown in the information box in the upper left
corner.
File - This allows the user to open a new storm, redisplay observations for the current storm, or Exit the
system.
Report – This displays the H*Wind impact report, which details "current" wind conditions for a location
group, counties or zip codes. See sample on next page.
Annotate – This allows the user to enter comment in a text box.
Send – This allows the user to send this image via email.
Print/Export – This allows the user to print this image or export to Google Earth.
Save Image – This allows the user to save this image to a graphic or PDF file.
Help – Displays help information about H*Wind.
251
HURRTRAK & Global Tracker Users Guide 1992-2012, PC Weather Products, Inc.
H*Wind Report
The H*Wind impact report details "current" wind conditions for a location group, counties
or zip codes.
While viewing the report, there are several menu options available. They include:
Exit - Closes this window.
Send - Sends this report via email.
Print - Prints this report.
Copy - Copies the report content to the clipboard.
Help - Displays this help.
252
HURRTRAK & Global Tracker Users Guide 1992-2012, PC Weather Products, Inc.
Hurricane Reconnaissance
When the hurricane reconnaissance program is started, the user is presented with a
screen similar to the above screen. At this point, the user can select the mapping area
they are interested in (see page 299 for more information) and then perform the program
functions.
The reconnaissance data is downloaded via the HURRTRAK ONLINE service. By setting
the HURRTRAK ONLINE Automatic Data polling option, the system will check for new data
on a regular basis. You can also manually retrieve the data via the Hurrtrak Online tab
options.
There are 3 types of recon reports that the program displays.
Vortex - Summarizes hurricane data, to include the location of the eye (the "fix"), the minimum central
pressure, maximum winds on the way into the eye, temperature inside and outside of the eye, etc.
RECCO - A line of weather data observed by the weather officer, usually every 30 minutes enroute, and at
the turnpoints in the storm. Typically, only the first eight groups are encoded, but on rare occasions clouds,
radar and surface winds are included.
HDOB (High Density) – The NOAA and USAF recon flights often include observations at 30 seconds
intervals as they flight in and around the storm. This information includes the flight level conditions and
often the surface estimates of wind speed and pressure. At normal flight conditions this provides a data
point approximately every 2 miles.
An explanation of the key items shown in the recon program is shown below.
253
HURRTRAK & Global Tracker Users Guide 1992-2012, PC Weather Products, Inc.
A. This displays the latitude and longitude of the cursor position.
B. These isolated reports represent non-vortex type recon reports. The wind speed and direction of the
report is indicated and the remaining items are decoded on the right information panel.
C. The circle represents the storm's vortex center (eye in well-defined storms). By passing the mouse over
this area, the report is decoded on the right information panel.
D. The NOAA and USAF recon flights often include observations at 30 seconds intervals as they flight in
and around the storm. This information includes the flight level conditions and often the surface estimates of
wind speed and pressure. At normal flight conditions this provides a data point approximately every 2 miles.
E. These options control whether to show the observation labels and what size font to use when displaying
them.
F. This option allows the user to identify what types of recon reports to show. The options are the Vortex,
RECCO and HDOB (High Density) reports. In addition, the user can specify whether to show the USAF
and/or the NOAA HDOB flight data.
G. This option instructs the system to display only the recon reports received in the last x hours... where x is
selected by the user.
H. The user can also select "older" recon reports by selecting a “from” and “to” date range. All reports that
fall inside this range will be displayed.
I. The right information panel displays the decoded information for vortex, High Density and RECCO
reports. The decoded information displayed varies based on which report is being pointed to with the
mouse. An example of each is shown below.
254
HURRTRAK & Global Tracker Users Guide 1992-2012, PC Weather Products, Inc.
Vortex
HDOB (High Density)
RECCO
255
HURRTRAK & Global Tracker Users Guide 1992-2012, PC Weather Products, Inc.
Additional HDOB capabilities include the ability to plot the graph of wind speed,
temperature/pressure and pressure/height of the pass through the storm. The user must
select the first and last observation they would like to analyze and then select the plotting
option. See the examples below.
256
HURRTRAK & Global Tracker Users Guide 1992-2012, PC Weather Products, Inc.
While using the reconnaissance program, the following options are available:
Exit - Closes this window.
Annotate - The annotate feature here is identical to the one described earlier.
Send - Sends the current image to an Email recipient
Print – Several print options which allow the user to print as a color or gray scale image.
Google Earth Export:
Export Static Image to Google Earth - Exports the current image and displays as an overlay on Google
Earth.
Export Vortex reports – Exports the displayed vortex reports via KML to Google Earth.
Export RECCO reports - Exports the currently displayed RECCO reports, via KML, to Google Earth.
Export HDOB reports - Export the currently displayed High Density reports, via KML, to Google Earth.
Export All reports - Exports the displayed Vortex, RECCO and High Density reports, via KML, to Google
Earth.
Export HDOB with virtual flight - This is a special type of export. It exports the displayed HDOB reports to
Google Earth, via KML, and also generates a GE tour which we call a virtual flight. It start the tour you
must double click on the “virtual flight” item within the exported KML file. See image below.
Export Animated HDOB - This option is similar to the export HDOB reports option above except the
observations are exported with date/time stamps, allowing the user to display the observations in an
animated fashion. Within Google Earth, the user must manually start the animation.
Options – This allows the user to switch between plotting flight level wind barbs or surface level wind
barbs.
Save Image - The save image options here are the same as those described earlier.
Graph HDOB – These options are somewhat redundant with the options on the information panel for
the HDOB reports. They include:
Clear Graph Selection – Clears the previously select start and end points for graphing.
Select HDOB observations – Prompts the user to select (with the mouse) the first and last observation points
for graphing.
Set Date1 – Allows the user to select the first observation point.
Set Date2 – Allows the user to select the last observation point.
Temperature / Dew Point – Plots a temperature / dew point graph as shown on the prior page.
Surface Pressure – Plots a surface pressure graph as shown on the prior page.
Flight Level Wind Speed – Plots a flight level wind speed graph.
Surface Wind Speed – Plots a surface wind speed graph as shown on the prior page.
Help - Displays help information.
If you want more general information on hurricane reconnaissance, check www.hurricanehunters.com
257
HURRTRAK & Global Tracker Users Guide 1992-2012, PC Weather Products, Inc.
Hurricane Model Plot
When the hurricane model plot program is started, the user is presented with the above screen. At
this point, the user can select the mapping area they are interested in via zoom in (rubber band area
with mouse) or zoom out (right click) (see page 299 for more information) and then perform the
program functions.
The model data is downloaded via the HURRTRAK ONLINE service. In addition to manually
requesting the model data, by setting the HURRTRAK ONLINE Automation option, you can force the
system to check for new data on a regular basis.
There are 2 program controls that determine which model forecast will plot.
-
The Date selection box which contains a date and time field.
-
A duration (hours) field box which instructs the system how far to look back from the date
selection.
The example above is showing all model forecast that were issued within 8 hours of 8/28/2008 at
13:48 UTC.
MOUSE Options:
When the user moves the mouse over a model verification point, the name of the model and description will
be displayed in the status bar at the top of the map image.
258
HURRTRAK & Global Tracker Users Guide 1992-2012, PC Weather Products, Inc.
TOOLBAR Options:
An important Toolbar option allows the user to select the models they would like to Plot. By selecting the
following icon...
The following model selection screen will be displayed....
Simply select the models you would like to see plotted and uncheck the ones you do not want to see. An
additional option of "Max's Favorite Models" will select only the hurricane forecast models that are on Max
Mayfield's preferred list. This may vary from time to time as models change. The selected models will be
preserved between ModelPlot sessions.
MENU OPTIONS:
While using the model plot program, the following options are available:
Exit - Closes this window.
Annotate - The annotate feature here is identical to the one described earlier.
Send - Sends the current image to an Email recipient.
Print - The print options here are the same as those described earlier, except that the fax print option
is not available.
Google Earth Export – This option allows the user to export the current image or the currently
displayed forecast model KML to Google Earth.
Save Image - The save image options here are the same as those described earlier.
Options - This option allows the user to change the width of the forecast models lines or select which
models to plot.
Help - Displays help information.
259
HURRTRAK & Global Tracker Users Guide 1992-2012, PC Weather Products, Inc.
Desktop Satellite
The desktop satellite program is a handy little program that runs in the system tray and will
maintain a current satellite image on your Windows Desktop. It will automatically change
from daytime to nighttime (IR) satellites and vice versa at sunrise and sunset.
To allow this to function you need…
1. An always on internet connection
2. To select the “Start Desktop Satellite on Windows startup” checkbox on the General
User options
The options for this tray program (right click on cloud icon in tray) are:
Options – This option presents the user with the following window, allowing them to change the 6 (3
day, 3 night) default satellite images, as well as the update interval, number of frames to save for
animation. Only one URL of each (day/night) can be selected. You can also select a local jpg, gif,
bmp, png or tif image to display.
260
HURRTRAK & Global Tracker Users Guide 1992-2012, PC Weather Products, Inc.
The userid and password fields can be used if your favorite satellite image is password
protected.
Do not update desktop – This option prevent the program from updating the desktop... however the
images will be included in the animation sequence. Some users may want to do this if they have a
favorite image on their desktop or if they utilized a "themed" desktop.
Force Update – This option will force the program to update the current satellite image, rather than
waiting the typical 20 minutes.
Animate saved images – This option will animate the saved images on the desktop. When animating,
all desktop icons are hidden to allow for a faster animation sequence.
Quit – Closes the tray options.
End Desktop Satellite – Closes the program.
Finally, we suggest you setup your windows display options to CENTER the image on
your desktop, rather than stretch or tile. Windows XP example below.
261
HURRTRAK & Global Tracker Users Guide 1992-2012, PC Weather Products, Inc.
Tray Alert Messaging
We found that Hurrtrak users, busy at their workstations, desired a way to be alerted to
new and changing conditions in the tropics. The "tray alert messaging" (TAM) system
notifies our users, via pop-up tray messages, of several noteworthy conditions including:
the formation of new storms, storm strengthening or weakening, the issuance of watches
or warnings, updated storm data, issuance of the last advisory, new tropical weather
outlooks or new tropical disturbance statements.
This module will initialize when Windows is started and depends on the Hurrtrak Online
Timer program also running in the System Tray.
The options for this tray program (right click on the “I” bubble icon in tray) are:
Redisplay last message. If you miss a message it will redisplay the last message displayed by the
system.
Display Tray Alert Log – This option displays, in a concise manner, all of the messages displayed
since the last restart of your system along with the date/time they were displayed.
Options – This option presents the user with the following window, allowing them to change which
conditions they should be alerted to and how to handle those conditions.
262
HURRTRAK & Global Tracker Users Guide 1992-2012, PC Weather Products, Inc.
Selections on this window include:
Tray Alert Active – This option will activate or de-activate the Tray Alert Function.
Tropical Basins to monitor – For Global or Advanced users this option allows the user to see
messages only for tropical areas they are interested in.
Further Information with mouse click on message – This option allows a “helper” program to
open when the message is clicked upon via the mouse. For example, if a new tropical weather
outlook message is displayed, the Tropical Weather Outlook will display when the message is
clicked.
Redisplay missed messages – This option will redisplay the message every 5 minutes unless it
has been “clicked” on. This assures you will not miss any messages since the Windows operating
system will often hide tray messages when there is other activity on the PC system.
Alert Selection – In this section you specify which alert you would like to see displayed. Uncheck
any you do not want to see. When there is an active reconnaissance flight, the New RECON Data
option will result in many tray messages.
Exit – This option closes the program. No more messages will be displayed.
263
HURRTRAK & Global Tracker Users Guide 1992-2012, PC Weather Products, Inc.
Location Import Utility
The Hurrtrak Advanced system includes a location / location group import utility. This program
allows you to import your organization’s locations, as well as the ability to automatically associate
them to a location group.
The utility is accessible from the START PROGRAMS menu – Hurrtrak Advanced program group.
Select “Run Location Import Utility”. It is best if the main tracking program is not running at the
time this utility is used.
When executed, the user is presented with a screen, whereby they must select the input import
file, as well as the location group the imported locations will be grouped under, if any. There are 3
choices of input files.. Comma Delimited (standard format), Comma Delimited (non-standard
format) or an ESRI Point type shape file.
If selecting a comma-delimited (standard format) input file, the following screen and field
are presented:
The input file must be comma-delimited and is required to be in the following format:
Location Name (25), Location State (3), Latitude, Longitude.
The first row must NOT contain data field names and the data fields must NOT have any commas or
quotes. Latitude and Longitude must be entered in degrees and tenths of a degree (not degrees and
minutes). West longitudes, like the ones in the US, must be specified as a negative number. A sample
input record for Fort Lauderdale, Florida with a plot size of 5 miles would look like the following:
Fort Lauderdale, FL, 26.14, -80.14
Plot Size: If you want to set the plot size to a certain value for all locations, specify it in the plot size field. It
will determine how the location will appear on a map. A plot size of zero will only show the location name,
while larger plot sizes will draw a circle at the diameter of the plot size (nm). Leaving this field blank will
force a value of 1.
264
HURRTRAK & Global Tracker Users Guide 1992-2012, PC Weather Products, Inc.
Location Prefix: If you want all of the locations being imported to have the same prefix identifier, enter it in
this field. For example, the prefix "Store-" will put this in front of the name of each imported location name.
i.e. a location name 1234 will be loaded as "Store-1234". This is not a required field.
If you would like ALL of the locations in the import file to be grouped into a location group, enter a location
group name in that field. If you do not want to group these locations at this time, leave the location group
name field blank.
When the import is complete, the following verification message is displayed:
When the import is complete, the system will suggest that the locations roughness indexes be calculated.
You do not have to do this now. However, the next time you go into System Maintenance – Location
Maintenance, the system may ask if you want to calculate roughness indices for these locations. Reply Yes
to do so. It may take a few minutes to complete.
If selecting a comma delimited (non-standard format), the following screen is presented.
The input file must be in a comma delimited format however the key fields can be at any position
in the input file. The first row must contain the information on where to find the location name,
state, latitude and longitude. The subsequent rows must contain the data. For example, if the
265
HURRTRAK & Global Tracker Users Guide 1992-2012, PC Weather Products, Inc.
location name is at position 3, the state at position 5 and latitude and longitude are at positions 7
and 8... the first row would be coded as...
3,5,7,8
with the following rows looking something like,
fielda data, fieldb data, Fort Lauderdale, fieldx data, FL, 26.14, -80.14 (field a, b and x data will be
ignored).
The rest of the import procedure is the same as described above.
If the input data file is a point type Shape file, the following screen is presented:
The data fields are identical to the comma-delimited input file method. However, an additional selection
screen is presented during the import. It displays the data fields within the point shape file.
Here, you must identify the unique ID field and, optionally, the State data field. When identified, select
“continue” and the locations will be imported, as described with the comma-delimited method above.
266
HURRTRAK & Global Tracker Users Guide 1992-2012, PC Weather Products, Inc.
Inland Wind Model
The inland wind model was developed by Mark DeMaria (NOAA/NWS/TPC) and John Kaplan
(NOAA/AOML/HRD). The model applies a simple two-parameter decay equation to the hurricane wind field
at landfall to estimate the maximum sustained surface wind as a storm moves inland. This model can be
used for operational forecasting of the maximum winds of landfalling tropical cyclones. It can also be used
to estimate the maximum inland penetration of hurricane force winds (or any wind threshold) for a given
initial storm intensity and forward storm motion. For further explanation refer to:
Kaplan, J., DeMaria, M., 1995: A Simple Empirical Model for Predicting the Decay of Tropical Cyclone
Winds After Landfall. J. App. Meteor., 34, No. 11, 2499-2512.
The graphics included in the HURRTRAK system will allow you to display examples of the Maximum
Envelope Of Winds (MEOW). Three sets of graphics are shown, one for each of the regions: Gulf coast,
East Coast, and Northeast Coast. Click on the region desired and that set of graphics will be displayed.
While viewing the graphics, there are several menu options available:
Close - Closes this window.
Send - Sends the current image to an Email recipient.
Print - The print options here are the same as those described earlier, except that the fax print option is not
available.
Save Image - The save image options here are the same as those described earlier.
Help - Displays help information.
267
HURRTRAK & Global Tracker Users Guide 1992-2012, PC Weather Products, Inc.
Appendixes
APPENDIX A: Initial System Setup Items
After installing the system, there are several system/user parameters that should be setup first.
They include the following:
1. Setting up a new storm database. The system comes with a PAST database and the
databases from 1851 onward. Unless already done, the first thing you will want to do is create a
database for the current year. We recommend calling it the year.. i.e. 2011 or 2012, etc... To
create a new storm database, go to FILE-Database from the Hurrtrak Menu OR go to System
Setup Options and follow the on-screen directions. See page 179.
2. Define your "Base" Location(s). If you have an interest in a single location, you may define
it to the system in the General options. After doing so, the main application’s Risk/Impact Tab will
show storm information about your location. See page 68. If you have more than one “base”
location, add them to the location group called “Base Locations” via system setup maintenance.
3. Define your system's Email parameters. In order to use the Email capabilities of the
system, you will need to define your preferences and settings in Email General options, as shown
on page 63.
4. Define your personal Email Address book. To send E-mail via HURRTRAK's native SMTP
capability, you must first define all of the possible recipients in the Address book option on page
61. If you plan on using the MS Outlook interface, you will need to select the address books you
would like Hurrtrak to use.
5. Define your HURRTRAK ONLINE parameters. To receive HURRTRAK Online information,
you must define several parameters.
- Define your Userid and Password via HURRTRAK Online Options shown on page 77. Be certain
that you enter them EXACTLY as shown on your instructions!
- If using a proxy server, set up http proxy parameters as directed by your system network
administrator using Hurrtrak Online Options.
- Select "Start Hurrtrak Online Timer as Windows Startup" in the Hurrtrak Online Polling options.
There are many additional system and user options that are available within the system.
This list just represents the ones that typically are setup first.
268
HURRTRAK & Global Tracker Users Guide 1992-2012, PC Weather Products, Inc.
APPENDIX A2: HURRTRAK Online Timer
The Hurrtrak Online Timer module is a crucial part of the Hurrtrak system because
it allows all of the Hurrtrak components to run effectively... using the latest data.
It runs in the system tray as a "clock" icon and it's only function is to keep the Hurrtrak databases up to date
with the latest storm, recon, forecast model, rain, wind probability, surge probability information. It is
activated via an option within the Hurrtrak Online user preferences ("Start Hurrtrak Online Timer at
Windows Startup"). It appears in the system tray as shown below and has several options that appear
when the icon is "right clicked" by the mouse.
When the icon is double clicked (left mouse button) the following window will appear detailing the latest
update times and events.
The options for this tray program (right click on the “clock” bubble icon in tray) are:
Force update check - This forces the system to check for data updates immediately instead of waiting
for the next polling time.
Change update interval Atlantic/EPAC – This option temporarily changes the default polling interval
for Atlantic and Eastern Pacific data. The EPAC data is only available for Global/Advanced users. The
default polling interval is set in the Hurrtrak Online user preferences.
Change update interval WPAC/IO – This option temporarily changes the default polling interval for the
Western Pacific and Indian Ocean. This is only available for Global/Advanced users. The default polling
interval is set in the Hurrtrak Online user preferences.
Update Thumbnails - This option allows the user to force the system to download/update all of the
satellite and radar thumbnails. Normally they are updated at regular intervals defined in the system
setup options.
Help - Displays this help
Exit Hurrtrak Online Timer - Closes this program
269
HURRTRAK & Global Tracker Users Guide 1992-2012, PC Weather Products, Inc.
APPENDIX B: Decision Support Capabilities
The HURRTRAK EM/Pro and RM/Pro systems have several elements of decision
support. While the storm graphics, summary and detail impact reports, etc. all provide
information which assist the user in making key decisions, several new functions have
been added that directly tie decision (action) points to the storm forecast data.
In this topic, we will cover the key decision support functions implemented within the system. Please review
each topic in sequence.
ACTION POINTS
DECISION ARCS
DECISION ARC USER OPTIONS
EFFECT OF ACTION POINTS ON DETAIL LOCATION REPORTS
DIRECT TO POINT
ACTION POINTS
Action Points are the key elements to the added decision support in the HURRTRAK system. Action points
are "points" in time that relate to key decisions for a particular location. Examples of decisions include the
start of storm phases like:
- Awareness
- Stand-By
- Decision
- Preparation
- Evacuation
- Storm Event
- Stand Down
These action points are "triggered" by the arrival of either 34, 50 or 64 knot winds and have lead times that
may vary by category of storm. For example, for Escambia County, the Evacuation action may be
triggered 24 hours prior to projected arrival of 34 knots winds for a category 3-5 hurricane and 16 hours
prior to projected arrival of 34 knot winds for a category 1 or 2 storm.
Multiple action points can be setup for any set of locations or counties. In order to establish action Point(s)
for a location, follow these steps:
1.
2.
3.
4.
5.
6.
Go to System Setup and select location or county maintenance.
Type in all or part of the location/county name until it shows up in the list.
With that location highlighted, select Define action points.
Select Add Action point and fill in the action point name and description
Fill in the rest of the information on this action point in the table.
Add another action point, if desired.
270
HURRTRAK & Global Tracker Users Guide 1992-2012, PC Weather Products, Inc.
DECISION ARCS
As shown above, a decision arc is a tool that shows, graphically, the point when certain decisions are made
or actions initiated. For example, if a storm is moving at 10 MPH towards a location and an action point is
triggered by the arrival of 34 knot winds in 16 hours, then a "circle" is drawn around that location at a
distance of 160 miles. When, graphically, the area of 34 knot winds "intersects" with the arc, that action
point checkpoint has arrived.
On a static tracking chart, the user is presented with the option of either accepting the storm's forecast
speed of motion and intensity, or of overriding it.
If selected in animation options, the decision arc will be shown during an animation sequence.
DECISION ARC OPTIONS
In order to utilize the location action point information that was entered, the user must set up
several options within the system.
1. First, the user must select the location they would like to use for the plot decision arc function. Within
the plotting options, as shown on page 84, select the desired location from the list. Remember, the only
locations that will appear in the list are ones that have had action points defined, with the decision arc
column selected.
2. Next, the user can control the decision arc line color and line width within plotting options.
3. Within Animation Options, as shown on page 57 the user can specify if they would like a decision arc to
be visible during animation. They must also specify which action point they would like to show the decision
arc for. Finally, in calculating the size of the decision arc, the user may override the official forecast motion
and intensity (category) which is normally assumed during animation. If override is checked, the user can
then enter a different storm motion speed and intensity (category).
271
HURRTRAK & Global Tracker Users Guide 1992-2012, PC Weather Products, Inc.
EFFECT OF ACTION POINTS ON DETAIL LOCATION REPORTS
When creating a detailed location or county forecast report, all of that location's action points are examined
to see if they are triggered by the forecast wind conditions. If they are, then the appropriate action point will
appear in the action point column at the defined time. Here is an example of a forecast location report for
Escambia County with the approach of Hurricane OPAL.
In this section of the report, only the Evacuation, Storm Event and Stand Down Action Points appear.
What If Capabilities
Unrelated to action points, "what if" is a powerful "worse case scenario" tool that allows the user to change
the projected path of a storm directly to a specified location. All functions, reports, etc., except for the strike
probabilities, will then use this new path in its presentation and calculations. In addition, the main menu
screen background turns black indicating to the user that they are in "what if" mode.
When selected, the user is presented with 3 intensity and storm motion options.
1. Maintain the storm's current intensity throughout the entire forecast period.
2. Assume the NHC forecast through the entire forecast period.
3. Override the NHC forecast. If this is selected, the user is presented with a screen that allows the entry
of maximum wind speed, 34, 50 & 64 knot wind field, and speed of storm through the forecast period.
See "What if" Options on page 37 for more information.
272
HURRTRAK & Global Tracker Users Guide 1992-2012, PC Weather Products, Inc.
APPENDIX C: Status Bars / General Information
There are several status “areas” throughout the system which provide either general or
cursor positional type information. They include:
Main Menu Status Bars and General Tab Information
The main menu status bars and information include:
Storm Database Name – This status bar indicates the open storm database. Operational database
updates are applied to the Hurrtrak Online Active Database... not this one (unless they match).
Hurrtrak Online Active Database - This status bar indicates the Active Hurrtrak Online Database.
All current/operational database updates are applied to this database, not necessarily the open
database. Under operational conditions, this database should match the default open database. A RED
bar is displayed next to the storm name when the default and Hurrtrak Online databases do not match.
Active Storm Name. – The name of the currently loaded storm.
Date the database was last updated.
Date/Time the Internet host data was last examined, along with the status.
Latest Advisory of the active storm, as well as its location, movement and intensity, in
addition to its relative position to the user’s "base" location.
Map image – Through the use of icons, this image shows all of the storms in the current database.
Older storms will be indicated with a black icon, while recent storms will be indicated with a red
273
HURRTRAK & Global Tracker Users Guide 1992-2012, PC Weather Products, Inc.
icon. Double Clicking on an icon will load that storm and make it current. In addition, the track of
the current, loaded, storm is shown.
Current Date/Time and tide information (if base location has been associated to a tide
station).
Software's Serial Number.
"Special" conditions, such as the system using post storm analysis, forecast estimation,
landfall analysis, Advanced Wind Estimation, "What if " analysis, etc.
Tracking Chart Status Bars
The tracking chart status bar information includes mouse positional information:
Wind Speed
Wind Direction
Distance from Center of Storm
Latitude
Longitude
274
HURRTRAK & Global Tracker Users Guide 1992-2012, PC Weather Products, Inc.
SLOSH Inundation Analysis Status Bars.
The SLOSH/Inundation chart status bar information includes mouse positional information
of:
"Raw" SLOSH value
Calculated Inundation (water) level
Elevation
Latitude
Longitude
275
HURRTRAK & Global Tracker Users Guide 1992-2012, PC Weather Products, Inc.
APPENDIX D: Email setup and capabilities
If you use Microsoft Outlook as your primary e-mail system, then do the following:
1. Make sure your Email Contact folders in Outlook are marked as “Show this folder as an Email
Addressbook”. This is a setting in the properties of each contact folder.
2. Select MS Outlook as your preferred method of sending e-mail via user preferences Email General
Options.
2. Define the address books you would like HURRTRAK to "see" via user preferences
Email General Option Outlook folders. Be sure to not select very large folders (>5000),
as this will greatly impact the systems performance when sending email.
276
HURRTRAK & Global Tracker Users Guide 1992-2012, PC Weather Products, Inc.
If you would like to use the Native Hurrtrak Email capabilities, then there are just a few steps to
complete:
1. You must have an SMTP Internet Email server available to you. If you connected to the Internet via a
network server, and you are not sure, check with your network administrator. Go to the Email General
Options and define your system's email server parameters. In most cases, you should be able to pull
these from the options defined on your current email program.
2. You must define the users you want to have the ability to send email messages to. This is a separate
Addressbook from your native email system due to the additional data fields required. Go to the
Addressbook Options and define your users/recipients and your user groups.
277
HURRTRAK & Global Tracker Users Guide 1992-2012, PC Weather Products, Inc.
Now, when you are viewing a graphic or report, just hit the Send option and the user will be presented with
either the following screen.
or for the MS Outlook method…
Selecting the recipients and "hitting" Send will transmit the message to the server defined.
NOTE: When viewing Emailed reports that have column type data (not recommended), the receiver must
change his Email programs viewing font to a non-proportional type (courier, for example).
278
HURRTRAK & Global Tracker Users Guide 1992-2012, PC Weather Products, Inc.
APPENDIX DD: Microsoft Outlook Considerations
In addition to the Native Hurrtrak SMTP Email capabilities, the system now
interfaces with the Outlook address book and Email send capabilities of Microsoft
Outlook.
There are several important considerations when using this capabilities that you
should be aware of:
1. Outlook 98/2000 installed in the Internet Only Mode (IMO) (Help|About in Outlook) is not
supported. This is because Microsoft does not support Extended MAPI in IMO. Microsoft got rid
of IMO mode starting in Outlook 2002. Subsequent version of Microsoft Outlook and those
installed in C/W mode and Exchange Server installations are OK.
2. Make sure your Email Contact folders in Outlook are marked as “Show this folder as an
Email Addressbook”. This is a setting in the properties of each contact folder.
3. When setting up your Email capabilities in Hurrtrak, be certain not to select very large contact
folders. If you do so, performance will be greatly impacted when showing address book
entries. It is difficult to put an exact number on this, but folders with more than 5000 entries
should be avoided. If you are in a large corporate environment where you do have large contact
folders, I suggest you copy your Hurrtrak contacts from the large folder to a new Outlook contact
folder and only select that folder in Hurrtrak Email setup.
4. Although rare, on some installations, when you send an email from Hurrtrak using the
Outlook option, the email may remain in the drafts folder. Keeping Outlook open and setting
your Outlook system to automatically send/receive every X minutes should take care of this. If
this does not, please report this to us and, until it is resolved, manually send this email from
Outlook. Please include a screen shot of your Microsoft Outlook's Help-About screen if you
contact us for support.
279
HURRTRAK & Global Tracker Users Guide 1992-2012, PC Weather Products, Inc.
APPENDIX E: Automated EMail Alerts
Email Alerts are a feature in the system which will automatically send and “alert” type Email when certain
“conditions” or triggers are met. The Email alerts are processed whenever new storm data is received or if
manually started by the user. In addition to the alert text, you can also specify to include a tracking map
and the advisories with the alert. There are 6 types of Automated Email Alerts.
ALL UPDATES Alert:
The All Updates alert is the only alert which does not have a trigger. This type of alert allows the user to
send out information about a storm every time new storm data is received.
NEW STORM Alert:
The New Storm alert is exactly what it sounds like. An alert email will be sent whenever a new storm
forms.
CATEGORY CHANGE Alert:
The Category Change alert is triggered whenever an existing storm change its storm strength category
(Saffir-Simpson Scale).
LOCATION Alert:
The Location Alert is a special alert that is triggered whenever a storm’s forecasted conditions, for a
location or group of locations are met. The triggers include, wind speed, timing of wind speed, rainfall, wind
probabilities and distance from the location to the center of the storm. This is a very powerful (and the
original) alert.
LOCATION GROUP Alert:
The location group alert is triggered whenever ANY location within a location group is expected to be
impacted by a storm. This was added when a customer said “what I really need is to have an email
automatically sent to me when ever any of my 5000 locations are expected to bit hit”.
GEOGRAPHICAL Alert:
The Geographical Alert is triggered whenever a storm is in or expected to enter a defined geographical
area.
Examples of each Alert are shown below:
All Updates Alert (this example shows optional user text)
280
HURRTRAK & Global Tracker Users Guide 1992-2012, PC Weather Products, Inc.
New Storm Alert (example is for Western Pacific storm)
Category Change Alert (SW Pacific Storm in example)
281
HURRTRAK & Global Tracker Users Guide 1992-2012, PC Weather Products, Inc.
Location Alert (image included with this example)
Location Group Alert (the name of the location group is called usergroup in this example)
282
HURRTRAK & Global Tracker Users Guide 1992-2012, PC Weather Products, Inc.
Geographical Alert
283
HURRTRAK & Global Tracker Users Guide 1992-2012, PC Weather Products, Inc.
APPENDIX F: Automated Summary Reports
Automated summary reports are reports, typically in PDF format, that are optionally generated without user
interaction whenever new storm data is received by the Hurrtrak System. They can be printed/previewed or
automatically sent via Email. There are 3 types of Automated Summary Reports.
Regular/Standard Summary Report:
The regular/standard report is designed to provide extensive data about a single location. It optionally
includes a user defined graphic, narrative impact statement, user diary contents, latest storm position
information, watches / warnings, official forecast information, strike probabilities, wind probabilities (when
available) forecast impact summary, forecast impact detail, and NHC advisory text.
Executive Summary Report:
The executive summary report is designed to provide information about a set of locations, typically
defined by a location group. It is targeted more to the decision maker who may not want to see all of the
detailed data and just the “bottom line”. It can be created in different formats with options to include/exclude
location hourly details, narrative impact statement and summary tabular data.
Risk Impact Summary Report:
The Risk / Impact report is designed for users that want to see both the risk factors and the impact to a set
of locations. It contains a wind impact chart, risk alert conditions and details about the impact to each
location. It mirrors the output on the Risk/Impact Tab.
Examples of each Report are shown on the following pages.
284
HURRTRAK & Global Tracker Users Guide 1992-2012, PC Weather Products, Inc.
Regular/Standard Summary Report
285
HURRTRAK & Global Tracker Users Guide 1992-2012, PC Weather Products, Inc.
286
HURRTRAK & Global Tracker Users Guide 1992-2012, PC Weather Products, Inc.
Executive Summary Report
Example shows narrative impact statement and summary location data
HURRTRAK SLA – 2012_0412
Page 287 of 356
HURRTRAK SLA – 2012_0412
Page 288 of 356
Risk/Impact Summary Report
HURRTRAK SLA – 2012_0412
Page 289 of 356
APPENDIX F2: “Other” Automations
The Automations capability basically includes other automatic output that did not fit into the category of
Summary Report or EMAIL Alerts. The outputs defined in this function are automatically generated when new
storm data is received and can be saved to a hard drive location and/or sent via Email. There are 4 types of
“other” Automations.
Map Image:
The Map Image automation simply generates a tracking map for the storm. The user can define the mapping
parameters. This is useful when all you need to do is send an image of the storm track, wind band, etc..
Google Earth:
The Google Earth automation generates a KML/KMZ file for the storm with specific outputs defined by the user.
This is handy when you want to share information about a storm but would rather have the recipient view it on
the Google Earth Interface. Since this is a single file, it is perfect for Emailing.
EXCEL (spreadsheet):
The EXCEL automation will create an EXCEL compatible file which contains a impact report information for a
location group. For folks who just want a concise report and prefer working with spreadsheets this is the way to
go. Perfect for emailing.
SHAPE File:
This automation is available only for Hurrtrak Advanced Users. The SHAPE File automation allows the user to
create multiple ERSI Shape files. The specific outputs can be defined by the user. Because of the potential for
a large number of files, it may make more sense to save these files to a network directory and allow your users
to view them in that manner… rather than sending them via email.
HURRTRAK SLA – 2012_0412
Page 290 of 356
APPENDIX F3: Narrative Impact Statements
The Narrative Impact Statement is a "computer AI generated" narrative description of the
impact to a location. This can be viewed for the base location, any location in a tab based
summary impact report and in the formatted summary report. It is available in both the
standard and "executive" formats. It can also be emailed by right clicking on the base
location or on the location in the tab based summary impact report. An example of the
information in these statements is shown below.
It can be viewed or emailed by right clicking on a location in the location impact summary report.
HURRTRAK SLA – 2012_0412
Page 291 of 356
APPENDIX G: Flood Index Summary
The flood index is an internally calculated algorithm that is designed to display the area of the
coastline most likely to experience the highest flooding due to storm surge and wind-driven water. In
the case of "Actual" analysis, it displays the actual flood index for an area of the coastline (as shown
in the graphic below). The value is an index and does not equate to any specific level of
flooding.
The flood index's main component is the strength and duration of the onshore wind flow. It does
NOT take into account the bathometry of the ocean floor nor any possible funneling
situations, such as a strong SW flow into Tampa Bay. For this data, you should refer to the
SLOSH Data charts.
In addition, you should not focus on the exact location of the forecasted maximum flood
index since small changes in the storm's path will dramatically affect the area with the highest storm
surge. It is best to use this data only within a few hours of landfall and in conjunction with the
SLOSH information.
An example of a plotted Actual flood index for Hurricane Fran is shown below:
HURRTRAK SLA – 2012_0412
Page 292 of 356
APPENDIX H: SLOSH Data Summary
The HURRTRAK system contains some of the SLOSH Storm Surge data. Only the Hurrtrak Advanced system
has the SLOSH MEOW data. The SLOSH Storm Surge data is compiled by the National Weather Service to
assist emergency management officials determine the risk of hurricane-related storm surge flooding in their
area. It is analyzed and created by "slosh basin" and takes into consideration the coastal bathometry, as well as
the effects of water being funneled into certain areas of the coastline.
The SLOSH analysis has been done for the most of the US Coastline, Puerto Rico and the US Virgin Islands.
There are two types of analysis related to SLOSH.
MEOW - (Maximum Envelope of Water) and MOM (Maximum of Maximum)
The National Weather Service calculates the SLOSH Storm Surge, MEOW’s and MOM’s as follows...
For each slosh basin:
1. Select hypothetical storms appropriate to those found from historical record: storm directions, forward speeds,
(Saffir-Simpson) intensities, sizes (radius of maximum winds, or RMW), and landfall sites sufficiently close
together (typically 15 miles or less) to adequately map the surge flood plain.
2. Generate the set of hypothetical storms. Typically, there will be about 10 directions, 4 forward speeds, 5
intensities and 10 to 20 landfall points*, resulting in 2000 to 4000 individual storms.
*Because the average error of forecast position of eye landfall is about +/- 100 miles in 24 hours, no single
storm is sufficient to map the potential for storm surge flooding in a basin in advance of storm landfall, as the
likelihood of having chosen exactly the correct track is dangerously too small. Instead, the SLOSH model is run
with a family of storms. In the family, all storms share the same intensity, size, speed and direction. For
example, the storm surge flood plain of a basin by Cat 3 hurricanes, heading northwest at 15 mph will be
calculated by running SLOSH with a succession of NW15C3 storms that have landfall sites separated by 5 or 10
or 15 miles from those flanking it. Then, after all the storms in a family have been run, the maximum surge value
at each grid square in the basin, from any storm in that family, is retained. The result is a Maximum Envelope Of
Water, (or MEOW), for the NW15mph Category 3 storms, in the above example.
3. Create MEOW maps of SLOSH modeled storm surge, for each combination of storm direction, speed, SaffirSimpson intensity and initial datums (in the case of the Lake Okeechobee and Cape Canaveral basins). In the
example #2 above, (10 directions, 4 speeds and 5 Saffir-Simpson Categories), there would be 200 MEOWs.
4. Consolidate MEOW results, (if requested to do so by emergency officials), into maps of MEOWS Of MEOWS
or MOMs. Typically, MOMs depict surge flooding for each intensity ONLY, regardless of storm direction or
speed. However, in other instances, the MEOWs of the two faster speeds** were consolidated to create five
"FAST MOMs", while MEOWs of the two slower speeds were consolidated to create five "SLOW MOMs".
** Faster storms create higher surge on coastlines than do slower storms. Slower storms create higher surge
values further inland (because there is more time available to pump water) up rivers or into heads of bays, than
do faster storms.
Simply put, the MEOW analysis represents the highest water* due to a "family" of parallel tracks with the same
direction, speed and intensity. The analysis is done for varying storm direction, speed of movement and
category. For example, a MEOW exists for a Cat 4 storm moving from the east at 12 mph into the Miami
SLOSH basin. The MOM data is the "Maximum of Maximum or "Meows Of Meows" or the highest water* due to
a composite of MEOWs.
This system includes the MOM data for all of the analyzed basins. While most are shown by storm category,
some basins have more qualified MOMs (see Charleston, SC).
An example of a Cat 4 MOM for Tampa Bay is shown on page 294.
* IMPORTANT NOTE: All of the SLOSH surge heights are referenced to
NGVD - National Geodetic Vertical Datum (the mean sea level as
HURRTRAK SLA – 2012_0412
Page 293 of 356
determined in 1929.) This is the same reference the USGS uses for its
quadrangle maps. So, when you see a 10 surge for a given area, you
expect flooding up to the 10 foot contour on the quadrangle map at that
location. Imagine that there's a 10 foot surge in an area. One house has a
base elevation of 11 feet, so it is "high and dry," but a neighboring house
which is at 9 feet will get one foot of flooding in its home.
Example of a Cat. 4 MOM on standard chart for Tampa Bay
Figure 16
HURRTRAK SLA – 2012_0412
Page 294 of 356
APPENDIX I: SLOSH Inundation Analysis
The SLOSH Inundation Analysis represents the potential storm surge water level that an area may
expect for a category of storm. It is available in limited form in the HURRTRAK EM/Pro system and
completely in the RM/Pro system. For more details, read on.
The SLOSH Storm Surge data indicates the highest water (above sea level) that coastal areas may expect
for a certain category of storm. For a separate discussion on how SLOSH was developed, see page 293.
The SLOSH data is just part of the "equation" in determining the extent of storm surge flooding. The other
part is the elevation of the inland areas in those areas. For example, the areas to the East of Mobile Bay
have a sharp rise in elevation very close to the coast, while areas like Florida Bay or the Savannah River
Basis have a slow rise, thus allowing for greater flooding further inland. In addition, the SLOSH data
analyzes flood level in "rectangular" segments. The differences in elevation across these segments are
sometimes significant, so while one part of the segment is "under water," other parts may not be. SLOSH
alone will indicate the entire area as "flooded".
To include the second part of the equation, the HURRTRAK system now includes the 1 arc-second USGS
elevation data for all the areas along the US Coastline, PR and the USVI.
When the SLOSH data is "combined" with the elevation data, the result is the SLOSH Inundation Analysis.
The system represents that water level (inundation) value with colors.
The following is an example of a Category 3 SLOSH analysis using Standard HURRTRAK
Charts, showing inundation value as text (Em/Pro).
The following is an example of a Category 3 Inundation analysis using standard HURRTRAK
charts (RM/Pro). In this case the inundation levels are analyzed.
HURRTRAK SLA – 2012_0412
Page 295 of 356
The following is an example of a Category 3 Inundation Analysis using the SLOSHVIEW program
(RM/Pro).
There are a couple of important things to consider when viewing the Inundation data:
1. Do not attempt to analyze at too detailed a chart level. Using the SLOSHVIEW program, you can
zoom down to the street level....however, neither the SLOSH data nor the elevation data is resolved to
that level of detail.
2. Depending on your processor, it may take quite a while to render the inundation images. A status bar
gives you some indication of progress and you can stop the process at any time. Using the smaller
charts and running in true color mode (24+ bit color) will provide the best performance. Large maps and
lower color capabilities will take the longest. You can check your system video color settings on Windows
in Control Panel Display Settings.
3. In HURRTRAK EM/Pro, inundation values may be viewed and labeled on a "standard" SLOSH analysis
chart. Complete graphic representation (plots) is only currently available in the RM/Pro system.
HURRTRAK SLA – 2012_0412
Page 296 of 356
APPENDIX I2: Storm Surge Probabilities
Storm surge probabilities are processed by NOAA and are available about 1 hour after the official
advisory time. For example, the advisory issued at 11 AM EDT will not have surge probabilities until
about Noon EDT. The information is downloaded and processed by the Hurrtrak Online Servers and
delivered to you system as soon as possible. You can view surge probabilities in either graphic or
report format.
HURRTRAK SLA – 2012_0412
Page 297 of 356
APPENDIX J: Legacy Pan and Zoom mapping
While the tracking system has a “true” pan and zoom implementation, some of the other modules
(Recon, Sloshview, Model Display, HWIND) in the system use the built in “legacy” pan and zoom
maps. The mapping database (TIger/Line 2006) for the variable size maps, is current, extremely
detailed and allows the user to display maps from a large scale all the way down to street level.
Mouse-controlled map functions are:
Moving Map - The map area can be shifted by either using the scroll bars on the right and bottom of the screen
or by holding down the Ctrl key and "hand" moving with the left mouse bottom depressed. You may also move
the map using the scroll bars.
Zoom - Zooming in can be accomplished by "rubber-banding" area selection using the left mouse button. The
user can also use the "zoom in" and "zoom out" tool icons.
Right Mouse Click controlled functions are:
UnZoom - This option undoes the latest zoom in or zoom out.
Zoom In - This option changes the current map to a smaller scale
Zoom Out - This option changes the current map to a larger scale
View State - This option changes the current map to a scale that will fit the entire state currently in the map
view. Note: If you are not within a state boundary (like in an ocean area), this function will display a blank map.
Configure Map - This option is a built-in function of the mapping system and is not supported by PC Weather
Products. You may experiment with the options displayed, as none of the changes made are permanent.
Lookup Address - This option allows the user to display a map centered on an address. Use street address,
city, state and zip.
Redraw Current Map - This option redisplays the current map.
Print Map - This option is a built-in function of the mapping system and is not supported by PC Weather
Products. Use at your own risk.
Copy to Clipboard - This option will copy the current map to the windows clipboard. This is also a built-in
mapping system function. Do not confuse this with the copy to clipboard function that is available after
displaying a storm track.
HURRTRAK SLA – 2012_0412
Page 298 of 356
APPENDIX J1: HURRRAK Maps / Tracking Charts
The system's mapping capabilities are somewhat varied depending on the type of
tracking map you use.
Fixed Maps - To maintain compatibility with prior versions, fixed maps are available. They are predefined and
cover all of the tropical regions.
Pan/Zoom Maps - Greatly enhanced in 2008, the user has the ability to zoom in and out, or pan in any
direction on ANY tracking map.
Specialty Maps - Radar and Satellite tracking charts are special types of fixed tracking charts. The radar and
satellite chart (including SST) are obtained via a connection to the Internet. It is important to note that panning
or zooming on these types of charts will result in a "standard" tracking map.... not a zoomed-in satellite or radar
image.
Fixed ("favorite") Maps
How it works...
There are a considerable number of fixed tracking charts that are included with the system. These tracking
charts are shown on the "favorite" tracking chart tabs (up to 3 tabs). The user can move from one chart to
another by selecting the Next, Prior and Best Map button. Once selected, this map will always be on this tab
until changed.
Sizes:
They come in three standard sizes.. 640x480, 1024x768 and 1400x1048. The size map displayed is controlled
in General Options.
Custom maps:
Five of the fixed maps are actually custom maps. This allows the user to create their own "fixed" map. There
are two ways to do this.
1. Use the Custom Map Creation Function.
2. From the "Map Select" tab, utilize the "Save as Custom Map" option. This will save the current map view as
a custom map. Note: Unless the county outlines are shown before "saving", you will not be able to view them
when used on a favorite tab.
Misc:
If the user pans or zooms the special topographical fixed map, the re-plotted map will result in a "standard"
tracking map, not a zoomed-in topographical map.
Pan/Zoom Maps
How it works...
The user has the ability to zoom in and out, or pan in any direction on ANY tracking map. This includes mouse
"rubber-banding". The system will display the new map area / zoom level and re-plot all of the items originally
plotted on the chart. These charts can be zoomed down to street level.
Sizes:
The new map size is dependent on the size of the Hurrtrak "window" as the system will create a map at the
largest size possible.
Misc:
- All of the items plotted on the original tracking chart (i.e. forecast track, wind field, locations, etc.) will replot on
the new zoomed image. The only exception are any chart notes and legends as they are manually placed by the
user.
- The Map Selection Tab is automatically used when the system creates the new map image.
- The toolbar has specific icons for assisting the user in the pan and zoom action. The bull’s-eye icon re-centers
the map at the storm location, while the arrows will pan the map in the direction indicated.
Speciality Maps
Satellite, SST and Radar image Maps
HURRTRAK SLA – 2012_0412
Page 299 of 356
How it works...
Hurrtrak Online users are able to plot a storm on certain Satellite, Sea Surface Temperature, and Radar images.
The source for these maps is from 3rd party free Internet web sites.
How to select...
These images are selected from any of the three Fixed Tracking Charts by selecting the Satellite/Radar
command button or the dropdown list on any of the "fixed map" tabs i.e. You must first be looking at a tracking
chart image before they can be selected. The command button will display the thumbnail sized images of all of
the satellite, sea surface temperature (SST) and Radar images that are available for overlaying storm tracks on
top of. See example below…
Otherwise you can select from the drop down list
Sizes:
They come in various sizes and can be scrolled if the image is larger than your display area.
Misc:
These images can be quite large (300K), so a fast Internet connection is recommended. Examples of a
Typhoon and Radar plot are shown below.
HURRTRAK SLA – 2012_0412
Page 300 of 356
APPENDIX K: E-Z Map option
The E-Z Map was initially designed for new users of the Hurrtrak system to assist them
in being immediately productive.
When the user selects the EZ Map option, the system generates a tracking map for a current
storm with all of the most common plot options. The user can choose anything from a default
to user specific options.
It is very simple, when the user selected the EZ Map option from the menu bar or the
toolbar...
a tracking map is created with several plotting options.
At this point the user can zoom in or out, select or deselect plotting options, etc. but in most
cases further plotting selecting is not required. The system is installed with a default set of
"EZ" plotting options... however the user can control what is automatically plotted by this
function by changing them in the General User Option (see page 68).
HURRTRAK SLA – 2012_0412
Page 301 of 356
APPENDIX L: GIS Wind Band Export
The system includes the ability to export the actual, forecast, or both actual and
forecast wind band data in an ArcInfo™ GIS importable format. This allows the user to
do further analysis with that tool. The export format is generic enough so that it could
easily be converted to other GIS tool formats by the user. The default wind bands are
34, 50 and 64 knots, however this can be easily changed in the general options (see
page 68) to any set of wind values (up to 10) desired.
When the Export Wind Data is selected from the FILE menu, the system plots the wind
bands desired over a "blank map" and then processes this data. The entire process
takes anywhere from 20 seconds to several minutes, depending on processor speed.
During processing, two files are written out to the directory specified in the general
options (GIS tab). If no location was specified, it will be written to the application’s temp
directory.
File Descriptions:
filename.att
This file contains the wind band attributes information.
An example of the data is shown below. Here, the file indicates three wind areas of 34,
50 and 64 knots
1,34
2,50
3,64
filename.dat
This file contains the latitude & longitude boundaries for each attribute.
example data:
1,auto
-83.37891,28.85417
-83.37891,28.80859
-83.37891,28.76302
-83.37891,28.71745
-83.37891,28.67188
..
.
where filename is a variable with the following naming convention:
filename= stormname + advisory number + type
where type = F (forecast), A (actual) or B (both actual and forecast)
e.g. FLOYD20F indicates this analysis is done for storm Floyd, advisory 20, forecast data only.
HURRTRAK SLA – 2012_0412
Page 302 of 356
ArcInfo™ IMPORT PROCESS:
The following describes the process for importing the exported wind band data into ArcInfo™.
Data Files:
filename.dat - A text filed formatted to be used by the Arc/Info "GENERATE" command.
filename.att - A text file of attribute information for populating the Arc/Info coverage generated
by the "GENERATE" command.
Process:
1. Create an Arc/Info coverage from the filename.att file.
2. Establish topology for the coverage using BUILD.
3. Load xport.att into INFO table.
4. Join coverage with INFO table (attribute data).
5. Result - a coverage with topology and attribute data that can be used in Arc/Info, ArcView,
or loaded into SDE.
Steps:
* Use the "GENERATE" command in Arc to create an Arc/Info polygon Coverage.
* To create topology, you will need to then use the Arc/Info "BUILD" command with the
"POLY" option. This will separate the overlaying wind band areas into distinct, spatially
related polygons.
** After this process, the "USER-ID" (in the INFO table) of the first two polygons (surrounding
polygons) becomes zero. You will need to re-assign the "USER-ID" in TABLES or INFO in
order to match its attribute table. The "USER-ID" is the key to correctly joining the polygon
information with the attribute information.
* Use TABLES or INFO to create the database file for loading filename.att. The DEFINE
command is used to create the table structure. After the structure is created, use the "ADD
FROM" command to add the records from the filename.att file.
* After the table and coverage are created, join the two by using the Arc/Info "JOINITEM"
command.
If you have any suggested additions or changes to this process, please contact us at
[email protected].
HURRTRAK SLA – 2012_0412
Page 303 of 356
APPENDIX M: Rainfall Forecast Capabilities
The HURRTRAK software coupled with HURRTRAK ONLINE allows the user to depict that
latest Quantitative Precipitation Forecast (QPF) information. It can be displayed in either an
analysis format or a color-shaded county thematic format. The QPF information is issued by
the National Weather Services Hydrological Prediction Center. Please note, while the QPF
information does a good job of showing the location of "normal" precipitation amounts, it is
not designed to forecast excessive precipitation amounts over a "small" area. The
information is presented in the HURRTRAK system in one of the two following formats:
ANALYSIS
COUNTY THEMATIC
Some more information on the National Weather Services HPC can be found at
http://www.hpc.ncep.noaa.gov/html/about2.shtml.
HURRTRAK SLA – 2012_0412
Page 304 of 356
APPENDIX N: Hurricane Model Forecast
The HURRTRAK software, coupled with HURRTRAK ONLINE, allows the use to depict the
latest available Hurricane Model Forecast. A complete discussion of the various hurricane
models that the NHC utilizes can be found at:
http://www.nhc.noaa.gov/modelsummary.shtml
It is important to note that the user should always make plans based on
the official NHC forecast and not on forecast model "raw" output.
HURRTRAK SLA – 2012_0412
Page 305 of 356
APPENDIX NN: Google Earth Interface
Go to earth.google.com to download the software. The “Open Google Earth” function will not work without
Google Earth being installed. We strongly suggest you learn how to use Google Earth and understand all of its
capabilities. We will not be able to support your questions about Google Earth.
There are 2 methods in which HURRTRAK interfaces with Google Earth (GE).
-
Graphic Export
KML language interface
Each method is described in more detail below.
Graphic Export:
The Hurrtrak system has the ability to export “ANY” graphic image that is currently being viewed within the
system to a format that can then be viewed using Google Earth. When selected, Hurrtrak will automatically
display the image on Google Earth without any other user key/mouse strokes needed. Depending on the
image, land and sea areas are set to transparent, allowing the Google Earth maps to show through. Please
keep in mind that the graphics will enlarge as you zoom in with Google Earth... i.e. the detail will remain
constant.
An example of an exported image is shown below.
Export of wind pattern around Wilma
KML Export:
Definitely more powerful than Graphic Export is the KML method… In this case, the Hurrtrak system has the
ability to export key hurricane tracking and analysis data to Google Earth via its native interface language called
KML. Somewhat similar to a GIS type language, KML allows data to be presented many different ways,
HURRTRAK SLA – 2012_0412
Page 306 of 356
including a three-dimensional manner. The data types that are available for export from HURRTRAK to Google
Earth are updated yearly and are shown on page 33.
There is one additional type of SLOSH export which is found in the SLOSHVIEW program
As indicated in the documentation of this function you have the options to Save, Email or Open the KML/KMZ
files. A couple of things to consider.
1. If you plan on opening the file, make sure you are running the latest version of Google Earth.
2. Within the tracking system, the user has the ability to generate multiple KML files/layers with a single
selection of “ALL SELECTED OUTPUT”. The outputs that will be created are controlled within the
General Options of User Preferences. Most users will select a subset of all of the possible outputs.
3. When exporting multiple layers at once, we suggest you deselect all of them initially in GE and then
select the data you want to view. If you don’t do this, you may be presented with something that looks
like the image on the next page.
4. GE has animation controls which will allow you to control the animation characteristics.
5. When viewing SLOSH storm surge polygons on GE, make sure you do the following:
a. Have the “Terrain” layer on (checked) in GE.
b. In GE options, set the terrain quality to its max value.
c. In GE options, set the terrain exaggeration to a value of 1.
d. Zoom in as far as you can in order to analyze the data as the terrain data is not reflected at a
low to medium zoom level. You may have to experiment with this.
e. Turning 3D Buildings on in GE will create some interesting effects.
6. Learn Google Earth (it’s not very difficult).
The following is an example of multiple (TOO MANY) KML layers on one image:
It is best to deselect all of the layers within GE first and then display only the ones you want
to see together at the same time. See image below:
HURRTRAK SLA – 2012_0412
Page 307 of 356
APPENDIX O: NHC Wind Radii Forecast Considerations
The National Hurricane Center’s Forecast Advisory details the current and forecast
wind radii for the area of 34, 50 and 64 knot winds. Since many of the functions of the
system utilize this data, there are several considerations the user needs to be aware
of.
1. Due to the squally structure of a tropical system, the winds vary greatly in each quadrant.
While a portion of a quadrant may be experiencing sustained hurricane force winds, other
areas in that quadrant at the same radius may be sustaining much lower wind speeds.
2. The "observed" and forecast wind radii represent the largest radii of those winds in that
quadrant. The reason for this is the same as indicated in #1.
3. The maximum winds and the radii winds being forecast represent sustained winds that
are experienced from an open "ocean type" exposure. Due to the effects of friction,
sustained surface winds over land are much less. Since the winds above the surface are
not impacted as much by friction, land areas typically experience "forecasted" winds only
during the passage of squalls… when these higher level winds are brought to the surface
in the form of gusts.
4. While 12 and 24-hour forecast are quite good, the NHC average forecast error at 120
hours is over 370 nm. Care should be taken when utilizing forecast information beyond
24 hours.
HURRTRAK SLA – 2012_0412
Page 308 of 356
APPENDIX OO: Interactive Chart Notes
The Hurrtrak system, optionally, displays the Chart Notes or observation details directly on the tracking chart.
The automatic display of the chart notes is controlled via the Plotting Options.
The user also can view these chart notes on the Database Tab and any TRACKING CHART TAB. As you pass
over an observation point (not forecast point), the chart notes for that observation are displayed. The secondary
function initiated by a “right click” of the mouse is different for each type of tab.
With the Database Tab, a “right click” over an observation allows you to set that advisory as the Post Storm
Analysis point. If you happen to point at a storm, you can also delete the storm from the database.
While viewing one of the TRACKING CHART TABS, a “right click” will permanently place the chart notes onto
the image. If you press the right button down, hold it down, while dragging your mouse to another location, and
then letting go of the right button, the chart notes will display in that location. The image below shows how the
chart notes were positioned away from the storm track.
HURRTRAK SLA – 2012_0412
Page 309 of 356
APPENDIX P: Depiction of storm’s eye, eye wall and wind
field
The Hurrtrak system depicts a storm's eye and eye wall (if they exists) as well as the areas of 34, 50 and 64
knot winds.
EYE/ EYE WALL:
If the storm has a well formed eye structure and is reported on the NHC Forecast Advisory, the system will use
the reported eye diameter and draw a donut type structure that looks like the image below. The eye wall width
is assumed to be 1/2 of the diameter of the eye. i.e. a 20 nm eye diameter is assumed to have an eye wall
width of 10 nm. Maximum winds are assumed to be in the eye wall with light and variable winds in the eye.
Well-formed eye example
The Hurrtrak system does not depict partial eye walls, however it does show quadrants where lighter winds
exist, even if an eye is reported. The example below shows what is likely to be a partial eye wall situation.
Storm with likely partial eye structure
HURRTRAK SLA – 2012_0412
Page 310 of 356
If the storm does not have an eye, the eye and eye wall width are set to 0 (via Hurrtrak Online). In this case, the
system shows a small red circle indicating the center area of the storm. Maximum winds are assumed to be
near the center of the storm
Storm with no eye structure
Note: Hurrtrak Online reports an eye under the following conditions.
1. It is reported on the NHC forecast advisory.
2. If it is not reported on the NHC forecast advisory but a storm has winds of 70 knots or greater, an eye
diameter of 18 nm is assumed. This is to cover the situation where hurricane recon is not available for the storm,
but it is likely to have an eye.
WIND FIELDS:
The 34, 50 and 64 knot winds areas are depicted based on the information in the NHC Forecast Advisory. See
NHC Wind Radii Considerations for more information about the data represented in this advisory. The example
below shows a 90 knot hurricane with the areas of 34, 50 and 64 knot winds depicted.
HURRTRAK SLA – 2012_0412
Page 311 of 356
Plotting Options (wind circle vs. area):
The user also has the option, via Plotting Options, to depict the wind fields as shaded areas or not at all. The
example below is an example of a storm with wind field shading.
HURRTRAK SLA – 2012_0412
Page 312 of 356
APPENDIX PP: Multi-Colored wind vector display
The Hurrtrak system has the ability to display wind “arrows” around a storm or present a multi-colored
wind vector display. The standard wind arrow display on both static and during animation looks like
the following:
The user can change the plotting and/or animation options, instead, to plot multi-colored wind vectors
where the vector color and size represents the wind speed. See Plotting Options on page 84 and/or
Animation Options on page 57 to view those user preferences. When choosing the multi-colored
display, it is recommended that you increase the density of the arrow plot and, perhaps, decrease the
arrow size. It all depends on the scale of map being used and the size of your screen display. An
example of a vector display is shown below:
The color of the vector is controlled within the plotting user options.
HURRTRAK SLA – 2012_0412
Page 313 of 356
APPENDIX Q: Advanced Wind Estimation
This function should be used with extreme care as it can lower the estimated wind speeds
significantly. While we believe it produces more accurate results, it is highly dependent on accurate
Land Cover Database information and correct user input. Like any good estimation calculation, it may,
in some cases, underestimate the actual winds experienced. If you always want to overestimate wind
speeds, do not use this feature. See considerations section at the end of this topic.
The National Hurricane Center's estimated maximum winds and wind field radii issued in their advisories are
valid, generally, for open sea exposures only. They cannot factor local wind characteristics for inland
areas. This is where Advanced Location Wind Estimation "comes in".
Advanced location wind estimation (AWE) is a function of HURRTRAK that applies a wind speed "correction
factor" to the forecast/estimated wind speeds based on the local “site” characteristics. These include distance
from open (ocean) exposures, types and density of vegetation and manmade structures, and elevation being
analyzed. Established wind dynamics formulae are applied for the location... adjusting the estimated wind
speeds (sustained and gusts) to account for frictional, exposure and height considerations of the location.
There are two methods of employing this capability.
Site/Location characteristics - With this option, the user specifies the characteristics of a specific location.
This is useful when creating impact reports.
NLCD (National Land Cover Data) - This option allows the system to determine the characteristics of locations,
zip codes and county area. This method is only available for US mainland locations.
All graphics that use AWE, such as wind pattern and wind arrows, utilize the NLCD information, while reports
can use either. If there is no user entered information for a report location, the system will use the NLCD data.
If you require the most accurate wind speed estimate reports possible, we recommend that you use the
site/location method and enter the roughness index information for each of your locations. This can be
a time-consuming exercise as it requires detailed knowledge of a locations surroundings and the ability
to translate this into roughness index values.
We will describe each method below.
NLCD Method :
The NLCD Enhanced AWE has three important changes over the original Site/Location characteristics method.
The NLCD database (see image below) has land usage information on every state. An example of the land
usage graphic for part of S. Florida is shown below. It shows the urban land usage of the Florida east coast, as
well as the Everglades and Crop areas. With this information, we can estimate the "roughness index" (friction)
for any location by direction of wind. i.e. an East wind into Palm Beach has a different "roughness index" than a
west wind.
HURRTRAK SLA – 2012_0412
Page 314 of 356
The system then considers these factors to adjust the “raw” derived wind speed (as determined by the NHC
forecast advisory) for this site. Typically, the adjusted wind speeds are considerably lower than the “raw”
values. This function affects the forecast and actual location wind impact reports, as well as the summary
report.
This type of information allows us to create graphics, such as the wind pattern shown below.
HURRTRAK SLA – 2012_0412
Page 315 of 356
Site/Location Characteristics Method:
For the most accurate wind estimation reports possible and for areas outside of the US, the user can enter
site/location characteristics within the Location Maintenance portion of the System Setup function.
An example of the advanced location data entry screen is shown below:
In this example, we have defined a location, Bay Harbor Island, FL. Based on the site characteristics, we have
entered the average roughness indices, for 16 compass directions. We used a distance of about 2 KM
“upstream” for each direction to help determine the average RI. This type of analysis requires a good
knowledge of your sites and may require some experimentation as real data is analyzed. i.e., if the system is
always underestimating easterly winds, your RI values may be too high in that direction.
HURRTRAK SLA – 2012_0412
Page 316 of 356
Many users use aerial images and local knowledge to help determine the best values. The image below is for
an airport location as shown on Google Earth. In order to determine a point location’s surrounding RI values,
these kinds of tools are invaluable.
If your requirements are not quite as strict, the NLCD method does provide good results and you do not need
this type of site analysis.
HURRTRAK SLA – 2012_0412
Page 317 of 356
Advanced Wind Estimation’s effect on reports:
When creating a wind impact location report, the system will utilize the user-entered information, if available. If
no information was entered, it will use the NCLD database data to estimate the friction (RI) values instead.
The following is an impact summary report for Hurricane Wilma in 2005. All of the locations used the NLCD
database information.
The Max Wind AWE column represents the maximum sustained winds using Advanced Wind Estimation; the
next column shows the “uncorrected” wind speeds; and the next column shows the max gusts using AWE. As
you can see, the impact of AWE on the report values is significant. Sustained wind speeds along the SE coast
of Florida, where the land usage is most dense, have been decreased about 40-50% while the wind speed
adjustment in more exposed areas, is much less.
One interesting location on this report is Pahokee. It is located on the SE shore of Lake Okeechobee and thus,
is more exposed to a NW wind off the lake. The detail hourly report (below) verifies that, indeed, their highest
winds were likely on the back side of the storm when the winds switched to the NW.
HURRTRAK SLA – 2012_0412
Page 318 of 356
APPENDIX QA: Advanced Wind Estimation
Considerations
We are pleased with the performance of Advanced Wind Estimation (AWE), but we feel that
is important to mention a few things about the accuracy of wind estimation in general and
advanced wind estimation specifically. In the documentation and helps, we try to communicate that
AWE does a good job of estimating sustained winds in Cat 3 and below storms and also outside of the eye wall.
The eye wall is an extremely turbulent region where violent up and down motions of air will bring very strong
winds aloft down to the surface.. thus reducing the "normal" effect of friction on wind speed.
In Cat 4 and 5 storms, like Charley and Katrina, we suggest that you do not rely solely on
AWE for estimating winds in the eye wall of this hurricane. We cannot afford to
underestimate the winds in these violent storms near the center. To understand this better,
generally, a perfect site specific wind forecast (location impact report) depends on several
things to occur.
1. A perfect forecast of storm track, storm strength and 34, 50 and 64 wind radii.
2. A homogeneous wind field around the storm. i.e. no eye wall vortices, local effects, and
squally areas of higher winds, etc.
3. For AWE, a perfectly-analyzed location with exact roughness index figures in all quadrants.
Let’s address each one.
1. It is obvious we do not have item #1. While NHC forecast are very good, especially 12 and
24 hours in advance, the average error is still in the 80-90nm range at 24 hours. That aside,
forecasting the exact storm strength and wind radii has proven to be nearly impossible.
2. As everyone who experienced hurricanes knows, an homogeneous storm does not exist
in nature. Hurricane Frances, for example, caused much higher winds in NE Florida than was
expected, due to a detached persistent area of squalls that prevailed in this region, even
though the storm center was near the Florida West Coast. The region inside the eye wall can
be a violent area with vortices and other local effects that no software can predict.
3. While we have a good feel for the type of land usage around a location, without a detailed site by site
analysis, it is not exact. AWE uses this information to adjust the raw extrapolated winds downward to a more
realistic level.
Due to these three factors, Hurrtrak (and any other software) is not able to provide EXACT wind speed forecast..
thus the use of the word “estimate.” While AWE is a huge improvement, it is not a panacea.
Specific to AWE, because it lowers the location’s wind speed to a more realistic level, it is important to
understand that it WILL sometimes UNDERESTIMATE wind speed forecast for a location (as in a location
impact report), something that the standard method rarely did. This may be suitable for some customers, while
other customers might want to make decisions based on the higher-end forecast generated from the standard
(non-AWE) method. Remember, the wind impact reports estimate SUSTAINED (2-minute average) wind
speeds at an observation point 10 meters above ground level. Wind gusts can be much higher and average
about 30-50% greater than the average wind speed.
Finally, If you choose to use AWE, I would highly recommend that you do not use AWE for the county or zip
code report. This is because AWE is site specific, and a zip code/county area average is not representative of a
single point. Imagine a county that is 5% coastline and 95% pine forest. The pine forecast friction factors will
HURRTRAK SLA – 2012_0412
Page 319 of 356
dominate bringing the calculation of the wind level down to an unrealistic level for the coastal location. The only
place you can use AWE on the zip and county report with some confidence is with areas that are entirely inland
and uniform in nature.
HURRTRAK SLA – 2012_0412
Page 320 of 356
APPENDIX QQ: Wind Pattern Display
One of the capabilities of the HURRTRAK system is to display an actual or forecast image of the estimated
winds across a geographic region. This display is unique because, unlike a wind arrow or wind vector display,
this image is a solid pattern that covers every “pixel” location on a map. This is best described with the following
two graphics. The first one shows wind arrows around a storm. The second image is the same area described
with the “wind pattern” display.
As you can see, the second image provides much more detail than the first. This kind of detail, using Advanced
Wind Estimation, does come with a cost… processing time. If not using the pre-processed RI files, depending
on screen size, the rendering of this image may take 20 minutes or longer. Fortunately, if you download the RI
files, the rendering time is reduced to less than a minute. You can find more about the Processed RI files on the
topic of Plotting Options on page 84.
HURRTRAK SLA – 2012_0412
Page 321 of 356
The great advantage of the wind pattern display is that “rougher” areas that typically reduce sustained winds,
are easily depicted. For example, on the image below, you can see the higher winds over and leeside of Lake
Okeechobee with lower winds over the metro areas of Broward, Palm Beach and Dade counties.
The wind pattern display is available for selection from any tracking chart.
To view a forecast wind pattern, the user must first select the PLOT- Forecast Position option from the Map
Select Tab. Once the forecast plot is displayed, Display- Wind Pattern can then be selected from the menu.
Wind Pattern Animation:
- The user can also select to create an animated wind pattern. This may take very long because multiple
animation frames are being created. If you are going to use this function it is imperative that you
download the processed RI files mentioned on the prior page. You can find our more about the
Processed RI files on the topic of Plotting Options.
- After the wind pattern animation is created, it is not saved unless you select the Save to Animated GIF
option. It can then be redisplayed using MS Internet Explorer or some other animated GIF viewer.
One final note… if using EMPRO, or AWE is not selected, the resulting Wind Pattern image plots much faster,
but does not show the effects of friction on the sustained wind levels. See image below:
HURRTRAK SLA – 2012_0412
Page 322 of 356
APPENDIX R: Risk Alert
The Risk Alert section of the Risk/Impact Tab is designed to quickly analyze an approaching storm's
critical risk factors to the user's base location. There are 7 separate factors represented. It is important
to note that not all factors should be treated equally. For example, a situation where a location has a
100-percent chance of getting hit by a tropical storm in the next 5 hours may appear to have more red
risk factors than a situation where you have a 40-percent chance of getting hit by a Category 4 storm in
the next 24 hours. The second situation represents a much higher risk!
The risk factors are...
Wind Probability - This is the probability that the base location will experience a 50 knot (58 mph) wind
speed. The colors equate to the following probability values:
Red- 33+
Orange- 22- 32
Yellow- 11 –21
Green- 0-10
Wind Probability Tendency- This is the change in wind probability, as defined above, from the prior advisory.
The colors equate to the following probability values:
Red- 11+
Orange- 4-10
Yellow- -4 - +4
Green- <-4
Direction of Movement - If the storm is within 600 nm of the base location, this represents the deviation of the
storm's current motion from the compass angle of a direct approach. For example, if a storm is heading at right
angles to a direct approach, this value would be 90, if moving in the opposite direction, this value would be
180. The colors equate to the following values:
Red- 0 – 22
Yellow- 23- 45
Green- 46+
Maximum Wind Speed Predicted - This represents the maximum wind speed forecast (knots) for the base
location. The colors equate to the following values:
Red- 100+
Orange- 65 – 99
Yellow- 36 – 64
Green- < 36
Hours until arrival of 34 knot winds - This represents the number of hours before the first 34 knot winds are
expected. The colors equate to the following values:
Red- 0 - 23 hours
Yellow- 24 - 48 hours
Green- > 48 hours
HURRTRAK SLA – 2012_0412
Page 323 of 356
Hours until arrival of maximum winds - This represents the number of hours before the maximum winds are
expected. The colors equate to the following values:
Red- 0 - 23 hours
Yellow- 24 - 48 hours
Green- > 48 hours
Forecast Rainfall- This total amount of rain expected at the base location over the next 72 hours. The colors
equate to the following probability values:
Red- 5.00+”
Orange- 3.00”- 5.00”
Yellow- .76 – 3.00”
Green- <.75”
HURRTRAK SLA – 2012_0412
Page 324 of 356
APPENDIX S: User Interface Considerations
The “tabstyle” user interface allows the user to access data faster, as well as making the
system much easier to use.
There are a few items, however, that need to be kept in mind while using this system interface.
1. Since a lot of information is being created when the system is initiated, startup time is a bit
longer than most applications. The “rewards” of waiting is in the time you save after the
system is initialized.
2. Tab setup can be done via the General Options. This allows the user to disable tabs, move
the tab labels, and otherwise personalize their preferences.
3. To CLOSE a tab, select the small X at the upper right hand corner of the tab area.
Not all tabs are “closable”.
4. The selection of a tab controls what toolbar commands are available. See the Toolbar topic
on the next page.
HURRTRAK SLA – 2012_0412
Page 325 of 356
APPENDIX T: Tool Bars
The Hurrtrak System includes extensive use of Tool/Command bars. They are in
integral part of the system and allow users to complete their tasks quicker.
In the main tracking program, there are 2 rows of toolbars... the first row displays functions that are not
dependent on which tab/function is being displayed. They include things like Setup System/user preferences,
Open Database, Open Storm, Reports and many others.
The 2nd toolbar row ARE functions that are relevant only to the displayed tab. So if you are on a text tab, like
Public Advisory, only buttons related to that type of tab are shown (Email, Email Outbox functions, print, save,
copy, font).
If you are on a tracking map tab many more buttons become available.
All of the buttons ”offer” tooltip explanations of what they do by simply ”floating” your mouse icon over the icon.
This is the best way to learn what they do.
As mentioned in the Setup Application Appearance topic on page 95 you can also customize the size and color
of the toolbars.
Data Layering: On the tracking map type tabs there is a group of tool bar functions that are designed to
be set ON or OFF... i.e. switched/pressed down or up.
This allows the user to create a tracking map with the features (layers) desired and easily modify what is plotted
on the tracking map without having to do multiple ”UNDOs”.
Toolbar Advanced Topics:
The user has the ability to move/resize the toolbars as well as customize them. By ”grabbing’ the toolbar you
can move it to another portion of the desktop to give you a view similar to the following.
HURRTRAK SLA – 2012_0412
Page 326 of 356
You can also, customize the command that will appear, the icon image, descriptions and look/feel by selecting
the toolbar options at the right end of the toolbar. This is only recommended for advanced users familiar with
these type of functions. If you do change them and want to go back to the original settings, there is a ”reset”
toolbar option within this function, which will reset them to the install defaults.
Most of the Toolbar functions are duplicated menu bar functions… with 2 important exceptions.
Add to Email Outbox – This option adds the current image to the Email outbox.
View Email Outbox – This option views the contents of the Email outbox and optionally allows the
user to Email them.
HURRTRAK SLA – 2012_0412
Page 327 of 356
APPENDIX T1: Default vs. Hurrtrak Online Database
The system has two database variables defined.
- Default Storm Database: This is the database that the system will open when using the Hurricane
Tracking modules of the system.. This also includes the QuickPlot program. This option is set via the
FILE menu option of Hurrtrak or in the System Setup portion of the system.
- Active Hurrtrak Online Database: This is the database that Hurrtrak Online will update with current
data or past storm year's data you may manually select from the Hurrtrak Online Tab. This option is
set in the Hurrtrak Online options.
The value of these fields will allow for several situations.
1. When the default and Hurrtrak Online databases match, the system will not notify the user. This is
considered the "normal" operating mode.
2. When the default and Hurrtrak Online databases do not match, the system will present the user
with an opening message informing them of this situation and providing options to continue, change
the default database, or disable this warning message for 24 hours. Be aware that if you choose to
continue in this condition, any storm data coming in from Hurrtrak Online will not be reflected during
the session. This includes the notices that indicate new storm data has arrived for a storm.
In addition, if you continue with a non-current database, the main database tab will show a red "flag"
next to the Hurrtrak Online database name field. This serves as a reminder.
HURRTRAK SLA – 2012_0412
Page 328 of 356
3. Finally, if the Active Hurrtrak Online Database is not in the current year, the system will warn the
user when opening the main tracking program of this condition and provide the option of changing the
Active database to the current year. This should reduce the chances that data from one year will be
stored into the wrong database.
HURRTRAK SLA – 2012_0412
Page 329 of 356
APPENDIX T2: Webcam/Location Images
When exporting the Summary impact report (tab) to Google Earth, you have the ability to view a "live"
web cam image of the location being analyzed (if available).
The system is pre-loaded with about 100 web cams links, but you can also select custom images
(web or local) for specific locations in the location database. They just need to be in a graphic format
(jpg, bmp, tif, gif). The custom images are defined in the System Setup - Location Maintenance
option.
The following Google Earth example shows the beach conditions at Boca Raton along with the
forecast wind impact information for Wilma. (for this example, the image does not correspond to the
same time frame as Wilma).
HURRTRAK SLA – 2012_0412
Page 330 of 356
For some organizations this is a great way to associate forecast wind conditions to a real location.
For example, a department store could associate static images of each store in the database. When
the data is presented on Google Earth, the user can see both the location's forecast impact as well as
an image of the site. This capability can be extended to private live web cams. A great example would
be a lumber store showing a report for each of their impacted locations with a live image of what is the
activity at the current time. A great way to present to management!
HURRTRAK SLA – 2012_0412
Page 331 of 356
APPENDIX T3: Cross Wind Calculation, setup and use
Once the user defines the cross wind direction for any location, typically airport runways, the system
is then able to include this information on the location wind impact report. In addition, with the ability to
estimate wind speeds below 34 knots (from 25 knots - 34 knots), this is a valuable tool for
aviation/airport facility users.
To define the cross wind direction, the user must select the location via the System Setup - Location
Maintenance (Advanced Data Entry) option and then input the azimuth value (0-360) that represents
the cross wind direction. For example, a runway running due north and south, would have a cross
wind value of either 090 (due east) or 270 (due west). Either direction can be used, the only difference
will be the sign.. i.e. If 090 is selected, then a -35 knot value would represent a westerly component of
35 knots while a +35 knot value would represent an easterly component of 35 knots.
The following Keesler AFB example shows how you would define the cross wind for a runway that
runs 030 - 210. The value for the cross wind direction is defined as 120.
HURRTRAK SLA – 2012_0412
Page 332 of 356
When a wind impact report is run for this location, it includes the component of cross winds, as well
as the absolute estimate of wind speed. The report below shows the estimated winds for Keesler
AFB (runway 030) during Katrina. Advanced Wind Estimation was not used for this report. The
column for Cross Wind Component shows the sustained and wind gusts cross winds. Note, the first
yellow row indicates when the cross runway wind gusts are expected to exceed 25 knots, while the
red colored row indicates when the sustained cross runway component of wind is greater than 25
knots.
HURRTRAK SLA – 2012_0412
Page 333 of 356
APPENDIX T4: Using Google Earth External data
One of the options within the Google Earth Export option is "External (non Hurrtrak) Google
Earth Data".
It allows the user to export National Weather Service and other weather information to display
on Google Earth. This data includes radar, satellite, wind, temperature, dew point, river
stages and more! When this information is displayed with Hurricane layers exported from the
Hurrtrak system, the user is able to view both storm and "weather" information on the same
Google Earth image. An example of hurricane wind radii superimposed with radar and wind
data is shown below.
HURRTRAK SLA – 2012_0412
Page 334 of 356
Please note that the sources of this weather information are external to PC Weather Products
and its content may change over time. The system will automatically adjust to these changes
and the dropdown menu may not change. We expect the amount of information available to
increase as time goes on.
HURRTRAK SLA – 2012_0412
Page 335 of 356
APPENDIX T5: Damage Comments
Prior to 2008, the "Damage" column on the location wind impact reports contained a damage
description based on the Saffir-Simpson scale. While certainly a good measure of storm
strength, we have found that the Saffir-Simpson scale is not necessarily tailored for damage at
individual locations. In 2008, we introduced the ability for the user to choose an alternative
scale which is based on observed damage in real situations. This scale is based on work done
by the scientists at Texas Tech University and is modified somewhat for hurricanes.
The user can select the damage scale they would like to use via the User Preferences - Report/Impact Analysis
option. The option selected will be reflected in the system on all wind impact summary and "hourly" reports.
While viewing a report, the user can display the entire scale by moving the mouse over the DAMAGE header.
Or to see the description of an individual damage level, point the mouse at that value.
The two scales available are shown below:
Saffir Simpson Scale:
HURRTRAK SLA – 2012_0412
Page 336 of 356
Category One Hurricane (Sustained winds 74-95 mph [119-153 km/hr]).
Very dangerous winds will produce some damage
People, livestock, and pets struck by flying or falling debris could be injured or killed. Older (mainly pre-1994
construction) mobile homes could be destroyed, especially if they are not anchored properly as they tend to shift
or roll off their foundations. Newer mobile homes that are anchored properly can sustain damage involving the
removal of shingle or metal roof coverings, and loss of vinyl siding, as well as damage to carports, sunrooms, or
lanais. Some poorly constructed frame homes can experience major damage, involving loss of the roof covering
and damage to gable ends as well as the removal of porch coverings and awnings. Unprotected windows may
break if struck by flying debris. Masonry chimneys can be toppled. Well-constructed frame homes could have
damage to roof shingles, vinyl siding, soffit panels, and gutters. Failure of aluminum, screened-in, swimming
pool enclosures can occur. Some apartment building and shopping center roof coverings could be partially
removed. Industrial buildings can lose roofing and siding especially from windward corners, rakes, and eaves.
Failures to overhead doors and unprotected windows will be common. Windows in high-rise buildings can be
broken by flying debris. Falling and broken glass will pose a significant danger even after the storm. There will
be occasional damage to commercial signage, fences, and canopies. Large branches of trees will snap and
shallow rooted trees can be toppled. Extensive damage to power lines and poles will likely result in power
outages that could last a few to several days. Hurricane Dolly (2008) is an example of a hurricane that brought
Category 1 winds and impacts to South Padre Island, Texas.
Category Two Hurricane (Sustained winds 96-110 mph [154-177 km/hr]).
Extremely dangerous winds will cause extensive damage
There is a substantial risk of injury or death to people, livestock, and pets due to flying and falling debris. Older
(mainly pre-1994 construction) mobile homes have a very high chance of being destroyed and the flying debris
generated can shred nearby mobile homes. Newer mobile homes can also be destroyed. Poorly constructed
frame homes have a high chance of having their roof structures removed especially if they are not anchored
properly. Unprotected windows will have a high probability of being broken by flying debris. Well-constructed
frame homes could sustain major roof and siding damage. Failure of aluminum, screened-in, swimming pool
enclosures will be common. There will be a substantial percentage of roof and siding damage to apartment
buildings and industrial buildings. Unreinforced masonry walls can collapse. Windows in high-rise buildings can
be broken by flying debris. Falling and broken glass will pose a significant danger even after the storm.
Commercial signage, fences, and canopies will be damaged and often destroyed. Many shallowly rooted trees
will be snapped or uprooted and block numerous roads. Near-total power loss is expected with outages that
could last from several days to weeks. Potable water could become scarce as filtration systems begin to fail.
Hurricane Frances (2004) is an example of a hurricane that brought Category 2 winds and impacts to coastal
portions of Port St. Lucie, Florida with Category 1 conditions experienced elsewhere in the city.
Category Three Hurricane (Sustained winds 111-130 mph [178-209 km/hr]).
Devastating damage will occur
There is a high risk of injury or death to people, livestock, and pets due to flying and falling debris. Nearly all
older (pre-1994) mobile homes will be destroyed. Most newer mobile homes will sustain severe damage with
potential for complete roof failure and wall collapse. Poorly constructed frame homes can be destroyed by the
removal of the roof and exterior walls. Unprotected windows will be broken by flying debris. Well-built frame
homes can experience major damage involving the removal of roof decking and gable ends. There will be a high
percentage of roof covering and siding damage to apartment buildings and industrial buildings. Isolated
structural damage to wood or steel framing can occur. Complete failure of older metal buildings is possible, and
older unreinforced masonry buildings can collapse. Numerous windows will be blown out of high-rise buildings
resulting in falling glass, which will pose a threat for days to weeks after the storm. Most commercial signage,
fences, and canopies will be destroyed. Many trees will be snapped or uprooted, blocking numerous roads.
Electricity and water will be unavailable for several days to a few weeks after the storm passes. Hurricane Ivan
(2004) is an example of a hurricane that brought Category 3 winds and impacts to coastal portions of Gulf
Shores, Alabama with Category 2 conditions experienced elsewhere in this city.
Category Four Hurricane (Sustained winds 131-155 mph [210-249 km/hr]).
Catastrophic damage will occur
There is a very high risk of injury or death to people, livestock, and pets due to flying and falling debris. Nearly
all older (pre-1994) mobile homes will be destroyed. A high percentage of newer mobile homes also will be
destroyed. Poorly constructed homes can sustain complete collapse of all walls as well as the loss of the roof
HURRTRAK SLA – 2012_0412
Page 337 of 356
structure. Well-built homes also can sustain severe damage with loss of most of the roof structure and/or some
exterior walls. Extensive damage to roof coverings, windows, and doors will occur. Large amounts of windborne
debris will be lofted into the air. Windborne debris damage will break most unprotected windows and penetrate
some protected windows. There will be a high percentage of structural damage to the top floors of apartment
buildings. Steel frames in older industrial buildings can collapse. There will be a high percentage of collapse to
older unreinforced masonry buildings. Most windows will be blown out of high-rise buildings resulting in falling
glass, which will pose a threat for days to weeks after the storm. Nearly all commercial signage, fences, and
canopies will be destroyed. Most trees will be snapped or uprooted and power poles downed. Fallen trees and
power poles will isolate residential areas. Power outages will last for weeks to possibly months. Long-term water
shortages will increase human suffering. Most of the area will be uninhabitable for weeks or months. Hurricane
Charley (2004) is an example of a hurricane that brought Category 4 winds and impacts to coastal portions of
Punta Gorda, Florida with Category 3 conditions experienced elsewhere in the city.
Category Five Hurricane (Sustained winds greater than 155 mph [249 km/hr]).
Catastrophic damage will occur
People, livestock, and pets are at very high risk of injury or death from flying or falling debris, even if indoors in
mobile homes or framed homes. Almost complete destruction of all mobile homes will occur, regardless of age
or construction. A high percentage of frame homes will be destroyed, with total roof failure and wall collapse.
Extensive damage to roof covers, windows, and doors will occur. Large amounts of windborne debris will be
lofted into the air. Windborne debris damage will occur to nearly all unprotected windows and many protected
windows. Significant damage to wood roof commercial buildings will occur due to loss of roof sheathing.
Complete collapse of many older metal buildings can occur. Most unreinforced masonry walls will fail which can
lead to the collapse of the buildings. A high percentage of industrial buildings and low-rise apartment buildings
will be destroyed. Nearly all windows will be blown out of high-rise buildings resulting in falling glass, which will
pose a threat for days to weeks after the storm. Nearly all commercial signage, fences, and canopies will be
destroyed. Nearly all trees will be snapped or uprooted and power poles downed. Fallen trees and power poles
will isolate residential areas. Power outages will last for weeks to possibly months. Long-term water shortages
will increase human suffering. Most of the area will be uninhabitable for weeks or months. Hurricane Andrew
(1992) is an example of a hurricane that brought Category 5 winds and impacts to coastal portions of Cutler
Ridge, Florida with Category 4 conditions experienced elsewhere in south Miami-Dade County.
Texas Tech Study Scale (modified):
DOD*
1
2
3
4
5
6
7
8
9
10
Damage description
Threshold of visible damage.
Loss of roof covering material (<20%), gutters and/or awning; loss of vinyl or metal siding.
Broken glass in doors and windows.
Uplift of roof deck and loss of significant roof covering material (>20%); collapse of chimney;
garage doors collapse inward; failure of porch or carport.
Entire house shifts off foundation.
Large sections of roof structure removed; most walls remain standing.
Exterior walls collapsed.
Most walls collapsed, except small interior rooms.
All walls.
Destruction of engineered and/or well constructed residence; slab swept clean.
More information on the Texas Tech Study can be found at http://www.wind.ttu.edu/EFScale.pdf. Again, we use
a modified version of this to account for hurricanes.
HURRTRAK SLA – 2012_0412
Page 338 of 356
APPENDIX T6: Damage Estimate Report (Advanced only)
It is important that this report is only used as a guideline. The index values cannot and should not be
correlated to the amount of insured losses.
Introduced in 2008 for the Hurrtrak Advanced system, the Damage Estimate Report is designed to
analyze a storm's forecast overall damage potential. It can also be run after the storm has had an
impact to help determine the extent of damage which may have occurred. The calculation of the
Damage Estimate Index uses the force of the wind and the height of the estimated storm surge... along
with the population of the area(s) affected and the real estate values in those areas. The absolute value
of the index has no meaning and is used only to compare to past storm's index values. Since the
population of the area is critical, it is possible to have a Category 5 storm impacting a low population
density area have a Damage Index value lower than a Category 1 storm impacting a densely populated
area.
The report is run by selecting it from the dropdown Report menu. It can be run for the latest forecast or the
actual observations of the storm
The system will check to see if this report has been run earlier. If so, it will allow the user to show the previous
calculation. Viewing the previous calculation is recommended, unless storm forecast data (for the same
advisory) or actual advisory data has changed for the storm.
The damage report's performance varies greatly and can take anywhere from a few seconds to several minutes
to complete a calculation. When complete, it will present the user with the following window:
HURRTRAK SLA – 2012_0412
Page 339 of 356
As you can see, the report calculates two indexes: one for wind damage and the other for Storm Surge
Damage. It is important to separate these two factors, as some locations are more prone to storm surge
flooding than other areas... at the same level of wind. The report's descriptive scale is meant to only give a
general idea of how the index value compares to past storms. The difference in actual damage may not be
significant for storms that are described as extreme and extensive, but you can be fairly confident that a storm
with an extreme rating will be more damaging than one with a minor or moderate one. Finally, the current storm
is compared to past storms with "similar" index values. The report will show up to three comparative storms for
both wind and storm surge.
The information can be shared via email, printed output, etc.
HURRTRAK SLA – 2012_0412
Page 340 of 356
APPENDIX T7: Shape File Export
Hurrtrak Advanced has the ability to export several types of storm graphic and report information to an ESRI™
Shape type GIS file. Graphic-type Shape files for the currently loaded storm can be created by selecting the
FILE – Export to Shape File menu option.
The data that can be selected includes:
-
-
-
-
Wind Bands (Polygon): A polygon Shape file containing the actual and/or forecast wind bands for a
storm.
Current Storm Track and Observation (Polyline and Point): This action creates two Shape files…
one that shows the actual storm track, and a second Shape file containing a storm’s observation points.
Current Wind Radii (Polygon): This contains a polygon-type Shape file that describes the wind radii of
a storm’s 34, 50 and 64 knot wind areas.
Current Wind Field (Point): This option creates a point-type Shape file containing a grid of the current
wind pattern across a storm. The grid size is determined via the GIS Export tab of the General User
Options.
Current Watch and Warning area (Polyline): This creates multiple polyline-type Shape files which
represent the current tropical watches and warnings.
Official Forecast Path track and points (Polyline and Point): This action creates two Shape files…
one that shows the forecast storm track, and a second Shape file containing the official forecast
verification points.
Official Forecast Average Error (Polygon): This action creates a Shape file that represents the
forecast storm track average error.
Official Forecast Wind Radii (Polygon): This contains a polygon-type Shape file that describes the
wind radii of a storm’s 34, 50, and 64 knot wind areas at a specific forecast hour.
Official Forecast Wind Field grid (Point): This option creates a point-type Shape file containing a grid
of the wind pattern across a storm at a specific forecast hour. The grid size is determined via the GIS
Export tab of the General User Options.
Climate Forecast (Polyline) – This option creates a Shape file that represents the current climate
forecast.
Forecast Model Plots (Polyline) – This option creates a Shape file that contains multiple polylines
which represent the latest forecast model plots.
HURRTRAK SLA – 2012_0412
Page 341 of 356
-
Rainfall forecast (Polygon): This option creates 3 polygon-type Shape files. One for each 24 hour
forecast period, out to 3 days.
There is one additional type of Shape file export which is associated with the Location, County, or Zip Code
impact report (example show below).
When selected, the content of this report is exported into a point-type Shape file. Each point represents a
row/location on the report, and all of the report’s data fields (max wind, date/time of Max Wind, etc.) are
contained within the Shape file.
All of the exported Shape files can be viewed/analyzed using your GIS software (separate from HURRTRAK).
While we do not recommend or support any particular GIS software, you should be able to download
ArcExplorer for free from the ESRI™ Web Site.
Some examples of data being displayed on ArcExplorer © ESRI, are shown below.
HURRTRAK SLA – 2012_0412
Page 342 of 356
APPENDIX T8: Overlay Control Center
The system includes the ability to display a shape file layer on top of a map used for tracking.
The shape file is converted to a proprietary format (PWC) used by the Hurrtrak system. Once
converted, it can quickly be loaded without conversion in the future. The image below shows
platforms and pipelines in the Gulf of Mexico along with the forecast wind speeds and wave
heights from Hurricane Ivan.
From the Map Selection Tab, when the Display Overlay Control Center is selected, the following screen is
displayed:
HURRTRAK SLA – 2012_0412
Page 343 of 356
The screen displays the overlays currently loaded, as well as several options.
These options include:
Load Overlay – This loads an existing PWC file.
Import GIS File – This option will convert a Shape™ file into PWC format and load it. The user must have
some knowledge of the Shape file, particularly its coordinate system, Ellipsoid and UTM zone (if
applicable).
Hide/Show Overlay – This option will change the layer from being visible to being invisible, but keeps it
loaded at all times.
Remove Overlay – This option will remove the overlay.
Autoload overlay – This option will instruct the system to automatically load this layer the next time
HURRTRAK system starts up. Otherwise, it will not be loaded.
Move to Top – This option will take the currently selected overlay and make it the top layer.
Overlay Options – This option will display a new set of screens that allow the user to control the way a
specific layer is displayed, colors and any labeling.
HURRTRAK SLA – 2012_0412
Page 344 of 356
It also will allow the user to select a small .bmp file to represent points in a GIS layer. (i.e. an oil platform
icon for that type of asset)
At the bottom of the main overlay control screen, there are additional options which allow the user to
control the different types of layer’s font size and appearance.
While different layers can be displayed differently, the font size for one type of layer is all the same. i.e. the
font for multiple point layers is the same size. Label colors can be assigned by layer.
Finally, the “outline font” option applies to all layer labels and the background outline is the same as the
“land” color.
NOTE: You can download some PWC files which show Oil/Gas Platforms, Pipelines, Pipe Points and
Blocks as well as US State Borders and US Highways/Interstates, and manmade Dams from our web site
at http://www.pcwp.com/ftp/pwc.zip .
HURRTRAK SLA – 2012_0412
Page 345 of 356
APPENDIX U: Network Installations
The network installation of Hurrtrak is “network unaware”.. i.e., the system does not
know it is running on a network. The server install puts all of the application’s
executables and data onto its system, while the workstation install installs the necessary
windows components and defines the server executables as shortcuts. The only
exception is the street database, which is installed on both server and workstation.
Network Considerations & Directory Structure
The following diagrams describe how the network administrator should set up the authorities on
the network directories. This model assumes that the "signon required" field is set ON in the
System setup (SYSTEM) program.
Directory Structure and authorities:
SYSOP
Directory
/APPL
/APPL/data
/APPL/database
/APPL/database/user
/APPL/dem
/APPL/maps1400
/APPL/maps1024
/APPL/maps640
/APPL/Temp
/APPL/n
/APPL/nlcd
/APPL/sats
/APPL/slosh
/APPL/skins
/APPL/streetdata
/APPL/miscgraphics
/APPL/reconbmp
Read
Create, Read, Update, Delete
Create, Read, Update, Delete
Read, Update
Read, Update
Create, Read, Update, Delete
Create, Read, Update, Delete
Create, Read, Update, Delete
Create, Read, Update, Delete
Create, Read, Update, Delete
Read
Create, Read, Update, Delete
Read, Update
Read
Read
Read
Read
Regular User with Update option = "Y"
Directory
/APPL
/APPL/data
/APPL/database
/APPL/database/user
/APPL/dem
/APPL/maps1400
/APPL/maps1024
/APPL/maps640
/APPL/Temp
/APPL/n
/APPL/nlcd
/APPL/sats
/APPL/slosh
/APPL/skins
/APPL/streetdata
/APPL/miscgraphics
/APPL/reconbmp
HURRTRAK SLA – 2012_0412
Read
Create, Read, Update, Delete
Read, Update
Read, Update
Read, Update
Create, Read, Update, Delete
Create, Read, Update, Delete
Create, Read, Update, Delete
Create, Read, Update, Delete
Create, Read, Update, Delete
Read
Create, Read, Update, Delete
Read, Update
Read
Read
Read
Read
Page 346 of 356
Regular User with NO update capabilities
Directory
/APPL
/APPL/data
/APPL/database
/APPL/database/user
/APPL/dem
/APPL/maps1400
/APPL/maps1024
/APPL/maps640
/APPL/Temp
/APPL/n
/APPL/nlcd
/APPL/sats
/APPL/slosh
/APPL/skins
/APPL/streetdata
/APPL/miscgraphics
/APPL/reconbmp
Read
Read, Update
Read
Read, Update
Read, Update
Create, Read, Update, Delete
Read
Read
Create, Read, Update, Delete
Create, Read, Update, Delete
Read
Create, Read, Update, Delete
Read, Update
Read
Read
Read
Read
Directory Contents:
/APPL- System Executables, strike probability DAT files and other system files
/APPL/n** - Database History Files
/APPL/data - Miscellaneous system data files
/APPL/database - MS Access (MDB) files
/APPL/database/user- User Preferences Access File MDB
/APPL/dem - Digital Elevation Model Data
/APPL/maps1024 - 1400x1180 maps
/APPL/maps1024 - 1024x768 maps
/APPL/maps640 - 640x480 maps
/APPL/nlcd – National Land cover database
/APPL/sats – Satellite images
/APPL/slosh - SLOSH data files
/APPL/skins – Application Skin files
/APPL/Temp - Temporary files, Pre-Compress/Repair copies of .MDB files
/APPL/streetdata - Street Atlas data used in SLOSHView program
/APPL/reconbmp - Collection of bitmaps used in the recon program
/APPL/miscgraphics - Collection of bitmaps used in the system
* The APPL for HURRTRAK EM/Pro is HTEM2012
The APPL for Global EM/Pro is GTEM2012
The APPL for HURRTRAK RM/Pro is HTRM2012
The APPL for Global RM/Pro is GTRM2012
The APPL for Hurrtrak Advanced is ADV2012
** n = 1 for HURRTRAK, n=1 through 6 for Global
Full create / update / read access for all users must be given to .LDB files in the database and
database/user subdirectory.
HURRTRAK SLA – 2012_0412
Page 347 of 356
APPENDIX V: Global Tracker Considerations
Users of the system have the ability to track and analyze storms from around the world. The 6
tropical basins are Atlantic, East/Central Pacific, Western (North) Pacific, Northern Indian
Ocean, Southern Indian Ocean and Southwest Pacific. When tracking global systems, there
are several important considerations.
Hurrtrak Online
There are a few differences on how the global data is processed by Hurrtrak Online. The three
data sources for tropical cyclone data are
1. National Hurricane Center (NHC) – Covers the Atlantic and Eastern Pacific basin.
2. Central Pacific Hurricane Center (CPHC) – Covers the Central Pacific from 140 degrees West
to 180 degrees.
3. Joint Typhoon Weather Center (JTWC) – Covers the Western Pacific, Indian Oceans and
Southwest Pacific.
The hurricane center data is retrieved and processed by PC Weather Products servers and then
made available to its users. The client software (that’s you) then retrieves the data from our
servers and updates your local storm database. If there is a problem with the released advisories,
we take every measure to correct these problems to make sure the data gets to the user correctly.
In addition, the data is mirrored on a second backup site. For this reason, the data from the
Atlantic and Eastern/Central Pacific is more complete and very reliable.
The JTWC data is handled a little differently. PCWP servers download and save key data from
the JTWC and then make that available to its users. The client software then retrieves this key
data from our servers. While this approach has worked well in the past, there are several
opportunities for problems that the user needs to be aware of.
1. JTWC server problems – If the JTWC servers go down, no data will be available for the period
of outage. There is nothing we can do at this point, but wait until they fix the problems.
2. JTWC format changes – Since the server software contains program logic to decode the
JTWC advisories, if they change the format unexpectedly or make an error, the server software
will not update correctly. If it is an error, it will be corrected (hopefully) with the next advisory. If
the change is permanent, we will have to modify our server software.
One other important item has to do with the download of watches and warnings. Watches and
warning areas are only downloaded for the Atlantic basin and only when they affect US coastal
areas. This is because this is the only area for which standard watch and warning breakpoints are
defined. The user can manually input other watch and warning areas via the edit function.
Program Function differences
The following functions are not available to the Global user tracking storms outside of the Atlantic.
1. Strike Probability Analysis – Strike probabilities cannot be calculated outside of the Atlantic.
2. County & Zip Code Reports – The county and zip code report data is only available for the US
and PR/USVI, so analysis in the Pacific is not feasible.
3. Forecast Rainfall – Rainfall data is only available for the US.
4. Model Forecast – Hurricane forecast model data is only available for the Atlantic and Eastern
Pacific.
5. RECON – Hurricane reconnaissance information is only available for the Atlantic.
HURRTRAK SLA – 2012_0412
Page 348 of 356
6. SLOSH – Slosh flood analysis is only available for the coastal Atlantic, Bahamas, PR and
USVI.
7. Advanced Wind Estimation – The NLCD database used for advanced wind estimation covers
only the US Mainland.
Recommended user preferences
Most of the user preferences are the same for the Atlantic only version and the Global version. There
are two areas that need consideration.
1. Hurrtrak Online Preferences – Global users have additional options regarding how often to
check for new data. It is recommended that, if you have an always-on Internet connection,
you turn on the options to check for Atlantic, Eastern/Central Pacific and Western
Pacific/Indian Ocean. Set the intervals to 10-15 minutes for the Atlantic and 30-60 minutes for
the Western Pacific. Of course, if you have no interest in a geographical area, do not check
that option.
2. Automation Alert (advanced) Preferences – Since the JTWC data comes in differently than the
other data, you may need to change how you define new data. If you are NOT automatically
sending email alert and/or summary reports, set the new data option to ANY. If you are
sending email alerts, automatics summary reports or other automations, then set the new data
option to FORECAST ADVISORY. This is always issued for all global areas and will prevent
you from sending out multiple messages for each advisory.
HURRTRAK SLA – 2012_0412
Page 349 of 356
APPENDIX W: Technical Support
PC Weather Products provides free support via our Web Site and EMAIL.
HURRTRAK Advanced customers also receive telephone support at no
extra charge. In order to continue to provide support at no additional
cost, please make sure to follow the order of support shown below.
Before contacting us, please make sure you have done the following:
1. Review the system help text (this document)
2. Review the system documentation
3. Review the training modules at www.pcwp.com/training.html
4. Check the FAQ on our web site at http://www.pcwp.com
If these methods do not provide an answer, please contact PCWP via EMAIL:
Email support requests to: [email protected]
Hurrtrak Advanced customers may call us: (770) 953-3506 or by FAX at (770) 952-2540.
Email is the preferred method of support.
HURRTRAK SLA – 2012_0412
Page 350 of 356
APPENDIX X: Software License & Services Agreement
HURRTRAK Software License
& Services Agreement
CAREFULLY READ THIS LIMITED LICENSE TO USE THE SOFTWARE AND SERVICES OF PC WEATHER
PRODUCTS, INC. (“COMPANY”), WHICH IS GRANTED ON THE CONDITION THAT YOU ACCEPT AND COMPLY
WITH ALL OF THE PROVISIONS CONTAINED HEREIN. BY DOWNLOADING, INSTALLING, ACCESSING OR USING
SUCH SOFTWARE OR SERVICES, YOU ACCEPT AND AGREE TO BE LEGALLY BOUND BY ALL PROVISIONS
HEREIN, BOTH FOR YOURSELF AND ALL PERSONS USING AND ACTING WITH, FOR OR THROUGH YOU. IF YOU
DO NOT AGREE TO BE SO BOUND, THEN YOU MAY NOT USE THE SOFTWARE OR SERVICES. THE COMPANY
RESERVES THE RIGHT, AT ANY TIME IN ITS SOLE DISCRETION, TO MODIFY, SUSPEND OR TERMINATE THE
CONTENTS HEREIN AND ALL, OR PART, OF THE SOFTWARE AND SERVICES.
1. Orders. Customer agrees to purchase the Software and Services specified on any Customer submitted Order
accepted by Company. Customer shall pay the cost and bear the risk through receipt for all deliveries, including
without limitation insurance, shipping, handling, etc.
2. Rates & Fees. Fees and rates applicable to any Order shall be as set forth by the Company on its price quote
and do not include sales, usage, excise, property or other taxes, which amounts Customer shall pay. During any
renewal terms for a Service, the applicable fees and rates for such Service shall be those stated in the thencurrent Company price quote. A daily late charge of the lesser of: (i) 1.5% per month, or (ii) the maximum rate per
month permitted by law, shall be applied to, and due from, Customer for all amounts due but not paid by their
respective due date.
3. Delivery. Ordered Software shall be either accessible for download by Customer via the Internet or delivered
to Customer at the ship to address specified on the Order. Services shall be provided to Customer either via the
Internet or such other method as Company may specify.
4. License Grant. Customer is granted a non-exclusive, non-transferable and limited license to use the
purchased Software (which includes object code and documentation for the specific version so purchased along
with such updates provided, if any, unless so provided under separate or superseding terms) solely for your
internal business purposes either: (i) on the single workstation on which the Software is first installed, or (ii) where
site/network license is purchased, solely on such equipment and for such number of concurrent users and level of
access as specified on the applicable Order. Such right to use includes a right to copy or print the results and
displays generated by the Software from your permitted use for your internal business or personal use.
Additionally, Customer may reproduce the Software solely for backup and archival purposes; provided, all such
copies made must retain all copyright and proprietary notices and may only be put into use temporarily on such
backup workstation in the event the initial workstation on which the Software is licensed malfunctions or is no
longer in use.
5. Reservation of Rights. All title, property and intellectual property rights (other than those granted in Section
4), and other interests in, to and under the Software and Services is reserved by, and shall remain exclusively
with, the Company. Customer shall not disassemble, decompile, re-engineer, modify, tamper with, misuse or
create derivative works of the Software or Services. The Software may have asset protection devices that
suspend or restrict installation, reproduction and use if used or moved in an unauthorized manner.
6. Confidentiality. The Software and Services are, and do contain, valuable confidential information and trade
secrets of Company and its licensors that Customer shall protect with the same care and diligence (but no less
than reasonable) that it uses for its own confidential information. During the term of this Agreement and for the
longer of: (i) five (5) years from its termination, or (ii) the date on which any item is no longer a trade secret under
applicable law, Customer shall not disclose, distribute, assign, pledge, transfer, sub-license or make accessible to
others either the Software or Services without the prior written consent of the Company.
HURRTRAK SLA – 2012_0412
Page 351 of 356
7. Government Use & Exporting. The Software and Services are provided with RESTRICTED RIGHTS. Use,
duplication or disclosure by the Government is subject to restrictions set forth in subparagraphs (a) through (d) of
the Commercial Computer Software--Restricted Rights at FAR 52.227-19 when applicable, or in subparagraph
(c)(1)(ii) of the Rights in Technical Data and Computer Software clause at DFARS 252.227-7013, and in similar
clauses in the NASA FAR supplement, as applicable. Manufacturer is PC Weather Products, Inc., PO Box
72723, Marietta, GA 30007. Customer shall be responsible for complying with all applicable trade regulations
and laws, both foreign and domestic, regarding its export and use of the Software.
8. Support & Updates. Unless, and except as expressly stated in an applicable Order and the then-current
Support Policy of the Company, the Company shall have no obligation to support, update, maintain, enhance or
further develop the Software or Services, whether in whole or in part. Failure to implement updates or corrections
provided by the Company, as well as the alteration or combination of the Software or Services with any product
or service not provided or authorized by Company, is at Customer's sole risk and may render the Software or
Services unusable or nonconforming to applicable documentation. In no event will the Company have any
obligation to support or update any Software or Service for which updates have been made available but not
been applied.
9. Customer Responsibilities. Customer is solely responsible for the providing, at its own expense, all
hardware, operating system software, Internet access and other products and services necessary to access and
use the Software and Services in accordance with applicable specifications. In the event that the Company or it
designees need access to the facilities or systems of Customer so as to install, provide or maintain any Software
or Service provided, Customer agrees to timely permit such access. Customer is solely responsible for any use,
and the results of any use, of the Software and Services by or through it. Customer shall ensure that anyone
having access or use of the Software or Services by or through it complies with the provisions of this document
as such are applicable to Customer.
10. Usage Monitoring. The Company has the capability to, and anticipates that it may, monitor usage of the
Software and Services in order to ensure compliance with the provisions of this agreement, provided support and
other Services where applicable, and collect and aggregate certain data and information about use of the
Software and Services, which the Company expects will help it to improve its products and services. Customer
acknowledges and agrees to, without restriction or charge, Company’s use, execution, reproduction, display,
performance, modification and distribution of such data and information.
11. Test Versions. If any Software or Service is designated as a "beta" or test version, Customer agrees that the
purpose of the limited license is only for the testing and evaluation of the same. In furtherance of such purpose,
Customer agrees to provide feedback to Company concerning the functionality and performance of the Software
or Service from time to time as reasonably requested by the Company, including, without limitation, identifying
potential errors and improvements. Such feedback and information may be used by the Company to improve or
enhance its offerings or otherwise as the Company deems appropriate in its sole discretion.
12. Warranties and Disclaimers. THE COMPANY DOES NOT WARRANT THAT THE SOFTWARE OR
SERVICES WILL OPERATE UNINTERRUPTED, SECURELY, OR ERROR FREE OR WILL MEET YOUR
REQUIREMENTS. TO THE MAXIMUM EXTENT PERMITTED BY LAW, THE SOFTWARE AND SERVICES
ARE PROVIDED "AS IS" AND “AS AVAILABLE” WITHOUT ANY WARRANTIES OR CONDITIONS OF ANY
KIND, EITHER EXPRESSED OR IMPLIED, INCLUDING, BUT NOT LIMITED TO THE IMPLIED WARRANTIES
OF MERCHANTABILITY AND FITNESS FOR A PARTICULAR PURPOSE. Some jurisdictions do not allow the
exclusion or limitation of implied warranties, so in such instances the above exclusion or limitation may not apply,
in which case all applicable warranties are limited in duration to 90 days from the applicable Order Date, with no
warranties applying after that period.
13. Limitations of Liabilities and Remedies. No failure or omission by Company in the performance of any
obligation under this arrangement will be deemed a breach of its obligations nor create any liability if the same
arises, or will arise, from any cause or causes beyond its reasonable control, including (without limitation): acts of
God; acts, orders or omissions of any government or like regulator; hurricane, wind, flood, storm, lightening, fire,
earthquake or like natural disaster; acts of terror, war, riot, or rebellion; Internet brown out; acts or omissions of
Customer or its representatives; or failure of suppliers or communications services. THE MAXIMUM LIABILITY
OF COMPANY TO CUSTOMER FOR ANY DIRECT DAMAGES ARISING FROM THE SOFTWARE, SERVICES
OR ARRANGEMENTS ARISING HEREUNDER SHALL NOT EXCEED THE LESSER OF THE FEES PAID BY
CUSTOMER TO THE COMPANY: (I) DURING THE CURRENT CALENDAR YEAR FOR SUCH ITEM THAT
DIRECTLY CAUSED THE LIABILITY THAT AROSE, OR (II) DURING THE SPECIFIC CALENDAR MONTH FOR
SUCH SERVICE THAT DIRECTLY CAUSED THE LIABILITY THAT AROSE. TO THE MAXIMUM EXTENT
PERMITTED BY LAW, THE COMPANY SHALL NOT BE LIABLE FOR ANY INDIRECT, INCIDENTAL, SPECIAL,
CONSEQUENTIAL, OR PUNITIVE DAMAGE, HOWEVER CAUSED, INCLUDING BUT NOT LIMITED TO LOSS
OF BUSINESS, PROFITS, DATA, OR OTHER COMMERCIAL OR ECONOMIC LOSS ARISING OUT OF OR
352
HURRTRAK & Global Tracker Users Guide 1992-2012, PC Weather Products, Inc.
FROM THE SOFTWARE, SERVICES OR ARRANGEMENTS ARISING HEREUNDER EVEN IF THE COMPANY
HAS BEEN ADVISED OF THE POSSIBILITY OF SUCH DAMAGE.
14. Indemnification. Customer agrees to defend any suit or proceeding brought against and will protect, indemnify,
save and hold harmless the Company its licensors, subsidiaries and affiliates (along with their respective
directors, officers, employees and agents) from and against any and all suits, actions, claims, proceedings,
damages, losses, costs and expenses (including reasonable attorneys' fees) relating to or arising out of: (i)
Customer’s license, use or misuse of the Software or Services, or (ii) any actions, decisions or omissions
involving the use of the Software and Services or any results from their use; provided, however, such obligation
to indemnify will not apply to such matters arising solely from the negligent acts of the Company or the
infringement of copyrights, trademarks or patents of any third party involving the Software as originally provided
and properly used.
15. Term & Termination. The provisions herein, including the right of Customer to use the Software and
Services, shall commence upon acceptance and are effective until terminated. Customer may terminate at any
time with notice to the Company. Unless otherwise terminated early, the term of each Service Ordered shall
automatically expire one (1) year from the Order Date of such Service on the applicable Order. Company may
terminate any Service, including Support, at any time, with or without cause, upon one month notice to Customer
or general publication. Termination may also occur, at Company’s discretion, if Customer either: (i) fails to
comply with any provision herein, (ii) fails to timely pay in full for any item specified on an Order, or (iii) becomes
insolvent, bankrupt, in receivership or subject to either an assignment for the benefit of creditors or the
appointment of a trustee or receiver, with such termination being effective as of the later of: (a) the date of the
occurrence that gave rise to such termination, and (b) such date as specified by the Company. Upon termination
or expiration, Customer agrees to promptly return to Company (or at Company’s direction destroy) all copies of
the Software, including backup copies, provided or used by Customer. Customer will not be relieved of its
obligation to pay any amounts owed to Company that became due prior to the effective date of termination. The
provisions of sections 5-7, 10, and 12-16 shall survive any termination or expiration regardless of the reason.
16. General. This document, along with any corresponding Order accepted by the Company and any applicable
published policies and specifications of the Company, constitutes the complete and exclusive statement of the
agreement of the parties hereto with respect to the license and use of the Software and Services, superseding all
prior and concurrent agreements, promises, proposals, representations and warranties, whether oral or written,
with respect to the subject matter hereof. The headings used in this Agreement are for convenience only and
shall not create any rights or obligations or affect the meaning or interpretation of this agreement. No
amendment, change, modification or revision of this document or any Order is permitted or accepted unless
agreed to in writing by an authorized representative of the Company. No provision hereof shall be deemed
waived or modified except in a written addendum signed by an authorized representative of the Company. If any
term of this document is determined to be invalid or unenforceable pursuant to applicable law, then the invalid or
unenforceable provision will be deemed superseded by a valid, enforceable provision that most closely matches
the intent of the original provision and the remainder of the document shall continue in effect. Customer may not
sell, assign or transfer this agreement or any or its rights or obligations hereunder without the prior written
consent of Company. This Agreement shall be deemed to have been made in, and shall be construed pursuant
to the laws of, the State of Georgia, USA without reference to conflict of laws principles thereof. The application
of the United Nations Convention of Contracts for the International Sale of Goods is expressly excluded. The
parties expressly consent and agree that the proper jurisdiction and venue of any action regarding this matter
shall be the State or Federal courts located in or about Cobb County, Georgia, USA. Any claim or action against
the Company arising from or under this agreement or its subject matter must be brought within twelve (12)
months of the time it first accrues or shall otherwise be deemed waived and time barred. The Company shall be
entitled to recover from Customer such reasonable attorneys’ fees and court or collection costs that it incurs in
enforcing its rights hereunder. Customer acknowledges that the Company may incur irreparable harm in the
event of a breach of this Agreement by it and therefore agrees that the Company shall have the right, among
other remedies available to it, to take all reasonable steps to protect all proprietary and confidentiality rights and
interests, including (without limitation) by suspending or terminating Customer’s use of the Software or Services
(in either case without liability to Customer) or seeking injunctive relief and other like legal and equitable
remedies. Any notice required or given in connection with this arrangement shall be in writing and shall be given
to the appropriate party by personal delivery or by certified mail; postage prepaid, or recognized overnight
delivery services. Notice to Company shall be to PC Weather Products, Inc., Attn.: Legal, PO Box 72723,
Marietta, GA 30007.
353
HURRTRAK & Global Tracker Users Guide 1992-2012, PC Weather Products, Inc.
APPENDIX Z: FAQ & TROUBLESHOOTING
FOR THE LATEST VERSION OF THIS INFORMATION, PLEASE EXAMINE THE FAQ
AT OUR WEB SITE (WWW.PCWP.COM)
What is the best video mode to use?
Which screen resolution to use is a matter of personal preference. In order to see the main menu window,
as well as the other system windows, we recommended that you run the system in 1024x768 or greater.
We also recommend true color (24 bit or higher). We operationally use a 30” monitor at 2560x1600.
Is there some easy way of setting the "current" advisory for an earlier point in a storm’s history?
All attempts are giving me a map with the last plot of the storm.
Yes, the Post Storm Analysis feature under User Preferences or Tools will do this.
How does the Estimate of 48, 72, 96 and 120-hour, 34 and 64-knot wind fields work?
Since the National Hurricane Center does not provide the forecast wind field information for the areas
of 64-knot winds and in the 96 and 120- hour outlook... the 34, 50-knot wind areas...., we allow the user to
turn on the option which will force the system to estimate these wind fields. A series of algorithms are
utilized to come up with a best guess of what these wind fields will be. Please remember, these are only
estimates based on storm trend and climatology.
How does the Landfall Recognition work?
Since landfall will often be in-between forecast verification times, this presents a problem of linearly
extrapolating forecast winds between forecast points. I.E. if a storm's 36-hour forecast is to be 100 miles
offshore with top winds of 125 MPH and its 48-hour position is forecast to be 100 miles inland with top
winds of 75 MPH, then a linear extrapolation would calculate a 100 MPH storm at landfall. Turning Landfall
Recognition ON will force the system to maintain the intensity of the storm until landfall. Landfall is defined
(by the system) as 5 contiguous hours over land.
Can I put the images from the system in a public forum, like a web site?
The license agreement for this software does NOT allow for its images to be placed in a public forum, such
as a BBS, WEB Site, ON-Air, etc. If you have a desire to do so, please contact PC Weather Products to
discuss separate license agreement possibilities.
Will this run on a Network?
Yes, contact PC Weather Products for more information on the Network version.
How can I get the data in the tracking system into the historical database for use by the Hurricane
History program?
You can't. The historical database is based on "official" storm track information provided by the NHC
(Atlantic / East Pacific). In addition, the data is pre-processed to allow for rapid information access.
Why should I create separate storm databases in system setup?
While separate storm databases are not required, they are recommended in order to segregate storms by
year. Creating a separate storm database for 2011, 2012 ,etc. should make management of storm data
much easier. Remember, the system's default database after installation is the "PAST" database. If you
wish to segregate this year's storms, create a new database right after you install.
Why would I want to turn database security ON?
Unless you have the LAN version of the system, you probably don't. Turning on security forces the user to
sign on before starting any of the system's programs.
How should I utilize 'Location Groups' and why are there predefined groups (like Email Alert, small
354
HURRTRAK & Global Tracker Users Guide 1992-2012, PC Weather Products, Inc.
map and large map group)?
Location groups are a powerful addition to the tracking system's capabilities. Not only can you display the
locations within a group on the tracking charts, they are also used to determine which locations will be
analyzed in the batch location analysis and with the strike probabilities report. The small map group can
be used as the set of locations you want to display whenever you are using a small map (<20 degrees
wind). The large map group, as you might expect, can be used when displaying locations on a large map,
like the whole Atlantic, etc.. The Email Alert location group is used when creating a map for an email alert
message. There is also a new location group called “Base Locations” that controls what appears on the
Risk-Alert tab.
What is the significance of the value of the flood index?
The value of the index is determined by the strength of the onshore wind flow for that area. For a complete
discussion of this topic, see Flood Index Summary on page 290.
In the systems, there are options to display SLOSH data. What is this data?
The SLOSH data is data compiled by the NWS to determine the potential extent of coastal flooding due to
a storm surge. For a complete discussion of this topic, see SLOSH Summary on page 293
TROUBLESHOOTING - PROGRAM
My tab labels are not showing unless I select that tab.
This is a video driver problem. You can try setting the tab labels to a different location. If that does not
work, you should replace your windows video driver with a newer one. These are usually available from
your PC vendor or via Internet support sites.
Why does my entire window become filled with a solid color while performing certain functions like
wind band analysis and plotting the storm track?
If you are experiencing color flooding problems, it is likely that you have a bug in your video driver. You
should replace your windows video driver with a newer one. These are usually available from your PC
vendor or via Internet support sites.
When I email reports with the imbedded text option, the format of the report gets all messed up.
When viewing emailed reports that have column type data, the receiver must change his email program
viewing font to a non-proportional type (courier, for example). A better solution is to email the report as
HTML or PDF.
When I attempt to start the system, I am getting an error message that says "... is not a MS Access
Database". What's wrong? It worked fine the last time I used it.
This error message indicates that the main system database file(s) have become corrupted. This is
typically due to a unplanned shutdown, power outage, etc. To correct this, run a database repair. If this
does not work, then restore from the latest backup. If this is not available, then the only option is to
reinstall the entire system. Note: most of the time the file that became corrupt is the userdb.mdb file. If
you replace just that file, you may be up and running without having to reinstall.
I downloaded the latest information from HURRTRAK ONLINE, but the watch and warning areas are
not available. Why?
The watch and warning data is typically released a few minutes after the Forecast Advisory.
I add new Locations in System Setup, but they are not appearing in the correct position on the
tracking charts. Why?
You have probably entered latitude and longitude in degrees and minutes; make sure you enter it in
degrees and tenths of a degree. To convert to tenths, divide the minutes by 60. I.E. 29 degrees 30 minutes
is 29.5 degrees.
TROUBLESHOOTING - ONLINE - Internet Connection
In addition to reviewing this topic, please review the FAQ at our web site (www.pcwp.com) to see the latest
355
HURRTRAK & Global Tracker Users Guide 1992-2012, PC Weather Products, Inc.
information. If you cannot get this feature working properly, you may want to consider using the direct dial
option instead.
Everything's been working fine for a while, and now all of a sudden I am getting errors.
Do a cold reboot (shutdown and turn the PC off). You'd be amazed at how many Windows problems get
fixed this way.
I am using a direct connection to the Internet through my organization’s server, but I keep getting
error messages.
If you are connecting to the Internet through your organization’s server there are two potential obstacles.
1. Proxy Server - If you are using a non-authenticating proxy server, contact your network
administrator and find out what proxy server parameters you need to enter into the Internet setup
option.
2. Authenticating Proxy Server - Some organizations operate "Authenticating" Proxy Servers which
require additional passwords to get data from the internet. The HURRTRAK ONLINE INTERNET
system will not operate with these types of proxy servers. Contact your system administrator to
request that an authentication exception be defined just for the purposes of retrieving data from
http://www.pcwp.com/data. Then, define the proper parameters as shown in the Internet setup option.
356
HURRTRAK & Global Tracker Users Guide 1992-2012, PC Weather Products, Inc.