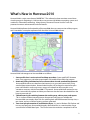
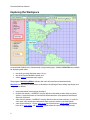
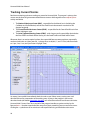
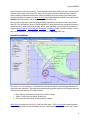
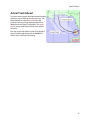
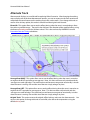
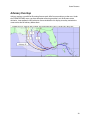
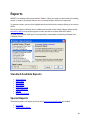
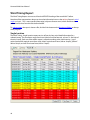
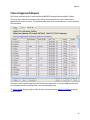
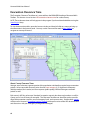
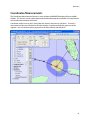
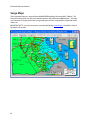
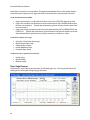
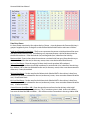
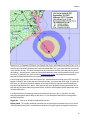
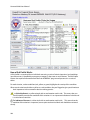
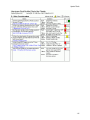
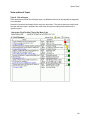
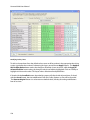
1
Hurrevac2010 User’s Manual
(Updated May 23, 2011)
Table of Contents
Welcome to HURREVAC .......................................................................................................................................................... 1
What's New in Hurrevac2010 ................................................................................................................................................ 2
Getting Started ........................................................................................................................................................................... 4
Resources ................................................................................................................................................................................. 4
Program Distribution ........................................................................................................................................................... 5
Installation and Configuration ......................................................................................................................................... 6
Using HURREVAC ....................................................................................................................................................................... 7
Topics in This Tour ................................................................................................................................................................ 7
Exploring the Workspace ................................................................................................................................................... 8
Tracking Current Storms ................................................................................................................................................. 10
Analyzing Distant Threats ............................................................................................................................................... 13
Evacuation Decision Timing........................................................................................................................................... 15
Other Forecast Data .......................................................................................................................................................... 17
Working with Archive Storms........................................................................................................................................ 18
Storm Features ........................................................................................................................................................................ 20
Available Storm Features ................................................................................................................................................ 20
Hourly Wind Ranges ......................................................................................................................................................... 21
72-Hr Wind Swath .............................................................................................................................................................. 22
Hourly Error Ellipse ............................................................................................................................................................ 23
Error Swath ........................................................................................................................................................................... 24
Watches/Warnings ............................................................................................................................................................ 25
Wind Probabilities ............................................................................................................................................................. 26
Actual Track Ahead ........................................................................................................................................................... 27
Alternate Track .................................................................................................................................................................... 28
Advisory Overlays .............................................................................................................................................................. 29
Briefing Display ................................................................................................................................................................... 30
Annotation ................................................................................................................................................................................ 31
Available Annotations ...................................................................................................................................................... 31
ii
Table of Contents
Storm Info Box .................................................................................................................................................................... 32
Advisory Labels ................................................................................................................................................................... 34
Custom Annotation........................................................................................................................................................... 35
Wind Tags ............................................................................................................................................................................. 36
Range Marks ........................................................................................................................................................................ 37
Disclaimers ........................................................................................................................................................................... 38
Place Names......................................................................................................................................................................... 39
Reports ....................................................................................................................................................................................... 40
Standard Available Reports ............................................................................................................................................ 40
Special Reports ................................................................................................................................................................... 40
Storm Statistics Report..................................................................................................................................................... 41
Error Swath Report ............................................................................................................................................................ 43
Wind Decay Report ........................................................................................................................................................... 45
Wind Timing Report .......................................................................................................................................................... 48
Evacuation Timing Report .............................................................................................................................................. 50
Closest Approach Report ................................................................................................................................................ 53
Rainfall Report ..................................................................................................................................................................... 54
River Flood Outlook .......................................................................................................................................................... 57
Browsers ..................................................................................................................................................................................... 59
Available Browsers ............................................................................................................................................................ 59
Evacuation Clearance Time ............................................................................................................................................ 60
Coordinates/Measurements .......................................................................................................................................... 61
Surge Maps........................................................................................................................................................................... 62
River Gage............................................................................................................................................................................. 63
Tide Gage .............................................................................................................................................................................. 66
Utilities ........................................................................................................................................................................................ 68
Available Utilities ............................................................................................................................................................... 68
Storm Data Entry ................................................................................................................................................................ 69
Historical Scan ..................................................................................................................................................................... 72
iii
Hurrevac2010 Users Manual
Map Defaults ....................................................................................................................................................................... 75
Evacuation Options ........................................................................................................................................................... 76
Decision Arc ......................................................................................................................................................................... 78
Export/Import...................................................................................................................................................................... 81
Exercise Track Wizard ....................................................................................................................................................... 83
Other Forms .............................................................................................................................................................................. 85
Setup Form ........................................................................................................................................................................... 85
Printing .................................................................................................................................................................................. 93
Monitoring Ribbon ............................................................................................................................................................ 95
Map Toolbar ......................................................................................................................................................................... 96
Decision Time Alert ........................................................................................................................................................... 97
SLOSH Display ..................................................................................................................................................................... 99
Special Tools ........................................................................................................................................................................... 102
Risk Profiles ........................................................................................................................................................................ 103
Florida Risk Profile ........................................................................................................................................................... 108
Virginia Risk Profile .......................................................................................................................................................... 120
New York Risk Profile ...................................................................................................................................................... 132
Facilities Timing ................................................................................................................................................................ 144
Facility Timing Details .................................................................................................................................................... 147
Evacuation Timing for a Single Facility .................................................................................................................... 153
Glossary .................................................................................................................................................................................... 155
iv
Welcome to HURREVAC
HURREVAC (short for Hurricane Evacuation) is a storm tracking and decision
assistance computer software tool for government emergency managers.
The program tracks hurricanes, using the National Weather Service’s
National Hurricane Center Forecast/Advisory product, and combines this information with data from
the various state Hurricane Evacuation Studies (HES) to assist local emergency managers in
determining a proper evacuation decision time and the arrival time of various storm effects such as
wind and storm surge.
HURREVAC is a joint program of the Federal Emergency Management Agency (FEMA) and the U.S.
Army Corps of Engineers (USACE). Sea Island Software is the private contractor tasked with
development, operation, and maintenance of the HURREVAC program. The USACE Baltimore District
office (Hurricane Program Office under the National Center of Expertise for Coastal Storm Damage
Reduction) administers the contract with funding and guidance from FEMA.
Hurrevac2010 is the latest platform for HURREVAC, so named for its initial release in the year 2010.
1
What's New in Hurrevac2010
Hurrevac2010 is a major new release of HURREVAC. The software has been rewritten several times
since the program's beginning in 1988 in order to stay current with Windows operating systems and
standards in information technology. Along the way, the annual 'Season Versions' have also
presented numerous enhancements and new features.
Hurrevac2010 duplicates the functionality of Hurrevac2000, the most recent version of the program,
and is intended as a complete replacement for the older Hurrevac2000 software.
Hurrevac2010's advantages over Hurrevac2000 are as follows:
1. State specific data is easier to install and keep up to date. State-specific HES clearance
times, river gage maps, and other customizations are installed from within the program.
2. Automatic polling and download of new forecast data via web-standard http protocol.
Hurrevac2010 receives new data from the Internet just as your web browser does, using
standard http communication. Network administrators will no longer be required to open
ports and firewalls in order to give users access to live data from hurrevac.com as was
sometimes necessary with Hurrevac2000's FTP protocol. Hurrevac2010 will monitor for new
storms/storm advisory updates and alert you when new data has been downloaded from the
hurrevac.com web site.
3. Tabbed browsing for switching between the tracking map, advisory text, and reports.
This is similar to modern Internet browsers that present web pages on multiple tabs.
Hurrevac2010 now employs View Tabs for switching back and forth between the map view, a
text viewer, and any number of reports you have generated.
4. Tree-view style presentation of available data layers. As seen in Windows File Explorer and
in many map programs, Hurrevac2010 employs hierarchical lists as a more intuitive way to
scan and view available data layers. The 'Current' tree-view maintains a complete list of live
2
What's New in Hurrevac2010
storms and other forecast information (current rainfall, flood outlook, gage data, etc) with
check boxes beside each one to control its display on the map. A tree-view is also employed in
the Toolbox, replacing the drop down menu system. Operations previously located in
Hurrevac2000's menus now appear under the following expandable headings of the Toolbox:
STORM FEATURES, ANNOTATION, REPORTS, BROWSERS, and UTILITIES.
5. Improved graphics with transparency and GIS capabilities. Items such as wind swaths,
error swaths, and rainfall isopleths which obscure the underlying map in Hurrevac2000 are
now displayed with partial transparency. Thanks to the transparency, it's now possible to
effectively display multiple storm features (i.e wind ranges and error swath together). Base
map resolution has been improved as well. Hurrevac2010's mapping functions are now
handled by a Geographic Information System (GIS) engine with data layers in shapefile format.
With this new GIS platform, HURREVAC should eventually have the capability to display
highly-detailed local maps of features such as surge zones, evacuation routes, shelter
locations, etc.
6. Better Help system. Help menu is easier to navigate and the help documentation is more
robust.
3
Getting Started
Resources
Hurrevac2010 includes a comprehensive help system that is installed along with the program. The
help system's 'Using HURREVAC' walk-through of program basics is a good place for new users to
begin. Searchable topics are available for in-depth research. A print-formatted PDF version is located
on the support site at http://www.hurrevac.com/guides.htm.
Technical Support
HURREVAC users have year-round access to 24/7 technical support from Sea Island Software,
developer of the program.
Users should register for the program and submit questions through the support site at
www.hurrevac.com. Routine website contacts and e-mails to [email protected] are answered
within one business day. Issues related to developing storms and other time-critical user needs are
addressed immediately even if outside of normal business hours.
Sea Island Software maintains a toll-free support phone line at (888) 840-4089. Support calls are
answered 24/7 during storm events.
4
Getting Started
Program Distribution
HURREVAC has been widely adopted in federal, state, and local government emergency management.
The program has more than 9,500 registered users; however, in actual practice there are likely two or
three times as many users, since registration is only required of one contact person per site.
HURREVAC is generally regarded as an indispensable tool for monitoring hurricane threats and
determining evacuation and other operational decision deadlines.
As a federally-funded program, the software, datafeed, and technical support are provided free-ofcharge to all individuals in government emergency management who request access. HURREVAC is
not distributed beyond the government emergency management community.
For program access, please visit the registration page at http://www.hurrevac.com/register.php.
Successful registrants receive an e-mail reply with instructions on how to download the program
installation file.
5
Hurrevac2010 Users Manual
Installation and Configuration
Detailed installation instructions are e-mailed to new users who apply for program access through the
registration page at http://www.hurrevac.com/register.php. If you are already registered but need to
have the installation instructions resent, please visit http://www.hurrevac.com/resend.php.
Program Requirements
Hurrevac2010 is a stand-alone desktop application for computers running Microsoft Windows. An
Internet connection is required in order for the program to retrieve live forecast data. The only other
program requirement is Microsoft .NET Framework 2.0. This modern application framework is
included with Windows VISTA and Windows 7 and may be obtained for older operating systems such
as Windows XP if not already present on your computer. Hurrevac2010's installation wizard will alert
you if the prerequisite .NET Framework is missing and needs to be downloaded from Microsoft.com
Installation
Basic steps for installation and configuration (as detailed in the registration e-mail) include:
1. Download and run the program install file.
2. Launch the program and go to the 'HURREVAC Setup Form' to make selections for State Plugins, Connection Settings, the Download Schedule, and Local Defaults.
6
Using HURREVAC
The following is a short walk-through of Hurrevac2010 intended for users who are new to HURREVAC
and for those who wish to refresh their skills.
Topics in This Tour
•
•
•
•
•
•
Exploring the Workspace
Tracking Current Storms
Analyzing Threats
Evacuation Decision Timing
Other Forecast Data
Working with Archive Storms
7
Hurrevac2010 Users Manual
Exploring the Workspace
Hurrevac2010's default view is dominated by a large tracking map. Additional View Tabs are available
for displaying other items:
•
•
•
text of the currently displayed storm advisory ;
text of the Tropical Weather Outlook; and
various reports generated upon request.
The program's Monitoring Ribbon indicates the status of recent forecast data downloads.
Map Tools for commonly-used functions are located on the left edge of the tracking map display and
are grouped as follows:
•
•
•
•
8
map manipulation (zoom and pan functions)
forecast hour buttons - HURREVAC's display defaults to the initial position of the very latest
advisory. Use these buttons to view forecast information from some portion of the forecast
(from 0 to 120-hours)
storm advisory buttons - HURREVAC's display defaults to the very latest advisory. In order to
view storm status and forecast information from a previous advisory use these buttons
storm forecast features - Display wind ranges (for a discrete hour), winds swath (for forecast
hours 0-72), error ellipse, and error swath (region where the storm in most likely to track)
Using HURREVAC
•
storm annotations - Forecast and past track position labels, watch and warning locations along
the coastline, wind probabilities
Data Tabs
Live storms and other forecast data appear in the list at top left on the Current Tab. You can expand
list headings and check list items on and off to control their display on the map. Right-clicking on a list
item will bring up additional options for that particular layer.
The Archives Tab is used to view ended storms, including a database of historical tracks dating back
to 1865.
Toolbox
Additional operations of the program appear at the bottom left of the workspace.
•
•
•
•
•
Storm Features displayed on the map for the current advisory
Annotation options for additional map labeling
Various Reports to be generated on potential storm impacts
Various Browsers to be used to examine mapped features such as river and tide gages
Utilities
9
Hurrevac2010 Users Manual
Tracking Current Storms
Real-time monitoring and storm tracking are central to Hurrevac2010. The program's primary data
sources are the three US government-based forecast centers which together cover tropical cyclone
activity worldwide:
1. The National Hurricane Center (NHC) - responsible for the Atlantic basin (including the
Caribbean and Gulf of Mexico) and the East Pacific basin that extends westward to 140
degrees longitude.
2. The Central Pacific Hurricane Center (CPHC) - responsible for the Central Pacific basin from
140 to 180 degrees west.
3. The Joint Typhoon Warning Center (JTWC) - with a large area of responsibility that includes
the West Pacific and North Indian Ocean, plus the South Pacific and South Indian Ocean.
Whenever there is an active tropical cyclone, the responsible forecast center produces sequentially
numbered advisories at 6-hour intervals. Issuance times are 03, 09, 15, and 21 Zulu (which translates
to 11pm, 5am, 11am, and 5pm Eastern Daylight Time).
At startup, Hurrevac2010 immediately checks the web to see if there are any active storms and
downloads them for presentation on the tracking map. As long as the program is left in autodownload mode (the default download schedule), you will receive notice of new forecast advisories.
Hurrevac2010's Current Data Tab, at top left of the program interface, organizes activity by the
forecast basins . Numbers appear after the name of any basin containing one or more active storms.
Clicking the + symbol next to an active basin will expand the listing to include the active storm
10
Using HURREVAC
name(s) and latest advisory number(s). To see a preview of all storm activity in a basin, simply click on
the basin name in the Current Data Tab. Storms in this preview mode are indicated with small red
circles (marking the location of the storm at the time of the most recent advisory) and white cones
(marking the potential tracking area or error swath).The Tropical Weather Outlook (accessed from the
Outlook View Tab) contains a text summary of activity in each basin.
When you find a storm you wish to investigate further, left-click on the storm's name in the Current
Data Tab. This will load this storm's STM file (HURREVAC's native file format for storing all the forecast
advisories from a single storm) into memory. With a storm activated, you can begin to manipulate it
using the Map Toolbar or Storm Features, Annotation, and Reports of the Functions window. You can
also view the text of its advisory package (accessed from the Advisory View Tab).
Storm Presentation
The storm's past track appears as a solid blue line, with colored squares representing the locations of
all previous (old) advisories. These are color-coded according to the maximum wind speeds observed
at the time of each advisory. The colors indicate:
•
•
•
Blue - tropical storm-force winds of at least 34kt or 39mph;
Yellow - winds of at least 50kt or 58mph; and
Red - hurricane-force winds of at least 64kts or 74mph.
Wind ranges illustrate the initial position and size of the storm. The Error Swath illustrates the area in
which the center of the storm is most likely to track. Forecast positions at 12, 24, 36, 48, and 72 hours
11
Hurrevac2010 Users Manual
are indicated by large white-filled squares. Extended forecast positions (96 and 120 hours) are
indicated by large gray-filled squares.
12
Using HURREVAC
Analyzing Distant Threats
When tracking a still distant hurricane, HURREVAC enables you to answer basic questions about the
threat such as:
•
•
•
Where is the hurricane currently located and how big is it?
Where is the hurricane expected to make landfall and at what intensity ?
What is the likelihood that the hurricane will impact my location and how soon could that
happen?
Storm status is indicated by the Storm Info Box that initially appears as a white banner across the top
of the tracking map. For a more prominent and detailed version, change the box type under
ANNOTATION...Storm Info Box. To find out how the storm is forecasted to develop over the five-day
period, use the (yellow) Move Storm AHEAD and BACK buttons of the Map Toolbar. The Storm Info
Box will update as you advance the storm along its forecast track .
An alternate way to gather statistics about the storm is through the Storm Statistics Graph or Report.
You can determine when tropical storm force winds are projected to reach the coast by advancing the
storm along its forecast track until the blue ring of the Hourly Wind Ranges touches the coast. Adding
Advisory Labels to the forecast track can also be helpful in illustrating when the storm center is
forecasted to be over an area.
13
Hurrevac2010 Users Manual
You should not focus solely on the forecast track or precise wind timing, however, when a storm is still
distant (36 to 120 hours away). Direction of the storm track, movement speed, and storm size is
uncertain and one should be focused on probabilistic forecast , rather than deterministic forecast
information. If you are in the Error Swath or Fringe Winds area surrounding the error swath, you
should be concerned and following the storm closely. The Error Swath Report will list all
counties/parishes within this swath and indicate how soon the storm might arrive. This calculation
will report an earlier time than the deterministic method (advancing the Hourly Wind Ranges) because
it adds a margin of error.
You can also use Wind Probabilities to gage the threat. Has the probability of hurricane-force winds at
the coastal location nearest you increased or decreased from previous advisories?
If you are an inland county or parish, the MEOW (wind) decay models will tell you a lot about how
much wind can be expected to penetrate inland to your area if the storm center comes very near or
over you.
Regional planners may wish to use the Closest Approach Report to determine which locations are
under the greatest threat.
14
Using HURREVAC
Evacuation Decision Timing
If a hurricane is determined to be close and threatening, you should begin to focus more specifically
on the official forecast track and precise timing calculations derived from it.
The 'close and threatening' time frame is determined to a certain extent by the lead time that your
community needs to make its evacuation preparations. In USACE Hurricane Evacuation Studies, this is
referred to as the Evacuation Clearance Time, the number of hours needed to move the
vulnerable population to safety. Clearance times vary according to both storm and local conditions.
In HURREVAC, you can use the Evacuation Clearance Time Browser to review all available scenarios for
your county or parish.
Timing Calculations
HURREVAC arrives at an evacuation decision time using input from the official hurricane forecast (from
NHC , CPHC , or JTWC ) and the Hurricane Evacuation Study for the county or parish of interest.
To determine the arrival time of tropical storm force winds, the program takes an Alternate Track,
worst-case scenario of a direct hit in which the forward speed and wind ranges of the official forecast
are retained, but the track is straightened and redirected to the county of interest. Typically, the
alternate track adjustment for counties in or near the error swath will result in a slightly earlier arrival
time for tropical storm force winds than the official track.
Note that because of the alternate track adjustment, it possible to run timing calculations on counties
well outside of the error swath where a storm strike is unlikely. HURREVAC cannot tell you whether or
not an evacuation is justified...only when the last possible moment is for making that decision. The
advantage of waiting as long as possible is that you have the most accurate forecast information and
are therefore in a position to make the best decision.
The precise evacuation clearance time (number of hours) used in the calculation will be based upon
your selection of Evacuation Options.
Finally to run the evacuation decision time calculations, you generate a tabbed Evacuation Timing
Report. These calculations should be updated each time a new forecast advisory is received. This is
15
Hurrevac2010 Users Manual
easily accomplished either with the Refresh button at the bottom of original report or by generating
an additional tabbed report.
If configured, the Decision Time Alert will appear when your county or parish is within 12 hours of
needing to make a decision.
Those familiar with the pre-computer methods for evacuation decision timing may also wish to use
the graphical Decision Arc Tool.
16
Using HURREVAC
Other Forecast Data
In addition to wind effects, storm surge and inland flooding are two
critical hazards that also need to be considered when preparing for a
hurricane strike. HURREVAC incorporates a number of NOAA / NWS
products to assist with the assessment of these threats through the
Rain, Rivers, and Tide Gages headings of the Current data tab. This
information is available year-round, even when there are no active
tropical cyclones, but is of special interest in the 24-48 hours prior to
storm landfall.
Inland Flood Tools
The River Flood Outlook (located under the Rain heading of the
Current data tab and as a Rain List under the Reports heading) and
3-day Quantitative Rainfall Forecast (located under the Rivers...Flood
Outlook heading of the Current data tab) provide generalized
guidance on possible inland flooding threats.
In order to display the latest rainfall and flood information in
Hurrevac2010, you must have the program's Download Schedule
set to 'Automatic Status Check' or have clicked 'Update Now' on the
Monitoring Ribbon. You can confirm the date and time of the currently displayed forecast by
checking the contents of the white banner that appears across the bottom of the tracking map.
The River Gage Browser should be used to consider potential flood scenarios surrounding specific
rivers gage locations. To display inland river gages, select the Rivers...River Gages heading of the
Current data tab. The latest gage information will be downloaded from the Internet as you turn this
on for the first time. With the gage locations displayed on the map, zoom in and click on a single gage
of interest to view a chart of water levels over time. In addition to observed and forecasted river levels,
charts for many gages contain helpful static information on defined flood levels, historical crests, flood
impact statements, and inundation maps.
Coastal Tide and Storm Surge Tools
The Tide Gage Browser should be used to consider tidal fluctuations and storm surge potential. To
access coastal tide stations, select the Tide Gages heading of the Current data tab. The latest gage
information will be downloaded from the Internet as you turn this on for the first time. Click on a
station on the map to display the tide chart of predicted (astronomical) and observed tide levels.
Depending on the storm size, location, and other factors, differences between the two tide values can
begin to show up well in advance of the approaching storm.
The Tide Gage Browser also contains several SLOSH Display tools for determining potential storm
surge under various direct hit scenarios.
17
Hurrevac2010 Users Manual
Working with Archive Storms
Want to simulate live hurricane tracking or review a storm that
impacted your area in the past? In addition to its live tracking
capabilities, Hurrevac2010 is a useful tool for evaluating historical
and hypothetical storms. When viewing and analyzing storms from
the Archives Tab, you will have access to all of the same STORM
FEATURES, ANNOTATION, and REPORTS functions employed when
tracking a live storm.
Your installation of Hurrevac2010 is accompanied by an extensive
database of STM files (HURREVAC's native file format for storing all
the forecast advisories from a single storm). Complete seasons of
STM records extend back to 1995 for the Atlantic basin, 1999 for
the East and Central Pacific basins, 2001 for the West Pacific basin,
and 2006 for the South Pacific basin.
For earlier years, HURREVAC's data source is the NHC 's Historical
Track Database. This database extends back to 1851 for the
Atlantic basin and 1949 for the East Pacific Basin.
Archive Organization
STM files of the Archives Tab are cataloged under headings for
sequential years (2010,2009, 2008, etc). Within each year, STM files
are further cataloged by basins - Atlantic, East Pacific, Central
Pacific, West Pacific and North IO, and South Pacific and South IO.
The check boxes by each heading can be used to turn on a preview
of all storm tracks from an entire year or basin within a single year. Left-clicking on the name of a
single storm in the list will load the relevant STM file, at which point you can begin to manipulate and
analyze the forecasts from that particular storm.
The Favorites heading at top of the Archives Tab is intended as a placeholder for frequently accessed
storms. To add a storm to Favorites, browse the year/basin headings and right-click on the desired
storm name. Select 'Copy to Favorites Storms Folder' from the options that appear next to your
cursor. Favorites should also be employed if you wish to show storms from different years on the
tracking map simultaneously. Your Favorites selections will be retained upon exit of the program. To
remove a storm, simply right-click on its name under the Favorites heading and choose 'Remove from
Favorites Folder.'
The Exercise heading is populated with STM files that are located in a special ExerciseSTMFiles data
directory. Most often, these are hypothetical storms created using the Exercise Track Wizard. You can
also use UTILITIES...Export/Import > Import Plot (.stm) to place a copy of an actual STM file in this
directory and then manually alter the parameters of this storm using the Storm Data Entry Utility to
create a slightly different storm scenario.
The Historical Plots heading is for viewing storms prior to 1994 from the NHC's Historical Track
Database. Storms from this database are simply plotted by 6-hourly center locations. These historical
tracks do not contain the wind extent or forecast information as the STM files do and therefore cannot
18
Using HURREVAC
be manipulated and analyzed to the extent that the STM file-based storms can. Instead, use the
Historical Scan Utility to query this database.
19
Storm Features
Storm Features are options for how forecast information associated with a particular storm advisory is
displayed on the map. Wind ranges, wind swath, and error swath, formerly discrete 'display modes' in
Hurrevac2000, can now be shown in combination as storm features. Additional forecast attributes
such as watches and warnings and wind probabilities also appear under the STORM FEATURES
heading of the Toolbox.
Available Storm Features
•
•
•
•
•
•
•
•
•
•
Hourly Wind Ranges
72-Hour Wind Swath
Hourly Error Ellipses
120-hr Error Swath
Watches/Warnings
Wind Probabilities
Actual Track Ahead
Alternate Track
Advisory Overlays
Briefing Display
20
Storm Features
Hourly Wind Ranges
This display shows storm position and size at a
certain hour of the forecast. Concentric rings
represent the extent of tropical storm force
winds (34kt or 39mph) in blue, 50kt or 58mph
winds in yellow, and hurricane force (64kt or
74mph) winds in red.
The Hourly Wind Ranges display defaults to
the initial position (Hour 0) of the latest
advisory.
Use the Time+ button at the edge of the
map view to advance the storm along its
forecast track and the Time- button to
return to earlier hours. Wind ranges
disappear from the display once a storm is
advanced beyond forecast hour 72. This occurs because the Hurricane Centers do not make wind
extent forecast data available beyond the 72-hour point.
The Hourly Wind Ranges button at the edge of the map view toggles the view between open
circles (rings), filled circles (colors), and no display. Left-click to turn the display on and off. Rightclick to change the display type. These operations are also duplicated in the Toolbox under the
'STORM FEATURES... Hourly Wind Ranges' heading.
21
Hurrevac2010 Users Manual
72-Hr Wind Swath
The 72-Hr Wind Swath is a composite of wind
ranges along the 72-hour forecast period. The
fill colors represent the extent of tropical storm
force winds (34kt or 39mph) in blue, 50kt or
58mph winds in yellow, and hurricane force
(64kt or 74mph) winds in red.
This storm feature should be utilized only when
the storm is close. It is a specific forecast subject
to error, and should be given credence only
with the last few advisories before landfall. On
the mainland US, the NHC will use a specific
version of the MEOW (wind) Decay Model to
prepare this forecast when the storm is forecast
to landfall.
See the Wind Overforecasting Disclaimer help
topic for discussion of another important caveat
of this display.
You can use the companion "Wind Timing...All Locations" Report for finding out which counties are
affected and by how much.
22
Storm Features
Hourly Error Ellipse
The white circle surrounding the 36-hour forecast position
in this display represents the Average Forecast Error, or
region in which the storm center is most likely to be located
at that discrete hour of the forecast period. Winds of
tropical storm force or greater (fringe winds) could be
occurring within the hatched area if the storm tracked at
the outer edge of the error ellipse.
The Error Ellipse button at the edge of the map view
toggles the view between error ellipse only, error
ellipse + fringe winds , and no display. Left-click to turn the
display on and off. Right-click to change the display type.
These operations are also duplicated in the Toolbox under the 'Storm Features...Hourly Error Ellipse
heading.
Error ellipses are shown for discrete hours and when you turn the display on, the first hour shown
is the 12-hour forecast position (9 hours from the advisory issuance time). Use the Time+ button
at the edge of the map view to advance the storm along its forecast track and the Time- button to
return to earlier hours. The fringe wind ellipse disappears from the display once a storm is
advanced beyond forecast hour 72. This occurs because the hurricane centers do not make wind
extent forecast data available beyond the 72-hour point.
Background Information
The error ellipse reflects the uncertainty in the hurricane forecast process. The ellipse means that even
though the NHC , CPHC, or JTWC has forecast a specific position, the storm center could end up
anywhere within the ellipse at that time...with a 66% level of confidence. Error ellipses can be useful
for timing functions when a storm is distant and the uncertainty great.
23
Hurrevac2010 Users Manual
Error Swath
The large white swath surrounding the forecast track in this
display represents the Average Forecast Error, or region in
which the storm center is most likely track within the next
72 hours(3 days). Winds of tropical storm force or greater
(fringe winds) might occur in the hatched area if the storm
tracked at the outer edge of the error swath. Extending
beyond the 72-hour swath, the transparent area bordered
by a gray ellipse represents the Average Error Swath for 73
to 120 hours (5 days).
The Error Swath button at the edge of the map view
toggles the view between error swath only, error swath
+ fringe winds , and no display. Left-click to turn the display
on and off. Right-click to change the display type. These
operations are also duplicated in the Toolbox under the 'Storm Features...Error Swath' heading.
You can use the companion Error Swath Report for finding out which counties are affected and by
how much.
Background Information
The error swath is a composite of the error ellipses published by the NHC , CPHC , and JTWC each year
for forecast hours 12, 24, 36, 48, 72, 96, and 120. The swath means that even though the has forecast
a specific track, the storm could end up anywhere within the swath within the next 72 hours...with
around a 66% confidence level. Indeed, the storm could end up outside the swath, but the swath is
based on a 5-year average of forecast errors and recent developments in forecast models such as the
GFDL model have improved forecast skill. Nevertheless, if your area is in or near to this swath, you
should be concerned and begin at least some preliminary planning for possible action.
24
Storm Features
Watches/Warnings
Watches and warnings appear as lines along the coast or as flags marking segment starting and
ending locations. Watches and warnings are only visible when you are working with a particular
advisory in which they were issued.
The Watch/Warn button at the edge of the map view toggles the view between lines, flags,
lines+flags, and no display. Left-click to turn the display on and off. Right-click to change the
display type. These operations are also duplicated in the Toolbox under the 'STORM
FEATURES...Watches/Warnings' heading.
Background Information
Prior to 2010, the NHC and CPHC issued hurricane warnings (red) when hurricane conditions were
expected within 24 hours and hurricane watches (pink) when hurricane conditions were possible
within 36 hours. Tropical storm warnings (blue) were issued where tropical storm conditions were
expected within 24 hours and tropical storm watches (green) when that threat was possible within 36
hours.
Since the start of the 2010 hurricane season, watches and warning are issued 12 hours earlier than in
previous years....so 48 hours for watches and 36 hours for warnings.
25
Hurrevac2010 Users Manual
Wind Probabilities
This display indicates the probability of hurricane, 50kt, and tropical storm-force within a 120-hour
period. Wind Probabilities appear as numbered boxes along the coast and are only visible when you
are working with the particular advisory in which they were issued.
Three numbers are given at each location. The red box is probability of 64 knot (74mph) winds; yellow
boxes contain probability of 50 knot (58mph) winds; and blue boxes contain probability of 34 knot
(39mph) winds.
The Wind Probabilities button at the edge of the map view toggles this display on and off with a
left-click.
Background Information
The Surface Wind Speed Probabilities text product, which is attached to the bottom of the Forecast
Advisory Text product in HURREVAC, provides probabilities, in percent, of sustained wind speeds
equal to or exceeding 34-, 50-, and 64-knot wind speed thresholds. These wind speed probabilities are
based on the track, intensity, and wind structure forecasts and uncertainties from the National
Hurricane Center and Central Pacific Hurricane Center, and are computed for coastal and inland cities
as well as offshore locations (e.g., buoys).
For each probability value, the event in question is a sustained (one-minute average) surface (10
meter) wind speed of at least a particular threshold value (34, 50, or 64 kt) at a specific location.
The numbers shown on HURREVAC's map are the cumulative 120 hour probabilities – These values tell
you the overall probability the event will occur sometime during the specified cumulative forecast
period (0-120 hours) at each specific point.
26
Storm Features
Actual Track Ahead
Two storm tracks appear ahead of the storm location
whenever you are viewing an earlier advisory. The
black-dotted line is the forecast track from the
particular advisory you are viewing and the bluedotted line is the 'Actual Track Ahead' This actual
track is comprised of initial positions from all later
advisories.
You may wish to turn off the 'Actual Track Ahead' if
you are working with forecasts from HURREVAC's
archive storms and find it distracting.
27
Hurrevac2010 Users Manual
Alternate Track
Alternate track displays are a useful tool for exploring What-If scenarios. After changing the tracking
map to display one of the three alternate track options, you can run reports on the new scenario and
manipulate the storm features on the tracking map in the usual manner. If you change advisories or
receive a live advisory update, this mode is canceled and the original track restored.
Direct Hit - This option allows one to see the effects/timing when the storm is moved along a direct
hit track to a specified county. The track is then laid out in the direction of the specified county, using
the forecast forward speed for the 120 hours ahead. This is the track used by HURREVAC to make
Evacuation Decision Timing calculations.
Average Error RIGHT - This option allows one to see the effects/timing when the storm is moved at
an angle to the RIGHT equivalent to average error. Note - this does not necessarily coincide with the
average error swath right edge. That could not be used because average error occasionally is circular
when the storm is moving slow and the size of the error simply enlarges in place.
Average Error LEFT - This option allows one to see the effects/timing when the storm is moved at an
angle to the LEFT equivalent to average error. Note - This does not necessarily coincide with the
average error swath left edge. That could not be used because average error occasionally is circular
when the storm is moving slow and the size of the error simply enlarges in place.
Original Track - This option restores the original, official advisory and erases the alternate track. You
must use this option, or change advisories or storm file, to be able to do computations using the
official advisory track.
28
Storm Features
Advisory Overlays
Advisory overlays are useful for illustrating forecast track shifts from one advisory to the next. Under
the STORM FEATURES menu, you have the option of turning on either 3 or 6 of the most recent
advisories. Intermediate A and B advisories are not included in this display since they maintain the
same track as the full advisory before them.
29
Hurrevac2010 Users Manual
Briefing Display
Briefing Display is a simplified view of a storm's forecast to be used for briefings where you need to
communicate the essential facts in an easy-to-understand format. This display emphasizes the current
location of the storm and its potential track area (error swath). Advisory Labels and watches/warnings
may be toggled on and off in this display, but many of the other STORM FEATURES are not available.
30
Annotation
ANNOTATION is a heading within Hurrevac2010's Toolbox. It is comprised of various map labeling
options.
Certain annotation options can also be accessed with a right-click on the map.
Available Annotations
•
•
•
•
•
•
•
•
Storm Info Box
Advisory Labels
Custom Annotation
Wind Tags
Range Marks
Disclaimers
City Names
Lat/Lon Hacks
31
Hurrevac2010 Users Manual
Storm Info Box
The Storm Information Box is an ANNOTATION item.
By default, storm information is displayed in the form of a banner across the top of the tracking map.
Information included in this banner is
•
•
•
•
•
storm name and advisory number;
date and time of the storm's currently displayed position;
latitude and longitude of the storm's currently displayed position;
maximum winds; and
forward speed .
One alternative to this display is to place a small information box next to the storm center.
Another option is to place a larger information box with legend included, on the map at either upper
left, upper right, lower right, or lower left of the screen. This is the type of display recommended for
briefing purposes since it is visible from a distance.
32
Annotation
33
Hurrevac2010 Users Manual
Advisory Labels
Advisory Labels are an ANNOTATION item.
Advisory labels appear as text tags along the track of a
single storm and can be toggled on and off using the
'Advisory Labels' check box under the ANNOTATION
heading of the Toolbox. Look just below this check
box for access to the 'Storm Labels Setup' form.
Options on the setup form include:
•
•
•
•
•
Label Text (Advisory Number, Day of Week,
Date, Time, Max Wind, S/S Category, Pressure,
Forward Speed)
Label Which Points? (Forecast Points, Past
Advisories)
Plot Interval (from 6 - 72 Hours)
Font Type (Regular or Bold)
Speed In (MPH or Knots)
A Label Button on the Map Toolbar will also toggle
labels on/off with a left-click. Right-click for Label
Setup.
Working with Advisory Labels
HURREVAC attempts to place as many labels on the storm track as possible without overcrowding. At
distant zoom levels, some of your labels may disappear because the interval you've selected is too
high to fit them all within the view. Try using a larger interval (36 hours or greater) and be selective
with the number of items you include in the label text.
34
Annotation
Custom Annotation
Custom Annotation is an ANNOTATION item, accessed in the Toolbox
and through right-clicking on the map.
Custom Annotations are snippets of text you add to the map display
independent of labels that HURREVAC automatically generates.
Possible uses of this include:
•
•
Labeling a place on the map and fixing to a map position
Adding an explanatory text to the map and fixing to a screen
position
Working with Custom Text Annotation
1. Right-click on the map in a location where
you wish to add a text label and select
'Annotate Text Here' from the pop-up menu.
2. In the Text Annotation setup form, select a
text size, location relative to Lat/Lon or
Screen Position, text color, and bold/regular
font. Enter your text in the box and press
Annotate.
3. Text can be toggled on and off with the
'Custom Annotation' check box under the
ANNOTATION heading of the Toolbox. The
text will remain in memory for as long as the
program is open.
4. Text may be cleared from memory by rightclicking on the map and selecting 'Delete
Nearest Text' or 'Delete ALL Text.'
35
Hurrevac2010 Users Manual
Wind Tags
Wind Tags are an ANNOTATION item, accessed in the Toolbox and through right-clicking on the map.
Wind tags are interactive displays of wind on the tracking map, which change as the storm is moved,
or an advisory is changed. They "stick" where they are placed, regardless of panning or zooming
actions by the user.
They are useful to display the NHC , CPHC , or JTWC forecast implied winds at any point, and to show
whether winds in an area will be blowing onshore, and thus subjecting the area to storm surge, or
blowing offshore, which should lessen and even eliminate storm surge.
Wind Tag locations are saved on disk between sessions, so you can set them up for an area of concern,
and they will be available when you next use the program.
The exact location of the wind speed and direction computed with the wind tags is at the upper left
corner of the wind tag box.
How to Use Wind Tags Ahead of a Land-falling Storm
1. Hurrevac2010 is pre-configured with a few wind tags already on the map, so the first action
you may want to take is to completely clear the map display of wind tags. To do this, go to
ANNOTATION...Wind Tags...Delete All.
2. Next, right-click on the map at a coastal location within the projected path of the storm.
Repeat this step in other areas within the projected path to add a number of wind tags to the
left and right of the forecast track. If needed, you can delete select tags with
ANNOTATION...Wind Tags...Delete Tag.
3. Advance the storm along its forecast track (or actual track, if viewing an old advisory). Wind
tag direction is influenced even when the storm is still distant. However wind tag speed only
displays when the storm is directly over head.
36
Annotation
Range Marks
Range Marks are an
ANNOTATION item,
accessed in the Toolbox
and through rightclicking on the map.
Range marks can be a
useful way of illustrating
how far away the storm is
from a location of
interest.
Working with range
marks
Range marks are toggled
on and off with the
'Range Marks' check box
under the ANNOTATION
heading of the Toolbox.
Look just below this
check box for access to
the setup form. Options
on the setup form
include:
•
•
•
Mileage Type
(Statute or Nautical miles)
Interval or miles or knots
Centered At (a specified Lat/Lon or a point clicked on the map)
Another method of quickly configuring range marks is to right-click on the map and select 'Center
Range Marks Here' from the pop-up menu.
37
Hurrevac2010 Users Manual
Disclaimers
Disclaimers are an ANNOTATION item.
The following disclaimer from the NHC will appear as a banner across the top of the map when
'Disclaimers' is checked under the ANNOTATION heading of the Toolbox.
"National Hurricane Center Disclaimer: 'Wind Range Contours show the maximum extent of winds
expected in each quadrant. Users are cautioned that winds vary greatly within each quadrant. For
quadrants extending over land and water, over-water values are used, which may make the extent of
inland winds radii appear unrealistically large"
About Wind Over-Forecasting
Over-forecasting of wind occurs in certain situations with land-falling and closely paralleling storms
due to limitations in the level of detail provided on wind ranges in the forecast advisory. Hurrevac
strictly uses the wind ranges specified by NHC , CPHC , or JTWC in its advisory . These are given only in 4
quadrants: Northeast (NE in advisory), Southeast (SE), Southwest (SW) and Northwest (NW).
With only these wind ranges as input, and even with smoothing of the range changes between
quadrants, the wind forecast must show that most or all of the quadrant has the specified wind range
from the advisory. Therefore as stated in the NHC Disclaimer, in certain situations a small area of
stronger winds at the edge of a quadrant may exist and the advisory must reflect that wind range for
the quadrant as a whole.
This situation most frequently occurs on the left side of storms that are moving forward at a decent
pace. It is also noted frequently in closely paralleling storm situations. In these situations, it is normal
for there to be a marked decrease in wind ranges on the left side (west side for northward moving
storms), especially if the storm is moving forward at a significant speed.
But, since there is usually a pronounced drop-off in wind ranges from the right side to left side of the
storm in these situations, stronger winds in a small area just inside the left (weaker) quadrant can
result in a greater wind range in the advisory for the entire quadrant than actually exists.
Also, there are certain situations where a small area of stronger winds are located well within a
quadrant (perhaps in a small area of heavy showers) but are not reflected in the rest of the quadrant.
38
Annotation
Place Names
Place Names are an ANNOTATION item.
Place names can be toggled on and off under the
ANNOTATION heading.
39
Reports
REPORTS is a heading within Hurrevac2010's Toolbox. When you request an item under this heading,
analysis is made on a particular forecast advisory and presented in the form of a report tab.
To generate a report, you must first highlight the desired storm on the map by clicking on its name in
the list.
The 'Analysis/Reports Selection' form is called when you click on the Analysis/Reports button on the
Monitoring Ribbon at top of the program or when you click on a report within the Toolbox.
To guide your selection, each report is accompanied by a description (or 'Meaning of Report') and
'Cautionary Notes.'
Standard Available Reports
•
•
•
•
•
•
•
•
Storm Statistics
Error Swath
Wind Decay
Wind Timing
Evacuation Timing
Closest Approach
Rainfall
River Flood Outlook
Special Reports
The following reports will appear in the list only if special state-specific tools are installed.
•
•
Risk Profile
Facility Timing Details
40
Reports
Storm Statistics Report
The Storm Statistics Report is accessed from the REPORTS heading of Hurrevac2010's Toolbox.
This report consists of past wind speed, pressure, and forward speed during the life of the storm to
date, and then forecast of wind speed and forward speed out to 120 hours. Each row of the tabular
report is colored according to the intensity of the storm at the time of that forecast hour or old
advisory - blue if tropical storm force (34kt or 39mph), yellow if 50kt or 58mph, and red if hurricane
force (64kt or 74mph).
The report's data is initially sorted by Date/Time. To sort by any other item, click on its heading once
for ascending order, twice for descending order.
If you have downloaded an advisory update or switched the map display to a different advisory, use
the 'Refresh' button to rerun the analysis based upon the changed forecast information.
To print or export the report's data to a file, click the Print button on the Monitoring Ribbon at the top
of the program.
41
Hurrevac2010 Users Manual
Storm Statistics Graph
An additional option is available within the 'Analysis/Reports' selection to display storm statistics in
graph form.
The forward speed is plotted in black with its scale bar at far left. Maximum sustained winds is plotted
in red with a scale bar at near left. Central pressure is plotted in blue with a scale bar on the right edge
of the graph. Statistics from old advisories are connected by a solid line. Statistics from the forecast
period are connected by a dashed line. The NHC does not provide forecasts of barometric pressure, so
the blue line is not plotted for the forecast period.
42
Reports
Error Swath Report
The Error Swath Report is accessed from the REPORTS heading of Hurrevac2010's Toolbox.
This report is an analysis of counties or parishes located within the Error Swath, or white cone
surrounding a storm's forecast track . Counties within the error swath or fringe winds area bordering
the error swath have a chance of eventually being affected by the storm.
For each reported county, an indication is given of how early or how late the center could cross the
area, assuming average error late and average error early, as well as the time implied by the advisory as
the median arrival time. The 'Winds Possible' heading indicates whether the county is within the
actual error cone (making Max Winds from the storm's core possible) or within only the tropical stormforce (fringe wind) area .
The report's data is initially sorted by counties affected first ('Time of Peak' heading). To sort by any
other item, click on its heading once for ascending order, twice for descending order. Additionally, the
list may be filtered for 'Locals Only'.
If you have downloaded an advisory update or switched the map display to a different advisory, use
the 'Refresh' button to rerun the analysis based upon the changed forecast information.
43
Hurrevac2010 Users Manual
To print or export the report's data to a file, click the Print button on the Monitoring Ribbon at the top
of the program.
44
Reports
Wind Decay Report
The Wind Decay Report is accessed from the REPORTS heading of Hurrevac2010's Toolbox.
This report, formerly referred to as the MEOW or Maximum Envelope of Winds, describes the
maximum distance certain categories of wind can penetrate inland, given the storm strength and
forward speed. These wind decay models are particularly important for determining winds over areas
far inland from the coastline, and for planning purposes. In the last few hours before landfall, the
specific NHC Wind Swath and Wind Timing Report should be used instead of the wind decay models.
If no decay model is currently selected, a selection panel will appear, asking you to choose one. The
default model selected is one determined from the Max Wind forecast by the NHC for that advisory at
any time out to 72 hours....and the forecast forward speed of the storm over the next 36 hours. You
can choose any model you wish or leave the selection as is.
Hurrevac generates a report for an entire region (Northeast, Southeast, or Gulf Coast), so the list is very
long and likely includes many counties that are well away from the forecast track. To limit the report
length either choose 'Locals Only' or 'In Error Cone' which limits the list to those within the Average
Error Swath.
45
Hurrevac2010 Users Manual
The report's data is initially sorted alphabetically by state and county. To sort by the Category of Wind,
click on its heading once for ascending order, twice for descending order. There is no timing involved
with this report, just the strength of winds that could occur in an area, given a perfect strike on the
area at a selected storm strength and selected forward speed . Each row of the tabular report is colored
according to the wind intensity - blue if tropical storm force (34kt or 39mph), yellow if 50kt or 58mph,
and red if hurricane force (64kt or 74mph).
To print or export the report's data to a file, click the Print button on the Monitoring Ribbon at the top
of the program.
Map Display
Model information can also be displayed on the tracking map by selecting Wind Decay...Graphic from
the REPORTS heading of the Toolbox. A legend appears across the top of the map identifying the
wind categories.
Background Information
The NHC Wind Decay Model (DeMaria and Kaplan 1996) predicts how far inland certain categories of
wind will penetrate, assuming a) a direct hit b) specified maximum sustained winds of the storm and
c) specified forward speed of the storm.
There are 3 regions which were computed in the decay model, necessitated by the different behavior
of storms in these 3 areas.
•
•
46
Gulf Of Mexico land-falling storms (includes the west coast of Florida)
Southeast Coast land-falling storms (from Key West to the NC/VA border
Reports
•
Mid Atlantic and New England storms (north of NC/VA border) - this separate area
necessitated by the faster forward speeds typical there.
The colors representing the wind categories are annotated on screen when this mode is in effect.
47
Hurrevac2010 Users Manual
Wind Timing Report
The Wind Timing Reports are accessed from the REPORTS heading of Hurrevac2010's Toolbox.
Note that all the computations done to arrive at the information here use the advisory forecast's wind
swath as a basis. This is more specific information (subject to forecast error) which should not be
utilized until the last few advisories before landfall.
To print or export the report's data to a file, click the Print button on the Monitoring Ribbon at the top
of the program.
Single Location
The Wind Timing...Single Location report consists of hour-by-hour wind detail information for a
selected county. The time frame ranges from hour 0 (the hour of the forecast) to hour 72 (the limit of
the wind swath). Each row of the tabular report is colored according to the wind intensity - gray if
under threshold for tropical storm force winds, blue if tropical storm force (34kt or 39mph), yellow if
50kt or 58mph, and red if hurricane force (64kt or 74mph).
48
Reports
All Locations or Local Areas
The Wind Timing...All Locations report consists of information for all counties within the wind swath of
the advisory forecast. The forecasted arrival time and ending time is given for each of the three
categories of wind. Duration of winds equal to or greater than the category appear in parentheses
after the ending times. Time of peak winds (storm's closest approach) is reported in the final column.
The report's data is initially sorted alphabetically by state and county. To sort by a different item, click
on its heading once for ascending order, twice for descending order. Each row of the tabular report is
colored according to the maximum wind intensity forecast for that county - blue if tropical storm force
(34kt or 39mph), yellow if 50kt or 58mph, and red if hurricane force (64kt or 74mph).
You can also run this Wind Timing analysis for Local Areas for a more selective report.
49
Hurrevac2010 Users Manual
Evacuation Timing Report
The Evacuation Timing Reports are accessed from the REPORTS heading of Hurrevac2010's Toolbox.
These reports are available for counties with Hurricane Evacuation Study clearance times installed as
State Plug-Ins.
The purpose of Evacuation Timing is to determine how long you can afford to wait before beginning
an evacuation. The advantage of delaying this evacuation start for as long as possible is so that your
decisions are based on the most accurate storm forecast, while still allowing enough time for
preparations to be completed if needed.
Note that all the computations done to arrive at the information here assume a direct hit on the area
for the purposes of timing actions (a worst case scenario and one you must consider if in or near the
threat area).
To print or export the reports data to a file, click the Print button on the Monitoring Ribbon at the top
of the program.
50
Reports
Single Location
The Evacuation Timing...Single Location report consists of hour-by-hour timeline of actions for a
selected county. The time frame ranges from hour 0 (the hour of the forecast) to hour 72 (the limit of
the wind forecast). Rows of the tabular report are colored according to activity: gray if pre-decision or
post-storm time, green if active evacuation time, blue if within tropical storm force (34kt or 39mph),
yellow if within 50kt or 58mph, and red if within hurricane force (64kt or 74mph) conditions.
In the final column, the hours in daylight and dark are noted - an important consideration when
deciding on the best time to begin an evacuation.
All Locations or Local Areas
The Evacuation Timing...All Locations report consists of evacuation timeline information for all
locations with HES State Plug-Ins available.
The report's data is initially sorted by earliest decision time. To sort by a different item, click on its
heading once for ascending order, twice for descending order. Items in the report are:
•
•
•
Evacuation Type - as determined by the selected scenario in the Hurricane Evacuation Study
Decide - Date/Time of decision time. [Past] indicates that the evacuation should already be
underway if needed.
Duration - the clearance time, or number of hours, needed to complete the evacuation
51
Hurrevac2010 Users Manual
•
•
•
Category/Occupancy/Response - Hurrevac defaults to medium occupancy, medium response,
and the max storm category forecasted.
Arrival times of 34kt (tropical storm-force) and 64kt (hurricane-force) winds,plus the eye of the
storm
'Nearest' refers to how close the actual forecast comes to the county. This is the only data item
that is based on the actual forecast rather than the worst-case, direct hit scenario.
To limit the report length either choose 'Locals Only' or 'In Error Cone' which limits the list to those
within the Average Error Swath.
52
Reports
Closest Approach Report
The Closest Approach report is accessed from the REPORTS heading of Hurrevac2010's Toolbox.
This report shows the closest distance, point in time, and direction that a storm is forecasted to
approach each county in the list. The predicted storm track of the current advisory is used to calculate
this information.
The report's data is initially sorted by Date/Time of closest approach. To sort by a different item, click
on its heading once for ascending order, twice for descending order.
To print or export the report data to a file, click the Print button on the Monitoring Ribbon at the top
of the program.
53
Hurrevac2010 Users Manual
Rainfall Report
The 3-day quantitative rainfall forecast is one of several Other Forecast Data products that can be
helpful to consider when weighing the flooding threat from an approaching storm. This information
can be displayed on the map and in a report of affected counties/parishes.
The source of this data is the HPC, or NOAA Hydro-Met Prediction Center, which compiles generalized
rainfall forecasts for the continental US. These forecasts are for three successive days and are issued
twice a day, around 8am and 8pm Eastern(12Z and 0Z).
Each 24-hour cumulative rainfall forecast takes the form of isopleths (polygons) of rainfall amount,
with the higher amounts of rain nested within the lower amounts. The amounts are in hundredths of
an inch, with 0.25 = 1/4 inch, 1.50 = 1-1/2 inch, etc.
Map View
Days 1, 2, and 3 can be cycled through using the radio buttons under the Rain heading of the Current
data tab.
54
Reports
Report View
The Rainfall Report is accessed from the REPORTS heading of Hurrevac2010's Toolbox.
The report's data can be sorted by any of the column headings. Click on a heading once for ascending
order, twice for descending order...or you can sort by the Most Rain and Alphabetical buttons at the
bottom of the report. Each row of the tabular report is colored according to the 3-day total rainfall
forecast (blue if less than 3 inches, yellow if less than 5 inches, and red if 5 or more).
The report's data can be filtered by 'Locals Only.' or restored to All Items. The Refresh button should
be used if you wish to update the report after a new HPC rainfall forecast is downloaded.
To print or export the report's data to a file, click the Print button on the Monitoring Ribbon at the top
of the program.
IMPORTANT NOTES
These forecasts from HPC are currently issued every 12 hours and the NHC issues advisories on
hurricanes at least every 6 hours. Therefore by the time the latest advisory from NHC is issued...the
HPC rain forecast can easily be several hours old and therefore may not reflect the latest forecast
storm track from NHC.
55
Hurrevac2010 Users Manual
Also, these rainfall forecasts are smoothed and averaged amounts, while actual rain amounts ,
especially in the warm months, are not usually distributed as evenly, and tend to fluctuate widely
over an area.
Therefore, as in hurricane forecasting, think of the forecast rain amounts as "educated guesses" that
help you to zero in on the most vulnerable areas. Also as in hurricane forecasting, the rain amount
error increases dramatically as the forecast goes to Day 2 and especially Day 3.
Always check with your local Weather Service office for the latest updates on the rainfall situation and
the latest river stages. These forecasts are constantly being revised and the HPC forecast shown in
HURREVAC can be several hours old.
56
Reports
River Flood Outlook
The National River Flood Outlook is one of several Other Forecast Data products that can be helpful to
consider when weighing the flooding threat from an approaching storm. This information is displayed
on the map when the Rivers...Flood Outlook heading is checked under the Current data tab.
Map View
HPC, the National Weather Service Hydro Meteorological Prediction Center, issues a 5-day forecast of
freshwater flooding hazards for the continental US using more specific forecasts for each flood basin
provided by several regional NWS River Forecast Centers (RFCs) around the country. These outlooks
are currently issued once a day around 21Z or 5PM Eastern Daylight Time.
The Flood Outlook takes the form of polygon regions that are color-coded according to the likelihood
of flooding. The categories are defined as follows:
•
•
Occurring/Imminent (red) Significant flooding is already occurring or is forecast to occur
during the outlook period.
Likely (blue) hydro meteorological conditions indicate that significant flooding can be
expected during the outlook period.
57
Hurrevac2010 Users Manual
•
Possible (black) hydro meteorological conditions indicate that significant flooding could
occur. Such flooding is neither certain nor imminent.
IMPORTANT NOTE
This Flood Outlook is intended to provide a general outlook for significant river flooding. It is not
intended to depict all small-scale events such as localized flooding and/or flash flooding. This graphic
will not depict minor river flooding as this implies only minimal or no property damage with possibly
some public inconvenience. Also, these forecasts are constantly being revised and the HPC forecast
shown in HURREVAC can be several hours old. Please refer to products issued by local NWS offices for
the latest official river forecasts and warnings.
58
Browsers
BROWSERS is a heading within Hurrevac2010's Toolbox. When you request an item under this
heading, a floating window appears over the program's main screen for the purpose of 'browsing'
data that appears on the map. Browser windows can be dismissed or minimized when not in use.
Available Browsers
•
•
•
Evacuation Clearance Time
Coordinates/Measurements
Surge Maps
Gage browsers appear when you turn on either the river gage layer
or tide gage layer. These layers are accessed from both the Current
or Archive Data Tabs.
•
•
River Gage
Tide Gage
59
Hurrevac2010 Users Manual
Evacuation Clearance Time
The Evacuation Clearance Time Browser is accessed from the BROWSERS heading of Hurrevac2010's
Toolbox. This browser is used to view HES evacuation clearance time for a select county.
NOTE: These clearance times will only appear in the program if you have downloaded them using the
State Plug-In Setup.
To view clearance time tables, open the browser window and then left-click on a county to bring up
the information in the browser panel. You may use the Zoom and Pan tools of Map Toolbar to
navigate to a county of interest.
About County Clearance Times
Stronger storms threaten a greater portion of the population and therefore require longer evacuation
periods. At least one table (or matrix) exists for each storm category (1-5). High tourist occupancy
(holiday weekend, for instance) and slow response (public apathy) will lead to longer evacuation
periods as well.
Each county's HES has at least one 'Standard' evacuation scenario, but there may be others as well (InCounty versus Out-of-County, for example). The Clearance Time Browser should be used to consider
all possible evacuation scenarios, tourist occupancy levels, and response times. Decide which settings
will be used in Hurrevac's Evacuation Decision Timing based upon a review of the HES documentation
and discussions with your emergency management colleagues.
60
Browsers
Coordinates/Measurements
The Coordinates/Measurements Browser is accessed from the BROWSER heading of Hurrevac2010's
Toolbox. This browser can be used to determine the latitude/longitude coordinates of a map location
and to make measurements of distance.
Coordinates of the cursor on the Tracking Map are shown in the browser at all times. To record a
measurement of distance, left-click on the map to begin a segment and left-click again to end the
segment. You can continue adding segments to the measurement with left-clicks.
61
Hurrevac2010 Users Manual
Surge Maps
The Surge Maps Browser is accessed from the BROWSER heading of Hurrevac2010's Toolbox. This
browser can be used to view the raster-based maps from the old Hurrevac2000 program. The maps
vary from one HES region to the next, but typically represent local surge patterns, evacuation zones,
routes, etc.
IMPORTANT NOTE - You must have one or more Inundation Map State Plug-ins installed in order to
have access to any files.
62
Browsers
River Gage
The River Gage Browser is accessed from the BROWSER heading of Hurrevac2010's Toolbox. This
browser can also be launched by clicking on a specific river gage point on the map. River gages are an
available data layer on the 'Current' data tab under the heading 'Rivers.'
HURREVAC monitors roughly 1000 river gages in hurricane prone states from Texas to Maine. The
program's River Gage display is part of a suite of inland flood tools that also include the National River
Flood Outlook and the HPC 3-day Rainfall Forecast. Refer to the 'Other Forecast Data' topic for more
information on these.
NOAA's Advanced Hydrologic Prediction Service (AHPS) is the source of this river gage data. The
HURREVAC system (data.hurrevac.com) receives updated gage observations and forecasts as often as
every hour from AHPS' vast network. Each time you turn on the River Gage layer under the Rivers
heading of the 'Current' data tab, Hurrevac2010 downloads the latest available information from
data.hurrevac.com. To refresh the gage display after a number of hours of viewing, simply un-check
and then recheck the River Gage layer.
River Gages Map Display
River gages are best displayed on the map when zoomed in to a state-wide or tighter view. The gages
appear as circles of different sizes and colors depending on the data available (size) and state and
63
Hurrevac2010 Users Manual
trend of the river (colors) as shown below. The legend at the bottom of the screen display explains
which circle colors represent river stage and which circle border colors represent the river trend.
Circle size indicates data available:
•
•
•
Gages represented by a small white circle have only OLD or OUTDATED data (or no data)
Gages with a medium size colored circle have recent data but ONLY OBSERVATIONS and no
forecast river conditions. Typically the observations go back 36 hours from the time of the
most recent data.
Gages with a large size colored circle have recent data including BOTH OBSERVATIONS and
FORECASTS. Typically the observations go back 36 hours from the time of the most recent
data and the forecasts go forward in 6-hourly increments to 120 hours or 5 days.
Circle colors indicates river stage:
•
•
•
•
•
Green for >5 feet below flood stage
Blue for below flood stage
Yellow for Minor Flood
Red for Moderate Flood
Purple for Major Flood
Circle border colors represent the river trend:
•
•
•
Red for rising
Blue for falling
Black for steady
River Gage Browser
The browser is used to display the data from an individual gage site. You bring up the browser by
clicking on the circle representing the gage of interest.
64
Browsers
Graph of river level and rainfall
The River Gage browser time frame is different for observation-only display and observation and
forecast displays:
•
•
For observation-only displays, the 36 hours of past gage readings are spread out across the
graph for clarity....with the last reading where the heavy vertical line is drawn.
For observation and forecast displays, the 36 hours of past readings are on the left side of the
graph...followed by 120 hours of forecast stages on the right 2/3rds of the display.
The color scheme for the observations and forecasts are noted at the bottom of the browser.
If 'Basin Average Rainfall' observations and forecasts are available, they are presented at the upper left
of the graph. The color scheme is the same as for the gage reading and forecast colors.
When amounts are shown, the amounts are BASIN AVERAGE. That is, the amounts are averaged over
the basin above the gage shown. So for instance, if a heavy thunderstorm dumped 3 inches over a
small area in the basin above the gage, the average rainfall spread over the entire basin may be only a
few hundredths of an inch. The same goes for the forecast amounts. If scattered heavy thunderstorms
are forecast, they may only produce a few hundredths or tenths of an inch over the entire basin.
On the right side of the browser are buttons for controlling the graph display. The Up Button adjusts
the graph scale upward to allow view of Flood, Moderate Flood, and Major Flood levels. The Down
Button adjusts the graph scale downward to allow viewing of smaller fluctuations.
Other Information available in the browser
•
•
•
Impacts statements (Impacts button) from the USGS describe the effects from past floods of
various levels;.
Historical crests and lows (Crests button) from the USGS with high and low water observations
from the past;
River Gage Map shows the area around the gage that would be inundated by a 100-year flood
and by a 500-year flood.
NOTE: The Map button appears only when the state gage maps are installed and a gage map
is available for that specific gage.
65
Hurrevac2010 Users Manual
Tide Gage
The Tide Gage Browser is accessed from the BROWSER heading of Hurrevac2010's Toolbox. This
browser can also be launched by clicking on a specific tide gage point on the map. Tide gages are an
available data layer on the 'Current' data tab.
HURREVAC monitors over 100 coastal tide gages in hurricane prone states from Texas to Maine. The
program's Tide Gage display is an important tool for weighing tidal inundation and storm surge
threats from approaching storms. The storm surge components of this browser are detailed in the
SLOSH Display topic.
NOAA 's National Ocean Service (NOS) is the source of this tide gage data. The HURREVAC system
(data.hurrevac.com) receives updated gage observations and forecasts as often as every hour from
NOS. Each time you turn on the Tide Gages layer of the 'Current' data tab, Hurrevac2010 downloads
the latest available information from data.hurrevac.com. To refresh the gage display after a number of
hours of viewing, simply un-check and then recheck the Tide Gages layer.
Working with Tide Gages
Tide gages are best displayed on the map when zoomed in to a state-wide or tighter view. The gages
appear as circles along the coast. Click on the circle of interest to bring up the Tide Gage Browser for
that gage.
The Tide Gage browser time frame is typically from 48 hours before current time to 30 hours or so
beyond the current time. Observations versus predicted heights are available up to the current time
and predictions only from current into the future up to 5 days (120 hours). The time frame of the
66
Browsers
display can be lengthened forward up to 120 hours by using the Time Frame buttons below the
graph. The vertical scale of the gage display can be adjusted using the Scale buttons below the graph.
The heavier gray vertical line represents the latest data and can be moved left or right either by
clicking with your mouse or by using the left or right arrows on your key board. The data at the time
referenced by the heavy vertical line is displayed in boxes below the graph.
MLLW or Mean Lower Low Water represents the average of the lowest of the tides during the day
(typically there are two, one lower than the other). So height MLLW represents the height of the water
above this low reference value.
Predicted values are the values computed by using the NOAA Tidal Harmonics algorithms for each
gage (each gage has a different set).
The Residual shown is the Tidal Anomaly computed by subtracting the Predicted from the Observed
reading. Positive numbers represent tide above normal and negative represent tide below normal.
Tide gage readings are updated at data.hurrevac.com about once an hour....but there is some lag to
the NOS data, so expect some gage data to be between 1 and 2 hours old even when just
downloaded. The residual or anomaly is the most important data and is usually quite slow to change
except as the center of a storm approaches. So, in most cases a fairly good estimate can be made of
the current tidal height by using the most recent hour's residual and applying it to the current hour.
67
Utilities
UTILITIES is a heading within Hurrevac2010's Toolbox.
Available Utilities
•
•
•
•
•
•
•
Storm Data Entry
Historical Scan
Map Default Settings
Evacuation Option Settings
Decision Arc
Exercise Track Wizard
Export/Import
68
Utilities
Storm Data Entry
The Storm Data Entry tools are located under the UTILITIES heading of Hurrevac2010's Toolbox.
These tools give you the ability to edit or create STM files, Hurrevac's native storm file format. The
most common use is for creation of a hypothetical storm from scratch or by modifying an existing STM
file. Another possible use would be if you were unable to receive STM file updates from
data.hurrevac.com and needed to manually enter forecast information into the program.
Manual Data Entry/Edit
This screen is where you enter data manually (by hand) if you do not have access to the Internet but
have a printed copy of the NHC , CPHC , or JTWC forecast advisory available.
The official National Hurricane Center (NHC), Central Pacific Hurricane Center (CPHC), and Joint
Typhoon Warning Center (JTWC) forecast advisories are the sources for all data used by Hurrevac2010
concerning the current storm. This is the most important data the program ingests, and must be
done correctly or errors will result in all calculations based on this data. The program does checking of
gross errors in input but cannot catch all minor errors that may occur.
Header Information
Disk Filename - In this box, you select the filename for the storm file you wish to work with. All
advisories for a storm come within one storm file, so if you just want to select another advisory,
choose the Advisory box (see below).
Storm Name - The selected storm's name is printed in this box.
Advisory # - This is the box where you can either select another advisory's data to view , or more
commonly, this is where you enter a new advisory number to indicate that you want to enter new
advisory data from the latest NHC or CPHC Forecast / Advisory.
Note: To enter Intermediate Advisories simply type in the Advisory number plus an A, B , or C as appropriate
(that's how they are numbered). Intermediate (Public ) advisories do not contain any new forecast
information. Just enter the new Initial Position of the storm , change the issuance time, and keep all else
same as previous advisory.
Time of Advisory Issuance - If entering a new advisory....in these boxes, you choose the
Year/Month/Date/Time of issuance of the advisory. These boxes automatically change if you are
simply viewing another advisory in the file, to reflect the issuance time of that advisory. When entering
a new advisory, remember that you must use the Z or Zulu (also called GMT) issuance time of the
advisory. This is the time frame that is used with the Forecast/Advisory and printed at the top of that
advisory.
69
Hurrevac2010 Users Manual
Data Entry Boxes
It is best to enter new data by Row rather than by Column, since the data on the Forecast/Advisory is
grouped together by time. So begin first with the Row labeled Initial Position and enter as follows:
Initial (and Forecast) Eye Positions - The first row represents the current or initial position of the storm
from the Forecast/Advisory text. The following rows represent forecasts valid at the time printed to
the left of these boxes. Enter the latitude (Lat) and longitude (Lon) taken from the Advisory.
Maximum Wind - Enter in these boxes the maximum sustained wind (not gusts) from the advisory at
the time indicated for that row (on the entry screen, times are at the extreme left of the row).
34-Knot Wind Range - Enter the range of 34 knot winds in each quadrant (NE=northeast)
(SE=southeast) (SW=southwest) and (NW=northwest) in nautical miles (n.m.) taken from the advisory
lines labeled 34KT at the time indicated for the row (on the entry screen, times are at the extreme left
of the row). If none, leave blank.
50-Knot Wind Range - Do the same for the 50 knot winds (labeled 50KT in the advisory) taken from
the advisory at the time indicated for the row (on the entry screen, times are at the extreme left of the
row). If none leave blank.
64-Knot Wind Range - Do the same for the 64 knot winds (labeled 64KT in the advisory) taken from
the advisory at the time indicated for the row (on the entry screen, times are at the extreme left of the
row). If none leave blank.
Central Pressure (in millibars MB) - Enter the central pressure found on the advisory at the initial
(current time or time of issuance of advisory) This is sometimes given in both inches and millibars,
but enter the data label MB or millibars.....this will be a number somewhere in the range 900 to 1020.
70
Utilities
Storm File Options
Create New Storm Button - This button brings up a screen where you can enter the name of NEW
storm (one not in the files). Do not use this to enter a new advisory on an existing storm. Instead use
the Advisory Box.
Delete Advisory Button - If you wish to delete the currently shown advisory from the storm file shown,
use this option. Use with care...you can always just edit the information if some is bad.
Input Boxes - Edit Options
Clear Boxes - This option clears all of the data input boxes (not the date/time or filename/advisory
boxes)...To allow you to start with a clean slate. If you are entering a new advisory...the old advisory
data will still be in the input boxes. At that point you can either edit that data or use this option to
start anew. If you use this option you can restore the previous data by clicking on the Restore button.
(See below)
Restore Boxes - This button restores the data which was in the boxes before the last Clear or Fill In
Boxes option.
Fill Rest of Blank Boxes with Last - This option is handy for filling in boxes when there is little or no
change from the previous forecast valid time(s) on the advisory. The program fills in the boxes below
(later times) with information from the previous boxes , if the previous box had any values. From
there, you can edit in any changes needed to reflect the Forecast/Advisory data.
Other Items
Warnings - The Enter-Edit Warnings button brings up a screen where you can select areas of NHC or
CPHC watches and warnings for display with the active advisory in the program.
Advisory Text Decoder
This tool allows you to decode an ascii (text) file of the NHC or CPHC Forecast/Advisory into an .STM
file. Follow the instructions and specify where the forecast advisory and the NHC Wind Probabilities
files reside on your system and a data file will be created, or added to, as appropriate.
71
Hurrevac2010 Users Manual
Historical Scan
The Historical Scan is located under the UTILITIES heading of Hurrevac2010's Toolbox. Storm tracks
from the National Hurricane Center's historical database of Atlantic (1851-Current Year) and Eastern
North Pacific (1949-Current Year) tropical storms and hurricanes may be queried and displayed using
this utility.
Historical storm plots are more limited than the plots of HURREVAC's STM file because the historical
databases do not contain wind ranges information. Storms are simply plotted by 6-hourly center
locations and are color-coded at each position according to intensity. Storm name (when available),
beginning date, and strength category appear on a label near the starting point for each track in the
display.
If researching Atlantic basin storms from 1994 and later, it's recommended that you use the Historical
Scan for querying and quick track display and then switch to archived .STM files (under the yearly
index of the Archives tab) for further investigation.
Querying the Database
Storms must be selected from the database using the Historical Track Scan Setup form. Query options
include:
Target Area Dimensions - Limits search to those storm tracks passing through a geographic region
that you specify. Select a width and height in nautical miles or degrees, then click on the main map to
position a box of the desired dimensions. If you do not wish to limit your search geographically, then
check the All Areas box.
72
Utilities
Range of Years - Limits search to range of years specified. If you do not wish to limit your search to a
range of years, then check the All Years box.
Range of Months - Limits search to the range of months specified. If you do not wish to limit your
search to certain months, then check the All Months box.
Max SS Category Reached by Storm - Limits search to specific storm category . You may further refine
this search to accept only storms that reach a desired strength within the geographical region (In
Target Area) you have specified rather than (Anywhere) along their complete tracks.
Scan by Storm Name ONLY - Entering a name here will cause all other search criteria to be ignored.
Press the Execute Scan button once you have finished defining scan criteria. Storm tracks meeting
your criteria will be listed in the Results box. Individually un-check any tracks that you do not wish to
display, or press the Mark All or Clear All buttons to affect all items in the list.
Set Display Options and then press the Display Tracks button to plot selected tracks from the Results
list on the main map.
73
Hurrevac2010 Users Manual
NOTE: The historical database is maintained by the forecasters and researchers at the National
Hurricane Center and represents Best Track and intensity estimates of tropical cyclones as determined
in a post-analysis of all available data. Early storm tracks should not be regarded as having the same
degree of accuracy as recent ones. Please refer to documentation from the NHC for a discussion of
these limitations to the database.
74
Utilities
Map Defaults
Set Map Defaults is an option under the UTILITIES heading of Hurrevac2010's Toolbox.
Use this utility to set your preferences for a Default FULL SIZE Map and a Default LOCAL Map. Your
selections will be saved upon exit of the program. You can easily access these maps through left and
right clicks to the Globe button near the top of the Map Toolbar.
75
Hurrevac2010 Users Manual
Evacuation Options
Evacuation Options are available under the UTILITIES heading of Hurrevac2010's Toolbox.
The options you select on this screen are very important. They determine the number of evacuation
clearance hours to be used in calculating the time at which actions (if any) should be taken. This
affects all the Evacuation Timing Reports and the Decision Arc plots.
NOTE: HURREVAC cannot advise you on which scenario to select or whether to override certain
variable settings. These decisions should be made after studying your HES document and consulting
with local officials as to the best course of action. Coordination with surrounding counties and state
EM offices is recommended so that all users of the program are looking at reports based upon the
same parameters. If several different scenarios are under consideration, you can employ
Hurrevac2010's new tabbed interface to display multiple reports in the same session.
The locations/scenarios appearing in the list will vary depending on which State Plug-Ins you have
installed. Within the individual state plug-ins, only those counties/parishes that have undergone an
official HES are listed. Counties/parishes appear more than once in the list if multiple 'scenarios' are
provided by the HES. These scenarios account for varying evacuation patterns such as local versus
regional evacuations, heavy versus light traffic, and lane reversal options.
For each location/scenario combination, the Evacuation Settings panel presents just one value at a
time, based upon selections of the following variables from a matrix (or table) of available clearance
times:
76
Utilities
•
•
•
Storm Category (Saffir/Simpson scale) - 1 to 5
Occupancy - Low, Medium, High and Worst /Extreme
Response - Immediate, Rapid, Medium and Slow.
NOTE: HURREVAC's Evacuation Clearance Time Browser can be used to see the complete set of
matrices for a location.
Overriding Default Evacuation Settings
1. Category of Storm - The default setting is the maximum wind predicted at any one time over
the 120-hour forecast period, however if the maximum wind is within 5 knots of the next
Saffir/Simpson category, the category is bumped up one step as insurance. You may wish to
change this setting if, for example, your EM office has a policy of evacuating for one category
higher than forecast as added insurance. Conversely, New England locations considering the
threat from a Cat 4 or 5 storm still well south may want to drop the storm category because
the storm is forecast to be much less intense once over the cooler waters of the Northeast.
2. Tourist Occupancy - This option defaults to medium, but can be changed if necessary to a
setting relevant for your area. This setting tends to be time dependent and not area
dependent. For example, a late October weekday would often find all areas with low tourist
occupancies, but a Labor Day weekend would find most all areas with very high occupancies.
3. Response - This also defaults to medium when the screen appears for the first time, but should
be set to a coordinated setting relevant for your area. A nighttime evacuation would probably
evoke a Slow response, as would heavy rain ahead of the storm or weak media treatment of
the threat.
4. Optional Safety Buffer (SB) - The default setting is zero, but you can add up to 10 hours to the
evacuation clearance times as a safety buffer, or to allow for pre-evacuation duties or
preparation. Any amounts selected will be shown in the SB column and added to the total
clearance time period that is needed.
5. Apply Settings to the list - You must apply the settings to the list in order to make the new
calculations effective. In most cases, you will use the Apply To All button to make the
settings applicable to all areas. For some users with multi-state configurations, the Apply To
Selected may be appropriate. If you wish to apply the settings only to certain areas, you may
click and drag on the list, or hold down the CTRL button on your keyboard while clicking on
multiple areas. You must press the OK button on exit to make the settings active.
Refer to the topic Decision Time Alert for a description of this additional function of the Evacuation
Options.
77
Hurrevac2010 Users Manual
Decision Arc
The Decision Arc Tool is located under the UTILITIES heading of Hurrevac2010's Toolbox.
This tool provides a graphical means of showing your decision time for evacuation...essentially
duplicating the manual Decision Arc Method that was necessary before the advent of hurricane
tracking software programs. In this method, paper tracking maps were overlaid with a series of
concentric arcs radiating out from the location of interest. With each new forecast advisory , a
particular 'Decision Arc' would be selected by multiplying the evacuation clearance time by the forward
speed of the hurricane and the storm location would be plotted using a special transparent disk
representing the storm center and extent of 34kt winds. Decision time was indicated when the
storm's 34kt wind ring finally intersected the decision arc.
The Decision Arc Method has been largely replace by HURREVAC's Evacuation Timing Report (for a
single location), however many emergency managers who are familiar with the method still use this
tool in HURREVAC.
How HURREVAC computes a Decision Arc
1. The user selects a location and evacuation scenario from under 'Arc Setup' of the Decision Arc
UTILITIES heading. The program uses the evacuation clearance time from the available state
plug-ins and uses the settings (such as Occupancy, Response, Storm Category) set in the
Evacuation Options utility.
2. The program computes how long it would take 34 knot winds to reach the location of interest
assuming a direct hit, and uses this to sample the forecast forward speed of the storm for that
time period.
3. Using the forward speed and clearance time obtained above, a distance is obtained (speed x
time = distance). An arc with this radius is drawn around the location of interest. The exact
location of the center of the arc (if you zoom in close, you will see a white circle there) is the
nearest corner of the county to the present storm's initial position .
How to use the Decision Arc
Move the storm forward along its forecast track until the outermost ring (the 34knot winds)
touches the arc. For the facilities version of the program, the decision arc for flood-threatened
locations such as tunnels are eye-based instead.
78
Utilities
Note the time and date indicated in the Storm Information Box. This is your latest decision time for this
storm and this advisory. This does not mean that any action must be taken, (your decision may be to
do nothing).....but only means a decision should be made by this time or the evacuation (if any) could
be rushed. In general if you are in or near the Average Error Swath, you should be concerned and
consider the latest decision time as an important time landmark.
If the 34 knot ring is already within the Decision Arc....decision time has already passed. This can easily
happen "suddenly" with a new advisory if the new advisory a) increases the wind range, b) speeds up
the storm, or c) increases the storm category (max wind) resulting in a longer evacuation clearance
time and wider Decision Arc. Moral - don't count on the storm gradually creeping toward the Arc, in
one advisory the storm could jump toward the Arc, or the Arc could expand quickly toward the storm
(or both could occur).
In reality the forecast is constantly evolving and each new advisory is just a "snapshot" of a fluid,
changing atmosphere and its effect on the storm. It is rare indeed to have little or no change from
advisory to advisory.
Toggle Arc - Turns on or off the last defined Decision Arc.
Adjust Speed - This option should be used with care, in adjusting the assumed forward speed of the
storm. By default, the speed is assumed from the forecast using the speeds averaged from the hours
79
Hurrevac2010 Users Manual
before the arrival of 34 knot winds. Speeding up the storm will cause an earlier decision time and
slowing it down, will delay it. If you use this, it will only be in effect until you change locations or any
other item in Evacuation Option Settings at which time it will revert to the default forecast speeds.
80
Utilities
Export/Import
Export/Import Tools are located under the UTILITIES heading of Hurrevac2010's Toolbox. The Export
and Import Plot tools copy STM files in and out of the Hurrevac2010's data directories. Imported
storms are placed in a special ExerciseSTMFiles data directory and appear in the program under the
Exercise heading of the Archive Tab.
The GIS Export Tool generates shapefiles from HURREVAC's storm tracking display that can be loaded
into outside mapping programs.
What is a Shapefile?
Shapefile is a widely adopted vector data format for describing geospatial points, lines, and polygons
along with their associated tabular attribute data. ESRI developed the format with open specifications,
and therefore many Geographic Information System software programs have incorporated the ability
to read and write shapefile data.
The shapefile (with an “.shp” extension) stores geometry of either points, lines, or polygons. It must be
accompanied by two supporting files of the same name—an ”.shx” file containing an index to the
geometry, and a “.dbf” storing a database of attributes associated with the geometric shapes. A
number of other files having the same name but different extensions may also accompany the .shp
file. Most notable of these are the “.prj” file that stores the geographic coordinate system, or
projection, and the “.shp.xml” that stores metadata.
Hurrevac's GIS Export Tool creates .shp, .shx, .dbf, and .lyr files for each shapefile. The files are saved by
default in the \GIS subdirectory under your main Hurrevac data directory.
Available Layers
The number and types of fields available for export will vary based upon what is currently displayed
on the Storm Map. The following fields may be available and are described here.
1. A forecast track from the current advisory as points and lines Separate files are created for the
two shape types and are differentiated by “_p” and “_l” tacked on to the end of the filenames.
Nodes (in the line file) and points (in the points file) represent the 0,12, 24, 36, 48, 72, 96, and
120-hour forecasted positions for the current advisory. Points are attributed with a date/time
field and a maximum wind speed field.
2. A past track as points and lines Separate files are created for the two shape types and are
differentiated by “_p” and “_l” tacked on to the end of the filenames. Nodes (in the line file)
and points (in the points file) represent the initial positions of each advisory for the past track.
Points are attributed with a date/time field and a maximum wind speed field.
3. The wind ranges from any forecast hour (0-72) as polygons Up to three rings with values of 39,
58, and 74 mph may be output.
4. Wind swath through hour 72 of current advisory as polygons Up to three polygons with
values of 39, 58, and 74 mph may be output.
5. Error swath or error swath plus winds as polygons -- Up to three polygons with a single
attribute field indicating 72-hour average error (72), extended forecast average error (120),
and average error plus winds (0).
6. Error ellipse (with or without winds) from any forecast hour (0-120) as polygons One polygon
(attribute value of 72 or 120) for the error ellipse and a larger wind ellipse (attribute value of 0).
81
Hurrevac2010 Users Manual
7. MEOW (wind) for specified region and storm conditions as polygons Polygons are attributed
with 39, 58, 74, 92, 109, and 127 mph to indicate the maximum wind possible for the region.
8. HPC rainfall isopleths for specified day (1-3) as polygons Polygons have attribute values to
indicate a regions expected rainfall in 100th of inches.
9. NWS river flood outlook as polygons Polygons have attribute values to indicate whether the
likelihood of flooding in a region is possible (1), likely (2), or imminent or occurring (3).
Additional Notes
By default, the polygons overlay each other. In other words, with the 3 wind ranges surrounding a
hurricane the 64kt (74mph) wind ring will overlay the 50kt(58mph) wind polygon, which will in turn
overlay the 34kt(39mph) polygon. If the higher 2 wind polygons are then turned off in the GIS
program display, what will remain is a polygon representing winds >34kt (39mph). In other words,
you do not have "doughnuts" representing wind >34kt and <50kt. The wind swaths, error swaths, and
HPC rainfall isopleths also export in this manner.
For help in creating unique "doughnut" polygons, refer to the “GIS Issues” page of the support website
at www.hurrevac.com. Legend (.AVL) and layer (.LYR) files are also available on the web site to assist
you in illustrating exported shapes in Arcview 3.x and ArcGIS 8.x as they appear in HURREVAC.
Experience in GIS is recommended, as the manipulation of these exported files may not be easy for
the casual user of HURREVAC.
82
Utilities
Exercise Track Wizard
The Exercise Track Wizard is located under the UTILITIES heading of Hurrevac2010's Toolbox. This tool
leads you through steps necessary to create an STM file of your own for an exercise. STM files are
HURREVAC's native file format for storing all the forecast advisories from a single storm.
The Exercise Track Wizard leads you through a sequence of 5 steps. You can use the Previous Step
button to backtrack at any point, but keep in mind that any work you have done on later steps will be
overwritten.
1. Set begin location and time for storm
2. Set end location and time for storm. The correct number of 6-hourly advisories will be created
along a straight-line track when you complete this step.
3. Next, work with the initial location of each advisory, adjusting its location and storm category
(SS CAT) to suit. Pay close attention to the 'Implied Motion' and move advisory locations closer
together if speed seem unrealistically high. By default the Wizard escalates the storm's
intensity up to the final advisory. If your final advisory is well inland, be sure to drop the storm
category to a realistic intensity.
4. In this step, modify the forecast track of each advisory as desired. The wizard creates forecast
tracks that are very similar in intensity and speed to the later advisory positions. It positions
83
Hurrevac2010 Users Manual
the track slightly to the left.
5. Finally, name the storm. The filename will be saved as Xx_yyyy.stm (example XA_2002.stm
for Allison from 2002), so as to prevent an overwrite by real storms during the season. The
name inside the file however will be whatever name you gave it in the Name box and when
you load the Xx file the name you gave it will appear within the program as usual. Your storm
will be saved in a special ExerciseSTMFiles data directory and is accessible in the program
through the Exercise heading of the Archives Tab
NOTE: Standard wind ranges are assumed by the Track Wizard initially. You can make fine-tuning
adjustments to the wind ranges and add watch / warning locations by using Storm Data Entry... Manual
Edit utility.
84
Other Forms
Setup Form
Hurrevac2010's Setup Form is called from the 'Setup' button at top right of the Monitoring Ribbon.
Setup Tabs
•
•
•
•
•
•
State Plug-Ins
Connection Settings
Download Schedule
Local Defaults
Timeline
Time Zone
85
Hurrevac2010 Users Manual
State Plug-Ins
State Plug-In configuration is handled by Hurrevac2010's Setup Form.
Although Hurrevac2010 is designed to be generic and quickly usable by all areas to track hurricanes
and time arrival of various wind parameters, the program relies on certain plug-ins in order to produce
evacuation decision times, show inundation areas, show river gage maps, and do other specialized
duties for at-risk states.
When you select state plug-ins here, files are downloaded to your computer from HURREVAC's support
site and installed in appropriate folders under the program's installation directory. This form should
also be used to update plug-ins when you are notified of changes. It's important that you register for
the program and notify the HURREVAC support team of any change in e-mail address so that you can
be kept informed of program updates.
Hurricane Evacuation Study Times
FEMA / USACE Hurricane Evacuation Studies (HES) assist emergency management offices in
determining who should evacuate when a hurricane threatens and when they should leave. HES
clearance times (the time it takes to complete an evacuation of a vulnerable population) are needed in
Hurrevac's Evacuation Decision Timing operations.
86
Other Forms
HES data is generally only available for coastal counties of hurricane-prone states. If you don't find
your location in the list of available Counties/Parishes, it is because no study has been done. Check
with your state's hurricane planner for information on if/when that might change. This person will
also know the age of your HES data and when a restudy might be planned.
Once you have downloaded HES data for one or more counties, you can use HURREVAC's Evacuation
Clearance Time Browser to view the data within the program.
Inundation Maps
These are old raster-based, static maps of surge zones that have been ported from Hurrevac2000.
While the type of information on these maps is extremely useful, the crude resolution and age of
those available in HURREVAC severely limit their usefulness. Check with your county or state hurricane
planner for newer versions of these maps that are often distributed in GIS or PDF formats.
One you have downloaded an inundation map plug-in , use HURREVAC's Surge Map Browser under
the UTILITIES heading to view available maps.
NOAA River Gage Maps
Static (raster-based) maps are available for certain river gages within Hurrevac's River Gage Browser.
These maps consist of aerial photography showing the area around the gage that would be
inundated by a 100-year flood and by a 500-year flood.
87
Hurrevac2010 Users Manual
Connection Settings
Connection Settings are handled by Hurrevac2010's Setup Form.
HTTP Proxy Settings many be left blank under normal situations. However, if the program gives you a
message about not being able to connect to the internet site, then try to access
http://data.hurrevac.com using your web browser. If you are able to connect in the web browser but
not in Hurrevac2010, you may need to duplicate the proxy settings from the browser here. Contact
your network administrator if you have trouble finding these settings.
88
Other Forms
Download Schedule
A Download Schedule is configured in Hurrevac2010's Setup Form.
Hurrevac2010 will routinely poll for new storm advisories and other forecast data if you select
'Automatic Status Check' in the Download Schedule. When Hurrevac is left running on your desktop
in monitoring mode, a small status.txt file is downloaded from data.hurrevac.com at the interval you
have specified. If files described in the status.txt file are new or different that what already exists, the
program will download updates to your computer.
For more information about the program's download and monitoring functions, refer to the
'Monitoring Ribbon' topic.
89
Hurrevac2010 Users Manual
Local Defaults
Local Defaults selections are made in Hurrevac2010's Setup Form.
On this Setup tab, mark the counties/parishes of interest to you. Many of HURREVAC's reports contain
information on a large number of localities. Specifying a local area of interest will give you the ability
to limit the report size if desired.
90
Other Forms
Timeline
Timeline items are configured in Hurrevac2010's Setup Form.
The Timeline feature allows you to specify Standard Operating Procedure-type actions to be taken at
times relative to any of the following storm events:
•
•
•
•
•
arrival of the 34kt winds
arrival of the 50kt winds
arrival of the 64kt winds
time of eye's closest approach
evacuation decision time (available only if a county clearance time is installed)
Results will be available in the Wind Timing (single location) and Evacuation Timing (single location)
reports when the Timeline Option button on the report is toggled on.
91
Hurrevac2010 Users Manual
Time Zone
Time Zone is a tab on Hurrevac2010's Setup Form.
Under most conditions, you will not need to touch this setting because the time zone setting in
HURREVAC matches your computer clock. This option is here in case you are preparing a map or
report for a distant location and want to use the local time zone with out changing your computer's
setting.
92
Other Forms
Printing
Hurrevac2010's Print Options are accessed though a button on the Monitoring Ribbon.
HURREVAC's Print Options are used both for printing to a printer and for exporting maps and data
('Print to File')
Print Item
Report Text - If you have an active report or text advisory showing, HURREVAC assumes that you want
to print the report. If you want to print such a report you must generate it first and leave it showing
on the screen. Caution: Some of these lists (especially the Wind Decay affected list) can be quite long and
you may want to select lines first for printing (see below).
Storm Map - This item is set automatically if there is no report showing. This prints the map only,
including any annotations thereon.
Current Report Extent
Selected Lines - If you have selected lines in the report showing on screen, this option is set
automatically. You must select lines in the report (click and drag over the ones you want) in order to
use this option.
Entire List - If you have not selected lines in the current affected list showing on screen, then it is
assumed you want to print out the entire list.
Print Output
Printer - Sends the printout to the current printer.
93
Hurrevac2010 Users Manual
File - Sends the printout to a file of your choice with a default destination of 'My Documents.' Graphics
files can be saved in several different formats. Reports are saved as plain text files which may be
imported into a spreadsheet as 'space delimited' data.
94
Other Forms
Monitoring Ribbon
Hurrevac2010 features a ribbon across the top of the program interface that is primarily dedicated to
monitoring a live stream of storm tracking and other data coming from HURREVAC's Internet site.
Refer to the Download Schedule and Connection Settings for setup information.
Items on the ribbon are as follows (from left to right):
Setup - Access to Hurrevac's Setup Form
Update Now - Used to IMMEDIATELY check for and download any new data
Download Progress Bar - Blue bars in this window indicate that a download is in progress. Window
remains empty otherwise.
Status Report Window - If Auto-Monitoring is turned on, the status report window will alternately
show either the status of the last check for new data or the countdown to the next one. The window
will flash when new data has been downloaded and stop flashing once you have acknowledged the
alert by clicking on the program window.
Print Button - Access to Hurrevac's Printing options.
Collapse/Expand Buttons - To switch between Full-Program display and Ribbon-Only display
Analysis/Reports Button - To access the 'Analysis/Reports Selection' form
Log - To see a text log of recent monitoring and download activity.
Check - Signals that you have the latest version of Hurrevac2010 installed and changes to an
exclamation mark if a later version is available. You can click on the mark for details.
Help - To access Hurrevac2010's help system.
95
Hurrevac2010 Users Manual
Map Toolbar
The Map Toolbar consists of a set of a set of buttons and tools for map and storm plot
manipulation.
Items on the toolbar are as follows (from top to bottom):
Zoom Tool - Click-and-Drag zooming on the map.
Pan Tool - Click-and-Drag panning on the map.
Extent Button - Left-click to zoom to full-extent map, right-click to zoom to local map. See
UTILITIES...Map Defaults for configuration instructions.
Zoom IN and OUT Buttons - Left-click for 20% incremental zoom in or out, right-click for
40% zoom.
Move Storm AHEAD and BACK Buttons - Advance storm forward or back in forecast hour (1
hour with left-click, 6 hours with right-click).
NEXT and PREVIOUS Advisory Buttons - Advance storm forward or back in advisories (1
advisory with left-click, 3 advisories with right-click).
Wind Ranges Button - Action duplicates STORM FEATURES...Hourly Wind Ranges.
Forecast Wind Swath Button - Action duplicates STORM FEATURES...72-Hr Wind Swath.
Average Error Button - Action duplicates STORM FEATURES...Error Swath.
Storm Track Labels Button - Action duplicates ANNOTATION...Advisory Labels.
Watches/Warnings Button - Action duplicates STORM FEATURES...Watches/Warnings.
Wind Probabilities Button - Action duplicates STORM FEATURES...Wind Probabilities.
96
Other Forms
Decision Time Alert
During the tracking of an approaching storm, the Decision Time Alert
can be used to notify you of the first forecast advisory that puts the
storm within 12 hours of evacuation decision time for a select county
and evacuation scenario. Since the NHC , CPHC , and JTWC issue new
forecast advisories at 6-hour intervals, the alert is intended as advance
warning that an evacuation decision will need to be made based upon the next advisory or two.
NOTE: The appearance of the Alert does not automatically imply an evacuation is necessary, merely
that the time for an evacuation decision is nearing. See Evacuation Decision Timing for more
information on this topic.
Clicking on the Details of the Alert, you are then presented with the calculated Decision Time and the
actual number of hours remaining (Time Left to Decision).
A Decision Time Alert can be configured under the Evacuation Options UTILITIES within
Hurrevac2010's Toolbox. Only one location/scenario can be selected for this alert. If you are
responsible for multiple counties or are considering multiple scenarios, selecting the location/scenario
that has the longest lead times will ensure that you are alerted at the earliest possible time. The
location/scenario you select will be retained even upon exit of the program.
97
Hurrevac2010 Users Manual
Adjustments you make to evacuation options such as SS Category, Tourist Occupancy, and Response
will also be reflected in the Decision Time Alert, however they will not be retained upon exit of the
program.
98
Other Forms
SLOSH Display
SLOSH (Sea, Lake, and Overland Surge from Hurricanes) is a computer software model used by the
NHC to predict potential storm surge for a storm of specific barometric pressure, direction and speed
of approach, and wind field size. Geography of the local area (shape of the coastline, depth of the
ocean floor) are also critical inputs into the model.
SLOSH is generally accurate plus or minus 20% when given a known storm track. SLOSH output is
much less certain, however, when used on a hurricane forecast, especially if the storm is still more than
24 hours from landfall. For this reason, emergency managers are advised to focus on maximum surge
potential for a location, rather than the predicted surge for a specific storm scenario. These
maximums are summarized in SLOSH MEOWs (Maximum Envelope of Water) and MOMs (Maximum of
Maximums).
HURREVAC does not do actual SLOSH modeling. but rather ingests SLOSH model output from NHC
and superimposes the surge predictions on the Tide Gage Browser. There are two types of SLOSH
display modes available:
1. Normal mode for SLOSH REX surge forecasts
NORMAL mode is for live storms. It displays the usual tide plot PLUS any recent or archived SLOSH
REX (output) files received at hurrevac.com from the NHC. As a general rule, these will be available
only 24 hours before projected landfall of a storm and only for the general strike location of that
storm.
99
Hurrevac2010 Users Manual
When real-time SLOSH modeling is available for a gage, the location will be marked on the map with
an S. Click on the gage to display its tide chart, then click on the SLOSH button next to the NOAA logo
in the tide chart. The SLOSH-based storm tide guidance amounts will be displayed as red circles
above the tide table heights on the right side of the graph. The amounts are the result of tide table
heights plus the SLOSH surge guidance values. You can check the individual values at any point by
clicking on the graph at the hour of your choice. Underneath the graph, in the box labeled Residual, is
the specific SLOSH value, which is added to the Tide Table value to obtain the total Guidance storm
tide level amount. The box is labeled Guidance, rather than forecast, since the projection is based on
a specific landfall location which will be in error by some amount.
The <-Peak and Peak-> buttons at the bottom of the panel allow the user to adjust the arrival time
of the Peak Surge forward or backward 6 hours in time. The current setting of this adjustment is
displayed on the graph in parentheses( ) following the Peak surge adjustment explanation.
2. Exercise mode for hypothetical MEOW/MOM values
MEOW or MOM Exercise mode allows the user to choose, for exercise purposes, a Maximum Envelope
Of Water (MEOW) storm surge amount or a Maximum of Maximums (MOM) storm surge amount from
the drop-down lists shown for this particular tide gage.
The MEOWs refer to SLOSH surges grouped into categories of Saffir Simpson scale (1 to 5), Direction of
movement, and Speed of Movement.
The MOMs refer to the maximum surge amounts for each SS Category, regardless of Direction or
Speed.
100
Other Forms
Once a MOM or MEOW is selected, a set of bands are drawn on the right hand side of the graph,
indicating the storm tide amount that could be expected (plus or minus 20%) given the tide table
height for that hour, and the MEOW or MOM surge height. By clicking on the graph at a specific hour,
a red circle is drawn at the projected hypothetical storm tide height. Underneath the graph, in the box
labeled Residual, is the specific SLOSH value, which is added to the Tide Table value to obtain the
total Guidance storm tide level amount.
101
Special Tools
Supplementing HURREVAC's standard toolset are a few special tools that handle unique
circumstances and locally-tailored analysis for certain states. These special tools are included with
Hurrevac2010's main installation, but only appear in the program interface if the user has installed a
Hurricane Evacuation Study Times plug-in containing tool information.
Special tools currently available in Hurrevac2010 are as follows:
Risk Profile - A report that compiles custom threat assessment information for a state and its localities.
Risk Profiles are available for the following states:
•
•
•
Florida
Virginia (including northeastern North Carolina)
New York (including northeastern New Jersey)
Facilities Timing - Reports and special settings that handle complex HES clearance time calculations
for bridges, tunnels, and other transportation facilities in the New York City metropolitan area.
102
Special Tools
Risk Profiles
The Risk Profile is a special state-specific tool in HURREVAC which highlights information that is felt by
a state's emergency managers to be especially important to consider when under a tropical cyclone
threat. State-specific risk profiles are integrated into Hurrevac2010 but only appear in the program
interface if the user has installed a Hurricane Evacuation Study Times plug-in containing risk profile
information. The Hurricane Evacuation Study plug-ins for Florida, Virginia, and New York will activate
Risk Profiles for those respective states.
The Risk Profile is accessed through the Analysis/Reports Selection panel and the resulting report is
based upon whatever storm advisory is currently displayed in the Map View.
Only standard reports are listed under the REPORTS heading of Hurrevac2010's toolbox. To
access the Risk Profile, you must use the [ + ] tab to add a new report from the list below:
The initial display for the Risk Profile will be something similar to this example below from Virginia.
103
Hurrevac2010 Users Manual
How a Risk Profile Works
A Risk Profile is customized for an individual state using a series of criteria (questions) and conditions
(possible answers) identified by emergency managers in that state as most relevant. The Risk Profile
extracts the required information from the main HURREVAC program and presents it in a series of
tables.
For each criterion, a color coded box (red, yellow, or green) highlights the severity of the condition.
When certain criteria reach either a yellow or a red condition, they are flagged to give special notice to
their importance in the evacuation decision making process:
The Critical Indicator is a yellow triangle with an exclamation mark inside. This means that you
should carefully consider the condition of this criterion. It is an important indication of a threat and
is a critical one to consider.
The Indicator of Concern is a white circle with an exclamation mark inside. This means that the
condition of the criterion is important, but not quite at the critical level and should be monitored
closely.
104
Special Tools
The intention is to lead the emergency manager toward a decision in a logical manner that takes
advantage of the information that is available, but which may not be readily apparent to all but the
most experienced.
Risk Profile Components
The following controls are used to manipulate the Risk Profile report (in other words, change the type
of information displayed within the white box):
Geographic Scope Selection
This list box at top left of the Risk Profile is used to define a geographic scope for the report. Choices
are either for an overall (State Profile) perspective or for the (Local) perspective of a single jurisdiction.
Some states' Risk Profiles include a few neighboring counties in other states if their evacuation plans
are interrelated (i.e. Outer Banks counties of Dare and Currituck, North Carolina would evacuate
through the southeastern corner of Virginia).
Criteria are often worded differently depending on whether the scope is state-wide or local. For
example, a state-wide question about forecast peak winds is phrased "Forecast peak wind in Virginia
based on the 72-hr forecast track?" and answered "82 mph in Suffolk" while the county-specific
question is phrased "Forecast peak wind in your locality based on the 72-hr forecast track?" and
answered with a county-specific wind speed.
In a few cases, criteria may apply to one scope but not the other. For example, since interstate lane
reversal is a regional evacuation option, it is only addressed in criteria that appear under the State
Profile.
Topics
Criteria are organized and labeled according to topic. These topics are shown on sequentially-lettered
(A, B, C, D, etc) screens. The number and types of topics vary according to the custom design of each
state's Risk Profile and may include any number of the following:
Risk Area Definition - Criteria that lead the user to consider information that
is felt necessary to define the geographic region at risk and the change in risk
from recent advisories.
Storm Intensity and Evacuation Scenario - Criteria that lead the user
toward the correct Saffir-Simpson Category assumption for determining the
type and extent of evacuation, should one be needed.
Evacuation Characteristics - Criteria that lead the user toward determining
the proper evacuation decision time, based not only on the length of
clearance time needed, but on such things as the time of day at which
evacuation occurs.
105
Hurrevac2010 Users Manual
Storm Surge and Flooding - Criteria that lead the user to consider the potential for severe coastal
storm surge and/or inland flooding due to heavy rainfall.
Other Considerations - This topic includes other information which may affect your evacuation, such
as time of year, and whether other nearby regions are likely to be evacuating.
One-Way Concerns - This topic is usually available only when the state profile is selected. It considers
the problem of whether and when to reverse-lane certain evacuation routes in order to increase
capacity.
Summary
A summary screen can be generated of either the state profile or local county topics by clicking on the
Summary button. The summary provides a graphical overview of the Risk Profile Indicators for the last
12 advisories. Once the summary screen is displayed, subsequent clicks on the Summary button will
toggle between a view of 12 main and intermediate advisories (AllAdvy) and a view of main advisories
only (Main Advy).
Special Considerations
106
Special Tools
The Risk Profile is very much a "weight of the evidence" system, designed to light up red when the
user's region is threatened in a meaningful way. There are no hard and fast rules for using the system,
but over time, users will no doubt develop some rules of thumb, such as a low number of green boxes
on the Summary screen.
In looking for trends on the Summary screen, keep in mind that certain criteria, such as the One-Way
Concerns, are designed to function more as timing indicators for starting a lane reversal option. That
is, they move to red as the time for lane reversal setup is close and move back to green after the time
has passed and the strategy can no longer be considered. Thus, while the other indicators may go to
red and stay there as the storm approaches, the One-Way indicators on the State Summary screen will
normally light up red only for one or two advisories around the time of One-Way setup.
Resources
The Resources list box at the bottom left highlights additional information (both internal and external
to HURREVAC) that could be relevant to the local or state situation. Making a selection in this box and
then pressing GO will either launch a web page or open a Hurrevac2010 control.
Additional Tips
To print or export the report's data to a file, click the Print button on the Monitoring Ribbon at the top
of the program.
Use the Refresh button at bottom right to redo the report if you have a new storm or different
advisory loaded into the Map Display. The Refresh button can be useful in a live-storm situation in
which a new advisory is received by the system and you want to refresh the Risk Profile with the latest
forecast information. Alternately, you could use the Advy+ and Advy- buttons to run a Risk Profile for
a different advisory.
The Evac Options button allows you to view and change the default HES settings for a county or
counties. Changing these settings can have a major effect on the Risk Profile output and should only
be manipulated if you are very familiar with the underlying Hurricane Evacuation Study.
107
Hurrevac2010 Users Manual
Florida Risk Profile
This series of images shows an example of the Risk Profile for Florida from Hurricane Ida Advisory #21
(2009).
108
Special Tools
State and Local Topics
109
Hurrevac2010 Users Manual
110
Special Tools
111
Hurrevac2010 Users Manual
112
Special Tools
113
Hurrevac2010 Users Manual
114
Special Tools
115
Hurrevac2010 Users Manual
116
Special Tools
117
Hurrevac2010 Users Manual
State and Local Summaries
118
Special Tools
119
Hurrevac2010 Users Manual
Virginia Risk Profile
This series of images shows an example of the Risk Profile for Virginia from Tropical Storm Hanna
Advisory #34 (2008).
120
Special Tools
State and Local Topics
121
Hurrevac2010 Users Manual
122
Special Tools
123
Hurrevac2010 Users Manual
124
Special Tools
125
Hurrevac2010 Users Manual
126
Special Tools
127
Hurrevac2010 Users Manual
128
Special Tools
129
Hurrevac2010 Users Manual
State and Local Summaries
130
Special Tools
131
Hurrevac2010 Users Manual
New York Risk Profile
Last updated: 04-2011
This series of images shows an example of the Risk Profile for New York from Hurricane Earl Advisory
#30 (2010). New York-specific criteria and special considerations are discussed.
New York's Risk Profile assigns the indicator icons to specific criteria when their conditions reach red
or yellow status. Criteria designated as 'Critical' will have a
next to their description while criteria
designated as 'of Concern' will have a
next to their description below. Critical and of Concern
indicators are also referred to as Tier 1 and Tier 2 indicators, respectively.
132
Special Tools
State and Local Topics
Topic A - Risk of Impact
The overall purpose of the 'Risk of Impact' topic is to define the area at risk and quantify the degree of
risk to that area.
Examples of state and local output for this topic are shown here. The same 6 criteria are used in both
the state and local scopes. See below the screen shots for notes describing each criterion and its
specific purpose.
133
Hurrevac2010 Users Manual
Notes on the 'Risk of Impact' Criteria
1.
Is there a chance that the storm might pass directly over this area? Error cones and
hourly ellipses encompass the area in which the storm is most likely to track.
2.
Does the National Weather Service consider the threat significant enough for watches
and/or warnings? Watches and warnings are issued along the coastline when tropical storm
or hurricane conditions are possible within 48 hours.
What are the odds of this area experiencing hurricane-force winds? Wind probabilities at
point locations along the coast quantify the potential for hurricane winds within a 5-day
period.
4. Are the odds of hurricane-force winds increasing? Differences in wind probabilities from one
advisory to the next indicate increasing or decreasing risk. Probabilities from distant storms
are typically low due to the high degree of uncertainty and increase as the storm gets closer
and continues to threaten.
3.
5.
134
Could there be greater risk
due to the direction from which
the storm is approaching? As a
general rule, storms having a
more perpendicular angle of
approach to the Northeast
coastline carry greater risk than
Special Tools
those that curve along (and parallel) the East Coast. The reason for this is that a paralleling
storm is more likely to first make landfall elsewhere (therefore diminishing its intensity before
reaching the New York area).
6. How high are the winds estimated to get in this area? Focus on this criterion and its specific
wind forecasts only when a storm is close and threatening (48 hours or less). A storm's precise
track and intensity over a longer period has a high degree of uncertainty.
Topic B - Storm Intensity
The purpose of this topic is to give guidance on what intensity (storm category) the storm may have
when it impacts the area. Storm category is used for determining the type and extent of evacuation,
should one be needed. The higher the storm category, the greater the vulnerable population and
longer the evacuation time.
Screen shots of state and local output for this topic are shown here. The same 4 criteria apply to both
the state and local scopes. See below for notes describing each criterion and its specific purpose.
135
Hurrevac2010 Users Manual
Notes on the 'Storm Intensity' Criteria
1.
What is the storm category at the present time and position? Remember that this rating
indicates the storm's observed strength at its initial position in the forecast advisory. It may be
many hours before the storm is predicted to make landfall and by this time it may have
weakened. Storms typically decrease in intensity as they head north and encounter cooler
waters.
2.
What is the forecasted storm category at the time when the storm is closest? For reasons
described in Item #1, this may be a more appropriate assumption for New York's Evacuation
Options settings than the default choice of the maximum category over the entire forecast
period.
3. Is the storm intensifying? Central pressure is inversely proportional to storm intensity. A storm
observed to drop in pressure or maintain a low pressure over several approaching advisories is
cause for concern and may warrant selection of a higher storm category for New York's
Evacuation Options than the category forecasted at closest approach (Item #2).
4.
If the storm tracks over the area, how far inland could hurricane-force winds penetrate?
Wind decay modeling (MEOWs) can be helpful for inland counties weighing whether or not
they could be impacted by strong winds if the storm tracks over the area.
Topic C - Evacuation Considerations
136
Special Tools
Beyond the storm category assumption (Topic B), a number of other factors must be considered in
order to arrive at an Evacuation Decision Time.
Screen shots of state and local output for this topic are shown here. See below for notes describing
each criterion and its specific purpose. The first two criteria are shared by State and Local. Subsequent
criteria are grouped and described according to similarity rather than number.
137
Hurrevac2010 Users Manual
Notes on the 'Evacuation Considerations' Criteria
1. 1(State and Local) - How fast is the storm tracking toward the area? Storms typically pick up
forward speed as they move further north, meaning that a decision might need to be made on
a storm when it is still well to the south.
Are the tropical storm-force wind fields of the storm growing in size?
2. 2(State and Local) Storms often grow in dimension as they move further north, thereby decreasing the amount
of time remaining before tropical storm force winds are encountered. This and all subsequent
calculations within this topic are limited to a 72-hour period in which wind extents are
forecast.
3. 3(Local) What is the county's longest evacuation clearance time for a storm of this
category? Remember that by default HURREVAC will use the highest category predicted over
the forecast period to answer this criterion. This may or may not be the most appropriate
selection. For closer consideration, refer to notes for Items 1 - 3 under the 'Storm Intensity'
topic. The default selections can be adjusted as described in Evacuation Options.
Using the official forecast track (closest point of approach), are
4. 3(State)/4(Local) tropical storm-force winds forecast in the area and if so, when? In this calculation, the Hourly
Wind Ranges are advanced along the forecast track and a time is noted when tropical stormforce winds first enter the area.
138
Special Tools
If this county is within the 72-hour wind swath, how soon might a worst-case
5. 5(Local) evacuation need to be initiated? This is calculated by subtracting the answer from Item #3
from the answer from Item #4.
6. 5(State)/6(Local) - For counties within the error swath, how soon might a worst-case
evacuation need to be initiated? A worst-case direct hit is used in this calculation as described
in HURREVAC's methods for Evacuation Decision Timing. The clearance time used in this
calculation comes from Item #3.
7. 6(State) - Do extra hours need to be added to evacuation clearance times? A holiday period
or special event might warrant adjustments in tourist occupancy settings of Evacuation
Options. This is an important consideration when determining evacuation timing and public
messaging.
8. 7(Local) - Does the evacuation decision time need to be shifted to a more favorable time of
day? If Decision Time is calculated to occur during a time when the public is unlikely to
respond promptly, this may warrant an adjustment in the response settings and/or safety
buffer of Evacuation Options.
139
Hurrevac2010 Users Manual
Topic D - Storm Surge and Flooding
This topic considers threats posed by heavy rainfall and storm surge brought about by an approaching
storm.
Screen shots of state and local output for this topic are shown here. The same four criteria apply to
both the state and local scopes. See below for notes describing each criterion and its specific purpose.
140
Special Tools
Notes on the 'Storm Surge and Flooding' Criteria
1.
Could this storm generate a large amount of rainfall over the area? This calculation is
made using the HPC 3-day quantitative rainfall forecast. Note that this item cannot be
answered for archived storms since there is no rainfall forecast available for the historic period.
2. Is this a period of especially strong or weak tides? Spring tides are about 20% higher than
average high tides. Neap tides are about 20% less than average. A spring tide may exacerbate
surge flooding while a neap tide could mitigate.
3. Is the storm approach projected to coincide with high tide? Diurnal tide fluctuates as much as
5 feet in the New York area and can make a difference in the severity of storm surge water
levels. However, it is difficult to make a tide timing determination until a storm very close to
landfall since only 6 hours of time separate high and low tides.
4. Is this a large, powerful storm capable of generating large amounts of storm surge? Storms
with sizeable hurricane-force wind fields have the power to push greater amounts of storm
surge ahead of them.
141
Hurrevac2010 Users Manual
State and Local Summaries
For more information on summaries, see the description under the general Risk Profile section.
142
Special Tools
143
Hurrevac2010 Users Manual
Facilities Timing
Last updated: 04-2011
Facilities Timing refers to a special set of HURREVAC functions developed specifically to accommodate
Hurricane Evacuation Study (HES) clearance times for bridges, tunnels, and other transportation
facilities in the New York City metropolitan area. The facilities functions of Hurrevac2010 are only
active if the New York HES data has been installed within the State Plug-Ins Setup.
HURREVAC's report capabilities for facilities are similar to those for counties, but with some extra
features to handle the more complicated evacuation/closure scenarios required by facilities.
The entries that are part of this module were determined by the transportation agency to be the most
critical facilities or locations within their transportation network that are vulnerable to a hurricane.
Some entries represent multiple facilities or locations.
Discrete Action Periods
Instead of a single evacuation clearance time as in the case of counties, facilities have 3 time periods for
actions that need to be taken before arrival of the hazards. Individual times are dependent on a variety
of factors including agency ownership and type of facility. They are:
1. Mobilization Period - Amount of time needed to organize internal decision making and stage
equipment, vehicles, and personnel. Most agencies have designated only a brief mobilization
time of 1 to 2 hours, expecting this time to be executed quickly or even concurrently with
other emergency time phases. Exceptions are the transit agencies with concerns about
redirecting resources/transit cars and buses.
2. Evacuation Period - Time frame during which a facility will function to move evacuees.
Commuter transit facilities will function like they do in a heavy PM peak period; highway
facilities will carry evacuation traffic over time periods defined in the regional HES.
3. Closure Period - Amount of time needed to secure and close facilities and redirect employees
to safe shelter before hazards arrive.
A facility's clearance time is the sum total of the mobilization, evacuation, and closure times.
Wind versus Surge-Timed Facilities
In calculating the hazard arrival time for facilities, HURREVAC must differentiate between two types of
facilities:
Wind-Affected Facilities
These facilities are affected primarily by wind hazards, specifically 34 knot (39mph) winds of an
approaching storm, and treated much the same as county evacuation timing in HURREVAC. For tall
facilities such as bridges however, an offset (also known as pre-landfall hazard time) of 1, 2, or 3 hours
is placed in front of (ground) forecasted 34 knot wind arrival time to account for the fact that winds are
routinely stronger at these high altitudes and the storm effects will be felt sooner.
Therefore with wind-affected facilities, HURREVAC computes the direct hit arrival time of 34 knot
winds to the facility, and subtracts the combined times for mobilization, evacuation and closure to
arrive at a proper decision time.
144
Special Tools
Note: Certain facilities affected primarily by RAINFALL flooding are placed in the Wind-Affected
Facilities category because wind and rainfall will begin at about the same time.
Surge-Affected Facilities
These facilities are affected first by flooding, specifically flooding from storm surge as determined by
the National Weather Service SLOSH model, which predicts flooding that would occur assuming a
direct hit or worst case assumption.
The SLOSH model data results in an offset time, in hours, before the arrival of the eye, when flooding
would commence at the facility. This may range from 0 hours (flooding arrives only when eye arrives)
or as much as 7 hours before the eye for a severe storm approaching from a critical direction. This
offset is based on the location and elevation of the facility. In most cases, the flood-affected facilities
will have much later decision times than the wind-affected ones.
Therefore with surge-affected facilities, HURREVAC first computes the direct hit arrival time of the
storm's eye or center in the area, and subtracts the pre-landfall flooding time in hours as determined
by the SLOSH model for the worst case. After the surge arrival time is determined from the SLOSH
model offset, the program then subtracts the combined times for mobilization, evacuation and
closure to arrive at a proper decision time.
145
Hurrevac2010 Users Manual
Presentation of Facilities Data
The primary presentation of facilities data is within the Facilities Timing Details report which calculates
start times for mobilization, evacuation, and closure of each facility. This report contains special
filtering, data export, and other facilities-related options that are not available elsewhere in
HURREVAC.
You can also generate a standard Evacuation Timing...Single Location report on a facility. This report
consists of an hour-by-hour timeline of actions with the start of the mobilization, evacuation, and
closure periods noted. It also indicates daytime and nighttime along the timeline.
146
Special Tools
Facility Timing Details
Facility Timing Details is the main report of Hurrevac2010's special Facilities Timing toolset for the New
York City metropolitan area.
It is accessed through the Analysis/Reports Selection panel and the resulting report is based upon
whatever storm advisory is currently displayed in the Map View. Note: The NHC does not include wind
ranges information in the extended forecast from 72 to 120 hours. Therefore, the reporting period for this
tool is only from hour 0 (the hour the NHC forecast is issued) to hour 72.
Only standard reports are listed under the REPORTS heading of Hurrevac2010's toolbox. To
access Facility Timing Details, you must use the [ + ] tab to add a new report from the list below:
147
Hurrevac2010 Users Manual
The initial report calculates direct hit impacts for all 132 facilities in the HURREVAC Critical Facilities list:
•
•
•
•
•
•
•
148
Evac Type - identifies facility as either wind or surge vulnerable.
Mobilize (hrs) - Date/Time to start mobilization with the duration in parentheses. [Past]
indicates that the action should already be underway if needed.
Evac (hrs) -Date/Time to start an evacuation with the duration in parentheses. [Past] indicates
that the action should already be underway if needed.
Closure (hrs) -Date/Time to start closure with the duration in parentheses. [Past] indicates
that the action should already be underway if needed.
Hazards (hrs) - Beginning time for the wind or surge hazards. This calculation includes the
hazards offset (in parentheses) which is used to account for earlier winds (at high elevations)
or surge in advance of eye arrival.
Eye Arrives - Date/Time when the eye of the storm would pass over the facility assuming a
direct hit
Jurisdiction/Owner/Type - facility description details which can be used to sort or filter the
list. Clicking on any heading will cause the list to sort according to data in that column.
Special Tools
Filtering
The facilities list can be filtered by any or all of the following criteria: jurisdiction, owner, facility type,
and hazard type. The effect of this filtering is to pare down the long list of facilities to only those of
particular interest.
When the facility list is filtered, it is denoted in the “Filter” tab on the lower left screen by saying “Filter
(SOME)”. When the facility list is not filtered, it is denoted in the “Filter” tab by saying “Filter (ALL )”.
Facility Options
To view/change the underlying facility clearance time components, press the Set Facility Options
button. In the 'Mobilize time', 'Evacuate time', 'Closure time', and 'Total time' columns here, you see
the default number of hours required for each category of storm (CAT 1/2/3/4/5).
149
Hurrevac2010 Users Manual
Modifying Facility Times
To add or subtract hours from the default values, enter an offset number in the appropriate box (using
a minus sign before the number if subtracting) and press one of the two Apply buttons. The Apply to
ALL Facilities Below button makes the change to all facilities shown in the list, while the Apply to
Selected Facilities button makes the change to only those facilities highlighted. Click on a facility to
highlight it in blue and use the CTRL key to make a selection of multiple facilities.
If closed with the Save/Exit button, the underlying report will refresh with adjusted times. If closed
with the Cancel button, the time modifications from this Facility Options session will be discarded.
The Reset to Original button is used to return to default values, thereby discarding modifications
from all sessions.
150
Special Tools
In the screen shot above, times have been adjusted for NJ DOT facilities. The Filter button was first
used to limit the list of facilities here and on the main Facility Timing Report to NJ DOT facilities. Next, a
Mobilize Time Offset of 1 extra hour was added to all 7 facilities with the Apply to ALL Facilities
Below button. This change is reflected in the CAT 1/2/3/4/5 values and (+1) notations in both the
'Mobilize time' and 'Total time' columns.
In this next screen shot below, 2 hours have also been added to the closure time of surge-affected NJ
DOT facilities. The desired facilities were individually selected while holding down the CTRL key and
then Apply to Selected Facilities. The lone wind-affected facility retains a total offset of just 1
(Mobilize) hour, while the others now have a total offset of 3 hours (1 Mobilize, 2 Closure).
Such an adjustment might perhaps be temporarily warranted by a special condition on the ground,
but generally speaking the HES clearance times should be used as is...with greater consideration given
to the storm category selection. Note: Any adjustments made in the Facilities Options will be retained
during this program session. After the user exits the program, all adjustments will be lost.
151
Hurrevac2010 Users Manual
Storm Category Selection
Storm category is an important consideration in facility decision times. HURREVAC selects the default
storm category based on the highest winds predicted over the 72-hour forecast period; however if the
maximum wind is within 5 knots of the next Saffir/Simpson category, HURREVAC increases the default
selection by one storm category as insurance.
Tip: New York locations considering the threat from a Cat 4 or 5 storm still well south may want to
drop the storm category because the storm is forecast to be much less intense once over the cooler
waters of the Northeast. For example, after consulting with your local NWS office, you might opt to
select 'CAT 2 (user selected)' from the list below where 'CAT 4 (NHC forecast)' was the default for an
intense storm still sitting off the coast of Florida.
Press the Refresh button to update the facility report for this advisory. Note: New advisories will revert
back to the default selection since this is an important decision that must be re-evaluated with each new
forecast.
Additional Tips
To print the report's data to a file, click the Print button on the Monitoring Ribbon at the top of the
program. Special export options are available within the Facility Timing Detail's report interface. Click
the Export button and then specify your choice of file name and location. For file type, choose 'dbf' if
you want to work with the data in a spreadsheet. Choose 'shp' if you wish to have a shapefile and
attribute table exported for use in a GIS program.
Use the Refresh button at bottom right to redo the report if you have a new storm or different
advisory loaded into the Map Display. The Refresh button can be useful in a live-storm situation in
which a new advisory is received by the system and you want to refresh the Facility Timing Details
report with the latest forecast information. Alternately, you could use the Advy+ and Advy- buttons
to run a report for a different advisory.
152
Special Tools
Evacuation Timing for a Single Facility
Evacuation Timing for a Single Facility is another component of Hurrevac2010's special Facilities
Timing toolset for the New York City metropolitan area. It is a slightly modified version of the standard
Evacuation Timing...Single Location report that breaks down a county's evacuation and hazard timing
analysis hour by hour. Note: The NHC does not include wind ranges information in the extended forecast
from 72 to 120 hours. Therefore, the reporting period for this tool is only from hour 0 (the hour the NHC
forecast is issued) to hour 72.
When this report is produced for a facility, the 'Possible Action' column specifically indicates each
clearance hour as one of the three types (either mobilization, evacuation, or closure) and the hours
after TASK COMPLETE as the type of hazard indicated for that facility (either wind or storm surge).
Rows of the tabular report are colored according to activity:
•
•
•
gray if pre-decision or post-storm time
green if active clearance time
blue if within tropical storm force (34kt or 39mph)
153
Hurrevac2010 Users Manual
•
•
yellow if within 50kt or 58mph
red if within hurricane force (64kt or 74mph)
In the 'Day/Night' column, the hours in daylight and dark are noted respectively as yellow or blue.
154
Glossary
A
actual track: A line created from multiple advisories by connecting the storm center's initial position
at each old advisory. Also referred to as the 'past track.'
advisory: A collection of various forecast products issued by the tropical cyclone forecast center on a
single storm at a single point in time. Advisory packages are sequentially numbered and
typically issued at 6 hour intervals. Additional advisories (intermediate A and sometimes A and
B) are issued whenever watches or warnings are in effect.
AHPS: Advanced Hydrologic Prediction Service; a National Weather Service clearinghouse for various
water forecasts and flood warnings.
B
basins: Oceanographic regions used to describe the general locations of tropical systems.
Hurrevac2010 organizes tropical systems into the following basins: Atlantic, East Pacific,
Central Pacific, West Pacific and North Indian Ocean, and South Pacific and South Indian
Ocean.
basins (SLOSH): Local coastal regions delineated and mapped for storm surge modeling (SLOSH).
C
closest point of approach: This refers to the calculation by HURREVAC of the direction, distance, and
time at which the storm will pass closest by a specified county. CPA calculations are based
upon the official NHC forecast track. The parameters for your county are presumably near their
peak at the Closest Point of Approach.
CPHC: Central Pacific Hurricane Center. This National Weather Service office, located in Honolulu,
Hawaii, is responsible for tropical cyclone forecasts from 140 to 180 degrees West. It is the
source of Central Pacific advisory data in HURREVAC.
D
decision time: The last possible time at which a decision to evacuate or not can be made and still
allow sufficient time to complete the evacuation before tropical storm winds begin.
deterministic forecast: A forecast presenting a single 'best guess' estimate without any
representation of the likelihood of that outcome. The NHC's forecast advisory is deterministic.
direct hit: Scenario in which the storm center passes directly over the area specified. HURREVAC takes
a straight-line direct hit approach to evacuation decision timing. That is, from the time the
advisory is issued, the storm is assumed to head straight for your county using the forecast
speed from the NHC.
direct to point: see direct hit definition
155
Hurrevac2010 Users Manual
E
evacuation clearance time: The amount of time (number of hours) it takes to move a vulnerable
population to safety. Hurricane Evacuation Studies deternine these for an area based on
various storm parameters and local conditions.
F
FEMA: Federal Emergency Management Agency
forecast period: Length of forecast. Beginning at synoptic time, tropical cyclone tracks are forecasted
to 120 hours (5 days), while wind extents are forecasted only to 72 hours (3 days).
forecast track: A line created for a single advisory by connecting the storm center's initial position
with its 12, 24, 36. 48, 72, 96, and 120-hour forecast positions.
forward speed: Speed at which the storm center is moving along either its forecast or actual track.
fringe winds: Winds of 34kts (tropical storm strength) or greater surrounding the storm's core.
G
GIS: Geographic Information System; a class of software programs that manipulate, analyze, and
present map-based information. HURREVAC includes a GIS Export Tool for transferring storm
related information into GIS programs.
H
HES: Hurricane Evacuation Study; a program of FEMA and USACE to assist local emergency managers
in determining who should evacuate when a hurricane threatens and when they should leave.
HPC: Hydrometeorological Prediction Center; a National Weather Service office that prepares maps
and forecast guidance products related to precipitation.
hurricane: A tropical system with maximum sustained winds greater than 64 knots(74 mph). Term
used for systems occurring in the Atlantic, East Pacific, and Central Pacific basins.
I
initial position: Position of the storm center at the time of advisory issuance.
intensity: Synonomous with 'maximum sustained winds' or SS Category.
J
JTWC: Joint Typhoon Warning Center. This US Navy office, located on the Naval Base at Pearl Harbor in
Hawaii, is responsible for all tropical cyclone forecasts west of 180 degrees. It is the source of
West Pacific, South Pacific, and Indian Ocean advisory data in HURREVAC.
M
156
Glossary
MEOW (surge): Maximum Envelope of Water is a SLOSH model output describing the maximum
storm surge value produced by parallel tracks of storms with the same forward speed,
strength, and angle of approach.
MEOW (wind): Maximum Envelope of Winds is a wind decay model describing the maximum distance
certain categories of wind can penetrate inland given the storm strength and forward speed.
MOM: Maximum of Maximums is a SLOSH model output describing the maximum storm surge value
produced by storms of a single Safir Simpson category, taking into account all angles of
approach and forward speeds.
N
NHC: National Hurricane Center. This National Weather Service office, located in Miami, FL, is
responsible for tropical cyclone forecasts for the Atlantic and East Pacific (to 140 degrees
West). It is the source of Atlantic and East Pacific advisory data in HURREVAC.
NOAA: National Oceanic and Atmospheric Administration; parent organization to the National
Weather Service (NWS).
NWS: National Weather Service; the official US government agency for weather, hydrologic, and
climate forecasts.
P
past track: A line created from multiple advisories by connecting the storm center's initial position at
each old advisory. Also referred to as the 'actual track.'
probabilistic forecast: A forecast presenting the likelihood of various outcomes. The NHC's Wind
Probabilities is probabilistic.
S
SLOSH: Sea, Lake, and Overland Surge from Hurricanes; the official storm surge model of the National
Hurricane Center.
state plug-ins: State-specific data necessary for certain HURREVAC operations such as evacuation
decision timing. After initial program installation, plug-ins must be added using
Hurrevac2010's Setup Panel.
STM file: HURREVAC's native file format for storing all forecast advisory information from a single
storm.
storm category: Saffir-Simpson Hurricane Wind Scale, a 1 to 5 ranking of hurricane wind strength
where categories 3, 4, and 5 are considered 'major' hurricanes.
synoptic time: Time that data is collected. Weather data is collected around the world at 00 Zulu, 06
Zulu, 12 Zulu, and 18 Zulu. Zulu is also known as GMT or UTC time.
T
157
Hurrevac2010 Users Manual
tropical cyclone: Generic term for hurricanes and typhoons--tropical systems with maximum
sustained winds greater than 64 knots(74 mph). Indian Ocean and South Pacific basin systems
are typically referred to as topical cyclones.
tropical depression: A tropical system with maximum sustained winds of less than 34 knots(39 mph).
tropical storm: A tropical system with maximum sustained winds greater than 34 knots(39 mph) but
less than 64 knots(74 mph).
typhoon: A tropical system with maximum sustained winds greater than 64 knots(74 mph). Term
used for systems occurring in the West Pacific basin.
U
USACE: Abbreviation for US Army Corps of Engineers
W
warning: A hurricane or tropical storm warning means that those conditions could affect the area
within 24 hours.
watch: A hurricane or tropical storm watch means that those conditions could affect the area within
36 hours.
wind ranges: The extent of 34kt, 50kt, and 64kt winds surrounding the storm center. Advisories from
NHC, CPHC, and JTWC provide wind extents by quadrant (NE, SE, SW, NW) for the initial
position and 12, 24, 36, 48, and 72-hour forecast positions.
158