1
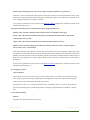
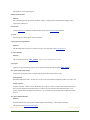
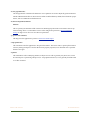
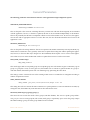
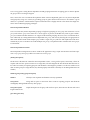
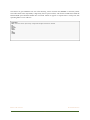
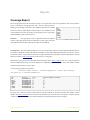
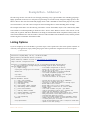
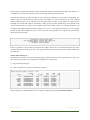
B
I
O
F
I
L
T
E
R
R e f e re nce M a nua l re v. 1.0.1
biofilter - Biological Knowledge Integration Utility
h t t p : / / c h g r. m c . v a n d e r b i l t . e d u / b i o f i l t e r
Table of Contents
Introduction!
1
Purpose of this manual!
1
Conventions Used!
1
Example commands!
1
biofilter sample.config --list-associations
1
Program Output!
1
Configuration details are listed first in bold- left aligned with the rest of the text.!
1
Common Parameters!
1
Integer!
2
Float!
2
Index!
2
max!
2
min!
2
On/Off!
2
filename!
2
label!
2
description!
2
Using the Biofilter Application!
3
Command-Line Arguments!
3
R i t c h i e L a b!
biofilter-Reference
2
biofilter config-file [--S (--sample-config)]!
3
-C (--coverage) filename!
3
-D (--detailed-coverage)!
3
-d (--disease-dependent) filename!
3
--filter-by-genes filename|ALL!
3
--inject-gene-information analysis-results filename integer integer filename|ALL!
4
-G (--list-groups) [criteria]!
4
-L (--list-models) filename!
4
--model-report filename!
5
--marker-info!
5
-q --quiet!
5
--report-gene-coverage filename!
5
-s (--snps) filename!
5
--snp-report!
5
-W (--write-models) float integer!
5
-m (--show-models) filename!
5
-P (--list-population-ids)!
6
-d (--disease-dependent) filename!
6
-p (--print-count-estimates)!
6
--strip-optimization!
6
--optimize!
6
General Parameters!
7
R i t c h i e L a b!
biofilter-Reference
3
The following parameters control the basic behavior of the application through configuration options.!
7
VARIATION_FILENAME filename!
7
VARIATION_FILENAME variations.bn
7
SETTINGS_DB filename!
7
SETTINGS_DB bio-settings.cn
7
MAX_GENE_COUNT integer!
7
MAX_GENE_COUNT 30
7
SNPS_SOURCE filename!
7
SNPS_SOURCE /projects/ritchie/biofilter/Affy6.0-v27.txt
7
INCLUDE_GROUPS group [group] [group] [...]!
7
INCLUDE_GROUP_FILE filename!
8
INCLUDE_GROUP_FILE ../group_list.txt
MODEL_FILENAME filename!
8
8
MDOEL_FILENAME affy50-models.bin
8
DISEASE_DEPENDENT string!
8
DISEEASE_DEPENDENT alz-bio-knowledge.txt
POPULATION string!
8
8
POPULATION NO-LD
8
MODEL_BUFFER_INIT integer!
8
MODEL_BUFFER_INIT 10000
8
MODEL_BUFFER_MAX integer!
8
MODEL_BUFFER_MAX 100000
8
MAX_GENE_COUNT integer!
9
MAX_GENE_COUNT 30
9
R i t c h i e L a b!
biofilter-Reference
4
PREFERRED_ALIAS filename!
9
PREFERRED_ALIAS my_favoriate_genes.txt
9
LOAD_ALL_ALIASES YES/NO!
9
LOAD_ALL_ALIASES NO
9
REPORT_PREFIX string!
9
REPORT_PREFIX data/bio-alz
9
IMPLICATION_IDX_DUPLICATE_WEIGHT float!
9
IMPLICATION_IDX_DUPLICATE_WEIGHT 0.25
9
HTML_REPORTS YES/NO!
9
HTML_REPORTS YES
DISEASE_DEPENDENT_LEVEL
9
ALL_MODELS/GROUP_LEVEL/DD_ONLY! 9
DISEASE_DEPENDENT_LEVEL DD_ONLY
9
COLLAPSE_ASSOCIATION_REPORT YES/NO!
COLLAPSE_ASSOCIATION_REPORT YES
10
10
BINARY_MODEL_ARCHIVE YES/NO!
10
BINARY_MODEL_ARCHIVE YES
10
ASSOCIATION_REPORT YES/NO!
10
ASSOCIATION_REPORT YES
10
Input File Formats!
11
Preferred Aliases!
11
SNPS_SOURCE!
11
Disease Dependent Genes!
11
Disease Dependent Definition!
12
Disease Dependent File Format!
12
R i t c h i e L a b!
biofilter-Reference
5
Model Production!
14
Overview!
14
Reports!
15
Coverage Report!
15
biofilter sample.config -s Illumina-660Quad.txt --report-gene-coverage
alz-genes.txt -C Illumina-660Quad.txt
15
Model Summary Report!
17
Assocations List!
18
biofilter sample.config --list-associations
18
Disease Dependent Contents Report!
19
SNP Report!
20
biofilter sample.config --snp-report
20
SNP-SNP Model Report!
21
Gene-Gene Models!
22
Genes Report!
23
SNP Cleanup Report!
24
Output Control (TBD)!
25
Example Run - Alzheimer’s!
26
Listing Options!
26
$ biofilter
26
Generating Sample Configuration!
27
$ biofilter --sample-config > sample.config
27
28
Target Platform!
Gene Aliases !
29
R i t c h i e L a b!
biofilter-Reference
6
biofilter sample.config -G alz
29
Report Prefix!
30
biofilter --list-associations
31
Population Selection and LD!
32
biofilter sample.config -P
32
Defining Disease Dependent Groups!
33
Model Generation!
34
biofilter sample.config -W 2.0 1000000
tutorial.gene-gene!
34
36
References!
38
R i t c h i e L a b!
biofilter-Reference
7
Introduction
Purpose of this manual
Contained within this manual are details for configuring and running the application, biofilter. If this is your first
time to use the software, we highly recommend that you take a few minutes to download and work through one or
more tutorials. Then, once familiar with the capabilities of the software, users can refer to this guide when making
changes to the basic configuration settings.
Conventions Used
There are two conventions used throughout this document. These text conventions are intended to help distinguish
examples from configuration parameters.
Example commands
biofilter sample.config --list-associations
The application itself will be named differently according to the platform it was compiled for. On Linux systems, it
will be biofilter or biofilter64 depending on whether it runs on 32bit or 64bit systems. Windows and OS X will have
be named slightly differently according to their platform as well.
Program Output
Program output will be in a gray box. Some lines will
often be removed when the output is lengthy.
Configuration details are listed first in bold- left aligned with the rest of the text.
The first word(s) are the keywords which specify what is being changed. Each keyword (or phrase) has some number
of parameters. These are listed in the order they should appear in the configuration line. In some cases, parameters
can be repeated or are optional. Those are denoted inside []s.
Configuration details are generally followed immediately by an example line:
!
This is an example
Examples show how an actual entry would look and are followed by some descriptive information to help the user
understand how the example would affect the biofilter application runtime.
Common Parameters
R i t c h i e L a b S o f t w a r e!
biofilter-Reference
1
There are a number of parameters which are used commonly across multiple configuration settings. In order to simplify the descriptions of the various properties of each command, we’ll describe those properties here, and just refer
to them as if they were a type.
Integer
Parameters specified in this way just simply refer to a whole number. In general, these values should be equal to or
greater than 0, except when specified otherwise.
Float
Values specified as float are decimal values.
Index
If a parameter is listed as an index, it refers to the index, starting at 1 the user wishes to select.
max
This is generally an integer value representing the upper bound of some value. In some cases, such as minor allele
frequency, it might represent a floating point value.
min
This is generally an integer value representing the lower bound of some value. In some cases, such as minor allele
frequency, it is possible that it represents a floating point value.
On/Off
These parameters accept a boolean, Yes/No type setting. Users can use ON/OFF or YES/NO to set them.
filename
When a configuration refers to a file for input or output, the filename is generally used. This can be either a fully
qualified path (such as /home/torstees/wga) or it can specified as a path relative to the directory where the application was run (such as ../data/goodfilename). It can also be just a plain filename as long as the file itself is available
from the directory in which the application was run.
label
A label refers to a parameter whose value can be any text string without whitespace. These labels are generally used
for reporting but in many cases are used to determine filenames. As a result, users should avoid using unusual characters in the string that could possibly cause problems with filenames. Because spaces and tabs are used to separate
each parameter on a given line, labels can not contain spaces.
description
A description is a chunk of text that can contain spaces. It will always be at the very end of a line and is generally
optional.
R i t c h i e L a b S o f t w a r e!
biofilter-Reference
2
Using the Biofilter Application
The biofilter stand alone application can be used for more than one purpose. As a result, execution may take more
than one set of parameters.
Many configuration parameters can be overridden on the command line. Those parameters are prepended with a
specially designated keyword which is prefixed by a “-” sign. These parameters might take more than one value. Below is a list of the parameters currently supported by the biofilter application. All parameters except the configuration file are optional.
Command-Line Arguments
biofilter config-file [--S (--sample-config)]
Config-file
Specifies the filename to be used to control genomeSIMLAs overall specific behavior. If the configuration is
available from within the current working directory, the filename alone is sufficient. If the filename exists in
another directory, a fully qualified or relative path should be provided along with the filename itself.
--sample-config (optional)
This parameter takes no arguments and causes the output of the biofilter to generate a basic configuration
based on the default settings (and any that have been overridden by other parameters) No other execution is
performed.
-C (--coverage) filename
filename
Adds a file to the coverage report list. Coverage files contain RS IDs for a platform used for a coverage report.
-D (--detailed-coverage)
Causes the coverage report to provide more detailed information.
-d (--disease-dependent) filename
filename
Adds a disease dependent group to the system. This is the same as adding a DISEASE_DEPENDENT line to
the configuration file.
--filter-by-genes filename|ALL
R i t c h i e L a b S o f t w a r e!
biofilter-Reference
3
filename File containing the genes to be used as a filter. Each gene should be on a separate line
Generates a comma separated file containing the chromosome in the first column and the RS ID in the second,
followed by each gene contained within that region in subsequent columns. Only SNPs that are found in one or
more of the genes in filename will appear in the file.
A new report is generated. It’s name is based on the REPORT_PREFIX configuration, with the last portion of the
filename being snp-report.csv.
--inject-gene-information analysis-results filename integer integer filename|ALL
filename - This is the file containing comma separated values for each SNP in the analysis
integer - This is the column in which the chromosome is found (this should start with 1). The chromosome should be 1-22, X, Y, MT
integer - This is the column in which the rsid is found (the index should start with 1).
filename - This is the file containing genes which are of interest. If the user wants to consider all genes,
she can choose “ALL” as the filename.
When the biofilter performs injection, it actually parses the specified CSV file and attempts to append any gene
information associated with each SNP in the file. The genes that will be identified will be chosen from the second
filename parameter, and will use the gene boundary extension conventions described elsewhere (either using LD
Spline for a given population, or using a predetermined constant extension up and downstream of the real gene
boundaries).
A new report is generated. It’s name is based on the REPORT_PREFIX configuration, with the last portion of the
filename being snp-analysis.csv.
-G (--list-groups) [criteria]!
criteria (optional)
This string can be used to search the group’s name and description. If a match is found, the Meta Group
name, group ID, group name and group description are displayed for each match. If this command appears
as the last flag on the command line, all groups will be listed.
This list does not refer to any setting other than the value at SETTINGS_DB. As a result, all groups that are
part of the SETTINGS_DB are considered regardless of restrictive group limitations set within the configuration.
-L (--list-models) filename
filename
The name of the model file from a previous run.
R i t c h i e L a b S o f t w a r e!
biofilter-Reference
4
This produces a basic model report.
--model-report filename
filename
File containing pairwise snp models. Each line contains a single pairwise model listed as integer values
separated by whitespace.
--marker-info
Produce haploview compatible marker-info files based on the SNPS_SOURCE platform.
-q --quiet
Turns off all non-vital output to stdout and stderr.
--report-gene-coverage filename
filename
This file holds the list of genes for which coverage is to be reported in the coverage report.
-s (--snps) filename
filename
This overloads the setting, SNPS_SOURCE, from the configuration file.
--snp-report
Produces a report containing all genes associated with each of the SNPs found in SNPS_SOURCE
-W (--write-models) float integer
Produces the gene-gene models, and optionally produces SNP-SNP models as well.
float (optional)
Minimum Implication Index - Set this value to the value of the minimum implication index you wish to use.
integer (optiona)
Number of models - Set this value to the number of models you wish to examine. This number takes precedence over the minimum implication index (i.e. if there are more models with implication index of 3 or
greater, and the minimum implication index is 2.0, you will still only get models with an implication index
of 3 or 4.
-m (--show-models) filename
filename
Filename indicates the name of the model file (file produced during --write-models command).
This produces the SNP-SNP Model report.
R i t c h i e L a b S o f t w a r e!
biofilter-Reference
5
-P (--list-population-ids)
Lists the populations available in the database in use. Populations are used to adjust the gene boundaries to
include additional SNPs that are observed to be within an LD threshold. By default, there should be 4 populations, with 3 to 6 different LD thresholds each.
-d (--disease-dependent) filename
filename
This is a specially formatted file which contains user defined group information associated to disease specific knowledge. This is a command-line version of the configuration parameter, Disease Dependent
Groups. A single run can have 0 or more disease specific files.
-p (--print-count-estimates)
This flag forces the application to produce a Gene-Gene model report.
--strip-optimization
This command causes the application to drop all of the Indexes. This can be done to speed up the insertions
necessary during LD imports. Once the data has been properly imported, users should be sure to optimize
the data once again.
--optimize
This adds indexes to the underlying database, if they don’t exist. This is generally only done once, but can
be removed prior to performing LD import (see --strip-optimization above). Users generally shouldn’t need
to use this command.
R i t c h i e L a b S o f t w a r e!
biofilter-Reference
6
General Parameters
The following parameters control the basic behavior of the application through configuration options.
VARIATION_FILENAME filename
VARIATION_FILENAME variations.bn
This sets the path to the source file containing the binary variation data. This file should originally be downloaded
with the application, however, as the data is updated, this file can be downloaded independently of the database.
There is the possibility that the file is incompatible with the version of the biofilter in use. In such cases, the application will exit with an appropriate measure. To resolve this issue, the user should download the latest version of the
application as well.
SETTINGS_DB filename
SETTINGS_DB bio-settings.cn
This sets the path to the settings database. This file is required for all biofilter functionality and will periodically updated with new information. Users generally will be able to update their settings file without updating the application, however, in the event that major changes have been identified, the file require a newer version of the application. In this event, users will be notified and will have to update their software to use the newest data.
MAX_GENE_COUNT integer
MAX_GENE_COUNT 30
This sets the upper limit for acceptable group size. Acceptable group size is the number of genes contained by a given
group. If a group has as many or fewer genes in it, the biofilter uses it’s contents to generate models. If a group exceeds this number, the biofilter queries each of it’s children groups, performing the same check.
This setting is used to constrain the size of the resulting model counts to a number that is manageable according to
modern computation resources.
SNPS_SOURCE filename
SNPS_SOURCE /projects/ritchie/biofilter/Affy6.0-v27.txt
This setting allows the user to limit the SNPs considered to a specific platform (or some user-defined set of SNPs). By
setting this value, the biofilter only loads SNP data for those found in the source.
INCLUDE_GROUPS group [group] [group] [...]
This allows the user to limit the search to those groups (and their children). This can be a specific group within a
meta-group or it can be a meta-group ID (such as DIP). Each group is separated by spaces and is the group’s unique
ID. When including a group, all of that groups children are also included.
R i t c h i e L a b S o f t w a r e!
biofilter-Reference
7
INCLUDE_GROUP_FILE filename
INCLUDE_GROUP_FILE ../group_list.txt
This functions identically to INCLUDE_GROUPS, however the source is a text file. This allows users to include a
very large number of specially selected groups (and their children).
MODEL_FILENAME filename
MDOEL_FILENAME affy50-models.bin
This sets the output filename for the binary model file.
DISEASE_DEPENDENT string
DISEEASE_DEPENDENT alz-bio-knowledge.txt
This instructs biofilter to load the knowledge associated with the file, alz-bio-knowledge.txt. A description of the format of these files can be found here.
POPULATION string
POPULATION NO-LD
Setting the population for a given run allows the user to tap into expanded region boundaries associated with a particular LD cutoff and a given population. biofilter comes with a set of populations based on LD data found in hapmap, but users can contribute their own data. The string used as the parameter is one of a set of values known to the
application. Users can query the application for a list of the valid settings by using the --list-populations flag.
MODEL_BUFFER_INIT integer
MODEL_BUFFER_INIT 10000
The model buffer is an internal data structure which is used to maintain the massive amount of models generated
without requiring huge amounts of RAM. This number is used to determine how large the buffer is at start. The
buffer object will always have at least MODEL_BUFFER_INIT models in memory at one time, and can grow as large
as MODEL_BUFFER_MAX + MODEL_BUFFER_INIT during the processing. For systems with 1 gigabyte of RAM or
less should use the default values.
Increasing the init size will simply reduce the number of disk reads, and thus speed up the processing at the cost of
increasing the actual memory foot print during processing. It is recommended that the init size be 1/4 the size of the
max or smaller.
MODEL_BUFFER_MAX integer
MODEL_BUFFER_MAX 100000
This number represents the size the buffer can get before triggering a disk write. Larger values will increase performance, and could reduce the number of disk reads by reducing the number of cycles required.
On 32bit Redhat intel systems, setting the MODEL_BUFFER_MAX to 20,000,000 allowed very fast processing of 500K
sources with a memory footprint of 2.5 Gigabytes. The same setting for a million SNP source took 30 minutes and
required 2.8 Gigabytes. Adding even more memory to the 64bit brought the run down to about 17 minutes
R i t c h i e L a b S o f t w a r e!
biofilter-Reference
8
(500,000,000 MAX_BUFFER). The same 1 million SNP source took over 2 hours at 4,000,000 but the footprint was
around 1 gigabyte.
MAX_GENE_COUNT integer
MAX_GENE_COUNT 30
During model production, the biofilter ignores groups that exceed this value. This is done to avoid generating too
many models (which defeats the purpose, to some extent).
PREFERRED_ALIAS filename
PREFERRED_ALIAS my_favoriate_genes.txt
The user specifies a list of gene aliases which they prefer. These aliases are used in place of the Ensembl ID in subsequent reports. See formatting details for help creating the file.
LOAD_ALL_ALIASES YES/NO
LOAD_ALL_ALIASES NO
Loads all region aliases (gene names) and generates a report report-prefix.aliases. This makes it easier for the user to
lookup the Ensembl IDs that are used by default in the reports.
REPORT_PREFIX string
REPORT_PREFIX data/bio-alz
When a report is produced that is sent to file instead of std-out, it will use the value of REPORT_PREFIX as the first
part of the file name. Acceptable options can be anything that is acceptable for the filesystem except for whitespace
(i.e. don’t use spaces or tabs).
IMPLICATION_IDX_DUPLICATE_WEIGHT float
IMPLICATION_IDX_DUPLICATE_WEIGHT 0.25
Disease dependent (DD) and disease independent (DI) groupings contribute differently toward the implication index.
For DD groupings, only those groupings which produce the gene-gene model are counted. Each one counts one
point. For DI groupings, we add a single point for each unique group where at least one gene is present. For each DI
grouping where both genes are present, the IMPLICATION_IDX_DUPLICATE_WEIGHT is added to the final score.
HTML_REPORTS YES/NO
HTML_REPORTS YES
When set to yes, most reports will be written in html format.
DISEASE_DEPENDENT_LEVEL
ALL_MODELS/GROUP_LEVEL/DD_ONLY
DISEASE_DEPENDENT_LEVEL DD_ONLY
Users can choose to filter models based on their association with disease dependent genes. When set to ALL_MODELS (default), all models will be produced. When set to GROUP_LEVEL, only groups where gene-gene models are
R i t c h i e L a b S o f t w a r e!
biofilter-Reference
9
produced that has one or more genes found in a disease dependent group will yield models. When set to DD_ONLY,
only the gene-gene models in which one of the genes is found in one of the disease dependent groups are produced.
COLLAPSE_ASSOCIATION_REPORT YES/NO
COLLAPSE_ASSOCIATION_REPORT YES
When set to yes, the associations shown reflect only the groups which could generate models. The report properly
respects the MAX_GENE_COUNT setting, but it does not obey the DISEASE_DEPENDENT_LEVEL setting (it shows
all groupings, despite their relationship with disease dependent groups).
BINARY_MODEL_ARCHIVE YES/NO
BINARY_MODEL_ARCHIVE YES
Setting this value to YES causes the gene-gene model archive and the snp-snp model archive to be written in binary
format. In most cases, this won’t be necessary, since both files will probably be reasonable in length. However, if either are expected to contain more than a few hundred thousand entries, it is recommended to use.
ASSOCIATION_REPORT YES/NO
ASSOCIATION_REPORT YES
When Yes, this causes the biofilter to produce an association report.
R i t c h i e L a b S o f t w a r e!
biofilter-Reference
10
Input File Formats
With very few exceptions, files are space delimited ascii files.
Preferred Aliases
This file provides one or more common gene names which can be substituted for Ensembl IDs in reports. Aliases
must be alphanumeric (no spaces) and must match an alias known to the biofilter. Known aliases are those that were
found in Ensembl’s external synonyms associated with EntrezGene & Uniprot (TrEMBL and Swiss-Prot). Currently,
only aliases which map back to a single Ensembl Gene ID are used.
This file is present only as a convenience for the user and is optional.
Example file:
NMT1
FURIN
NRD1
S100B
ATP2A2
SNPS_SOURCE
The SNP Source file contains all SNPs to be used in the analysis. Generally, this will match the SNPs from the platform to be used in the analysis. However, it is also possible to use a highly restricted set for other types of analysis
(such as identifying which genes a set of interesting SNPs might be found in.)
The format is very simple. List all RS IDs in their integer format. Each ID should be separated by whitespace.
10000169
10000185
10000201
1000022
10000226
1000025
10000255
10000266
Disease Dependent Genes
R i t c h i e L a b S o f t w a r e!
biofilter-Reference
11
Users can tag genes as being disease dependent and add grouping information. Assigning genes to disease dependent groups causes two things to happen:
First, it allows the user to increment the implication index of disease dependent genes for every disease dependent
meta-group they assign it to. Second, by providing groups of genes that have been known to be related to a given
disease, it is possible to add models that represent interactions that a highly relevant to the disease that might not
exist in more traditional grouping paradigms.
Disease Dependent Definition
Users can create many disease dependent groupings. A high level grouping (or meta-group) will contain one or more
group. Each of these groups will contain one or more regions. At present, the biofilter only looks at genes within a
group for constituent models and there is no support for hierarchical groupings. However, users can simulate the effects of hierarchy by creating different disease dependent meta-groups, and correctly choosing the one appropriate for
their needs. Models found inside multiple groups within a single meta-group will have their implication index incremented only by one. If a model occurs inside multiple meta-groups, it’s implication index will reflect each meta-group it
is found inside.
Disease Dependent File Format
Disease dependent configurations are done outside of the application using a simple text file format. Each file represents a super group (meta-group) which can contain one or more groups.
[Name] [Description]
The first line of the file must contain the disease dependent “name”, a string with no spaces, followed by a short description (this can have spaces but must fit on a single line). The total length of the line should be 4096 characters or
less. These are used by for reporting purposes and should be as meaningful as possible (i.e. if the user will have more
than one meta-group for a single disease, they should properly name them so that they can be distinguished from one
another.)
GROUP [group name] [group description]
GROUP!!
!
This keyword is required and should be correctly capitalized.
Group Name!
!
String with no spaces or tabs inside. This is used for reporting purposes and should be
meaningfully distinguishable from any other groups.
Group Description!
Simple description for the group. This can have spaces, but must fit on the line with a total
length of 4096 or less.
gene alias [gene alias]!
R i t c h i e L a b S o f t w a r e!
biofilter-Reference
12
Gene aliases are gene identifiers from one of the following sources: Uni-Prot IDs (TREMBL or SwissProt), Entrez
Gene. These aliases must only identify a single entity, have no spaces in them, and must be available from within the
Ensembl build upon which the biofilter data was based. Aliases can appear on separate lines or with spaces/tabs
separating them or a mix of the two.
ALZHEIMERS
GROUP alz-assoc Genes previously recognized through association studies
AGT
APH1A
APOA1BP
APOA2
CAMK1G
CFH
CHRNB2
CLCNKB
R i t c h i e L a b S o f t w a r e!
biofilter-Reference
13
Model Production
Overview
The Biofilter uses biological information about gene-gene relationships and gene-disease relationships to construct
multi-SNP models before conducting any statistical analysis. Rather than annotating the independent effect of each
SNP in a GWAS dataset, the Biofilter allows the explicit detection and modeling of interactions between a set of SNPs.
In this manner, the Biofilter process provides a tool to discover significant multi-SNP models with non-significant
main effects that have established biological plausibility. This approach has the added benefit of reducing both the
computational and statistical burden of exhaustively evaluating all possible multi-SNP models.
Model production is gene centric, and thus requires that any SNPs to be considered be mapped to genes. The gene
mapping takes place internally using local copies of current data sources such as Ensembl, HapMap and dbSNP. A
structured mapping is made based on relationships from one of the knowledge sources and this information is used
to identify candidates for snp-snp models.
The biological knowledge used by the Biofilter is derived from various sources which are identified as Meta Groups
as well as optional user defined groupings. Currently, the data-sources represented include: Gene Ontology, KEGG,
Net Path, pfam, Reactome and DIP. These sources are updated periodically, and made available as updates at the
biofilter website.
There are two distinct types of data sources. Disease-dependent sources are user defined and reflect gene-disease
associations. Disease independent sources represent key relationships between genes in important biological processes such as a metabolic pathway. (Bush 2009)
Users provide a set of SNPs that reflect the platform on which their analysis will be run. This can be a GWAS platform such as Illumina Human 1M-DUo BeadChip or one designed for the user’s specific study. Biofilter requires only
the rsNumber. It uses it’s own copy of SNP data to insure that positional information matches it’s internal representation for gene mapping. As a result, only those SNPs available in the Biofilter’s local copy will be considered.
R i t c h i e L a b S o f t w a r e!
biofilter-Reference
14
Reports
Coverage Report
The coverage report shows the amount of coverage a set of genes has on one or more platforms. The report requires 2
pieces of information: A single gene list, and 1 or more coverage lists. Depending on the settings chosen, the report might be plain text or in HTML
format. As with any other HTML formatted report, users should be aware
of the potential size of the report they are generating, since a huge report
will be difficult to open in most browsers.
Gene List: !
The gene list is a series of gene aliases listed on individ-
AGT
APH1A
APOA1BP
APOA2
CAMK1G
CFH
CHRNB2
CLCNKB
ual lines. These gene aliases must be UniProt IDs or entrez genes and must
Example Gene List
not be defined such that they represent more than one ensembl ID.
Coverage Files:! The user should provide one or more coverage files, which are just the individual RS IDs that can
be found on a platform of interest. By default, the biofilter comes with 4 different platform files, but the user can use
any list they wish, as long as the file contains only integer representation of the RS ids found on the platform. Any file
that can be used as a SNPS_SOURCE file can be used as a coverage file.
The baseline coverage is based on the SNPs found using the regular SNPS_SOURCE value (or -s). This is treated as
the total. Additional coverage sources are displayed as additional columns. Each entry shows the number of SNPs
covered by that platform for a given gene.
A coverage report might look as follows:
biofilter sample.config -s Illumina-660Quad.txt --report-gene-coverage
alz-genes.txt -C Illumina-660Quad.txt
Gene
AGT
APH1A
APOA1BP
APOA2
CAMK1G
CFH
CHRNB2
CLCNKB
Ensembl_id
ENSG00000135744
ENSG00000117362
ENSG00000163382
ENSG00000158874
ENSG00000008118
ENSG00000000971
ENSG00000160716
ENSG00000184908
Total
78
11
5
12
22
82
1
18
Illumina-660Quad.txt(593544)
78
11
5
12
22
82
1
18
The gene alias is shown in the first column, followed by the ensembl_id. The total represents the number of SNPs
found in the SNPS_SOURCE file and is followed by the SNP count for each of the coverage files. Using the option,
--detailed-coverage, lists all RS IDs associated with the genes (and their position for the text report.)
R i t c h i e L a b S o f t w a r e!
biofilter-Reference
15
Additional coverages can be added using additional -C filename options. Below is the same report in HTML format
using --detailed-coverage. Ensembl IDs and RS Numbers provide links to ensembl’s website for convenience.
R i t c h i e L a b S o f t w a r e!
biofilter-Reference
16
Model Summary Report
During model generation, a report is made containing all gene-gene pairs that were used to generate SNP-SNP models. This report contains SNP counts for each gene, the groups in common between the two genes and the number of
models produced by the pairing. By default, Genes are reported using their Ensembl Stable ID. However, users can
configure a Preferred Gene Alias file. Genes which appear in the preferred alias file will be reported according to the
preferred alias.
-------------------------------Gene-Gene Models-----------------------------------------------------------Gene
SNP
Gene
SNP
Impl.
Models
Groups
Name
Count
Name
Count
Index
Count
DI,DD
----------------------------------------------------------------------------------------------------------ABCG1
7
ACVR2B
7
2
49
1,485522
ABCG1
7
ABCB1
58
2
406
1,485522
ABCG1
7
CYP3A4
37
2
259
1,485522
ABCG1
7
SLC22A11
7
2
49
1,485522
ABCG1
7
SCUBE3
47
2
329
1,485522
ABCG1
7
ANXA9
6
3
42
1|2,485523
ABCG1
7
SULF1
3
2
21
1,485522
ABCG1
7
STX4
17
2
119
1,485522
ACVR2B
7
ABCB1
58
2
406
1,485522
ACVR2B
7
CYP3A4
37
1
259
1,
ACVR2B
7
SLC22A11
7
1
49
1,
ACVR2B
7
SCUBE3
47
1
329
1,
ACVR2B
7
ANXA9
6
2
42
1,485523
SULF1
3
ACVR2B
7
1
21
1,
STX4
17
ACVR2B
7
1
119
1,
ABCB1
58
CYP3A4
37
2
2146
1,485522
SLC22A11
7
ABCB1
58
2
406
1,485522
SCUBE3
47
ABCB1
58
2
2726
1,485522
(truncated)
R i t c h i e L a b S o f t w a r e!
biofilter-Reference
17
Assocations List
Suffixed by “associations.txt” or “associtions.html”, association reports provide the user with a hierarchical representation of groups in their search. Only groups that have been loaded using INCLUDE_GROUPS (or all, if no groups
were provided) will appear.
biofilter sample.config --list-associations
Associations (Gene Ontonology):
GO:0048154(1)
S100B ( rs2839357 rs2839362 )
GO:0048155(1)
ATP2A2 ( rs3026445 rs3026457 rs1860561 )
GO:0048156(1)
S100B ( rs2839357 rs2839362 )
GO:0042982(2)
GO:0042987(4)
ABCG1 ( rs4148083 rs4148084 rs4148085 rs9975740 rs4148087 rs1117640 rs4148088 rs4148089
rs4148090 ... )
PSEN1 ( rs214273 rs8006497 rs362350 rs214260 rs165933 rs362377 )
ENSG00000162736 ( rs10494342 rs16831846 rs12239946 rs6664438 rs6677637 )
ENSG00000143801 ( rs2073489 rs1295640 )
ENSG00000167755 ( rs1654537 )
(truncated)
Associations (KEGG):
KEGG-05010(127)
ENSG00000015475 ( rs181390 rs181396 rs181402 rs181405 rs9604787 rs181408 rs181417 rs5746474
rs5747351 rs9605401 rs738095 )
ATP2A2 ( rs3026445 rs3026457 rs1860561 )
PSEN1 ( rs214273 rs8006497 rs362350 rs214260 rs165933 rs362377 )
NCSTN ( rs10494342 rs16831846 rs12239946 rs6664438 rs6677637 )
PSEN2 ( rs2073489 rs1295640 )
BACE1 ( rs7083 rs522843 rs687740 rs473210 rs551662 rs676134 )
ENSG00000132906 ( rs6685648 rs2020902 rs4646018 rs2042370 rs1862710 rs4645989 rs1052571 )
NDUFV2 ( rs4148964 rs11081459 rs4148965 rs1039825 rs1472944 rs977581 rs874250 rs4148966 rs4148967
rs4148968 rs12966444 )
(truncated)
Associations (NetPath):
Associations (pfam):
Associations (Reactome):
Each relationship is nested with tabs on separate lines. In the example above, GO:0042987 has some child relationship
to GO:0042982. The numbers beside a group ID indicate the number of genes associated with the group.
An optional setting, COLLAPSE_ASSOCIATION_REPORT, can be set to true to collapse groups where models
would be generated. This allows the user to see more clearly which genes will be combined to produce models.
R i t c h i e L a b S o f t w a r e!
biofilter-Reference
18
Disease Dependent Contents Report
Suffixed with dd-contents, this report is produced when the user includes disease dependent information. This report
is provided to allow the user to verify that the genes being used are the same as the genes were intended.
Ensembl
Start
Stop
Snp
Alias
ID
ID Chrom
Pos.
Pos.
Count
------------------------------------------------------------------------------AGT
ENSG00000135744
98998
1
228777551
228945111
78
APH1A
ENSG00000117362
96653
1
148432473
148515725
11
APOA1BP
ENSG00000163382
97981
1
154820731
154863290
5
APOA2
ENSG00000158874
98229
1
159458707
159489274
12
CAMK1G
ENSG00000008118
98856
1
207793089
207874438
22
CFH
ENSG00000000971
98642
1
194718611
195171294
82
CHRNB2
ENSG00000160716
97575
1
152806881
152818975
1
CLCNKB
ENSG00000184908
78893
1
16240720
16272971
18
R i t c h i e L a b S o f t w a r e!
biofilter-Reference
19
SNP Report
SNP reports provide information about the genes for which they are associated. If the user has selected
LOAD_ALL_ALIASES YES in their configuration, a list of corresponding aliases will also be provided. This report is
available as plain text and HTML format. In the HTML format, the RS Numbers and gene IDs will appear as links to
the corresponding page at the ensembl website. As with any other HTML document, users should be aware of the
potential size of their report before choosing HTML due to potential memory problems.
biofilter sample.config --snp-report
R i t c h i e L a b S o f t w a r e!
biofilter-Reference
20
SNP-SNP Model Report
The SNP-SNP Report lists the details for each model from a previously generated model file. Details include:
• Left/Right SNPs that make up the model.
rs2072539 rs1990310
rs2072539 rs1805488
rs176590882 rs17701871
• The Group(s) in which the pair of Loci were found
• The Genes from which each of the SNPs were found.
When possible, each of elements reported will reflect the highest form of the name provided by the user. At the very
least, Ensembl IDs will be used. However, if the user specifies gene “Aliases”, those will be used preferentially over
the less familiar Ensembl ID.
The excerpt to the left
shows
an
example
of
what might be produced
by such a report. Each snp
is listed with it’s corresponding genes provided
with a link to ensembl.
The text report is similar except the SNPs are listed together as can be seen in the example below.
SNPS
Genes Groups
[ 2072539 1805488 ] GRIN2B KEGG-05010
[ 2072539 1990310 ] GRIN2B KEGG-05010
[ 176590882 17701871 ]
Genes
GRIN2B
ENSG00000139180
ENSG00000139180
R i t c h i e L a b S o f t w a r e!
Groups
KEGG-05010
KEGG-05010
KEGG-05010
biofilter-Reference
21
Gene-Gene Models
This isn’t a report, but a data product which can be passed to applications which have been linked to the biofilter
library and have support for gene-gene models. However, when the setting BINARY_MODEL_ARCHIVE is off, this
is written in plain text, allowing the user to see exactly what models their run produced.
The first line contains the number of models. Each subsequent line contains the 4 columns: Gene ID 1, Gene ID 2,
Implication Index, Disease Independent groups associated with the pairing. The Gene IDs are the numerical ID value
(this is the second column from the genes file). This file requires the .genes output file in order to be used to fully expand gene-gene models into snp-snp models.
The file is sorted by implication index, such that those models with the highest score will be first.
11925
54991
75847
75837
75837
64546
64546
64546
....
55016
91412
91412
75847
91412
75847
75837
4
4
4
4
4
4
4
1|2|4|9
1|2|4|9
1|2|4|9
1|2|4|9
1|2|4|9
1|2|4|9
1|2|4|9
R i t c h i e L a b S o f t w a r e!
biofilter-Reference
22
Genes Report
This is actually part of the gene-gene model output and is a text file which contains the information required to associate genes with their contents (SNPs) and their potential contributions toward implication index.
Each column is separated by a tab. For compound fields such as SNP lists and group IDs, constituent members are
separated by a “|” character. There are 5 Columns (not all will be filled): Alias, Gene ID, SNPs, Disease Independent
groups, Disease Dependent Groups.
TYMS
ENOSF1
YES1
TWSG1
RALBP1
PPP4R1
CHST9
OXA1L
SLC7A7
MRPL52
MMP14
44549
44559
44568
44857
44861
44868
45509
45871
45894
45927
45945
596909|3786362|11540152|11540153
2|4|9
596909|3786362|11540152|11540153
1|4
596909|3786362|11540152|11540153
1|2|4|9
3322|10898|12680|11559053|28552921|35867116
3322|10898|12680|11559053|28552921|35867116
3322|10898|12680|11559053|28552921|35867116
417808|418546|1155514|17694469|28693844 1|4
1061040|1805059|1805061|2281677|8016634|8018462
1061040|1805059|1805061|2281677|8016634|8018462
1805059|1805061|2281677|8016634|8018462 1
1061040|1805059|1805061|2281677|8016634|8018462
R i t c h i e L a b S o f t w a r e!
360684|360685
360685
4
1|2|4|9
1|4
1|2|4
1|4|9
1|2|4
biofilter-Reference
23
SNP Cleanup Report
After loading the SNPs from the SNPS_SOURCE file, the biofilter attempts to identify any RS IDs that have been
merged into previous RS IDs by dbSNP. Any RS IDs that have been merged will be replaced with the proper RS ID.
Those SNPs that have been identified as having been deleted by NCBI are removed. Each removal and renaming is
noted in the file, projectname.snp-cleanup.
This file is a tab separated file listing first the SNPs that were removed due to having been deleted at NCBI followed
by the mapping details for those that have been merged.
4 Expired SNPs Encountered:
45469397
rs45552437
rs45616434
rs45628831
504 rs IDs were updated
Original ID
New ID
rs41429248
rs2305130
rs41480744
rs17145687
rs12782608
rs9422653
rs41396045
rs36130286
rs41495349
rs16865746
rs4365706
rs4026962
rs11242845
rs9501985
rs41503946
rs11077998
rs4446752
rs2314691
(truncated)
R i t c h i e L a b S o f t w a r e!
biofilter-Reference
24
Output Control (TBD)
R i t c h i e L a b S o f t w a r e!
biofilter-Reference
25
Example Run - Alzheimer’s
The following tutorial will walk the user through performing many typical biofilter tasks including preparing a
highly specialized model set to use with plato for performing an association study using knowledge specific to Alzheimer’s disease. This search is intentionally highly selective and is intended for instructional purposes only. Under
most circumstances, users will want to incorporate more knowledge than we will be including in this example.
The examples listed below use the following command to execute the biofilter, biofilter. This command may differ
from machine to machine depending on hardware. This is done to allow different versions of the software to exist
side by side. In general, 32bit linux distributions will simply be called biofilter. When compiled for 64bit systems, the
name will be biofilter64. For OSX and windows, the name will be biofilter-OSX and biofilter-win32, with the possible
64 following the word biofilter when built for 64bit.
Listing Options
If you are completely new to the biofilter, a good first step is to take a quick look at the various options available. As
with many Unix application, simply running the program with no parameters will generate a basic list of options.
$ biofilter
biofilter 0.5.0 (600) Debug
Tue Sep
1 16:07:51 CDT 2009
Marylyn Ritchie, William Bush and Eric Torstenson
Please forward any comments or errors to [email protected]
usage: biofilter <configuration file>
biofilter is a standalone application for use in investigating possible SNP associations
in a set of data which, through biological knowledge, might be worth investigating
Optional Commands Include:
-S [--sample-config]
-- Print sample configuration to std-out
--report-gene-coverage gene-list-filename -- Reports the snp count for the genes in genelist
-- for the snps in snp-source
--marker-info
-- Reports each SNP and it's position/chromosome
-- in a format acceptable by haploview
--snp-report
-- For each SNP in the SNP Source, lists the genes
-- where that RS number is found
--list-associations
-- Lists the associations for each group
Optional Parameters Include:
-s [--snps] <snps filename>
-C [--coverage] <snps filename>
-D [--detailed-coverage]
-L [--list-models]
-W [--write-models] <model filename>
-m [--show-models] <model filename>
-p [--print-count-estimates
-l [--load-ld] <model filename>
-d [--disease-dependent] <filename>
-G [--list-groups] [criteria]
-P [--list-populations]
--optimize
--strip-optimization
-------------------
Override the snp source file ont he commandline
Add a file to coverage report list
(used with -C) adds extra details to coverage report
Writes model list to std-out
Writes model list to file (in binary format)
Writes contents of model file to screen in human
readable form
Lists count estimates for gene - gene models
Loads LD information from the file, filename, and
adjusts the gene boundaries accordingly
Adds a meta group containing data from the file, filename
Adds group search criteria and produces a list of
group IDs that match the criteria
Lists all available Population based LD boundary options
Updates internal structures to allow faster access. This
is usually done prior to release
Strips the optimization out (this is helpful to allow data
imports to run more quickly)
R i t c h i e L a b S o f t w a r e!
biofilter-Reference
26
Generating Sample Configuration
Users can use biofilter to generate a skeleton sample configuration. Most command line options will be incorporated.
Users should edit this configuration with appropriate settings. Filenames follow standard unix convention for location. This allows them to be expressed with full paths as well as paths relative to the directory in which the application is run (this includes just using the filename, if the file exists in the same directory as the application was run.)
Fields that have no default value will be commented out in the example configuration. In some cases, such as
SNPS_SOURCE, a value is required before certain types of execution can be made.
$ biofilter --sample-config > sample.config
# Variations data
VARIATION_FILENAME
variations.bn
# BioFilter data
SETTINGS_DB
bio-settings.cn
# Max number of genes before we ignore the group
MAX_GENE_COUNT
30
# The source file for the RS numbers in your dataset
#SNPS_SOURCE
# List the various groups (by group name) separated by spaces
#INCLUDE_GROUPS
# Set the filename for the output model list (none writes to std-out)
MODEL_FILENAME
NONE
# Set the initial size of the model buffer.
MODEL_BUFFER_INIT
10000
# Set the upper limit to the buffer. Bigger -> faster, but must remain within
# the limits of the hardware or could cause the application
# to fail or become so slow that it will never complete.
MODEL_BUFFER_MAX
100000
# Set the population ID to match the population your data is drawn from so that
# LD patterns can be used to expand the gene boundaries.
POPULATION
NO-LD
# Add one or more files containing disease dependent genes
#DISEASE_DEPENDENT
# User can specify aliases for genes (the alias must be present in the database
#PREFERRED_ALIAS
# Prefix used for all reports
#REPORT_PREFIX
# Loads all aliases and generates a text report containing their associations
LOAD_ALL_ALIASES
NO
sample.config
Many configuration options also have a command line override available. This is useful for performing tasks which
are repeated from time to time.
R i t c h i e L a b S o f t w a r e!
biofilter-Reference
27
General Reporting
Except when generating a sample configuration, a summary report is produced containing the configuration details
being used along with some details about the database in use.
------------------------- Dependency Versions ---------dbSNP: 36
Ensembl: 27
Hap Map LD: 53
-------------------- Configuration Parameters ---------DISEASE_DEPENDENT : alz.txt
INCLUDE_GROUPS : 53887,53892,53894,101057,101064,106734,160871
LOAD_ALL_ALIASES : NO
MAX_GENE_COUNT : 30
MODEL_BUFFER_INIT : 10000
MODEL_BUFFER_MAX : 100000
MODEL_FILENAME : NONE
POPULATION : CEU-DP0.80
PREFERRED_ALIAS : gene_aliases.txt
PROJECT : sample.config
REPORT_PREFIX : tutorial
SETTINGS_DB : bio-settings.cn
SNPS_SOURCE : Illumina-660Quad.txt
VARIATION_FILENAME : variations.bn
The first three lines describe the source versions used in the local database. These refer to the versions from which the
data was captured. The remaining lines represent the various configuration options in use.
For the purposes of our example, let’s make a few changes. The following represent some changes that we might
make:
Target Platform
Whenever we generate models, we need to tell the biofilter what SNPs exist on that platform.
Users can specify a platform using either configuration changes or on the command line. For this example, we’ll
make a single change to the configuration file.
Open the file and edit the line that contains SNPS_SOURCE. Remove the ‘#’ sign and add an appropriate filename
after the command. It should look something like the following:
# The source file for the RS numbers in your dataset
SNPS_SOURCE Illumina-660Quad.txt
R i t c h i e L a b S o f t w a r e!
biofilter-Reference
28
The file Illumina-660Quad.txt is just a list of RS Numbers (without the letters ‘RS’) in a simple ascii file that represent
each of the SNPs on our platform. In this case, the list was extracted from documentation on Illumina’s 660 Quad
platform. When specified as we have (along with no path information), the application assumes that the file is located
in the same directory as the application is run.
Gene Aliases
In general, the biofilter will supply the gene’s Ensembl ID for all gene names. This ID is
stable and has a single meaning. However, most users will prefer to see IDs listed in
more familiar terms. Providing a list of familiar aliases allows the application to use a
known synonym for the gene without it having to make any assumptions for the user.
NMT1
FURIN
NRD1
S100B
ATP2A2
ABCG1
PSEN1
For more information on the format of this file, please see the documentation on gene
aliases.
gene_aliases.txt
For the purposes of example, we’ll use a really small one with some genes we know will be in our report. This file is
called, gene_aliases.txt. To use these aliases, edit your configuration file and change the line containing PREFERRED_ALIAS. Remove the ‘#’ from the beginning of the line and add the filename to the end of the line. It should
look something like what you see below.
# User can specify aliases for genes (the alias must be present in the database
PREFERRED_ALIASgene_aliases.txt
Selective Search
The biofilter contains a large amount of information, much of which might be completely outside of the user’s interest. Users can select as much or as little as they want to use. We’ll be restricting the search to include only groups that
have Alzheimer’s listed in the comments. This is probably not a very good example, since it will only capture a tiny
amount of knowledge, but for the purposes of our example, it will do just fine.
Biofilter gives the user the ability to query it’s built-in group information. To get a list of groups that contain the letters ‘alz’ in the name or description field, type the following:
biofilter sample.config -G alz
Meta GroupGroup IDName
Description
Gene Ontonology
53887GO:0048154"Interacting selectively with S100 beta protein. S100 is a small calcium and
zinc binding protein produced in astrocytes that is implicated in Alzheimer's disease, Down Syndrome and
ALS." [GOC:jic]
Gene Ontonology53892GO:0048155"Interacting selectively with S100 alpha protein. S100 is a small calcium and
zinc binding protein produced in astrocytes that is implicated in Alzheimer's disease, Down Syndrome and
ALS." [GOC:jic]
Gene Ontonology53894GO:0048156"Interacting selectively with tau protein. tau is a microtubule-associated
protein, implicated in Alzheimer's disease, Down Syndrome and ALS." [GOC:jic]
Gene Ontonology101057GO:0042982"The chemical reactions and pathways involving amyloid precursor protein
(APP), the precursor of beta-amyloid, a glycoprotein associated with Alzheimer's disease." [GOC:go_curators]
Gene Ontonology101064GO:0042987"The chemical reactions and pathways resulting in the breakdown of amyloid
precursor protein (APP), the precursor of beta-amyloid, a glycoprotein associated with Alzheimer's disease."
[GOC:go_curators]
Gene Ontonology
106734GO:0050435"The chemical reactions and pathways involving beta-amyloid, a glycoprotein
associated with Alzheimer's disease, and its precursor, amyloid precursor protein (APP)." [GOC:ai]
KEGG
160871KEGG-05010Alzheimer's disease
R i t c h i e L a b S o f t w a r e!
biofilter-Reference
29
Users can perform more selective searches by adding additional -G keyword phrases to the command-line. The more
keywords you add, the more selective the search will be.
The second column contains the group IDs, which is what we need to update our configuration file so that it only
includes the groups we are interested in. Open the configuration file and change the line containing “INCLUDE_GROUPS” so that it looks similar to the text below:
# List the various groups (by group name) separated by spaces
INCLUDE_GROUPS 53887 53892 53894 101057 101064 106734 160871
Notice that groups are separated by spaces, not commas.
When users specify no groups, all groups are used. However, if one or more groups are added to this line, only those
groups and any that are hierarchically contained within them are used to generate models. Users can include an entire group by using the group ID associated with the top level group (such as the ID for GO.)
Report Prefix
One last detail is the report prefix. By default, any text output that doesn’t go to the command line will be named
after the configuration file. However, users can override this behavior by providing a Report Prefix. For our purposes,
we’ll simply change the reports to start with the word tutorial.
# Prefix used for all reports
REPORT_PREFIXtutorial
R i t c h i e L a b S o f t w a r e!
biofilter-Reference
30
Assocations List
Users can visualize the layout of the grouping information by generating the Association Report. This is a hierarchical view of the data associated with the requested groups, genes and SNPs that will make up the requested model
summary. The output of the associations list is written to a file, ending with “-associations.txt” or “associations.html”.
biofilter --list-associations
Associations (Gene Ontonology):
GO:0048154(1)
S100B ( rs2839357 rs2839362 )
GO:0048155(1)
ATP2A2 ( rs3026445 rs3026457 rs1860561 )
GO:0048156(1)
S100B ( rs2839357 rs2839362 )
GO:0042982(2)
GO:0042987(4)
ABCG1 ( rs4148083 rs4148084 rs4148085 rs9975740 rs4148087 rs1117640 rs4148088 rs4148089
rs4148090 ... )
PSEN1 ( rs214273 rs8006497 rs362350 rs214260 rs165933 rs362377 )
ENSG00000162736 ( rs10494342 rs16831846 rs12239946 rs6664438 rs6677637 )
ENSG00000143801 ( rs2073489 rs1295640 )
ENSG00000167755 ( rs1654537 )
(truncated)
Associations (KEGG):
KEGG-05010(127)
ENSG00000015475 ( rs181390 rs181396 rs181402 rs181405 rs9604787 rs181408 rs181417 rs5746474
rs5747351 rs9605401 rs738095 )
ATP2A2 ( rs3026445 rs3026457 rs1860561 )
PSEN1 ( rs214273 rs8006497 rs362350 rs214260 rs165933 rs362377 )
NCSTN ( rs10494342 rs16831846 rs12239946 rs6664438 rs6677637 )
PSEN2 ( rs2073489 rs1295640 )
BACE1 ( rs7083 rs522843 rs687740 rs473210 rs551662 rs676134 )
ENSG00000132906 ( rs6685648 rs2020902 rs4646018 rs2042370 rs1862710 rs4645989 rs1052571 )
NDUFV2 ( rs4148964 rs11081459 rs4148965 rs1039825 rs1472944 rs977581 rs874250 rs4148966 rs4148967
rs4148968 rs12966444 )
(truncated)
Associations (NetPath):
Associations (pfam):
Associations (Reactome):
Associations (DIP):
There is a lot there, even though we included only 7 groups. Many of the GO groups had one or more child groups,
and the KEGG group we added had a large number of genes associated with it (127 to be exact).
If we were to use all 127 genes to generate models, the resulting model count could be tremendous, depending on the
numbers of SNPs in each of those genes. If you look through the report as generated by the biofilter, you will see that
some have quite a few SNPs.
This problem brings up the value in one of the configuration options. In the configuration file, you will find a line
similar to the following:
# Max number of genes before we ignore the group
MAX_GENE_COUNT
30
R i t c h i e L a b S o f t w a r e!
biofilter-Reference
31
While the comment might suggest that we ignore the group, it’s a bit misleading. The application won’t actually create models with any group larger than 30. However, it will attempt to traverse any child groups and consider producing models with those (if they have 30 genes or less).
In the case of the KEGG group above, there are no child groups-so, that group will not yield any models with our
current setting. Should you want to ensure that the group is used, the variable above can be set high enough to catch
the group. Users should make these types of changes very carefully, though. Setting the threshold too high could result in massive delays. In order to maintain large lists, the bilfilter uses a file cache to keep up with the models as they
are generated. As this cache becomes really large, it can alter the runtimes dramatically.
Population Selection and LD
The database that holds group information also contains information about regions (genes). Users can select a population and an LD threshold to extend gene boundaries during model generation. This allows the system to potentially
capture SNPs that might carry a signal but are missing from the platform. This LD information is drawn from the
hapmap project.
To get a list of populations and their LD thresholds, use the --list-populations (-P).
biofilter sample.config -P
LabelComment
NO-LDNo LD
YRI-RS1.00YRI
YRI-RS0.80YRI
YRI-RS0.70YRI
YRI-DP1.00YRI
YRI-DP0.80YRI
YRI-DP0.70YRI
CEU-RS1.00CEU
CEU-RS0.80CEU
CEU-RS0.70CEU
CEU-DP1.00CEU
CEU-DP0.80CEU
CEU-DP0.70CEU
CHB-RS1.00CHB
CHB-RS0.80CHB
CHB-RS0.70CHB
CHB-DP1.00CHB
CHB-DP0.80CHB
CHB-DP0.70CHB
JPT-RS1.00JPT
JPT-RS0.80JPT
JPT-RS0.70JPT
JPT-DP1.00JPT
JPT-DP0.80JPT
JPT-DP0.70JPT
Population.
Population.
Population.
Population.
Population.
Population.
Population.
Population.
Population.
Population.
Population.
Population.
Population.
Population.
Population.
Population.
Population.
Population.
Population.
Population.
Population.
Population.
Population.
Population.
RSquared cutoff of 1.00
RSquared cutoff of 0.80
RSquared cutoff of 0.70
DPrime cutoff of 1.00
DPrime cutoff of 0.80
DPrime cutoff of 0.70
RSquared cutoff of 1.00
RSquared cutoff of 0.80
RSquared cutoff of 0.70
DPrime cutoff of 1.00
DPrime cutoff of 0.80
DPrime cutoff of 0.70
RSquared cutoff of 1.00
RSquared cutoff of 0.80
RSquared cutoff of 0.70
DPrime cutoff of 1.00
DPrime cutoff of 0.80
DPrime cutoff of 0.70
RSquared cutoff of 1.00
RSquared cutoff of 0.80
RSquared cutoff of 0.70
DPrime cutoff of 1.00
DPrime cutoff of 0.80
DPrime cutoff of 0.70
By default, the system uses NO-LD, which interprets a gene explicitly by it’s beginning and end base pair location.
The procedure used to extend the boundaries is called LD-Spline, a technique developed by the Ritchie Lab. The cutoff mentioned in the report above is the minimum LD statistic (R-Squared or D’) a pair can have to extend the region’s boundaries.
R i t c h i e L a b S o f t w a r e!
biofilter-Reference
32
Our study most closely matches the CEU population, so we’ll use one of those options. We’ll let the system be quite
liberal in the definition of a region’s boundaries, so we’ll choose the middle D’ option, 0.80. To indicate to the biofilter
that a particular population and LD threshold is to be used, the configuration file must be edited once again. Find the
line that starts with POPULATION and change NO-LD to CEU-DP0.80.
# Set the population ID to match the population your data is drawn from so that
# LD patterns can be used to expand the gene boundaries.
POPULATIONCEU-DP0.80
It is important to realize that the populations listed are the only ones available in the database that is in use. Users can
process their own LD using thresholds of their own choosing. However, that is beyond the scope of this tutorial.
Defining Disease Dependent Groups
When building a model list, users have the option of adding in their own knowledge into the system. This is done
through the use of Disease Dependent groups. A disease dependent group functions similarly to one of the larger
disease independent ones (such as KEGG and GO).
To create a small example disease dependent group, create a text file named alz.txt containing the following lines:
ALZHEIMERS
GROUP alz-assoc Genes previously recognized through association studies
AGT
APH1A
APOA1BP
APOA2
CAMK1G
CFH
CHRNB2
CLCNKB
The first line is the name of the meta group name and is used to identify the various groups associated with this disease dependent set. The next line defines an actual group. Each group definition must start with the keyword,
GROUP followed by it’s name and some descriptive commentary. Each group should have a unique name, since it
will be used in the reporting. As in all other cases, names must contain no spaces. However, the description can contain any character the user prefers, except for new line characters.
Following the group definition are the gene names. These should be common names, and must appear in the list of
known aliases. In general, those names should be recognized by EntrezGene or Uniprot and must identify a single
gene. Gene aliases should be separated by whitespace, however, they must start on the line after the group definition.
We could add more groups to this file using addition GROUP definitions, but this is sufficient for our needs.
Adding the disease dependent information to a run can be done using either a configuration file, or on the command
line. We’ll add it to the configuration file here. Open the configuration and add the new filename to the end of the line
starting with #DISEASE_DEPENDENT. Be sure to remove that ‘#’ as well, or else the line will be ignored.
# Add one or more files containing disease dependent genes
DISEASE_DEPENDENT alz.txt
R i t c h i e L a b S o f t w a r e!
biofilter-Reference
33
Model Generation
We are now ready to produce our model list. The most important step is the production of a gene-gene model list.
This is a complete listing of all gene-gene models that were defined based on the Disease Independent information in
our database, and the disease specific information provided by the user. This model list can be passed directly to
some programs (such as the application, athena) or it can be used to produce a selective list of snp-snp models. Both
of these files can be written as text or in a binary format. The gene-gene models are sorted by Implication Index such
that those with the highest score are at the beginning of the file.
To produce a gene-gene model file, simply pass the argument -W on the command line. This option can take 2 optional parameters: Minimum Implication Index and the Maximum SNP-SNP model count. These determine the number and quality of SNP-SNP models to be generated immediately upon completion of generating the Gene-Gene
model file. The user must provide both values or neither.
For our purposes, let’s produce up to One million models with the worst Implication Index of 2.0.
biofilter sample.config -W 2.0 1000000
Illumina-660Quad.txt : 592652 SNPs ......................... (593548 matches in our database )
Group Group ID
Group-Count
Gene-Count
----------------------------------------------------------------------------Gene Ontonology
1
6305
10673
KEGG
2
204
4640
NetPath
3
21
161
pfam
4
3904
16261
Reactome
9
4024
675
DIP
12
1310
1045
Disease Dependent (alz.txt ALZHEIMERS)
alz-assoc
176647
1
8
The first few lines just describe the state of our database with regard to the input we have provided. Out of our
593,548 SNPs, 592,652 were found in our local database. We also are provided a list of meta-groups and their various
counts and IDs. These “Group IDs” are useful when selectively using one or more meta-groups. The group and gene
counts represent the various children found.
Total Gene-Gene Model Count: 171802
Gene-Gene Model Summary (Snp-Snp Model Estimates)
Impl. Idx
Count
--------------------1
67410870
2
4812558
3
69458
4
653
Snp-Snp Model Generation Summary:
Impl.
Index
Count
--------------------2
930386
3
69363
4
653
R i t c h i e L a b S o f t w a r e!
biofilter-Reference
34
The next portion describes the estimated number of SNP-SNP models for each Implication Index. This number is an
overestimation, since it doesn’t take into account actual overlap between gene-gene models..
To describe the output of our snp-snp models, we get a summary describing how many models were produced. This
number is the exact number that was produced. If you do the math, you will see that there aren’t exactly 1,000,000
models produced. This has to do with the fact that gene-gene models produce varying numbers of snp-snp models,
including some models that might be produced by another gene-gene model. biofilter keeps the requested model
count in mind and tries to get close to the requested models. These models will have 0 overlapping members, and
will represent the highest Implication Index possible. In our case, we only represented 930,386 out of the 4,812,558
possible models with an implication index of 2.0. The ones that were generated were simply the ones produced by
the first N gene-gene models.
Alias Report:
Gene-Gene Model Summary:
Gene-Gene Models:
Snp Models:
tutorial-aliases.html
tutorial-model-summary.txt
tutorial.gene-gene
tutorial.snpsnp
Finally, we get the list of reports that were generated. According to the list above, we should find an Alias report (this
describes which genes were given an alias, a gene-gene model summary, the actual gene-gene model file and the snpsnp model file.
tutorial-model-summary.txt
This file lists the contents of our disease dependent groups. In this case, there is only one group. Since we only recognize a subset of gene names, we produce this list to help the user recognize that
A) We got the important genes,
B)
They correspond to the same gene that the user expected.
Adding new group (176647), alz-assoc - Genes
Ensembl
Start
Stop
Snp
Alias
ID
ID Chrom
Pos.
Pos.
Count
------------------------------------------------------------------------------AGT
ENSG00000135744
98998
1
228904897
228916564
8
APH1A
ENSG00000117362
96653
1
148502512
148508156
0
APOA1BP
ENSG00000163382
97981
1
154828178
154830715
0
APOA2
ENSG00000158874
98229
1
159458707
159460042
1
CAMK1G
ENSG00000008118
98856
1
207823668
207853906
12
CFH
ENSG00000000971
98642
1
194887764
194983255
16
CHRNB2
ENSG00000160716
97575
1
152806881
152818975
1
CLCNKB
ENSG00000184908
78893
1
16242834
16256390
7
The ID column (#3) is the internal ID that we use with the configuration parameter, INCLUDE_GROUPS.
R i t c h i e L a b S o f t w a r e!
biofilter-Reference
35
tutorial.gene-gene
146491
786099375641|4|9|12
800488012641|2|4|9
889669431541|2|4|9
791098951541|2|4|12
791098353041|2|4|12
868319825841|2|4|9
800918240841|2|4|12
783738037741|2|9|12
834768362941|4|9|12
883629336641|2|9|12
796329344932|4|9
854548734934|9|12
867989792131|4|9
(truncated)
This file lists all gene-gene pairings and the number of models that the pairing yielded. This is the actual model file
and might be unreadable (binary) depending on the value of the configuration property BINARY_MODEL_ARCHIVE is set to YES. The first line indicates the number of gene-gene models contained int the file. Subsequent lines
contain the gene-IDs, their Implication Index and the Disease Independent information associated with the pairing.
The file is sorted by Implication Index, then gene 1 then gene 2. No duplicate gene pairings should be found.
A more understandable report is the tutorial-model-summary.txt file:
----------------------------------Gene-Gene Models--------------------------------------------------------Gene
SNP
Gene
SNP
Impl.
ModelsGroups
Name
Count
Name
Count
Index
CountDI,DD
-----------------------------------------------------------------------------------------------------------PAFAH1B1
8
GLI2
31
1
2481,
PAFAH1B1
8
CHRNB2
1
2
81,176647
GLI2
31
CHRNB2
1
2
311,176647
GLI2
31
DRD2
18
1
5581,
NR0B1
1
DRD2
18
1
181,
NR0B1
1
GLI2
31
1
311,
TGFB3
6
TGFB2
22
1
1321,
ROCK1
10
EZR
10
1
1001,
ROCK1
10
ICAM1
5
1
501,
ROCK1
10
MSN
2
1
201,
ROCK1
10
VCAM1
22
1
2201,
ICAM1
5
EZR
10
1
501,
(truncated)
Both show the gene pairings and implication index and the components, even though the model file simply shows
the ID. This is used by the program performing the snp-snp model expansion. Users can estimate the count of snpsnp models to be produced by multiplying the two snp-counts for any given gene-gene model.
R i t c h i e L a b S o f t w a r e!
biofilter-Reference
36
Finally, there is the file, tutorial.snpsnp. This contains the actual snp-snp models of interest and may be binary for the
same reason as the gene-gene model file.
1004632
230
230
230
230
230
230
230
13490
13728
14210
14576
27152
27154
27827
2
2
2
2
2
2
2
(truncated)
The first line is simply the number of models found in the file. Each subsequent line lists two RS IDs (without the
letters, “R” and “S”) and the Implication Index. This file is sorted by rs-ID 1 and rs-ID2 respectively and should contain no duplicate rs pairings.
Another file can be found, called tutorial.genes. This file can be used by programs reading the gene-gene models and
describes the SNPs associated with a particular gene-gene model production.
R i t c h i e L a b S o f t w a r e!
biofilter-Reference
37
References
Bush WS, Dudek SM, Ritchie MD. Biofilter: A Knowledge-Integration System for The Multi-locus Analysis of
Genome-wide Association Studies. Pacific Symposium on Biocomputing. 2009:368–379
R i t c h i e L a b S o f t w a r e!
biofilter-Reference
38