1
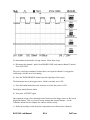
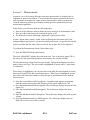
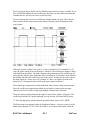
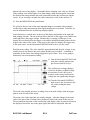
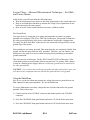
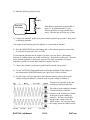
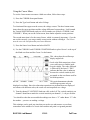
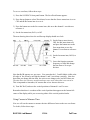
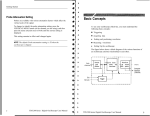
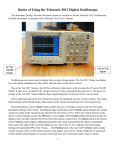
Beginners’ Guide to the TDS 210 and TDS 220 Oscilloscopes By David S. Lay P. Eng Foreword This guide contains information to help you become familiar with using digital oscilloscopes. You should work through these lessons if you have limited knowledge of oscilloscopes or if you have only a basic understanding of simple analog oscilloscopes. The lessons in this guide will help you in the following ways: • Quickly be able to use a digital oscilloscope • Avoid some of the traps that you may fall into • Avoid advanced functions that may get in the way of taking simple measurements To gain the most from this guide, you should use it while you work through each lesson with the TDS 210 or TDS 220 oscilloscope and a function generator. Credits Oscilloscope drawings are reproduced by kind permission of Tektronix Incorporated. The drawings in this guide are of the TDS 220 oscilloscope, which is functionally identical to the TDS 210 except that it has 100 MHz bandwidth, compared to the 60 MHz of the TDS 210. The screen shots were captured using Wintek32, a freeware product of Production Robots Ltd. Wintek32 can be found on the Tektronix web site (www.tek.com) as thsdump.zip. The next drawing shows the front of a TDS 220 oscilloscope. Copyright 2000 David S. Lay ELEC 290 Lab Manual E3-1 Fall Term Lesson 1 - Getting Started This lesson teaches you how to turn on the oscilloscope and display a simple signal. To perform the Getting Started lesson, follow these steps: 1. Plug in the oscilloscope and apply power by pressing the POWER button on the top of the case. Notice that when you apply power, the oscilloscope immediately performs a self-test. 2. Wait until the display shows that all self tests passed and press the SAVE/RECALL front-panel button (top left). The SAVE/REC menu displays on the right of the screen. The top right bezel button toggles between two menus: Setups and Waveforms. 3. Be sure that Setups is highlighted (in inverse video) and press the button beside “Recall Factory.” The oscilloscope recalls the default factory settings to initialize the instrument to a known state, which eliminates any nasty surprises. If at any time you do not understand what the oscilloscope is displaying, you can repeat this step. The box at the end of this lesson also gives some suggestions for getting out of odd screen modes without resetting everything. The display that dominates the left side of the scope is a digital LCD screen. This means that displayed signals have visible pixel “jaggies.” If you have used an analog scope, you will notice that the signals, especially sine waves, do not look as smooth and continuous on this screen. The digital display does, however, have some significant advantages, as you will discover. Some of the information around the edges of the display will be explained as we go along; the rest can be looked up in the Tektronix manuals. The large area down the right side of the screen is the menu. A large number of menus are available and are called up by pressing various buttons on the control panel. The buttons immediately to the right of the screen correspond to the menu items; their functions change depending on the menu displayed. Take a close look at the probes that are provided with the scope. These are important to the performance of the oscilloscope and should be handled with care. The sprung hook tip is removable, revealing a point that can be used in tight locations. The short wire that terminates in an alligator clip is the ground connection. If both probes are connected to the scope, disconnect one of them by turning the connector to the left and pulling it straight toward you. ELEC 290 Lab Manual E3-2 Fall Term Take a look at the connector and note that it is not quite like a regular BNC connector, on which the shell will rotate continuously. This connector only turns through a small arc and must be in the left, or unlocked, position, before being pushed onto the oscilloscope input. Do this now and turn the connector to the right to lock it. Now we will get a signal onto the display. Note that the first two BNC type connectors at the bottom edge of the front of the scope are labelled CH 1 (for channel 1) and CH 2. Usually you will connect the probes here, but you can also use a coaxial cable with a BNC connector to connect the scope to a function generator or other signal source. Immediately to the left of the inputs is a pair of small metal tabs labelled PROBE COMP for probe compensation. This is an internal source of a square wave at about 5 volts magnitude and 1KHz, used to adjust the internal compensation of the probe. 4. Connect the probe on channel 1 of the scope to the top tab, and the ground clip of the probe to the bottom tab. 5. Press the AUTOSET button near the top right corner on the front-panel. The oscilloscope sets the vertical, horizontal, and trigger controls automatically which usually results in a usable display. These settings are adequate in this and many other situations. Be aware that the oscilloscope also sets a number of background functions that might be not be desirable in some circumstances. Depending on how the oscilloscope was being used when it was last turned off, you may see one or more channels displayed. The trace labels on the left edge of the screen correspond to the channel numbers on the front of the oscilloscope. 6. If only one channel appears, press the CH 2 MENU front-panel button to display channel 2, and then press AUTOSET again. Now both channels display even though there is nothing but noise on channel two. The upper trace should show a steady square wave as depicted below. The wave is stationary on the screen because AUTOSET has set the oscilloscope’s trigger to channel 1 and the trigger circuit causes successive similar waveforms to be superimposed on the screen. For a complete discussion of trigger see the Tektronix manual. If the top and bottom of the square waves are not straight, your probe needs to be compensated, but you do not need to do it right now. ELEC 290 Lab Manual E3-3 Fall Term To demonstrate the downside of using Autoset, follow these steps: a) Disconnect the channel 1 probe from PROBE COMP, and connect channel 2 instead. Press AUTOSET. The wave is no longer stationary because there is no signal on channel 1 to trigger the oscilloscope, which is now free-running. b) Press the TRIGGER MENU button (near the right edge of the scope). The third menu item is the trigger source, which is currently set to CH1. c) Press the button beside this menu item once to switch the source to CH2. The display should become stable. d) Now press AUTOSET again. Once again the scope is free running because Autoset sets the trigger source to the lowest displayed channel. This is just one of many settings that Autoset changes – see the Tektronix manual for the complete list, and use Autoset wisely. e) Before proceeding, switch the probe compensation waveform back to channel 1. ELEC 290 Lab Manual E3-4 Fall Term Now let us get rid of the useless channel 2 display and expand the channel 1 presentation. 7. Press the CH 2 MENU front-panel button to remove the channel 2 waveform from the display. If that channel’s menu is not already displayed, the first push of the button displays the menu (the top right corner of the screen will say CH1 or CH2). A second push turns off the channel. Do this and you should see that the channel 2 trace disappears. Now look at the channel 1 control area. In addition to the CH 1 MENU front-panel button, there are two knobs. The top one controls the vertical position. 8. Turn the POSITION knob to bring the displayed waveform down to the middle of the screen. Note that as soon as you start turning the knob, a line of text appears in the bottom left corner of the screen. This is telling you how far the zero level of this channel is from the vertical center of the screen. There are several reasons why you might want the display exactly centred, and this helps you to do that. Once you have the trace centred you can expand it for a better view. The bottom knob of the channel, or vertical, controls is the volts per division range control. Turning the VOLTS/DIV knob to the right inc reases the sensitivity (decreases the volts per division, and expands the display vertically). One division is the distance between the grid lines on the screen, a bit less than one centimeter apart. Just to the right, on the other side of the channel 2 controls, is a similar knob labelled SEC/DIV that controls the time base resolution. Turning it to the right reduces the time per division and expands the display horizontally. Quick fixes for display problems. These relate to features that we will stud y later but may be just getting in your way right now. My display is very dark or has very low contrast. Press the DISPLAY button. The bottom two buttons at the right edge of the screen are now labelled “Contrast Increase” and “Contrast Decrease.” These actually lower and raise, respectively, the brightness of the white part of the screen. As soon as you press one of them the “contrast” level appears at the bottom right corner. Set it to 50%. There are a pair of extra vertical or horizontal lines cluttering up my display. Press the CURSOR button. The top button at the right of the screen is now labelled “Type” and will have either “Voltage” or “Time” below it. Press it until it says “Off”. There is an “A” and/or a “B” (with or without an associated trace) at the left edge of the screen. Press the SAVE/RECALL button. Use the third screen button to select “Ref A” or “Ref B” if necessary, then press the bottom button to turn it off. ELEC 290 Lab Manual E3-5 Fall Term Lesson 2 – Measurements In general, you will use an oscilloscope to measure characteristics of a signal, such as magnitude or period of oscillation. You can look at the signal in relation to the screen grid or graticule to estimate the values of these characteristics, which was about one could do with early oscilloscopes. Modern oscilloscopes have much more powerful measurement capabilities. In this lesson, you will learn about the following topics: • How to use the Measure menu to define the source and type of measurement to take • How to set the Probe menu item to match the probe in use • The difference between measuring a signal and a displayed waveform Lesson 2 begins where lesson 1 ended. If the oscilloscope has been turned off or the settings changed since lesson 1, you need to quickly redo lesson 1 to get back the centred square waveform that fills most of the screen with two or three full cycles displayed. To perform the Measurements lesson, follow these steps: 1) Press the MEASURE front-panel button. The word “MEASURE” appears above the menu area, Type is the active menu, CH1 is the source for four measurements and no measurements are selected (NONE). The Measure menu is a Page Selection type of menu. The top menu displays two menu names: Source and Type. The active menu is highlighted in inverse video - white letters in a black box. When Source is highlighted, you can press each of the other four bezel buttons to switch between CH1 and CH2 as the measurement source. When Type is highlighted, you can press each of the other four buttons to select the type of measurement to take from the selected source. 2) Press the second button until Freq appears. A question mark appears momentarily until the oscilloscope measures the frequency of the signal connected to CH1. 3) Press the third button until Period appears. The oscilloscope displays the period of the signal (1/f). 4) Press the fourth button until Mean appears. The oscilloscope displays the mean voltage. 5) Press the fifth button until Pk-Pk appears. The oscilloscope displays the peak-to-peak voltage. 6) Press the third button until Cyc RMS appears. The oscilloscope displays the true RMS value of one cycle of the waveform. ELEC 290 Lab Manual E3-6 Fall Term The Freq, Period, Mean, Pk-Pk, and Cyc RMS measurements are always available. If you have a TDS2MM module in your oscilloscope, then there are some other measurements available that we will not cover here, such as rise time. The next drawing shows how the oscilloscope display should now look. There may be some variation in the actual measurement values caused by subtle fluctuations in the source signal. If the peak-to-peak voltage is not close to 5 volts, in particular if it is around 0.5 or 50 volts, the probe setting of the oscilloscope is incorrect. The oscilloscope displays voltage values based on the probes. The probes improve the performance of the oscilloscope by increasing the effective input impedance from 1 Megohm to 10 Megohms, thus reducing the loading effect that the oscilloscope has on the circuit. In doing so, the probe reduces the input signal by a factor of ten. For example, if a three volt signal is present at the probe tip, 0.3 volts appears at the oscilloscope input channel connector. The oscilloscope compensates for this attenuation when it takes voltage measurements. Since the oscilloscope cannot detect which type of probe is connected to any input channel, you have to tell the oscilloscope through a channel menu selection. The most common probe attenuates the signal 10 times and is called a 10X probe. The oscilloscope includes 10X probes although you can also use 100X and 1000X probes. 7) Press the appropriate channel menu front-panel button, such as CH 1 MENU. The Probe menu item appears beside the fourth bezel button – successive presses of the button rotate through 1X, 10X, 100X and 1000X. As you press this button, watch the ELEC 290 Lab Manual E3-7 Fall Term bottom left corner of the display – the number that is changing is the volts per division. If the readings seem wildly high or low when taking voltage measurements, check that the Probe menu setting matches the probe connected between the oscilloscope and the circuit. If you are using a straight coax cable connection, set the Probe menu to 1X. 8) Press the MEASURE front-panel button. We will now discover one of the most important things to remember when using the oscilloscope to take measurements from signals displayed as waveforms. To do this, we need to understand how the oscilloscope displays signals. Notice that there is a small arrow at the top of the display and another at the right side, both pointing inwards. The one at the top shows the time of the trigger event, and the one at the right shows the trigger voltage. Because this is a storage oscilloscope, it can display the waveform before the trigger event, and the default horizontal position for the trigger is the centre of the screen. If the arrow at the top of the display, the trigger time, is not at the centre, use the Horizontal POSITION knob to move it to the centre. Read the mean voltage. The value should be approximately half the peak voltage; it may actually be a bit less because the peak voltage includes any overshoot – something to remember for the future when interpreting peak-to-peak values. Now we are going to deliberately cause an erroneous reading. 9) Turn the Ho rizontal SEC/DIV knob (time base control) until the time per division reads M 50.0 µs. The oscilloscope no longer displays values for frequency or RMS voltage because there is not a full cycle to measure on the screen, but the mean voltage has not significantly changed. 10) Turn the Horizontal POSITION knob to move the waveform to the left, while reading the mean voltage. The mean value steadily increases, reaching close to the peak voltage when the trigger point is at the left side of the screen. The mean value of the signal has not actually changed – what has changed is the mean value of the part of the waveform that is displayed, which is the point of this exercise. The measurement functions of this oscilloscope (and digital scopes in general) operate on the displayed waveform, not on the input signal, and must be interpreted with care. ELEC 290 Lab Manual E3-8 Fall Term Lesson Three – Advanced Measurement Techniques – the Math and Cursor Menus In this lesson, you will learn about the following topics: • Why the oscilloscope must connect to the same ground point as the circuit under test • How to use Math menu functions to measure the voltage of two signals that are not both connected to the same ground • How to use the Cursor menu functions to measure a Math waveform The Ground Point You must always be aware that your voltage measurements are relative to ground potential whe n using the TDS 210 or TDS 200 oscilloscopes. This ground is identical to the safety ground (third pin) of the power socket that the oscilloscope is plugged into. For safety, the shell of the BNC connectors are also connected to this ground, as are the ground clips of the probes. Most multimeters are battery powered. This means that they are completely isolated from ground, and that the meter leads are NOT grounded. Therefore, you can connect your multimeter to any point in a circuit without worrying about introducing an unwanted ground connection. This is not true for oscilloscopes. For the TDS 210 and TDS 220 oscilloscopes, if the circuit under test has a ground point (which it may not have if it operates from a battery or runs on a floating power supply), then the oscilloscope ground must be connected to the same ground point. CAUTION. If you connect the oscilloscope ground to any other point of the circuit, you will short out any components that are between this point and the circuit ground. Using the Math Menu How do we see the waveform and measure the voltage between two points that are not both connected to the ground potential? We use the Math menu. To use the Math menu to measure voltages that are not both connected to the ground potential, follow these steps: 1) Connect a probe to the CH1 BNC connector and another probe to the CH2 BNC connector. 2) Press the CH1 MENU front-panel button and select 10X for the Probe menu item. 3) Press the CH2 MENU front-panel button and select 10X for the Probe menu item. ELEC 290 Lab Manual E3-9 Fall Term 4) Build the following simple circuit: A 10 KΩ Function Generator B 20 KΩ C Most function generators are grounded, so point C is at ground potential. If your function generator is not grounded, don’t worry – the next step will take care of that 5) Connect the channel 1 probe tip to point A and its ground clip to point C; now point C is definitely grounded. The output of the function generator displays as a waveform on channel 1. 6) Press the MEASURE front-panel button and set the function generator to provide a six volt peak-to-peak sine wave at 1 KHz. If your function generator has an output level meter, you may notice a discrepancy between its reading and the one on the oscilloscope. Believe the oscilloscope – the meter on the function generator is likely only accurate if its load is matched to its output impedance (usually 50 or 600 ohms) and this is not the case here. 7) Connect the channel 2 probe tip to point B and its ground clip to point C. 8) Use the VOLTS/DIV front-panel knob to adjust the amplitude of the displayed waveform and the POSITION knob to get a good view of the waveform. 9) Use the Source and Type functions of the Measure menu to add a peak-to-peak voltage reading on channel 2; retain the peak-to-peak reading for channel 1. This shows an example of ho w the oscilloscope display might look. The peak-to-peak reading for channel 2 should be about (within the tolerance of the resistors) two-thirds of the peak-to-peak reading for channel 1. We have successfully measured the voltage across the 20KΩ resistor. Let’s try to measure the voltage across the 10KΩ resistor. ELEC 290 Lab Manual E3-10 Fall Term 10) Connect the channel 2 probe to point A and its ground clip to point B. What does the oscilloscope now read for the channel 2 voltage? It should be the same as channel 1 because we just shorted out the 20KΩ resistor. Fortunately, there is still a high resistance in the circuit – this sort of mistake could be dangerous if we were working with high voltages and low resistances. 11) To get a correct reading, re-connect the channel 2 probe to point B and its ground clip to point C. Channel 2 is once again measuring the voltage at point B. To measure the across the 10KΩ resistor, we must determine the difference between channel 1 and channel 2. 12) Use the VOLTS/DIV front-panel knobs to set channe l 1 to 1 volt per division and channel 2 to 500 mV per division. These numbers appear near the bottom left corner of the screen. 13) Use the POSITION front-panel knobs to adjust the vertical positions so that both waveforms are on the screen. You might have to reduce the function generator output slightly to fit the channel 2 waveform. 14) Press the MATH MENU front-panel button between two Vertical POSITION knobs. If your oscilloscope has a TDS2MM extension module (the FFT module) installed, the Math menu will be different. See the user manual that comes with the TDS2MM module for the changes to this procedure. 15) Press the top button, CH1 – CH2. The oscilloscope removes the two channel waveforms and displays a new Math waveform labelled “M” at the left of the screen. The Measure menu does not measure Math waveforms. However, you can take measurements from Math waveforms with cursors. This shows how the oscilloscope display might look. ELEC 290 Lab Manual E3-11 Fall Term Using the Cursor Menu To use the Cursor menu to measure a Math waveform, follow these steps: 1) Press the CURSOR front-panel button. 2) Press the Type bezel button and select Voltage. Two horizontal lines appear on the screen; the voltage cursors. The three bottom menu items show the cursor positions and the voltage difference between them. Look beneath the Vertical POSITION knobs, and you will see another set of labels: CURSOR 1 and CURSOR 2. When you use the Cursor menu, these knobs adjust the cursor positions. The second menu item is for the cursor Source, which is extremely important – if you do not set this correctly, you can get totally wrong results without realizing it. The Source must be set to the waveform that you want to measure. 3) Press the Source bezel button and select MATH. 4) Use the CURSOR 1 and CURSOR 2 POSITION knobs to place Cursor 1 to the top of the Math waveform and the Cursor 2 to the bottom. This shows how the oscilloscope display might look. Look at the Delta menu item, where you would expect to find the peakto-peak voltage. The value displayed is followed by the letter U. The U indicates that the value is unknown because the vertical sensitivity did not match on the waveforms used for the Math operation. This again demonstrates that the oscilloscope operates only on displayed waveforms. Since the subtraction operation was performed on two displayed waveforms with different scales, the result was not interpreted as a voltage. 5) Turn the channel 2 VOLTS/DIV knob one click to the left. The vertical sensitivity on channel 2 should now match the vertical sensitivity on channel 1, 1 volt per division. You should see that the cursor and delta readings now have a “V” rather than a “U” after the number – you now are reading a voltage. This technique can be used any time that you need to see and measure a waveform somewhere in the middle of a circuit where neither end point is at ground potential. ELEC 290 Lab Manual E3-12 Fall Term Lesson Four – Time Measurements and the Save/Recall Menu In this lesson, you will learn about the following topics: • How to save reference waveforms • How to use the Cursor menu to measure time For this lesson, we need two waveforms that are separated in time. The easiest way to do this is to use an RC (resistor-capacitor) circuit. If you have not yet studied the behaviour of capacitors, just treat this as magic for now. To setup the test circuit, follow these steps: 1) Build the following RC circuit. A 0.33 µF Function Generator B 20 KΩ C To do this, replace the 10 KΩ resistor in the previous circuit with a 0.33 µF capacitor (this exact value is not required – anything in the general range will do). 2) Set the function generator to output a sine wave at 50 Hz, with a magnitude of 6 volts peak-to-peak. 3) Connect the probe tip of channel 1 to point A, the probe tip of channel 2 to point B, and both ground clips to point C. The capacitor causes a phase shift between the voltage and current in the circuit (again, if the RC circuit theory is not familiar to you, don’t worry about it) so that the waveform at point A lags behind the waveform at point B, as you can see on the oscilloscope display. 4) Turn the Horizontal SEC/DIV knob to set the time base to 5 ms per division (read this at the centre bottom of the screen) and adjust the settings to get a display similar to the next drawing. Using the Save/Recall Menu The Save/Recall menu allows you to save all the control settings for the oscilloscope, which is also called the setup. Saving a setup is handy if you are doing a long experiment or repeated measurements, and want to quickly re-establish your configuration for your next session, especially if the oscilloscope has been used for something else in between. This menu also allows you to save two waveforms as references for use at a later time. ELEC 290 Lab Manual E3-13 Fall Term To save a waveform, follow these steps: 1) Press the SAVE/RCL front-panel button. The Save/Recall menu appears. 2) Press the top button to select Waveforms; be sure that the Source menu item is set to CH1 and the Ref menu item is set to A. 3) Press the button next to the Save menu item; this saves the channel 1 waveform as reference A. 4) Set the last menu item, Ref A, to Off. The next drawing shows how the oscilloscope display should now look. 5) Set the Source menu item to CH2, the Ref menu item to B, and press the button next to the Save menu item to save the channel 2 waveform as reference B. 6) Set the last menu item, Ref B, to On. 7) Lower the function generator frequency to 30Hz and change the time base to 10 ms per division. Note that Ref B appears as a grey trace. You can make the 1, 2 and B labels visible at the left edge of the screen by moving the channel 1 and 2 waveforms vertically. Note also that when you change the time base, the active traces change scale, but Ref B does not. The time base of a reference waveform always stays at the value that it was saved at. This is important to remember, for reasons that we are about to discover. 8) Turn Ref B off, and reset the vertical positions of channels 1 and 2 to zero. Remember that there is a readout of the vertical position that appears at the bottom left corner of the display while you are moving either of the vertical position knobs. Using Cursors to Measure Time Now we will use the cursors to measure the time difference between the two waveforms. To do this, follow these steps: ELEC 290 Lab Manual E3-14 Fall Term 1) Press the CURSOR front-panel button. 2) Press the Type bezel button and select Time. Two vertical lines appear on the screen; the time cursors. 5) Turn the Horizontal SEC/DIV knob to set the time base to 2.5 ms per division – stretching out the waveform allows a more accurate time measurement. 6) Use the CURSOR 1 and CURSOR 2 Position knobs to place Cursor 1 on the point where the channel 2 waveform (the one on the left – change the VOLTS/DIV temporarily if you want to confirm this) crosses the zero line going upwards and Cursor 2 where the channel 1 waveform passes upwards through zero. The Delta now shows the time difference between the zero-crossing points, which is the amount of time that channel 1 lags behind channel 2. The drawing to the left shows how the oscilloscope display might look. The Source for this measurement may be set to CH1 or CH2 since both channels are always on the same time base. However, set the Source to Ref A and watch what happens to the Delta number. It’s about twice the previous reading because the reference waveforms were saved with the time base set to 5 milliseconds per division, and now it is set to 2.5 ms/div. The cursor reading is correct for a measurement on reference signals A or B, but not on channels 1 or 2, even though neither Ref A nor Ref B are displayed. Whenever you use cursors, you must always ensure that the Source setting matches the waveform that you are measuring. Using the Display Menu To understand various functions of the Display menu, follow these steps: 1) Press the DISPLAY front-panel button. The top menu item is Type, which switches between dots and vectors, and with this particular set of waveforms yo u will not see a noticeable difference. When displaying ELEC 290 Lab Manual E3-15 Fall Term square waves or other waveforms that have rapid vertical excursions, the vectors setting draws in the vertical lines to make the waveform easier to recognize. 2) Press the Format bezel button and select XY. You should see an ellipse on the screen – we are now displaying channel 1 as the X axis versus channel 2 on the Y axis. 3) To make the ellipse more solid, go back to the Persist bezel button and set it to 2 Sec. Note that the ellipse fills in because the oscilloscope is now keeping two seconds of history on the screen. The bottom two buttons are labelled Contrast Increase and Contrast Decrease but they actually lower and raise, respectively, the screen brightness. If the screen is too dark you actually need to press the Contrast Decrease button to raise the contrast. A Note in Closing These four lessons by no means cover all the features of this oscilloscope, nor the many kinds of measurement that you can make with it. I hope, however, that they will get you up to the point where the oscilloscope is less intimidating and the official Tektronix manuals are easier to understand. I would like to thank the members of the 1999/2000 ELEC 290 class here at Queen’s University who, along with myself, learned how to use this oscilloscope this year and gave me many of the ideas for this guide. Please send any ideas for improvements to this guide to me at [email protected] David Lay Department Engineer Electrical and Computer Engineering Queen’s University at Kingston Ontario, Canada 1 August 2000 ELEC 290 Lab Manual E3-16 Fall Term