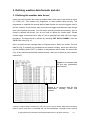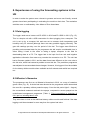
1
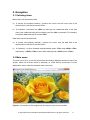
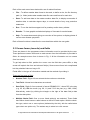
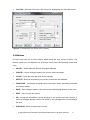
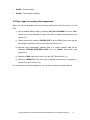
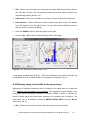
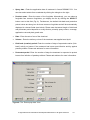
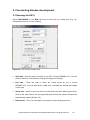
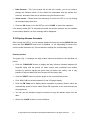
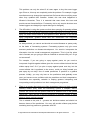
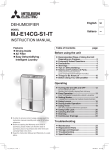
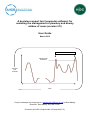
A decision support tool (computer software) for assisting the management of powdery and downy mildew of roses (version 3.0) User Guide March 2012 Control advised Infection risk threshold Infection risk forecast Time Project undertaken by Xiangming Xu ([email protected]) at East Malling Research, West Malling, Kent ME19 6BJ. Funded by the HDC (Projects HNS 165 and HNS 173). Please report problems (or general advice) to: Xiangming Xu ([email protected]) East Malling Research West Malling Kent ME19 6BJ Note: if a RUNTIME error message is displayed, note the message along with the sequence of events that led to the error and send, together with any other relevant information to Xiangming Xu. © Agriculture and Horticulture Development Board 2012. All rights reserved. 2 DISCLAIMER: AHDB, operating through its HDC division seeks to ensure that the information contained within this document is accurate at the time of printing. No warranty is given in respect thereof and, to the maximum extent permitted by law the Agriculture and Horticulture Development Board accepts no liability for loss, damage or injury howsoever caused (including that caused by negligence) or suffered directly or indirectly in relation to information and opinions contained in or omitted from this document. Copyright, Agriculture and Horticulture Development Board 2012. All rights reserved. No part of this publication may be reproduced in any material form (including by photocopy or storage in any medium by electronic means) or any copy or adaptation stored, published or distributed (by physical, electronic or other means) without the prior permission in writing of the Agriculture and Horticulture Development Board, other than by reproduction in an unmodified form for the sole purpose of use as an information resource when the Agriculture and Horticulture Development Board or HDC is clearly acknowledged as the source, or in accordance with the provisions of the Copyright, Designs and Patents Act 1988. All rights reserved. AHDB (logo) is a registered trademark of the Agriculture and Horticulture Development Board. HDC is a registered trademark of the Agriculture and Horticulture Development Board, for use by its HDC division. All other trademarks, logos and brand names contained in this publication are the trademarks of their respective holders. No rights are granted without the prior written permission of the relevant owners. © Agriculture and Horticulture Development Board 2012. All rights reserved. 3 CONTENTS 1. Overview .................................................................................................................. 5 2. Navigation ............................................................................................................... 6 2.1 Selecting items .................................................................................................... 6 2.2 Main menu ........................................................................................................... 6 2.3 Screen forms (records) and fields ........................................................................ 7 2.4 Buttons ................................................................................................................ 8 2.5 Key steps in running the programme ................................................................... 9 3. Defining weather data formats and site .............................................................. 10 3.1 Defining the weather data format ....................................................................... 10 3.2 Defining site data ............................................................................................... 13 4. Appending and displaying weather and spray data ........................................... 15 4.1 Appending weather data .................................................................................... 15 4.2 Calculating degree-days .................................................................................... 16 4.3 Calculating daily summaries .............................................................................. 17 4.4 Entering spray record data in the spray diary ..................................................... 18 5. Forecasting disease development ....................................................................... 20 5.1 Running the DSTs ............................................................................................. 20 5.2 Display disease forecasts .................................................................................. 21 6. Use of forecasts for assisting the management of powdery mildew ................ 24 6.1 Epidemiology of powdery mildew ....................................................................... 24 6.2 Forecasting rose powdery mildew infection........................................................ 25 6.3 Tactical use of the powdery mildew forecasts .................................................... 25 7. Use of forecasts for assisting the management of downy mildew .................... 27 7.1 Epidemiology of downy mildew .......................................................................... 27 7.2 Forecasting rose downy mildew infection ........................................................... 27 7.3 Tactical use of downy mildew forecasts ............................................................. 28 8. Experiences of using the forecasting systems in the UK .................................. 30 8.1 Data logging ...................................................................................................... 30 8.2 Wharton’s Nurseries .......................................................................................... 30 8.3 Fryers Nursery ................................................................................................... 31 8.4 David Austin Roses ........................................................................................... 31 8.5 John Woods Nurseries....................................................................................... 32 8.6 Key points from the evaluation ........................................................................... 32 © Agriculture and Horticulture Development Board 2012. All rights reserved. 4 1. Overview This Windows-based decision support tool (DST) computer software forecasts the development of powdery and downy mildew of roses and can act as an early warning system to assist in making decisions relating to the management of these economically important diseases. The powdery mildew model forecasts daily infection levels and can take into account past levels of temperature, relative humidity and fungicide sprays. Through the allocation of a threshold value to these infection levels it can assist with the management of this disease: for example, through adjusting application interval; application volumes; and, product choice. The need to take a management action depends on whether levels are below or above this threshold value. The downy mildew model forecasts the progress of infection - measured as Infection Efficiency (IE) - and can take into account past levels of rainfall, leaf wetness, temperature and relative humidity. In a similar manner to powdery mildew, the allocation threshold values for IE can also assist within the management of this disease (particularly through adjusting the choice of fungicide product). Due to the potential of outbreaks of rose mildew to spread rapidly, it is not advised to rely only on such tools for disease management, particularly in areas with severe disease pressure. The DST is only intended to assist growers during periods where shoot growth is not rapid or weather conditions are not very favourable for mildew development. It should be noted that using such approaches for disease management is a process rather than an instantaneous event. This user manual may also be accessed within the DST system: select the ‘USER’S MANUAL’ from the ‘HELP’ main menu. To use this facility, you need to have the Acrobat Reader programme installed on your PC. © Agriculture and Horticulture Development Board 2012. All rights reserved. 5 2. Navigation 2.1 Selecting items Menu items can be selected with: a) A mouse (the simplest method) - position the cursor over the menu item to be selected then click the left mouse button. b) A keyboard - hold down the <Alt> key and type the underlined letter of the item name (the underlined letter will be shown once the <Alt> is pressed). For example, hold down <Alt> and type F to select FILE. Data fields can be selected with: a) A mouse (the simplest method) - position the cursor over the data field to be selected then click the left mouse button. b) A keyboard - to move forwards and backwards press <Tab> and <Shift>-<Tab>, respectively. (<Shift>-<Tab> means while holding down <Shift> press <Tab>). 2.2 Main menu The main menu (Fig. 1) has five items which are always displayed across the top of the screen; when one of these items is selected (i.e. made active) a sub-menu is often displayed in a box under the selected main menu item. Figure 1: Screenshot of the programme showing the main menu interface © Agriculture and Horticulture Development Board 2012. All rights reserved. 6 Each of the main menu items deals with a set of related functions: File – To define weather data format to be used; to define a site, the file directory path (i.e. folder) and master weather data file name and format for each site. Data - To add new data to the master weather data file; to display summaries of weather data; to calculate degree days; to record details of any crop protection treatments. Run - To run the decision support tool for powdery and/or downy mildew. Results - To view graphic and tabular displays of forecasts for each disease. Help - To access documents giving an overview of the system; to display photos of various rose disease symptoms. Each of these functions is described in more detail later within the user guide. 2.3 Screen forms (records) and fields There are places in the programme where information must be provided by the user. These places are screen forms and on each screen form the information is provided in fields. An example screen form is shown in Fig. 2. All the information on one screen form is a record. To get help about a field, position the cursor over the field then press <F1>; a help screen will explain the form and relevant field(s). Some screen forms look complicated but they shouldn’t take too long to fill. Fields differ in the type of information needed and the method of providing it. There are five types of field: Number Field - Digits 0-9 are entered whole numbers or decimals. Text Field - Normal text characters are entered. Date Field - Digits 0-9 are entered in format DD/MM/YYYY, where DD is the day (e.g. 05, 20), MM the month (e.g. 09, 11) and YYYY the year (e.g. 1990, 1994). Alternatively, select (by clicking the triangle on the right of the date field) a date from the date picker. Multiple Choice Field - One or more listed option(s) are selected. These fields have either check boxes or radio buttons on the left of each option. With the checkbox type, select one or more options (indicated by the tick); with the radio-button type select one option only. The easiest way to select is to click mouse. © Agriculture and Horticulture Development Board 2012. All rights reserved. 7 List Field - Select an item from a list of items by highlighting the item with mouse. Figure 2: A screenshot of a screen form (record) 2.4 Buttons A screen form has one or more buttons which select the next course of action. The buttons (which are not displayed on all screen forms) have the following names and uses: 2D (3D) – Switch between 2D and 3D graphic displays. CANCEL - Cancel changes made to the current record and abort. CLOSE - Close the form and save all the changes. DELETE - Remove permanently the current record from the database. FUNGICIDE - Incorporate fungicide spray information when generating forecasts of powdery mildew. SAVE - Save changes made to the current record and display a blank screen form. NEXT – Move to the next record. OK - Accept the information (record) showing on the screen form and continue. If an error message appears use the OK button in the message box to acknowledge the error. PREVIOUS - Move to the previous record. © Agriculture and Horticulture Development Board 2012. All rights reserved. 8 PRINT – Print the graph. SHOW – Show graphic displays. 2.5 Key steps in running the programme When you use the programme for the first time, please follow the five steps to run the DST: 1) Set up weather data formats by selecting 'SET DATA FORMAT' from the 'FILE' main menu. This is essential in order for the DST to read the data correctly (see Section 3.1). 2) Define each site by selecting 'DEFINE SITE' from the 'FILE' main menu and the data logger format type used at each field (see Section 3.2). 3) Append newly downloaded weather data to a master weather data file by selecting 'APPEND WEATHER DATA' from the 'DATA' main menu (see Section 4.1). 4) Select the 'RUN' main menu item to run the DST (See Section 5.1). 5) Select the 'RESULTS' main menu item to display results either in a graphic or tabular form (See Section 5.2). For subsequent use of the programme, you usually need only to repeat steps 3-5. © Agriculture and Horticulture Development Board 2012. All rights reserved. 9 3. Defining weather data formats and site 3.1 Defining the weather data format Users first need to define the format of weather data, which have to be stored as a text (i.e. ASCII) file. This enables the programme to read weather data correctly. The programme is supplied with several defined data formats for common loggers used in the UK. However, these formats may not work since logger manufacturers may change their communication protocols. You can define as many formats as necessary; once a format is defined and saved, you do not need to define the format again. Please contact logger manufacturers for help on how to generate text data files from logger recordings. The data format is defined by selecting 'SET DATA FORMAT' from the 'FILE' main menu (Fig. 2). Here, we shall use two example data* to illustrate how to define the format. The first data file (Fig. 3) contains only temperature and relative humidity, which are sufficient to run the powdery mildew DST. In addition to temperature and humidity, the second file (Fig. 4) also contains rainfall and surface wetness, which are required to run the downy mildew DST. Figure 3: An example data file with only temperature and humidity Figure 4: An example data file with temperature, humidity, rainfall and wetness. *Note: the example data is contained on the CD. Figure 3 data is named ‘HDC Rose DST Demo Data for PM.txt’ (start date = 01/05/2008 and end date 26/06/2008). The data format is already © Agriculture and Horticulture Development Board 2012. All rights reserved. 10 defined in the programme (format name = Temp and RH). Figure 4 data is named ‘HDC Rose DST Demo Data for PM and DM.txt’ (start date = 12/05/2000 and end date 14/06/2000). The data format is already defined in the programme (format name = Berri ASC). ‘Date time’ data This is probably the most difficult part of the data format to define. Date and time - Select the check box if the date and time are listed in the same column, i.e. there is no space or other column separators (e.g. a comma) between date and time. For both example data, the date and time are listed in different columns: one is separated by Tab (Fig. 3) and one by comma (Fig. 4). Date - Enter the format in which the date is stored. For example, 13/02/08 is coded as DD/MM/YY; 13-12-2008 as DD-MM-YYYY. If the date and time are in the same column, please enter the date and time format here. For example, 13/02/08:10:03 as DD/MM/YY:HH:TT. For the data in Fig. 3, the format is defined as DD/MM/YYYY; for the data in Fig. 4, it is defined as YYYYMMDD. Date column - Enter the column number within the data file where the date is stored. You may increase or decrease the number by clicking the up or down arrow on the right of the field. For the data in Fig. 3, the date is given in the second column; for the data in Fig. 4, it is given in first column. Time - Enter the format in which the time is stored if time is stored separately from the date. Use H, T and S for hours, minutes and seconds respectively. For the data in Fig. 3, the format is defined as HH:TT:SS; for the data in Fig. 4, it is defined as HHTT. Time column - Enter the column number within the data file where the time is stored. You may increase or decrease the number by clicking the up or down arrow on the right of the field. For the data in Fig. 3, the time is given in the third column; for the data in Fig. 4, it is given in the second column. © Agriculture and Horticulture Development Board 2012. All rights reserved. 11 ‘Wetness’ data This is used to define whether surface wetness is recorded and, if so, in what format. Wetness present - Check this box if surface wetness data are available. If this box is not checked, all other fields for wetness will be unavailable for editing. For the data in Fig. 3, do not check the box as there is no wetness but check the box for the data in Fig. 4. Character - Indicate whether the wetness is coded as a character or a number in the text file. For the data in Fig. 4, check the box since the data are recorded as T (for True) and F (as False). Threshold - Enter the threshold value to indicate whether surface is wet. For the character-defined wetness, this is simply the 'character' that defines when it is wet. For the number-defined wetness, any wetness number equal to or greater than this threshold indicates that surface is wet. For the data in Fig. 4, enter T. Column - Enter the column number within the data file where the wetness is stored. You may increase or decrease the number by clicking the up or down arrow on the right of the field. For the data in Fig. 4, it is given in the fourth column. ‘Others’ data Temperature - Enter the column number within the data file where the temperature is stored. You may increase or decrease the number by clicking the up or down arrow on the right of the field. For the data in Fig. 3, temperature is given in the fourth column; for the data in Fig. 4, it is given in the sixth column. Relative humidity - Check the box if humidity is recorded and, if so, enter the column number within the data file where the humidity is stored. You may increase or decrease the number by clicking the up or down arrow on the right of the field. If no humidity data, just leave it as zero. For the data in Fig. 3, check the box and humidity is given in the fifth column; for the data in Fig. 4, check the box and humidity is given in the seventh column. © Agriculture and Horticulture Development Board 2012. All rights reserved. 12 Rainfall - Check the box if rainfall is recorded and, if so, enter the column number within the data file where rainfall is stored. You may increase or decrease the number by clicking the up or down arrow on the right of the field. If no rainfall data, just leave it as zero. Do not check the box for the data in Fig. 3; check the box for the data in Fig. 4 and rainfall is given in the fifth column. ‘General’ data Heading - Enter the number of heading text lines in the data file before the data. You may increase or decrease the number by clicking the up or down arrow on the right of the field. For the data in Fig. 3, there are five lines of headings; but for the data in Fig. 4, there are no headings. Format name - Enter a unique name to identify the data format. This name is used by the programme to read data recorded in this particular format. The programme will warn you if the name has already been used. Column separator - Please enter the separator used to separate data column. Default separators are space, Tab, and comma. For both example data, you do not need to enter this field since the separators are included in default (Tab for Fig.3 and comma for Fig. 4). Select ‘CLOSE’ to save and close the weather data form. 3.2 Defining site data In larger nurseries, it may be necessary to operate the programme with more than one loggers/site. To do this, individual sites need to be defined first. At each site, there is a single logger. A site is also the basic unit for spraying. A site is defined by selecting 'DEFINE SITE' from the 'FILE' main menu (Fig. 5). Site - Type a unique name to identify a site; a maximum of 60 characters, including space, are allowed. Master weather filename - This is the master file that contains weather data for this specific site. Typically, one season's data are stored in a single file. It is recommended that data for a different season are stored within a new file. Use © Agriculture and Horticulture Development Board 2012. All rights reserved. 13 <Tab> (or <Shift>-<Tab>) to move to the field (the field is highlighted) and then type in manually (including the folder name as well). Alternatively select the file from the open file dialog by single clicking this field to display an open file dialog. Data format: This is the weather data format recorded for this site (see Section 3.1). Select a format from the list (which will be displayed by single clicking the triangle on the right of the field with a mouse). Figure 5: The ‘Define site’ form. © Agriculture and Horticulture Development Board 2012. All rights reserved. 14 4. Appending and displaying weather and spray data 4.1 Appending weather data In practice, weather data are downloaded from a logger frequently, usually at an interval less than a week (using the communication programme supplied by the manufacturer) and saved as a text file. Downloading interval may also depend on the time of the previous spray and the stage of plant growth. In order to produce the most reliable information, the programme requires data downloaded over a much longer period. Thus, it is necessary to append newly downloaded weather data to the overall master weather file to run the model. Data are appended by selecting 'APPEND WEATHER DATA' from the 'DATA' main menu (Fig. 6). Figure 6: The ‘Append data’ form. Site - Select a site from the list of sites that have been defined previously (which will be displayed by single clicking the triangle on the right with a mouse). Once a site has been chosen, the corresponding data format and master file name are automatically loaded (these were given when defining a site). Data format - This is for information only and cannot be changed here (to change the data format, see Section 3). New data filename - Enter the name (include the directory) or click the ‘New files’ button to select files that are to be appended to the master file. Please note, you can select more than one file at a time. To do so, please hold down the <Control> key while using the mouse to click individual files in the open file dialog. The programme will automatically check the order of the data in these files; in addition, © Agriculture and Horticulture Development Board 2012. All rights reserved. 15 it will also check whether the selected data have already been appended into the master file. Master file – This is the master file for this specific site. Usually, one season's data are stored in a single file. Thus for a new season, a new file for the site should be defined. The default file is the one defined before for the site (see Section 3.2). It is a good practice to use the same file as defined for the site. You may also select a file from an open file dialog by clicking the ‘Master files’ button. 4.2 Calculating degree-days Sometimes, it can be useful to calculate accumulated degree-days from a certain date, which can be used to forecast plant or pest development. An example is given in the end of this section to illustrate the usefulness of this function. Degree-days over any base temperature may be calculated by selecting 'CALCULATE DEGREE DAYS' from the 'DATA' main menu (Fig. 7). Figure 7: The ‘Calculate degree-days’ form. Start and end date - enter or select (by clicking the triangle on the right) the start and end dates to calculate degree-days. Site - Select a site from the list of sites that have been defined previously. Once a site has been chosen, the corresponding data format and master filename are automatically loaded (Section 3.2). Data format - This is for information only and you cannot change the format here. © Agriculture and Horticulture Development Board 2012. All rights reserved. 16 Data filename – Enter a filename in which weather data are stored. The default file is the master file for this specific site. You can also click the Browse button to select a file from an open file dialog. Base temperature - This is the base temperature from which to accumulate degree-days. The default value is 0°C. Click the ‘SHOW’ button to show the graph on the right Click the ‘2D’ (‘3D’) button to switch between 2D and 3D graph. You can also display the accumulated degree-day values on any date in the date range. This is achieved by single clicking a single point on the line; a box titled 'Point data' containing the exact date and degree-day value will then be shown in left bottom (Fig. 7). You can start to accumulate degree-days over a new base temperature from a new date while not changing the current display. This is useful when you need to calculate degree-days for multi-purposes. To do so, double click a point on the graph from which you want to re-calculate degree-days. You are then presented with a simple input window asking for a new base temperature. Enter an appropriate value and click OK; a new line will then be displayed in the graph. For example, an insect pest is assumed to require 90 degree-days above 0°C from eggs to larvae and another 120 degree-days above 10°C from larvae to pupae. Assuming that it is the larval stage that damages crop, we could use the calculating degree-days function to estimate the period when larvae are active. First, calculate the degree days above 0°C from the date when eggs are believed to be laid. Then double click the symbol (circle) on the graph when the accumulated degree-days exceeded 90 for the first time [i.e. eggs are predicted to have hatched]; enter 10°C as the new base temperature in the simple input window and then click OK. On the new line displayed, find the first date when the accumulated degree days exceeded 120 [when pupating is predicted]. Thus a period of larval activity can then be estimated. 4.3 Calculating daily summaries Daily summary data (temperature, humidity and rainfall) may be obtained by selecting ‘SUMMARISE WEATHER DATA' from the 'DATA' main menu (Fig. 8). Start and end date: enter or select (by clicking the triangle on the right) the start and end dates to calculate daily summary data. © Agriculture and Horticulture Development Board 2012. All rights reserved. 17 Site - Select a site from the list of sites that have been defined previously. Once a site has been chosen, the corresponding data format and master filename are automatically loaded (Section 3.2). Data format - This is for information only and you cannot change the format here. Data filename – Enter a filename in which weather data were stored. The default file is the master file for this specific site. You can also click the Browse button to select a file from an open file dialog. Click the ‘SHOW’ button to show the graph on the right Click the ‘2D’ (‘3D’) button to switch between 2D and 3D graph. Figure 8: The ‘Summarise weather data’ form. In the graph, average daily (9:00 am - 8:59 am) temperature and relative humidity will be displayed as lines and total rainfall (if recorded) as vertical bars (Fig. 8). 4.4 Entering spray record data in the spray diary Application of fungicide treatments can be recorded in the spray diary for a particular site - although this information is not essential. The programme scans records in the spray diary before tabulating forecasts of powdery mildew in order to indicate the period in which plants may have been exposed to the greatest risk of infection. The spray diary form is accessed by selecting ‘ENTER SPRAY DATA' from the 'DATA' main menu (Fig. 9). Site - Select a site from a list of sites that have been previously defined. © Agriculture and Horticulture Development Board 2012. All rights reserved. 18 Spray date - Enter the application date of treatment in format DD/MM/YYYY. You can also select a date from a calendar by clicking the triangle on the right. Product name - Enter the name of the fungicide. Alternatively, you can select a fungicide from common fungicides; you display the list by clicking the ‘SELECT’ button next to this field (Fig. 9). Furthermore, the default kick-back and protection period values are also given for these common fungicides and will be automatically displayed in relevant fields (see below). Please note that actual length of kick-back and protectant period depends on many factors, primarily spray volume, coverage, application rate and plant growth rate. Rate - Enter the rate of use of the chemical. Volume - Enter the delivery volume if the treatment was applied as a liquid. Kick back (curative) period: Enter the number of days of expected curative ('kickback') activity on leaves if the treatment has known post-infection activity against powdery mildew. Please ask advisors for more information. Protectant period: Enter the number of days the treatment is expected to protect leaves from infection of powdery mildew. Please ask advisors for more information. Figure 9: The ‘Enter spray data’ form. © Agriculture and Horticulture Development Board 2012. All rights reserved. 19 5. Forecasting disease development 5.1 Running the DSTs Select RUN MODEL in the RUN sub-menu to show the run model form (Fig. 10). Complete this form to run the model(s) Figure 10: The ‘Run the model’ form. Start date - Enter the date from which to run DST in format DD/MM/YYYY. You can select a date from a calendar by clicking the triangle on the right. End date - Enter the date to which the model would be run in format DD/MM/YYYY. You can also select a date from a calendar by clicking the triangle on the right. Select site - Select a site from the list of sites that have been defined previously. Once a site was chosen, the corresponding data format and master filename are automatically loaded (Section 3.2). Data format - This is for information only and you cannot change this here. © Agriculture and Horticulture Development Board 2012. All rights reserved. 20 Data filename - This is the master file for this site. Usually, you do not need to change this filename since it is the default file associated with the defined site. However, alternative files can be selected using the Browse button. Select model - Please select the disease(s) for which the DST is run by clicking the corresponding check box. Click the ‘OK’ button to run the DST(s) or the ‘CLOSE’ to cancel the operation. If the downy mildew DST is selected but rainfall and surface wetness are not available in the weather data file, an error message will be displayed. 5.2 Display disease forecasts After running the DST(s), you can display disease forecasts by clicking RESULTS main menu item [the RESULTS main menu is disabled, i.e. not responding to mouse click, until the model has been run]. Click a tab title to display the corresponding output. Powdery mildew The graph (Fig. 11) displays the daily mildew infection forecasts for the specified run period. Click the ‘FUNGICIDE’ button to display the daily infection forecasts adjusted for fungicide spray and the period for which leaves were protected from mildew infection by previous sprays [as green bars just above the x-axis] - this is only possible if required data have been entered into the spray diary. Click the ‘PRINT’ button to print the graph on the current default printer. Click ‘2-D’ (‘3-D’) to switch between 2-D and 3-D graph display. Click the PM Table tab to display tabular forecasts of powdery mildew, which are automatically saved in the file called 'Rose PM output.dat' in the same directory as the programme. You can use the Windows copy/cut functions to copy the tabular output from the table. Select the ‘CLOSE’ button to exit the Window. © Agriculture and Horticulture Development Board 2012. All rights reserved. 21 Figure 11: The ‘Disease prediction’ output screen for powdery mildew. Downy mildew Figure 12 displays the progress of infection – measured as Infection Efficiency (IE) for the specified run period. The height of each line represents the favourability of weather conditions for infection in each potential infection period: 100% means that all viable spores will lead to successfully infection. The actual disease severity resulting from each potential infection period depends on the amount of downy mildew inoculum present and the level of cultivar susceptibility to this fungus. Click the ‘PRINT’ button to print the graph on the current default printer. Click ‘2-D’ (‘3-D’) to switch between 2-D and 3-D graph display. Click the DM Table tab to display tabular predictions of downy mildew. This information is automatically saved in the file called ' Rose DM output.dat' in the same directory as the program. Select the ‘CLOSE’ button to exit the Window. © Agriculture and Horticulture Development Board 2012. All rights reserved. 22 Figure 12: The ‘Disease prediction’ output screen for downy mildew. © Agriculture and Horticulture Development Board 2012. All rights reserved. 23 6. Use of forecasts for assisting the management of powdery mildew 6.1 Epidemiology of powdery mildew Powdery mildew of roses is caused by Sphaerotheca pannosa. The fungus grows well only on young tissues; tissues become more resistant to infection as they age. Typically, mildew development increases as new shoots develop and decreases as these shoots mature and terminate in flower buds. Because of the explosive nature of mildew epidemics, even a low level of disease can lead to severe outbreaks over a very short period of time and hence may lead to 100% loss of plants. Control is achieved by routine intensive spray programmes. A preferable strategy is to intervene with fungicides only when it is justified. This requires knowledge of when there is a risk of disease, which is estimated by a model (a set of rules) describing the effects of weather and possibly other factors on disease development. In the spring, primary mildew is initiated by conidia or mycelia that overwintered in the buds, often leading to the entire shoot being infected. Conidia produced on these primary mildew lesions initiate new infections, i.e. secondary mildew. Although the overwinter fungus as may ascocarps, also this mechanism is believed not to be an effective means because of of erratic overwintering production Figure 13: Powdery mildew colonies on young leaves of ascocarps. In mild climates, no winter survival is necessary since the secondary mildew infection cycle can continue provided the susceptible tissues are available. At 20°C and near 100% relative Figure 14: Conidiophores of rose powdery mildew humidity, conidia begin to germinate two to four hours after being deposited on the leaf. Drier conditions lead to fewer conidia that may successfully infect plants. At constant temperature in the range of 8-28°C, it takes about 3-10 days for new infections to become visible lesions, and 4 to 10 days for new infections to start sporulating (the latent period). Once sporulating, a single lesion may continue to produce conidia for 2© Agriculture and Horticulture Development Board 2012. All rights reserved. 24 3 weeks. Thus, within a growing season many generations of powdery mildew may take place, explaining the explosive nature of this disease. Disease development is minimal when temperature is over 30°C or below 6°C. Successive conidia remain attached to each other in chains (Fig. 14), giving the characteristic powdery appearance. They are usually broken off and carried to new infection sites by air currents. The optimum temperature for mildew development is c. 22-23°C. Powdery mildews are characterised by the fact that surface wetness is not required for infection. Indeed, mildew development may be adversely affected by the presence of films of water on the leaf surface because of harmful effects on conidial germination, hyphal penetration or sporulation. Thus, conidial infection is effectively continuous over time. In general, the rate of disease progress of a mildew epidemic is mainly determined by the daily dose of inoculum that successfully infects the host. Temperature determines the rate of conidial infection whereas both temperature and relative humidity determine the rate of mortality. 6.2 Forecasting rose powdery mildew infection The DST forecasts powdery mildew on rose shoots at daily intervals and the percentage of conidia that infect host tissue within a period of 24 h using ambient temperature and relative humidity (recorded in an interval <= 1 h). It is important to realise that the lesions resulting from the infection may take up to 14 days to appear depending upon the temperature (typically this process takes about a week). Furthermore, it is important to understand that this forecast only indicates the effects of weather on the daily development rate of the landed inoculum, without considering the amount of inoculum and cultivar susceptibility. 6.3 Tactical use of the powdery mildew forecasts It is suggested that a threshold of daily infection forecast of around 4-5% could be used to indicate that a control measure may be needed, such as applying sprays or altering products in response to the infection pressure. Of course, the risk is conditioned on the degree of cultivar susceptibility, which has to be taken into consideration. Due to the potential of rose mildew epidemics to rapidly increase, it is ill-advised to rely only on DSTs alone for disease management, particularly in areas with severe disease pressure. The DST is only intended to assist growers in adjusting the frequency (and possibly products) during periods where shoot growth is not rapid or weather conditions © Agriculture and Horticulture Development Board 2012. All rights reserved. 25 are not very favourable for mildew development. It should be noted that using forecasts for disease management is a process rather than an instantaneous event. For controlling powdery mildew, an important issue is to understand the critical importance of inoculum level on disease development. It is essential to have good control during the early phase of powdery mildew development. Failing to achieve this, satisfactory control of mildew is difficult to achieve. As indicated before, the forecast does not consider current disease level (i.e. inoculum level) and cultivar susceptibility. Users need, therefore, to consider these factors when interpreting forecasts in practical disease management. When daily infection forecast exceeds the threshold level (e.g. 4-5 %), a control measure should be taken. The type of action will depend on the current spray programme. The interval between sprays, can be reduced, an anti-sporulant or curative product can be used in place of a protectant or in some situations the spray volume can be increased. If the disease is below the threshold level, the action can be taken to lengthen the spray interval or even omit fungicide sprays, to save costs. The control measure to be taken also depends on the pattern of forecasted infections over time. – If the forecasted infection exceeded the threshold level only for a recent few days (i.e. for other days, forecasted infection is very low), users may use a fungicide with a very good curative efficacy against mildew. – On the other hand, if the forecasted infection was generally very high over the previous 1-2 weeks, it would be better to use a fungicide with a very good antisporulant as well as curative efficacy in combination with a protectant programme. – In the period where a fungicide spray has not been applied for a long time and disease prediction is generally very low, a good protectant fungicide may be applied, if a spray is deemed necessary. HDC Factsheet 17/10: ‘Control of powdery mildew diseases on hardy nursery stock and herbaceous perennials’ provides further guidance on how to minimise losses by avoiding environmental conditions favourable for disease development and by applying appropriate fungicide treatments. © Agriculture and Horticulture Development Board 2012. All rights reserved. 26 7. Use of forecasts for assisting the management of downy mildew 7.1 Epidemiology of downy mildew Downy mildew (Peronospora sparsa) can be very destructive but tends to be sporadic in its occurrence. Although not as common as powdery mildew, downy mildew is considered in the UK to rank in the ‘top four’ most important foliar diseases of cultivated roses along with rust, powdery mildew and black spot. Infection is generally restricted to young, apical plant growth although it can infect leaves, stems, peduncles, calyces and petals. The main effect of the disease is short-term disfigurement caused by foliar lesions and extensive premature leaf abscission or ‘leaf drop’. Under humid, cool conditions, sporangia and sporangiophores appear copiously on the lower surfaces of leaves but, under less favourable conditions, spore production is sparse and difficult to detect. Sporangia germinate within four hours in water and germination is favoured under cool conditions (< 18°C). Field observations indicate that as little as four hour wetness may be sufficient for infection to take place. Using detached leaves, it has been shown that infection can take place after only two hour leaf wetness at an optimum temperature and disease severity increases with increasing length of leaf wetness. Latent periods range from four to seven days, depending on temperature. The fungus is believed to overwinter as dormant mycelium in cuttings and plants. However, the role of oospores in overwintering and initiating infections is less certain. Mycelium of P. sparsa may survive the winter in the cortex of rose stems. Systemic infections appear to be important in rose rootstocks in the downy mildew epidemics seen in California. Recent studies indicate that systemic infection in bush roses grown in the UK is not important and that oospores may play an important role in overwintering. 7.2 Forecasting rose downy mildew infection Rainfall triggers the DST to start a potential infection period, i.e. release sporangia from overwintering lesions or from lesions on plants. The DST assumes that all spores are viable and land on the leaf surface immediately following a rainfall event. It also assumes that the rate of infection by each spore is independent of cultivar and inoculum density. If wet leaves become dry, the DST halts any current infection © Agriculture and Horticulture Development Board 2012. All rights reserved. 27 process. Any infecting spores are liable to die during the dry period. The rate of spore mortality depends upon the relative humidity and temperature during the dry period. When a leaf is re-wetted by rain, dew or overhead irrigation, the surviving spores continue to infect. An infection period ends when all spores landed following a rainfall event have infected the leaf or are dead. The progress of infection is measured as Infection Efficiency (IE), defined as the accumulated percentage of spores which have successfully infected plants. The final IE of each infection period quantifies the favourability of weather conditions for infection. 7.3 Tactical use of downy mildew forecasts The DST alerts users to periods when weather was favourable for infection. This information can be used to improve the disease control, lower production costs and reduce fungicide usage. Under high inoculum and susceptible cultivars, an IE of 5% could indicate the need for control actions. For low inoculum or moderate susceptible cultivars, an IE of 35% may indicate the need for control actions. The key for downy mildew management is the level of inoculum on the site, since conditions required for infection are not very strict. Severity of downy mildew during the recent past at the same site and the fate of those previously-infected leaves/plants are the keys to estimate the level of inoculum. Without considering the level of inoculum (indeed presence of the inoculum), growers are likely to spray unnecessarily if they follow the model predictions literally. There are several possible ways that growers could use IE values in practice. 1. Forecasts for wet-loving pathogens (e.g. downy mildew) can be used in association with a curative control strategy in which chemicals are applied soon after infection periods are detected; these treatments are intended to stop each generation of infection from developing into visible symptoms. In relatively dry seasons this strategy is cheaper than the widespread practice of applying protective chemicals at fixed time intervals according to a routine schedule. Reliance on curative treatments is considered a risky strategy and growers adopting this approach need reliable forecasts and must be equipped with sufficient spray machines to respond rapidly to warnings. For this use, a number of products from different fungicide groups with good curative efficacy are needed. 2. Using protectant products in the initial epidemic phase (i.e. early season) with the timing of application determined by forecasts from the DST as well as © Agriculture and Horticulture Development Board 2012. All rights reserved. 28 weather forecasts. 3. Using products that have high efficacy as an anti-sporulant with good curative action when disease has already established in the crop, with the timing of application determined by the IE value as well as current disease level and weather forecasts. 4. Programming irrigation schemes to reduce the risk of disease development, particularly in the glasshouse, based on the joint effects of temperature and duration of wetness on disease development. HDC Factsheet 15/09: ‘Control of rose downy mildew’ provides further information on the biology of rose downy mildew and guidance on how to minimise losses by good nursery hygiene, avoidance of environmental conditions favourable for disease development and by the use of fungicides and nutritional products. © Agriculture and Horticulture Development Board 2012. All rights reserved. 29 8. Experiences of using the forecasting systems in the UK In order to make the system more relevant to growers and more user friendly, several growers have been participating in evaluating the model on their sites. The evaluation activities were co-ordinated by John Adlam of Dove Associates. 8.1 Data logging The logger used was a Lascar unit EL-USB1 in 2010 and EL-USB2 in 2011 (Fig. 15). This is a simple unit with a USB connection for direct plugging into a computer. The unit is set up by a computer link and was set to measure both temperature and humidity every 30 minutes [although there are many possible logging intervals]. This gave 48 readings per day over the period of the trial. The logger was effective at providing environmental data for the programme but did require considerable time in either taking it back to the office or taking a laptop computer to the field for downloading data to a PC. The logger had to be kept free from rain and irrigation applications otherwise free water may corrode the connection to a PC. The unit has had a firmware update in 2011 and the data format was different on the new units to the old units, which had caused a problem at one trial site. The prediction programme was adjusted to accommodate these changes. However, this logger will not be suitable for the downy mildew module when available as leaf wetness and rainfall are required too. 8.2 Wharton’s Nurseries The programme was first run at Wharton’s Nurseries in 2010, on a crop of container grown roses (Fig. 15). A whole bed was devoted to the programme which determined the need for a powdery mildew protective spray. Over the trial period (April – August), the conventional treatment received nine sprays, compared to seven sprayed on the model-based management programme (Table 1). This is equivalent to reduction of £411 per ha, including labour cost. They were keen to look at the additional downy mildew module and felt that if the data logging could be automated in some way then the system had value. © Agriculture and Horticulture Development Board 2012. All rights reserved. 30 Table 1. Summary of spray records in the DST-based and conventional programme of managing powdery mildew in 2010 at Wharton’s Nurseries DST-based strategy Conventional strategy Date Product Cost/ha Date Product Cost/ha 14-04-10 Systhane £21.86 14-04-10 Systhane £21.86 14-05-10 Systhane £21.86 14-05-10 Systhane £21.86 24-06-10 Amistar £40.43 25-05-10 Folicur £25.23 06-07-10 Folicur £25.23 07-06-10 Nimrod £65.05 13-07-10 Nimrod £65.05 24-06-10 Amistar £40.43 23-07-10 Folicur £25.23 06-07-10 Folicur £25.23 09-08-10 Amistar £40.43 13-07-10 Nimrod £65.05 23-07-10 Folicur £25.23 09-08-10 Amistar £40.43 9 x £9.00/ha £81.00 Spraying 7 x £9.00/ha TOTAL £63.00 £303.09/ha £411.37/ha 8.3 Fryers Nursery This site ran the system through the season and had a good level of success at both running the programme and translating the information into reduced fungicide sprays. Once installed the programme ran well with no operational difficulties. Over the trial period (May – July), the plot subjected to the model-based management received four sprays, three less than the remaining container rose area. 8.4 David Austin Roses The programme was installed on one of their workstations and the logger placed in a nearby container rose bed. The programme ran well and the data was successfully loaded into it. The levels of powdery mildew on both the trial area and the remaining crop were very high and they felt the need to spray their normal programme as they struggled to gain control. They applied fungicides nine times within a period of 5-6 weeks (June-July). They also realised that using their air-blast sprayer there was some drift onto the trial area too. © Agriculture and Horticulture Development Board 2012. All rights reserved. 31 8.5 John Woods Nurseries The system was run last year but had considerable difficulties with installation over the company computer network. Whilst the logger was run and downloaded the prediction programme was never run without repeated attention.. There were difficulties in getting the programme to retain the fungicide data. This again was a computer-network related problem and one that can be amended. In the end the programme running was abandoned although the logger information was continued. A total 13 applications were applied from early February to mid-June. The difficulties found in the system were that when spraying for powdery mildew according to the programme prompting they then had to go back over and spray for insect control, whereas in the standard container area, they would tank mix insecticides and fungicides together. There was also a concern that plants were often despatched having not had a routine powdery mildew spray and they were unsure how the product shelf life was affected once on the garden centre bed. There may be a reduced protection to powdery mildew of these plants to those routinely sprayed. Finally the time taken to down load the data was considered difficult and some means of automatic transfer would be an improvement. 8.6 Frequently asked questions The evaluation has identified several specific issues where the forecasting system (software) needs to be improved and it also raised several issues that are generic to the use of pest/disease forecasting systems in practice. Specific issues 1. How to handle multi-loggers at a site? This is particularly problematic if different loggers (hence different data formats) are used. The system allows definition of logger data format and individual locations for a logger separately. Users first define the data format(s) for logger(s) used on the holding, and then define logger site (and associate one of defined data formats for the site). This kind of operations only needs to done once when the programme is first used, or once a year. 2. How to enter spray information for different sites? In the ‘enter spray’ form, select a specific site where a logger is located for © Agriculture and Horticulture Development Board 2012. All rights reserved. 32 which the spray information is entered. 3. Can we provide the information for fungicide action against powdery mildew? The default information for fungicide action against rose powdery mildew (i.e. kick-back/curative time and protectant period) is now provided for common fungicides; the information is provided by John Adlam of Dove Associates. However, it should be noted that the information is for guide only. Several factors affect the fungicide action considerably, including spray coverage, spray volume, and rate of plant growth. In particular, during the fast growing period, the protectant period must be considerably shorter than indicated. 4. Problems encountered in installation There may be difficulties in installing and running the programme on a network due to security issues as the network may not allow the programme to access files or write data to files across the network. This issue can only be resolved via the local network administrator. Generic issues 1. Why is it necessary and so difficult to define data format? Can we just use the same type logger? There are many loggers available in markets with varying capabilities. Furthermore, different loggers usually store their data in their own specific format that cannot be viewed by other programmes. For example, some growers may only want to run powdery mildew model and others may want to run both powdery and downy mildew models. For the former, a simple temperature-humidity logger is good enough; but for the latter, rainfall and surface wetness sensors are also needed, which usually are recorded by expensive loggers. It is practically impossible to allow any model to read internal data format for common commercially-available loggers. Therefore, the compromise is to enable the system to read a text file, which all logger manufactures provide functions to export their internal data format into a text file. However, even for a text file, there are large differences in how the data are stored. For example, how is the date/time stored? [i.e., is the month before day? What is the separator between day and month? Is the year in two or four digit?]; what column is temperature stored? Thus the programme needs to know the exact format of the text file, which is provided by users through data format definition. © Agriculture and Horticulture Development Board 2012. All rights reserved. 33 This problem can only be solved if all users agree to buy the same logger type. Even so, this may not completely solve the problem. For example, logger manufacturers may change the exported text file format without notifying users when they updated their firmware. Indeed, this was what happened in Wharton’s Nurseries. Thus, it is essential that users know this issue and provide correct format definition. Fortunately, this is only need to be done once unless loggers are changed [or export data type is changed]. 2. The difficulties in using the system are that when spraying for powdery mildew according to the programme prompting growers may have to go back over and spray for insect control within a short period of time. Whereas in the normal spray programme, growers would tank mix insecticides and fungicides together. As always stated, you cannot and should not control diseases or pests purely on the basis of forecasting systems. Forecasting systems only give more accurate predictions on disease development. You need to incorporate the information into the overall management programme. This is just like when rain is forecast, are you going to take an umbrella or raincoat with you? Or go out as normal? For example, if you are going to spray against pests, do you need to incorporate fungicide against mildew given the current mildew risk and the last mildew spray time? Or if you plan to spray against pests next day, but the current mildew risk is predicted to be severe, could you bring forward your pest spray by one day? Use of model predictions in practice is a gradual process. Initially, you may rely less on the predictions and gradually more once you become more confident with the prediction and their interpretation. Consultants are especially valuable in helping growers interpreting and incorporating model predictions into their management programme. 3. There is a concern that plants are often despatched having not had a routine powdery mildew spray when the forecasting system is adopted. Hence, growers are unsure how the product shelf life is affected once on the garden centre bed. There may be a reduced protection to powdery mildew of these plants to those routinely sprayed. This is related to the point 2 – growers are decision-makers and should not become slaves of the predictions. You may still provide mildew spray before marketing as a key practice to guarantee shelf life. © Agriculture and Horticulture Development Board 2012. All rights reserved. 34 4. The single biggest need is for the system to incorporate some means of automatic data loading to avoid the need for regular logger visits. This is achievable by the use of an automatic weather station. A unit such as the Davis Vantage Pro 2 would provide all the necessary environmental data as well as provide a leaf wetness module to include the necessary sensors for a future downy mildew prediction. See point (1). This really depends on the cost of an automatic weather station. © Agriculture and Horticulture Development Board 2012. All rights reserved. 35