1
-_
SHRP-P-652
Falling Weight Deflectometer
Relative Calibration Analysis
PCS/Law Engineering
Strategic
Highway Research Program
National Research Council
Washington,
DC 1993
SHRP-P-652
Contract P-001
Program Manager: Neil F. Hawks
Project Manager: Cheryl Allen Richter
Production Editor: Marsha Barrett
Program
Area Secretary:
Cynthia Baker
August 1993
key words:
calibration
deflection testing and backcalculation
falling weight deflectometer
FWD
LTPP AC
Strategic Highway Research Program
National Academy of Sciences
2101 Constitution Avenue N.W.
Washington,
DC 20418
(202) 334-3774
The publication of this report does not necessarily indicate approval or endorsement of the fmdings, opinions,
conclusions, or recommendations
either inferred or specifically expressed herein by the National Academy of
Sciences, the United States Government, or the American Association of State Highway and Transportation
Officials or its member states.
© 1993 National
350/NAP/893
Academy of Sciences
Acknowledgments
The research described herein was supported by the Strategic Highway Research Program
(SHRP). SHRP is a unit of the National Research Council that was authorized by section
128 of the Surface Transportation and Uniform Relocation Assistance Act of 1987.
The development of this program was sponsored by the Strategic Highway Research
Program for use in the Long-Term Pavement Performance (LTPP) Studies. Technical
contributions were provided by Dr. Lynne Irwin, Comell University and Consultant to
SHRP. Version 1 of the program was written by Mr. Scott Rabinow of PCS/LAW
Engineering, Beltsville, Maryland. Version 2 of the program was written by Mr. Raj
Basavaraju and Mr. Gary E. Elkins of Nichols Consulting Engineers.
°..
111
Table of Contents
Purpose
Background
.................................................
...............................................
Page
1
2
Program Description
.........................................
FWD Data File Input ......................................
Gain_ Table .............................................
Latin Square ANOVA .....................................
Summary Statistics .......................................
Program Output .........................................
Gains Table .........................................
ANOVA Table .......................................
Deflection Input Data ..................................
Summary Statistics ....................................
4
4
7
10
10
12
17
19
24
24
Program Operation
.........................................
Program Inctallation and Starting .............................
Control Screen 1 - Select Analysis Type ..........................
Control Screen 2 - FWD Data File Selection .......................
25
25
27
29
Control Screen
Control Screen
Output Screen
Output Screen
Output Screen
Output Screen
Function Keys
3 - Select Geophone Replaced ......................
4 - Display Results on Screen ......................
1 - Gains Table ...............................
2 - ANOVA Table ..............................
3 - Gain Change ln ctructions .......................
4 - Average New Gain Factors ......................
..........................................
30
30
32
32
32
32
35
Anomalous Results ..........................................
37
Technical Assistance
38
.........................................
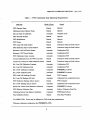
Appendix A. SHRP FWD Calibration Protocol
Appendix B. FWDCAL 2.0 Program Listing
Appendix C. Latin Square Analysis of Variance (ANOVA)
V
Abstract
Non-destructive deflection testing with Falling Weight Deflectometers (FWDs) is a critical
element of the pavement monitoring effort for the Long-Term Pavement Performance
(LTPP) test sections of the Strategic Highway Research Program. Data obtained through
this testing serves as the primary mechanism for assessing structural conditions within each
LTPP test section.
For the LTPP deflection data to serve its intended purpose, the deflection testing must be
conducted consistently, and with accurately calibrated FWDs. This report documents the
FWDCAL software, which was developed to help ensure that the latter need is met.
SHRP FWD testing procedures require that the FWDs used be calibrated on a regular basis.
One aspect of this requirement is monthly relative calibration of the FWD deflection
measurement system. This process involves stacking the deflection sensors, one above
another, in a special stand, so that all will simultaneously measure the deflection of the
pavement at the same point. By rotating the sensors through the positions in the stand, and
repeating the testing, a data set is obtained which can be analyzed to: (1) determine an
appropriate multiplier for each sensor, so that all will provide identical data; and (2)
statistically partition the measurement errors in the data to the major sources of error, as a
check on the acceptability of the calibration data. The FWDCAL software documented in
this report was developed to perform these analyses.
vii
FWDCAL Version 2, Program Manual - February 1992
Purpose
The purpose of this document is to explain the background and use of the revised FWD
relative calibration analysis computer program, FWDCAL
Version 2.0, developed for the
Strategic Highway Research Program (SHRP) for use by the Long Term Pavement Performance
(LTPP) Regional Coordination Offices (RCO). The FWDCAL Version 2.0 program automates
the analysis of the results of the relative calibration test procedure performed on the Falling
Weight Deflectometer
•
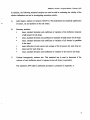
(FWD) geophones. The program performs the following functions:
Checks FWD relative calibration data file for compliance with the LTPP test setup
requirements.
•
Calculates new relative gain factors for each geophone.
•
Checks the ratios between the existing and new relative gain factors to determine if they
are within the established tolerances.
•
Performs an analysis of variance on the data to determine the statistical significance of
key test factors.
•
Provides a statistical summary of the test results.
•
Provides guidance to the user on needed gain changes or further testing needs.
The following new capabilities have been added to the FWDCAL Version 2.0 program:
•
Computes the gains factor for a replacement sensor.
•
Processes up to three data sets in the same file.
•
Computes the average new relative gain factor from relative calibration tests performed
as a part of the SHRP Reference calibration procedure. All three data sets must be in the
same file.
•
Processes "data sets produced by Version 10 and Version 20 of the Dynatest FWD
operating system software.
•
Ability to process multiple data sets in separate files without exiting the program.
The program displays the results on the screen and writes them to an output file for subsequent
printing.
FWDCAL Version 2, Program Manual - February 1992
Background
The LTPP program uses the Dynatest Model 8000 Falling Weight Deflectometer
to measure the deflection response of the test pavement structures.
program
was developed
The FWDCAL
to automate the analysis of the results of the relative
(FWD)
computer
calibration
performed with this device.
Relative calibration is a technique used to verify and adjust the response of each of the
deflection
sensors, geophones on a Dynatest FWDs,
so that equivalent
obtained when the sensors are subjected to the same displacement.
measurements
are
A direct result of this
procedure is the determination of a set of multipliers necessary to keep the measurements derived
from the deflection sensors equivalent.
In the relative calibration procedure all deflection sensors are placed in a stand which is
held vertical on a point located near the load plate so that all sensors are subjected to the same
deflection. The measurements consist of subjecting the sensors to a five drop load sequence, then
rotating the positions of the sensors in the stand, placing the stand on the same point and
repeating the drop sequence. This process is repeated until all sensors have been tested in each
position in the stand. The position of the sensors in the stand are rotated to serve as a check on
proper conduct of the test and cancel out any effect of stand position on the results.
The most basic analysis of the data collected in a relative calibration test consists of the
following:
1.
Calculating the ratio of overall mean deflection of all sensors for all drops to the mean
deflection of each sensor for all drops. This is called the means ratio.
2.
Computing the new gain value, which is the product of the means ratio times the existing
gain value.
2
FWI_AL Version 2, Program Manual - February 1992
In addition, the following statistical analyses are used as aids in evaluating the validity of the
relative calibration test and in investigating anomalous results:
A.
Latin Square, analysis of variance (ANOVA). This determines the statistical significance
of sensor, set and position on the test results.
B.
Summary statistics:
•
mean, standard deviation and coefficient of variation of the deflection response
C.
•
•
of all sensors for all drops.
mean, standard deviation and coefficient of variation of each sensor for all drops.
mean, standard deviation and coefficient of variation of all sensors by position
in the stand.
•
•
•
mean deflection of each sensor and average of for all sensors for each drop set.
mean load for each drop set.
mean, standard deviation and coefficient of variation of the load for all drops.
Cochran homogeneity variance test. This statistical test is used to determine if the
variance of each deflection sensor's response across all drops is equivalent.
The standard LTPP relative calibration procedure is presented in Appendix A.
FWDCAL Version 2, Program Manual - February 1992
Program
Description
The FWDCAL Version 2.0 program contains three analysis options:
1.
Standard Analysis
_
2.
Replace Geophone Analysis
3.
Reference-Relative Calibration.
The Standard Analysis is designed for use in interpreting
the results when a relative
calibration is performed as a stand-alone procedure such as for routine checks (e.g. monthly).
The Replace Geophone Analysis is used when one of the geophones is replaced without an
immediate Reference calibration. In the Replace Geophone Analysis, the response of the
replacement geophone is not included in the computation of the overall average mean response
of all geophones.
calibration
The Reference-Relative
performed
Calibration is designed to be used for the relative
in conj_r:=tion with the SHRP Reference
calibration procedure.
This
analysis option computes the average new gain setting for a series of three tests.
The program is written in Microsoft _ QuickBasic TM 4.5. It uses a proprietary file selection
routine written by PCS/LAW
Engineering.
It also utilizes commercial
Crescent Software for the menu's and windows. A listing of the FWDCAL
routines written by
Version 2 program
is presented in Appendix B. The routines from Crescent Software are not included in the listing.
All of the analyses follow the same basis steps which consist of FWD data file input,
gains table, latin square ANOVA, summary statistics, and program output. These topics are
described in the following sections.
FWD Data File Input
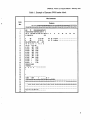
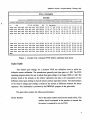
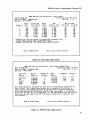
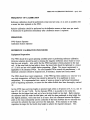
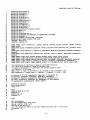
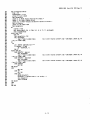
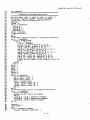
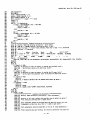
Each Dynatest FWD data file consists of header information and data block(s).
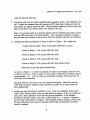
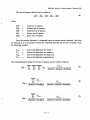
The first
37 lines of the Dynatest data file contains the header information. An example is shown in Table
1. The second part of the data file, known as the data block, consists of the loads, deflections,
temperatures
and station information. A data file can contain multiple data block sets, referred
to as data sets, in a file that contains only one header block.
4
:
FWDCAL
Version 2, Program Manual - February 1992
Table 1. Example of Dynatest FWD headerblock.
File Contents
Line
No.
Column
111111111122222222223333333333444444444455555555555666666666([(H([[[(8
123456769_123456789_123456789_123456789_123456789_123456789_123456769_123456769_
I
2
3
4
5
6
7
8
9
10
11
12
13
14
15
16
17
18
19
20
21
22
23
24
25
26
27
R80
73
8906065806068936F10
700031018002-05875568.6303111 6
150 0
203 305 457 610 914 1524 5.9
C:\Ftdl)\DATA\
.Fkl)
26
....o...**....*o°°.............,
29
30
31
32
33
16388 -4839
0
........
32 0
......
123P45676P90123P45676P90123P65678P90123P45678S
..................................
DDDP44444P44464P44444P_6444P_444_P44444P44444P1111111111111111114444444444444444
.........................................................
..... ..................
********************************************************************************
35
..._-.*_.._._--._-_---_.°__-_-_..._..-__.
36
37
RELATIVECALIBRATION
............
*
S
-28
2723 38
S
-28
2723 74
808.207227303730-.005
-.005
18 15 3.5 5
2
15 2
8
Ld 110
1.014 92
01 801
.967 1.059
02 802
.986 1.093
D3 803
.985 1.066
D4 804
.983 1.045
D5 805
.985 1.126
D6 806
.981 1.108
D7 807
.983 1.059
DO 808
1
1.079
DO 609
1
1.069
DO 810
1
1.130
OPERATOR
NAME
11020600........................
0
0
0
0
...............
*
0
80
80
73
73
8
12
18
24
36
60
Heights ............................
Heights ............................
*
5
FWDCAL Version 2, Program Manual - February 1992
The program is terminated if any of the following conditions are found during the checks
performed on the header block:
•
The Dynatest FWD operating software is not either edition 10 or 20.
•
If the number of sensors is not equal to 7.
•
If there are less than 46 total active drops indicated on line 30. The number of active
drops is determined by the column number of the first period (.) found on line 30.
•
If there are not 5 repeat drops for each drop set.
Other information determined from the header block and used by the program include:
•
Units for data collection, English or Metric
•
Data collection date
•
FWD serial number
•
Deflection sensor gain settings
•
Operators' names
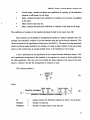
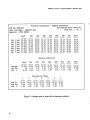
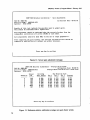
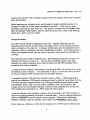
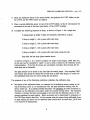
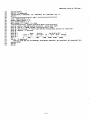
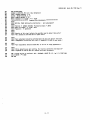
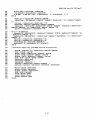
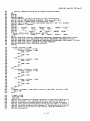
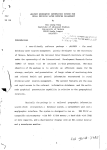
The FWD data block consists of a repeating series of lines defining the test sequence of
five repeat drops for each position arrangement.
The first line in the data block identifies the
location (station) of the test, the character "S" always occupies the first column in this line. The
lines following are the data recorded for each drop. If English units are used, the load and
deflection data are written twice on the same line, once in metric and then in English units. If
metric units are used, only the metric measurements are present. An excerpt from a Dynatest
FWD relative calibration data block in English units is shown in Figure 1.
6
FWDCAL
Version 2, Program Manual - February 1992
File Contents
Column
11111111112222222222333333333344444444445555555555566666666677777777778
123456789_123456789_123456789__23456789_123456789__23456789_123456789__23456789_
S
73
Heights
1596
441
-28
443
442
443
27
443
23
442
I61626
441
25360
80
17.37
17.44
17.40
............................
17.43
17.42
17.42
17.38
1580
452
452
452
452
451
452
452
25104
17.78
17.78
17.78
17.79
17.77
17.80
17.79
1593
459
460
460
460
460
460
459
25312
18.07
18.12
18.11
18.12
18.12
18.10
18.07
1586
465
467
466
466
467
466
465
25208
18.31
18.37
18.35
18.36
18.38
18.36
18.32
1434
512
512
515
513
512
512
512
22784
20.16
20.15
20.26
20.18
20.17
20.16
20.16
1407
508
510
510
510
510
509
509
22360
20.00
20.07
20.09
20.06
20.09
20.03
20.04
1381
505
504
506
505
505
504
505
21936
19.88
19.86
19.93
19.90
19.87
19.86
19.88
1380
1365
503
503
502
503
506
505
503
503
502
504
503
503
503
503
21928
21696
19.79
19.79
19.77
19.81
19.93
19.88
19.82
19.82
19.78
19.82
19.81
19.81
19.80
19.80
EOF
Figure 1. Excerpt from a Dynatest FWD relative calibration data block.
Gains Table
The relative gain settings for a Dynatest FWD are multipliers used to refine the
deflection sensor calibration.
The manufacturer generally sets these gains to 1.000. The FWD
operating program allows the user to adjust these gain settings in the range 0.980 to 1.020. The
primary result of the analysis on the relative calibration test data is the computation of new
deflection sensor gain settings so that all sensors produce equivalent results. The determination
of the need to change gain settings is based on the amount of difference between the sensor
responses. This information is provided by the FWDCAL program in the gains table.
The gains table contains the following information:
Sensor Number
-
This is the sensor number read from the header block. This
number should correspond to the position or channel that
the sensor is connected to on the FWD.
7
FWDCAL Version 2, Program Manual - February 1992
Sensor Serial Number
This is the sensor serial number read from the header
block. Each sensor has an serial number assigned by the
manufacturer. This number is used by the FWD operating
program to determine the proper processing parameters for
each sensor.
Existing Gain Factor
-
This is the current gain setting read from the header
block.
Means Ratio
This is the computed ratio of the average response of all
sensors to the response
of each individual
sensor.
A
tolerance range is set for this number to indicate the need
for adjustment of the gain factor.
New Relative Gain
This is the new relative gain factor computed from the
results of the test. This is the number that would be entered
into the FWD operating program if the gain factors need to
be changed.
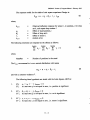
The overall mean deflection response is computed as follows,
o=E i=, k=,
E E
t_,
(NumSens xNumSets x NumReps)
where,
_'o
NumSens
=
=
average deflection for all sensors.
Number of sensors, 7 for SHRP FWD.
NumSets
=
Number of drop sets, 7 for SHRP relative calibration test. This
should be equal to the number of sensors and number of positions
in the stand.
8
NumReps
=
Number of repeat drops for each drop set, 5 for SHRP relative
calibration test.
_ua
=
deflection for sensor i, drop set k, and repeat drop l.
FWDCAL Version 2, Program Manual - February 1992
The mean deflection response for each sensor is computed as,
Nt,r,,s_ N,an_
Xi =
E
_ 1
E
tz1
/i'k'
(NumSets x NumReps)
(2)
where,
X_
=
Average deflection for sensor i.
The means ratio for each sensor is,
(3)
Ri=
Xi
where,
R_
=
The means ratio of sensor i.
The new relative gain factor is computed as,
=
×g
(4)
where,
Gma)
=
The new relative gain factor for sensor i.
Gvea)
=
The existing relative gain factor for sensor i.
The values of the means ratio are compared against a tolerance range of 1.000 + 0.003.
If the means ratio fails outside of this range a YES is displayed in the out of limit tolerance
column in the gains table. The new relative gains are compared against a range from 0.980 to
1.020, which corresponds to the manufacturer's
specified 2% tolerance. If a new relative gain
value falls outside of this range, a YES is displayed in the out of limit 2 % range column. The
other messages displayed by the program are discussed in the program output portion of this
document.
FWDCAL Version 2, Program Manual - February 1992
It is important to note that the geophones on a Dynatest FWD must be in the position
indicated in the FWD operating software. If the position of a geophone is switched on the FWD
a change must be made in the geophone set-up table in the operating program. Otherwise the
program will use the wrong gain and amplification factors for the geophone.
Latin Square ANOVA
The SHRP relative calibration procedure was designed in such a way that a statistical
analysis of variance (ANOVA) procedure
could be run on the results. The purpose of this
procedure is to provide a tool for evaluating the validity of the relative calibration test and as
an aid in interpreting its results. The results of the ANOVA indicate only statistical significance
relative to the amount of unexplained
variation present in the data set. By themselves, the
ANOVA results do not necessarily indicate the need for a sensor gain change,
that a test was
not valid, or that a repeat test is needed. The ANOVA results must be evaluated relative to the
information provided in the gains table and the summary statistics. Statistical significance in the
ANOVA results do not necessarily imply engineering
significance.
In the Latin Squ_:: ANOVA of the relative calibration test, F statistics are computed for
each main effect (position, set, and sensor). The computed F values are compared to the critical
F statistic (2.14 corresponds to the 5% confidence level). Ifa computed F values is less than the
critical F statistic, then the the effect is judged not to be statistically significant. If the computed
F value is greater than the critical F statistic, then the effect is indicated as being statistically
significant and instructional messages are displayed in the output. These messages are based the
results of both the gains table and the ANOVA. These messages are discussed in the program
output portion of this document. The details of the Latin Square experiment design layout and
computations are presented in Appendix C.
Summary Statistics
A following summary statistics are produced by the program to aid in interpretation of
the relative calibration test results.
10
*
Mean deflection of each sensor and the average for all sensors for each drop set.
•
Mean, standard deviation and coefficient of variation of each sensor for all drops.
__
FWDCAL
•
Version 2, Program Manual - February 1992
Overall mean, standard deviation and coefficient of variation of the deflection
response of all sensors for all drops.
•
•
Mean, standard deviation and coefficient of variation of all sensors by position
in the stand.
•
Mean load for each drop set.
•
Mean, standard deviation and coefficient of variation of the load for all drops.
The coefficient of variation is the standard deviation divided by the mean times 100.
These statistics can be helpful in interpreting the results of a relative calibration test. For
example, the systematic variation in the load between drop sets can be directly observed. This
can be the cause for the significance of drop set in the ANOVA. The cause for some anomalous
results can also be easily identified. For example, it is easy to detect if effect of one out of range
sensor on the overall mean is causing another sensor to be indicated as out of range.
A test is performed on the significance of the variance between deflection sensors. This
test is performed to determine if the variation in the response of a sensor is much greater than
the other geophones. This can occur even though the mean response is the same as the other
sensors. Cochran's
test for the homogeneity of variances is used.
The Cochran statistic is
g =
Largest S2
N,,,,,s_
(5)
E
i=I
where
(NumSetsxNumReps) __,
$2
___ 5,kt
NumSe_ Numl_ps 2
k=l
l=l
=
-
_
INu_ets
\ k=l
NumReps
1=1
6,k
(6)
112
(NumSets x NumReps)(NumSets x NumReps - 1)
S_
=
sample variance for deflection response of sensor i for all drops.
NumSets
=
Number of drop sets.
NumReps
=
Number of repeat drops in each drop set.
11
FWDCAL Version 2, Program Manual - February 1992
To determine significance the computed g value is compared against the critical g,,. If g
> g,, then the hypothesis of equal variances is rejected. For 7 sensors and 35 measurements,
g0.0s = 0.2326. This procedure provides a test on the homogeneity of the sensor variance and
also provides an indication of which sensor has the greatest variance. The results of this test are
only printed if the computed g value is in the critical region.
t
Program Output
The program output is organized into the following screens/pages:
•
*
Gains Table
ANOVA Table
*
*
Deflection Input Data
Summary Statistics
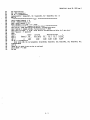
An example of the four page output file from the program is shown in Figures 2 - 5. The
output file created by the program has a name that consists of the original data file name with
an extension of the form ".Cx_/', where:
x =
indicates the type of analysis:
S for standard analysis,
G for replace geophone analysis, and
R - for Reference-relative calibration
,/ =
the last character in the data file name extension, for example it would be
the (1) in the file name 59092289.RC1.
The program writes the output files to the same directory as the FWD data files specified in
Control Screen 1. This file can be printed external from the program using the DOS PRINT
command or by importing it into a text editor or word processing program and then printing.
The following information read from the input data file header block is printed on every
page:
•
*
*
FWD Serial Number
Data of Calibration
Data File Name
•
•
Operator Name
Data Set # of #. This indicates the data set number when multiple data blocks are
included in a file with only one header block. For a single data set in the file, Data Set
1 of 1 will be displayed.
12
__
FW
SBRP
FWD
SN:
Data
File
Calibration
- Gains
Name
: 61053191.RC3
Date:
Data
Set
05-31-91
1
of
Existing
S/N
Gain
Means
Factor
New
Ratio
Relative
Out
Gain
of
Tolerance
Limit
2% Range
1
840
0.986
1.0011
0.987
2
838
0.990
0.9961
0.986
3
833
0.989
1.0015
0.990
G
834
0.990
1.0030
0.993
YES
NO
5
835
0.993
1.0018
0.995
NO
NO
6
3013
0.994
0.9980
0.992
NO
NO
7
837
0.993
0.9985
0.992
NO
NO
* Warning:
Verify
At
* RESULTS
Results
this
This
should
Gain
adjustment
independent
be
one
results
INDICATE
of
sensor
with
THAT
FWD
adjusting
to
Relative
test
indicate
confirmed
with
be
should
any
confirm
outside
SENSOR
SHRP
should
is
additional
THE
calibrations
adjustments
repeated
least
these
1
SMITE
Sensor
#
Table
Calibration
: RICK
Sensor
After
Relative
8002-061
Operator
Gain
FWD
AL Version 2, Program Manual - February 1992
be
possible
a repeat
within
gain
setting,
that
all
SHOULD
Calibration
the
made
tolerance
need
NO
NO
NO
limit.
RESET.
to
adjustments
adjust
the
gains.
test.
the
+/-
0.002
the
BE
- Gain
when
ONLY
sensors
NO
tests!
GAINS
performed
are
the
NO
YES
to
the
New
Gain
Factors
of
each
other.
out
relative
are
within
of
range
calibration
for
two
geophone(s).
test
must
be
tolerance.
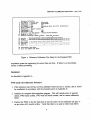
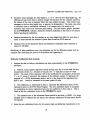
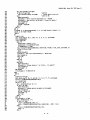
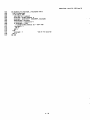
Figure 2. Example print of output file for the Gains Table.
13
FWDCAL
FWD
SHRP
8002-061
SN:
Data
File
Operator
Gain
the
Name
Calibration
- Latin
Square
ANOVA Table
Calibration
Date:
: 61053191.RC3
: RICK
Data
1
of
SMITH
Sum
Squares
Position
9.40E-02
6
1.57E-02
0.43
2.14
Set
1.96E+00
6
3.26E-01
8.88
2.14
of
Degrees
of
Mean
1.97
2.14
Freedom
Computed
Square
Sensor
4.34E-01
6
7.23E-02
Error
8.29E+00
226
3.67E-02
TOTAL
1.08E+01
244
adjustments
level.
are
'Set'
of
confirm
the
indicated,
and
significance
materials
the
buffers
need
more
for
than
FWD
gain
1 mil
drop
may
pavement
conditioning
drops
vary by
new location.
be
during
with
adjustments.
(25.4
set
due
50
is
to
the
statistically
warming
test.
drops
If
microns),
the
from
of
the
A repeat
height
deflections
repeat
Critical
f
the
f
significant
buffers
at
or
calibration,
3,
is
from
calibration
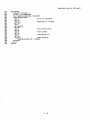
Figure 3. Example print of output file of the ANOVA Table.
14
05-31-91
Set
Source
consolidation
to
Relative
Variation
5%
after
FWD
Version 2, Program Manual - February 1992
required
the
last
at
a
10
1
FWDCAL
Relative
FWD SN: 8002-061
Data File Name
: 61053191.RC3
Operator
: RICK
Set
#
Calibration
-
Version 2, Program Manual - February 1992
Input
Data
Calibration
Date:
Data Set
05-31-91
1
of
1
SMITH
Drop
#
Load
ibf
Dr1
Deflections,
Dr2
Dr3
0.001
Df4
inches
Dr5
[mils]
Dr6
Dr7
1
1
1
1
1
2
3
4
22,064
22,088
22,032
22,032
18.12
18.12
18.50
18.07
18.22
18.13
18.59
18.09
18.05
18.05
18.47
18.05
18.00
17.96
18.46
17.96
18.04
18.04
18.54
18.04
18.09
18.09
18.52
18.09
18.10
18.10
18.53
18.10
1
5
22,088
17.99
17.97
17.96
17.83
17.91
17.91
17.98
2
2
2
2
2
1
2
3
4
5
22,080
22,048
22,088
22,040
22,008
18.63
18.24
17.95
18.03
18.29
18.68
18.30
18.01
18.09
18.38
18.60
18.26
17.96
18.05
18.30
18.58
18.17
17.83
17.92
18.17
18.54
18.12
17.83
17.95
18.21
18.61
18.22
17.95
18.00
18.30
18.62
18.23
17.93
18.06
18.32
3
3
3
3
3
1
2
3
4
5
22,048
22,136
21,984
22,152
22,048
18.07
18.58
18.29
17.99
17.99
18.22
18.80
18.51
18.18
18.18
18.09
18.68
18.34
18.05
18.05
18.08
18.67
18.33
18.00
18.00
18.04
18.67
18.29
18.00
18.00
18.09
18.74
18.39
18.09
18.04
18.15
18.71
18.36
18.06
18.10
4
4
4
4
4
1
2
3
4
5
22,048
22,104
22,000
22,072
21,992
18.54
18.71
18.24
18.37
18.16
18.63
18.84
18.34
18.47
18.26
18.55
18.77
18.22
18.39
18.17
18.58
18.75
18.25
18.42
18.17
18.50
18.71
18.21
18.42
18.12
18.61
18.79
18.35
18.48
18.30
18.58
18.75
18.28
18.45
18.19
5
5
5
5
1
2
3
4
22,072
22,000
21,984
22,048
18.12
18.29
18.16
18.12
18.22
18.34
18.30
18.22
18.09
18.30
18.17
18.17
18.17
18.33
18.25
18.21
18.08
18.25
18.16
18.12
18.22
18.35
18.26
18.26
18.19
18.36
18.28
18.23
5
5
22,000
18.33
18.43
18.30
18.42
18.29
18.44
18.41
6
6
6
6
6
1
2
3
4
5
22,040
22,080
21,984
21,952
21,928
18.12
18.20
18.29
18.41
18.07
18.22
18.22
18.30
18.43
18.09
18.05
18.09
18.22
18.34
18.01
18.04
18.12
18.17
18.33
17.96
18.16
18.12
18.25
18.37
18.04
18.17
18.22
18.30
18.44
18.13
18.15
18.19
18.32
18.41
18.06
7
7
7
7
7
1
2
3
4
5
22,008
22,008
21,920
22,032
21,952
18.12
18.03
18.33
18.29
18.20
18.22
18.13
18.38
18.43
18.30
18.13
18.01
18.30
18.26
18.17
18.04
17.96
18.25
18.21
18.12
18.25
18.12
18.37
18.42
18.29
18.22
18.17
18.39
18.39
18.30
18.19
18.15
18.36
18.41
18.28
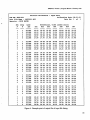
Figure 4. Example print of output file of input file listing.
15
FWDCAL
Relative
FWD
SN:
Data
Calibration
Version 2, Program Manual - February 1992
- S,mmary
8002-061
File
Operator
Name
Statistics
Calibration
: 61053191.RC3
: RICK
Date:
Data
Set
1
of
SMITH
Load
Dfl
Df2
Df3
Dr4
Dr5
Dr6
Df7
Dfl-7
Set
1 Avg
22,061
18.16
18.20
18.12
18.04
18.11
18.14
18.16
18.13
Set
2 Avg
22,053
18.23
18.29
18.23
18.13
18.13
18.22
18.23
18.21
Set
3 Avg
22,074
18.18
18.38
18.24
18.22
18.20
18.27
18.28
18.25
Set
4 Avg
22,043
18.40
18.51
18.42
18.43
18.39
18.51
18.45
18.44
Set
5 Avg
22,021
18.20
18.30
18.21
18.28
18.18
18.31
18.29
18.25
Set
6 Avg
21,997
18.22
18.25
18.14
18.12
18.19
18.25
18.23
18.20
Set
7 Avg
21,984
18.19
18.29
18.17
18.12
18.29
18.29
18.28
18.23
Overall
Average
Std Dev
COV,
Dfl
Df2
Df3
Df4
Dr5
Dr6
Df7
Dfl-7
22,033
54
18.23
0.19
18.32
0.21
18.22
0.20
18.19
0.23
18.21
0.21
18.28
0.21
18.27
0.20
18.25
0.210
0.25
1.06
1.13
1.12
1.27
1.16
1.15
1.09
1.15
%
Position
Avg
Std
COV,
Df
Dev
%
Statistics
Load
1
2
3
in
Stand
4
5
6
7
18.22
0.23
18.22
0.21
18.24
0.22
18.28
0.20
1.24
1.16
1.20
1.12
--_n--1
--l--l--
mll--_
l--m--1
18.26
0.20
18.25
0.20
18.25
0.22
1.09
1.09
1.22
Figure 5. Example print of output t-de of summary statistics.
16
05-31-91
1
FWDCAL Version 2, Program Manual - February 1992
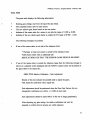
Gains Table
The gains table displays the following information:
•
Existing gain settings read from the input file data block.
•
The computed means ratio for each sensor.
•
The new relative gain factor based on the test results.
•
Indicates if the means ratio for a sensor is out side the range of 1.000 + 0.003.
•
Indicates if the new relative gain factor is outside the 2% range of 0.980 - 1.020.
The following messages are printed:
•
If one of the means ratios is out side of the tolerance limit:
* Warning: At least one sensor is outside of the tolerance limit.
Verify these results with an additional test!
RESULTS INDICATE THAT THE SENSOR GAINS SHOULD BE RESET.
•
If one of the means ratios is outside the tolerance range then the following message is
shown on a separate screen displayed after the ANOVA output screen and is printed on
the gains table in the output file:
SHRP FWD Relative Calibration - Gain Adjustment
Results of this test indicate the possible need to adjust the gains.
This should be confirmed with a repeat test.
Gain adjustment should be performed when the New Gain Factors for two
independent calibrations are within +/- 0.002 of each other.
Gain adjustments should be made ONLY to the out of range geophone(s).
After adjusting any gain setting, the relative calibration test must be
repeated to confirm that all sensors are within tolerance.
17
FWDCAL
•
Version 2, Program Manual - February
1992
If one of the New Relative Gain factors are outside the 2 % range:
* Warning: At least one sensor is outside the 2% range limit.
Notify Supervising Engineer after verifying with additional tests!
•
If the replace sensor analysis is selected, and if the means ratio is outs_cle the tolerance
range, then for the replaced sensor:
* Means Ratio for Sensor No. #### is outside the tolerance range.
* New Relative Gain for REPLACED
Sensor No. #### is ?.???
Where the serial number is indicated as #### and the new gain factor ?.??? in the
example message above)
•
If the replace sensor analysis is selected, and if the means ratio is inside the tolerance
range, then for the replaced sensor (indicated as #### in the example message below):
* Means Ratio for Sensor No. #### is within the tolerance range.
* New Relative Gain for Sensor No. #### is ?.???
An example gains table output is displayed in Figure 2.
In these messages,
the user, who is assumed to the FWD operator, is advised to contact
the supervising engineer prior to making any gain changes. This serves to notify the responsible
supervisor that the results of the tests indicate that the gains need to be adjusted and to provide
a check on the determination of the new gain factors to be input into the FWD operating
computer program. The gains table is the primary determinant of the need to change gains.
Because it is possible to obtain abnormal results from a single test, if a gain change is indicated
then it is prudent to verify the results with another test. The resulting new relative gain factor
from the two te._ts should be in close agreement. If inconsistent results are obtained, then
additional tests should be performed
after sources for the inconsistencies
are investigated.
Significant or frequent changes in the gain factors may indicate the need for a Reference
calibration or the presence of abnormalities
18
in the FWD electronics.
FWI_AL Version2, ProgramManual- February1992
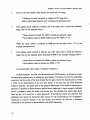
ANOVA
Table
For each source of variation, the ANOVA table displays the following information:
•
Sum of squares
•
Degrees of freedom
•
Mean Square
•
•
Computed F
Critical F
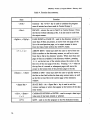
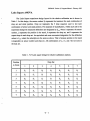
The messages printed on the ANOVA table are conditional on the results of the tolerance
checks in the gains table and the significance of the variation sources determined
in the
ANOVA. For each combination of results a separate message is printed as specified in Table
2 for situations when all of the means ratios are within tolerance, and Table 3 when a means
ratio is outside the tolerance range. In these tables, a Y indicates the effect was significant.
The message shown in Table 2 instructs the user to contact the supervising engineer if
the situation occurs where the means ratios are within the tolerance limits for all sensors and
sensor, set, and position are all significant. This unlikely situation can occur when the mean
square error term has a very small value, less than 1.0 x 10³. The data set should be reviewed
for potential anomalies. It can be expected that in this situation the coefficient of variation for
all deflections will be less than 0.5 %. If very good repeatability (low coefficient of variation)
is found between sensors and all measurements, then the calibration should be accepted as valid
and no changes made to the gain factors.
An example ANOVA Table output produced by the program is shown in Figure 3.
19
FWDCAL Version 2, Program Manual - February 1992
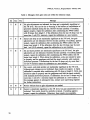
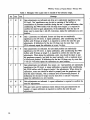
Table 2. Messages when gain ratios are within the tolerance range.
Y
N
N
No gain adjustments are indicated, but drop set is statistically significant at
the 5 % level. This can be due to warming of the buffers or consolidation of
pavement materials during the test. Review the data carefully. If anything
appears suspect, repeat the calibration after conditioning the FWD buffers
with 50 drops from height 3. If the deflections from the last 10 drops vary by
more than 1 rail (25.4 microns), repeat the calibration at a new location.
Y
Y
N
Sensor and drop set are statistically significant at the 5 % level, but gain
adjustments are not indicated. Review the data carefully. If anything appears
suspect, repeat the calibration after conditioning the FWD buffers with 50
drops from height 3. If the deflections from the last 10 drops vary by more
than 1 rail (25.4 microns), repeat the calibration at a new location.
Y
N
Y
Set and stand position are statistically significant at the 5 % level, but gain
adjustments are not indicated. Examine the data carefully. If anything appears
suspect, repeat the calibration after conditioning the FWD buffers with 50
drops from height 3. When doing the calibration, extra care should be taken
to properly seat the geophones and hold the stand vertically with moderate
downward pressure. If deflections for the last 10 drops vary by more than 1
mil (25.4 microns) repeat the calibration at a new location.
Y
Y
Y
Set, sensor, and stand position are statistically significant at the 5 % level.
Although gain changes are not indicated, these results are suspect. A repeat
calibration is required after conditioning with 50 drops at height 3. Extra care
should be taken to properly seat the geophones and hold the stand vertically
with moderate downward pressure. If deflections for the last 10 drops vary by
more than 1 nail (25.4 microns) repeat the calibration at a new location. If
this message appears in subsequent tests, contact your supervising engineer
for further instructions.
N
N
N
Results indicate that no gain adjustments are needed.
N
Y
N
Sensor is statistically significant at the 5 % level, but gain adjustments are not
indicated. Test results should be carefully reviewed. If anything appears
suspect, repeat the calibration. Otherwise, these results are acceptable.
2O
-'
FWDCAL Version 2, Program Manual - February 1992
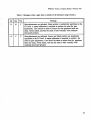
Table 2. Messages when gain ratios
are within the tolerance range (Contd.).
Set
Sen
Pos
Message
N
N
Y
Gains do not needed to be adjusted, but stand position is statistically
significant at the 5 % level. This may be caused by failure to keep the stand
vertical, or improper seating of the geophones. In the future, care should be
taken to ensure that the geophone bases are clean and well seated, and the
stand is kept vertical with moderate downward pressure.
N
Y
Y
Sensor and stand position are statistically significant at the 5% level, but gain
adjustments are not indicated. Review calibration results carefully. If anything
appears suspect, repeat the calibration, taking care to ensure that geophone
bases are clean and properly seated, and the stand is kept vertical with
moderate downward pressure.
21
FWDCAL Version 2, Program Manual - February 1992
Table 3. Messages when a gain ratio is outside of the tolerance range.
Senl
Y
N
N
Gain adjustments are indicated and drop set is statistically significant at the
5% level. 'Set' significance may be due to warming of the buffers or
consolidation of pavement materials during the test. A repeat calibration, after
conditioning the FW buffers with 50 drops from height 3, is required to
confirm the need for gain adjustments. If the deflections from the last 10
drops vary by more than 1 mil (25.4 microns), repeat the calibration at a new
location.
Y
Y
N
Gain _justments are indicated. Sensor and drop set are statistically
significant at the 5 % level. A repeat calibration, after conditioning the FWD
buffers with 50 drops at height 3, is required to confirm the need for gain
adjustments. If deflections for the last 10 drops vary by more than 1 mil
(25.4 microns) repeat the calibration at a new !oc_tion.
Y
N
Y
Gain adjustments are indicated. Set and stand position are statistically
significant at the 5% level. A repeat calibration, after conditioning the FWD
buffers with 50 drops at height 3, is required to confirm the need for gain
adjustments. When doing the calibration, extra care should be taken to seat
the geophones properly, and hold the stand vertically, with a moderate level
of downward pressure. If deflections for the last 10 drops vary by more than
1 mil (25.4 microns) repeat the calibration at a new location.
Y
Y
Y
Gain adjustments are indicated. Set, sensor, ant,! _tand position are statistically
significant at the 5 % level. A repeat calibration is required after conditioning
the FWD buffers with 50 drops at height 3 for adjustments. When doing the
calibration, extra care should be taken to properly seat the geophones, and
hold the stand vertically, with a moderate level of downward pressure. If
deflections for the last 10 drops vary by more than 1 mil (25.4 microns)
repeat the calibration at a new location.
N
N
N
Gain adjustments are indicated. A repeat calibration is required to confirm the
need for adjustments.
N
Y
N
The gain ratios and the statistical results indicate that gain adjustments are
needed. A repeat calibration is required to confirm the need for gain
adjustments.
22
Setl
Pos I
Message
FWDCAL Version 2, Program Manual - February 1992
Table 3. Messages when a gain ratio is outside of the tolerance range (Contd.).
J
Set
Sen
Pos
Message
N
N
Y
Gain adjustments are indicated. Stand position is statistically significant at the
5 % level. A repeat calibration is required to confirm the need for gain
adjustments. Care should be taken to ensure that the geophone bases are
clean, firmly seated, and that the stand is held vertically with moderate
downward pressure.
N
Y
Y
Gain adjustments are indicated. Sensor and Stand position are statistically
significant at the 5 % level. A repeat calibration is required to confirm the
need for gain adjustments. Care should be taken to ensure that the geophone
bases are clean, fLrrnly seated, and that the stand is held vertically with
moderate downward pressure.
23
FWDCAL Version 2, Program Manual - February 1992
Deflection Input Data
An echo listing of the deflection and load data read as input is provided to assure the user
that the information was correctly read. This information is included only in the output file and
is not accessible while running the FWDCAL program. An example listing of the deflection
input data is shown in Figure 4.
Summary
Statistics
An example of the summary statistics output is shown in Figure 5. This information is
only included in the output file and is not accessible while running the program.
24
FWDCAL Version 2, Program Manual - February 1992
Program
Operation
J
The FWDCAL
is an interactive program which queries the user for the required
information. The user program control interface consists of the following screens:
Control Screen 1 - Select Analysis Type
Control Screen 2 - FWD Data File Selection
Control Screen 3 - Select Geophone Replaced
Control Screen 4 - Display Results on Screen
The following three output screens are produced which display the results of the analysis
and user messages:
Output Screen 1 - Gains Table
Output Screen 2 - ANOVA Table
Output Screen 3 - Gain Change In_ructions
Output Screen 4 - Average New Gain Factors
These screens plus instructions on program installation and starting are discussed in the
following sections.
Program Installation and Starting
The program is self contained in the fde FWDCAL2.EXE.
The program is not copy
protected. The basic hardware requirement is an IBM ®Personal Computer or IBM®-Compatible
computer with at least 384 kilobytes (K) of available memory and minimum of 360K disk-drive
capacity. A hard disk and 640K of memory are recommended. The program must be run under
the DOS environment.
Two copies of the program should be made on two other disks to serve as a working and
intermediate
backup. The program distribution disk should be stored with other computer
software backups. For a computer with a hard disk, the installation process consists of copying
25
FWDCAL Version 2, Program Manual - February 1992
the program onto the desired directory or subdirectory. This can be done by using the change
directory command to make the destination directory the current directory. Then issuing the
DOS command:
'
COPY < drive> :FWDCAL2.EXE/V
-'
where
<drive>
FWDCAL2.EXE
corresponds
to the floppy
program file. The/V
disk drive
containing
the disk
with
the
switch verifies that the program was properly copied.
The program can be started by typing:
< Drive >: < Path >
FWDCAL2
where,
< Drive>:
Specifies the name of the hard disk drive or floppy disk drive
containing the FWDCAL2.EXE
< Path >
program file.
Specifies the route the computer is to follow through the directory
structure
to
FWDCAI.,2.EXE
locate
the
directory
contains
the
program file.
If the current directory contains the FWDCAL2.EXE
file, or if the directory containing
the program is included in the PATH statement in the AUTOEXEC.BAT
be started by typing FWl)CAL2
which
file, the program can
at the command prompt.
Since the directory that the program is started from becomes the default directory in the
FWD Data File Selection screen, Control Screen 2, it is convenient to start the program from
the directory and or disk drive containing the FWD data file.
26
FWDCAL Version 2, Program Manual - February 1992
Control
;
Screen
1 - Select
Analysis
Type
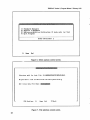
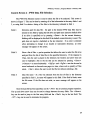
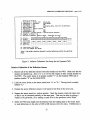
Control screen 1 is used to select the analysis type the program will run or can be used
to exit the program after completing an analysis. This screen is shown in Figure 6. To select the
desired analysis press the up and down arrow keys to highlight the desired choice and then press
the <Enter>
key. The <Home>
and <End>
keys can be used to jump to the first or last
choice on the menu, respectively. The analysis types are:
Standard Analysis
-
The standard analysis is for use in interpreting the
results of routine relative calibration tests not
conducted in conjunction
calibration test.
Replace a Geophone
-
with
the
Reference
This analysis is used when one of the geophones is
replaced or in the instance that the user wishes to
exclude the effect of a specified geophone from the
computation of the overall mean deflection response.
In this analysis the response of the replacement
geophone is not included in the computation of the
overall average mean response of all geophones.
Reference-Relative
Calibration
-
This analysis is designed to be used for the relative
calibration performed in conjunction with the SI-IRP
Reference
calibration
procedure.
This
analysis
option computes and displays the new relative gain
factor for a series of three tests and the average gain
factor from the tests. All three data blocks for the
tests must be contained in the same file.
The standard analysis and replace geophone analysis can be run on data fries containing
1, 2, or 3 data blocks in the same file. After the analysis type is selected, the program reads the
data file. If multiple relative calibration data blocks are found, the program displays a message
indicating how many data blocks were found. For data files containing multiple data blocks, the
program simply cycles through the program and treats each data block separately. The results
are written to the same output file.
27
FWDCAL Version 2, Program Manual - February 1992
1) Standard
flnalysis
Z) _eplacc
a Gcophonc
3) _cfcz'el_cc-RclaLioc
4) quit
Program
Caiibr_tioo
Eater
t_
Home
(3 da_a
Selection:
scts
in
file)
1
End
Figure 6. Select analysis control screen.
.......................................................................
__'
Do you _.nt
s. list
of data files
:_-_'-_
for
this
path
ii
ii
(Y/M)
g
jj
.................................
De:£}._ctio,z
D_ta
File
Mame: _
i!
!i
FI_ : Coot i ntte
1"$
}lo=e
ETtd
F? : qt! it
Figure 7. File selection control screen.
28
J
FWDCALVersion2, ProgramManual- February1992
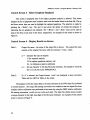
Control Screen 2 - FWD Data File Selection
The FWD File Selection screen is used to select the file to be analyzed. This screen is
shown in Figure 7. This can be done by entering all of the information in the entry fields 1 and
2, or using field 2 to obtain a listing of the fries in the directory indicated in field 1.
Field 1:
Directory path for data file - the path to the desired FWD data files may be
entered in this field by typing the full drive and path name (assumes default drive
if no drive is specified) or by pressing
<Enter>
for the current directory.
Nothing will be displayed in this field if the default current directory is used. The
path does not require a backslash as the last character.
If an error is detected
when attempting to change to an invalid or nonexistent
directory,
an error
message will appear on the screen.
Field 2:
Show a list of files - a yes/no question that allows the user to select the file to be
analyzed from the list of data files in the specified directory.
If the response is
(Y)es, then the user is placed in the directory list window and arrow keys are
used to highlight a file in the list that can be selected by pressing
(< Return > on some keyboards).
<Enter>
< PgUp > and < PgDn > can also be used to
move backwards or forwards one page at a time, where such a quantity of files
exists.
Field 3:
< Esc > allows the user to exit the file list without selecting a file.
Data file name - If a file was selected from the list of files in the directory
specified in field 1, its name will appear in this field. If the field is blank, enter
the file name. If the file does not exist, an error message will appear on the
screen.
Once the data file has been specified, use the <F10>
key to continue program operation.
The up and down arrow keys can be used to change between the entry fields. The < Home >
key can be used to jump to the first entry field and the <End>
key to the last field. The
< F7 > key can be used to terminate the program.
29
FWDCAL Version 2, Program Manual - February 1992
Control Screen 3 - Select Geophone Replaced
This screen is displayed only if the replace geophone analysis is selected. This screen
--
displays the list of geophone serial numbers read from the header block in the data file. The up
and down arrow keys are used to highlight the replaced geophone. The selection is made by
pressing the <Enter>
key. The user is also given the option of exiting the program or
indicating that no geophone was replaced. The < Home > and < End > keys can be used to
jump to the first or last entry in the menu, respectively.
An example of this screen is shown in
Figure 8.
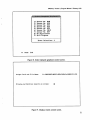
Control Screen 4 - Display Results on Screen
Field 1:
Output file name - the name of the output file is shown.
The output file name
consists of the original file name with the extension ".CxT/", where:
x =
indicates the type of analysis:
S for standard analysis,
G for replace geophone analysis, and
R - for Reference-relative calibration
7; =
the last character in the data file name extension, for example it would be
the (1) in the file name 59092289.RC1.
Field 2:
If a Y is entered, the Output Screens 1 and 2 are displayed to show the Gains
Table and the ANOVA Table on the screen.
The program writes the output fries to the same directory as the FWD data fries indicated
in Control Screen 1. The output file naming convention was created so that the output fries from
multiple relative calibration tests performed on the same day using the SHRP relative calibration
frie naming convention, would not over write each other. The input file should always contain
a unique character in the fight most digit of the file name extension. An example of this control
screen is shown in Figure 9.
30
_.
FWDCALVersion2, ProgramManual- February1992
,
1)
Sensor
No. 848
ii
2)
3)
Sensor
Sensor
,o.
14o. 838
833
!i
4)
S) Sensor
Sensor
11o.
Ho. 834
835
il
6) Sensor
_ensor
?)
Ho. 837
3813
No,
!j
s_ No Replacement
!i
9) quit PrograN
!i
Znter
T_
Home
Se Iect ion : 1
ii
End
Figure 8. Select replaced geophone control screen.
Output Path
0i_pla!j
end File
calibrat|.o_
Hams:
£e._ult_
ll:xLflM_UAGE_BflSIC_B_CH_RAJ_61853191.CS3
on screen:
Figure 9. Display results control screen.
31
FWDCAL Version 2, Program Manual - February 1992
Output Screen 1 - Gains Table
If a (Y)es is selected to display the results on the screen in field 2 on Display Results
._
Control Screen, then the Gains Table is displayed on the screen. In this screen, the user has the
option of press < Page Down > or < PgDn > to display the ANOVA Table, or < Esc > to exit
the output screens. An example of the Gains Table screen is shown in Figure 10. An explanation
of the information and summary of the user messages presented in the Gains Table is discussed
in the program output section of this document.
Output Screen 2 - ANOVA Table
The results of the ANOVA is displayed after the < PgDn > key is pressed in the Gains
Table screen. In this screen the user has the option of pressing
< PgUp > or < Page Up > to
return to the Gains Table screen, or < Esc > to exit from the result table screens. An example
of the ANOVA Table screen is shown in Figure 11. An explanation of the information
and
summary of the messages presented in the ANOVA Table is discussed in the program output
section of this document.
Output Screen 3 - Gain Change Instructions
This screen is always displayed if one of the means ratio for a sensor is outside of the
tolerance limit. The user is not given a choice of displaying this screen. To exit this screen, the
user must hit any key. The contents of this screen are shown in Figure 12.
Output Screen 4 - Average New Gain Factors
This screen is only displayed for the results of a Relative-Reference
type of analysis. This
screen shows the computed new relative gain factors for each of the three repeat relative
calibration tests, and the average of the tests. An example is shown in Figure 15.
32
..
FWDCAL
SHRP FWD Relative
F_ SM: 8BOZ--B6£
Data File Name : 61_53%91.BC3
Operator
: RICK SMITH
Sensor
#
Sensor
S/M
Exitisting
Gai_ Factor
B48
B38
833
834
835
38i3
837
8.986
8.990
0.$89
8.998
0,993
0.994
8,993
I
Z
3
4
5
6
7
Calibration
Hearts
Batio
-
Version 2, Program Manual - February 1992
Gai_s Table
Calibration Bate: B5--31.--51
Data Set
I of
I
O_t a£ Limit
Tolerance
2z Hange
He_
Relative Gain
1.8811
8.9S61
i.88i5
i.8838
1,8_18
8.9988
8.9985
8.587
8.986
8.990
8,993
8.995
8.992
8,992
NO
YES
HO
_ES
MO
NO
NO
NO
NO
NO
HO
NO
NO
_0
_arnlnff: Rt ]east one sensor is outside
the tolerance limit.
Ueri£N these results _itb an additional test_
RESULTS IBDICATE THAT THE SENSOE GAIHS SHOULD BE BESET,
FgDn to ANOU_ Table
Esc to exit results
screens
FigureI0.Gainstable
outputscreen.
SHRP FUD Relative
FRD SH: 8B82-861
Data File Ham,_ : 6185319_.BC3
Operator
: RICK SMI_!
Oariation
Source
Sum of
Squares
Position
Set
Sensor
Error
TOTAL
9.48E-82
1.96E_8
4.34E-_ql
B.29E+_lO
1.0BEll
-
Calihratio_
Degrees oF
Freedom
6
6
6
226
244
Latin Square
AHOV_ Table
Calibration
_ale: 85-31-91
Da_a Set
1 of
i
Mean
Square
Compuled
f
1.57E-6Z
3.Z6E-Bl
?.Z3E-4]Z
3.67E-B2
B.43
8,88
1.97
Critical
f
Z.14
Z.14
Z.14
Gain adjusgm_nis
are i_dicaled and drop set is statlsticallg
significant at
the 5x level. '_eg" slgni_icance maN be due to _.rmi_g of the bufEers or
consolidation
ot pauemcnt materials during
t}le test, A repeat
calibration,
a_ter con_Itioni_
the FWD bufEers _i_h 58 drops from height 3, is required
to confirm t_
need for gain adjustmeoks,
I£ the deflections
from the ]asi 18
_rop_
uar_
b_ more tl_an i mil (ZS.4 microns}, perform the calibration
at a
nee location.
FgUp to Gaius
Table
Esc to exit results
screens
Figure 1I. ANOVA table output screen.
33
FWDCAL
SHBP FWD Relative
Calibration
-
Version 2, Program Manual - February 1992
Gain
FWD SN: BBgZ-Sfit
Data File
Hame : 61853151.XC3
Operator : RICK $HITH
6ain
adjustments
si_oald
After
adjusting
ann
repeated
to confirm
§ain
that
_aee:
Calibration
Results of this test indicate
This should
be confirmed eith
Gain adjustment
should
indepe,_dent ealibra'tions
adjustmenes
the possible need
a repeat test.
be performed
are atthin
gains.
_en
the new gain
factors
_B.gBZ of each other.
be made OMLY to
the
out
setting,
the relatiue
all
sensors
are within
Press
to adjust
any
key
to
0£ range
calibration
tolerance.
0S-31-51
from
¢_
geophone(s),
test
s}tonld
be
continue
i
Figure 12. Sensor gain adjustment message.
SHRP FND Relative
F_D SH: 8882-86_
Data File Hame : T_MP3SET,RC1
Operator : lICK SMITH
Sensor
#
1
2
3
4
S
6
?
Sensor
S/H
8_8
838
833
034
835
3813
83?
Calibration
Gains
Table
Calibration Date:
05-88-91
Me.ans and Gains for 3 data Sets
Auerage
Existing
_ain
Factor
Set 1
_.586
8.$9B
8.58?
8.558
8,553
8.95_
8.993
8,551
8,587
8,952
8,951
_.951
_.551
8,_93
Press any keg to
Figure 13. Reference-relative
34
--- flverage
Hue Bela¢ive
fial_
Set 2
Set _
8.$51
8.587
8.SSZ
8,991
_.951
8,951
8,593
_.551
0,587
8,952
_.951
_.951
8.9_I
0.593
fluera_e
8.5SI
8.587
8.$52
8,551
B,SSI
8.551
_,993
continue
calibration average new gain factor screen.
FWDCAL Version 2, Program Manual - February 1992
Function Keys
Table 4 presents a summary of the action of selected function and control keys the
program uses in the various control screens. The function keys which are active are shown at
the bottom of each screen.
35
FWDCAL Version 2, Program Manual - February 1992
Table 4. Function key summary.
Keys
Function
<F10>
Continue - the <F10> key is used to continue the program
once all entries have been made in Control Screen 2.
< Esc >
ESCAPE - returns the user to field 2 in Control Screen 2 from
the file list without selecting a file. It is also used to exit from
the output screens.
< PgDn >, < PgUp >
PAGE DOWN or PAGE UP - used in the directory window if
more than 20 files are present, to move from one page of the
list to the next/previous page, or in output screens to move
from the Gains Table to/from the ANOVA Table.
< t >, < ; >
ARROW KEYS - these keys allow the user to move from one
field to another on the data entry screens, as well as to move
from file to file in the directory window. When more than one
page of files are available in the directory window, pressing
< _ > on the last row of the window places the cursor on the
first row of the next page of the list. Pressing < t > when on
the top line of a second or subsequent pages will move the
cursor to the bottom line of the previous page in the list.
< Home >,
< End >
HOME or END - these keys allow the user to quickly move to
the first or last field within the data entry screen menu, as well
as the first or last file in the current page of the directory
window.
< Space Bar >
SPACE BAR - the < Space Bar> key is used to exit the
various warnings or errors that appear at the bottom of the data
entry screen.
< CR >, < Enter >
< _ >
< F7 >
36
CARRIAGE RETURN or ENTER - used to accept a data input
value once it has been entered or selected.
QUIT - used to exit the program in the File Selection Screen.
-"
FWDCAL Version 2, Program Manual - February 1992
Anomalous Results
--
Depending on the results of the calibration analysis procedure, a number of scenarios exist
for the case of apparently "bad" or anomalous data. For all scenarios, the first two remedial
steps should consist of reviewing the echo print of the input data to identify any irregular or
unusual conditions. If a problem exists in the header block or data format, another possibility
might be to review the contents of the input file using a text editor and correct any format
inconsistencies and then repeat the analysis.
As suggested in the user messages contained in the ANOVA table, several possible
sources of abnormal results from the relative calibration test include:
:
•
Failure to keep the stand vertical with moderate downward pressure applied. This
typically results in position being statistically significant.
•
Systematic change in the applied load to the pavement. Typically the load will decrease
during the conduct of the test. This can be due to a change in the resiliency of the buffers
or a change in the pavement structure. Remedial actions include further "conditioning"
of the buffers with additional drops, or movement to a new location. This condition can
be detected by inspection of the change in the load level between drop sets and the
occurrence of set being statistically significant.
•
Failure to place the stand in the exact same point. This can result in set and/or position
being statistically significant.
•
Failure to properly set the geophones in the center of holders in the stand. Cleaning the
base of the geophones or greater care in setting them in the stand are two remedial
approaches.
•
Switching the position of the electrical connections, or "channels", of the geophones on
the FWD without making the change in the FWD computer operating program. For
example is sensor 7 is plugged into the channel 6 connection. In this case the operating
program will not use the correct gain and analogue to digital conversion factors for the
specific geophone. This is the reason why geophones can not be used on other FWDs
without a modification to the operating computer software from Dynatest. The position
of the geophone connections on the FWD should be compared against the positions shown
in the operating computer program.
•
Frayed, cracked or worn sensor wires and loose sensor connections can be a source of
inconsistent results. Care should be taken not to remove a geophone from its holder by
pulling on the lead wire since this can damage the connection.
37
FWDCAL Version 2, Program Manual - February 1992
Technical Assistance
If further technical assistance is required in the use of this program, please contact Cheryl
Richter at FI-IWA LTPP Division (703) 285-2.183 or Nichols Consulting Engineers, Reno
Nevada (702) 329-4955.
38
Appendix
A
SHRP FWD Calibration
Protocol
39
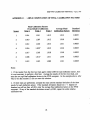
SHRP FWD CALIBRATION
:
April
PROTOCOL
1993
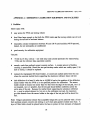
INTRODUCTION
This document describes the procedure for calibration of falling weight deflectometers
(FWD) which was originally developed by the Strategic Highway Research Program (SHRP).
This protocol is now administered by the Long-Term Pavement Performance (LTPP)
Division in the Federal Highway Administration.
The procedure is written primarily for use with the Dynatest falling weight deflectometer,
however it can also be used with the KUAB FWD. Due to differences in the design of the
KUAB certain details are not applicable. Special procedures for the calibration of KUAB
FWDs are included in Appendix B. It may be possible to use the procedure for other types
of FWDs with minor modifications of the hardware and of the data acquisition software.
The procedure is not applicable to the calibration of cyclic loading and other types of
pavement deflection testing equipment.
In this procedure, the deflection and load transducers from the FWD are first calibrated
individually against independently-calibrated reference devices. This is called "reference
calibration," and it is performed at a LTPP Regional Calibration Center, or any other
properly equipped location. The calibration of the FWD deflection sensors is further refined
by comparing them to each other in a process referred to as "relative calibration". Relative
calibration is done as a final step that accompanies reference calibration, and it can also be
carried out alone, at any suitable location. There is no corresponding relative calibration
procedure for the load measurement system.
The procedure results in calibration factors which are entered into the FWD software as
multipliers. When the FWD measurements are multiplied by the calibration factors the result
is a measurement which has been corrected to agree with the calibration instrumentation.
It
is necessary that there be a place in the FWD software to enter the calibration factors. That
is the responsibility of the FWD manufacturer.
.
To use this procedure Dynatest FWDs must have Version 10 or higher software. Earlier
versions do not have the pause feature and do not allow programming the required number of
drops in the test sequence. Furthermore, it is not possible to leave the load plate down, as is
called for in this procedure. Thus, Dynatest FWDs must be upgraded to Version 10 or
higher software before calibration.
SHRP FWD CALIBRATION PROTOCOL - April, 1993
FREQUENCY
OF CALIBRATION
Reference calibration should be performed at least once per year, or as soon as possible after
a sensor has been replaced on the FWD.
Relative calibration should be performed on the deflection sensors at least once per month.
It should also be performed immediately after a deflection sensor is replaced.
PERSONNEL
FWD System Operator
Calibration System Operator
REFERENCE
CALIBRATION
PROCEDURE
Equipment Preparation
The FWD should be in good operating condition prior to performing reference calibration.
Particular attention should be paid to cleaning the magnetic deflection sensor bases to insure
that they seat properly. Also verify that the FWD load plate is fn'mly attached to the load
cell. In the event that the load plate is loose, the lower bolts should be tightened to a torque
of 7.5 lbf-ft and set with Locktite before proceeding. (Note: This torque requirement is
applicable to the Dynatest FWDs. For non-Dynatest FWDs consult the manufacturer.)
All
electrical connectors should be inspected and, if necessary, cleaned and ftrmly seated.
The FWD should be at room temperature. If the FWD has been outdoors at a very low or a
very high temperature, sufficient time should be allowed for it to equilibrate to room
temperature. It is recommended that a series of warm-up drops be performed immediately
prior to beginning calibration, to assure that the rubber buffers have been thoroughly warmed
up.
Set the FWD mass and drop heights to produce loads within + 10 percent of 6, 9, 12, and 16
kips (27, 40, 53, and 71 kN). For the Dynatest FWD, it is possible to be within this
tolerance for the highest load, and yet to have the drop height set too high. Before placing
the reference load cell under the load plate, and with the mass positioned at drop height four
(the highest position), verify that there is at least a four inch clearance between the highest
point on the mass subassembly and the underside of the brace between the two columns that
surround the cylinders that raise and lower the load plate. If the clearance is too small,
reposition the target for the fourth drop height to achieve the required clearance. This
SHRP FWD CALIBRATION PROTOCOL - April, 1993
•
should assure that there will be adequate clearance when the reference load cell is in position
under the load plate.
Before beginning any calibration work, and throughout the entire calibration period, it is
necessary that there be no data filters in operation in the FWD. Verify that the "peak
smoothing" processor has been turned off. This feature is accessed from the Dynatest Main
Menu by selecting "Road Options" (item #3, followed by item #12), where "Peak Readings"
should show "direct" and not "smooth".
General Procedure
The FWD load cell should be calibrated at least twice. Multiple calibration tests are
performed on the load cell, and the results are averaged, since it is not possible to perform
relative calibration on the load cell. Acceptance criteria based upon the repeatability of the
calibration factor are identified in the load cell calibration procedure. If the results persist in
failing the acceptance criteria, then the cause of the erratic results should be identified and
corrected.
Each deflection sensor shall be calibrated once. Spare deflection sensors do not have to be
calibrated until they are in active use. After all load and deflection sensors have been
calibrated, the interim calibration factors shall be entered into the FWD computer before
proceeding with relative calibration.
A sample reference calibration setup screen for the Dynatest FWD with version 10 or version
20 software is given in Figure 1. The information in Figure 1 can also be used as the basis
for setup of Dynatest FWDs running version 25 and higher software.
A complete summary of the data to be recorded is given in Table 1. Before beginning to
perform the calibrations, FWD-specific information should be recorded via printouts from the
FWD data acquisition program screens (e.g., showing the deflection sensor serial numbers
and calibration factors, load cell serial number, calibration factor, and sensitivity, and
voltage screens from the Dynatest software), which have been annotated with the date and
FWD identification information (i.e., FWD model and serial number).
Locate the calibration data acquisition system as close as possible to the FWD computer so
that the two systems operators will be able to converse easily. Load the reference calibration
software FWDREFCL into the reference system computer. Directions for performing
reference calibration using this software are provided in the FWDREFCL User's Guide•
Before doing any calibrations, verify that the computers for the FWD and the reference data
3
SHRP FWD CALIBRATION
1.
2.
3.
4.
5.
6.
7.
8.
9.
10.
11.
12.
15.
14.
15.
16.
17.
PROTOCOL
- April,
1993
Reference Calibration
Test UNITS...: lbf.mil.inch
(kPa.mu.mm)
Temperature..: Fahrenheit
(Centigrade)
Stn.Request..: OFF
(ON)
Test Checks..: NONE
(Decreasing defts, Roll-Off,
RoltOFF+Decr)
Reject prompt: OFF
(ON)
Stationing...:
[Doesn't matter]
Temp.Request.: OFF
(ON)
Cond.Request.: OFF
(ON]
Variation : Load NOTChecked ! Deflections NOT Checked !
Diameter of Plate: 11.8
Deflector distances: [Doesn't matter.
Keep what you have.]
1
2
Drop No. : 123P4P5P6PTP8P9POP1P2PSP4PSP6P7P8P9POP1P2P3P4PSP6P7S
...........
Heights
: CCCP1P1P1P1P1P1P2P2P2P2P2P2P3P3P3P3P3P3P4P4P4P4P4P4P11111111111
Test Plots: ...............................................................
Save Peaks: .... ***********************************************
............
Load His. : ...............................................................
Whole His.: ............
* ...........
* ...........
* ...........
* ..............
18. Load another TESTSETUP.
19. Store the CURRENT
TEST SETUP.
Figure 1: Reference Calibration Test Setup for the Dynatest FWD
acquisition system are registering the correct date and time.
correct it before proceeding.
If either is set incorrectly,
Equipment
As described in Appendix A.
FWD Load Cell Calibration Procedure
1. If the reference load cell has not been calibrated within the last 12 months, then it should
be recalibrated in accordance with the procedure given in Appendix D.
2. Initialize the computer data acquisition program. This will include entry of operator
names, FWD serial number, FWD load cell serial number, and its current calibration
factor.
3. Position the FWD so that the load plate is near the center of the calibration test pad, or
on any other stiff, smooth surface. Verify that there is no sand or other loose debris
4
SHRP FWD CALIBRATION PROTOCOL - April, 1993
Table 1 - FWD Calibration Data Reporting Requirements
Data Item
Mode of Entry
Source _
FWD Operator Name
Manual
Operator
Calibration System Operator Name
Manual
Operator
Date and Time of Calibration
Automatic
Computer Clock
FWD Serial/ID Number
Manual
Operator
FWD Manufacturer
Manual
Operator
FWD Owner
Manual
Operator
FWD Load Cell Serial Number
Manual
Transducer Setup and Gain Printout
FWD Deflection Sensor Serial Numbers
Manual
Transducer
Reference Load Cell Serial Number
Automatic
Configuration File 2
Reference LVDT Serial Number
Automatic
Configuration File 2
FWD Calibration Center Location
Automatic
Configuration File 2
Current Calibration Factor for FWD Load Cell
Manual
Transducer Setup and Gain Printout
Current Cal. Factors for FWD Deflection Sensors
Manual
Transducer Setup and Gain Printout
Ref. Load Cell Calibration Constants
Automatic
Configuration File 2
Ref. Load Ceil Calibration Date
Automatic
Configuration File 2
Ref. LVDT Calibration Constants
Computed
FWDREFCL
Software
Ref. LVDT Calibration Date
Automatic
FWDREFCL
Software
FWD Load Cell Readings (20 total)
Manual
FWD Computer
Ref. Load Cell Readings (20 total)
Automatic
Calibration Data Acquisition System
FWD Deflection Readings (20 per sensor)
Manual
FWD Computer
Ref. LVDT Readings (20 per sensor)
Automatic
Calibration Data Acquisition System
Interim Cal. Factors from Reference Calibration
Computed
FWDREFCL
FWD Relative Calibration Data
Automatic
Relative Calibration Data Files
Calibration Factors from Relative Calibration
Computed
FWDCAL2
Final Calibration Factors
Manual
Final Gain Worksheet
f
tFor SHRP FWDs.
,
Source may be different for FWDs from other manufacturers.
2Reference calibration configuration
file (FWDREFCL.CNF).
5
Setup and Gain Printout
Software
Software
SHR.P FWD CALIBRATION PROTOCOL - April, 1993
under the reference load cell.
4. Attach the cable from the signal conditioner/data acquisition system to the reference load
cell. Position the reference load cell beneath the FWD load plate, making sure that the
three guides are aligned around the plate. Zero the signal conditioner with the load plate
high, so that there is no external load on the reference load cell.
Note: For accurate results it is critically important that the reference load cell be zeroed
with the FWD load plate in the raised position. Also, the signal conditioner excitation
and gain must be set exactly to the levels at which the reference load cell was calibrated.
5. Complete the following sequence of drops, as shown in Figure 1, for a single test:
3 seating drops at height 3 (data not recorded), followed by a pause
5 drops at height 1, with a pause after each drop
5 drops at height 2, with a pause after each drop
5 drops at height 3, with a pause after each drop
5 drops at height 4, with a pause after each drop except the last
Stop after the last drop (plate remains down)
As shown in Figure 1, it is useful to program six drops at each height, rather than five,
so that one can be cor_:dered a "spare" in case a drop is missed by the reference system
instrumentation.
If t;': _irst five drops are successfully recorded, then the data for the
sixth drop can be discarded.
The plate should not be raised at any time during the sequence. Data from both the
FWD load cell and the reference system should be recorded for all drops except the
three seating drops.
6. Perform the load cell reference calibration twice. If the two calibration factors agree
within 0.003, then the results of the two tests shall be averaged. If they are outside this
limit, then a third calibration of the load cell shall be performed. If the standard
deviation of the three results is less than +0.003 (based on n - 1 degrees of freedom),
then the three results shall be averaged. If the standard deviation exceeds +0.003, then
all three calibration factors shall be discarded and the load cell calibration procedure
should be repeated.
o
SHRP FWD CALIBRATION PROTOCOL - April, 1993
.
7. Upon completion of the calibration testing, raise the FWD load plate and remove the
reference load cell.
'
The presence of any one or more of the following conditions invalidates the load cell
calibration test results.
•
Excessive noise messages for drop heights 2, 3, or 4. (For the low drop height (e.g.,
the 6000-pound load level) there is seldom enough free-fall time for the vibration caused
by the release of the mass to attenuate before the mass strikes the plate. Thus excess
noise messages at the low drop height may, in general, be disregarded.) The noise, due
either to electrical noise or mechanical vibrations, is of concern only if it results in an
erroneous zero value or an erroneous peak reading. The time history graphs provided
by the FWDREFCL software should be viewed to determine if the noise is of concern
before rejecting the calibration.
•
Standard deviations for the five readings at any drop height that differ by more than a
factor of three between the reference system data set and the FWD data set.
•
Standard error of the adjustment factor (see Reference Calibration Data Analysis) in
excess of _+0.0020.
•
Failure to satisfy the repeatability criteria for multiple calibration tests.
Should any of these conditions occur, the load cell calibration test procedure must be
repeated after identifying the source of the problem and correcting it.
FWD Deflection Sensor Calibration Procedure
1. Initialize the computer data acquisition program. This would include entry of the
operator names, FWD serial number, FWD deflection sensor serial number, and its
current calibration factor.
,
2. Clean the spring-loaded tip of the LVDT. Use a non-lubricating contact cleaner in a
pressurized can to spray cleaner into the bearing sleeve until the tip goes in and out
without noticeable friction. Check by working the tip in and out. The stroke should be
smooth, without "bumps." If the LVDT cannot be made to operate smoothly do not
continue with the calibration.
'
3. Use the micrometer calibrator to calibrate the LVDT. To do this, the LVDT should first
be positioned in the calibrator and set to the null point (zero voltage output), with the
7
SHRP FWD CALIBRATION PROTOCOL - April, 1993
micrometer set to 5 mm. The micrometer should then be advanced slightly beyond 7
mm, and returned to the 7 mm mark. Verify that the MetraByte board reads within ___30
bits of -2000 bits. If necessary, adjust the Gain knob on the 2310 signal conditioner in
increments of 0.1 (for instance, from a setting of 1.50 xl to a setting of 1.40 xl) to
achieve the required reading. The LVDT voltage output and the micrometer reading (7
ram) should be recorded.
The micrometer should be moved in 0.5 mm increments to a final reading of 3.0 mm,
with the micrometer reading and LVDT voltage output recorded at each 0.5 mm step.
Turn the barrel of the micrometer in one direction only, to avoid errors due to backlash.
Analyze the resulting data using a linear regression to determine the coefficient m in the
equation Y = m X + b, where Y is the position of the LVDT tip in microns, as
measured by the micrometer, and X is the corresponding voltage output in bits, as read
by the computer data acquisition board. (The FWDREFCL software provides prompts
for this entire process, reads and records the requisite data, and performs the
computations.)
The slope m will be approximately -1.00 microns per bit. The standard error of the
slope should be less than 4-0.0010. If a larger standard error is obtained, the LVDT
calibration should be repeated.
4. Enter the LVDT calibration results into the computer data acquisition system. (This is
handled automatically by the FWDREFCL software.) After the calibration results are
entered, the signal conditioner gain must not be changed.
5. Secure the LVDT in its holder on the reference system aluminum beam, so that it is near
the null point (eg., zero voltage output). Verify with a spirit level that the LVDT is
vertical in its holder. If it is not vertical, adjust the position of the aluminum beam to
a;:_2inverticality. This may require shimming the beam where it is bolted to the concrete
block.
6. Position the FWD trailer so that the load plate is as close as possible to the deflection
sensor holder. It is important, however, that the FWD should not come in contact with
the beam or any other part of the reference system during the testing.
7. Remove the deflection sensors from their holders on the FWD beam, and verify that
they are free of dirt and grime which would adversely affect their seating in the
reference system deflection sensor holder. Run the magnetic base over a piece of finegrained emery paper that is placed on a firm, flat surface (such as the upper flange of
the aluminum beam), to assure that it is clean.
8
o
"-
SHRP FWD CALIBRATION
PROTOCOL - April, 1993
8. Place one deflection sensor in the sensor homer, and position the LVDT holder so that
the LVDT and the FWD sensor are aligned.
•
9. Place a second deflection sensor on top of the LVDT holder, so that it will measure the
movement of the end of the beam (and hence, of the LVDT housing).
10. Complete the following sequence of drops, as shown in Figure 1, for a single test:
3 seating drops at height 3 (data not recorded), followed by a pause
5 drops at height 1, with a pause after each drop
5 drops at height 2, with a pause after each drop
5 drops at height 3, with a pause after each drop
5 drops at height 4, with a pause after each drop except the last
Stop after the last drop (plate remains down)
As shown in Figure 1, it is useful to program six drops at each height, rather than five,
so that one can be considered a "spare" in case a drop is missed by the reference system
instrumentation.
If the fu'st five drops are successfully recorded, then the data for the
sixth drop can be discarded.
The plate should not be raised at any time after the seating drops. One complete FWD
time history plot should be studied for the fifth drop at each drop height, to verify that
the calibration beam does not move during the test period.
The presence of any of the following conditions invalidates the calibration data.
•
o
Movement of the calibration beam, as measured by the deflection sensor resting on the
top of the beam, prior to, or simultaneous with, the peak deflection reading from the
device under test. It is entirely possible that there will ultimately be some movement of
the beam, as the deflection wave passes under the concrete inertial block. The important
criterion is whether the beam moved prior to the time that the deflection sensor on the
ground registered its peak reading. Beam movement can be determined by inspection of
the FWD time history data fries. At the moment when the sensor being calibrated shows
its peak reading the sensor on the reference beam should show no more than +_0.08 mils
(+_2 microns) of displacement.
9
SHRP FWD CALIBRATION PROTOCOL - April, 1993
•
Excessive noise messages for drop heights 2, 3, or 4. (For the low drop height (eg., the
6000-pound load level) there is seldom enough free-fall time for the vibration caused by
the release of the mass to attenuate before the mass strikes the plate. Thus excess noise
messages at the low drop height may, in general, be disregarded.) The noise, due either
to electrical noise or mechanical vibrations, is of concern only if it results in an
erroneous zero value or an erroneous peak reading. The time history graphs, provided
by the FWDREFCL software, should be viewed to determine if the noise is of concern
before rejecting the calibration.
•
Standard deviations for the five readings at any drop height that differ by more than a
factor of three between the reference system data set and the FWD data set.
•
Standard error of the adjustment factor (see Reference Calibration Data Analysis) in
excess of _+0.0020.
_.
--
Should any of these conditions occur, the calibration test for the deflection sensor must be
repeated after identifying the source of the problem and correcting it.
Reference Cafibration Data Analysis
1. Analyze the dataas follows (calculations are done automatically by the FWDREFCL
software):
A. Perform a least squares regression forced through zero for all of the datafor each
measurement device (i.e., 20 pairs of data per test -- 5 replicates at each of 4 load
levels). The result of this regression will be the coefficient for an equation of the form
Y = m X, where Y represents the response of the reference system, X represents the
response of _:e FWD measurement device, and m is the slope of the regression line.
Both X and
should be measured in the same system of units.
B. The coefficient, m, determined in step A, represents the adjustment factor for the
calibration factor in the FWD Field Program. The new calibration factor is computed
by multiplying the former calibration factor by the coefficient m from step A. This is
listed as the new calibration factor on the FWDREFCL report.
C. The standard error of the adjustment factor should be less than ___0.0020. If a larger
standard error is obtained for any sensor, the reference calibration for that sensor should
be repeated.
2. Enter the new calibration factors for all sensors (load and deflection transducers) in the
10
o
"
SHRP FWD CALIBRATION PROTOCOL - April, 1993
FWD Field Program before continuing with the relative calibration. The new calibration
factor for the FWD load cell is a "final" calibration factor, while the new calibration
factors for the deflection sensors are "interim" factors, which will be further refined by
doing relative calibration.
RELATIVE CALIBRATION PROCEDURE
General Background
Relative calibration of the FWD deflection sensors is used to ensure that all sensors on a
given FWD are in calibration with respect to each other. As such, it serves as the final step
in the overall FWD calibration process, and as a quick means to periodically verify that the
sensors are functioning properly and consistently.
Relative calibration uses the relative calibration stand supplied by the FWD manufacturer.
The sensors are stacked vertically in the stand, one above another, so that all sensors are
subjected to the same pavement deflection. Relative calibration assumes that the overall
mean deflection, as determined from simultaneous measurements by the full set of deflection
sensors, yields an accurate estimate of the true deflection. This assumption requires that the
deflection sensors must have first been subjected to the reference calibration procedure.
Some FWDs have fewer than or more than seven active deflection sensors. If they do, these
procedures should be modified to calibrate the actual number of active sensors in use on the
FWD.
Equipment
FWD relative calibration stand with as many positions as the number of active deflection
sensors. For purpose of illustration a seven-position stand is assumed herein.
FWD relative calibration software (FWDCAL2)
and documentation.
General Procedure
•
"
The process involves rotation of the seven deflection sensors through the seven positions in
the calibration stand. Each combination of sensors and levels is considered a "set," and thus
there are seven sets of data. The test point is "conditioned" before beginning the calibration
procedure to reduce the possibility that set will be significant in the data analysis. The
11
SHRP FWD CALIBRATION PROTOCOL - April, 1993
required order of movement of the sensors is shown in Table 2. Spare deflection sensors do
not have to be calibrated until they are in active use.
Table 2 - Relative Calibration Sensor Positions by Set
Level in
Sensor
Stand
Deflection Sensor Number in the Stand
Set:
1
2
3_
_4
_5
_6
7
1
2
3
4
5
6
7
2
3
4
5
6
7
1
3
4
5
6
7
1
2
4
5
6
7
1
2
3
5
6
7
1
2
3
4
6
7
1
2
3
4
5
7
1
2
3
4
5
6
(Top)
A
B
C
D
E
F
G
(Bottom)
Note: The rotation must be done as p_,_ _'ribed above in order for the software (FWDCAL2) to work
properly. For instance, for Set 2, mox',_Sensor 2 to the position formerly occupied by Sensor 1, etc.
When done in conjunction with reference calibration, the relative calibration procedure shall
be repeated twice. Acceptance criteria based upon the repeatability of the calibration factor
are identified in the relative calibration procedure. If the results persist in failing the
acceptance criteria, then the cause of the erratic results should be identified and corrected.
After the relative calibration is completed, the final calibration factors shall be entered into
the FWD computer.
A sample relative calibration setup screen for the Dynatest FWD with version 10 or version
20 software is given in Figure 2. The information in Figure 2 can also be used as the basis
for setup of Dynatest FWDs running version 25 and higher software.
12
SHRP
FWD
CALIBRATION
1.
2.
3.
4.
5.
6.
7.
8.
9.
10.
11.
Relative
Calibration
Test UNITS...:
tbf.mit.inch
(kPa.mu.mm)
Temperature..:
Fahrenheit
(Centigrade)
Stn.Request..:
OFF
(ON)
Test Checks..:
NONE
(Decreasing defts,
Roll-Off,
Reject prompt: OFF
(ON)
Stationing...:
[doesn't
matter]
Temp.Request.:
OFF
(ON)
Cond.Request.:
OFF
(ON)
Variation
: Load NOT Checked ! Deflections
NOT Checked !
Diameter of Plate:
11.8
Deflector
distances:
[doesn't
matter - keep what you have]
1
2
3
4
12.
13.
14.
15.
16.
17.
Drop No.
:
Heights
Test Plots:
Save Peaks:
Load His. :
Whole His.:
18.
19.
Load another TEST SETUP.
Store the CURRENT TEST SETUP.
+Note:
range.
PROTOCOL
- April,
1993
RoltOFF+Decr)
1234567P8901234P5678901P2345678P9012345P6789012P3456789S
.......
CC44444PCC44444PCC44444PCC44444PCC44444PCC44444PCC44444S1111111
...............................................................
******************************************************* ........
...............................................................
...............................................................
Drop heightshoutdbeadjustedto
attaindeftectionsuithin
the specified
Figure 2: Relative Calibration Test Setup for the Dynatest FWD
Relative Calibration of the Deflection Sensors
1. Remove all of the deflection sensors from their holders on the FWD. Make sure that the
sensors are labeled (e.g., from 1 to 7, or 0 to 6) with respect to their normal position on
the FWD. The center sensor is in position number "1" on the Dynatest FWD and in
position number "0" on the KUAB FWD.
2. Label the seven levels on the sensor stand from "A" to "G."
labeled "A."
The top level is usually
3. Position the seven deflection sensors in the stand for the first of the seven sets.
,
4. Support the sensor stand in a vertical position. Mark the location where the stand rests
so that it can be relocated precisely on the same spot. This may be done by gluing a
washer to the pavement, or by making a small divot in the pavement with a chisel.
5. Select the FWD drop height and the distance from the loading plate to the sensor stand
to yield deflections on the order of 400 to 600 microns (16 to 24 mils). If deflections in
13
SHRP FWD
CALIBRATION PROTOCOL
- April,1993
this range cannot be achieved, then it may be necessary to relocate the FWD to a
different pavement. In general, a concrete pavement on a relatively weak subgrade will
yield the required deflection. In most cases the reference calibration test pad should be
usable for relative calibration.
6. Warm up the FWD rubber buffers and condition the test point by repeating a sequence
of ten drops until the loads and deflections that are registered are nearly uniform. The
deflections in a sequence of ten drops should not be showing a steadily increasing or
decreasing trend. If liquefaction or compaction is indicated by the warm-up data,
relocate the FWD to another pavement.
7. Lower the FWD loading plate. DO NOT raise the loading plate or move the FWD
during the relative calibration testing. This will assure a constant distance between the
center of the load plate and the base of the sensor stand.
8. For each set make two seating drops (no data recorded) followed by five replicate drops
(for which data is recorded) while holding the stand in a vertical position. With seven
sets and 5 replicate drops, data for a total of 35 drops is required (see Figure 2).
Relative Cafibration Data Analysis
A three-way analysis of variance should be used to evaluate the data. This will partition the
variance into four sources: (1) that due to sensor number, (2) that due to position in the
calibration stand, (3) that due to set, and (4) that due to random error of measurement. This
analysis is performed by the FWDCAL2 software. In this analysis, deflection is the
dependent variable, and sensor number, position and set are the three main factors. The
three hypotheses that may be tested are:
Ho:
Sensor number is a significant source of error
H0:
Data set number is a significant source of error
Ho:
Position in.the stand is a significant source of error
Through the use of hypothesis testing it is possible to determine whether random error due to
sensor number, due to position in the calibration stand, and due to set number are statistically
significant. The only factor that should result in a change in the deflection sensor calibration
factors is sensor number.
If the random error due to sensor number is found to be statistically significant, then the
14
.
SHRP FWD
.
CALIBRATION
PROTOCOL
- April,1993
calculated adjustments in the calibration factors for each sensor should be made. If a change
is made in the calibration factor for one sensor, then the calibration factors for all sensors
should be changed in accordance with the calculations.
If position in the stand is statistically significant, it is likely that the stand was not held
vertical throughout all of the sets during the test. Or a connection in the stand may have
been loose. The problem should be corrected, and the test should be repeated.
If set is statistically significant, there may have been a systematic change in the properties of
the pavement materials, for instance due to compaction or liquefaction. The test should be
repeated after the testing site has been further "conditioned" according to the procedure. If
the deflection readings do not become relatively constant during the conditioning, then
another site should be selected for the testing.
The mere fact that either position or set, or both, are significant does not necessarily
invalidate the relative calibration. Judgement must be used to assess whether or not these
factors may be of sufficient physical significance (as opposed to statistical significance) to
require that the relative calibration should be repeated or that a new test site should be
selected.
The standard error of measurement (e.g., the square root of the mean square error due to
error) should be on the order of +0.08 mils (+2 microns) or less if the system is working
properly and the calibration test was conducted carefully.
The analysis of the data obtained from the relative calibration procedure and the method used
to determine revised calibration factors is as follows (calculations are done automatically
within the FWDCAL2 software):
1. Compute the mean deflection measurement, xi, for each sensor (average for the seven
sets) and the overall mean, Xo, for all of the sensors averaged together.
2. Compute the adjustment ratio, g, of the overall mean to the sensor mean for each
sensor.
Xo
Xi
15
SHRP FWD CALIBRATION PROTOCOL - April, 1993
Adjustment of Calibration Factors
When relative calibration is conducted in conjunction with reference calibration, the
procedure is repeated two times. If the two sets of calibration factors agree within 0.003 for
each deflection sensor, then the results of the two tests shall be averaged. If they are outside
the limit, then a third relative calibration shall be performed. If the standard deviation of the
three results (based on n - 1 degrees of freedom) is less than +0.003, then the three results
shall be averaged. If the standard deviation exceeds _+0.003, the relative calibration
procedure should be repeated.
An example of the calculations following this procedure is shown in Appendix C. The
average final calibration factors should be computed, and the factor for each deflection
sensor should be entered into the FWD computer software (e.g., the "FWD Field Program").
When relative calibration is done alone, typically on a monthly basis, then adjustment of the
calibration factors in the FWD Field Program should be made only when those changes are
both significant, and verified to be necessary. The following guidelines are to be used to
evaluate the need for adjustment to the calibration factors.
1. Computed sensor adjustment ratios, _, between 0.997 and 1.003 inclusive are
considered to be equivalent to a ratio of 1.000. In other words the required adjustments
are trivial and need not be made.
2. Where the adjustment ratios for one or more sensors fall outside of the range 0.997 to
1.003, the calibration process should be repeated. If both sets of data agree within
0.003, the gains should be adjusted for all sensors.
3. The final calibration factor is calculated by multiplying the current calibration factor for
a given sensor, i, by its adjustment ratio, _.
According to the recommendations of the FWD manufacturers, a final calibration factor
less than 0.98 or greater than 1.02 is possibly indicative of a damaged sensor, which
should be repaired by the manufacturer, or replaced. Final calibration factors that are
within this range should be entered into the FWD data collection software.
4. If any calibration factors are changed, the relative calibration process must be repeated
to verify the accuracy of the final values. The resulting adjustment ratios should be
within the range 0.997 to 1.003 for all sensors. If they are not, the test procedure
should be repeated.
16
SHRP FWD CALIBRATION PROTOCOL - April, 1993
Reports
The full FWD calibration report shall consist of the following:
•
Printouts of the following Dynatest FWD Field Program screens (or equivalent for nonDynatest FWDs).
• Transducer Setup and Calibration Factors
• Voltages
• Load Cell Calibration
Each of the above printouts is to be annotated with the FWD unit identification (e.g.,
manufacturer's serial number or agency ID), and the calibration date.
•
All printouts from the FWDREFCL software
•
The final printouts from the FWDCAL2 software for all relative calibration trials.
•
The Final Calibration Computation worksheet (see Appendix C)
Distribution of this report shall be as follows:
•
Original retained by FWD operator for submission to his agency (LTPP Regional
Engineer for LTPP FWDs).
•
One copy transmitted to LTPP Division Office within one week of calibration.
•
One copy retained on file by calibration center for a period of at least three years.
The diskettes on which the reference and relative calibration data are stored should be kept in
the FWD. It is recommended that labeled backup copies be kept on file with the calibration
report at the office out of which the FWD is operated. For the LTPP FWDs, additional
backup copies of the calibration diskettes are to be kept on f'de at the LTPP Regional Office.
When relative calibration is done alone (e.g., as a monthly calibration check), the relative
calibration report will consist of all printouts from the FWDCAL2 software, annotated as
necessary to explain any problems which might have been encountered.
17
SHRPFWDCALIBRATION
PROTOCOL- April,1993
APPENDIX A: REFERENCE
CALIBRATION
EQUIPMENT
AND FACILITIES
I. Facilities
Indoor space with:
•
easy access for FWD and towing vehicle
•
level floor large enough so that both the FWD trailer and the towing vehicle can sit level
during the test and be enclosed indoors
•
reasonably constant temperature (between 50 and 100 F) and humidity (40-90 percent),
heated, but not necessarily air conditioned
•
good security for calibration equipment
Test pad:
•
_,5 feet by 15 feet, with an _.-_oot wide clear zone around perimeter (for maneuvering
;_WDs and the reference data acquisition system)
•
smooth, crack-free portland cement concrete surface. A modest amount of hairline
cracking is permissible. Should the test pad develop cracks which are visibly open (1/16
inch or more), it should be replaced.
•
isolated (by impregnated felt bond breaker, or sawed and caulked joint) from the area
where the concrete inertial block supporting the aluminum reference beam will rest
•
slab deflection of at least 16 mils due to 16,000 lb load at the position of the deflection
sensor holder when the FWD is in the specified position for calibration. The sensor
holder should be located not closer than two feet from the edge of the test pad, but it is
not required, nor is it possible, that the test pad should deflect uniformly across the
entire area of the pad. Because the inertial block supporting the aluminum reference
be ..-1 must be placed adjacent to, but not on the calibration test pad, the maximum
poszible distance from the sensor holder to the edge of the test pad will be about five
feet.
Note: Fatigue calculations indicate that acceptable fatigue life can be achieved with a 5-inchthick portland cement concrete slab resting on an 8-inch open-graded crushed stone base. A
layer of filter fabric should be placed below the base to protect it from intrusion of subgrade
18
_
SHRPFWDCALIBRATION
PROTOCOL
,
'
- April,
1993
fines. To achieve adequate deflections, the subgrade modulus should be less than 12,000 psi
(80 MPa) with bedrock deeper than 25-30 feet. Where bedrock exists at depths of 15 to 25
feet, a subgrade modulus of 7,500 psi (50 Mpa) or less will be needed. Test pads located
where bedrock is less than 15 feet deep are likely to be very sensitive to minor variations in
subgrade moisture, and hence are not advisable.
II. Equipment
•
concrete inertial block (4,000 Ibs.)
•
5-foot aluminum reference beam
•
Air-Cel low frequency rubber isolation pads for support of the concrete block
•
LVDT mounting hardware
•
deflection sensor holder assembly
•
magnetic tip for LVDT
•
Schaevitz Model GCD-121-125, 0.125-inch stroke DC LVDT with Cannon connector
•
Schaevitz metric LVDT calibrator C-41M
•
Measurements Group, Inc. Vishay Model 2310 signal conditioner, with factory
modification for +15 VDC and -15 VDC excitation
•
Keithley-MetraByte Model DAS-16G A/D data acquisition board, with STA-16 screw
terminal board and C-1800 ribbon cable. The G2 version of the data acquisition board is
recommended for IBM PC-XT and PC-AT computers, and compatibles; the G1 version
is acceptable. A Model #DAS-16G board should be used with IBM PS/2 (microchannel
bus) computers.
•
connecting cables, Vishay to LVDT and Vishay to MetraByte
•
FWD reference calibration software (FWDREFCL) and documentation
•
custom built reference load cell (300 mm diameter, 40,000 lbs. capacity)
•
connecting cable, Vishay to load cell
19
SI'tRP FWD CALIBRATION PROTOCOL - April, 1993
Note: Drawings of each of the special items of equipment, and cabling diagrams, are
available from the Long-Term Pavement Performance (LTPP) Division at the Federal
Highway Administration, Turner-Fairbank Highway Research Center, McLean, Virginia.
IBM PC-XT or PC-AT, or compatible, computer recommended;
acceptable. Configuration:
IBM PS/2 computer
• 80386 processor or higher
• 25 MHz or faster processor speed
• co-processor,
if applicable
• 1 megabyte or more RAM
• 100 megabyte or more hard drive
• an 8-bit expansion slot for the MetraByte board
Monitor:
• Color monitor; monochrome not recommended
• VGA recommended;
EGA acceptable
Graphics Printer:
• Laser printer recommended;
dot matrix acceptable, but very slow
(Where both "recommended" and "acceptable" options are given in the above specifications,
an effort has been made in the software development to accommodate both alternatives.
However, since most of the testing has been done on computer hardware meeting the
"recommended" specifications, installation of the calibration station will go more smoothly if
those specifications are met. A demonstration version of the FWDREFCL software is
available from the LTPP Division in the Federal Highway Administration (located at the
Turner-Fairbank Highway Research Center, McLean, VA) which can be used to determine if
the computer and peripherals will work satisfactorily with the program.)
20
SHRP FWD CALIBRATION PROTOCOL - April, 1993
APPENDIX
B: SPECIAL PROCEDURES
FOR TESTING THE KUAB FWD
Reference calibration of the KUAB FWD can be carried out in a manner very similar to the
procedure outlined for the Dynatest FWD. However, because the KUAB has its load plate
forward of the deflection sensor beam (i.e., toward the towing vehicle), it will be necessary
to place the trailer on an angle with respect to the test pad, so that the load plate can be
positioned as close as possible to the LVDT and the deflection sensor holder. The end of the
aluminum beam holding the LVDT should be just behind the trailer wheels, near the place
where the "foot" of the KUAB A-frame rests on the floor.
KUAB FWDs must have operational program SFWD version 4.0 or higher to perform
reference calibrations. This version can be obtained from the manufacturer.
Before the reference calibration procedure is performed, the FWD Operator should first
conduct a static calibration of the deflection sensors. The KUAB software will automatically
file the static calibration factors. The manufacturer recommends that the dynamic calibration
factors be entered as 1.05 for all sensors. These values should not be changed during or
after the reference calibration.
Due to the larger distance between the center of the load plate and the seismometer holder it
may not be possible to achieve the specified deflection of 16 mils at 16,000 pounds. The
deflection should be as large as possible.
To achieve the specified load levels the manufacturer recommends using Load Mode 3 (9+9
small buffers, 2 stack weights). Adjust the drop height endswitches as necessary to be within
the load tolerances.
In general the KUAB will be tested with the 17-millisecond rubber buffers installed. The
reference data acquisition system and the FWDREFCL software allow for calibration using
the 25-millisecond buffers, but the movement of the aluminum beam should be checked
carefully to assure that there is no motion before the ground deflection peaked out.
The FWDREFCL software contains an number of special features to accommodate the
KUAB, and thus in initializing the software, the FWD type should be set for "KUAB." The
deflection sensor that is mounted through the load plate (i.e., the center sensor) is called
sensor number zero on the KUAB, and it is in position number 0 as far as FWDREFCL is
concerned.
KUAB FWDs with version 4.0 software are able to pause during the drop sequence, prior to
releasing the mass. This is achieved by entering the letter "P" after the drop height position
21
SHRP FWD CALIBRATION PROTOCOL - April, 1993
code during programming of the drop sequence. For example, the required reference
calibration drop sequence would be entered as follows (drop height, number of drops):
333(1P,6)(2P,6)(3P,6)(4P,6)
The pause occurs with the mass elevated, ready to drop.
the FWD operator strikes a key.
The mass will not be released until
To repeat the drop sequence without raising the load plate from the ground, strike the ESC
key twice immediately following the final drop. This will interrupt the initial drop sequence,
allowing a second drop sequence to be started without raising the plate.
Because
possible
with the
in order
the top of the reference load cell is 300 millimeters in diameter, it will only be
to calibrate the small (300 mm) load plate on the KUAB. If the KUAB is outfitted
large (450 mm) load plate, it should be replaced with the 300 millimeter load plate
to attain accurate results.
A special holder is provided for mounting the KUAB seismometer under the LVDT. The
Dynatest geophone holder should be removed and the KUAB holder bolted down in its place.
The LVDT mounting plate that z_-.ches to the end of the aluminum beam should be removed
from its position under the beam _d reinstalled on top of the beam. The KUAB deflection
sensors will be slid upward off the two rods that hold them in position on the sensor beam in
the trailer. Remove the tripod foot by loosening its holding screw, and then slip the
deflection sensor over the peg on the holder under the LVDT. Tighten the holding screw
f'_aly.
Conducting load plate calibration is particularly difficult on the KUAB, because it is hard to
detect when the FWD mass has been released. To make this easier, a double layer (or
thicker) of "duct tape" should be wrapped around the guide post (down which the runners
under the falling mass roll), located an inch or two above the bottom of the stroke. The
proper position for the tape can be found when the mass is at its lowest drop height. Adjust
the KUAB load sensitivity in the reference system computer to a value of 5 to 10 bits.
Remove the tape after completion of the reference calibration.
Enter the new calibration factors for the deflection sensors as the "SHRP Calibration
Factors" under the Calibrate menu in the KUAB operational program. The calibration factor
for the 300 mm load plate is entered in the same manner. The calibration factor for the
large (450 mm) load plate should remain unchanged.
Most KUAB FWDs do not have a calibration stand for performing relative calibration. Thus
it will not be possible to perform the relative calibration procedure as described herein.
22
_
SHRP FWD CALIBRATION PROTOCOL - April, 1993
"
Limited experience in the calibration of KUAB FWDs has shown that the combination of
static calibration and dynamic calibration may be adequate to yield a satisfactory calibration
and accurate final calibration factors. However, relative calibration further refines the
reference calibration factors, and it allows a monthly check of the accuracy of the deflection
sensors. Thus it is highly recommended that a means of performing relative calibration with
the KUAB FWD be developed.
23
SHRP FWD CALIBRATION PROTOCOL - April, 1993
APPENDIX C:
Sensor
_:_MPLE COMPUTATION
OF FINAL CALIBRATION
Final Calibration Factors
From Relative Calibration
Trial 1
Trial 2
Trial 3
FACTORS
Average Final
Calibration Factors
Standard
Deviation
1
1.014
1.011
1.015
1.013
0.0035
2
1.010
1.007
1.012
1.010
0.0035
3
1.012
1.010
1.013
1.011
0.0035
4
1.016
1.020"
1.012
1.016
0.0035
5
1.017
1.018
1.018
1.018
0.0035
6
1.008
1.012"
1.011
1.010
0.0035
7
1.012
1.012
1.009
1.011
0.0035
Notes:
1. If the results from the first two trials agree within 0.003 for each deflection sensor, then
it is not necessary to perform a third test. Average the results of the first two trials, and
enter the ave=age final calibration factors in the FWD computer. In the example above, after
Trial 2 the data marked 0 did not meet this criterion.
2. If three trials are performed, compute the mean and the standard deviation of the three
results for each deflection sensor. If the standard deviations (based on n - 1 degrees of
freedom) are all less than 4-0.003, enter the average final calibration factors in the FWD
computer. If any of the standard deviations exceed 4-0.003, repeat the entire relative
calibration test.
24
SHRP FWD CALIBRATION PROTOCOL - April, 1993
APPENDIX
D: REFERENCE
LOAD CELL CALIBRATION
PROCEDURE
INTRODUCTION
The reference load cell is a precision instrument, capable of measuring loads within +0.3
percent or better. Such a high degree of precision can be attained, however, only if this
calibration procedure is followed exactly. It is essential that the reference load cell be
calibrated using a universal testing machine that is properly maintained and accurately
calibrated.
FREQUENCY OF CALIBRATION
Calibration of the reference load cell should be performed at least once per year. It should
also be performed immediately after any of the six Allen head screws that attach the load
measurement links to the upper or lower plates of the reference load cell are loosened.
Calibration would also be necessary if the load cell fails to pass the unbalanced zero test
(within +5 percent) as detected by the FW REFCL program.
EQUIPMF rcr
•
Universal testing machine. A static testing machine, hydraulic or screw-powered, with a
load capacity of 120,000 pounds or more should be used for the reference load cell
calibration. Although the reference load cell will only be calibrated to a capacity of
20,000 pounds, the higher capacity of the testing machine assures that the test frame will
be adequately rigid. The testing machine should have several load ranges, among them
a 0 - 20,000 pound range (slightly higher ranges, such as 0 - 24,000 pounds, etc., would
be acceptable). Care must be taken to avoid overloading the reference load cell during
its calibration.
Note: Do not use a servo-controlled, closed-loop testing system such as a MTS machine
for this purpose. In general such equipment does not provide the high degree of
accuracy that is required for this calibration.
•
Bearing blocks:
special wood/aluminum
bearing blocks.
•
Measurements Group, Inc. Model 2310 Signal Conditioner. This should be the same
signal conditioner that will be used in the reference calibration procedure.
25
SHRP FWD CALIBRATION PROTOCOL - April, 1993
•
Keithley-MetraByte DAS-16G data acquisition board, installed in the same computer that
is used for reference calibration.
•
Push-button trigger for activating the data acquisition system.
The reference load cell and its cable, and the associated signal conditioner, data acquisition
board and computer should be considered a system of instruments, which should be
calibrated together and used together.
CALIBRATION
OF EQUIHVIFNT
The universal testing machine should be calibrated according to ASTM procedure E-74
within twelve months prior to conducting this procedure. The device(s) used to calibrate the
universal testing machine should be certified to be traceable to the National Institute for
Science and Technology (NIST - formerly the National Bureau of Standards) calibration(s).
The certificate of calibration provided for the universal testing machine should be used to
develop an adjustment algorithm which will correct the indicated load on the universal testing
machine to the NIST load. It is highly recommended that the reference load cell be
calibrated soon after the universal testing machine is calibrated.
The MetraByte board should be calibrated according to the procedure described in the
manufacturer's instruction manual. Its accuracy should be verified using a reference voltage
source such as a 1.350 volt mercury cell (eg., camera battery in new condition).
The 2310 signal conditioner amplifier should be balanced according to the procedure
described in the manufacturer's instruction manual. With the signal input terminals shorted
together, at gain 100 the ac noise on the + 10 volt output terminals should be 1 miUivolt or
less.
EQUIPMENT
PREPARATION
Inspect the reference load cell carefully before calibration. Verify that the cable and the
Amphenol connectors are making proper contact in their sockets (eg., fitting and locking
tightly). Make a continuity check to verify that there are no breaks in the wires. Verify that
the Allen screws on the load cell are tight.
Note: The six Allen screws on the top and the bottom of the load cell were torqued to 100
lb.-in, and set with Locktite during assembly. These screws should not be loosened unless it
is absolutely necessary. If any of the screws are loosened, they should be removed one at a
26
SI-IRPFWD CALIBRATION PROTOCOL - April, 1993
.
time and their threads cleaned. Locktite should be reapplied to their threads, and they should
be torqued to precisely 100 lb.-in.
Verify that the three steel pads on the bottom of the reference load cell are in good
condition. Verify that one of the wood/aluminum bearing blocks has a ribbed rubber pad
cemented to it. If the edges of the rubber pad are loose, use rubber cement to reattach it.
Install a spherically-seated bearing block in the cross head of the universal testing machine.
Make the following settings on the front panel of the 2310 signal conditioner:
•
Excitation Voltage set to 10 volts
•
Filter set to 1000 I-Iz
•
AC IN button fully extended (eg., out)
•
Gain set to 5.5 xl00
•
Auto Balance switch OFF
Verify that the Tape Playback switch on the rear panel of the signal conditioner is OFF.
Position the signal conditioner and the computer several feet apart near the testing machine
and attach them to ac line power.
COMPUTER PREPARATION
Use the same computer system for reference load cell calibration that is used for FWD
calibration. A graphics printer must be available.
Load the software LDCELCAL into the reference system computer. This program should
be located in the same subdirectory with FWDREFCL.EXE
and FWDREFCL.CNF.
A
disk with the files REFLCCAL.WK1
and REFLCCAL.FMT
on it should be inserted in
drive A. The computer must be running under DOS and not under WINDOWS during the
calibration.
'
The computer program LDCELCAL is designed to interact with a Lotus 1-2-3, version 2.3,
spreadsheet to accomplish the data analysis. The subdirectory containing the 1-2-3 program
must be on the PATH in order for the two programs to work together successfully. The
WYSIWYG add-in utility should be installed according to the Lotus directions. Defaults in
27
SHRP FWD CALIBRATION PROTOCOL - April, 1993
Lotus 1-2-3 shouM be set as follows.
•
Default directory:
A:\
•
Auto-execute macros:
•
Auto-attach add-in #1: C:\LOTUS\WYSIWYG
on
See the Lotus User's Manual for instructions regarding setting the defaults. If the program is
correctly installed and set up, the data analysis will be run, a listing of the data will be
produced, and graphical output will be printed automatically. A demonstration version of
LDCELCAL is available to use with Lotus 1-2-3 to verify that your computer system can
interact properly with the program.
CALIBRATION
PROCEDURE
1. Attach the cable from the signal conditioner to the reference load cell, turn on the signal
conditioner, and allow the system to warm up for at least 15 minutes. Attach the cables
connecting the signal conditioner to the computer. Attach the push-button trigger in the
blue terminal box of the MetraByte data acquisition system. Turn on the computer and
the printer. If an hydraulic universal testing machine is used, turn the pump on and
allow it to warm up for 15 minutes.
2. Place a wood/aluminum
machine platen.
bearing block with no rubber pad in the center of the testing
3. Place the reference load cell on top of the bearing block with the three steel pads down
(i.e., in contact with the top surface of the lower bearing block).
4. Place the second bearing block on top of the load cell with the cemented rubber pad
down (i.e., in contact with the top surface of the load cell).
5. Carefully align the edges of the load cell and the two bearing blocks, and center the
system under the upper loading block of the universal testing machine.
6. Set the testing machine on a range equal to or slightly larger than 20,000 pounds. Apply
a nominal load of 20,000 pounds to the reference load cell three times. Apply the load
at a rate in the range of 5,000 to 20,000 pounds per minute.
7. Temporarily
remove the upper wood/aluminum
28
bearing block.
Set the Auto Balance
SHRP FWD CALIBRATION PROTOCOL - April, 1993
¢
switch on the 2310 signal conditioner to OFF. Read and record the unbalanced zero
voltage. If this voltage is in excess of +5 volts the load cell has been damaged by
yielding and it should be returned to the manufacturer for repair.
8. Push down the Auto Balance switch on the signal conditioner to the RESET position and
release it to the ON position. Adjust the Trim knob until the MetmByte board reads 0
bits.
9. Replace and align the upper bearing block, rubber pad down.
fingers do not come in contact with the upper bearing block.
Verify that the three guide
10. Apply a load of 20,000 pounds, and while it is held relatively constant verify that the
MetraByte board reads within 4-30 bits of -2000 bits. If necessary, adjust the Gain knob
on the 2310 signal conditioner in 0.1 increments (for example, from a setting of 5.50
xl00 to 5.40 xl00) to achieve the required reading. Release the load. Record the gain
setting.
Note: When the load is released the MetraByte board will not read exactly zero because
it was zeroed without the upper bearing block in place. Do not rezero the signal
conditioner at this point.
11. Apply load at a rate no faster than 1,000 pounds per minute. Record the MetraByte
board readings at 1,000 pound intervals up to a maximum load of 20,000 pounds. While
releasing the load, record a reading at 10,000 pounds and at zero load.
12. Remove the upper bearing block and, if necessary, adjust the Trim knob on the signal
conditioner until the MetmByte board reads 0 bits. Push and hold the Cal switch in the
+B position and record the reading. Repeat for the -B position. Set the Auto Balance
switch to OFF and again record the unbalanced zero voltage. This reading should be
within three bits of the earlier reading. If it is not, repeat the calibration procedure from
step 4 (be sure that the load cell is centered in the testing machine, and be sure to repeat
the 20,000-pound preloading procedure in step 6).
DATA ANALYSIS
Using a spreadsheet utility program such as Lotus 1-2-3, enter the results of the calibration.
In column A enter the nominal loads registered by the universal testing machine (i.e., 0,
1000, 2000, etc.). In column B correct these loads to the NIST traceable loads, based on the
certificate of calibration for the testing machine. In column C subtract the tare weight of the
upper bearing block from the loads in column B. In column D enter the MetraByte board
29
SHRP FWD CALIBRATION
PROTOCOL - April, 1993
readings in bits. Note that the readings are negative. In columns E, F, G and H calculate
V2, V3, W, and V5, respectively (where V represents the readings in column D).
Use the spreadsheet regression utility to calculate a linear regression of corrected load (as the
Y-variable) versus bits (as the X-variable). The regression should be forced through zero,
yielding an equation of the form Y = m V, where Y is the corrected load (column C), V is
the voltage (column D), and m is the slope of the line of best fit. The coefficient m should
be approximately -10 pounds per bit.
Use the regression utility to calculate a fifth degree polynomial regression of the form:
Y = A1 V + A2 V2 + A3 V3 + A4 V 4 + As V5
whez-e the coefficients _ are determined by the regression.
acc,:_ding to the following criteria.
Evaluate the polynomial solution
1. The standard error of the Y estimate should be less than +_50 pounds.
2. The standard error of each of the coefficients should be small with
coefficient. G_:,nerally speaking the coefficient should be at least a
than its standarc_ error. For instance, if the coefficient A 2 is -0.15,
should be +_0.015 or smaller. If this is not the case, the regression
significant.
respect to the
factor of ten larger
its standard error
coefficient is not
If the standard error any of the coefficients is too large (eg., not significant),
regression using a fourth degree polynomial of the form:
Y =AIV
+A2V
repeat the
2 +AaV 3 + A4V 4
Again evaluate the polynomial according to the criteria in 1 and 2 above. When the
evaluation criteria are satisfied, and all of the coefficients are significant (usually this will
hrppen with either a fourth degree polynomial or a third degree polynomial), record the
regression coefficients.
ENTER THE REGRESSION
COEFFICIENTS
IN FWDREFCL
The regression coefficients should be entered in the data acquisition program FWDREFCL.
Instructions for doing this can be found in the Load Cell Setup section of the FWDREFCL
User's Guide. Any of the unused higher order terms should have their coefficients entered
as 0.0.
30
..
SHRP FWD CALIBRATION
PROTOCOL - April, 1993
When the regression coefficients are entered in FWl)REFCL, the unbalanced zero, the +B
and -B calibration factors, the load cell signal conditioner gain factor, .and the date of
calibration should also be entered.
31
FWDCAL Version 2, Program Manual - February 1992
Appendix B
FWDCAI, 2.0 Program Listing
FM)CAL2.BAS
1
DECLARE SUB GainAdjustHsg
2
3
4
5
DECLARE SUB
DECLARE SUB
DECLARE SUB
DECLARE SUB
Harch
28,
1992 Page 1
()
ReplaceSensor
()
LatinPagel
()
GainsPagel
()
FiteToScneen
()
6
7
8
9
10
11
12
13
14
15
16
17
18
19
20
21
22
DECLARE SUB AvgGainToFile
()
DECLARE SUB AvgGainToScreen ()
DECLARE SUB StartAnatysis
()
DECLARE SUB OutputToFite
()
DECLARE SUB LatinSqDesign
()
DECLARE SUB SetectAnatysis
()
DECLARE SUB GetSensorNum ()
DECLARE SUB AssignPosition
(%ndex_, PositS())
DECLARE SUB BadFite ()
DECLARE SUB Quit ()
DECLARE SUB DisptayCopyright
()
DECLARE SUB CheckHeader (InitNumPeaks_,
InitNumWHStocks_,
DECLARE SUB ReadPeaks ()
DECLARE SUB ReadNextLine
(DataType_,
LineLength%)
DECLARE SUB GetFiteName
(FPath$,
fiLeS,
Ext$)
'$1NCLUDE: 'decLare.inc'
'$1NCLUDE: ,cmnbtank.inc'
23
24
25
26
27
28
29
30
31
32
33
34
35
COHHON SHARED /cat01/
LineCounter&,
LineData$,
English_,
Edition_,
ADFLag%, ADFLagl_,
R_DSN$, FiteDate$,
NumDeftectors_
COMHONSHARED/cat02/
[nitNumPeaks%+ OperatorS, PositS(),
Analysis$,
OExt$, SumTotat#, Ti#(),
SetCount_, TOL$(),
RAN$()
COHHONSHARED/cat03/StdDevDef!(),
StdDevPos!(),
HeanBySet!(),
NeanLoad!(),
HeanSet#(),
HeanPos#(), HeanDef#(),
NL_Drops_
COMHONSHARED/caL04/ NeanAtLLoad!,
StdDevAtLLoad!,
CVALLLoad!, CVPos!(),
CVDef!(),
NeanAttDef#,
StclDevAltDef!,
CVALLDef!
COHHONSHARED/ca[05/
SSLT#, SSLPos#, SSLSet#, SSLSens#, SSLE#, FLPes#, FLSet#, FLSens#
COMMONSHARED/caL06/
DegFreeLPos_, DegFreeLSet_,
DegFreeLSens_, DegFreeLE_, DegFreeLT_
COHHONSHARED/caL07/
RSLPos#, HSLSet#, RSLSens#, RSLE#, SerialNun_(),
ReLGain#(),
ReansRat#(),
Ne_Gain#()
COMMONSHARED/caL08/
DefData!(),
LoadData!(),
OutDef!(),
DataSetS(),
AvgMeansRat#(),
AvgNewGain#()
COHHONSHARED/carD9/
repml$, repmZ$, RepSens_, BigDef!,
G!, ProbtemExist_,
SC_, JnLanl_, JnLa_2_, LSAH$
36
37
38
39
40
41
'The determination
of significance
is based on a hard coded F-Statistic
'for a given set of degrees of freedom and confidence
[eve[.
'To modify the determination
of significance,
the user must change the value
'for
-FStatisticin this cede.
CONST True_ = -1, FaLse = O, CritFLPos!
= 2.14, CritFLset!
= 2.14, CritFLSens!
= 2.14
CONST NumSensors_ = 7, NmPositions_
= 7, NumSets_ = 7, NL_Reps_ = 5, Galph! = .2326
42
43
44
45
46
DIM
DIM
DIM
DIM
DIN
47
GP.Honitor_
48
49
CALL DisptayCopyright
FPath$ = ""
50
51
52
53
54
Start:
SCREEN O: WIDTH 80,
RepSens_ = 0
NumStations_ = 0
SetCount_ = 0
55
CLOSE
56
57
58
59
60
61
62
CALL SetectAnatysis
CALL GetFiteName(FPath$,
fiLeS,
Ext$)
Sources = FPath$ + fiLeS + Ext$
OPEN Sources FOR INPUT AS #1
CLS : CALL NormatColor:
LOCATE 13, 20: PRINT "Reading
LineCounter&
= 0
DO
ExitCode_)
DefData!(7,
7, 7, 5), LoadData!(35),
OutDef!(35,
7), DataSet$(3,
35)
PositS(7),
ReanSet#(7),
ReanPos#(7),
ReanDef#(7),
ReanLoad!(7)
CVPos!(7),
CVDef!(7),
StdDevDef!(7),
StdDevPos!(7),
MeanBySet!(7,
7)
Ti#(7),
RetGain#(lO),
NewGain#(3,
10), MeansRat#(3,
7), SeriatNum_(lO)
AvgNewGain#(7),
AvgHeansRat#(7),
TOL$(7),
RAN$(7)
= Honitor_
25: CLS
Input
B - 1
Data
from:
";
fiLeS
+ Ext$
F_)CALZ.BAS
Narch 28,
63
64
65
66
67
68
69
70
71
72
73
74
IF LineCounter&
< 37 THEN
CALL CheckHeader(InitgumPeaks_,
Initgum_HBtocks%,
ExitCode%)
ELSE
CALL ReadNextLine(DataType_,
LineLength_)
SELECT CASE DataType%
CASE 1
CALL ReadPeaks
'peak deflection
data block
CASE ELSE
EXIT DO
END SELECT
END IF
LOOP
75
76
77
78
79
80
81
82
83
84
85
86
87
88
89
90
91
92
93
94
95
96
97
98
IF DropCount_ <> CritNumDrops_ THEN
CALL BadFiLe
END IF
CLS : CALL NormalColor
IF (Se_:_ount% > 1) AND (Anatysis$
= "S") THEN
S_V!$ = "Input data file
has" + STRS(SetCount_)
+ " data sets"': SH1 = LEN(SHI$):
LOCATE ;2, 40 - SH1 / 2: PRINT SMI$
SH2$ = "Analysis
wilt
be performed sequentially
on each set":
SN2 = LEN(SH2$):
LOCATE 13, 40 - SN2 / 2: PRINT SN25;
SLEEP 6
ELSEIF (SetCount% • 1) AND (Anatysis$
= "G") THEN
SM15 = "Input data file
has" + STR$(SetCount_)
+ " data sets'=: SH1 = LEN(SHI$):
LOCATE 12, 40 - SN1 / 2: PRINT SN1$
SH25 = "Analysis
wilt be performed sequentially
on each set":
SH2 = LEN(SH2$):
LOCATE 13, 40 - SH2 / 2: PRINT SN2$;
SLEEP 4
ELSEIF (SetCount_
< 3) AND (Anatysis$
= "R") THEN
SH1$ = '"Not enough data sets to run Reference-Relative
Calibration
Analysis":
SH1 = LEN(SNI$):
40 - SH1 / 2: PRINT SH15
SM25 = "PLease select
correct
analysis
type from the menu": SM2 = LEN(SH2$):
LOCATE 13, 40 - SN2 / 2: PRINT SH2$
SLEEP 4
GOTO Start
END IF
99
100
101
102
103
106
105
106
107
108
109
110
111
112
113
114
115
OEXt$ = ".C" + Analysis3+
RIGHT$(Ext$,
1)
Outputs = FPath$ + files
+ OExt$
OPEN Outputs FOR OUTPUT AS #2
IF Analysis3
= "G" OR Analysis3
= "g" THEN
CALL GetSensorNum
END IF
CALL StartAna[ysis
IF SetCount% = 3 AND Anatysis$
= "R" THE;,
CALL AvgGainToFite
CALL AvgGainToScreen
END IF
IF Jnum1% • 0 AND Anatysis$
<> "R" THEN
CALL GainAdjustNsg
END IF
CLOSE
GOTO Start
CALL Quit
B-2
1992 Page 2
LOCATE 12,
FWDCAL2.BAS Hatch 28,
116
117
118
119
120
121
122
1_"4
124
125
SUB AssignPosition
(Inclex_,
PositS())
STATIC
Count = 0
FOR i = lndex_ TO NumSensors_
PositS(i)
= i - ]ndex_ + 1
NEXT i
FOR i = Index_ - 1 TO 1 STEP -1
Count = Count + 1
PositS(Count)
= Nund;ensors_ - i + 1
NEXT i
END SUB
B-3
1992 Page 3
FWDCAL2.BAS March 28,
126
127
128
129
130
131
132
133
134
135
136
137
138
139
140
141
142
143
144
145
146
147
148
149
1992 Page 4
SUB AvgGainToFite
FOR i% = 1 TO NumSensors_
AvgNewGain#(i_)
= (NewGain#(1,
i_) + NewGain#(2,
i_) + NewGain#(3,
i_))
/ 3
NEXT i_
, *******************************
Page 1 ******************************
Years = NID$(FiteDate$,
1, 2)
Months : MID$(FileDate$,
3, 2)
DayS = MID$(FiteDate$,
5, 2)
NDY$ = Months + "-" + DayS+ "-" + Years
,**********************
Geophone Catibration
Sensor ******************
PRINT #2, SPC(14); "SHRP FgD Retative
Catibration
- Average Gains Tabte"
PRINT #2, "Fkl) SN: "; FWDSN$; SPC(38);
,'Catibration
Date: "; HDY$
PRINT #2, "Data File Name : "; fires
+ Ext$; SPC(12); "Average Means and Gains for 3 data Sets"
PRINT #2, "Operator
: "; Operators
PRINT #2,
PRINT #2, "
Sensor
Existing
New Retative
Gain
"
PRINT #2, "
Sensor #
S/N
Gain Factor
Set 1
Set 2
Set 3
Average"
PRINT #2, "
...............................................
"
t85 = "
#
_
#.###
#-###
#-###
#-###
#-###"
FOR S% = 1 TO NumSensors%
PRINT #2, USING t85; S%; SeriatNum_(S_);
RetGain#(S_);
NewGain#(1, S_); NewGain#(2, S_); NewGain#(3,
AvgNewGain#(S_)
NEXT S_
END SUB
B-4
S%);
FWDCAL2.BAS Harch
150
151
152
SUB AvgGainToScreen
CLS : CALL NormatCotor
FOR i_ = 1 TO NumSensors_
153
154
155
156
157
158
159
160
161
162
163
164
165
166
167
168
169
170
171
172
173
AvgNewGain#(i_)
= (Re,Gain#(1,
i_) + NewGain#(2,
i_) + NewGain#(3,
i%)) / 3
NEXT i_
, *******************************
Page 1 ******************************
Years : HID$(FiteDate$,
1, 2)
Nonth$ = NIDS(FileDate$,
3, 2)
DayS = NiDS(FileOate$,
5, 2)
HDY$ = Honth$ + "-" + DayS + "-" + Years
'**********************
Geophone Calibration
Sensor ******************
PRINT SPC(14); "SHRP Fk_) Relative
Calibration
- Average Gains Table"
PRINT "FWI) SN: "; FM)SN$; SPC(38);
"Calibration
Date: "; 14DY$
PR%NT "Data File Name : "; fileS+
Ext$; SPC(12);
"Average Neans and Gains for 3 data
PRINT "Operator
: "; Operators
PRINT
PRINT "
Sensor
Existing
New Relative
Gain
"
PRINT "
Sensor #
S/N
Gain Factor
Set 1
Set 2
Set 3
Average"
PRINT "
...............................................
"
t85 = "
#
_
#.###
#.###
#*###
#-###
#.###"
FOR S% = 1 TO RumSensors_
PRINT USING t_; S_; SerialNum_(S_);
RelGain#(S_);
NewGain#(1,
S_); Re,Gain#(2,
AvgNewGain#(S_)
NEXT S_
174
175
176
LOCATE 25, 25: PRINT "Press
WHILE INKEY$ = "": WEND
END SUB
any key to continue";
B-5
28,
1992 Page 5
Sets"
S_);
NewGain#(3,
S_);
FWDCAL2.BAS Hatch 28,
177
178
SUB BadFite
CLOSE
179
180
181
182
183
184
185
186
187
188
189
190
191
192
193
194
195
196
197
198
199
COLOR 7, O, 0
CLS
PRINT : PRINT
PRINT "*
EXECUTION HALTED"
PRINT "*
The data file
selected
does not match the structure
specified
PRINT "*
for relative
calibration
in FWD Operational
Field Guidelines"
PRINT "*
Version
1.00, TABLE 6"
PRINT
IF Edition_
<> 10 AND Edition_
<> 20 THEN
PRINT "* Version 10 or 20 of Dynatest Field Program Not Used"
ELSEIF NumDeflectorsX
<> NumSensors_ THEN
PRINT "* Not Using 7 Deflectors"
ELSEIF ActiveOrops_
< 46 THEN
PRINT "* Less Than 46 Active Drops in Sequence"
ELSEIF InitNumPeaks_ NOD NumDrops_ • 0 THEN
PRINT "* Not Using 5 Repeat Drops"
END IF
PRINT
PRINT
END
END SUB
1992 Page 6
STATIC
B-6
+
"
FWDCAL2.BAS Hatch 28,
200
201
202
203
204
205
206
207
208
209
210
211
212
213
214
215
216
217
218
219
220
221
222
223
224
225
226
227
228
229
230
231
232
233
234
SUB CheckHeader ([nitNunPeaks_,
InitNumWHBtocks_,
ExitCode_)
STATIC
CALL ReadNextLine(DataType_,
LineLengthX)
SELECT CASE LineCounter&
CASE 1
FiteWidth_
= VAL(N]D$(LineData$,
2, 4))
IF FiteWidth_
= 32 THEN
EngLish_ = FaLse_
ELSE
EngtishX = True_
END IF
FiLeDate$ = N[D$(LineData$,
14, 6)
_Data coLLected on FiLeDate$
Edition_
= VAL(HID$(LineData$,
31, 2))
IF Edition_
<> 10 AND EditiorC_ <> 20 THEN CALL BadFite
CASE 2
NumDefLectors_ = VAL(LEFT$(LineData$,
1))
IF NumDefLectors_ <> NumSensors_ THEN CALL SadFiLe
FWDSN$= HID$(LineData$,
9, 8)
CASE 3 TO 10, 22 TO 29, 31, 32, 34 TO 36
CASE 11 TO 20
_deftector
1 to 10
SensorNumber_ = VAL(HID$(LineData$,
2, 2))
SeriaLNum_(LineCounter&
- 10) = VAL(HID$(LineDaLa$,
4, 5))
ReLGain#(LineCounter&
- 10) = VAL(HID$(LineData$,
10, 5))
CASE 21
'operator
Operators
= LTRIH$(RTRIH$(LineData$))
CASE 30
'active
sequence drops
Posit_ = INSTR(LineData$,
".")
ActiveDrops_
= Posit_
- 1
IF ActiveDrops_
< 46 THEN CALL BedFite
CASE 33
_peaks stored
CheckText$ = LEFT$(LineData$,
ActiveDrops_)
InitHumPeaks_
= ]nCount2_(CheckText$,
"*")
NumDrops_ = InitNumPeaks_ \ Nu_ets_
IF InitNumPeaks_ HOD NunOrops_ • 0 THEN CALL BadFiLe
END SELECT
END SUB
B-7
1992 Page 7
FIJDCAL2.BASHatch 28, 1992 Page 8
235
236
237
238
239
240
241
242
243
244
245
246
247
248
269
250
251
252
253
254
255
256
257
258
259
260
261
262
263
264
SUBCochran
'Cochran's test to determine significance of variance between sensors
=set up Vdef (Nean, Sensor) for sorting
DIN Temp(1, 2), Vdef(7, 2)
FORS%= 1 TO 7
Vdef(S%, 1) = StdDevDef!(S_) ^ 2
Vdef(S_, 2) = S_
NEXT S_
'SORT
FOR Itev_ = 1 TO 7
FOR S%= 1 TO 6
IF Vdef(S% + 1, 1) • Vdef(S%, 1) THEN
Temp(1, 1) = Vdef(S_ + 1, 1)
Temp(1, 2) = Vdef(S_ + 1, 2)
Vdef(S% + 1, 1) = Vdef(S_, 1)
Vdef(S_ + 1, 2) = Vdef(S[, 2)
Vdef(S%, 1) = Temp(1, 1)
Vdef(S_o 2) = Temp(1, 2)
ENDIF
NEXT S_
NEXT Iter_
BigVarDev! = Vdef(1, 1)
BigDef! = Vdef(1, 2)
,Sum art Neans
FORM_= 1 TO 7
SumVarOev! = SumVargev! + StdDevl)ef!(N%) ^ 2
NEXTN%
G! = BigVarOevJ / SumVarDev!
IF G! • Gatph! THENProbtemExistX = 1
ENDSUB
B-8
FWDCAL2.BAS Narch
265
266
267
SUB DisptayCowright
STATIC
SCREEN O: WIDTH 80: CLS
PRINT
269
270
271
272
273
274
275
276
277
278
279
280
281
282
PRINT "
PRINT "
PRINT "
PRINT "
LOCATE 10, 20: PRINT
LOCATE 12, 35: PRINT
LOCATE 15, 20: PRINT
LOCATE 20, 10: PRINT
LOCATE 21, 12: PRINT
LOCATE 23, 13: PRINT
SLEEP 4
CALL NormatCo[or
CALL CtearBuf
END SUB
FWDEPIL
"
"
"
"FWD Retative
Catibration
AnaLysis Software"
"Version
2.0"
"Strategic
Highway Research Program
(SHRP)"
"Support material
Cowright
(c) 1989
PCS/Law Engineering
Inc."
"Additional
material
Copyright
(c) 1988
Crescent Software"
,'Enhancements by Nichots Consutting
Engineers,
Chtd. 1992."
B-9
28,
1992 Page 9
Fk_)CAL2.BAS March 28,
283
284
SUB FiteToScreen
FTS$ = "Y"
285
286
287
288
289
290
291
292
293
294
295
296
297
298
299
300
301
302
303
30/,
305
306
307
308
309
310
311
312
313
314
315
316
317
318
319
320
321
322
323
324
325
326
327
328
329
330
331
332
333
334
WfndowType_ = 1: CLS
WFite$ = files
+ OExt$
CALL NormatColor
LOCATE 7, 7: PRINT "Output Path and Fire Name: "
LOCATE 7, 37: PRINT FPath$; WFite$
LOCATE 13, 7: PRINT "DispLay catibration
resutts
on screen: "
CALL HititeCotor
LOCATE 13, 50: PRINT FTS$
CALL NormatCoLor
DO
OtdFTS$ = FTS$
CALL GetString(13,
50, 1, FTS$, "U', O, O, "", "", ExitCode_)
FTS$ = UCASES(FTS$)
SELECT CASE FTS$
CASE "Y"
CALL NormatCotor:
CLS
CALL GafnsPagel
Img$ = "PgDn to ANOVA Tabte
Esc to exit
resutts
Img / 2: PRINT Img$;
DO
DO
aS = INKEY$: LOOP WHILE aS = ""
IF LEN(as) = 2 THEN
aS = RIGHTS(aS, 1)
END IF
SELECT CASE aS
CASE CHR$(73) ' page up
CALL GainsPagel
]mg$ = "PgDn to ANOVA Tabte
Esc to exit results
Img / 2: PRINT Zmg$;
CASE CHR$(81) ' page down
CALL LatinPagel
Img$ = "PgUp to Gains Tabte
Esc to exit resutts
- Img / 2: PRINT Img$;
CASE CHR$(27)
EXIT DO
END SELECT
LOOP
EXIT DO
CASE "N"
EXIT DO
CASE ELSE
REDIH PUText$(1)
PUText$(1)
= "Ptease enter a Y or N onty..."
CALL PopupError
FTS$ = OLdFTS$
END SELECT
LOOP
CLS
END SUB
1992 Page 10
STATIC
B-
10
screens":
Img = LEN(Img$):
LOCATE 25,
40
screens":
Img = LEN(Img$):
LOCATE 25,
40
screens":
Img = LEN(Img$):
LOCATE 25,
40
FI_DCAL2.BAS March 28,
335
336
337
338
339
340
341
342
343
346
345
346
347
348
349
350
351
SUB GainAdjustMsg
SCREEN O: WIDTH 80, 25: CLS : CALL NormalColon
Years = MID$(FileDate$,
1, 2)
Months = MlDS(FileDate$,
3, 2)
DayS = MID$(FileDate$,
5, 2)
MDY$ = Months + "-" + DayS+ "-" + Years
**************************
Geophone Gain Adjustments ******************
PRINT
PRINT SPC(15);
"SHRP FMD Relative
Calibration
Gain adjustments"
PRINT
PRINT "FWD SN: "; FtJDSN$; SPC(38); ,'Calibration
Date: "; MDY$
PRINT "Data File Name : "; files
+ Ext$
PRINT -Operator
: "; Operators
PRINT
PRINT
PRINT "Results
of this test indicate
the possible
need to adjust
then gains."
PRINT "This should be confimed
with a repeat test."
352
353
354
PRINT
PRINT "Gain adjustment
should
PRINT ,,independent
calibrations
355
356
PRINT
PRINT "Gain
357
358
359
PRINT
PRINT "After
adjusting
any gain
PRINT "repeated
to confirm that
360
361
362
bm$ = "Press any key to continue":
WHILE INKEY$ = "": MEND
END SUB
adjustments
be performed
are _ithin
should
_hen the ne_ gain factors
from two"
"; CHR$(241); "0.002 of each other."
be made ONLY to the out of
range geophone(s)."
setting,
the relative
calibration
all sensors are within
tolerance."
I_l
= LEN(I_$):
LOCATE 25,
B-
11
test
must be"
40 - 10ml / 2:
PRINT I_$;
1992 Page 11
Fkl)CAL2.BAS
March 28,
1992 Page 12
363
364
365
366
367
368
369
370
371
372
SUB GainsPagel
SCREEN O: WIDTH 80, 25: CLS
Years = HIDS(FiteOate$,
1, 2)
MonthS = MID$(FiteDate$,
3, 2)
DayS = HZO$(FiteDateS,
5, 2)
NDY$ : Months + "-" + DayS + "-" + Years
**************************
Geophone Calibration
******************
PRINT SPC(18);
"SHRP FtdD Relative
Calibration
- Gains Table"
PRINT "FWD SN: "; FWDSN$; SPC(37);
"Calibration
Date: "; MDY$
PRINT "Data File Name : "; files
+ Ext$; SPC(32); "Data Set "; SC%; " of ";
373
374
375
376
377
378
379
380
381
382
383
384
385
386
387
388
389
390
391
392
393
394
395
396
397
398
PRINT "Operator
: "; Operators
PRINT
PRINT "
Sensor
Existing
Weans
New
Out of Limit"
PRINT "
Sensor #
S/N
Gain Factor
Ratio
ReLative Gain
ToLerance
2_ Range"
PRINT "
.............................................................
"
t85 = "
#
_
#.;;_
#.####
#.###
\
\
\
V'
FOR S% = 1 TO NumSensors_
PRINT USING t85; S_; SeriatNum_(S_);
RetGain#(S_);
NeansRat#(SC_,
S_); NeNGain#(SC%, S%); TOL$(S%); RAN$(S%)
NEXT S%
PRINT
IF Jnuml_ > 0 THEN
PRINT "* Warning: At least one sensor is outside the tolerance
limit."
PRINT " Verify
these results
with an additional
test!"
END IF
IF Jnum2_> 0 THEN
PRINT "* Warning: At least one sensor is outside the 2_ range limit."
PRINT " Notify
Supervising
Engineer after
verifying
with additional
tests!"
END IF
IF Jnum1% > 0 THEN
PRINT "* RESULTS INDICATE THAT THE SENSOR GAINS SHOULDBE RESET."
END IF
IF RepSens_ • O THEN
PRINT repml$
PRINT repm2$; USING "#.###";
NewGain#(SC%, RepSens_)
END IF
END SUB
B-
12
SetCount%
FWDCAL2.BAS March 28,
399
400
401
402
403
404
405
406
407
408
409
410
411
412
413
414
415
416
417
SUB GetFileName
(FPath$,
fileS,
Ext$) STATIC
STATIC ZP$
WindowType_ = 1: CLS
IF ZP$ = "" THEN ZP$ : "N"
WFiLe$ = files
IF Ext$ <> "" THEN
WFile$ = WFile$ + Ext$
END IF
CALL ScreenBorder
CALL TitteCotor
Titles
= "
FWD Data File Selection
"
TL_ = LEN(Titte$)
Cot_ = ((80 - TL_) / 2) + 1
LOCATE 2, COL%: PRINT Titles
CALL NormatCotor
LOCATE 7, 7: PRINT "Directory
path for data file:
";
LOCATE 10, 7: PRINT "Do you want a list
of data files
LOCATE 13, 7: PRINT "Deflection
Data File Name: "
CALL HititeColor
418
419
420
421
LOCATE 7, 37: PRINT FPath$
LOCATE 10, 60: PRINT ZP$
LOCATE 13, 34: PRINT WFite$
CALL NormatCotor
422
423
424
425
426
427
428
429
430
LOCATE 25, 4
PRINT "
FlO:Continue
"; CHR$(24);
PRINT "
Home End
FT:Quit";
Item_=
1
Maxltem_= 3
DO
SELECT CASE Item%
CASE 1
OtdPath$ = FPath$
431
432
433
434
435
436
437
438
439
440
441
442
443
444
445
446
447
448
449
450
451
452
453
454
455
456
457
458
459
460
461
462
463
464
465
466
467
for
this
path
(Y/N)
1992 Page 13
"
CHR$(25);
CALL GetString(7,
37, 32, FPath$, "U',
O, O, "", "", ExitCode%)
FPath$ = LTRIM$(RTRIM$(UCASE$(FPath$)))
CurrDrive$
= CHR$CGetDrive%)
CurrDir$ = GetDir$(CurrDrive$)
CurrPath$ = CurrDrive$ + ":" + CurrDir$
IF FPath$ <> "" THEN
IF MID$(FPath$, 2, I) = ":" THEN
Chld)rive$
= LEFT$(FPath$,
1)
IF NOT GoodDrive%(Chld)rive$)
THEN
'check if valid drive
REDIM PUText$(1)
PUText$(1) = "Drive " + ChkDrive$ + " is not a valid choice... Please try another path."
CALL PopupError
ExitCede% = 0
FPath$ = OtdPath$
ELSE
'drive OK, check dir
IF RIGHT$(FPath$,
I) = "V' THEN
FPath$ = LEFT$(FPath$,
LEN(FPath$) - 1)
END IF
IF RIGHT$(FPath$, I) = ":" THEN
FPath$ = FPath$ + "V'
END IF
CALL CDir(FPath$,
ErrFtag%)
IF NOT ErrFlag_
THEN
'path OK
CALL CDir(CurrPath$,
ErrFtag%)
'
switch back to curr dir
ELSE
'path not OK
REDIM PUText$(2)
PUText$(1) = "Error occurred switching to " + FPath$
PUText$(2) = "May not be a valid path... PLease try again."
CALL PopupError
ExitCode% = 0
FPath$ = OldPathS
END IF
END IF
ELSE
'no drive
letter
in spacified
path
IF RIGHT$(FPath$,
1) = "V' THEN
FPath$ = LEFT$(FPath$,
LEN(FPath$) - 1)
END IF
B"
13
Ft,'DCAL2.BAS March 28,
468
469
470
471
472
473
474
475
476
477
478
479
480
481
482
483
484
485
486
487
488
489
490
491
492
493
494
495
496
497
498
499
500
501
CALL CDir(FPath$,
ErrFtag_)
IF NOT ErrFtagX THEN
'path OK
CALL CDir(CurrPath$,
ErrFtag_)
'
switch back to curr dir
ELSE
'path not OK
REDIM PUText$(2)
PUText$(1)
: "Error
occurred switching
to " + FPath$
PUText$(2)
= "Nay not be a valid path...
Please try again."
CALL PopupError
ExitCodeX = 0
FPath$ = OtdPath$
END IF
END IF
END IF
IF FPath$ <> "" AND RIGHTS(FPath$,
1) <> "V' THEN FPath$ = FPath$ + "V'
LOCATE 7, 37: PRINT FPath$
CASE 2
DO
OLdZP$ = ZP$
CALL GetString(lO,
60, 1, ZP$, "U', O, O, "", "", ExitCode_)
ZP$ = UCASES(ZP$)
_ELECT CASE ZP$
CASE "Y"
ShowFites$ = FPath$ + "*.*"
Nuld4atchs_ = FCount_(ShowFites$)
IF Num/4atchs_ > 0 THEN
CALL DisptayFiteNames(NumNatchs_,
ShowFites$,
FPath$, fileS,
Ext$,
NFite$ = files
+ Ext$
ELSE
REDIN PUText$(1)
PUText$(1)
= "No files
fozmdmatching
" + ShowFiles$
CALL PopupError
ZP$ = "N"
END ]F
CASE "N"
502
503
504
505
506
507
508
509
510
511
512
513
514
515
516
517
518
519
520
521
522
523
524
525
526
527
528
529
53C
53
53"
533
534
535
536
'go on
CASE ELSE
REDIN PUText$(1)
PUText$(1)
= "PLease choose a Y or N only..,
try again!"
CALL PopupError
ExitCode_ = 0
END SELECT
IF ExitCode% <> 0 THEN EXIT DO
LOOP
CASE 3
DO
OtdUFite$
= NFite$
CALL GetString(13,
34, 12, gFite$,
"L", O, O, "",
"", ExitCode_)
gFite$ = LTRIN$(RTRIH$(UCASE$(NFiLe$)))
LF = LEN(NFiLe$)
FOR W = 1 TO LF
chk = ASC(RIDS(NFiLe$,
W, 1))
IF chk = 32 THEN
REDIH PUText$(1)
PUText$(1)
= "SPACES ARE NOT ALLONED IN FILE NARES"
CALL PopupError
NFite$ = Otc_Fite$
ExitCode_ = 0
EXIT FOR
END IF
NEXT W
IF ExitCode_ <> 0 THEN
SP_ = INSTR(NFite$,
".")
IF SP_ <> 0 THEN
files
= LEFT$(NFite$,
SP_ - 1)
Ext$ = LTRIN$(RTRIR$(RIGHT$CNFiLe$,
LENCNFite$)
- (SP_ - 1))))
ELSE
fiLeS = LTRIN$(RTRIM$(LEFT$(NFiLe$,
8)))
EXt$ = ""
END IF
B-
14
Ex_tCode_,
O)
1992 Page 14
,
537
538
539
540
541
542
543
544
545
546
547
548
549
550
551
552
553
554
555
556
557
558
559
560
561
562
563
564
565
566
567
568
569
570
571
572
573
574
575
576
577
578
579
580
581
FM)CAL2.BAS
EXIT DO
END IF
LOOP
END SELECT
SELECT CASE ExitCode%
'determine
next action
CASE 71
'home
Item_ = 1
CASE 79
'end
Item_=
MaxItem_
CASE 15, 75, 72
'Shift-Tab,
Left arrow, up arrow
ItemX=
Item_ - 1
CASE 9, 13, 77, 80
'Tab, CR, right arrou, doun arrow
Item_=
Item_+
1
CASE 68
'FlO:Continue
IF fiLeS = "" THEN
REDIM PUText$(1)
PUText$(1)
= "A file
name must be entered..,
please try again!"
CALL PopupError
Ite_
= 3
ELSE
ChkName$ = FPath$ + files
+ Ext$
IF NOT Exist%(ChkName$)
THEN
REDIM PUText$(1)
PUText$(1) = "FiLe not found...
Please try again."
CALL PopupError
fiLeS = ""
Ext$ = ""
ExitCode_ = 0
It_
= 3
ELSE
ExitCode%=
1
EXIT SUB
END IF
END IF
CASE 65
=F7: quit
CLS
PRINT : PRINT : PRINT "Program Execution Terminated
by User"
END
CASE ELSE
' do nothing
END SELECT
IF Item_ < 1 THEN Item_ = 1
IF It_
> MaxItem_ THEN It_
= MaxIten_
LOOP
END SUB
B-
15
March 28,
1992 Page 15
FWDCAL2.BAS Hatch 28,
582
583
584
585
586
587
588
589
SUB GetSensorNum
CLS
Chofce_ = 1
DO
REDIH Item$(NumSensors_
+ 2)
TitLeS = " SeLect Geophone RepLaced "
FOR i_ = 1 TO NumSensors_
Item$(i_)
= "Sensor No." + STR$(SeriatNum_(i_))
590
591
592
593
594
595
596
597
598
599
600
601
602
60]
604
605
606
607
608
609
610
611
612
613
614
615
616
617
618
619
620
621
622
623
NEXT i_
Iteln$(8)
= "No RepLacement"
[tenS(9)
= "Quit Program"
CALL SarNenu(Titte$,
ItemS(),
Choice_,
O)
SELECT CASE Cho_ce_
CASE 1
EXIT DO
CASE 2
EXIT DO
CASE 3
EXIT DO
CASE 4
EXIT DO
CASE 5
EXIT DO
CASE 6
EXIT DO
CASE 7
EXIT DO
CASE 8
EXiT DO
CASE 9
SCREEN O: WIDTH 80, 25: CLS
CLOSE : CALL NormatCotor
PRINT
PRINT "Program terminated
by the user"
END
CASE ELSE
REDIH PUText$(1)
PUText$(1)
= "PLease SeLect Sensors 1 through
CALL PopupError
END SELECT
LOOP
IF Choice% = 8 THEN
624
625
626
627
628
629
650
7 only..."
RepSens_ = 0
ELSE
RepSens_ = Choice_
END IF
CLS
CALL NormatCotor
END SUB
B-
16
1992 Page 16
FWDCAL2.BAS March 28,
1992 Page 17
631
632
633
634
635
636
SUB LatinPagel
SCREEN O: WIDTH 80, 25: CLS
Years = NIDS(FiteDate$,
1, 2)
Months = MID$(FiteDate$,
3, 2)
DayS = MlDS(FileDate$,
5, 2)
MDY$ = Months + "-" + Days + "-"
637
638
639
640
641
PRINT
PRINT
PRINT
PRINT
PRINT
642
643
644
645
646
647
648
649
650
651
652
653
654
655
'*******************
Latin Square Design Analysis
Output *****************
PRINT "
Variation
Sum of
Degrees of
Mean
Computed
Critical"
PRINT "
Source
Squares
Freedom
Square
f
f"
PRINT "
.......................................................
"
Data$ : "
\
\
##.#_^^^
###
##.##_^^^
_#_#-##
##-##"
IF FLPos# > 1000 OR FLSet# • 1000 OR FLSens# • 1000 THEN
Data$ = "
\
\
##-##_^^^
###
##-##_^^^
##-##^^^^
##-##"
END IF
PRINT USING Data$; "Position";
CSNG(SSLPos#); DegFreeLPos%; CSNG(NSLPos#); CSNG(FLPos#); CritFLPos!
PRINT USING Data$; "Set";
CSNG(SSLSet#); DegFreeLSet%; CSNG(MSLSet#); CSNG(FLSet#); CritFLset!
PRINT USING Data$; "Sensor";
CSNG(SSLSens#); DegFreeLSens%; CSNG(MSLSens#); CSNG(FLSens#); CritFLSens!
PRINT USING Data$; "Error";
CSNG(SSLE#); DegFreeLE_; CSNG(HSLE#)
PRINT USING Data$; "TOTAL"; CSNG(SSLT#); DegFreeLT%
PRINT
656
657
658
659
660
661
662
663
IF Jnum1% • 0 THEN
SELECT CASE LSAM$
CASE "YNN"
PRINT "Gain adjustments
are indicated
and drop set is statistically
PRINT "the 5_ level.
'Set'
significance
may be due to warming of the
PRINT ,'consolidation
of pavement materials
during the test.
A repeat
PRINT "after
conditioning
the FWDbuffers
with 50 drops from height
PRINT "to confirm the need for gain adjustments.
If the deflections
664
665
PRINT "drops vary by mere than I mit (25.4 microns), repeat the calibration at a "
PRINT "new location."
666
667
668
669
670
671
CASE "YYN"
PRINT "Gain adjustments are indicated. Sensor and drop set are statistically "
PRINT "significant
at the 5% level.
A repeat calibration,
after
conditioning
the F_D "
PRINT "buffers
with 50 drops at height 3, is required
to confirm the need for gain
"
PRINT "adjustments. If deflections for the Last 10 drops vary by mere than I mit
"
PRINT "(25.4 microns) repeat the calibration at a new Location."
672
673
674
675
676
677
678
679
CASE "YNY"
PRINT "Gain adjustments are indicated. Set and stand position are statistically "
PRINT "significant
at the 5% level.
A repeat calibration,
after
conditioning
the FWD"
PRINT "buffers
with 50 drops at height 3, is required
to confirm the need for gain
"
PRINT "adjustments.
ghen doing the calibration,
extra care should be taken to seat
"
PRINT "the geophones properly,
and hold the stand vertically,
with a moderate Level "
PRINT "of downward pressure.
If deflections
for the Last 10 drops vary by more than "
PRINT "I mil (25.4 microns) repeat the calibration at a new location."
680
681
682
683
684
685
686
687
CASE "YYY"
PRINT "Gain adjustments
are indicated.
Set, sensor, and stand position
are
"
PRINT "statistically
significant
at the 5_ Level. A repeat calibration
is required
"
PRINT "after
conditioning
the FWObuffers
with 50 drops at height 3 for adjustments."
PRINT "When doing the calibration,
extra care should be taken to property
seat the
"
PRINT "geophones, and hold the stand vertically,
with a moderate level of downward
"
PRINT "pressure.
If deflections
for the last 10 drops vary by more than 1 "
PRINT "mil (25.4 microns) repeat the calibration at a new Location."
688
CASE i'NNN"
689
690
PRINT "Nothing is significant. Gain adjustments are indicated. A repeat calibration"
PRINT "is required to confirm the need for adjustments."
691
692
CASE "NYN"
PRINT "The
+ Years
SPC(12);
"SHRP FM) Relative
Calibration
- Latin Square ANOVA Table"
"Fkl) SN: "; Fk_)SN$; SPC(37); "Calibration
Date: "; MDY$
"Data File Name : "; files
+ Ext$; SPC(32); "Data Set "; SC%; " of ='; SetCount%
"Operator
: "; Operators
gain
ratios
and the statistical
results
indicate
B - 17
that
significant
at "
buffers
or "
calibration,
"
3, is required"
from the last 10"
gain
adjustments"
Fkl)CAL2.BAS
A repeat
693
694
PRINT "are needed.
PRINT "adjustments."
695
696
697
698
699
700
CASE "NNY"
PRINT "Gain adjustments
are indicated.
Stand position
is statistically
PRINT "significant
at the 5_ level.
A repeat calibration
is required
to confirm
PRINT "the need for gain adjustments.
Care should be taken to ensure that the
PRINT "geophone bases are clean,
firmly
seated,
and that the stand is held
PRINT "vertically
with moderate downward pressure."
701
702
703
704
705
706
CASE "NYY"
PRINT "Gain adjustments
are indicated.
Sensor and Stand position
are statistically"
PRINT ='significant
at the 5_ level.
A repeat calibration
is required
to confirm
PRINT "the need for gain adjustments.
Care shoutd be taken to ensure that the
PRINT "geophone bases are clean, firmly
seated,
and that the stand is held
PRINT =,vertically
with moderate downward pressure."
707
708
709
710
CASE ELSE
END SELECT
ELSE
SELECT CASE LSAH$
711
712
713
714
715
716
717
CASE "YNN"
PRINT "No gain adjustments
are indicated,
but drop set is statistically
significant"
PRINT "at the 5% Level. This can be due to warming of the buffers
or consolidation
"
PRINT "of pavement materials
during the test.
Review the data carefutty.
If anything"
PRINT "appears suspect,
repeat the calibration
after
conditioning
the F_D buffers
with ='
PRINT "50 drops from height ].
If the deflections
from the last 10 drops vary by mere"
PRINT "than 1 mit (25.6 microns),
repeat
the calibration
at a new location."
718
719
720
721
722
723
CASE "YYN"
PRINT "Sensor and drop set are statistically
significant
at the 5_ Level, but"
PRINT "gain adjustments
are not indicated.
Review the data carefully.
If anything
"
PRINT "appears suspect,
repeat the calibration
after conditioning
the FM) buffers
with"
PRINT ='50 drops from height 3. If the deflections
from the Last 10 drops vary by mere"
PRINT "than 1 mil (25.6 microns),
repeat
the calibration
at a new location."
724
725
726
727
728
729
730
7"51
CASE "YNY"
PRINT "Set and stand position
are statistically
significant
at the 5_ Level, but
"
PRINT '=gain adjustments
are not indicated.
Examine the data carefully.
If anything"
PRINT "appears suspect,
repeat
the calibration
after
conditioning
the FI_) buffers
with"
PRINT "50 drops from height
]. ghen doing the calibration,
extra care should be taken to"
PRINT "property
seat the geophones and hold the stand vertically
with moderate downward"
PRINT "pressure.
If deflections
for the Last 10 drops vary by mere than 1 mit"
PRINT "(25.6
microns) repeat the calibration
at a new Location."
732
733
734
735
736
737
738
739
760
CASE "YYY"
PRINT "Set,
sensor, and stand position
are statistically
significant
at the 5_ Level."
PRINT "ALthough gain changes are not indicated,
these results
are suspect.
A repeat
"
PRINT "calibration
is required
after conditioning
with 50 drops at height 3."
PRINT "Extra
care should be taken to property
seat the geophones and hold the stand"
PRINT "vertically
with moderate downward pressure.
If deflections
for the Last 10 drops"
PRINT ='If vary by mere than 1 miL (25.6
microns)
repeat the calibration
at a new"
PRINT "location.
If this message appears in subsequent tests,
contact your supervising"
PRINT "engineer
for further
instructions.
"
761
742
CASE '=NNN"
PRINT "Results
743
744
745
746
747
768
769
750
751
752
CASE "NYN"
PRINT "Sensor is statistically
PRINT "not indicated.
Test
PRINT "suspect,
repeat the
indicate
that
calibration
no gain
is
required
adjustments
to confirm
the
need for
March 28,
gain"
"
"
"
"
"
"
"
are needed."
significant
at the 5_ level,
but gain adjustments
are"
results
should be carefully
reviewed.
If anything
appears"
calibration.
Otherwise,
these results
are acceptable."
CASE "NNY"
PRINT ='Gains do not needed to be adjusted,
but stand pesition
is statistically
"
PRINT "significant
at the 5_ Level. This may be caused by failure
to keep the stand "
PRINT "vertical,
or improper seating of the geophones. In the future,
care should be"
PRINT "taken to ensure that the geophone bases are clean and welt seated,
and the
"
B - 18
1992 Page 18
FWDCAL2.BAS March 28,
753
PRINT ',stand
is
kept
vertical
754
755
756
757
758
759
CASE "NYY"
PRINT "Sensor and stand position
are statistically
significant
at the 5_ level,
but "
PRINT "gain adjustments
are not indicated.
Review calibration
results
carefully.
"
PRINT "if
anything appears suspect,
repeat the calibration,
taking
care to ensure "
PRINT "that
geophone bases are clean and property seated,
and the stand is kept"
PRINT "vertical
with moderate downward pressure."
760
761
762
763
764
CASE ELSE
END SELECT
END IF
,*******************
IF ProbtemExist_
765
766
767
768
PRINT "**
PRINT "
END IF
END SUB
Cochran
= 1 THEN
with
test
moderate
results
downward pressure."
*************************
Cochran test variance
between geophones indicates
variance
for
is significantly
larger
than the other sensors. Please consult
B - 19
Sensor No. "; BigDef!
the output file."
1992 Page 19
FWDCALZ.BAS Hatch 28,
769
770
771
772
773
774
775
776
777
778
779
780
781
782
783
784
785
786
787
788
789
790
791
792
793
794
795
796
797
798
799
800
801
802
803
804
805
806
807
808
809
810
811
812
813
814
815
816
817
818
819
820
821
822
823
826
825
826
827
828
829
830
831
SUB Lat inSqDesign
'***********************************************************************
'
Subprogram for Latin Square Design analysis
'************************************************************************
DIN Tj#(7),
Tk#(7),
Tij#(7,
7), Tik#(7,
7), Tjk#(7,
7), Tijk#(7,
7, 7)
DIN SSumTi#(7),
SSumTj#(7),
SSumTk#(7), SetSum(7), TotatLoad(35)
=***************
I ni t i a l i ze Vat iab[ es to Zero ***************
SumTotat# = 0
TotatSS# = 0
FOR i_ = 1 TO NumSensors_
Ti#(i_)
= 0
Heard)ef#(i_)
= 0
NeanPos#(iX)
= 0
NeanSet#(i_)
= 0
FOR J_ = 1 TO NumSets_
NeanBySet!(i_,
J_) = 0
NEXT J_
NEXT i_
,***************
Compute main statistics
for the anatysis
***************
FOR i_ = 1 TO NumSensors_
FOR J_ = 1 TO NumPositions_
FOR I_ = 1 TO NumSets_
FOR L_ = 1 TO NumReps_
SumTotat# = SumTotat# + DefData!(i_,
J_, k_, L_)
TotaLSS# = TotatSS# + (DefData!(i_,
J_, I_, L_)) ^ 2
Ti#(i_)
= Ti#(i_)
+ DefData!(J_,
J_, IC_, L_)
SSumTi#(i_)
= SSumTi#(i_)
+ (DefData!(i_,
J_, I_, L_)) ^ 2
Tj#(J_)
= Tj#(J_)
+ DefData!(i_,
J_, k'_, L_)
SSumTj#(J_)
= SSumTj#(J_) + (DefData!(i_,
J_, I_, L_)) ^ 2
Tk#(l_)
= Tk#(l_)
+ DefData!(i_,
J_, K_, L_)
Tij#(iX,
J_) = Tij#(i_,
J_) + DefData!(i_,
JX, I_, L_)
Tik#(i_,
k'_) = Tik#(i_,
k'_) + DefData!(i_,
J_, I_, L_)
Tjk#(J_,
I_) = Tjk#(J_,
k_) + DefData!(i_,
J_, I_, L_)
Tijk#(i_,
J_, K_) = Tijk#(i_,
J_, K_) + DefData!(i_;,
J_, I_,
NEXT L_
NEXT I_
NEXT J_
NEXT i_
SumTi# = 0
SumTj# = 0
SumTk# = 0
SumTij# = 0
SumTik# = 0
SumTjk# = 0
FOR i_ = 1 TO NumSensors_
SumTi# = SumTi# + Ti#(i_)
^ 2
SumTj# = SumTj# + Tj#(i_)
^ Z
SumTk# = SumTk# + Tk#(i_)
^ 2
FOR J_ = 1 TO NumOositions_
SumTij# = SumTij# + Tij#(i_,
J_) ^ 2
SumTik# = SumTik# + Tik#(i_,
J_) ^ 2
SumTjk# = SumTjk# + Tjkf(i_,
J_) ^ Z
NEXT J_
NEXT i_
'***************
Compute Std. Dev. for the data set ****************
FOR i_ = 1 TO NumSensors_
FOR K'_ = 1 TO NumSets_
NeanBySet!(i_,
ICZ) = Tik#(i_.,
I_) / NumReps_
NEXT ICZ
HeanDef#(i_)
= Ti#(i_)
/ (NumSensors_ * NumReps_)
HeanPos#(i_)
= Tj#(i%)
/ (NumPositions_
* NumReps%)
HeanSet#(i_)
= Tk#(i_)
/ (NumSets_ * NumReps_)
NEXT i5_
832
833
834
SSumLoad# = 0
TotatAtlLoad#
= 0
Set_ = 1
835
836
FOR D_ = 1 TO NumSets_ * NumReps_
SSumLoad# = SSumLoad# + LoadData!(D_)
^ 2
B - 2O
1992 Page 20
'_
L%)
FWDCAL2.BAS March 28,
837
838
839
840
841
842
843
8/+4
845
8/+6
847
848
TotatAlLLoad#
= TotalAttLoad#
+ LoadData!(D%)
TotatLoad(Set%)
= TotaLLoad(Set%)
+ LoadDataZ(D%)
IF D% MOO5 = 0 THEN SetX = Set_ + 1: MeanLoad!(Set_
NEXT D%
- 1) = TotatLoad(Set_
MeanAlLLoad! = TotaLAttLoad#/
(NumSets_*
NumReps_)
StdDevAlLLoad!
= $QR((SSumLoad# - ((NumSets_ * NumReps_) *
- 1) / 5
(MeanAlLLoad!)
^ 2))
/
(NumSets% * NumReps_ -
1))
CVALtLoad! = (StdDevALLLoad! / MeanALtLoad!) * 100
MeanAttDef# = SumTotat# / (Nu_ensors_
* NumSets_ * Nun_eps_)
StdDevAttDef!
= SQR((TotatSS#
- (NumPositions_
* Nm_ets% * Nu_eps_)
NumSets_ * NurnReps_)) ^ 2)) / (Nul_ositions_
* NumSets_ * NumReps_ - 1))
CVALLDef! = (StdDevAttDef!
/ MeanAttDef#)
* 100
849
850
851
852
FOR i_ = 1 TO NumSensors_
StdDevDef!(i%)
= SQR((SSumTi#(i%)
/ (NUl_ensors_
* NumReps_ - 1))
StdDevPos!(i%)
= SQR((SSumTj#(i%)
853
854
855
856
857
858
NumReps% - 1))
CVDef!(i_)
= (StdDevDef!(i%)
/ MeanDef#(i%))
* 100
CVPos!(i_)
= (StdOevPos!(i%)
/ NeanPos#(i_))
* 100
MeansRat#(SC%, i_) = MeanALiDef# / MeanDef#(i%)
NewGain#(SC_, i_) = MeansRat#(SC%, i%) * ReLGain#(i%)
NEXT i%
859
,**************
Compute final
- ((NumSensors% * NumReps%) * (Ti#(i%)
- ((Nul_ositions%
LATIN-SQARE statistics
* NumReps%) *
*****************
NegTern_f = (SumTotaL# ^ 2) / (N_Positions%
* NumSets% * NumReps%)
SSLT# = TotaiSS# - NegTern#f
SSLPos# : SumTj# / (NunzOositions_ * NumReps_) - NegTerlrdf
SSLSet# = SumTk# / (NumSets_ * NumReps%) - NegTerm#
SSLSens# = SumTi# / (NumSensors_ * NumReps%) - NegTern#/
SSLE# = SSLT# - SSLPos# - SSLSet# - SSLSens#
866
867
868
869
870
DegFreeLPos% = NumPositions_
- 1
DegFreeLSet% = NumSets_ - 1
DegFreeLSens% = N_ensors_
- 1
DegFreeLT% = (N_Positions%
* Nu_Sets% * NumReps%) - 1
DegFreeLE% = DegFreeLT_ - DegFreeLPos_.DegFreeLSet% - DegFreeLSens_
MSLPos# = SSLPos# / DegFreeLPos%
MSLSet# = SSLSet# / DegFreeLSet%
MSLSens# = SSLSens# / DegFreeLSens%
NSLE# = SSLE# / DegFreeLE%
FLPos# = MSLPos# / HSLE#
FLSet# = HSLSet# / MSLE#
FLSens# = MSLSens# / MSLE#
END SUB
B - 21
*
((SumTotat#
/
(NumSensors% * NumReps%)) ^ 2))
(MeanPos#(i%))
860
861
862
863
86/+
865
871
872
873
874
875
876
877
878
1992 Page 21
^ 2))
/
/
(NumPositions%
(NumPositions%
*
*
FWDCAL2.BAS Hatch 28,
879
880
881
882
883
884
885
886
SUB OutputToFite
DIM Avg$(7)
YearS = NID$(FiteDateS,
1, 2)
Nonth$ = NIDS(FiteDate$,
3, 2)
DayS : MIDS(FiteDateS,
5, 2)
MDY$ = Months + '*-*' + DayS + "-*'
Jnum1% = 0
Jnum2% = 0
887
888
889
890
891
892
893
894
895
896
897
898
899
90r
90':
90E
903
906
905
906
907
908
909
910
911
912
913
916
915
916
917
918
919
920
921
922
923
926
925
926
927
928
929
930
931
932
FOR i% = 1 TO NumSensors%
IF ABS(1 - NeansRat#(SC%, i%)) • .003 THEN
TOL$(i%) : "YES"
Jnum1% = Jnum1% + 1
ELSE
TOLS(i%) = " NO"
END IF
IF ABS(1 - NewGain#(SCX, i%)) • .02 THEN
RANS(i%) : **YES"
Jnum2% = Jnum2% + 1
ELSE
RAN$(i%) = *' NO'*
END IF
NEXT i%
**************************
Geophone Calibration
******************
PRINT #2, SPC(18); "SHRP FWDRelative
Calibration
- Gains Table"
PRINT #2, "FWD SN: "; FI_)SN$; SPC(37); "Calibration
Date: "; NDY$
PRINT #2, "Data File Name : "; fileS
+ Ext$; SPC(32); "Data Set "; SC%; '* of "; SetCount%
PRINT #2, "Operator
: "; Operators
PRINT #2,
PRINT #2, "
Sensor
Existing
Neans
New
Out of Limit"
PRINT #2, '* Sensor #
s/g
Gain Factor
Ratio
Relative
Gain
Tolerance
2% Range"
PRINT #2, "
.............................................................
"
t8$ = *'
#
_
#.###
#._
#.###
\
\
\
V'
FOR S% = 1 TO NuraSensors%
PRINT #2, USING t85;
S%; Seriatgum%(S%);
ReLGain#(S%);
HeansRat#(SC%, S%); NewGain#(SC%,
RANS(S%)
NEXT S%
PRINT #2,
IF Jnum1% • 0 THEN
PRINT #2, "* Manning: At least one sensor is outside
the tolerance
limit."
PRINT #2, " Verify
these results
with additional
tests!"
END IF
IF Jnum2% • O THEN
PRINT #2, "* Warning: At least one sensor is outside the 2% range limit."
PRINT #2, "
Notify
Supervising
Engineer after
verifying
with additional
tests!"
END IF
IF Jnum1% • 0 THEN
PRINT #2,
PRINT #2, "* RESULTS INDICATE THAT THE SENSOR GAINS SHOULDBE RESET."
END IF
IF RepSens% • 0 THEN
PRINT #2,
PRINT #2, repml$
PRINT #Z, repm2$; USING '*#.###*'; NewGain#(SC%, RepSens%)
END IF
933
934
935
936
937
938
939
960
941
962
943
964
965
966
947
PRINT #2,
PRINT #2,
IF Jnum1% • 0 THEN
**************************
Geophone Gain Adjustments ******************
PRINT #2, SPC(16); "SHRP Ft_ ReLative Calibration
- Gain adjustments"
PRINT #2,
PRINT #2, *'Results of this test indicate
the possible
need to adjust the gains.*'
PRINT #2, "This should be confirmed with a repeat test."
PRINT #2,
PRINT #2, "Gain adjustment
should be performed when the New Gain Factors for two"
PRINT #2, "independent
calibrations
are within
*/- 0.002 of each other."
PRINT #2,
PRINT #2, "Gain adjustments
should be made ONLY to the out of range geophone(s)."
PRINT #2,
PRINT #2, "After
adjusting
any gain setting,
the relative
calibration
test must be"
1992 Page 22
+ Years
B - 22
,;
S%);
TOL$(S%);
Ft_DCAL2.BAS March 28,
"repeated
to confirm
that
all
sensors
are
within
1992 Page 23
948
949
PRINT #2,
END IF
tolerance."
950
951
952
955
954
955
956
957
958
959
960
961
962
963
964
965
966
967
968
969
970
971
PRINT #2,
PRINT #2,
PRINT #2, CHR$(12)
'*******************
Latin Square Design Analysis
Output *****************
PRINT #2, SPC(12);
"SHRP FWD Relative
Calibration
- Latin Square ANOVA Table"
PRINT #2, "FtJ9 SN: "1 Fkl)SN$; SPC(37); "Calibration
Date: "1MDY$
PRINT #2, "Data File Name : "; files
+ Ext$; SPC(32); "Data Set "; SC_; " of "; SetCount%
PRINT #2, "Operator
: "; Operators
PRINT #2,
PRINT #2, "
Variation
Sum of
Degrees of
Mean
Computed
Critical"
PRINT #2, "
Source
Squares
Freedom
Square
f
f"
PRINT #2, "
.......................................................
"
Data$ = "
\
\
##-##_^^^
###
##-#_P^^^
####.##
##'##"
IF FLPos# • 1000 OR FLSet# • 1000 OR FLSens# • 1000 THEN
Data$ = "
\
\
##.##^^^^
###
##.##_^^^
##-##^^^^
##-##"
END IF
PRINT #2, USING Data$; "Position";
CSNG(SSLPos#); DegFreeLPos_; CSNG(MSLPos#); CSNG(FLPos#); CritFLPos!
PRINT #2, USING Data$; "Set";
CSNG(SSLSet#); DegFreeLSet_;
CSNG(MSLSet#); CSNG(FLSet#);
CritFLset!
PRINT #2, USING Data$; "Sensor";
CSNG(SSLSens#); DegFreeLSens_;
CSNG(NSLSens#); CSNG(FLSens#); CritFLSens!
PRINT #2, USING Data$; "Error";
CSNG(SSLE#); DegFreeLE_; CSNG(MSLE#)
PRINT #2, USING Data$; "TOTAL"; CSNG(SSLT#); DegFreeLT_
PRINT #2,
972
973
974
975
976
977
978
979
980
981
982
985
984
985
986
987
988
989
990
991
992
993
994
995
996
997
998
999
1000
1001
1002
1003
IF FLSet# - CritFLset!
• 0 THEN
IF (FLSens# - CritFLSens!
> O) THEN
IF FLPos# - CritFLPos!
• O THEN
LSAH$ = "YYY"
ELSE
LSAM$ = "YYN"
END IF
ELSE
IF FLPos# - CritFLPos!
• 0 THEN
LSAH$ = "YNY"
ELSE
LSAH$ = "YNN"
END IF
END IF
ELSE
IF (FLSens# - CritFLSens!
• O) THEN
IF FLPos# - CritFLPos!
• 0 THEN
LSAH$ : "NYY"
ELSE
LSAH$ = "NYN"
END IF
ELSE
IF FLPos# - CritFLPos!
• 0 THEN
LSAR$ = "NNY"
ELSE
LSAH$ = "NNN"
END IF
END IF
END IF
IF FLSens# - CritFLSens!
< 0 AND FLPos# - CritFLPos
LSAH$ = "NNN"
END IF
1004
1005
1006
1007
1008
1009
1010
1011
1012
1013
IF Jnuml_ • 0 THEN
SELECT CASE LSAN$
CASE "YNN"
PRINT #2, "Gain adjustments
are indicated,
and drop set is statistically
significant
at "
PRINT #2, "the 5_ Level.
'Set'
significance
may be due to warming of the buffers
or
"
PRINT #2, "consolidation
of pavement materials
during the test.
A repeat calibration,
"
PRINT #2, "after
conditioning
the F_ID buffers
with 50 drops from height 3, is required
"
PRINT #2, "to confirm the need for gain adjustments.
If the deflections
from the last 10"
PRINT #2, "drops vary by ff=Dre than 1 mit (25.4 microns),
repeat the calibration
at a
"
PRINT #2, "new location."
< 0 AND FLSet#
B-23
- CritFLset
< 0 THEN
FWDCAL2.BAS Harch 28,
1014
1015
1016
1017
1018
1019
CASE "YYN"
PRINT #2,
PRINT #2,
PRINT #2,
PRINT #2,
PRINT #2,
1020
1021
1022
1023
1024
1025
1026
1027
CASE "YNY"
PRINT #2, "Gain adjustments
are indicated,
and set and stand position
are statistically
"
PRINT #2, ,,significant
at the 5_ level.
A repeat calibration,
after
conditioning
the Ft_)"
PRINT #2, "buffers
uith 50 drops at height 3, is required to confirm the need for gain
"
PRINT #2, "adjustments.
When doing the calibration,
extra care should be taken to seat
"
PRINT #2, "the geophones property,
and hold the stand vertically,
aith a moderate level "
PRINT #2, "of downward pressure.
If deflections
for the last 10 drops vary by mere than "
PRINT #2, "1 mit (25.4 microns)
repeat the calibration
at a new location."
1028
CASE "YYY"
1029
1030
1031
1032
1033
1034
1035
PRINT
PRINT
PRINT
PRINT
PRINT
PRINT
PRINT
1036
1037
1038
CASE "NNN"
PRINT #2, "Nothing is
PRINT #2, "is required
1039
CASE "NYN"
1040
1041
1042
PRINT #2,
PRINT #2,
PRINT #2,
1043
CASE "NNY"
1044
1045
1046
1047
1048
PRINT
PRINT
PRINT
PRINT
PRINT
1049
1050
1051
1052
1053
1054
CASE "NYY t,
PRINT #2, "Gain adjustments
are indicated,
and sensor and stand position
is statistically"
PRINT #2, "significant
at the 5_ level.
A repeat calibration
is required
to confirm
PRINT #2, "the need for gain adjustments.
Care should be taken to ensure that the
PRINT #2, "geophone bases are clean, and firmly
seated,
and that the stand is held
PRINT #2, "vertically
with moderate downward pressure."
1055
1056
1057
1058
1059
1060
1061
1062
1063
1064
1065
1066
CASE ELSE
END SELECT
ELSE
SELECT CASE LSAH$
1067
1068
1069
1070
1071
1072
CASE "YYN"
PRINT #2, "Sensor and drop set are statistically
significant
at the 5_ level,
but"
PRINT #2, "gain adjustments
are not indicated.
Review the data carefully.
If anything
"
PRINT #2, "is suspect,
repeat the calibration
after
conditioning
the Fkl) buffers
with 50"
PRINT #2, "drops from height 3. If the deflections
from the last 10 drops vary by more
"
PRINT #2, "than 1 mit (25.4 microns),
repeat the calibration
at a new location."
1073
CASE "YNY"
#2,
#2,
#2,
#2,
#2,
#2,
#2,
#2,
#2,
#2,
#2,
#2,
CASE "YNN"
PRINT #2,
PRINT #2,
PRINT #2,
PRINT #2,
PRINT #2,
PRINT #2,
"Gain adjustments
are indicated,
and sensor and drop set are statistically
"
,,significant
at the 5_ Level. A repeat calibration,
after
conditioning
the F_,9 "
"buffers
uith 50 drops at height 3, is required
to confirm the need for gain
"
,,adjustments.
If deflections
for the last 10 drops vary by more than 1 mit
"
"(25.4 microns)
repeat
the calibration
at a new location."
"Gain adjustments
are indicated,
and sere sensor, and stand position
are
"statistically
significant
at the 5X Level. A repeat calibration
is required
"after
conditioning
the FWD buffers
with 50 drops at height 3 for adjustments."
"When doing the calibration,
extra care should be taken to property
seat the
-geophones, and hold the stand vertically,
with a moderate level of downward
"pressure.
If deflections
for the last 10 drops vary by more than 1 "
"mit (25.4 microns)
repeat
the calibration
at a new location."
significant.
to confirm
Gain adjustments
are indicated.
the need for adjustments."
"Both the ratios
and the statistical
"are needed. A repeat calibration
"adjustments."
is
results
required
A repeat
"
"
"
"
calibration
indicate
the gain adjustments
to confirm
the need for gain
"Gain adjustments
are indicated,
and stand position
is statistically
',significant
at the 5_ level.
A repeat calibration
is required
to confirm
"the need for gain adjustments.
Care should be taken to ensure that the
-geophone bases are clean,
and firmly
seated,
and that the stand is held
"vertically
with moderate downward pressure."
"
"
"
"
"
"
"
"
"
"
"No gain adjustments
are indicated,
but drop set is statisticatty
significant
"
"at the 5_ Level. This can be due to warming of the buffers
or consolidation
"
"of pavement materials
during the test.
Review the data carefully,
if anything"
"is suspect,
repeat the calibration
after
conditioning
the FM) buffers
with 50"
"drops from height 3. If the deflections
from the last 10 drops vary by more
"
"than 1 mit (25.4 microns),
repeat the calibration
at a new Location."
B - 24
1992 Page 24
Fkl)CAL2.BAS
#2,
#2,
#2,
#2,
#2,
#2,
#2,
March 28,
1074
1075
1076
1077
1078
1079
1080
PRINT
PRINT
PRINT
PRINT
PRINT
PRINT
PRINT
1081
1082
1085
1084
1085
1086
1087
1088
1089
CASE "YYY"
PRINT #2,
PRINT #2,
PRINT #2,
PRINT #2,
PRINT #2,
PRINT #2,
PRINT #2,
PRINT #2,
1090
1091
CASE ='NNN'=
PRINT #2, "Results
1092
1093
1094
1095
1096
1097
1098
1099
1100
1101
1102
CASE "NYN"
PRINT #2, "Sensor is statistically
significant
at the 5% level,
but gain do not needed
PRINT #2, "to be adjusted.
Test results
should be reviewed carefully.
If anything
is
PRINT #2, "suspect,
repeat the calibration.
Otherwise,
these results
are acceptable."
1103
CASE "NYY"
1104
1105
1106
1107
1108
1109
1110
1111
1112
1113
1114
PRINT
PRINT
PRINT
PRINT
PRINT
"Set and stand position
are statistically
significant
at the 5% Level,
but gain"
,,adjustments
are not indicated.
Examine the data carefully.
If anything appears"
"suspect,
repeat the calibration
after
conditioning
the FWD buffers
with 50"
"drops from height 3. When doing the calibration,
extra care should be taken to"
"property
seat the geophones, and hold the stand vertically,
with a moderate
"
"tevet
of pressure.
If deflections
for the Last 10 drops vary by more than 1 "
"1 mit (25.4 microns)
repeat the calibration
at a new Location."
1115
1116
1117
1118
1119
1120
1121
PRINT
PRINT
PRINT
PRINT
PRINT
PRINT
END IF
1122
1125
1124
1125
1126
1127
1128
1129
1130
1131
1132
1133
1134
PRINT #2, CHR$(12)
, *****************************
Data RepLay *****************************
PRINT #2, SPC(25); "Relative
Calibration
- Input Data"
PRINT #2, "FWD SN: "; FWDSN$; SPC(37); "Calibration
Date: "; HDY$
PRINT #2, "Data File Name : "; files
+ Ext$; SPC(52); "Data Set "; SC%; " of "; SetCount%
PRINT #2, "Operator
: "; Operators
PRINT #2,
PRINT #2, '=
Set Drop
Load
Deflections,
0.001 inches [mils]"
PRINT #2, "
#
#
[bf
Dfl
Df2
Df3
Df4
Df5
Dr6
Df7"
PRINT #2, '=
................................................
"
tOS= "
#
#
##,###
##.##
##.##
##.##
##.##
##.##
##.##
##.##"
Lin% = 1
Set% = 1
1135
1136
1137
1138
FOR t_ = 1 TO NumSets * NumReps%
drop% = (_
- (SetZ - 1) * 5)
PRI NT #2, USING tO$; Set_; drop%; LoadData! (_);
OutDef ! (t_,
4); OutDef!(t_,
5); OutDef!(_,
6); OutDef!(t_,
7)
CASE "NNY"
PRINT #2,
PRINT #2,
PRINT #2,
PRINT #2,
PRINT #2,
#2,
#2,
#2,
#2,
#2,
1992 Page 25
"Set,
sensor, and stand position
are statistically
significant
at the 5% Level."
"Although
gain changes are not indicated,
these results
ape suspect. A repeat "
"calibration
is required
after
conditioning
with 50 drops at height 3. When
"
"doing the calibration,
extra care should be taken to properly
seat the
"
"geophones, and hold the stand vertically,
with a moderate level of pressure.
"
"If deflections
for the last 10 drops vary by more than 1 mil (25.4
microns) "
"repeat
the calibration
at a new Location.
If this message appears
in the
"
"subsequent
tests,
contact the supervising
engineer for further
instructions.
"
indicate
that
no gain
adjustments
are
needed."
"
"
"Gains do not needed to be adjusted,
but stand position
is statistically
"
"significant
at the 5% Level. This may be caused by failure
to keep the stand ,'
"vertical,
or improper seating
of the geophones. In the future,
care should be"
"taken to ensure that the geophone bases are clean and welt seated,
and the
"
,,stand is kept vertical,
with a moderate downward pressure."
"Sensor and stand position
are statistically
significant
at the 5% level,
but "
"gain adjustments
are not indicated.
Review calibration
results
carefully.
"
"If anything
is suspect,
repeat the calibration,
taking care to ensure that
"
,,9eophone bases are clean,
and properly
seated,
and the stand is kept vertical"
"with moderate downward force applied."
CASE ELSE
END SELECT
END IF
,*******************
IF ProblemExist%
#2,
#2,
#2,
#2,
#2,
#2,
Cochran test
= 1 THEN
results
"*
Results
of Cochran Test
"
"
"
"
The variance
for Sensor
the other sensors. This
sensor in the stand OR
to be replaced.
Please
*************************
on Significance
of Variance
Between Geophones"
No. "; BigDef!;
" is significantly
Larger than"
could be a result of incorrect
seating of the"
an indication
that this sensor is bad and needs"
confim
with additional
tests."
B - 25
1); OutDef ! (_,
2);
OutDef ! (tJ%, 3);
OutDef ! (_,
FWDCAL2.BASHatch 28, 1992 Page 26
1139
1140
1141
1142
1143
1144
1145
1146
1147
1148
1149
1150
1151
1152
1153
1154
1155
1156
1157
1158
1159
1160
1161
1162
1163
1164
1165
1166
1167
1168
1169
1170
1171
1172
1173
1174
1175
1176
1177
1178
1179
1180
1181
1182
1183
118/*
1185
1186
1187
1188
1189
1190
1191
IF _ NOD5 = 0 THEN
Set% = Set% + 1
PRINT #2,
END IF
NEXT
PRINT #2,
PRINT #2, CHR$(12)
, ************************
SummaryStatistics
**************************
, *******************************
Page 4 *********************************
PRINT #2, SPC(24); "Retative Catibration - SummaryStatistics"
PRINT #2, "Fk_) SN: "; F_I)SN$; SPC(37); ,,Calibration Date: "; NDY$
PRINT #2, "Data FiLe Name : "; fires + Ext$; SPC(32); "Data Set "; SC%; " of "; SetCount_
PRINT #2, "Operator : "; Operators
PRINT #2,
PRINT #2, "
Load
Dfl
Df2
0f3
Of4
0f5
Df6
0f7
0fl-7"
PRINT #2, "
..............................................
"
t15 = " \
\ ##,### ##-## ##-## ##-## ##-## ##-## ##-## ##'##
##'##"
t25 = " \
\ ##,### ##.## ##.## ##-## ##-## ##-## ##-## ##'##
##'##"
t35 = " \
\ #,### ##.## ##-## ##-## ##-## ##-## ##-## ##'##
#'###"
t45 = " \
\ ##.## ##.## ##-## ##-## ##-## ##-## ##-## ##'##
##'##"
t55 = " \
\ ##.## ##.## ##.## ##-## ##.## ##-## ##-##"
t65 = " \
\
#.##
#.##
#-##
#.##
#.##
#.##
#-##"
t75 = " \
\ ##.## ##.## ##.## ##.## ##-## ##-## ##-##"
FORN%= 1 TO 7
Avg$(N%) = "Set" + STR$(N%)+ " Avg"
PRINT #2, USING t15; Avg$(N%); NeanLoad!(N%); NeanBySet!(1, N%); NeanBySet!(2, N%); NeanBySet!(3, N%);
NeanBySet!(4, N%); NeanBySet!(5, N%); NeanBySet!(6, N%); HeanBySet!(7, N%); HeanSet#(N%)
NEXTN%
PRINT #2,
PRINT #2,
PRINT #2, "
Overatt Statistics"
PRINT #2,
PRINT #2, "
Load
Dfl
0f2
Df3
Df4
0f5
Df6
Df7
Df1-7"
PRINT #2, "
..............................................
"
PRINT #2, USINGt25; "Average"; NeanAiiLoad!; HeanDef#(1); HeanDef#(2); NeanDef#(3); NearOef#(4); HeanDef#(5);
NeanDef#(6); NeanDer#(7); NeanAttDef#
PRINT #2, USINGt35; "Std Dev"; StclDevAttLoad!; StcDevDef!(1); StclDevDef!(2); StdDevDef!(3); StcDevDef!(4);
StclDevDef!(5); $tdDevDef!(6); StdDevDef!(7); StdDevAttDef!
PRINT #2, USINGt4_: "COV, %"; CVAttLoad!; CVDef!(1); CVDef!(2); CVDef!(3); CVDef!(4); CVDef!(5); CVDef!(6);
CVDef!(7); CVAIIDe
PRINT #2,
PRINT #2,
PRINT #2, "
Position in Stand"
PRINT #2, "
1
2
3
4
5
6
7"
PRINT #2, "
...................................
"
PRINT #2, USING t55; "Avg Df "; MeanPos#(1); NeanPos#(2); HeanPos#(3); NeanPos#(4); HeanPos#(5); HeanPos#(6);
HeanPos#(7)
PRINT #2, USING tO$; "Std Dev"; StdDevPos!(1); StdDevPos!(2); StdDevPos!(3); StdDevPos!(4); StdDevPos!(5);
StdDevPos!(6); StdDevPos!(7)
PRINT #2, USINGt75; "COV, % "; CVPos!(1); CVPos!(2); CVPos!(3); CVPos!(4); CVPos!(5); CVPos!(6); CVPos!(7)
PRINT #2,
PRINT #2, CHR$(12)
ENDSUB
B - 26
FMDCAL2.BASHarch 28, 1992 Page 27
;
•
1192
1193
1194
1195
1196
1197
1198
1199
1200
SUBQuit STATIC
CLOSE
COLOR7, Oa 0
CLS
PRINT : PRINT
IF files <> "" THENPRINT "
PRINT
END
END SUB
Output results
are contained in file:
B " 27
"; FPath$ + fiLeS + OExt$
FWDCAL2.BAS Narch
1201
1202
1203
1204
1205
1206
1207
1208
SUB ReadNextLine
(DataType%, LineLength%)
STATIC OtdDataType%
IF NOT EOF(1) THEN
LINE INPUT #1, LineData$
DataType$ = LEFT$(LineData$,
1)
DataType% = ]NSTR("SB'E*1234567890",
OLdDataType% = DataType%
LineCounter&
= LineCounter& + 1
1209
1210
1211
1212
1213
1214
1215
1216
1217
IF DataType% : 4 THEN
IF UCASE$(LEFT$(LineData$,
DataType% = -1
END IF
END IF
ELSE
DataType% = -1
END IF
END SUB
3))
STATIC
DataType$)
= "EOF" THEN
'end of fire
occurred
B - 28
28,
1992 Page 28
FtJDCAL2.BASNarch 28, 1992 Page 29
1218
1219
1220
1221
1222
1223
1224
1225
1226
1227
1228
1229
1230
1231
1232
1233
1234
1235
1236
1237
1238
1239
1260
SUBReadPeaks
SetCount_ = SetCount_ + 1
FORI_= 1 TO InitNumPeaks_
CALLReadNextLine(DataType_, LineLength_)
SELECTCASEDataType_
CASE-1
'end of file encountered
EXIT FOR
CASEO, 4
'unknown data in line #xxxx
EXIT FOR
CASE1
CALLReadPeaks
EXIT SUB
CASE2
_start of history block
EXiT SUB
CASE3
_found a comment
EXIT FOR
CASE5
'found subsection id
EXIT FOR
CASEELSE
=nomat processing
DataSet$(SetCount_, k_) = LineData$
END SELECT
NEXTK%
ENDSUB
B " 29
Fk_CALZ.BAS Narch 28, 1992 Page 30
1241
1242
1243
1244
1245
1246
1247
1248
1249
1250
1251
1252
1253
1254
1255
1256
1257
1258
1259
SUB ReptaceSensor
IF RepSens%< 1 OR RepSens_• 7 THEN
EXIT SUB
END IF
MeanRepOef#= (SumTotat# - Ti#(RepSens_)) / ((NumSensors%- 1) * NumSensors_* Nur_eps_)
FORS%= 1 TO NumSensors_
MeansRat#(SC_, S_) = MeanRepDef#/ MeanDef#(S_)
NewGain#(SC%, S_) = MeansRat#(SC'&,S_) * RetGain#(S_)
NEXTS%
IF ABS(1 - MeansRat#(SC_, RepSens%))• .003 THEN
repml$ = "* Means Ratio for REPLACEDSensor No." + STR$(SeriatNum%(RepSens%))+ "
tolerance range."
repm2$ = "* New ReLative Gain for REPLACED
Sensor No." + STR$(SeriatNum%(RepSens%))+
ELSE
repml$ = "* Means Ratio for REPLACEDSensor No." + STR$(SeriatNum%(RepSens_)) + "
tolerance range."
repm2$ = "* New ReLative Gain for REPLACED
Sensor No." + STR$(SeriatNu_(RepSens%)) +
END IF
END SUB
B - 30
is outside
the
" is "
is within
" is "
the
FWDCAL2.BASMarch 28, 1992 Page 31
1260
1261
1262
1263
1264
1265
1266
1267
1268
1269
1270
1271
1272
1273
1274
1275
1276
1277
1278
1279
1280
1281
1282
1283
1284
1285
1286
1287
1288
1289
1290
1291
1292
1293
1294
1295
1296
SUBSetectAnatysis
CLS
Choice% = 1
IF SetCount%• 1 THEN
Choice_ = ]
END IF
DO
REDIM ItemS(4)
Titles = " Select Analysis Type "
ItemS(l)= "StandardAnalysis"
ItemS(2)= "Replacea Geophone "
ItemS(3)= "Reference-Relative
Calibration(3 data sets in file)"
ItemS(4)= "Quit Program
"
CALL8arMenu(Titte$,
ItemS(), Choice%, O)
SELECTCASEChoice_
CASE1
Anatysis$ = "S"
EXIT DO
CASE2
Anatysis$= "G"
EXIT DO
CASE3
Anatysis$ = "R"
EXIT DO
CASE4
SCREENO: WIDTH80, 25: CLS
CLOSE: CALLNormatCotor
PRINT
PRINT "Program terminated by the user"
END
CASEELSE
REDIMPUText$(1)
PUText$(1) ="Ptease Select an Option"
CALLPopupError
ENDSELECT
LOOP
ENDSUB
B - 31
Fta)CAL2.BAS
1297
1298
1299
1300
1301
1302
1303
1304
1305
1306
1307
1308
1309
1310
1311
1512
1313
1314
1315
1316
1317
SUB StartAnatysis
FOR Sets_ = 1 TO SetCountX
SCREEN O: WIDTH 80, 25: CLS : CALL NormatCotor
IF Analysis$
= "S" THEN
anatl$
= "Standard
relative
catibration
analysis
being performed ll
anat2$ = "on data set " + STR$(Sets_)
+ " in file
" + files
+ Ext$
anal1 = LEN(anatl$):
LOCATE 12, 40 - anal1 / 2: PRINT anatl$
anat2 = LEN(anat2$):
LOCATE 13, 40 - anat2 / 2: PRINT anat2$
END IF
IF Anatysis$
= "G" OR AnalysJs$ = "g" THEN
anatl$ = "Replacement geophone relative
calibration
analysis
being performed"
anat2$ = "on data set " + STR$(Sets_)
+ " in file
" + files
+ Ext$
anal1 = LEN(anatl$)=
LOCATE 12, 40 - anal1 / 2= PRINT anatl$
anat2 = LEN(anat2$):
LOCATE 13, 40 - anat2 / 2: PRINT anat2$
END IF
IF Anatysis$
= "R" OR Analysis$
= "r" THEN
anatl$ = ==Relative calibration
analysis
as part of reference
calibration
procedure"
anat2$ = "is being performed on data set " + STR$(Sets_)
+ " in file
" + files
+ Ext$
anatl = LEN(anatl$):
LOCATE 12, 40 - anal1 / 2: PRINT anatl$
anat2 = LEN(anat2$):
LOCATE 13, 40 - anat2 / 2: PRINT ,:_t25
END IF
1318
1319
SC_ = Sets_
k'_= 1: RCount_ = 0
1320
1321
1322
1323
1324
1325
1326
1327
1328
1329
1330
1331
1532
1333
1334
1535
1336
1337
1338
1339
1340
1341
1342
1343
1344
1345
1346
1347
1348
1349
CALL AssJgnPosition(K_,
PositS())
FOR H_ = 1 TO InitNumPeaks_
RCountg = RCountZ + 1
IF NOT EngtJsh_ THEM
FOR i_ = 1 TO NumSensors_
Positn_=
i_ * 4 + 1
Jg = Posit_(i_)
DefData!(i_,
J_, I_, RCount_) = VAL(NID$(DataSet$(Sets_,
OutDef!(l_,
i_) = VAL(HID$(DataSet$(Sets_,
R_), Positn_,
NEXT i_
LoadData!(H_)
= VAL(HID$(DataSet$(Sets_,
_),
1, 4))
ELSE
FOR i_ = 1 TO NumSensors_
Positn_
= ig * 6 + 33
J_ = PositX(i_)
DefData!(i_,
J_, I_, RCountX) : VAL(HlDS(OataSet$(Sets_,
OutDef!(H_,
i%) = VAL(NiD$(DataSet$(Sets_,
H_), Positn_,
NEXT i_
LoaclData!(H_)
= VAL(HID$(DataSet$(Sets_,
H_), 34, 5))
END IF
IF RCount_ HOD NumReps_ = 0 THEN
RCount_ = 0
I_=
IC_+ 1
CALL AssJgnPositJon(K_,
PositS())
END IF
NEXT H_
CALL LatinSqDesign
IF Anatysis$
= "G" AND RepSens_ • 0 THEN
CALL ReplaceSensor
END IF
1350
1351
1352
1353
1354
1355
Harch 28,
CALL OutputToFile
IF Analysis$
<> "R" THEN
CALL FiteToScreen
END IF
NEXT Sets_
END SUB
B " 32
1992 Page 32
¢
Hg),
4))
Positr_,
4))
H_),
6))
Positn_,
6))
FWDCAL Version 2, Program Manual - February 1992
'
Appendix C
Latin Square Analysis of Variance (ANOVA)
F3k'DCAL Version 2, Program Manual - February 1992
Latin Square ANOVA
•
The Latin Square experiment design layout for the relative calibration test is shown in
Table 1. In this design, the sensor number St represents the treatment for each combination of
'
drop set and stand position.
Drop set represents
the 5 drop sequence used to test each
combination of sensor and stand position. For purposes of classification,
within each cell in the
experiment design the measured deflections are designated as 8iikt where i represents the sensor
number, j represents the position in the stand, k represents the drop set, and l represents the
repeat drops in each drop set. An equivalent and more convenient designation for the deflection
values is/_i kt where the subscripts are the same as above. This is because position in the stand
is dependent on sensor number and drop set. All combinations of i, j, k, and I do not exist in
the data set.
Table 1.7x7 Latin square design for relative calibration analysis.
Position
in Stand
Drop Set
1
2
3
4
5
6
7
1
SI
$7
$6
$5
$4
$3
$2
2
$2
$1
$7
$6
$5
$4
S3
3
$3
$2
Sl
$7
$6
$5
$4
4
$4
$3
$2
Sl
$7
$6
$5
5
$5
$4
$3
$2
Sl
$7
$6
6
$6
$5
$4
$3
$2
Sx
$7
7
$7
$6
$5
$4
$3
$2
S1
C-1
FWDCAL
Version 2, Program Manual - February 1992
The response model for the relative Latin square experiment Design is:
8ijt: = P + aS + _k + "ci + eiSkz
(1)
where,
r:
_5_jt_
=
Observed deflection response for sensor i, in position j, for drop
set k, and repeat drop number l.
%
/_k
r_
=
=
=
Effect of stand position j.
Effect of drop set k.
Effect of sensor i.
8i j k I
"--
random error.
The following restriction are imposed on the effects as follows:
Nua_oa
NumSe_
Num_.a
E "s-- t=z
E ,k-- E
i--i
j=z
where,
NumPos
=
Number of positions in the stand.
The _ski are assumed to have a normal distribution with means
PiSt = P + aS + Dk + "_i
and with a common variance oz.
The following three hypothesis are tested with the Latin Square ANOVA:
1.
H'0:
H'I:
a, = a2 = ""= aN_mPo_
= 0
At least one c_
s is not equal to zero, i.e. position is significant.
2.
H"0:
H"I:
BI =/if2 -/_N_sa = 0
At least one Bt is not equal to zero, i.e. set is significant.
3.
H'"0:
H'"1:
_'1 = z2 - rN=_s_ = 0
At least one _-_is not equal to zero, i.e. sensor is significant.
C-2
(3)
FWDCAL
Version 2, Program Manual - February 1992
The sum of squares identity can be written as
SST = $$p + SSd + $$s + $SE
(4)
u
where,
I,
SST
SSp
SSd
SSs
SSE
=
=
=
=
=
Total sum of squares
Position sum of squares
Drop Set sum of squares
Sensor sum of squares
Error sum of squares
Since the position subscript j is dependent upon the sensor number subscript i and drop
set subscript k, it is convenient to show the computing formulas for the sum of squares using
the following notation:
T_...
=
Sum of all deflections for sensor i.
T.i..
T.._
T....
=
=
=
Sum of all deflections for position j.
Sum of all deflections for drop set k.
Sum of all deflection measurements.
The computational
formulas for the sum of squares can be written as follows.
ssr-- E
i=1
E
kffil
E
- (Nu,.eos×Nu,.Se, ×NumReps)
lffil
NumPo$
SSp =
j_ l
(NumPos ×NumReps)
(NumPos ×NumSets xNumReps)
Nu,'nSets
"
SSd =
-_E1
-
(NumSets xNumReps)
(NumPos xNumSets xNumReps)
e
C-3
FWDCAL
,.E,
$Ss =
Version 2, Program Manual - February 1992
(8)
-
(NumSens x NumReps)
_o
(NumPos x NumSets x NumReps)
.t
SSE = $ST-
$$p - SSd-
$Ss
(9)
The mean square error estimates are computed as follows.
= (NumPosssp
S2n =
2
S_,o,
$2 =
=
SSd
(NumSets-
SSs
(NumSens-
SSE
[ (NumReps xNumPos xNumSets)
(10)
1)
(11)
1)
(12)
1)
(13)
- 3 (NumPos)
+ 2]
The computed F values are
2
Feo_on_
$7,_
S2
S_
Fsn = S2
Fs_"_o"-
S2s_o,
S2
(14)
For the SI-IRP relative calibration test, each main effect being tested has 6 degrees of
freedom and the error term has 226 degrees of freedom. The critical F statistic at the 5 %
confidence level is 2.14. The computed F values are compared to the critical F statistic. If a
computed F values is less than the critical F statistic, then the corresponding Ho hypothesis is
accepted and the effect is judged not to be statistically significant at the 5% level. If the
computed F value is greater than the critical F statistic, then the corresponding H0 hypothesis
is rejected and the effect is indicated as being statistically significant.
C-4
_'
.,
Long-Term
Pavement
Performance
Advisory
Committee
Chairman
Kenneth R. Wardlaw
William J. MaeCreery
W.J. MacCreery, Inc.
Exxon Chemical Corporation
David Albright
Alliance for Transportation
H.B. Zachry Company
Marcus Williams
Research
W'_
Liaisons
Richard Barksdale
Georgia Institute
of Technology
Albert J. Bush, III
USAE Waterways Experiment
_"
Station
James L. Brown
Pavement
Consultant
Louis M. Papet
Federal Highway Administration
Robert L. Cievenger
Colorado Department
of Highways
John P. Hallin
Federal Highway Administration
Ronald Collins
Georgia Department
of Transportation
Guy Dore
Ministere des Transports
Ted Ferragut
Federal Highway
Administration
de Quebec
Frank R. McCullagh
Transportation Research Board
of Transportation
Expert Task Group
Charles E. Dougan
Connecticut
Department
McRaney Fulmer
South Carolina Department
of Highways and Public Transportation
Paul D. Anderson
Mountainview Geotechnical
Ltd.
Robert C. Briggs
Marlin J. Knutson
American Concrete
Pavement
Association
Hans Jorgen Ertman Larsen
Danish Road Institute, Road Directorate
Texas Department
of Transportation
Albert J. Bush, III
USAE Waterways Experimental
Billy G. Connor
Alaska Department
Kenneth H. McGhee
Consultant Civil Engineer
Station
of Transportation
William Edwards
Raymond K. Moore
University of Kansas
Ohio Department
of Transportation
John P. Hallin
Richard D. Morgan
National Asphalt Pavement
Federal Highway Administration
Association
Frank L. Holman, Jr.
William R. Moyer
Pennsylvania Department
of Transportation
Alabama Highway Department
William
David E. Newcomb
University of Minnesota
J. Kenis
Federal Highway Administration
Joe P. Mahoney
University of Washington
Charles A. Pryor
National Stone Association
Larry A. Scofield
Arizona Transportation
Cesar A.V. Queiroz
The World Bank
Research
Center
Richard N. Stubstad
Roland L. Rizenbergs
Kentucky Transportation
Gary K. Robinson
Arizona Department
.'q_
Dynatest
Consulting,
lnc.
Cabinet
Marshall R. Thompson
University of Illinois
of Transportation
t
Per Ullidtz
Frederic R. Ross
Wisconsin Department
Technical
University of Denmark
of Transportation
Jacob Uzan
Ted M. Scott
American Trucking Association
Marshall R. Thompson
University of Illinois
Texas A&M University
Wes Yang
New York State Department
of Transportation