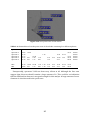
1
DEGREE PROJECT, IN NUCLEAR ENERGY ENGINEERING , SECOND LEVEL
STOCKHOLM, SWEDEN 2015
Identification of Silicon Phases in
Highly Dense Uranium Nitride Pellets
PATRIK SIRÉN
KTH ROYAL INSTITUTE OF TECHNOLOGY
SCHOOL OF ENGINEERING SCIENCES
KUNGLIGA TEKNISKA HÖGSKOLAN
Master in Nuclear Energy Engineering
Reactor Physics Department
Master´s Thesis
Identification of Silicon Phases in
Highly Dense Uranium Nitride Pellets
Patrik Sirén
Supervisor:
Dr. Mikeal Jolkkonen, KTH, Sweden
Examinator:
Dr. Janne Wallenius, KTH, Sweden
Stockholm, Sweden, 2015
ii
Abstract
In this thesis have impurity phases containing silicon located in highly dense uranium
nitride pellets been identified. The pellets are manufactured with a new technique
involving nitride powder and spark plasma sintering. Silicon arise in the pellets during
the manufacturing process as an impurity and its impact on density has to be evaluated
in order to permit assessment of measured thermal conductivity of the pellets. By using
a SEM equipped with EBSD the phase was determined to Co3Si5U2. However, EDS
analyses revealed that most of the silicon is located in the bulk or in phases at the grain
boundary, a result that gives no support to the hypothesis of silicon increasing the
density by acting as a pore filler.
In an earlier study, the solubility limit of silicon in UN at 1500 °C got estimated to
(UN0.72Si0.28) with a lattice parameter of 4.9003 Å. Since the examined pellet only
contained around (UN0.991Si0.09) silicon, there is no surprise that we do not observe a
shift of the lattice parameter in the bulk.
Combining these results gives the conclusion that, impact on density from silicon
phases are negligible.
iii
iv
Acknowledgements
I will use this opportunity to thank everyone that helped me make this thesis
possible.
First, I would like to thank my family, in particular my mother and father for their
immeasurable support during these five years. Words cannot describe how thankful I
am.
I'd also like to thank Kyle Johnson for all the help and support during the project,
being an enjoyable and funny person is just a big plus. Kyle was also the one that carried
out the manufacturing process, XRD analyses and calculated the theoretical density.
In addition, I'd like to thank Janne Wallenius and Mikeal Jolkkonen for giving me the
opportunity to work with this project and for letting me use the Fuel lab.
To everyone in the lab: Kyle, Alicia and Mikael, I'd like to thank you all for all of the
help you gave me and for the fellowship we shared.
I would also like to thank Oskar Karlsson at KIMAB, for operating their SEM and for
letting me sit alongside when doing so.
Last, I'd like to thank all the great people at KTH that I have meet during these years,
it has been a pure pleasure and I wish you all the best in the future.
v
vi
Contents
Abstract
iii
Acknowledgements
v
List of Figures
ix
List of Tables
xi
1 Introduction
1
2 Tools and Methods
3
2.1 Manufacturing Method of Uranium Nitride . . .
2.1.1 Setup of Equipment for Synthesis Process
2.1.2 Starting Material . . . . . . . . . .
2.1.3 Hydriding . . . . . . . . . . . .
2.1.4 Nitriding . . . . . . . . . . . . .
2.1.5 Denitriding . . . . . . . . . . . .
2.1.6 Spark Plasma Sintering . . . . . . .
2.2 Sample Preparation for SEM Analysis . . . . .
2.3 Scanning Electron Microscope . . . . . . .
2.3.1 Basic Components . . . . . . . . .
2.3.2 Signal Detection . . . . . . . . . .
2.3.3 Microscopes and Analysis Software Used
2.4 Analysis . . . . . . . . . . . . . . . .
2.4.1 XRD & XRF . . . . . . . . . . . .
2.4.2 SEM . . . . . . . . . . . . . . .
.
.
.
.
.
.
.
.
.
.
.
.
.
.
.
.
.
.
.
.
.
.
.
.
.
.
.
.
.
.
.
.
.
.
.
.
.
.
.
.
.
.
.
.
.
.
.
.
.
.
.
.
.
.
.
.
.
.
.
.
.
.
.
.
.
.
.
.
.
.
.
.
.
.
.
.
.
.
.
.
.
.
.
.
.
.
.
.
.
.
.
.
.
.
.
.
.
.
.
.
.
.
.
.
.
3 Results & Discussion
3
3
4
4
5
6
6
7
11
11
12
13
14
14
14
17
3.1 X-Ray Fluorescence & X-Ray Diffraction
3.1.1 X-Ray Fluorescence . . . . .
3.1.2 X-Ray Diffraction . . . . . . .
3.2 Scanning Electron Microscope . . . .
3.2.1 Philips XL-30 ESEM, KTH . . .
3.2.1.1
SUN150225A4 . . .
3.2.1.2
SUN150302A5 . . .
3.2.1.3
SUN150302A1 . . .
vii
.
.
.
.
.
.
.
.
.
.
.
.
.
.
.
.
.
.
.
.
.
.
.
.
.
.
.
.
.
.
.
.
.
.
.
.
.
.
.
.
.
.
.
.
.
.
.
.
.
.
.
.
.
.
.
.
.
.
.
.
.
.
.
.
.
.
.
.
.
.
.
.
.
.
.
.
.
.
.
.
.
.
.
.
.
.
.
.
17
17
17
18
18
18
23
25
3.2.2
3.2.1.4
SUPD140331A1
3.2.1.5
Discussion . .
LEO 1530, Swerea KIMAB
3.2.2.1
EDS . . . . .
3.2.2.2
EBSD . . . .
3.2.2.3
Discussion . .
.
.
.
.
.
.
.
.
.
.
.
.
.
.
.
.
.
.
.
.
.
.
.
.
.
.
.
.
.
.
.
.
.
.
.
.
.
.
.
.
.
.
.
.
.
.
.
.
.
.
.
.
.
.
.
.
.
.
.
.
.
.
.
.
.
.
.
.
.
.
.
.
.
.
.
.
.
.
26
28
29
29
34
34
4 Conclusion
36
References
37
viii
List of Figures
2.1
Furnace for the synthesis process. Observe that the process is not running
as the quartz tube is not inserted . . . . . . . . . . . . . . . . 4
2.2
Temperature and gas flow difference during hydriding of legacy uranium
metal
2.3
. . . . . . . . . . . . . . . . . . . . . . . . 5
Temperature and gas flow difference during nitriding of legacy uranium
hydride powder . . . . . . . . . . . . . . . . . . . . . . 6
2.4
Typical appearance of manufactured uranium nitride pellets . . . . . . 7
2.5
Used mechanical polishing device
2.6
Used diamond lubricants, from left to right: 9 µm - 0.05 µm . . . . . . 9
2.7
Left: Medium hard woven silk cloth (9 µm to 1 µm). Right: Soft synthetic
. . . . . . . . . . . . . . . 9
velvet cloth (0.25 µm to 0.05 µm). . . . . . . . . . . . . . . . 10
2.8
VWR USC200TH ultrasonic cleaner, used to clean the pellets . . . . . . 10
2.9
Final result of sample preparation . . . . . . . . . . . . . . . 11
2.10 The FEG-SEM equipment used at KTH . . . . . . . . . . . . . . 14
2.11 Phase diagram for U-Si . . . . . . . . . . . . . . . . . . . 16
3.1
Obtained data from XRD analysis
. . . . . . . . . . . . . . . 18
3.2
Typical appearance of the sought silicide . . . . . . . . . . . . . 18
3.3
Line scan over a silicide in the SUN150225A4 pellet . . . . . . . . . 19
3.4
Obtained data from the line scan . . . . . . . . . . . . . . . . 19
3.5
Line scan over a silicide in the SUN150225A4 pellet . . . . . . . . . 20
3.6
Obtained data from the line scan . . . . . . . . . . . . . . . . 20
3.7
Line scan over a silicide in the SUN150225A4 pellet . . . . . . . . . 21
3.8
Obtained data from the line scan . . . . . . . . . . . . . . . . 21
3.9
Line scan over two silicides in the SUN150225A4 pellet.
. . . . . . . 22
3.10 Obtained data from the line scan . . . . . . . . . . . . . . . . 22
3.11 Line scan over a silicide in the SUN150302A5 pellet . . . . . . . . . 23
3.12 Obtained data from the line scan . . . . . . . . . . . . . . . . 23
3.13 Line scan over a silicide in the SUN150302A5 pellet . . . . . . . . . 24
ix
3.14 Obtained data from the line scan . . . . . . . . . . . . . . . . 24
3.15 Line scan over cloud formed silicon phases in the SUN150302A5 pellet . . 25
3.16 Obtained data from the line scan . . . . . . . . . . . . . . . . 25
3.17 Line scan over a silicide in the SUPD140331A1 pellet
. . . . . . . . 26
3.18 Obtained data from the line scan . . . . . . . . . . . . . . . . 26
3.19 Five point scans on the silicide
. . . . . . . . . . . . . . . . 27
3.20 Pellet SUN150225A4 at Magnitude = 1000. Observe the now visible grain
boundaries after etching with a 2% nital solution (ethanol and nitric acid) . 29
3.21 Ten point scans over an interesting region . . . . . . . . . . . . 30
3.22 An needle-shape phase located at the grain boundary, in close proximity to a
'chaotic' phase. Three point scans over the chaotic phase was done. . . . 32
3.23 Point scans on a silicide containing a darker phase on the tip of it . . . . 33
3.24 Interface of the AZtecEnergy software. To the upper left is the observed silicide
and right to it is the kikuchi pattern. Below this pattern is the integrated MAD
function, which display that Co3Si5U2 is the most likely phase . . . . . 35
x
List of Tables
2.1
Manufactured pellets and their sintering parameters . . . . . . . . . 7
2.2
Measured and calculated density for the pellets
2.3
Physical density and calculated uranium density for the expected phases
3.1
Obtained data from the point scans of an silicide containing four different
. . . . . . . . . . 8
. 16
phases . . . . . . . . . . . . . . . . . . . . . . . . . 27
3.2
Data from ten point scans over an interesting region . . . . . . . . . 31
3.3
Data from point scans of the chaotic phase . . . . . . . . . . . . 32
3.4
Data from point scans of an silicide . . . . . . . . . . . . . . . 33
xi
1 Introduction
In an age when it has never been more obvious that the electricity generation needs
to be clean and safe, nuclear reactors are producing electricity at reasonable prices
without creating any major carbon dioxide emissions that would influence the global
climate. Nuclear power has, however, challenges to face e.g.: radioactive waste, potential
accidents, nuclear proliferation and limited resources of U-235. In order to subdue these
problems the nuclear power industry initiated in 2000, the Generation IV International
Forum (GIF). It is an international corporation representing governments from 13
countries, set up to carry out the research and development needed to establish the
feasibility and performance capabilities of the next generation nuclear energy systems
[1]. About one hundred reactor technology concepts were reviewed and six of them
were selected for further investigation. These selected concepts are clean, safe, reliable,
cost-effective and use a closed fuel cycle to maximise the resource base and minimise
high-level wastes to be sent to a repository [2].
There is a big difference between the six concepts in how they try to achieve this and
parameters like: neutron spectrum, coolant, moderator, temperature, pressure, fuel and
power of the reactor have different solutions from one concept to another. In the
Reactor Physics Department at KTH, most of the research is focused on a concept called
'Lead-cooled fast reactors'. This concept is a nuclear reactor using high energy neutrons
with lead or lead-bismuth as coolant. The fuel in this reactor is a nitride composition of
Uranium-238 (with some U-235 or Pu-239) from depleted light water reactor fuel [2].
Before uranium nitride fuel can be used in a reactor, exact knowledge of its thermophysical properties is required to assure a margin of failure, in case of an accident
during operation.
A number of independent studies to determine the thermal conductivity have been
made in the past. When correcting for as-manufactured porosity, the results between
the studies shows a variation of up to 25% for the derived conductivity of a fully dense
UN [3]. These deviations cannot distinctly be assigned to impurities nor stoichiometry
[3-4]. An element that could influence the results is the porosity which varied from 2%
to 7% in the measurements. With the purpose of removing this uncertainty, a
manufacturing process producing highly dense uranium nitride pellets was crafted.
The manufacturing process consists of a synthesis procedure that combines
hydriding and nitriding of metallic uranium and a spark plasma sintering (SPS)
procedure. These techniques make it possible to manufacture a fully dense nitride pellet,
with an average porosity of 0.2%. Elemental analysis of manufactured pellets revealed
silicide phases, which arise during the synthesis procedure due to contamination from a
1
quartz filter in the furnace [3]. It's been assumed in previous studies that most of this
silicon settles in pores as needle-shaped silicides during spark plasma sintering, thereby
increasing density [5]. The exact impact of this has to be evaluated to permit assessment
of measured thermal conductivity of the pellets.
The objective with the research presented in this report, has been to determine the
phase of the silicide and examine the impact of using different parameters during SPS.
2
2. Tools and Methods
In this chapter, the manufacturing method and sample preparation of uranium nitride
is reviewed. Understanding these steps are extremely important in order to do a correct
analyse of the images produced in the scanning electron microscope. Furthermore a brief
explanation on how the scanning electron microscope operates is given, followed by a
walkthrough for how the analyse was performed.
2.1 Manufacturing Method of Uranium Nitride
The manufacturing process for produced uranium nitride pellets in this thesis is
based on a method published by 'P.Malkki et al' in Journal of Nuclear Materials [3]. It
uses a technique that differs greatly from the common manufacturing method [6]. The
normal procedure to produce uranium nitride is by carbothermic nitriding. Some
benefits with that method are usage of stable oxides as starting materials and major
experience with handling oxide fuel. However, it also leads to large particles which
requires milling to achieve a high density [3].
The synthesis method applied for this thesis instead follows a procedure by first
hydriding and then nitriding the uranium. Using this procedure one gets a fine powder,
for which no milling is required. By implementing the relative new spark plasma
sintering technique, the powder is sintered into uranium nitride pellets. Advantages
with this procedure compared to the more traditional sintering methods like,
pressureless sintering or hot-pressing, is shorter production time and higher density of
the pellet [7].
2.1.1 Setup of Equipment for Synthesis Process
The synthesis process is performed in a 25 x 1000 mm quartz tube, which is vertically
mounted in a resistive heating furnace, see Figure 2.1. On the bottom end of the quartz
tube is a gas mixer connected where the reaction gases are merged. Attached to the
mixer are two gas lines, from which one of them hydrogen is injected. The other gas line
can be shifted between injecting nitrogen or argon. To ensure low amount of impurities
in the system, both gas lines are equipped with a gas cleaning system. The gases exit the
systems from the top of the quartz tube where a filter system is installed, this prevent
small particles to migrate into the ventilation system. The uranium metal is placed on a
porous quartz filter at half height of the quartz tube, it is by contamination from this
filter the sought silicon phase originate from.
To control & monitor the temperature and gas flows of the system, a K-type
thermocouple and flow controllers is attached to the furnace and connected to a
standard PC with the software LabVIEW installed. Using this software it is possible to
3
program a set of temperature and gas flow sequences for the furnace to automatically
follow.
Figure 2.1: Furnace for the synthesis process. Observe that the process is not running as the
quartz tube is not inserted.
2.1.2 Starting Material
Used uranium originates from two sources. The pellet manufactured in 2014 have
depleted uranium derived from Oakridge material science. While Uppsala University
provided with natural uranium for pellets manufactured in 2015. Since the uranium was
not stored in a protective atmosphere, it got severely oxidized on the surface. To remove
this oxide layer the uranium was grinded down until it had an oxygen content around
500-800 ppm. The uranium from both sources can be referred to as "legacy uranium".
2.1.3 Hydriding
By exposing the uranium metal to hydrogen at low reaction temperatures, uranium
hydride (UH3) is formed [3]:
(1)
During this process the volume increases significantly, causing the uranium hydride
to spall off as fine powder and exposing fresh metal surface to the reaction. It is a
continuous process until all metal has been converted into powder. Since no milling is
required the risk of contaminate the sample with oxygen is substantially reduced.
The hydriding process was performed in a gas flow of 0.3 dm3/min H2 and 0.1
dm3/min Ar. Using argon is merely a safety measure in case of back suction of air
through the gas outlet. Which could lead to contamination of the sample or even worse,
4
a violent chemical reaction between hydrogen and oxygen [8]. Registered differences in
gas flow and temperature are displayed in Figure 2.2. The initial temperature was set to
325 °C in order for the hydrogen to reach equilibrium. It is then lowered to 225 °C so the
reaction could start. After around 14 000 s the gas flow difference is zero indicating that
the process is complete.
Figure 2.2: Temperature and gas flow difference during hydriding of legacy uranium metal.
2.1.4 Nitriding
The next step is nitriding the uranium hydride and can be performed directly after by
introducing N2 during an increase of temperature. The chemical exchange occurs
according to equation (2) [3].
(2)
As displayed in Figure 2.3, the reaction is swifter than for the hydriding reaction. This
is due to the product now being in powder form, providing a higher amount of surface
area. The gas flow of the nitriding was set to 0.4 dm3/min N2 and target temperature to
500 °C with a ramp of 10 °C/min. Around 400 s into the process, temperature dropped
due to an insulation problem. This incident prolonged the procedure but it did not affect
the end result. After 2175 s the nitriding was completed as temperature reached 500 °C
with a stable gas flow difference.
5
Figure 2.3: Temperature and gas flow difference during nitriding of legacy uranium hydride
powder.
2.1.5 Denitriding
Uranium sesquinitride (U2N3) is thermally unstable. Using inert argon gas at
decomposes it into the desired uranium mononitride (UN) according to
equation (3) [3]:
(3 )
The denitriding process was conducted directly after nitriding, with an argon flow
rate of 0.3 dm3/min and a temperature held at 1150 °C. It took 7.4 hours for the
reaction to be completed. By using the optimal denitriding temperature of 1300 °C the
process could be quicker, but due to limitations of the quartz tube it was not possible in
this project [3].
2.1.6 Spark Plasma Sintering
Sintering is a process where the powder is heated below its melting temperature.
Allowing bonding to take place by diffusion of atoms, which lead to coalescence of
powder particles into a more dense mass.
The method used in this thesis, spark plasma sintering (SPS) is a relative new
technique which only takes a few minutes to complete. Powder for each sample is
loaded into a cylindrical graphite die with graphite punches. The machine utilise a high
electrical DC pulse between graphite electrodes to heat the sample. This combined with
pressure gives a higher densification at a shorter time compared to conventional
sintering methods. Heating rates up to 1000 °C/min is achievable with SPS [3,7].
A total of four pellets were manufactured using this technique, where three variables:
time, pressure and temperature varied for each sample according to Table 2.1.
6
Table 2.1: Manufactured pellets and their sintering parameters.
Pellet
SUN150225A4
SUN150302A1
SUN150302A5
SUPD140331A1
Time (min)
15
15
3
15
Pressure (kN/cm2)
10
15
14.8
5
Temperature (°C)
1650
1450
1650
1450
A typical sintered uranium nitride pellet can be seen in Figure 2.4. Having a dark gray
metallic color.
Figure 2.4: Typical appearance of manufactured uranium nitride pellets.
2.2 Sample Preparation for SEM Analysis
Sample preparation is a key step for scanning electron microscope analysis (SEM).
With more than 90% of the problems associated with image analysis originated from a
careless preparation, the biggest challenge is obtaining the required image quality to the
microscope. Performing a thorough and proper preparation can be the difference
between getting useful data from the SEM analysis and getting no information at all,
"garbage in, garbage out" [9].
The first measure during the preparation is to remove carbon residues on the pellets
crust that appeared during sintering. Using silicon carbide paper (SiC) P320, the surface
is manually grinded down until a visible difference could be seen. To prevent grinded
powder from become airborne, paraffin oil was used as lubricant.
Density
Next step was to determine actual porosity of pellets by using Archimedes' principle.
The principle utilises that there is a relation between the volume of an object to the mass
of liquid displaced when the object is immersed therein. Mass of each pellet got
7
measured before submerged into a cup of chloroform. The cup was then placed in a
vacuum chamber with a pressure just above the vapor pressure for chloroform, and
stored there until to no visible traces of air escaping from the pores could be seen,
indicating a complete absorption of the chloroform into the pores. The mass was then
measured again and by inserting these values into equation 4, the density could be
calculated.
(4)
Where the density of chloroform is taken as 1.483 g/cm3.
The theoretical density can be estimated by measuring the: oxygen, nitrogen, carbon
and silicon amount in the pellet and using mol calculations. Exact procedure is out of
scope for this text, but the result is to a small extent dependant on which phase the
silicon is in. If exact knowledge of this phase is known the theoretical density can be
determined more accurately.
The theoretical density is an estimation in which there is no pores in the pellet, so by
dividing measured density with calculated theoretical density, a relative density is given.
The value of this relative density is a clear indicator of how dense the pellet is, where
100% is a fully dense pellet with no pores. Density of the pellets is displayed in Table
2.2, where the silicon phase for the theoretical density is for now assumed as U3Si2.
Table 2.2: Measured and calculated density for the pellets.
Pellet
SUN150225A4
Density
(g/cm3)
13.87
Theoretical density
(g/cm3)
14.27
Relative density
(%)
97.20
SUN150302A1
12.16
14.27
92.52
SUN150302A5
13.60
14.27
95.30
SUPD140331A1
12.80
14.27
89.96
Mounting
For easier handling during sample preparation and in order to optimise material
usage, the pellets got shattered into smaller pieces and the most suitable one from each
pellet got selected for compression mounting. To be classified as a suitable piece it
should not have been damaged during the shattering. Pieces with cracks and highly
stressed areas were avoided.
During compression mounting the piece is encapsulated with bakelite powder under
heating and pressure. This simplifies handling of the sample and protect outer edges
during preparation steps. An important arrangement during mounting is the placement
of the piece, as it should be positioned so the most interesting surface is shown.
8
Grinding & Polishing
To retrieve the partial hidden piece after mounting, a part of the bakelite had to be
grinded of. This was done by once again use SiC paper with grit designation P320. After
some minutes of grinding the whole surface could be seen. Next step is to remove
sectioning effects and establish a flat surface. This was achieved by using gradually finer
SiC papers (P600 P800 P1200). As the depth of damage decrease with abrasive size and
each operation removes the damage introduced from the previous one, a planar surface
is obtained with this procedure.
The final step required to produce a scratch and deformation-free surface with mirror
reflection is to polish the sample. For this a mechanical polishing device was used, see
Figure 2.5.
Figure 2.5: Used mechanical polishing device.
The setup involved usage of diamond lubricants on a cloth. The cloth is attached to a
rotating wheel and held in place using an adjustable clamp. Rotational speed of the
wheel is adjustable with a max rpm of 3000. By applying diamond lubricant and
smoothly pressing the pellet down into the cloth a shiny surface occurred. A similar
approach as when grinding was applied, using five diamond lubricants with different
grain size (9µm, 3µm, 1µm, 0.25µm and 0.05µm), see Figure 2.6.
Figure 2.6: Used diamond lubricants, from left to right: 9 µm - 0.05 µm.
9
Since cloths are manufactured to be optimal for certain grain sizes, two different
cloths were used, see Figure 2.7. A medium hard woven silk cloth was used for
lubricants with grain sizes from 9 µm to 1 µm. From 0.25 µm to 0.05 µm grain sizes, a
cloth with soft synthetic velvet with low nap was used.
Figure 2.7: Left: Medium hard woven silk cloth (9 µm to 1 µm). Right: Soft synthetic velvet cloth
(0.25 µm to 0.05 µm).
Cleaning
In previous studies it was discovered that dirt and aluminum, originated from the
diamond lubricants got detected in the SEM [5]. Therefore, the last preparation step was
to ultrasonic clean the pellets. This was done by placing the pellets in a glass with 99.5%
ethanol and insert it into a VWR USC200TH filled with water, see Figure 2.8. Ultrasound
with a frequency of 45 kHz then cleaned the pellets for 20 min.
Figure 2.8: VWR USC200TH ultrasonic cleaner, used to clean the pellets.
10
Final result of the sample preparation can be seen in figure 2.9.
Figure 2.9: Final result of sample preparation.
2.3 Scanning Electron Microscope
The scanning electron microscope is the most widely used type of all electron
microscopes [10]. It was developed mainly because of the limitations that optical
microscopy has. An optical microscopy has two major inherent limitations compared to
the SEM. One being that the wavelength of visible light is broader than for electrons,
providing images with lower resolution. The second limitation is the large aperture
angle which is decreasing the depth of field.
Not constrained with these limitations the SEM can produce images of higher quality,
however, electrons provide some limitations of their own. First of all, in air electrons
will quickly disperse or scatter due to collisions with other molecules, therefore, the
equipment and sample must be under vacuum. Another limitation arise due to the
electrically charge that electrons has, this requires the sample to be conductive in order
to dissipate the charge [11].
2.3.1 Basic Components
The electrons which probe the sample in SEMs originates from an electron gun. A
wide variety of electron guns exists, but the basic design is similar. One of the most
common gun is the thermionic gun where the electrons are extracted from a heated
tungsten filament. When heated an electron cloud forms around the filament. By placing
an anode plate near the filament the negatively charged electrons are attracted towards
it, and the electrons can be transported away from the filament. To prevent that the
electrons jumps over to the anode plates, a cathode plate is also placed near the
filament. This is the basic of an electron gun, having electrons travel through a hole in
the anode & cathode plate, with a speed controlled by the amount of potential applied to
the cathode and anode plates, typically in the range of 1-40 kV.
11
The electrons leaves the hole in a spray pattern. To control the flow of electrons and
focus them into a beam, a series of column mounted electromagnetic lenses are used.
The first lenses in the column is the condenser lenses, they control the size of the beam
by regulate the number of electrons travelling through the column. Optimal size of the
beam is a compromise between getting a better signal to noise ratio but lower resolution
with larger beam diameter. The objective lens focuses the beam at a spot on the sample
which is necessary to get a proper focus on the image.
In order to get the beam to scan across (map) the sample in an x-y raster, two
electromagnetic scanning coils are included in the column. One will position or deflect
the beam in x-direction, while the other does the same in y-direction. The scanning coils
are controlled by a scan generator which regulates the current flowing in the coils, thus
control the strength and direction of the beam deflection [12].
With this we have an electron beam that can map across the surface of our sample.
But to form an image we need one more important component, the detector. In the next
section (2.3.2) a more through explanation on how the signal detection works in a SEM
is given, but simply put, electrons that interact with the sample will scatter and hit the
detector. This signal is amplified and an image can be produced on a computer monitor.
Since the electrons have a low travel distance in air, a vacuum chamber is connected to
the system to ensure that the electrons reach the sample and detector [11,13].
2.3.2 Signal Detection
When a high energy electron reaches the sample three things can occur. First, the
electron can pass through the sample. Second, it can collide inelastic with electrons from
the inner shell of the sample and transfer enough energy to knock them out as free
electrons. A knocked out electron is called a secondary electron (SE). Third, it can elastic
collide with the nucleus of the sample and deflect out as a backscattered electron (BSE).
However, these are not the only particles being ejected from the sample. As the SEs
are knocked out they leave holes in the electron shell and the atom becomes ionized.
This is an excited state that is unstable, so the atom will quickly return to its normal
state by letting electron from the outer shell fill the vacancy. The energy difference
between an outer shell electron and an inner shell will generate a photon (Characteristic
X-rays). By using an Energy Dispersive Spectroscopy (EDS) detector to analyse the
energy of this photon, it is possible to evaluate the elemental composition of the sample.
To determine the crystallographic phase an Electron Back-Scatter Diffraction (EBSD)
detector can be used [11,14].
12
Secondary Electrons
The SEs has a very low energy and therefore travels a short distance in the sample
(5-50 nm). Thus this detection mode is used for the detector if topographical surface
contrast is of interest. The contrast is formed by two effects, the trajectory effect and the
electron number effect. The trajectory effect emerge from variations in how the sample
surface is oriented with respect to the detector, which is similar for a light microscope.
The electron number effect will produce light or dark areas depending on the shape of
the surface. A hole in the surface will reduce the amount of electrons reaching the
detector and a dark spot will be seen on the image. Whereas a hill will increase the
number and a bright spot occurs [11,15].
Backscattered Electrons
The high energy of BSEs let them escape from deeper depth of the sample (50-300
nm), thus this detection mode give useful information about the elemental composition
contrast of the sample. For BSE the contrast arise because of the number of
backscattered electrons emitted from the sample increase with the atomic number. So
areas with atoms of higher atomic numbers will appear brighter on the image [11,15].
Energy Dispersive Spectroscopy
Every atom has unique characteristic X-ray excitation energy. Using a Si(Li) detector
the EDS system can collect these over a selected area and send the data to a computer
software that creates a spectrum, where existing elements is shown as a peak in the
spectrum.
By calculating the area under the peak the atomic fraction for each element can be
estimated. The strength of using EDS is that one obtains elemental analysis at the same
time as examining the microstructure of the material. Limitations are that: elements of
low atomic number (Z<11) cannot be properly analysed, and there is a detection
threshold around 1000 ppm (0.1 wt.%) [11,15].
Electron Back-Scatter Diffraction
The principle of EBSD is that back-scattered electrons diffract against the crystal
planes in the focal point of the electron beam. The diffraction pattern, Kikuchi pattern, is
captured by the EBSD detector, consisting of a phosphorus screen with a CCD camera at
the back side. The pattern is sampled, corrected for background and noise and then
formatted with a computer image analysis system in order to obtain crystallographic
phase and orientation [16].
2.3.3 Microscopes and Analysis Software Used
Two different scanning electron microscopes were used in this thesis. One belongs to
the division of surface and corrosion science at KTH and the other one to Swerea KIMAB.
The used FEG-SEM equipment at KTH (see Figure 2.10) was a Philips XL-30 ESEM
equipped with a 20 mm2 Silicon Drift Detector (SSD) from Oxford Instruments. Used
13
SEM settings were 15 kV with an aperture of 120 µm. To analyse obtained data, the
software INCA Energy from Oxford Instruments was used.
Figure 2.10: The FEG-SEM equipment used at KTH.
The used FEG-SEM equipment at Swerea KIMAB was a LEO 1530 with Gemini column,
upgraded to a Zeiss Supra 55 (equivalent) with Channel 5 software from HKL
Technology and a Nordlys F+ EBSD camera. The EDS detector was a 50 mm2 X-Max
Silicon Drift Detector (SDD) from Oxford Instruments. The SEM settings used was 15 kV
with an aperture of 120 µm. Used EBSD settings was step size 0.5µm (1000x), 0.05µm
(10000x) and 4x4 binning. To analyse obtained data, the software AZtecEnergy from
Oxford Instruments was used.
2.4 Analysis
2.4.1 XRD & XRF
X-ray diffraction (XRD) measurements was made using a Siemens D5000 X-Ray
Diffractometer, equipped with Cu k-alpha target at 40 mA and 35 kV voltage. Obtained
spectra got benchmarked using EVA evaluation software in order to identify phases
present. To identify trace elements, powder got sent to Degerfors Laboratorium for Xray fluorescence (XRF) analysis, using a Thermo ARL 9800 instrument with an
estimated relative error of 10 ppm [3].
2.4.2 SEM
After sample preparation the pellets were ready to be analysed in the SEM. Since the
mounted bakelite is non-conductive, a carbon tape had to be attached on the back of the
pellet before inserting it into the microscope chamber. Vacuum was applied and the:
working distance, brightness and contrast were adjusted until a good image could be
seen on the monitor.
14
Since main focus were to analyse elemental composition and mainly silicon phases,
the BSE detection mode was used for the detector. In previous studies [3,5] it was
observed that silicon often appeared as uranium silicide in needle-shaped phases. It was
assumed that these silicides fill up pores during the spark plasma sintering process and
hence increasing density of the pellets. Potential phases of the uranium silicides can be
found from the phase diagram of U-Si, see Figure 2.11. Phases of interest are: USi, U3Si,
U3Si2 and U3Si5. As a first attempt to determine the exact phase an EDS detector was
used to analyse elemental composition. This method utilises that intensity of the signal
strength is proportional to amount of the element [5]. By performing line and point
scans over the UN bulk and silicide to measure intensity changes, it should possible to
determine uranium density in the silicide and thereby estimate the phase (if uranium
density in the UN and silicide phases is known).
The uranium density in UN is determined to be 13.5 g/cm3 by equation 5:
(5)
Where
is the density of UN inserted as 14.3 g/cm3,
and
are the atomic mass
of uranium (238.02891 amu) and nitrogen (14.0067 amu), all values found on web
elements [16].
Same calculations was done for all the possible silicon phases using:
,
,
and
. With
results displayed in Table 2.3.
This procedure is a continuation from the previous research [5] and contains several
uncertainties since the detected elemental concentration is not completely reliable. For
example are elements of low atomic number like: nitrogen, oxygen and carbon
overestimated compared to uranium and silicon.
The plan in this thesis was reduce this uncertainty by getting a good amount of data,
trough scanning several silicides in each pellet. This data could possible determine if any
potential phase is over representative in the pellets and if there is any difference
depending on: time, pressure and temperature during the SPS process.
As the results appeared to have: deficiencies, being inconsistent and there was a
misunderstanding about the functionality of the SEM (explained more thorough in
chapter 3), it became obvious that this procedure would not be enough to determine the
phase. To get around this problem we used a better SEM, equipped with an EBSD
detector.
15
Table 2.3: Physical density and calculated uranium density for the expected phases.
Phase
UN
USi
U3Si2
U3Si5
Physical density
(g/cm3)
14.3
10.96
12.2
9.06
Uranium density
(g/cm3)
13.5
9.8
11.3
7.5
Change in respect to UN
(%)
-27
-16
-44
Figure 2.11: Phase diagram for U-Si [17].
16
3. Results & Discussion
In this chapter, all the results from the analysis will be presented. The chapter is divided
into two separate sections. First section briefly presents results obtained from the XRD &
XRF analyse. The second section presents and discuss results from the SEM analyse.
3.1 X-Ray Fluorescence & X-Ray Diffraction
In this section are results from the XRD and XRF analyses presented. These analyses
are of importance since they could give a first indication of possible phases and trace
elements in the pellets.
3.1.1 X-Ray Fluorescence
Powder from several pellets were examined with XRF analyse at Degerfors. Out of
these contained pellet UPD140331 the highest amount of silicon content with 0.16 wt.%,
while the lowest pellet had 0.06 wt.%. Other detected trace elements were: titanium,
copper, iron and tungsten. Content of these elements varied between 0.05-0.19 wt.%
depending on pellet. The analyse indicated that over 99 wt.% is uranium, which is
clearly incorrect as around 5 wt.% should be nitrogen. This can simply be explained
since XRF have similar limitations as the SEM with detecting light elements [19]. It is
also the reason why it fails to detect carbon and oxygen, which instead got measured to
0.22 wt.% respectively 0.49 wt.%, using inert fusion gas instrument.
Detection limit depend upon the specific element and matrix of the pellet, where
heavier elements usually have a better detection limit. The lowest detectable
concentration appeared to be around 0.05 wt.%.
3.1.2 X-Ray Diffraction
The XRD analysis indicated only a cubic phase of uranium mononitride (UN), see
Figure 3.1, implying that the manufacturing process succeeded. As no silicon phases got
detected, the analysis is of no assistance in order to identify the silicides. This result was
expected since the pellets only contain around 0.05-0.16% silicon and the detection limit
is around 2 wt.% for XRD analysis [19]. Phases below this limit is usually clouded in the
background noise. Also, if this low amount of silicon would happen to be present in
different phases, it would be even harder to detect them in XRD analyse.
As the XRF and XRD analyses could not determine the phase of the silicide, focus got
shifted towards SEM analyse.
17
Figure 3.1: Obtained data from XRD analysis.
3.2 Scanning Electron Microscope
In this section are results from the SEM analyse presented. It is divided into two
subsections, the first one introduces results from EDS analysis produced with the SEM
available at KTH. In the second one, are results from EBSD and EDS analysis produced at
Swerea KIMAB presented. At the end of each subsection is a short discussion about the
results given.
3.2.1 Philips XL-30 ESEM, KTH
3.2.1.1 SUN150225A4
The first examined pellet was SUN150225A4. This is the most dense pellet which is
favourable since less pores makes the needle-shape easier to find, as it stand out more
from the bulk. Several silicides were found and line scans was performed to analyse
elemental composition. The distinct needle-shape appearance of the silicide can be seen
in Figure 3.2.
Figure 3.2: Typical appearance of the sought silicide.
18
A line scan over the silicide revealed an increase of silicon density and a deep drop of
uranium and nitrogen density, see Figure 3.3-3.4. The intensity change for uranium is
around -43% which could correspond to the U3Si5 phase, according to Table 2.3. In all
analysis are carbon concentration disregarded, since the coating material (bakelite) is
made of carbon which distort the measurement. To the upper left of the silicide is an
oxygen impurity detected.
Figure 3.3: Line scan over a silicide in the SUN150225A4 pellet.
Figure 3.4: Obtained data from the line scan.
19
Similiar results for another silicide is seen in Figure 3.5-3.6. There is an intensity
change of uranium by around -38%, which as well indicate the U3Si5 phase. The EDS
analyse also revealed iron, this was not something unique for this silicide. But usually
the small amount of detected iron was overlooked as unimportant and perhaps being an
issue with overlapping energy peaks and therefore disregarded from the scans.
Figure 3.5: Line scan over a silicide in the SUN150225A4 pellet.
Figure 3.6: Obtained data from the line scan.
20
Occasionally the silicide consisted of two different phases, one example can be seen in
Figure 3.7-3.8. The dark phase appear to be captured inside the brighter one and
assemble around the corners of the triangle. A remarkable note is that detected silicon
counts is higher than for uranium. The intensity change of uranium is around -80%, this
does not correspond to anyone of the expected phases. Another notation is the high
intensity of molybdenum, which most likely belong to the darker phase.
Figure 3.7: Line scan over a silicide in the SUN150225A4 pellet.
Figure 3.8: Obtained data from the line scan.
21
A more rare case where two silicides are positioned close to eachother was analysed,
see Figure 3.9-3.10. The right silicide have a intensity change of uranium around -42%
which once again could correspond to the U3Si5 phase, while the left silicide had a
change around -35% which makes it more uncertain since the value is between the USi
phase and U3Si5.
Figure 3.9: Line scan over two silicides in the SUN150225A4 pellet.
Figure 3.10: Obtained data from the line scan.
22
3.2.1.2 SUN150302A5
This pellet was manufactured with the shortest sintering time and a high pressure.
Characteristic results from a line scan can be seen in Figure 3.11-3.12. The uranium
intensity drop is around -25%, revealing a possible USi phase. Compared to
SUN150225A4 the intensity drop of uranium appeared to be lower. A small amount of
the trace elements: cerium and fluorine was also detected.
Figure 3.11 Line scan over a silicide in the SUN150302A5 pellet.
Figure 3.12: Obtained data from the line scan.
23
Similar results are detected in the silicide seen in Figure 3.13-3.14. With uranium
intensity change around -26% and an oxygen impurity seen on the right side.
Figure 3.13: Line scan over a silicide in the SUN150302A5 pellet.
Figure 3.14: Obtained data from the line scan.
24
3.2.1.3 SUN150302A1
This pellet has a different sintering temperature (1450 °C) compared to the previous
presented pellets, one could therefore assume a disparity in results. Analysis displayed
that not a single needle-shaped phase was found. It would be a premature conclusion to
say that it therefore does not exist at all in the pellet. But it gives a strong indication that
at least it is more uncommon. Some of the silicon could be detected in cloud formed
phases as seen in Figure 3.15-3.16. Line scan reveals a deep decrease of the uranium
intensity and increase of oxygen which indicate that this is not anyone of the expected
phases. Point scans exposed uranium and nitrogen in the bulk as expected and on the
phase was trace elements like: Calcium, aluminium, fluorine, lanthanum, cerium,
neodymium and iron found.
Figure 3.15: Line scan over cloud formed silicon phases in the SUN150302A5 pellet.
Figure 3.16: Obtained data from the line scan.
25
3.2.1.4 SUPD140331A1
The last examined pellet was also manufactured at 1450 °C but with the lower
pressure during sintering. The needle-shaped silicide was hard to find in this pellet as
well, but a found one can be seen in Figure 3.17-3.18. It seems to contain four different
phases: a black & a white one, and two different grey colored. The line scan reveals a
deep drop of uranium intensity and increase of silicon over the darker part of the grey
colored phase. In the brighter grey an increase of oxygen is detected. Trace elements like
molybdenum and tungsten also appears to be present. Results from five point scans can
be seen in Table 3.1.
Figure 3.17: Line scan over a silicide in the SUPD140331A1 pellet.
Figure 3.18: Obtained data from the line scan.
26
Figure 3.19: Five point scans on the silicide
Table 3.1: Obtained data from the point scans of the silicide containing four different phases.
Spectrum
C
N
O
Si
Spectrum 2
Spectrum 3
Spectrum 4
Spectrum 5
Spectrum 6
10.05
16.16
12.13
12.27
11.82
16.98
6.91
9.21
14.00
5.20
5.13
1.18
0.81
Max.
16.16
Min.
10.05
All results in weight.%
16.98
6.91
14.00
5.13
1.18
0.81
Ti
Fe
Ni
1.49
1.49
1.49
Mo
W
19.21
63.14
U
Total
72.97
100.00
100.00
100.00
100.00
100.00
5.93
1.81
2.35
16.68
4.32
3.54
73.87
45.95
66.88
5.93
1.81
2.35
2.35
19.21
4.32
63.14
3.54
73.87
45.95
Unexpectedly, spectrum 3 did not detect any silicon at all. Although the line scan
suggest that this area should contain a large amount of it. This could be an indication
that the SEM and its detector is not good enough for this analyse. A large amount of trace
elements is also detected in the point scan.
27
3.2.1.5 Discussion
Results gathered to this point indicate a strong dependence of manufacturing
variables during SPS and the silicon phase. Temperature appears to have the strongest
influence as non or few needle-shaped silicides were found in pellets manufactured at
1450 °C. This observation is interesting since these pellets have a lower density
compared to those that got manufactured at 1650 °C. This is kind of expected as a higher
sintering temperature enables a shorter sintering time to achieve bonding between the
powder particles, but, it is also a result which to some extent support the hypothesis that
silicon acts as a pore filler.
Evaluating results from line and point scans are difficult since they are inconsistent.
Uranium intensity change for pellets manufactured at 1650 °C suggest that U3Si5 and USi
are the most likely phases. But values not corresponding to the expected phases are also
common. This gives a hint that line scans might not be the optimal method to determine
phases or that expected phases are inadequate. Line scans over the silicon phases in
1450 °C pellets reveals a vast drop of uranium intensity, indicating a completely
different and unknown phase.
Point scans on the silicides in all pellets detected around ten trace elements. This
result was unexpected as the majority of them was not detected in the XRF analysis.
Because of this they were therefore often disregarded as limitations of the SEM, possible
due to overlapping energy peaks. The result from scans also indicate a problem with the
used SEM, as it appears to be of inferior quality for this type of analyse.
In the previous study [5], it was considered that the electrons emitted from the
electron gun could penetrate the silicon phase and reach the uranium nitride phase
beneath it, giving inaccurate result about the uranium concentration. This assumption
followed into this thesis at an early stage, creating a source of concern as the results
from EDS analyse might be unreliable. Later at KIMAB we got enlightened that the
electrons do not penetrate the silicone phase. Since penetration depth for BSE is in the
nm (1*10-9 m) scale. While the assumed spherical size of the silicide is in the µm (1*10-6
m) scale. But because of this concern combined with the inconsistent results, it was
settled that to determine the silicon phase solely with EDS analyse would be too difficult.
A decision was therefore taken to use solve a better SEM equipped with EBSD.
28
3.2.2 LEO 1530, Swerea KIMAB
As the thesis had a limited budget only the SUN150225A4 pellet got examined. The
reason for selecting this pellet is that it appeared to have the highest amount of sought
silicide phases.
Results
With a superior SEM, new EDS with an addition of EBSD analysis got produced. As the
phase was going to be analysed using EBSD a final polishing was done using an etching
agent (2% nital solution). This improves pattern quality by removing deformations
emerged from grinding and polishing of the surface. Additionally, etching outlines the
grain structure, which is an obvious benefit. An example on how the pellet appeared at a
magnitude of 1000 can be seen in Figure 3.20.
Figure 3.20: Pellet SUN150225A4 at Magnitude = 1000. Observe the now visible grain
boundaries after etching with a 2% nital solution (ethanol and nitric acid)
3.2.2.1 EDS
An interesting region was found containing several different phases, see Figure 3.21.
Ten point scans was performed with results summarised in Table 3.2. Considering the
large amount of carbon, point scan number 2 is most likely detecting a pore. While the
other nine point scans detect particles or the bulk.
Analysis of the bulk is shown in point scan number 10, with a result corresponding
well to the XRF analyse. This is a good indicator that the microscope have a high
accuracy. Point scan number 8 & 9 appears to be the sought phase. The results display a
big difference between them as point scan number 8 have a higher amount of uranium
and nitrogen, but lower amount of trace elements. This is very likely due to a mistake
29
when selecting area for point scan number 8. As it appears when zooming in that the
silicide was not completely hit but rather slightly above.
With this knowledge, one could expect with a high probability that the two phases are
the same with correct values from point scan 9.
Figure 3.21: Ten point scans over an interesting region.
Another interesting result is the high amount of detected silicon found in point scan 3.
This is a clear evidence that nor for pellets manufactured at 1650 °C or 1450 °C is silicon
only gathered in needle-shaped phases. In fact, silicon is detected in every point scan.
Observe from Table 3.1 that this was not detected with the previous SEM.
A total of 17 trace elements got detected, this is a similar phenomena to the one
presented in section (3.2.1). Indicating that the decision to disregard them was
incorrect.
30
Table 3.2: Data from ten point scans over an interesting region.
Element
(wt.%)
1
5
6
7
8
9
10
3.32
0.93
0.72
5.01
3.38
10.73
11.26
11.03
0.72
0.70
0.58
5.76
12.12
0.13
Cr
0.45
1.32
Mn
0.10
0.44
3.66
9.60
Co
0.98
2.50
Ni
0.67
1.69
82.65
68.25
C
2
3
4
36.52
N
4.00
O
1.06
21.23
23.07
12.96
9.77
F
4.26
2.25
7.69
1.83
Al
8.35
2.75
1.42
19.85
2.47
2.19
P
0.10
0.16
S
0.20
0.15
Si
0.15
1.54
Cl
0.66
0.89
0.89
Ca
0.30
0.62
1.86
Fe
0.46
0.67
6.22
21.25
2.72
Ce
9.29
9.62
29.72
4.57
Pr
1.06
0.96
2.63
0.56
Nd
2.63
2.62
7.14
0.80
0.51
1.15
32.42
7.42
Total:
94.80
7.36
0.14
1.77
6.35
U
0.14
0.27
La
Sm
0.14
72.55
87.67
88.10
88.57
100.00 100.00 100.00 100.00 100.00 100.00 100.00 100.00 100.00 100.00
31
Due to the etching, a remarkable discovery was made. The needle-shaped phase
appears to be located nearly always at the grain boundary, frequently in close proximity
to a 'chaotic' phase. The chaotic phase often consist of several different phases. An
example of this can be seen in Figure 3.22 with results from point scans of the chaotic
phase displayed in Table 3.3.
Figure 3.22: An needle-shape phase located at the grain boundary, in close proximity to a
'chaotic' phase. Three point scans over the chaotic phase was done.
Table 3.3: Data from point scans of the chaotic phase.
Element
(wt.%)
N
O
F
Si
S
Fe
Sr
Ba
La
Ce
Pr
Nd
U
Total:
1
2
3
4
8.76
2.85
0.26
0.37
0.19
1.33
13.66
1.89
3.97
0.85
12.45
0.84
1.30
4.93
10.28
0.38
0.10
0.78
0.99
86.57
100.00
18.03
13.85
2.07
5.25
39.17
100.00
32
1.94
24.16
4.34
5.59
43.60
100.00
89.24
100.00
Point scans on a silicide containing a darker phase on the tip was also performed, see
Figure 3.23 & Table 3.4. Results are similar with previous observed ones, the brigther
phase in point scan 1 contains nearly the same trace elements with equivalent amount
as in point scan 9 seen in Table 3.2, with a small exception in the lack of manganese for
this scan. The darker phase in point scan 3 contains several of the elemets that got
detected in the chaotic phase.
Figure 3.23: Point scans on a silicide containing a darker phase on the tip of it.
Table 3.4: Data from point scans of an silicide
Element
(wt.%)
N
O
F
Si
Cr
Co
Ni
Cl
Fe
La
Ce
Pr
Nd
U
Total:
1
2
3
0.64
0.86
10.63
16.36
1.3
3.02
2.39
0.11
2.98
7.19
2.64
4.1
89.26
100.00
0.71
1.64
5.9
9.43
0.62
1.9
62.89
100.00
12.09
63.34
100.00
33
3.2.2.2 EBSD
A few of the found needle-shaped phases got analysed using EBSD. For not a single
one of them did the detected kikuchi lines match anyone of the expected phases. As an
EBSD system needs to know which phases to index against in order to determine the
most probable one, this became a problem.
Because of the large amount of detected trace elements in the EDS analyse,
specifically: iron & cobalt. Phases containing these was added to the evaluation. Several
of potential matching phases was now found. To be able to determine the correct one, a
great amount of experience working with kikuchi patterns is needed. The used software
AZtecEnergy also have an integrated function of calculating the Mean Angular Deviation
(MAD). This is a number given in degrees which specify the averaged angular misfit
between detected and simulated Kikuchi bands. The smaller the number, the better the
match, values less than 1° is acceptable for most systems [21].
All the analyses displayed the same outcome. Result from one of them can be seen in
Figure 3.24, it appears that the needle-shaped phase in this pellet is: (Co3Si5U2). But,
since the magnetic trace elements (iron, nickel, molybdenum, manganese, etc) easily
could substitute the cobalt. It is most likely a phase structure consisting of (Xx,Six,Ux)
3.2.2.3 Discussion
Interpreting results gathered from this analyse is more straightforward compared to
previous one, due to the better SEM. A major discovery is that the silicide is nearlyalways located at the grain boundary. This indicate that during the SPS process, silicon
together with all the other detected trace elements is being pushed out from the bulk
towards the grain boundaries. A result which falsify the theory of silicon acting as a pore
filler, but rather is creating pores between grains as it is ejected from the bulk.
Another interesting result is that silicon is detected in all particles and not (as
previously thought) primarily in the needle-shape phase. In fact, the majority of the
silicon is located in the bulk as the concentration there lies between 0.10-0.13 wt.%.
This feature was not detected in point scans during the previous analyse, though there is
signs of it in line scans graph.
As silicon was identified in the bulk it was assumed to be dissolved substitutionally in
the nitrogen lattice. In an earlier study [22], the solubility limit of silicon in UN at 1500
°C got estimated to (UN0.72Si0.28) with a lattice parameter of 4.9003 Å. Since the
examined pellet only contains around (UN0.991Si0.09) silicon, there is no surprise that we
do not observe a shift of the lattice parameter in the bulk.
Combining these discoveries makes it fairly safe to say that, the impact on density
from silicon impurities is negligible in the SUN150225A4 pellet. As this was the only
pellet that got examined, it is not certain that this result applies to the other pellets. But
since the only difference is the SPS parameters which should not affect this type of
result, and nothing in the analyses indicate a difference, it is very likely that the same
phenomena apply in the other pellets. Confirmation of this could be an interesting point
to continue from for future studies.
34
Figure 3.24: Interface of the AZtecEnergy software. To the upper left is the observed silicide and right to it is the kikuchi pattern. Below this pattern
is the integrated MAD function, which display that Co3Si5U2 is the most likely phase.
35
4. Conclusion
A new manufacturing method able to synthesis uranium nitride pellets close to fully
dense, has been the subject of this thesis. During the synthesis process, silicon arise in
pellets as an impurity due to contamination from a quartz filter. In previous studies it
was assumed that most of this silicon settles in pores as needle-shapes during spark
plasma sintering, thereby increasing density. Depending on which phase the silicon is in
the increase can vary. Exact impact of this has to be evaluated in order to permit
assessment of measured thermal conductivity of the pellets [3].
The aim of this thesis has been to analyse these pellets and identify the silicon phases
using a SEM. It is a continuation from a previous research that tried to solve it by using
an EDS detector to analyse elemental composition. The method utilised that intensity of
the signal strength is proportional to amount of the element [5]. By analysing the
uranium intensity in the bulk and compare it with the silicides, one should be able to
estimate the phase. This method was also attempted in this thesis with deficient and
inconsistent results. A decision was therefore taken to use a better SEM equipped with
an EBSD detector.
These analysis revealed that the starting assumptions for this and previous studies
has been incorrect. The concentration of silicon in the bulk is around 0.10-0.13 wt.%,
this is almost the total amount of it in the pellets according to XRF analysis. A result
which falsify the assumption of silicon mainly being located inside the silicide phases.
Another discovery was that the silicide phases are nearly-always located at the grain
boundary, together with a large spectrum of trace elements. This discovery falsify the
theory of silicon acting as a pore filler. A more reasonable explanation is that during the
SPS process, silicon together with the other detected trace elements gets pushed out
from the bulk towards the grain boundaries, where it forms different particles and
phases. Using EBSD the needle-shape phase got determined to (Co3Si5U2) in one of the
pellets. But due to possible substitution of the cobalt with any detected magnetic trace
element, it is more likely a (Xx,Six,Ux) phase.
The consequence of these results is that the impact on density from the needle-shape
phase and other silicon phases is negligible. Compared to previous published results, the
reliability is higher in this thesis as more data got collected and a superior SEM was
used. Due to a limited budget only one pellet got examined with EBSD, it is therefore still
uncertain if pellets with different SPS manufacturing parameters contains the same
silicon phases. But since nothing indicate that the same phenomena of silicon being
negligible, would not apply in these pellets. No further investigations was done on this
subject.
36
5. References
[1] The Generation IV International Forum (GIF)
Website: https://www.gen-4.org/gif/jcms/c_9260/public , 06/30/2015
[2] World Nuclear Association - Generation IV Nuclear Reactors
Website: http://www.world-nuclear.org/info/Nuclear-Fuel-Cycle/PowerReactors/Generation-IV-Nuclear-Reactors/ , 06/30/2015
[3] P. Malkki, M. Jolkkonen, T. Hollmer and J. Wallenius.
Manufacture of fully dense uranium nitride pellets using hydride derived powders with
spark plasma sintering.
Journal of Nuclear Materials, 2014. Volume 452, Issues 1–3, pp 548–551
[4] S.L. Hayes, J.K. Thomas, K.L. Peddicord
Material property correlations for uranium mononitride IV. Thermodynamic
properties.
Journal of Nuclear Materials, 1990. Volume 171, Issues 2–3, pp 289-299
[5] V. Schamböck.
Analysis of silicon phases in highly dense uranium nitride pellets.
Project Work, 2015
[6] T. Muromura, H. Tagawa,
Formation of uranium mononitride by the reaction of uranium dioxide with carbon in
ammonia and a mixture of hydrogen and nitrogen - Synthesis of high purity UN.
Journal of Nuclear Materials, 1977. Volume 71, Issue 1, pp 65-67
[7] H. Muta, K. Kurosaki, M. Uno, S. Yamanaka.
Thermal and mechanical properties of uranium nitride prepared by SPS technique
Journal of Materials Science, 2008. Volume 43, Issue 19, pp 6429-6434
[8] T.Hollmer
Manufacturing methods for (U-Zr)N-fuels
Diploma thesis, 2011
[9] George F. Vander Voort
Specimen Preparation for Image Analysis
Practical Guide to Image analysis, ASM International, 2000, Chapter 3,
37
[10] Y. Lang
Scanning Electron Microscope
Materials Characterization, John Wiley & Sons, 2008, Chapter 4, pp.127-161,
[11] SEAL Laboratories
How SEM Works
Website: http://www.seallabs.com/how-sem-works.html
[12] The MicroAnalytical Facility
Digital Imaging and Mapping
Website: http://epmalab.uoregon.edu/pdfs/Mapping2%20_Chap%208_.pdf
[13] S. Amelinckx, D. van Dyck, J. van Landuyt, G. van Tendeloo
Scanning Beam Methods
Handbook of Microscopy: Applications in Materials Science, Solid-State Physics and
Chemistry Applications, Methods II, Wiley-VCH, 2008, Chapter 2, pp.537-561
[14] D.Brandon, W.D Kaplan
Scanning Electron Microscopy
Microstructural Characterization of Materials - 2nd Edition, John Wiley & Sons,
2008, Chapter 5, pp.261-331
[15] Y.Lang
X-ray Spectroscopy for Elemental Analysis
Materials Characterization : Introduction to Microscopic and Spectroscopic
Methods, John Wiley & Sons, 2009, Chapter 6, pp.171-196
[16] T.Maitland, S.Sitzman
Electron Backscatter Diffraction (EBSD) Technique and Materials Characterization
Examples
Scanning Microscopy for Nanotechnology: Techniques and Applications, Springer,
2009, Chapter 2, pp.41-75
[17] Web Elements
Website: http://www.webelements.com/
[18] Yeon Soo Kim
Uranium Intermetallic Fuels (U–Al, U–Si, U–Mo)
Comprehensive Nuclear Materials, Chapter 3.14, p.402
[19] Geochemical Instrumentation and Analysis
X-Ray Fluorescence (XRF)
http://serc.carleton.edu/research_education/geochemsheets/techniques/XRF.html
38
[20] Geochemical Instrumentation and Analysis
X-ray Powder Diffraction (XRD)
http://serc.carleton.edu/research_education/geochemsheets/techniques/XRD.html
[21] Oxford Instrument
AZtec User Manual
Issue 2.1, 2013, p.446
[22] S. Imoto, K. Niihara, H. -J. Stöcker
Thermodynamics of nuclear materials. Solid solubility in NaCl-type uranium
compounds
International Atomic Energy Agency, Vienna, 1968
39