1
FACSCalibur User Guide
Ragon Institute of MGH, MIT, and Harvard at
Massachusetts General Hopsital
Visit our facility website!
http://www2.massgeneral.org/aids/flow_cytometry.html
It contains information about our instruments, links to calendars and flow resources, and many of the
documents that I hand out, as well as a flow cytometry syllabus of resources to expand your flow
knowledge.
Index
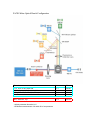
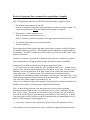
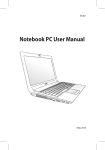
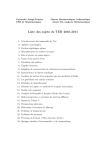
FACSCalibur Optical Bench Configuration
Fluorochrome
Detector
Filter
FITC, GFP, CFSE, Alexa 488,
PE, PI, Pyronin Y, DsRed, Alexa 546
PE-Cy5, PerCP, PerCP Cy5.5, PE Cy5.5
Side Scatter
FL-1
FL-2
FL-3
SSC
530/30
585/42
670LP
488/10
APC, Alexa 647, Cy5
FL-4
661/16
--default parameter dimension is H
--DDM allows measurement of A and/or W of one parameter
Calibur user guide
To add Cellquest pro to your "program dock" at the bottom of the screen, drag the icon from the BD
Applications>Cellquest Pro folder onto the dock. Do NOT drag the icon to your desktop, which will
physically move the entire program and prevent anyone else from using it.
Creating an Account
To become a user:
--visit www2.massgeneral.org/aids/flow_cytometry.html and go through the introductory material
on the training page
--attend the introductory class (dates are announced on the training page)
--go through the user manuals: they are on the Calibur Mac in the Cellquest Pro folder, or linked
from the training page on our website.
--observe another person operate the instrument at least twice.
--schedule time with me to run at least your first experiment with you.
Location
The FACSCalibur is located in CNY149, room 5228. Take the central elevators to the 5th floor, go through
the door to the left of the balcony, and then go through the door straight ahead to enter the lab. Walk
straight ahead and you will see the instrument in the bay in front of you.
When booking time for the calibur
If you decide to not use your time or will not be using the entire time reserved, please update or delete your
entry as soon as possible so that other researchers will know it is available for use.
If you fail to delete your unwanted reservation at least 1 hour before the start time and do not use your time,
you may still be billed for 1 hour usage.
If you do not show up within 20 minutes of your start time, your reservation is forfeited and anyone can use
the instrument.
Researchers that are not members of the Partners AIDS Research Center/Ragon Institute may not schedule
reservations more than 1 week in advance.
There is a 2 hour limit during working hours (9-6), and no more than 2 reservations per week can be
between 2 and 6 pm.
Delete unwanted reservation 1 hour before start time or you may be billed 1 hour of usage time. Please
update your reservations as soon as you know they are different from the scheduled time. Late deletions or
no-shows may be billed 1 hour of usage time.
General Guidelines
-$50 per hour for user-run analysis, tracked by how long user is logged onto the computer. Use the
dedicated analysis workstations for free instead of getting charged for using the instrument computers for
analysis.
-Wear gloves when using instruments. No gloves on analysis stations!
NEW WASTE PROTOCOL
All Flow waste must be disposed of as hazardous waste, and is collected in a plastic drum that is kept near
the calibur in 5228.
--On the Calibur, there will be an empty cube near the fluidics cart. When the active cube is full, switch it
to the empty one and the full one will be transferred to the drum.
If I am not around and both are full, please wear a lab coat and empty them as follows:
--On top of the waste drum is a bucket with a funnel and a spigot. Attach the spigot to the waste cube and
make sure it is in the “off” position (handle to the right). Remove cap to drum, and position cube on top of
drum so that spigot is directly over the opening. Open the spigot and allow the waste to flow into the drum.
When nearly empty, close spigot, use the funnel to transfer the waste to the drum, and replace the cap on
the drum when you are done. Also remember to add bleach to the empty waste container.
Using the FACSCalibur
Tutorials for use of the Calibur and Cellquest Pro for acquisition and analysis can be found on the Mac
analysis station in room 5233 (FACSAnalysis HD>BD Applications>Cellquest Pro Folder>CQPro Acq
Tutorial.pdf or CQPro Analysis Tutorial.pdf) or online at www.bdbiosciences.com (see our “Training”
page for link)
MECHANICS OF MACHINE USE (Calibur):
__ Turn on the cytometer first, and then computer. If computer is on and cytometer is off, turn computer
off and then start up.
__ Sheath and waste are regulated by the fluidics pump under the bench. If the alarm sounds, press the
“alarm” button on the left side to silence, and see which light is on. Full sheath cubes are to the left, empty
waste tank should be in the cabinet to the right (has hazardous waste label on it). Change the appropriate
tank, and then press the “restart” button on the right side of the console. Leave full waste tanks in the
cabinet, I will empty later. Empty sheath cube goes at the end of the bay for trash pickup.
__Label all tubes. Do not overfill (no more than 2/3 full).
__Push tube all the way up onto sample injection port, move “tube support arm” to center position. Black
knob should NOT touch tube (something of a misnomer, doesn't actually support the sample tube)
__Don't let a tube run dry, don't leave a sample tube on while tube support arm is to the side (aspirates
sample to waste)
__Filter samples especially if there might be large clumps of cells.
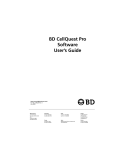
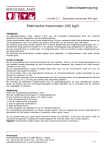
__Droplet containment system
outer droplet containment sleeve
tube support arm turns on vacuum and puts machine in a "standby" mode ("run" button turns
orange).
__full standby (button) lasers power reduced, stops sheath fluid flow to conserve sheath. Use only when
done—while running samples, leave instrument in “run”.
__PRIME: flushes the flow cell, refills with sheath--clears air bubbles (which may occur when you let
sample tube run dry, or if sheath tank runs dry and air is pumped through the system). May eliminate
noise. Always remove tube before priming!
__Cellquest Pro. Acquire>connect to cytometer. Open layout, acq. Settings, instr. Settings,
__Proper shutdown procedure—2/3 full tube of bleach, set tube support lever to side, set to “run” on “high”
for 1 minute (about 1 ml), then return lever to center position to run bleach through sample injection tube
for 5 minutes. Repeat with water, leave water tube on Sample Injection Port with 1 cm of water in bottom,
press "standby". Do not leave too much liquid in tube, as some backflow will occur, and if it fills
completely then fluid will be forced into the sample pressurization holes, into the air line, and clog the
hydrophobic filter.
Troubleshooting:
Fluid levels
--The fluidics tanks are monitored by 6 sensors.
1. One in the cube of sheath fluid detects when the 20 L cube is low, and then empty.
2. One in the sheath tank in the fluidics drawer determines when more sheath needs to be pumped
from the cube.
3. One in the sheath tank in the fluidics drawer that tells the software when that tank is low/empty
4. One in the waste cube that detects when the waste is full.
5. One in the waste tank in the fluidics drawer that detects when waste needs to be pumped to the
cube.
6. One in the waste tank in the fluidics drawer that tells the software when that tank is full.
If the software gives you a “not ready” message after the warmup period, check the status window (apple4). At the bottom will be a Sheath-Empty or a Waste-full message (sensors 3 or 6 above). This should not
come up unless there is a problem with the fluidics cart. Make sure it is turned on (green power button on
the right hand side)—if it is, then make sure the warning lights on the left are not lit up and someone just
silenced the alarm without changing the cubes. If no lights are on, then there is a problem with sensors 2 or
5 and you will need to find me.
If the waste alarm on the fluidics cart is going off and the tank is empty, then you can try this:
Turn off the power to the fluidics cart (green toggle switch), remove the probe from the waste
cube and dry it off with a paper towel or kimwipes, including inside the hole in the grey cylinder
towards the cap. Return to the waste cube and then turn the power back on. You may have to
press restart to clear the alarm. If it alarms again, find me.
Macs look for attached devices when they are first starting up, The cytometers, once connected to a
computer, will not look for one again. Thus it is necessary to start up the cytometer first, wait 30 seconds,
and then start the computer. If the computer is on and cytometer is off, you must turn on the cytometer and
then either restart or shutdown and restart the computer. If the cytometer is on and the computer is off
(either being shut down or restarting from a crash), you will need to turn off the cytometer, wait 30
seconds, then turn on the cytometer and then the computer.
If you do not see any events:
If it happened suddenly (you were running fine and it stops) make sure there is sample left in the
tube, and try taking the tube off, wait a few seconds, and then loading it again. A clump of debris may
have blocked the sample port, and removing the tube allows sheath fluid to backflow and wash away the
blockage. If that doesn’t work, remove the tube again, and press “Prime” which is a more forceful way to
clear the sample probe—it will switch back to standby after the cycle finishes. Press run and try your tube
again.
If you cannot see any events right from the start, make sure the threshold is not set too high
(apple-3 and it should be set around 50 on FSC), and your FSC settings are high enough for your particles.
If you still can’t get events, then you may have to restart the computer—there are times when the computer
will respond to changes to the instrument (showing “Ready” or “Standby” in the status window) but will
not be able to acquire events until you restart.
--Cyto 2 and Mac analysis station run Cellquest Pro. Layouts generated using Cellquest can be opened in
Pro, and data files can be opened in almost any flow software, but layouts (histograms, dot plots and stats)
created in Pro CANNOT be opened in Cellquest (for Mac OS 9).
--user manual on shelf contains a chapter on troubleshooting if I am not around.
__training manual—good to look over, chapter on cellquest etc.
3/1/07
Protocol to prepare flow cytometer for acquisition of samples
Note: This protocol can not be used for DNA acquisition and/or apoptosis assays.
1. If cytometer and computer are both off:
Turn on cytometer by depressing large green button on side of cytometer (right). Let
cytometer warm up for at least one minute before turning on computer.
2. If cytometer is off but computer is on:
Turn on cytometer as directed above in 1.
After 2-3 minutes, restart the computer (from Apple menu in the top left corner)
3. If cytometer and computer are already connected:
Proceed with below
The program used to both acquire and analyze data on the cytometer is called CellQuest
Pro and the computer runs OS X. This program must be running for all applications on
this machine. To launch CellQuest Pro, click on the grey circle icon on the “dock” at the
bottom of the screen.
Connect to cytometer – go under the acquisition menu and select “connect to cytometer”.
Your acquisition box will appear telling you that this has been done successfully.
At this point, you need to either open or design an acquisition layout.
-----To set up a new one, select under the “file” pull down menu “new”. A blank screen
appears. Now, dot plots and histograms need to be added, as you wish. The only sort of
mandatory screen you must have is the light scatter screen, which plots forward scatter
versus side scatter. To get this screen, click on the palette for dot plot and select
“acquisition” in the inspector window that appears, select no gate, and single color. Click
on the polygon creation tool and create R1 in the plot somewhere – i.e.: where you expect
your cells to be, where lymphocytes normally are, etc.
*Note: to view details of a plot in the inspector, the plot must be selected so that there are
handles on the corners, by clicking on the white border of the plot.
Now, click on the dot plot icon or the histogram icon to select other acquisition
parameters based on fluorescence. As in the previous one, select “acquisition” but this
time, select G1 gate. The reason you select the G1 gate is because you will eventually
move the R1 in the FSC/SSC plot onto your cells of interest. By selecting G1, it means
your fluorescence will be reflective of the R1 population and not contaminating cells, be
they of a different lineage, dead, apoptotic, etc.
-----If you have a layout saved, go under file, open, and select the acquisition screen.
Now that the screen is set up how you want it, work left to right in the pull down menu.
Under “cytometer”, select “detectors/amps”, “threshold” and “compensation”. Move
them to the side of your acquisition screen. If you have previous settings, click
“instrument settings” and select them…be sure you select the file, hit “set” then hit
done….. watch the screen to be sure they have changed.
If you need new settings, change your FSC and SSC to linear (unless collecting dendritic
cells) and all the FL1,FL2 etc. (the fluorescence detectors) to log, around 500 on each
PMT. This is a good starting place if you are making new settings.
Now go over to under “acquire” and select acquisition and storage. There will be a
highlighted area of the screen – it is a number – this is the number of events you wish to
collect. Standard is anywhere from 10,000 to 200,000, depending on what expt. you are
doing. Type in the number. Then, on the bottom of this screen, check the saved
parameters. Make sure all the boxes have a check in them – if not, click them with the
mouse so they do – this prevents your data not being saved. It is suggested you do not
change anything lese on this screen unless you absolutely know what you are doing!
Now go under “acquire” and select “parameter description”. Click “folder” and select to
what folder you want to save it to.
Then under file, name the file – it is STRONLY suggested you at least put the date of the
expt. here, as well as any other info. you may want, although you of course can name the
file whatever you like. Be sure the file counter is set at “1”. Click ok.
Under “acquire”, click counters. This lets you watch the number of cells acquiring in
your file.
Now, you are ready to begin acquiring your sample. Change the cytometer from standby
to run, and hit the high flow rate button.
Make sure your acquisition control is in the “set-up” mode, by making sure there is an X
in the box that says set-up.
Put your sample on and click acquire.
First, adjust FSC/SSC parameters to make the cells appropriate in terms of light scatter.
Make sure that your cells of interest are in R1.
Unless you know what you are doing, set the threshold at FSC (primary) between 18-52.
Now, adjust fluorescence and compensation (yon need to know how to do this!!!!! It
can’t be explained here in this space. If you DON’T know how to do this, ask - you
should not be using the machine by yourself in the first place).
Once all your light scatter, fluorescence parameters and compensations are appropriate,
hit “abort” on the acquisition menu. Take the machine off set up mode, and hit acquire.
The machine will collect the number of events you told it to before. However, keep an
eye on the tube…..if it seems you are not going to get the desired number of events, then
when the tube gets low, on the acquisition box, hit “pause” then “save” and your data will
be saved to the file. Do not let the tube run dry, as it will make your data file a very poor
one and screw up your results too (and even if it’s dry, it will keep collecting air as events
and not stop running!! If this happens, tell someone who works in the flow facility).
When you are done collecting your samples, close down CellQuest (go under “file” and
select “quit”). Also, close all boxes on the screen.
Bleach the cytometer for 5 minutes, and then run water for 5 minutes, change tanks, etc.
Clean the cytometer as instructed on the back of the user guide binder.
Finally, transfer your data files to a remote site/the server then delete them from the
temporary folder on the hard drive. Nothing can stay on the hard drive!!! We delete it
from time to time without notice (it is done every 2 weeks), and if your data are left, they
will be deleted without notice.
How (in what order) to run tubes on the cytometer (assuming a 4 color experiment):
1. Unstained cells OR cells stained with negative control antibodies
This tube is used for 2 things.
First, adjust forward and side scatter parameters by adjusting the FSC and SSC controls.
You are aiming to have all cells of interest on the screen. Also, you aim to have them in
the “right spot”, which is arbitrary. What I mean is this: there’s no difference in your
data if you put, say, lymphocyte scatter at the center of the plot rather than in the lover
left-hand corner of the plot. However, people are not used to seeing lymphocytes in the
center of the plot. As such, for better or worse, your data will come under immediate
scrutiny. It’s up to you, but I would try to avoid this if possible. The lymphs usually go
in the left hand corner because it allows all cell population in PBL to be on the dot plot,
so you should do this as well.
Second, adjust the instrument settings, located under “parameters”, and by changing
(increasing/decreasing) voltage. This is your negative control tube, so all cells in a dot
plot should be in the left hand corner of the plot; all histograms should be in the left side
of the plot. Adjust all parameters you have an actual positive stain in – for instance, if
you are testing cell transfection with GFP, and you put on GFP-negative cells, then worry
ONLY about the FL1 setting – if it looks like crap in the other channels, don’t worry –
you have nothing in those channels, so it does not matter!!!
2. Cells stained with the FITC antibody ONLY
If your FITC antibody is of a very low percentage positive, however (let’s say you use
IFN-g FITC for intracellular cytokine detection), then use a different antibody that will
give a healthy percentage of + cells in this color – say, CD3/4/8…whatever.
You use this tube for FITC compensation. DO NOT TOUCH VOLTAGES…ONLY
USE THE COMPENTATION BOX FROM HERE FORWARD. Remember, FITC can
only overlap with PE, so the only thing to adjust is the FL2-% FL1 control, which takes
FL1 (FITC) fluorescence out of FL2. The only real, sure fire way to do compensation is
electronically, but that can not be done on the FACSCalibur currently, so you have to do
it by sight, or by quadrant analysis. *Note: you only have the option of correcting FL1
vs. FL2. If you are running FITC and FL3 (PerCP, etc), and NOT PE, you may see
overlap into FL3 with your FL1 label. This would normally be corrected by adjusting
your PE compensation. In this case, even though you do not have FL2, you could adjust
FL3-%FL2 to correct overlap of FL1 into FL3. Please see me if you need help with
this.*
3. Cells Stained with PE ONLY
See info. about low percentage staining in FITC above – it applies to all your stains.
PE can overlap in two directions – with FITC and with
Percp/Tricolor/PeCy5/PeCy5.5/7AAD (these are all stains used in the FL3 channel). In
this case, you need to worry about compensating out of the 2 channels: FL1-%FL2 and
FL3-%FL2. Remember, though……if you used PE, and let’s say FITC too, but did not
use anything in the FL3 channel, then don’t worry about compensating out of the FL3
channel – you will never look at this channel because it has no stain, and therefore, no
data!
4. Cells stained with Percp/Tricolor/PeCy5/PeCy5.5 only
Percp (and the other ones in this channel) can overlap in two directions – with PE and
with APC. In this case, you need to worry about compensating out of the 2 channels:
FL2_%FL3 and FL4_%FL3.
Of note – APC and Percp are excited by different laser lines (633, 488 respectively), so
the compensation is actually inter-laser compensation. However, it does not change how
you will do the compensation, but it is why the time delay on the instrument is so
important. This gets really messed up if the machine is either a.) let run overnight, or b.)
let run dry for anything over10 minutes or so.
5. Cells stained with APC
APC overlaps with the FL3 channel – so you have to adjust FL3-%FL4 only.
6. Your sample
If you followed steps 1-5, you should not have to touch anything – just put your sample
on and acquire – it should look perfect!
--------------------------------------------------------------------------------------------------Flow Cytometry Analysis using CellQuest
Open CellQuest
Open an analysis template or make new one with dot plots/histograms as you wish
To make new analysis screen: start with a light scatter screen:
Go to dot plot menu
For plot source, select “analysis”
Click “select file” and then find the file you want to analyze
X: fsc or ssc
Y: fsc or ssc
Gate: no gate
Show 100% of dots, or if there are many events in the file (eg: an ICS or stem cell
file) then choose a lesser percentage than 100% so you can discriminate
between populations of interest.
Using the polygon tool on the palette, draw a gate/region around the cells of interest (for most people it
is usually lymphocytes, but if you want to look at other cells, then you do this the same way. In
general, with a few exceptions, do NOT draw a gate around all white cells and do your analysis – the
backgrounds are different for each population, and this might make analysis tough or give false
results).
Make subsequent dot plots or histograms the same way (plot source=analysis, select file to match the file
used in the first plot, choose your x and y parameters [they will not be FSC/SSC anymore, but will now be
the fluorescence parameters], gate=G1/R1 because those are the cells you are interested in).
Region/gate viewing/deletion
Go to under the “gates” menu
Choose region list
Note that R1 is there, because you have just drawn G1/R1 on the FSC/SSC plot.
All gates you make are shown here. If you make a mistake, and either mistakenly draw a gate or make one
that is totally oversized, etc., then come to this location, highlight the ^ at the side of the gate, and hit
“delete” on the keyboard to delete it.
Fluorescence parameter choice
Assume you made a mistake in choosing the fluorescence parameters on the plot.
To change fluorescence parameters once you have closed the new dot plot/histogram creation page, just
click on the parameter on the dot plot/histogram on the screen at that time, a box will appear with all the
parameters, and you can scroll down and change it.
Region/gate viewing/deletion #2
Make R2 somewhere on the second, fluorescence dot plot.
Now, go under the “gates” menu, choose “regions”, and now you should see both R1 and R2 listed under
here, because now you have made both R1 and R2 on the screen.
Now, close the menu.
Go to the R2 gate, click it, and hit delete. Go back to under “gates”, “regions”, and notice R2 is still there –
the only way to permanently delete it from the record is by deleting it under this menu. If you drew
ANOTHER gate at this point, it would appear as R3, because R2 was never deleted from the menu. Once
you accidentally delete R2 from the screen (or any region from the screen, for that matter), you can bring it
back by selecting it in the region list, “copy” in the Edit pulldown menu, select the dot plot, and select
“paste”.
Gate combinations
Go under the “gates” menu, choose “gate list”
G1 lines up with R1
G2 lines up with R2, etc…..
This means that if you choose G1 for a gate, then it will display all cells in R1. If you choose G2, it will
display all cells in R2. Let’s assume, however, that you want to look at a combination of gates – that is, all
cells that fall into R1 AND R2, all cells that fall in R1 but not in R2, all cells that fall in R1 OR R2…you
see the logic here, I’m sure….
In order to do this, under the gate menu, you change the “R” column. So, if you want to look at all cells in
R1 and R2, then go to a higher G…..anything G3 or above (I usually go to G5 or above, in case you make
any more gates – although this is not necessary).
Leave G5 alone. In the corresponding column on the right, highlight and delete R5. Type in, for this
scenario, “=R1 AND R2”. Two things of note: the equals sign is there, and all typing in capitals….it
MUST be in capitals. The most common are “AND, AND NOT, OR”.
However, any other boolean combination will work.
A note of caution: if you make G5 be R1 and R2, and end up making more regions on the screen, when
you make R5, you need to go back into the gates menu and make G5=R5, or else it will still be G5=R1
AND R2, and you results will be completely wrong!)
Changing gate colors or histogram colors
If you want to change the color of a gate – that is, what color the cells appear on the screen that fall from a
particular gate – go to under “gates”, choose “gate list”. All other gate combinations will appear, as well as
color beside each. Click the color and a palette of colors will appear. Choose the one you want and close.
To change histogram colors, go into “plots”, choose “format histogram” and the menu will appear. On the
left hand side, about 1/2 way down, will be a box – the default color is purple. Click it. Choose the color
you want., or “no fill” to just get a line with no color inside. You can also choose the color of the line, if
doing “no fill” – click on the line under the color box and choose the line color you want.
Statistics:
Region stats: shows you the percentage of cells in each region on the plot – both gated and ungated (total).
So, if you are looking at PBMC, and you gate the lymphocytes, and look at, say, CD3, the percentage of
CD3+ cells in R1 will be greater than ungated (total) because you’ve selectively enriched for this
population with your gate.
Quadrant or histogram statistics:
Now, put a quadrant on the dot plot – to do this, look at the palette and click the icon that looks like a
window. Now click the dot plot and drag the mouse. The axes will appear. These can be moved, etc. by
clicking the crosshairs and dragging to the desired location.
To get quadrant statistics to appear, with the desired plot selected (border highlighted) go to under stats,
and choose “quadrant stats”.
Also, to put a region on a histogram, select the histogram, go to the palette, choose the line with end lines
(looks like a long “H”), put cursor onto histogram and drag it.
Editing statistics box information:
You can edit what information appears in the statistics box as well – let’s say, for instance, you only care
about one percentage quadrant or something, or are trying to squish a bunch of plots on a single page and
the stats box size is prohibiting this - then, edit the box and what appears in it. To do this, go back to under
statistics, and choose “edit quadrant stats”. Click “off” what you do not want, and close when done. This
should apply to all stats now that you make in this document until it is changed again or the document is
closed (don’t worry – when you close your files, it will not affect other files of yours or other people’s
files).
KS statistic:
This stands for Kolmogrov-Smirnov statistic, and provides a D value, which is capable of detecting very
small but significant shifts in fluorescence based on the mean fluorescence intensity of the peaks. The only
time I have ever seen this used is to analyze the presence of the P-glycoprotein antigen on clinical samples,
where the levels are significant but VERY low. This statistic needs to be validated on controls usually, and
as a result, do not use it unless you know in advance this is the statistic you need. To present this statistic
for any reason to denote differences in staining on 99.99% of staining experiments in just wrong!
To annotate plots (add text):
Go to “plots” , select “annotate”….from here, you can have displayed the file name, patient ID, or any
other information you enter into the file while you were collecting it. or, you can go to the palette, and
click on the icon “A” which is the text tool, and type your text.
Rearranging what is on the screen and how you see it:
To get multiple pages:
Go under “file”, select “document size”
Pages will be displayed – click and blacken the # of pages you want, vertically or horizontally.
To size reduce what is on the page (which allows more things to fit on the page):
Go under “file”
Choose page setup
Change the “100” to 90,80,70,…..I think 60 is the lowest you can go.
To analyze a series (sequential files):
Select all the files on the screen (make sure all the boxes have a little box in the corner to denote this).
Go under “plots”, and select “next” or “previous” to advance or go back a single file #.
Or, select “change data file” to change to a new data file somewhere else in your saved data.
You will also see a box for file increment increase. This is usually set to 1. If you set it to another #, it will
jump ahead or back that number when you select “next or previous” file. That is, if you are looking at file
001, and set the increment to 3, then select next file, it will not go to 002, but to 004.
------------------------------------------------------------------------------------------------------------------------Sometime, people want to present data as a presentation. To do this, make the individual plots/histograms
EXACTLY how you want them to look. Select, copy and paste for export (paste) into power point files.
Printing:
To print the data on screen, go to “file”, select “print”. You can also select “print one”, which is a nice
feature that will print one copy of all open pages you have on the screen. If you have 3 pages open, though,
and data on only one page, do not use this feature – it will print ALL pages and just waste 2 blank pages.
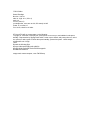
FACS Calibur
Status Readings
No tube: Volt=10
tube on: high- 6.1v (5.5-6.1)
med- 6.3
lo-6.4 V (5.9-6.5)
no sample tube, move arm to side, SV exactly 10.23V
Power 15, no tube 2.5
if not 10.23, check for air leaks.
If FL3 and FL4 will not compensate, try the following:
To purge air: with tube on sample port, press prime, as soon as you see bubbles in tube press
standby. Depressurize by flipping black switch, loosen cap to sheath, and press prime-run, wait 3
sec, prime-run wait, repeat 12 times then press standby, pressurize system. check sample
voltage while run on high.
Then:
Discard the following files:
HD>sys folder>prefs>BD prefs>calib file
HD>Sys folder>prefs>BD Prefs>FACSCompprefs
HD>BDFiles>Calib file
empty trash, restart computer, rerun FACSComp
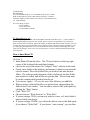
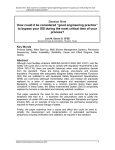
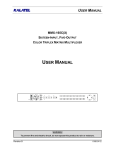
FACSCOMP Target Values
Lot #
<69000
>69000
SSC
181
175
FL1
FL2
FL3
FL4
74
63
70
58
65
54
SEE APC BEADS INSERT FOR VALUE
FL1-%FL2
FL2-%FL1
FL3-%FL2
FL3-%FL4
FL4-%FL3
-5
-14
-24
65
41
-24
-9
-21
65
41
Troubleshooting
Rebuild desktop:
You can rebuild the desktop. It's recommended to do so once a month.
Hold Alt and Apple keys down while clicking on Restart. Continue to
hold Alt & Apple keys down until screen ask if you want to Rebuild. Say
yes. Hope this helps.
No events during "acquire":
--restart computer
--verify cells in tube
--verify backflow of sheath
To burn data to a cd:
Mac: You can only use CD-RW, CD-R, DVD-RW or DVD-R on the Macs (not “+”). Insert a blank cd.
Default should open the program “Toast”, and the process is pretty self-explainatory, but if it does not
open, use the search tool in the top right of the window to find the application and open it to burn your cd’s.
You may also choose “Open with Finder” if the computer prompts you when you insert the blank cd, and
you simply drag and drop folders you wish to burn onto the cd icon, and when finished drag cd to trash
(trash can will change to “burn” icon). You can only burn to a cd once with this method, and cannot add
more files later!
How to burn Data CD
On Cyto 2:
1. Insert blank CD into the drive. The CD eject button is in the top right
corner of the keyboard, the underlined triangle.
click on the icon of the toaster for “Adaptec Toast” software in the dock.
Create a new folder on the desktop, and rename it whatever you want the
cd to be named. Move the folders/files you wish to burn into this new
folder. The software makes the name of the cd whatever the first folder
moved into it is called, and all files are put into that. Files to burn must
be on the computer being used to burn the cd.
You can use <apple> + I to see the size of the folder as you add files.
When you have collected the files you wish to burn, drag and drop the
folder to the Toast window. You can add or remove files at this point by
clicking the “Data” button.
Click “Write CD”
Choose between “Write Session” or “Write disk”:
If you are using a CD-R, you can only write to it once, so I don’t think it
matters which you choose.
If you are using a CD-RW, you will not be able to write to this disk again
if you choose “Write Disk”. If you choose “write session”, you can later
burn more files to this disk in an additional session if there is space
available.
Verify disk will check to see the data was copied correctly.
Remove disk, label disk, delete folder from desktop if you no longer need
the files on the computer.
Analysis station:
Inserting a blank disk should cause a cd icon to appear on the desktop.
Simply drag and drop folders and files you wish to burn onto the cd icon and
when all desired files have been added, drag cd to the trash, which will
change to a “burn” symbol. You can only write to a cd once using this
method.