1
SERVER ROOM
CLIMATE
&
POWER MONITORING
by
Gerry Cullen
Contributors:
Gary Akins
Jason Cohen
Pedro DeKeratry
Ron McCormack
Pepe Ramos
Michael Smith
Bob Walsh
ITWatchDogs
January 2011
Third Edition
All information and specifications subject to change.
Copyright © 2006, 2007, 2011 ITWatchDogs.
All rights reserved. No part of this book may be used or
reproduced in any manner whatsoever without written
permission, except in the case of brief quotations
embodied in critical articles and reviews.
For more information, write to:
ITWatchDogs
7600 N Capital of Texas Highway
Suite B-345
Austin TX 78731
First Edition, May 2006
Second Edition, March 2007
Third Edition January 2011
Printed in United States of America.
Library of Congress Control Number
2006931643
Cullen, Gerard L.
ITWatchDogs
Server Room Climate & Power Monitoring, edited by Gerry Cullen
p cm.
Summary: How Information Technology managers can use low-cost
climate and power measuring devices in order to be warned of
potentially damaging conditions to computer equipment rooms.
ISBN 1-59916-051-X
1. Computer Technology - Non Fiction
2. Electronics and Electrical Technology - Non Fiction
3. Data communications Technology - Non Fiction
2006931643 {[Non Fict]}
Cover art by Layne Lundstrom
1st Printing, 2006
www.itwatchdogs.com
NetBotz is a trademark of NetBotz, Inc.
Table of Contents
Introduction...................................................
The $160,000 Sunday Cook-in........................................................1
The Cost of the Meltdown................................................................2
Cost of Replacement Equipment...............................................2
Cost of Re-installing Software...................................................3
Chapter 1: Monitoring Techniques............5
Things That Kill Gear......................................................................6
The Five Fundamental Threats:.......................................................6
Heat Created by Equipment.............................................................6
Temperature Inside the Equipment Case.........................................8
Removing the Heat..........................................................................9
How UPS Helps Cook the Gear.....................................................11
Hot Spots, Temperature Variations...............................................11
Backup Air Conditioners...............................................................12
Water is Everywhere......................................................................12
Water Sensors.................................................................................13
Installation Rules for Water Sensors.............................................14
Smoke Alarms...............................................................................15
Power - How to Keep the Juice On...............................................15
Current Transformers.....................................................................16
Dual Power Strips..........................................................................17
Power Trends Seen in the Graphs..................................................17
Door Sensors..................................................................................18
The Well-Monitored Server Room................................................18
Appendix: How Fast Will a Server Room Heat Up?.....................19
Chapter 2: The WeatherGoose II Family. 20
WeatherGoose II Family Overview................................................21
Other Applications.........................................................................25
The ITWatchDogs Climate Monitor Family .................................26
Chapter 3: The WeatherGoose II..............27
WeatherGoose II Overview............................................................28
Input Power....................................................................................28
Reset Button .................................................................................29
Internal Sensors.............................................................................30
External Sensors............................................................................30
Remote Digital Sensors.................................................................31
Analog / Dry Contact Input Terminals...........................................31
Chapter 4: Other Climate Monitors..........33
Other Climate Monitors.................................................................34
The SuperGoose II.........................................................................35
The MiniGoose II...........................................................................36
The MiniGooseXP II......................................................................37
The MicroGoose.............................................................................38
The RelayGoose II.........................................................................39
The PowerGoose II........................................................................40
Climate Monitor Comparisons......................................................41
Chapter 5: Sensors..................................42
Digital Sensors...............................................................................44
Remote Temperature Sensor....................................................44
Remote Temperature, Airflow and Humidity Probe...............44
“CCAT” Analog to Digital Adaptor..........................................45
Analog Sensors...............................................................................46
Water Sensor............................................................................46
Door Contact Monitor..............................................................47
City Power Monitor.................................................................47
Smoke Alarm...........................................................................48
Current Transformer................................................................48
-48 VDC Sensor........................................................................49
WaterSnake..............................................................................49
Chapter 6: Climate Monitor Family
Firmware................................................50
Climate Monitor Family Firmware................................................51
Sensors Page..................................................................................56
Alarms Page...................................................................................58
Data Logging.................................................................................60
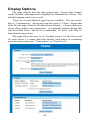
Display Options.............................................................................62
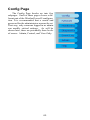
Config Page...................................................................................63
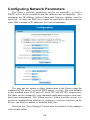
Configuring Network Parameters..................................................64
Monitoring Configuration..............................................................65
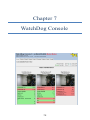
Chapter 7: WatchDog Console.................72
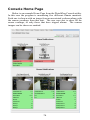
WatchDog Console.........................................................................73
Console Home Page.......................................................................74
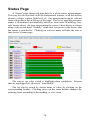
Status Page.....................................................................................76
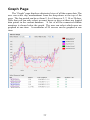
Graph Page....................................................................................77
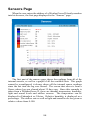
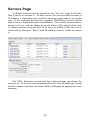
Servers Page..................................................................................78
Logs Page......................................................................................81
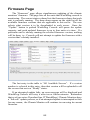
Firmware Page...............................................................................82
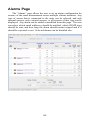
Alarms Page...................................................................................83
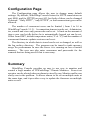
Configuration Page........................................................................84
Summary........................................................................................84
Chapter 8: Wrap Up..................................85
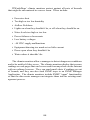
Monitoring Temperature................................................................87
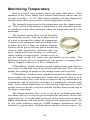
Monitoring R/H and Dew Point.....................................................88
Monitoring Airflow.......................................................................88
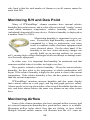
Monitoring Voltages......................................................................89
Monitoring Current........................................................................90
Monitoring Power..........................................................................90
Monitoring Light and Sound Levels..............................................90
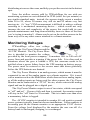
Smoke Alarm, Door Sensor and Water Alarms.............................91
Output Relays................................................................................92
Conclusion.....................................................................................92
Introduction
The $160,000 Sunday Cook-in
The meltdown at Acuity Software spurred development
of low-cost server room monitors - a true story.
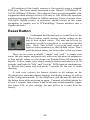
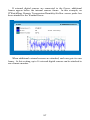
The equipment didn’t look dead. It looked the same as it did three
days ago. No burn marks, no melted faceplates. Even the Cisco
logos on the routers were still shiny white. One thing was different:
it was very quiet in the server room. Inside, the room normally
sounded like a vacuum cleaner, plenty of fan noise.
Not today. All the gear was dead.
Someone set this little
guy to 95 F. It did its job,
and killed the gear in the process.
Our IT manager was removing some servers from the racks and
placing them on wheeled metal cart that looked like the kind the food
caterers delivered lunch on. On several units, the tiny lights were fixed on,
as if the electronics inside the pizza-box cases were still alive, begging to
be freed. No rapid, urgent flicker, as in the past. Just steady pleading from
inside of some of the units. Our server room was toast. “All the gear is
dead?” I asked.
“Fried. Somebody left the thermostat turned up over the weekend and
the heater cooked the gear.”
“The heater blows into the server room?” I asked.
“Yes, it blows right in there.” He pointed to the ceiling register.
“Any chance you’ll be able to save the disks?”
“Very little. The heat sublimates the bearing oil. The drives go dry and
seize up. I’m sending them to a recovery shop, just in case,” he said
half-heartedly.
I called an IT friend at another company and told him what happened.
“It’s just a regular office heater. How did this happen?” I asked.
1
“The heat adds up; you have the heat from all the gear, plus the heat
dumping in from the ceiling grill,” he answered. “I’ll bet it was over 110
degrees in less than six hours. Inside the equipment cases it was over 130
degrees. Your gear is scrap, not worth repairing.” He gave me no hope.
He asked what kind of software was on the equipment.
“Our internal web and data servers. E-mail, the CRM stuff, and the
development guys files,” I answered. “Everything except the corporate
web site.” The corporate web site was hosted in New Jersey.
“Tough deal there,” he counseled. “Replacing the hardware will take a
week or more. Installing the software could take a month.”
“What if we have back-up disks?” I asked hopefully.
“Unless you have the same gear coming in as you burned up, there will
be incompatibility problems. How old was the gear?”
“Maybe five years old.” The depth of the problem was expanding. We
had bought some of the equipment from the last start-up company occupying the building. We had not installed much of the software ourselves.
We probably didn’t have all the CDs. Heaven knew where all the license
codes lived.
IT gear more than five years old is considered geriatric equipment.
Probably no parts were available, and they were certainly long out of
warranty. It would be a fresh start on the equipment list.
The Cost of the Meltdown
I asked the lead software developer what was in the room and he gave
me a thumbnail list. There were far more machines in the room than I
recalled, even though the room had hall windows. I added up his guess at
what was lost. Over $100,000, not counting the time needed to re-order
the gear. The IT guys had a sizable project.
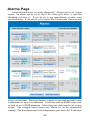
Cost of Replacement Equipment
Device
Routers
Servers
Switches
UPS
Quantity
4
8
2
2
Cost
$6,000
$10,000
$1,000
$1,000
Total:
2
Total
$24,000
$80,000
$2,000
$2,000
$108,000
“That’s what the equipment replacement is going to cost. You have to
reload the application software. You do have the CDs around the shop,
right?”
I answered that we must have them somewhere, but I recalled we had
a complex-looking magnetic tape backup system in the room with the
equipment. I wondered if the back-up unit got fried along with the gear.
“The application software is on the back-up tapes?”
“No, and if it is it’s probably an old version. Your guys will probably
first reload the Exchange Mail Server and then work on the Pivotal CRM
system. The developers can load their own stuff back. All the employee
data files should be on the back up tapes.” I wondered if anyone had ever
tried a backup. My PowerPoints were on one of the disks stacked in the
hallway. I had two weeks of work in those slides.
Since I didn’t know salaries for anyone except myself, I used consultant prices to reinstall the software. I showed my spreadsheet around and
most folks thought the cost would be twice that, but come back in two
weeks and we’ll have a better idea. Nobody felt like talking about the
meltdown, much less the IT guys who had become almost invisible.
“Plan on at least a month getting back up unless you have folks trained
on those enterprise-size systems in-house. You’ll be feeding CDs into
those replacement machines for weeks. Just rewriting the router tables
will take a couple of days.”
Cost of Re-installing Software
Device
Routers
Servers
Switch
UPS
Apps
4
30
2
2
Days to Reinstall
5
40
5
2
Total:
Total Cost @$1000/day
$5,000
$40,000
$5,000
$2,000
$52,000
Nobody ratted on who set the thermostat, but we were all under
suspicion.
I asked various technical staffers who had lost some computer capability when the room melted down how much time we lost. Weeks, easily,
they said.
I felt bad about the melt-down. I had been there that winter Saturday
when one of us had jammed the thermostat setting to the highest setting,
95 degrees. The heaters must have fully kicked in after we left. We froze
most of the day, and forgot about the thermostat setting.
3
The thermostat cost $50. I never got my PowerPoints back. If I ever
built a server room, I knew this wasn’t going to happen to me.
Comments by Gerry Cullen, who participated in the meltdown.
He left Acuity to found NetBotz and, later, ITWatchDogs.
Both are leading providers of server room monitoring equipment.
4
Chapter 1
Monitoring Techniques
5
Things That Kill Gear
Protecting existing server rooms is difficult because most legacy
server rooms are dissimilar and the threats are multiple. One
tried-and-true configuration may not work in another server room.
This chapter will show a variety of methods to monitor server rooms
that have proved effective in many years of instrumenting server
rooms.
The five fundamental threats:
Ÿ Heat, both inside and outside
Ÿ Water
Ÿ Fire and smoke
Ÿ Power Failure
Ÿ Intrusion
Heat Created by Equipment
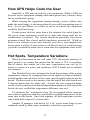
Almost all the electricity consumed by computer equipment is converted to heat. One feature of heat is its desire to quickly distribute itself.
With multiple cabinets and dozens of fans, the heat becomes uniform
through the room. The room feels hot, but there is no glowing stove to
demonstrate the amount of heat entering the room. If you moved around
with a hand-held thermometer, you would see hot spots, some more than
ten degrees above the average temperature.
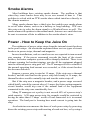
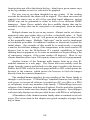
= 1000W Heater
Server cabinets full of floor heaters – an illustration to emphasize
graphically how much heat is produced in a typical server room.
6
Imagine the equipment replaced by floor heaters, the kind found under
almost any desk in Nebraska. A typical heater produces 500 watts, and
can easily take the edge off a cold cubicle.
Now imagine each piece of equipment
replaced with a floor heater. A typical PC
uses about 300 to 400 watts, not including
the monitor. For the sake of easy multiplication, let’s say your server room has 30 devicA typical server produces about the
es, each consuming 500 watts, for a total of same heat as a small floor heater.
15,000 watts.
If that number doesn’t seem impressive enough, try visualizing 30
floor heaters in the room. Turn all the heaters on and come back in 30
minutes.
How hot would the room be?
Heat Rise (deg F)
NonReversible
Damage
(Toast)
115
110
105
Depending on the room’s size
and insulation, the temperature
could rise 10°F in less than 30 minutes. In an hour the room could be
over 100°F.
95
90
Damage Begins,
Shutdowns,
"Flaky" Operation
85
80
75
65
8:00
8:30
9:00
Computer gear converts almost
all the electricity into heat. There is
no water pumped or logs sawed
(work); other than the internal fans
and the disk head arms, 90% of the
electricity converts to heat.
A heat-gain calculation showed that the internal temperature of the
room would increase about 15°F every thirty minutes. The room rapidly
becomes an oven. In most legacy server rooms, the air conditioning
system has no margin for error; at best, most legacy air conditioners can
barely cope with removing the internally generated heat. There is small or
no performance margin.
If the air conditioning partially failed, the room will heat up, and the
equipment’s maximum operating temperature could be exceeded within
only a few hours. If the air conditioner fails completely, the room could
be in melt-down condition in as little as an hour, ruining the equipment.
7
Temperature Inside the Equipment Case
At a recent trade show, two Cisco-certified (CCIE) network maintenance technicians commented on the importance of keeping the equipment
within operating temperatures. Here are their remarks:
“It’s more critical than many IT guys think,” said the first technician.
“A typical rack-mounted device can run about 20 degrees hotter inside the
unit than the outside temperature.”
We told them about our meltdown worries.
~70°F server room (ambient)
>80°F inside the blade server
“Happens a lot. Heat is the
big killer. If the gear doesn’t fail
outright, it gets flaky.”
server fails around 115°F (internal)
“What’s ‘flaky’?” we asked.
“Some of the integrated circuits become intermittent because of the
over-temperature operation. The silicon junctions in the integrated circuits can’t dissipate the heat and they become unreliable, even after the
gear cools down. You now have unpredictable equipment.”
“For example, a dependable server suddenly becomes unavailable.
You can’t see the site or read a disk file. Somebody gets mad and starts
calling you saying the server’s down, so you go racing around looking for
server problems. Just as suddenly, the server reappears and the complaints
cease. You go nuts. This happens every week. You move stuff to
different servers, you drive everyone crazy by pinging the gear every
minute. You have flaky gear.” He obviously spoke from experience.
The second technician added, “If we have a performance guarantee in
our maintenance contract, we can insist on replacing our gear if the room
temperature goes above 95°F for more than an hour. Once gear gets flaky,
it can drive our costs up and our reputations down.”
8
Removing the Heat
Taking the floor heater example one step further, let’s cool the room
with a dedicated air conditioner. Note the word dedicated – many legacy
server rooms use existing the building’s existing air conditioning system,
which adds more complexity because the heat load in other rooms may
change, affecting the air conditioner’s performance. A common example
of this is when an office copier is added to an office adjacent to the server
room. A large copier can produce 1,000 watts of heat when in operation,
which the building air conditioner has to remove
15,000 watts of heat needs two tons of air conditioning to remove.
(See calculations in Appendix.) To put this into perspective, a two ton air
conditioner will cool a three-bedroom home to 72°F in an Arizona summer.
Added to this calculation is the external temperature. Hot walls
require air conditioning. A stand-alone building in a Michigan winter has
different cooling requirements than a similar building in a Florida summer.
To simplify our example, we will assume the outside temperature is 72°F.
Since we only have about an hour before the equipment is damaged,
we need to instrument the air conditioner to get the earliest warning. A
well-running air conditioner should have a 20°F difference between the air
inlet (suction) and the output (discharge) sides of the evaporator coil. If
the filter begins to clog or the refrigerant starts to leak out, knowing the
difference between these two temperatures may provide a week’s notice
that there is a problem. Having temperature graphs is important here.
We recommend measuring the temperature in four locations. The first
location is at the wall thermostat, so we would know what the thermostat
saw as it controlled the compressor and fan. A locked cover for the
thermostat is highly recommended; one accidental brush of a cleaning
person’s vacuum hose is all it takes to turn off the air conditioner.
The next location is the hottest part of the server cabinet – between two
“pizza-box” servers is a good start. One IT manager uses a hand-held
infrared thermometer to find the hottest locations, then places sensors in
those hot spots. The hottest locations will be the first temperatures to rise
quickly if the cooling system fails.
The air conditioner should be instrumented in two ways:
First, the inlet temperature should be measured. A common way to do
this is to tie-wrap a Remote Temperature Sensor to the air inlet grill in the
ceiling.
9
In the same manner, attach a sensor to the air-conditioning output grill.
The difference between these two readings reflects the efficiency of the
unit. Some IT managers, particularly in the southern states, recommend
monitoring the outside (ambient) temperature as well, in order to see what
the building was subjected to.
Since the air conditioner is vital, experienced IT managers know that
an emergency monitoring and repair plan is essential. First, place multiple
personnel on the alert list. If somebody is on vacation – and someone is
always on vacation or sick when alarms come in – the backup personnel
will get the alarm.
Every IT manager who has lived through an air conditioning failure
agrees that a service contract with a reliable A/C repair company with
backup personnel must be established. The repair service must have 24
hour service. One IT manager even goes so far as to keep spare parts for
his air-conditioning systems in-house.
Many IT managers recommend monthly reviews of temperature logs
downloaded into a spreadsheet for analysis. Many things can happen
during weekends and holidays, and the logs will show if the room has
undergone a spike in temperature.
Monthly testing of temperature sensors – such as heating them with a
hair dryer to deliberately trip the alarm – is also highly recommended.
The logic behind all these recommendations is to get the earliest
warning possible. High temperatures in the spaces between the pizza-box
servers could indicate a problem; once the air around the wall thermostat
or the A/C inlet gets hot, it may already be too late to save your equipment.
Remote temperature sensors can have wire runs of hundreds of feet.
One well-placed temperature sensor can deliver an hour’s early warning, enough time to get a repair technician on site.
10
How UPS Helps Cook the Gear
Ironically, a UPS unit can help fry your equipment. While a UPS can
keep the server equipment running when main power fails, it doesn’t keep
the air conditioners going.
While keeping the equipment running during a power failure may
make the users happy, it also means that the gear will keep making tons of
heat. As we saw before, in as little as one or two hours the equipment
could fry itself into scrap.
If main power fails for more than a few minutes, the safest thing for
the server room equipment would be to shut each down until the air
conditioning is restored. The servers should be gracefully shut down;
programs exited, files closed, and the machines powered off. While an
hour or two without service may frustrate your users, just imagine how
much worse it will be if your system is off-line for days or weeks because
you had to re-build the entire server room after the equipment cooks itself!
Hot Spots, Temperature Variations
When the thermostat on the wall reads 72°F, the natural tendency of
most people is to assume this means that the room is 72°F everywhere.
But of course, this simply isn’t the case; temperatures can vary by 10
degrees or more in a room, and variations of 20°F inside server cabinets
are common.
One WeatherGoose user attempted to check the accuracy of his remote
temperature sensors by arranging them on an eight foot long workbench
located against one end of his server room, spaced equally apart across the
bench. He discovered, to his surprise, that one end of the work bench was
8 degrees hotter than the other end! At first, the user suspected faulty
sensors, but by placing an industrial digital thermometer at each end of the
bench, the user verified the temperature difference was real.
To minimize the “workbench effect” he tie-wrapped all six temperature sensors together so that they would all be reading temperatures in the
same spot on the bench. Once tied together, all the temperature sensors
read within half a degree F of each other.
Another IT manager, who built a 50’ x 50’ server room (large by our
standards, small by data center standards), related her experience:
11
“We have hot spots in our data center. I can show you a 10’ wall
section 15°F higher than the rest of the room. I’m putting in an additional
air conditioning duct to hit that spot,” she commented.
These experiences illustrate the importance of monitoring your server
room’s temperature with several sensors at multiple locations – otherwise,
equipment on one side of the room might be running hot while equipment
on the other side is well within normal limits, and you might never know
until it’s too late.
Backup Air Conditioners
From a peace-of-mind perspective, the most secure method of preventing a meltdown is to have a backup air-conditioning system that is
completely separate from the primary system.
Whether a stand-alone portable unit or a duplicate in-ceiling machine,
this is a practical way to keep equipment in operation while the primary
air conditioner is being repaired.
One user reported he had installed a backup cooling system from a
contractor built from used components for $5,000, including installation.
We mentioned this to a local IT manager and she said, “A backup
air-conditioning system, which I still don’t have, is next on my budget list.
By the way, you’re right about the UPS helping cook your gear. I hadn’t
thought about that until you mentioned it.”
Water is Everywhere
One IT manager we spoke to mentioned he had survived a fire
protection sprinkler accidental turn-on incident. He tells about his experience with water:
“The sprinkler just turned itself on. Don’t know why. A software guy
walked in right as the sprinkler started spraying down on a line of five
server cabinets. A maintenance guy found a big Styrofoam food cooler in
a closet and climbed up on a chair to place it directly under the sprinkler
head. He wrapped his sweater around the sprinkler head to help catch the
water.
“It took ten minutes to figure out how to shut off the sprinkler water.
Before they shut it down, three developers emptied the food chest eight
times into trash cans. Could have been a disaster.
12
“We started counting water pipes around the server room. Water pipes
were in the ceiling, the walls and under the raised floor.
“A slow flood could take an hour maybe, but the sprinkler eruption
would be catastrophic. What we needed was a permanent version of the
Styrofoam cooler to catch sprinkler leaks and other overhead leaks.
“The metal tray was simpler to build than we had imagined. A local
air conditioning sheet metal shop made two trays with hangar brackets and
½” drains for less than $150. We punched pencil sized holes in the
acoustic tile ceiling and hung the catch trays over the cabinets. The drain
was a real problem. The maintenance guy for the building helped us route
the garden house to a sink drain on the first floor.”
Water Sensors
Most water sensors measure the difference between the conductivity
of air and the conductivity of water. ITW water sensors have a low voltage
applied to four metal brads on a plastic case.
When the water touches the brads, it completes the circuit and the
current begins to flow. If the metal brads are touching a surface such as a
concrete floor, the graphs will show a decrease from reading 99 (dry, no
current flow) to 80 (damp) to 55 (full conductivity).
Make sure that the surface the sensor is placed on is nonconductive.
Since the sensor detects water by electrical conductivity between the metal
brads, if those brads are in contact with a conductive surface – such as a
metal tray – the sensor will always show full conductivity, wet or dry.
Routine testing of water sensors is essential. Unlike temperature,
which can show revealing trends over time, water is likely to be an
all-or-nothing event. Periodically dunking water sensors in a cup will
confirm the sensors are operational.
Correct orientation of the sensors is also essential. We were looking
at another installation in a data center. I asked the tour guide to see the
water sensors, and he lifted a floor tile to show me a sensor he had installed
near a floor drain point. The sensor had been installed upside-down! Be
sure the metal sensor brads are against the floor, or the sensor won’t work.
13
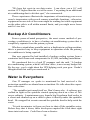
Installation rules for water sensors:
1. The sensor must face down – metal brads against the floor.
2. Placement locations:
a. Water collection trays such as the trays below sprinklers.
Don’t forget to insulate the sensors with a piece of vinyl
floor tile.
b. Lowest point on the floor or below raised flooring. Find
the lowest place on your floor. Spill some water and see
where it puddles in your server room. That’s a perfect
place for a water sensor.
c. Below a water pipe junction where the chances of a pipe
leaking are good.
d. In back-up air-conditioning condensation trays. If the
primary tray’s drain clogs up (very common because of
algae growth) and the water flows into the back-up tray,
once the back-up tray is full the next path for the water
may be right onto your server cabinets.
3. Place a small weight or clamp on the sensor so it cannot move.
We have seen some sensor installations where the connecting wire
had raised the sensor to 3” off the surface. The water would have
had to reach 3” in depth before the sensor would signal the alarm!
Nylon tie-wraps are another good way to restrain a wandering
water sensor that doesn’t want to stay where you want it to.
4. Test the sensor. Dunk it in a glass of water and see if you get an
alarm. Wipe it off, then place it on a wet napkin and note the
reading.
5. Make sure the sensor is installed on an insulated surface. If the
sensor must be placed on a metal surface, such as inside an
air-conditioner’s condensation tray, place something non-conductive, such as a plastic sheet or a vinyl floor tile, underneath the
sensor in between the sensor and the galvanized metal, as illustrated below:
water
sensor
weight
insulator
(plastic, paper, etc.)
air conditioner
drip pan (metal)
14
Smoke Alarms
Most buildings have existing smoke alarms. The problem is that
when they sense smoke there may be no one around to hear it. That
problem is solved with an ITW smoke alarm which interfaces directly to
the climate monitors.
Many smoke alarms have a third wire that enables one smoke alarm
to set off other alarms, such as in a hallway or long building. ITW uses
this extra wire to relay the alarm signal to a WeatherGoose as well. The
smoke alarm still operates in the normal mode, but now an e-mail alert can
be sent to someone offsite in addition to the smoke-alarm’s siren.
Power - How to Keep the Juice On
The nightmare of power strips stems from the internal circuit breakers
in the power strips. An electrician explained there are two types of circuit
breakers in power strips, thermal and magnetic.
In most installations, web or e-mail servers are expected to turn-on and
stay running. If the power consumed exceeds the limit of the circuit
breaker, the entire computer system will be abruptly disabled. There is no
advance warning for breaker tripping; one day all the equipment plugged
into the affected power strip goes off. The IT manager is left to wonder if
the normal operating load current was exceeded, or if the circuit breaker
has become defective.
Suppose a power strip is rated at 15 amps. If the strip uses a thermal
breaker, and the total load on the power strip held steady at 16 amps, the
thermal breaker would eventually trip and turn the entire strip off.
But if the strip uses a magnetic breaker, and a power surge occurred
which briefly raised the current above 15 amps, the faster-acting magnetic
circuit breaker would trip even if the normal load of the equipment
connected to the strip was considerably less.
Many IT managers set a policy to not exceed 60% of a power strip’s
rated capacity. A 20-amp power strip, for example would be restricted to
having no more than 12 amps’ worth of load connected to it in normal
operation. The hard part is learning how much current is going into the
strip.
An electrician can measure the draw of each power strip by powering
down the existing power strip and inserting a break-out box, or by using a
15
hand-held clamp-on ammeter. But the usefulness of these measurements
is usually short-lived, because equipment tends to migrate from cabinet to
cabinet and new equipment is always being added. If the breaker trips, a
trip to the server room is needed to reset the breakers, and the IT manager
has to determine why the breakers tripped. Usually, this is not easy.
There are two ways to monitor current in existing power systems:
Current Transformers, and In-line Current Meters
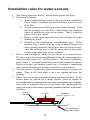
Current Transformers
A current transformer (CT) surrounds a single alternating currentcarrying wire and converts the current into a 0 - 5 VDC signal suitable for
input to a WeatherGoose analog-sensor jack. The CT supplied by ITW can
be selected for 30, 60, or 120 amp scales with a slide switch.
The most common place to mount a CT is around one of the wires
entering or leaving the breaker box. It cannot be used around power cords
unless a single power conductor is extracted from the cable, or else the
opposing magnetic fields will cancel each other out, as illustrated below:
current passing through a single wire generates a
magnetic field around the wire, which is detected by the
current transformer and turned into a voltage signal
the higher the current being carried by the wire, the
stronger the magnetic field, and the greater the voltage
signal from the current transformer
opposing currents from the hot and neutral wires
generate magnetic fields of opposite polarity which
cancel each other out, leaving no field for the
transformer to detect
16
Dual Power Strips
Many devices, such as Cisco routers, have A and B power inputs. If
you haven’t used equipment with two power inputs, the utility seems
vague until you need to power down an entire power strip to add or remove
equipment. With dual power-inputs, the equipment automatically operates off of whichever input is “hot”, switching between them without
interruption. If the equipment you plan to install in your server room is
available with this feature, we highly recommend it.
Power Trends Seen in the Graphs
The ability to measure and graph will sometimes show some surprising variations in voltage changes. Normal line voltage in the U.S. is
supposed to be 120VAC – and as long as the lights are on and everything
is running, it rarely occurs to us that it might be anything else. But when
you monitor and graph your power over a period of days, you just might
be surprised at what you find.
One customer discovered, after installing his power monitor, that his
incoming line voltage sagged at least twice a week to about 100 volts –
very close to “brown-out” conditions. Once again, graphs tell the story.
The Cisco installer technicians we spoke to said their gear starts shutting
down automatically about 105 volts. They recommend running all critical
gear off the UPS units, which are far more forgiving of voltage changes
and produce a steady voltage output.
We recommend all server room power be on dedicated circuits; that is,
the wires should run from the power transformer on the power pole outside
the building directly to the computer equipment inside, and the server
room should have its own breaker box independent from the rest of the
building circuits. Many facility managers oppose this due to the expense,
but the benefits can easily outweigh the additional cost.
17
Door Sensors
These tiny sensors, long used in the security industry, have two parts,
a magnet and a magnetically-activated switch. If the magnet gets close
enough to the switch, usually within an inch or less, the switch closes.
These sensors offer a low-cost option to monitor whether the doors to the
server room or equipment cabinets are opened or closed. Server and UPS
cabinets are excellent candidates for this kind of monitoring, since under
normal conditions no one should be opening those cabinets without the IT
administrators’ knowledge – not to mention that on some kinds of cabinets, leaving a door open can actually disrupt the proper flow of air across
the equipment, decreasing the overall cooling efficiency and making your
A/C units work harder. (Or worse, making your equipment run hot!)
Depending on your server room’s location and security requirements,
you might also place sensors on any doorways allowing access to the room
– although this option should be considered carefully; if personnel frequently come and go during the day, the steady stream of alarm mail will
quickly become an irritant. However, such alarms can be valuable for
weekend monitoring; if a door sensor goes off on a Sunday, when the
building is supposedly unoccupied, something is wrong! Fortunately,
ITWatchDogs’ latest line of monitoring equipment lets you choose whether to receive such alerts all the time, only during business hours, or only
outside of business hours, making situations like this much easier to
manage.
Note that door sensors will take some carpentry skill and various hand
tools to install correctly.
The Well-Monitored Server Room
Whether you have two server rooms to manage, or two hundred,
having a proper monitoring system in place greatly increases your chances
of surviving a climate failure with minimal damage. Just don’t forget to
periodically test your sensors!
18
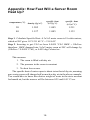
Appendix: How Fast Will a Server Room
Heat Up?
temperature (°C)
density (kg/m3)
specific heat
(kJ/(kg°C)
specific heat
20
40
1.205
1.127
1.005
1.005
1.211
1.133
(kJ/(m3°C)
Step 1. Calculate Specific Heat: A 3x3x2 meter room is 18 cubic meters,
which at 20C gives 18*1.211 kJ/°C = 21.8 kJ/C
Step 2. Inverting to get C/kJ we have 0.0459 °C/kJ 10kW = 10kJ/sec
therefore: 10kW dumped into 3x3x2 meter room at 20C will change by
(10kJ/sec * 0.0459 °C/kJ), or 0.459 deg Celsius/sec.
This assumes:
1. The room is filled with dry air.
2. The pressure in the room is constant.
3. No heat loss occurs.
The specific heat of water vapor is about twice that of dry air, meaning
pure water vapor will change half as much as dry air in the above example.
You would have to know the relative weight of water in the air to account
for humid air, but the answer will be between 0.25 and 0.45 °C/sec.
19
Chapter 2
The WeatherGoose II
Family
20
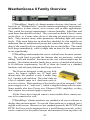
WeatherGoose II Family Overview
ITWatchDogs’ family of climate-monitor devices (also known, collectively, as “WeatherGeese”) provide remote monitoring of environmental parameters in data centers, server rooms, and in other applications.
They watch for extreme temperatures, extreme humidity, failed fans and
open doors that should be closed. They can send an alarm if there’s water
on the floor, or if some other device is drawing too much power or too
little. They monitor many other parameters, including light and sound
levels. If the room lights are on when they shouldn’t be, that might be an
indication that an unauthorized person has entered the room. An abrupt
drop of the sound level in a room might be due to a fan failure. The sound
level drops immediately, while it might take an hour for the temperature
to rise significantly.
ITWatchDogs understands that cost is a critical issue for most customers. We work hard to provide the features that are necessary, without
adding “bells and whistles” that increase the cost without improving the
product. Our climate monitor family has a variety of models and options
to fit different requirements, but all of them are based on a standard
hardware and software platform that keeps costs low.
The Geese are designed to take up very little
space; the largest models are 1U high rack
mount units, the smallest is only 4 inches long
by 1.5 inches wide and deep. They don’t take up
a lot of valuable space in a data-center rack or
in a server closet. Most members of the family run off an external 6 VDC
power supply (a.k.a. “wall wart”), which is supplied along with the units.
Some models also have Power over Ethernet (POE) capability, so they
don’t require the external supply to operate.
All the Geese have internal sensors; most models allow remote sensors to be connected as well.
ITWatchDogs’ climate monitors use standard web server software to
display their measurements. No special client software is required, just a
regular web browser. Because we use standard protocols like TCP/IP and
HTTP, the Geese can be monitored over a local Ethernet network, or they
can be connected to the public Internet and monitored from anywhere on
21
the Net. The monitors have an SNMP “agent” already built-in to the
firmware, so they can be accessed using popular network management
tools such as HP OpenView, What’sUp Gold, or LoriotPro.
22
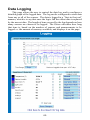
All members of the climate monitor family keep logs of the measurements they make. The user selects internal and external sensors to be
logged periodically. The number of sensors selected affects the length of
time that the log can cover, but in most cases data can be logged for days
or weeks. Data from the log can be downloaded to a PC in “Comma
Separated Value” (CSV) format. Most spreadsheet programs (Excel) can
read CSV directly, so the data can be analyzed using the spreadsheet’s
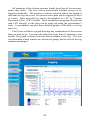
tools. A spreadsheet can also draw detailed graphs of the data, or of any
part of it.
The Goose will draw a graph showing any combination of the sensors
that you want to see. You can select the time scale, from 15 minutes to one
month. The graph is drawn from the data available in the log. The user
can determine which sensors are selected to graph, but the data in the log
remains unchanged.
23
A variety of internal and external sensor options are available, including:
Ÿ
Ÿ
Ÿ
Ÿ
Ÿ
Ÿ
Ÿ
Ÿ
Temperature
Ÿ Water leak detection
Humidity
Ÿ Voltage
Airflow
Ÿ AC Current
Sound Level
Ÿ Smoke Alarm
Light Level
City Power Monitor (monitors the power company voltage)
-48VDC Monitor (for Telecom installations)
Power Consumption, including real power, volt-amperes, and power
factor
Ÿ Contact closures, such as “door open” or “breaker tripped” detectors
Most members of
the climate monitor
family have internal
sensors to measure
things like temperature and humidity.
They also have at
least one connection for an external digital bus. This bus uses proprietary
technology to connect ITWatchDogs’ digital sensors to the Geese. This
external bus allows sensors to be hundreds of feet away from the Goose if
necessary.
Many WeatherGoose models have general purpose
analog inputs. ITWatchDogs offers a set of analog sensors
that connect to these ports. The analog inputs can also be
used with any type of sensor that outputs a signal between
0 and 5 volts DC. The analog inputs have weak pull up resistors on them,
which means they can be used to monitor “dry contact” inputs such as
external relays or switches.
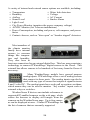
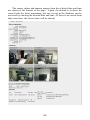
WeatherGoose II devices can include references to
supported IP-enabled cameras on the web page, which
causes the browser to display still images from the
cameras on the WeatherGoose page. Up to four cameras can be displayed at once. Contact ITWatchDogs for
the list of cameras that are currently supported.
24
Other Applications
ITWatchDogs’ climate monitor family was developed to monitor
environmental conditions in server rooms, but Geese are used for many
other applications. Several schools are using the WeatherGoose II device
and some external temperature sensors to monitor and log the temperature
in their cafeterias’ walk-in refrigerators. If the temperature gets too high
the Goose alerts the maintenance people, day or night. These schools are
also able to use the temperature logs to document that the temperature has
remained within the mandated safe limits for food storage.
A university lab used a Goose in a botany experiment to determine the
effect of longer or shorter days on certain plants. The Goose gave them a
log of light levels over time, as well as generating an alarm if someone
turned the lights on when they were supposed to be off.
Although we don’t recommend using the WeatherGoose II family
outdoors, one of our customers used a MiniGoose to monitor temperature
and humidity in a livestock enclosure, as part of an experiment to see how
these quantities affected his animals. (The experiment worked well, but it
ended when a spider took the term “web server” a bit too literally and built
his web inside the MiniGoose’s case, which eventually corroded some of
the internal connections.)
At least one telecommunications company in South America has
placed several WeatherGoose units in the equipment rooms of remote
communications towers to help them make sure the backup batteries are
being properly charged and serviced. An emergency-services organization in the northeastern U.S. is using a WeatherGoose to remotely monitor
the fuel levels in an LPG storage tank. While the WeatherGoose units may
have originally been designed with server rooms and data centers in mind,
our customers are always finding new and interesting uses for them!
25
The ITWatchDogs Climate Monitor Family
The ITWatchDogs Climate Monitor Family includes:
1. WeatherGoose II - the flagship of the family
2. SuperGoose II - Similar to the WeatherGoose II, but with an LCD
display and an audible alarm horn included
3. MiniGoose II - WeatherGoose II functionality in a smaller case
(4” x 1.5” x 1.5”) with a single digital sensor port.
4. MiniGooseXP II - A MiniGoose with a full array of 16 digital
sensor ports and three analog ports
5. MicroGoose - The least expensive member, with only temperature
and humidity sensors. The MicroGoose can run off the standard
external power supply or off “Power over Ethernet” (POE).
6. RelayGoose II - Similar to the SuperGoose II, but with three low
voltage relays to control external devices
7. RelayGoosePOE II - same as the RelayGoose II, but capable of
using Power over Ethernet (“PoE”) instead of an external 6 VDC
supply.
8. PowerGoose II - The same features as the WeatherGoose II, plus
AC power monitoring.
26
Chapter 3
The WeatherGoose II
27
WeatherGoose II Overview
The WeatherGoose II is ITWatchDogs’ flagship product. Many of the
features of the WeatherGoose II are shared by other members of The
WeatherGoose II Family. As you can see from the illustration, the
WeatherGoose II fits in a 1U high 19” rack mount chassis. All of the
connections are on the front panel for easy access.
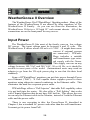
Input Power
The WeatherGoose II, like most of the family, runs on low voltage
DC power. The input voltage must be between 6 and 12 volts. The
WeatherGoose II draws about 450 mA at 6 VDC. (It might draw more
current if external sensors
are connected.) ITWatchDogs includes a suitable
wall transformer type external supply with the Goose.
This supply can run on any
voltage between 100 VAC and 240 VAC, 50 or 60 Hz, so it should be
useable in most parts of the world. (International users may need an
adaptor to go from the US-style power plug to one that fits their local
standard).
Some of ITWatchDogs’ monitors can get their power through Power
over Ethernet (“PoE”). A PoE capable router supplies power to these
monitors using otherwise unused conductors in the Ethernet cable. This
eliminates the need for a separate power cable.
ITWatchDogs offers a “PoE Injector” that adds PoE capability when
it is not built into the router. We also offer a “PoE Splitter” that works
with Climate Monitors that do not have PoE built in. This allows the user
to run only the Ethernet cable to the Monitor, instead of both the Ethernet
cable and the power cable.
There is one exception to this: the PowerGoose II, described in
Chapter 4, has a standard AC power cord rather than the wall transformer.
It cannot get its power from PoE.
28
All members of the family connect to the network using a standard
RJ45 jack. The Geese can be connected to any 10baseT, 10/100baseT, or
10/100/1000baseT Ethernet. (Note that the Geese are not compatible with
equipment which attempts to force 100-only or 1Gb/10Gb-only operation
and does not support fallback to 10Mbit operation. Users of certain Cisco
1Gb/10Gb Gigabit routers, in particular, should beware of this when
attempting to connect any of ITWatchDogs’ climate monitors into a
Gigabit network.)
Reset Button
Underneath the Ethernet jack is a small hole for the
IP Reset button, which restores various settings on the
unit to their default values. The unit can be reset by
inserting a jeweler's screwdriver or a paperclip into this
hole. (Note: This is NOT a power-up reset, rather it
restores some parameters to their default values. Don’t
push the button unless you’re sure that’s what you want)
There are two resets available, “simple” and “total”. A simple reset
erases the user names and passwords, and resets the network parameters
to their default values (see the chapter on WeatherGoose II Firmware for
details). To do a simple reset, simply push the button and hold it for 15-20
seconds, until both the “Idle” and “Activity” LEDs light up simultaneously. Release the button and wait about 5 seconds for the unit to finish
resetting.
A total reset restores the factory defaults to all settings on the
WeatherGoose, including alarms, logging, and display settings, as well as
all the Config information. To do a total reset, turn the unit off, then hold
the button down while powering up again. Continue to hold the button for
at least 5 seconds, then release it and let the unit reboot normally. Again,
this erases ALL of your settings, the unit will be as it came from the
factory.
29
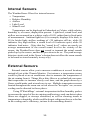
Internal Sensors
The WeatherGoose II has five internal sensors
Ÿ
Ÿ
Ÿ
Ÿ
Ÿ
Temperature
Relative Humidity
Airflow
Light Level
Sound Level
Temperature can be displayed in Fahrenheit or Celsius, while relative
humidity is, of course, displayed in percent. Light level, sound level, and
airflow are measured on a relative scale of 0-99, rather than in fixed units
of measurement. Ambient light level, for example, displays 0 for dark, to
99 for bright light; airflow readings of <20 indicates still air, while 99
indicates very high airflow; a sound level of 0 indicates quiet, while 99
indicates loud noise. (Note that the “sound level” values are merely an
average measurement of the overall sound level in the vicinity of the
sensor; the WeatherGoose does not record or transmit the actual sounds
picked up by the sensor, and has no provision to do so. The peak/average
detector circuit used in the Goose’s design does not allow the room sounds
to be heard or stored remotely in any way.)
External Sensors
External sensors allow you to measure conditions at several locations
instead of just at the Climate Monitor. For instance, a temperature sensor
could be placed at an air conditioner duct to measure the temperature of
the air coming from it. Things like a dirty filter or a coolant leak can cause
that temperature to increase slowly over time, and the graph drawn by a
Goose would make such a trend easy to see. Multiple temperature sensors
located throughout the room can reveal where the “hot spots” are, so more
cooling can be directed to those places.
Using ITWatchDogs’ external temperature/airflow/humidity probes
to measure the speed of the air entering and leaving a rack can detect when
filters are clogged, or airways obstructed, as well as showing trends in
temperature or humidity which could help spot refrigerant loss or a decline
in the cooling unit’s efficiency, in time to do something about it.
30
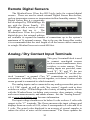
Remote Digital Sensors
The WeatherGoose II has five RJ12-style jacks for external digital
sensors. These are used to attach external Digital Sensor Bus devices,
such as temperature sensors or temperature/airflow/humidity sensors. The
Digital Sensor Bus is a proprietary
bus developed by ITWatchDogs for
use with the Goose Family. ITWatchDogs sells a variety of external sensors that use it.
The
WeatherGoose II has five jacks for
digital devices, but external splitters
are available to expand the number of connections up to the system’s
maximum of 16 external sensors. Due to the way the Sensor Bus works,
it is recommended that the total length of all the sensor cables connected
to a single WeatherGoose not exceed 600 feet.
Analog / Dry Contact Input Terminals
This gray 5-terminal block is used
to connect non-digital sensors
such as current transformers, door
switches, or water sensors. Three
analog inputs are provided, numbered “1”, “2”, and “3”; the two
terminals labeled “C” are the electrical “common”, or ground. (Two “C” connections are provided for
convenience; internally, they are tied together, so it doesn’t matter which
sensor ground is connected to which terminal.)
The analog inputs can be connected to any analog sensor that puts out
a 0~5 VDC signal, as well as with “dry contact” signals such as door
switches or relays. ITWatchDogs sells a variety of analog sensors for use
with the WeatherGoose, including water sensors, door contacts, voltage
and current measurements, and smoke alarms. See the “Analog Sensors”
tab at www.itwatchdogs.com for more information.
The input voltage should never be below 0 volts or above 5 volts with
respect to the “C” terminals. The Goose measures the input voltages and
displays them on a scale of 0-99, where 0 corresponds to 0 volts and 99 to
5 volts. The actual value displayed is an average of several samples to
reduce the effect of noise on the measurement. The Goose updates the
31
displayed values every few seconds. The web page automatically refreshes
every 60 seconds, but if you hit the “refresh” button on your browser more
often than that you will see the updated values immediately.
The analog inputs have weak “pull ups” on them to supply a small
amount of loop current for use with dry contacts, which makes it possible
to use them with devices like door sensors or relays. With these types of
sensors, a reading near 99 means the contact is open, and a reading near 0
means it’s closed.
The WeatherGoose II is typical of the entire product line. The other
members of the family are similar to it; they may have a different mix of
features, come in different packages, and/or be intended for different
budgets and applications than the WeatherGoose II, but they are all based
on the same core design and share a common user interface, making it easy
to choose the model that fits your needs for any given installation.
In the next chapter we’ll discuss those other members of the family,
concentrating on how they differ from the WeatherGoose II.
32
Chapter 4
Other Climate Monitors
33
Other Climate Monitors
The WeatherGoose II Family includes other climate monitors that
offer additional features, different form factors, and are intended for
different budgets and applications. Other models of the family include (at
this writing):
1. The SuperGoose II
2. The MiniGoose II
3. The MiniGooseXP II
4. The MicroGoose
5. The Relay Goose II
6. The RelayGoosePOE II
7. The PowerGoose II
34
The SuperGoose II
SuperGoose II
The SuperGoose II adds two features to the WeatherGoose II: A 2 line
by 8 character LCD display, and an audible alarm horn. The LCD can be
configured to display all the available measurements, or just the measurements that have exceeded their alarm thresholds.
LCD Display
“Horn Off” button
Otherwise, the SuperGoose II is similar to the WeatherGoose II. It is
the same size, 1U high by 19” wide, and has the same internal temperature,
humidity, airflow, light and sound sensors. It has 5 RJ12 jacks for external
digital sensors, and three ports for analog sensors or dry contact switches.
Any alarm can be configured to sound the horn when it trips, along
with sending emails and SNMP traps as they do on the other members of
the ITWatchDogs’ climate monitor family. The horn will stop either when
the alarm condition is resolved, or when the “Horn Off” button on the front
panel is pushed.
35
The MiniGoose II
The MiniGoose II has most of the
WeatherGoose II’s functionality in a smaller case (4” x 1.5” x 1.5”). It has the same
10baseT Ethernet jack as the rest of the
family, and it runs the same firmware. (See
the chapter on the WeatherGoose II Family
Firmware).
Due to its small size, the MiniGoose II has only one internal temperature sensor, and only a single RJ-12 jack for external Digital Bus
sensors, although external splitters are available to expand the single
connection into five or sixteen external ports. (The 16-port version is
shown below.) The same restriction of 600 total feet (180m) of cable
connecting all the digital sensors to the MiniGoose II applies as it does to
all the other family members. The MiniGoose II also runs off an external
6 VDC power supply. A suitable wall-transformer supply that runs off
100-240 VAC @ 50/60 Hz is supplied with the unit.
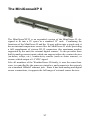
The MiniGoose II does not have any analog/dry contact inputs built
in. However, a peripheral called the “CCAT” is available that interfaces
analog and dry contact sensors to the digital bus. (See the chapter on
Digital Sensors for details)
The MiniGoose Splitter
(16 Port Version)
36
The MiniGooseXP II
The MiniGooseXP II is an expanded version of the MiniGoose II, designed to fit into a 1U space in a standard 19” rack. Combining the
functions of the MiniGoose II and the 16-port splitter into a single unit, it
has an internal temperature sensor like the MiniGoose II while providing
a full complement of sixteen RJ-12 connectors (the maximum number
supported by the unit) for external digital sensors. It also provides three
built-in analog-sensor inputs which can support either dry-contact devices
(switches, relays, etc.), conductivity sensors (such as water sensors), or
sensors which output a 0-5 VDC signal.
Like all members of the WeatherGoose II family, it uses the same firmware, is controlled by the same user interface, and connects to the network
via a standard 10BaseT ethernet jack. Since it has both analog and digital
sensor connections, it supports the full range of external sensor devices.
37
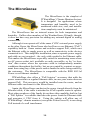
The MicroGoose
The MicroGoose is the simplest of
ITWatchDogs’ Climate Monitor devices.
It is designed for applications where
temperature and humidity need to be
monitored while size, cost, and installation complexity must be minimized.
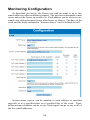
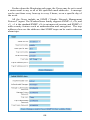
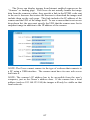
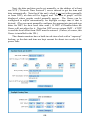
The MicroGoose has an internal sensor for both temperature and
humidity. Unlike other members of the WeatherGoose II family, though,
it does not have any provision for adding any external digital or analog
connections.
Although it can operate off of the same 6 VDC external power supply
as the other Geese, the MicroGoose also has Power-over-Ethernet (“PoE”)
capability built-in. Some routers and switches support PoE, which uses
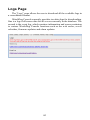
the Ethernet cable to supply power as well as connectivity to the devices
connected to it. This simplifies installation, since a separate power supply
and cable are not required – the only cable needed is the Ethernet cable.
This makes the MicroGoose especially suited for monitoring areas where
an AC power socket isn’t available or easily accessible; or for “co-location” data centers where the operators wish to independently monitor
conditions throughout the facility, but are prevented by contract or agreement from using any of the power outlets inside the racks being rented by
the customers. The MicroGoose is compatible with the IEEE 802.3af
Power-over-Ethernet standard.
ITWatchDogs also offers a “PoE Injector” accessory that adds the
power connection to a regular Ethernet cable, in case your router does not
support PoE. This accessory would be installed near the router, and an
Ethernet cable run from it to the MicroGoose.
Again, the MicroGoose can derive the power it needs directly from the
Ethernet cable, if the cable is attached to a PoE capable router or splitter.
Most other members of the family do not have this capability built in, but
a “PoE Splitter” is available that takes the power from the Ethernet cable
and generates 6 VDC from it. Using the splitter will allow any of
ITWatchDogs’ climate monitors (except the PowerGoose II) to run using
PoE instead of a wall transformer.
38
The RelayGoose II
The RelayGoose II adds output and control capability to ITWatchDogs’ climate monitors. It includes three dry-contact relays, which can
either be energized manually on a web page, or automatically when an
alarm trips. Both the normally open (NO) and normally closed (NC)
contacts are brought out to the front-panel terminal blocks, so the relays
can be wired in whatever way is most suitable for your particular application. The relays can be configured to de-energize when the alarm condition clears, or to stay energized until they are manually cleared from the
unit’s web page by the user. (This function can be password-protected, so
that only users with the control or admin password can clear a latched
relay.) Each relay can switch a maximum load of 30 watts @ 60 VDC or
30 VAC(rms), which is generally sufficient to operate warning lights,
alarm sirens, phone dialers, and similar devices.
The RelayGoose II has an internal temperature sensor, as well as 4
RJ12 jacks for external digital sensors and 6 analog/dry contact inputs. It
also has an LCD display and an audible alarm horn identical to the ones
included on the SuperGoose II.
The RelayGoose II takes up 1U of space in a 19” rack. It is powered
by 6 VDC from an external wall-mounted supply. The RelayGoose uses
ITWatchDogs’ standard firmware (see the Chapter on Firmware), and uses
the same sensors as the rest of the WeatherGoose family.
An optional version of the RelayGoose II is available that can run
using Power over Ethernet, just as the MicroGoose can. This version is
called the RelayGoosePOE II, and sells for slightly more than the standard
RelayGoose.
39
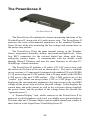
The PowerGoose II
The PowerGoose II
The PowerGoose II combines the climate monitoring functions of the
WeatherGoose II, along with a 10-outlet power strip. The PowerGoose II
measures the same environmental parameters as the standard WeatherGoose II unit, while also measuring the line voltage and current draw on
the power-strip sockets.
The PowerGoose II has the same internal sensors as the WeatherGoose: temperature, humidity, airflow, and sound and light levels. It has
four RJ12 connectors for the external digital bus along with three
analog/dry contact inputs. It communicates with the outside world
through 10baseT Ethernet, and uses the same firmware as all other ITWatchDogs’ climate monitors.
The PowerGoose II includes a 10-outlet, 120 VAC power strip, with
the outlets on the back of the unit as shown above. The unit is available
in two versions: a 15-amp model, equipped with standard US-style NEMA
5-15P power plug and 5-15R sockets; and a 20-amp model with a NEMA
5-20P power plug and 5-20R sockets. (The 5-20R sockets are of the
“combo” type, which can accept either 5-15P or 5-20P plugs.) Besides
displaying the environmental parameters, this unit measures the true RMS
voltage on the power strip as well as the peak voltage. It also displays the
current draw and peak current, as well as the real power being supplied,
the power factor, and the product of the voltage times the current (the
“apparent power”).
A “Remote Display” unit, which connects to the PowerGoose II by
means of a coiled telephone-style cord, is available as an optional add-on.
This unit adds an LCD status display and an audible alarm horn, similar to
those built in to the SuperGoose II and RelayGoose II.
40
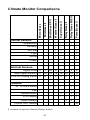
MiniGoose II
MiniGoose XP II
WeatherGoose II
SuperGoose II
RelayGoose II
RelayGoose POE II
•
•
•
•
•
•
•
•
•
•
•
•
•
•
•
•
•
•
•
•
•
•
Digital Ports
0
1
16
5
5
4
4
4
Max Digital Sensors
0
16 16 16 16 16 16 16
0-5V DC Analog Inputs
0
0
PowerGoose II
MicroGoose
Climate Monitor Comparisons
Internal Sensors
Temperature
Humidity
Air Flow
Light
Sound
Power
External Sensors
3
3
3
6
6
3
•
•
•
•
•
•
Features
19” 1U Rack Mount
PoE
•
•
Audible Alarm
•
•
•
†
LCD Display
•
•
•
†
3
3
Output Relays
110/208 VAC Outlets
10
† available via optional “Remote Display” add-on
41
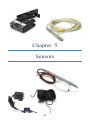
Chapter 5
Sensors
42
ITWatchDogs has a full line of external sensors that can be connected
to most of the climate monitors. There are two classes of sensors: digital
and analog. The digital sensors connect to the external digital bus connectors available on most of the climate monitors. Up to 16 digital sensors
can be connected at one time - splitters are available for monitors that have
fewer than 16 of the RJ12 Digital Sensor Bus connectors. (Note: this bus
is a proprietary ITWatchDogs design, and is not compatible with any
sensors from other companies.) It allows digital sensors to be connected
to climate monitors hundreds of feet away from the sensors. The total
length of all the digital sensor cables attached to one climate monitor
cannot exceed 600 feet (180 meters). For example, one sensor can be
attached to a monitor with 600 feet of cable; or, two sensors with 300 foot
cables can be attached to the same monitor, or four sensors with 150 foot
cables, etc.
Digital remote sensors available from ITWatchDogs include temperature-only sensors, and temperature/humidity/airflow probes. ITWatchDogs also offers an accessory (the “CCAT”) that can adapt analog sensors
to the digital bus for climate monitors which lack analog connections, or
for those users who need to add more analog sensors than their particular
model of climate monitor provides for.
Many of ITWatchDogs’ climate monitors have connectors for analog
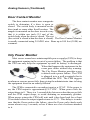
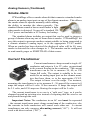
sensors. ITWatchDogs offers analog sensors that can detect water on the
floor, alert you when a cabinet door is opened, detect AC line-power
failures, and measure AC current draw, to list a few. Any device whose
output voltage is between 0 and 5 volts DC can be connected to these
analog inputs. Readings from analog sensors are not displayed in any
standard units; rather the displayed value is shown as “00” - “99” where
“00” corresponds to a 0 V input, and “99” corresponds to a 5 V input. In
addition, the analog input ports have weak pull-up resistors on them, so
they can also be used to monitor dry-contact signals, such as switches or
relay contacts. If the contact is open, the input will read at or close to “99”;
while if the contact is closed, it will read at or close to “00”. Note that
unlike Digital Bus sensors, analog sensors have no inherent wiring-length
limit, although excessively long wiring runs could affect the accuracy of
the readings due to increased electrical resistance or induced EM interference.
43
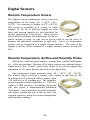
Digital Sensors
Remote Temperature Sensor
The digital remote temperature sensor measures
temperatures in the range -40 ~ +85°C (-40 ~
185°F). It is accurate to within ±0.5°C (±0.9°F).
The sensor is available in a variety of cable
lengths; 12, 20, 50, or 100-foot lengths are standard, and custom lengths are also available for
special applications if necessary. These sensors
can be used to measure the temperature at various
places around a room; or, one can be put in each of several racks to
monitor the individual conditions in each rack. Up to 16 temperature
sensors can be connected to a single climate monitor. The sum of the
lengths of all the cables attached to a single monitor cannot exceed 600
feet.
Remote Temperature, Airflow and Humidity Probe
This device combines three sensors – temperature, airflow and humidity – all in one package. Because all of these sensors are combined into a
single device, this “combo” probe only counts as one device against the
maximum of 16 sensor devices allowed on the digital bus.
The temperature sensor measures from -40 ~ +85°C (-40 ~ 185°F).
The airflow sensor reads on a relative scale similar to that used by the
WeatherGoose II’s internal airflow sensor, from
<20 (still air) to 99 (rushing air). The humidity
sensor measures relative humidity (0 - 100%) to
within ±3%RH accuracy. In addition, the probe
will also report a mathematically-calculated
“dew point” (the temperature at which humidity
will begin condensing out of the air onto any
exposed surfaces) using the current temperature
and humidity readings.
44
Digital Sensors (continued)
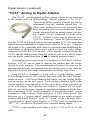
“CCAT” Analog to Digital Adaptor
The “CCAT” was developed to allow analog sensors to be connected
to the digital ports on ITWatchDogs’ climate monitors. The CCAT
converts an analog signal to a format that can be
transmitted over the standard digital bus. It
allows more analog sensors to be connected than
there are analog ports on a given monitor. Some
climate monitors have no analog inputs, but analog sensors can be connected to them using
CCATs. Splitters can be used to connect more
CCATs if necessary. Since the Goose firmware
sees the CCAT as a digital sensor, the total number of CCATs and other
digital sensors connected to a single Goose must be 16 or less. Likewise
the length of the connecting cable must be included when calculating the
total length of all digital cables used, which as has been noted before,
cannot exceed 600 feet (183 meters). (Note that the wiring between the
CCAT and the analog sensor does not count as part of the 600 ft. limit;
only the digital connection from CCAT to climate monitor counts.)
If an analog sensor must be tens or hundreds of feet from a climate
monitor, a CCAT can be used to digitize the reading near the sensor
instead of at the monitor. This arrangement will reduce the noise on the
measurement that may encountered in an electrically noisy room, since the
digital bus is much more noise resistant than an analog connection.
Each CCAT is designed to work with a specific analog sensor.
ITWatchDogs offers CCAT versions that work with the water detector,
smoke detector, City Power Monitor and others. (see the Analog Sensor
section starting on the next page). Each version identifies itself to the
climate monitor it’s connected to, so the correct device name will show up
on the web pages. There are also two models of “generic” CCAT available, for use with 3rd-party sensors or specialized equipment which don’t
have a matching CCAT model (examples of this would include weight
transducers, relay contacts from generator or UPS status panels, gas
detectors, etc.); a “generic digital” model intended for use with dry contact
switches and which displays “open” or “closed” on the web page, and a
“generic analog” model which displays a 0-5 VDC input as a reading from
“00” - ”99”, just like the WeatherGoose’s internal analog inputs.
CCAT’s come standard with either a 12 ft (3.7 M) or 25 ft (7.6 M)
cable.
45
Analog Sensors
ITWatchDogs supplies a full line of analog sensors to go with the
WeatherGoose II family climate monitors. These can either be connected
directly into the analog inputs of the climate monitors that have them, or
to CCATs which convert the outputs to digital format. The exact number
of built-in analog inputs, and the style of connector used, varies between
models (although most models of the WeatherGoose II family provide
three such inputs); more details can be found in the previous section on the
various climate-monitor models.
The analog sensor line includes:
1. A water-leak monitor
2. A door-contact switch to determine if a door is open or closed
3. A sensor that detects incoming-power blackouts (“City Power
Monitor”)
4. A smoke alarm
5. A current transformer, to measure AC current
6. A sensor that monitors positive-ground, -48 VDC voltage levels
(for telecom applications)
7. A more sophisticated water leak detector, (“Water Snake”) that
watches for leaks anywhere along a cable, allowing an large area
to be monitored instead of just a single point.
Water Sensor
The water sensor, like all the other sensors, is designed to be connected to one of the analog input ports on a climate monitor. The water sensor
has four metal brads on the bottom. It works by measuring the resistance
between the brads. If the surface it’s sitting on
is dry, the resistance will be high, and the
sensor will read 99. If the sensor is in a pool
of water, the resistance will be low, and it will
read around 50 or lower. Readings between
99 and 50 indicate increasing dampness under
the sensor.
The water sensor must never be placed on a metal or otherwise
conductive floor or it will give inaccurate readings. Several water sensors
can be placed around a room and connected in parallel (to the same
numbered terminal). If this is done the climate monitor will raise an alarm
when any one of the sensors detects water.
The water sensor should be connected to the climate monitor by 22 or
24 AWG wire. Runs of 100 feet or more are common.
46
Analog Sensors (Continued)
Door Contact Monitor
The door contact monitor uses a magnetic
switch to determine if a door is open or
closed. The switch body is mounted on the
door jamb or some other fixed location. The
magnet is mounted on the door in such a way
that it is within one inch (2.5 cm) of the
switch body when the door is closed. The switch is wired normally closed
(the switch is closed when the door is closed). The Door Contact Monitor
is usually connected using 24 AWG wire. Runs up to 100 feet (30 M) are
common.
City Power Monitor
Most server rooms have uninterruptible power supplys (UPS) to keep
the equipment running in the event of a power failure. The problem is that
the UPS can only keep the equipment up until its battery is discharged.
When that happens the equipment in the
room goes down without any warning.
The City Power Monitor provides a way
to detect such a power failure. The CPM
is plugged in to a wall receptacle that is
not behind the UPS. The CPM triggers
an alarm as soon as power fails, thus giving the administrator time to bring
the equipment down in an orderly fashion.
The CPM is connected to an analog input or a CCAT. If the power is
on, the CPM output is approximately 4.5 VDC. When power fails the
output drops to 0. There is a 1-second delay between when the power fails
and the CPM output drops, to avoid alarming on momentary glitches.
When power returns the CPM will wait until it has been back for at least
30 seconds before the output signal returns to 4.5 V. This delay is to make
sure that the Goose notices the failure, since the Goose only checks each
sensor about every 5 seconds, or less if there are a lot of sensors attached
to it.
47
Analog Sensors (Continued)
Smoke Alarm
ITWatchDogs offers a smoke alarm kit that connects a standard smoke
alarm to an analog input port on one of the climate monitors. This allows
the smoke alarm to operate normally while adding
the ability to monitor the alarm remotely. The
standard alarm sounds a buzzer and flashes a light
when smoke is detected. It runs off a standard 120
VAC power and includes a 9V battery for backup.
The standard alarm includes an output that can be used to trigger a
group of alarms when any one of them detects smoke. ITWatchDogs’ kit
uses this output to generate another output suitable to being connected to
a climate monitor’s analog input, or to the appropriate CCAT model.
When no smoke has been detected the displayed value will be 99; once
smoke is detected the value changes to 1. The monitor can be configured
to send emails, pages or SNMP TRAPs if that occurs.
Current Transformer
Current transformers clamp around a single AC
conductor and output a 0 to 5V value proportional
to the current flowing in the conductor. The current
transformer can be set to measure 30, 60, or 120
Amps full scale. The output is suitable to be connected to an analog input port on the climate monitors that have them, or to the appropriate CCAT.
The output is linear over the range. For instance,
assuming the transformer is set to measure 0 - 30 amps:if the current is 0
amps the output will be 0 volts. If the current is 15 amps the output will
be 2.5 volts, and if 30 amps are flowing the output will be 5 volts.
The current transformer is we use is a “split core” type, so it can be
clamped around an existing wire instead of requiring that the wire be cut
and passed through the core.
Important Notes: The conductors in an AC cord must be separated
– the current transformer must clamp around one of the conductors, else
the currents in both conductors will cancel each other out. A current
transformer can only measure alternating current (“AC”). It will not
work with direct current (“DC”).
48
Analog Sensors (Continued)
-48 VDC Sensor
The -48 VDC sensor is designed to monitor battery voltages in telecom rooms, and for other applications that need to monitor negative
voltages. Such systems are also called “positive
ground” systems. The sensor measures DC voltages in the range -15 to -60 volts, and converts them
into voltages between 0 and +5 VDC that can be
connected to an input port on a climate monitor or the appropriate CCAT.
By setting appropriate trip points on the monitor’s alarm page, the user can
be notified if the battery is overcharged or discharged in time to take the
appropriate action. The -48 VDC sensor is accurate to within +/-5%, and
draws less than 20 mA from the battery.
WaterSnake
The WaterSnake uses a water-sensing cable
that can sense water anywhere along its length. It
is usually run all the way around a room at the base
of the walls. That way water on the floor anywhere in the room from any source will be detected. Standard cable lengths are 10 ft, 20 ft, 50 ft and 100 ft; custom lengths
are available up to 300 ft long.
The WaterSnake’s control box (not shown) has two relays that are
suitable to be connected to the analog inputs of a climate monitor, or to an
appropriate CCAT. One relay opens when water has been detected; the
other relay opens when the cable has been cut or otherwise damaged. The
climate monitor will display 0 when the relays are closed, and 99 when
they are open. The user can configure the monitor to send emails, pages,
or SNMP traps when either relay opens.
future expansion...
ITWatchDogs is always looking out for potential new applications and
sensors to add to our product line, so be sure to visit out web site to see the
latest developments.
49
Chapter 6
Climate Monitor Family
Firmware
50
Climate Monitor Family Firmware
ITWatchDogs’ family of climate monitors, which includes the SuperGoose II, WeatherGoose II, MicroGoose, RelayGoose and others
(collectively called the “Geese”) allow the user to monitor remotely
critical environmental parameters in server rooms and similar places, and
to be notified when those parameters exceed specified thresholds. The
Goose family firmware is designed to take full advantage of the capabilities of the various family members while presenting a human interface that
is easy to understand and use. Functionality is important, but ease of use
is critical. As with any other device, a climate monitor is not much use if
it is too hard to set up and operate.
Note: This chapter describes the Goose firmware as it existed
when this book was written. However, ITWatchDogs is constantly adding features and improving the user interface in
response to our customers’ feedback. By the time you read
this book, there may be several differences between the interface and behavior shown here in these pages and the actual
behavior of the units being shipped. This chapter should be
treated primarily as an overview and general introduction to
the WeatherGoose climate-monitoring system, rather than a
model- or version-specific user manual.
Users should also check our web site at www.itwatchdogs.com
periodically to see if a new release is available; if so, you can
download the new firmware release to your PC, then install it
into the unit. Firmware updates can be done straight from the
unit’s configuration web page via your PC’s web browser,
without any need for a separate update or installation program, and the process uses ITWatchDogs’ patented technology to insure that the Goose’s program memory will not be
corrupted if an upload fails for any reason. If a failure occurs
during uploading of the new firmware, the Goose will simply
discard the failed upload and keep running using the old
version of the firmware.
The same firmware package runs on all the Geese. At power-up, it
automatically recognizes which model of Goose it’s running on and
configures itself accordingly. It identifies which internal and external
sensors are connected and initializes them, and displays the appropriate
web pages and controls.
51
The standard human interface to a Goose is through a set of web pages.
The firmware includes a fully functional web server. The Geese use
standard Internet protocols such as TCP/IP, HTTP, HTTPS, DNS and
DHCP, so they are compatible with internal networks or the public
Internet. A user does not need any special client software on his or her
computer, just a standard web browser such as Internet Explorer or
Firefox. ITWatchDogs tests each new release to make sure the web pages
are rendered properly by a wide range of browsers.
The Goose-family firmware also includes an SNMP “agent”, which
means any Goose can be monitored by popular network management
packages such as HP OpenView, WhatsUp Gold, or LoriotPro. SNMP v1,
v2c, and the secure SNMP v3 are all supported. A Goose can send alert
emails through SMTP or ESMTP, and can send encrypted emails via
TLS/SSL. ITWatchDogs also offers a Windows application called
“Watchdog Console” which allows multiple Geese to be monitored from
one PC.
When the firmware starts up it automatically discovers the sensors that
are attached and starts scanning them. If a new sensor is attached while
the firmware is running, it will be discovered and added to the scan. A
new scan is launched about every five seconds or so and the web pages
updated. However, the new data will not appear on-screen immediately,
unless the browser’s “refresh” button is clicked right away. The Goose
refreshes the web pages every 60 seconds, whether the user clicks
“refresh” or not.
The measurements are stored in a log file, in non-volatile memory.
The user can select certain sensors to be logged, or to have all of them
logged. Log entries are made every 60 seconds. The amount of data that
can be stored depends on the number of sensors being logged, but many
configurations have room for 30 days’ worth or more. Once the log
memory is full, the oldest entries are pushed out to make room for the
newest ones, so the log always contains the most recent samples. The data
stays in the log until the user explicitly clears it. The user can download
the logged data directly from the unit’s web page, as a Comma Separated
Value (“CSV”)-formatted text file. Most popular spreadsheet programs,
such as Microsoft’s Excel or OpenOffice Calc, can read CSV files.
The Goose can draw a graph of the data from selected sensors over a
selectable time scale. The graph is drawn from the data in the log, so data
from a given sensor must be being logged in order to be graphed. The user
can select data from any combination of sensors to be graphed. New
sensors can be selected, and the graph redrawn, at any time. The graphing
52
function does not affect the data in the log – data from a given sensor stays
in the log whether or not it is selected to be graphed.
The user can set an alarm threshold on any sensor. If the reading
exceeds the threshold, the alarm will be tripped. The alarm can cause an
email to be sent to any or all of five specified email addresses, and an
SNMP trap can be generated to either or both of two different SNMP
managers. Some Goose models also have audible alarms that can be
sounded, or relays that can be energized or de-energized, when an alarm
occurs.
Multiple alarms can be set on any sensor. Alarms can be set when a
measured value goes either above or below a threshold value. A “high
trip” combined with a “low trip” will generate an alarm if the value is out
of the acceptable range. Multiple “high trips” can be used to implement
an escalation procedure if conditions continue to deteriorate beyond the
initial alarm. (An example of this would be to send merely a warning
e-mail to the facilities manager if the temperature in the room reaches 80
degrees, but to use the RelayGoose II’s control capabilities to begin
shutting down equipment, or to cause an autodialer to begin calling a list
of emergency contacts, if the room reaches 90 degrees.) Most of our
climate monitors allow up to 200 separate alarm events to be programmed.
Another feature of the firmware adds images from up to four IPenabled cameras to a web page. The Goose does not actually read the
image from the camera and include it in the page it sends to the browser.
Rather, the HTML code for the web page includes a URL which points the
browser to the cameras, which causes the browser to fetch the images
directly from the cameras themselves.
The standard human interface for any member of the Goose family is
through a web browser. ITWatchDogs’ standard firmware has a built-in
web server, so no special software is needed on a PC (or a Mac or a PDA
or cell phone) to use any member of the family. ITWatchDogs tests new
releases of the firmware with Internet Explorer, Firefox and other popular
web browsers to make sure they display the pages properly. Special pages
with text-only displays are also provided for use with PDAs or cell phones.
All members of the climate monitor family share a common set of web
pages. The screen shots in this chapter are typical examples of pages from
any of them.
53
A typical example of the initial web page generated by a SuperGoose II
displaying a status summary, internal sensors, and an external sensor.
54
The top of each page is always the same. A “friendly name” is
assigned to each device by the user, and that name is displayed at the top
of the page. The device’s IP address is given, as well as the local date and
time and the software revision number.
“Friendly Name”
Software Version Number
A set of tabs appear on the left side of each page.
These are links to the other pages.
The “PDA/Phone” button below the tabs changes the
display to a sparse view of the first page (“Sensors”).
This allows a user to check on the current readings
from all the sensors using a device with a small screen
and perhaps a slow data link.
The “MIB” button downloads the information that a
SNMP (“Simple Network Management Protocol)
Manager needs in order to monitor this device.
The “XML” button allows downloading the current readings in XML
(eXtensible Markup Language) format. Certain useful management
programs can read data in this format.
Each page has a footer that shows information about this particular Goose
so the user can keep track of multiple Geese in a system. These values are
set on the Config->Admin page which is described later.
55
Sensors Page
When the user enters the address of a WeatherGoose II family member
into his browser, the first page displayed is the “Sensors” page.
The first part of the sensors page shows the readings from all of the
internal sensors, as well as a graph of all the available data. This graph
cannot be reconfigured; it always shows all the internal sensor readings
since the last time the log was cleared. The screen shot above is from a
Goose whose log was cleared about 35 days ago. Since this example is
taken from a WeatherGoose II, there are internal temperature, humidity,
light and sound levels and airflow sensors. The temperature can be
displayed in Fahrenheit or Celsius. Relative humidity is displayed as a
percentage. The airflow rate as well as light and sound levels are given as
relative values from 0-100.
56
If external digital sensors are connected to the Goose, additional
frames appear below the internal sensors frame. In this example, an
ITWatchDogs Remote Temperature/Humidity/Airflow sensor probe has
been attached to the WeatherGoose.
When additional external sensors are attached, each one gets its own
frame. At this writing, up to 16 external digital sensors can be attached to
one climate monitor.
57
Alarms Page
Alarm thresholds are set on the alarms tab. Alarms can be set on any
sensor. An alarm can be set to trip if the value goes above a specified
threshold or below it. It can be set to trip immediately or after some
specified delay. It can also be set to repeat the if alarm hasn’t been cleared
after a certain time. When an alarm is tripped, it can send an email to any
combination of up to five addresses. It can also send an SNMP trap to one
or both of two SNMP managers. More than one alarm can be set on any
sensor. The example above shows two alarms set on the temperature
reading. The first alarm trips if the temperature goes above 90°F and stays
58
there for at least five minutes. After that time, an email is sent to the first
address on the list, and an SNMP trap is sent to the first manager. If the
alarm is not cleared after 10 minutes, another email and another trap will
be sent.
The second alarm will trip immediately if the temperature climbs
above 100°F. It sends an email to a different address. This is an example
of an escalation procedure: if the temperature exceeds 90°F the first alarm
is tripped, the Goose emails the first responder. If he fails to respond and
the problem gets even worse, the Goose will notify another person.
Emails can be sent to any combination of five different addresses.
Additional alarms can be added by clicking the “Add New Alarm”
button at the bottom of the page. As mentioned before, multiple alarms
can be set on the same sensor. Up to 200 alarm events can be set at any
given time.
59
Data Logging
This page allows the user to control the data log, and to configure a
detailed graph of the logged data. The log can be configured to store data
from any or all of the sensors. The data is logged in a “first-in first-out”
manner, which is to say that once the log is full the oldest data is replaced
by the newest data. The length of time covered by the log depends on how
many sensors are chosen to be logged. The Goose calculates how long
that time is, based on the number of sensors and measurements to be
logged vs. the amount of memory available, and displays it on the page.
60
The user can select exactly what measurements are logged. The
Goose hardware reads all the sensors approximately once every 5 seconds.
Log entries, however, are made approximately every 60 seconds. In
“normal” mode, the value logged is the most recent reading. This is
appropriate if the input value does not change quickly, for instance the
temperature in a room cannot change very much in only 60 seconds. For
measurements that can change quickly the user can select the “high water”
or “low water” mark. In this mode the value logged is the highest (or
lowest) value that was seen in the last 60 seconds. This useful for things
like door contact sensors, since a door can be opened and then closed in a
short time.
The entire log can be downloaded at any time in “Comma Separated
Value” (CSV) format, which can be read by Excel and most other spreadsheet programs.
The user can clear all the data out of the log by checking the “Reset
Logs” box. Note that the user must press the “Save Changes” button
before any change, including clearing the data, will take effect.
Data from the log can be graphed on this page as well. The user can
select which data items to graph, as well as the time scale of the graph.
The time scale can be from the last 15 minutes to the last 30 days. Note
that the graph is drawn from the log, so a sensor’s readings have to be in
the log in order to be graphed. If logging has been turned off for a
particular sensor, then data from that sensor cannot be shown in the graph.
On the other hand, turning the graphing off for a particular sensor does not
affect the data in the log. Data will continue to be accumulated (as long
as logging for that sensor is turned on, of course!), and will remain in the
log until it is either pushed out by new data or “Reset Logs” is selected,
regardless of whether you choose to view it on the log or not.
61
Display Options
This page controls how the other pages look. Various date formats
can be selected, and temperatures displayed in Fahrenheit or Celsius. The
default language can be set as well.
There are several different page layouts available. The one shown
here is “Contemporary”, but the user can also select a “Classic” design that
looks like the pages from the WeatherGoose-I family – a feature that users
of our older products may appreciate! – or a minimal-graphics design that
will download faster, and use less bandwidth, for users with slow or
data-limited connections.
This page allows the user to set “friendly names” for the Goose and
for each sensor, i.e. names that help identify each sensor as something
more descriptive than just “Temperature” or “Light Level”.
62
Config Page
The Config Page breaks up into five
subpages. Each of these pages covers a different part of the WeatherGoose-II configuration. It is recommended that a userid and
password for the administrator account be set.
That way, only someone logged in as admin
can modify critical settings. As will be
shown later, there are potentially three levels
of access: Admin, Control, and View Only.
63
Configuring Network Parameters
The Goose’s network parameters can be set manually, or from a
DHCP server. In the example below the addresses are set manually. At a
minimum the IP address, Subnet Mask and Gateway address must be
specified. At least one DNS server must be specified so that the user can
enter URLs instead of IP addresses for external machines.
The user has the option to allow connections to the Goose using the
standard HTML access, secure HTTPS access, or both. The unit defaults
to the standard ports of 80 and 443 for HTTP and HTTPS, respectively,
but these can be changed if your intended application requires non-standard port assignments. The Telnet service, which provides access to a
powerful command line interface to configure a variety of options on the
device, can also be enabled or disabled from here.
Note that the “Save Changes” button must be clicked, or any changes
will not take effect.
64
Monitoring Configuration
As described previously, the Goose can send an email to up to five
email addresses when an alarm is tripped. The user has to designate a mail
server and set the Goose up to talk to it. Each address can be set to receive
emails only during business hours, after hours, or always. The days of the
week and the hours included in “business hours” can be defined as well.
System status reports can be emailed to each address at specified
intervals or at a specified time on a specified day of the week. Three
different time schedules can be set up. Each report can go to any or all of
the five email addresses.
65
Further down the Monitoring sub-page, the Goose may be set to send
a status email to any or all of the specified email addresses. A message
can be sent from every hour up to every 4 hours, or on a specific day of
the week.
All the Geese include an SNMP (“Simple Network Management
Protocol”) agent. The WeatherGoose family supports SNMP v1, v2c, and
v3. v1 is the standard SNMP, v2c is an improved version, and SNMP v3
adds security features such as authentication and encryption. The trap
addresses here are the addresses that SNMP traps can be sent to when an
alarm trips.
66
The Geese can display images from Internet enabled cameras on the
“Sensors” or landing page. The Geese do not actually handle the image
data from the cameras; rather, they provide a link in the HTML code sent
to the user’s browser that causes the browser to download the images and
include them on the web page. This link includes the IP address of the
camera and the URL of the image itself. To use a camera that is not on our
drop-down list, the user must specify the URL that the camera uses for its
snapshot image in addition to the IP address of the camera.
NOTE: The Geese cannot connect to the type of webcam that connects to
a PC using a USB interface. The camera must have its own web server
built into it.
NOTE: The camera’s IP address has to be accessible from the user’s
computer, just as the Goose’s address does. If the camera has a local
address (such as 192.168.123.180) the images will only be visible on that
local network.
67
Next, the date and time can be set manually, or the address of at least
one NTP (“Network Time Protocol”) server entered to get the time and
date automatically. Note that if the unit’s clock is not set (either manually
or from NTP), no data will be logged, and “No data to graph” will be
displayed where graphs would normally appear. The Goose can be
configured to adjust automatically for daylight savings time if that is
desired. (The user must manually configure the appropriate start and stop
dates for DST for their local time zone.) If DST is Disabled then the
Goose will not adjust for it. Note that NTP servers return GMT – if NTP
is used the local offset from GMT must be entered. (Unless, of course, this
Goose is installed in the UK.)
The climate monitors have a built-in real-time clock with a “supercap”
backup, so the date and time are kept current for about two weeks if the
power fails.
68
The Firmware allows for three levels of access to the Goose: Administrator, Control, and View Only. The Administrator has full privileges to
change any parameter on the system. “Control” access permits the user to
change anything except the parameters on the Config page, and the “View
Only” account cannot change anything. ITWatchDogs recommends that
you set at least an Administrator password: otherwise some unauthorized
person could change something important, perhaps the network parameters. If those are changed the Goose can no longer be accessed over the
network. The only way to recover would be to push the reset button
described earlier, which of course requires physical access to the Goose.
69
The “Saved Configuration XML File” allows a user to download the
current configuration in XML (eXtensible Markup Language) format.
This is a way to backup the current configuration settings by clicking the
“Download Current XML File” button. The saved configuration can be
sent back to the Goose by clicking the “Upload Local XML File” button.
XML is a text-based format, so it is possible to edit the file before it is
uploaded. This should only be attempted by someone who is familiar with
XML, otherwise the upload may corrupt the Goose’s configuration.
The certificate and key file for the SSL (Secure Socket Layer) encryption must be set up to use the secure HTTPS communication method
instead of, or in addition to the standard HTTP.
70
The developers at ITWatchDogs are constantly improving the firmware. New releases, including bug fixes and new features, are periodically
posted to the web site (www.itwatchdogs.com). The “Upload System
Firmware” button is how a new release is uploaded to a Goose. The
WeatherGoose-II software includes this functionality that uploads new
Firmware from the desktop to the Goose using the browser. Unlike our
older series-I devices, there is no need to connect the Goose directly to a
desktop PC and run a special update-installation program to upload new
firmware into the Goose; everything can be done straight from the web
browser, as easily as uploading a photo to your favorite blog or picturehosting web site.
ITWatchDogs has developed and patented a method to insure that the
entire file is uploaded correctly and completely before control is switched
to the new software. That way, if the upload is interrupted in some way,
or the file is garbled, the Goose will continue to run the existing software
instead of crashing or locking up from trying to execute invalid or corrupted code.
71
Chapter 7
WatchDog Console
72
WatchDog Console
Some of ITWatchDogs’ customers have just one or a few of our
climate monitors. They can control their units by connecting to them one
at a time. But many of our customers are responsible for monitoring tens
or hundreds of units - it is not feasible for them to connect to each unit
individually.
ITWatchDogs’ “WatchDog Console” software provides a way to
monitor multiple climate monitors using a single web interface. At this
writing, up to 200 climate monitors can be controlled from a single web
interface. WatchDog Console runs as a service under Windows Server
2003 and 2008, and Windows XP, Windows Vista and Windows 7. The
WatchDog Console server can be accessed from a standard web browser.
WatchDog Console polls the units and collects sensor measurements
from each one. The user can see an overview of conditions everywhere in
the network. Similar sensors from multiple units can be presented on the
same graph. The same alarm can be set on multiple units at one time.
Firmware updates can be loaded to several units at one time. Thumbnail
images from cameras connected to different units can be viewed on the
same page.
The data is stored in an SQL database. It can be retrieved for offline
analysis by any SQL-compatible tools.
73
Console Home Page
Below is an example Home Page from the WatchDog Console utility.
In this case the program is monitoring five different climate monitors.
Each one is shown with an image from an associated webcam along with
the sensors readings from that unit. The user can elect to show all the
sensor readings, or only those that have tripped alarms. The camera
images can be shown or omitted.
74
The monitors are grouped into three groups: monitors that have alarms
that have tripped, monitors that have no alarms tripped, and monitors that
could not be contacted during the last refresh cycle. The top two on the
previous page have alarms that are currently tripped. None of the alarms
on the bottom three units are tripped. If WatchDog Console failed to
contact a climate monitor during the last refresh, that unit would be listed
as being in an “error” status. This could be due to a network problem or
some problem with the monitor itself.
Each climate monitor is labeled with its “Friendly” name
(“SuperGoose II Demo Unit”, “ITWATCHDOGS” etc) as well as its model
(“Owl-MicroGoose”, “Owl-SuperGoose-II” etc). The labels are hyperlinks to the actual climate monitors, if you click on one you are taken to
that unit’s landing page.
The sensor readings from each device are shown with it. All the
sensors from each device including external sensors are shown. The
sensors are listed by the friendly names that were assigned to them when
the climate monitors were configured. The sensors that have tripped an
alarm are highlighted.
75
Status Page
A “Status” page shows real time data for a given sensor measurement.
This way the user can look at all the temperature sensors, or all the airflow
sensors, voltage, current, light level etc. Any measurement can be selected
from a drop-down list at the top of the page. The list of possible measurements is determined automatically based on what units WatchDog Console knows about. An icon representing the sensor’s host device is shown
along with user-defined “friendly” name that was given to the device that
the sensor is attached to. Clicking on a device name will take the user to
that device’s home page.
The sensors are color coded to highlight alarm conditions. Sensors
that are unplugged are shown as “unavailable”.
The list can be sorted by sensor name or value by clicking on the
corresponding header. Clicking twice on the same header changes the
ordering from ascending to descending, or vice versa.
76
Graph Page
The “Graph” page displays a historical view of all the sensor data. The
user can select any measurement from the drop-down at the top of the
page. The log period can be set from 2, 4 or 8 hours or 2, 7, 14 or 28 days.
Note that you can only select as many hours or days as there are logged
data points in the current database. A list of all the connected climate
monitors is shown below the graph. The user can select which ones are
graphed at one time. A maximum of 20 servers can be graphed at one
time.
77
Servers Page
A climate monitor must be entered on the “Servers” page for WatchDog Console to monitor it. To add a server the user provides its name or
IP address, a connection type, and the necessary passwords to access the
unit. If the read-only password is supplied, WatchDog Console will be
able to show a limited amount of information. The control account allows
alarms to be set, and the admin password allows full control of the unit.
A climate monitor does not have to be up to be added to this list, but its
status will be shown as “Error” until WatchDog Console is able to contact
it.
The URL, firmware version and last contacted time are shown for
each server. If an error was encountered the last time WatchDog Console
tried to contact a monitor, the status field will display an appropriate error
message.
78
More detail on a given climate monitor can be shown by pushing the
“Details” button after its name on the Servers page. The top of the page
gives information about how WatchDog Console connects to it, including
the admin log-in and password that WatchDog Console is using to access
it. (If the server is in “error” status, it may be because this information is
wrong and the climate monitor is rejecting the log-in attempt).
The climate history information is shown lower on the page. It is
possible here to download all the logged data from the climate monitor in
comma separated value (“CSV”) format. Most popular spreadsheet tools
can read this format, so they can be used to further analyze the data.
It is also possible to review the data in WatchDog Console’s SQL
database from this page. The first and last timestamps are listed. By
default the data with the latest timestamp is shown (including the camera
images). Data and images from any date time in the database can be
accessed by entering the desired date and time in the “Show Different
Time” field.
79
The sensor values and camera images from the selected date and time
are shown at the bottom of the page. Again, the default is to show the
record with the latest timestamp, but any record in the database can be
accessed by entering the desired date and time. (If there is no record from
that exact time, the closest time will be shown)
80
Logs Page
The “Logs” page allows the user to download all the available logs in
a consolidated format.
WatchDog Console currently provides two data logs for downloading.
One is a log of all sensor data for all servers currently in the database. The
second is the event log, which contains information and errors pertaining
to various WatchDog Console functions such as the web server, server
refreshes, firmware updates and alarm updates.
81
Firmware Page
The “Firmware” page allows simultaneous updating of the climate
monitors’ firmware. The page lists all the units that WatchDog console is
monitoring. The current status column lists the firmware release that each
unit is currently running. The drop-down menus on the right list all the
available firmware versions that are applicable to this server. The user
selects what version is to be downloaded to each server. Once the
“Update” button is pushed WatchDog Console will queue the update
requests, and push updated firmware to up to four units at a time. If a
particular unit is already running the selected firmware version, nothing
will be done; i.e., Console will not attempt to update the firmware with a
version that’s already installed.
The last entry in the table is “All Available Servers”. If a version
number is selected in this entry, then that version will be uploaded to all
the servers that are in a “Ready” status.
If an attempted update fails, an error message will be displayed and
WatchDog Console will retry it after ten or fifteen minutes. Remember
that as of our series-II product line, ITWatchDogs’ Climate Monitors have
a “fail safe” update process, so if an attempted update is interrupted or fails
for any reason, the Climate Monitor will continue to run using its current
firmware.
82
Alarms Page
The “Alarms” page allows the user to set an alarm configuration for
sensors of the same measurement across multiple climate monitors. Any
type of sensor that is connected to the units can be selected, and only
internal sensors, only external sensors, or all sensors of that type can be
displayed. Any alarm can be added or modified from this page. The user
can select which email addresses should be notified, which SNMP traps
should be sent, and how long the alarm should remain tripped and if it
should be repeated or not. Selected alarms can be disabled also.
83
Configuration Page
The Configuration page allows the user to change many default
settings. By default, WatchDog Console listens for HTTP connections on
port 8090, and for HTTPS on port 443, but both of those can be changed
if desired. “Only HTTP”, “only HTTPS”, or both connection types can be
allowed.
The number of concurrent users can be limited ( from 1 to 16 in
WatchDog Console 3.1.3). A connection timeout can be set. Administrator, control and view only passwords can be set. A limit on the amount of
time a user can be idle before he is automatically logged out can be set.
Offset from GMT, default temperature units (°F or °C), and the number of
concurrent firmware update sessions can be set.
The directory in which data is stored can be set or changed, as well as
the log archive directory. The program can be tuned to trade memory
usage for performance in case the server it is running on has a limited
memory. The user can also enter usernames and passwords for the
cameras that are being used if that is necessary.
Summary
WatchDog Console provides an easy to use way to monitor and
control a large number of ITWatchDogs’ Climate Monitors. From it an
operator can be alerted when an alarm is raised by any Monitor and he can
easily zero in the problem. It allows alarms to be set on multiple units at
the same time, and it provides a way to update the firmware on multiple
units as well.
84
Chapter 8
Wrap Up
85
ITWatchDogs’ climate monitors protect against all sorts of hazards
that might be encountered in a server room. These include:
Ÿ Excessive heat
Ÿ Too high or too low humidity
Ÿ Airflow Problems
Ÿ Lights on when they shouldn’t be, or off when they should be on
Ÿ Noise levels too high or too low
Ÿ Power failures or brownouts
Ÿ Low battery voltages
Ÿ –48 VDC supply malfunctions
Ÿ Equipment drawing too much or too little current
Ÿ Doors open when they shouldn’t be
Ÿ Water where it shouldn’t be
The climate monitors allow a manager to detect dangerous conditions
and to be notified if they occur. The climate monitors display their sensor
readings on web pages that can be accessed from anywhere on the Internet
with an ordinary browser. They can send email alerts if readings go out
of bounds, and they can also send SNMP traps to an SNMP Manager
Application. The climate monitors include SNMP “agent” functionality
so that the data-center manager can integrate them into his existing management process.
86
Monitoring Temperature
Heat is a crucial issue in data centers and many other places. Most
members of the Goose family have internal temperature sensors that are
accurate to within +/- 0.5°C. Most family members also have digital bus
interfaces that allow up to sixteen external temperature sensors.
The internal sensor measures the temperature near the climate monitor. That’s useful if the monitor is mounted in a rack with other servers,
or installed in some other enclosure where the temperature needs to be
monitored.
The external sensors allow a lot of flexibility
in monitoring a room. One can be placed on top
of a rack to measure the exhaust air temperature.
A sensor can be mounted in each of multiple racks
to make sure all of them are cooling properly.
Sensors can be put in different places around the
room to find temperature variations and “hot
spots” which need more cooling, or “cold spots”
where cooling is being wasted. Another use is to
put one sensor on the A/C return vent and another on the outlet. The
difference between the two temperatures can provide a warning that a
filter is clogged or that the A/C has a coolant leak.
ITWatchDogs’ climate monitors log the readings from each temperature sensor so long term records can be kept and analyzed. They also can
display the readings on graphs so developing trends can be spotted.
ITWatchDogs’ monitors were originally designed for datacenters and
server rooms, but our customers have found other uses for them as well.
Several laboratories have used them to measure and log temperatures in
experiments, and to warn the researchers if a temperature exceeds some
limit. Some school lunchrooms uses them to log temperatures in a food
storage cooler so the they can prove that the food has always been kept at
the proper temperature.
The climate monitors have a way to set up an escalation procedure:
one alarm can be set to trip on a given temperature and notify the first line
support person. A second alarm can be set on the same sensor to trip at a
higher temperature, and then notify a higher level support person(s). Up
to five email addresses and two SNMP manager applications can be
notified by a given alarm. Multiple alarms can be set on any sensor – the
87
only limit is that the total number of alarms set on all sensors cannot be
more than 200.
Monitoring R/H and Dew Point
Many of ITWatchDogs’ climate monitors have internal relative
humidity/dew point sensors, and we also offer an external “combo” sensor
wand which measures temperature, relative humidity, airflow, and
(calculated) dewpoint all in one device. Relative humidity is displayed as
a number from 0 to 100%.
Monitoring humidity is important for two reasons. Excessively high humidity, especially if accompanied by a drop in temperature, can cause
water to condense inside electronic equipment and
cause electrical shorts. On the other hand, if the
humidity is too low, static-electricity charges can
quickly build up on moving surfaces (or personnel!), causing high-voltage discharges which can disrupt or damage sensitive electronic equipment.
In either case, it is important that humidity be monitored and that
someone notified when it is either too high or too low.
Dew point is related to relative humidity: Given the current relative
humidity, the dew point is the temperature at which condensation will
begin. If the relative humidity is high, the dew point is close to the current
temperature. If the relative humidity is low, the dew point is much lower
than the current temperature.
ITWatchDogs’ monitors measure humidity and dew point, display
their current values on a web page, and log and graph previous values.
Alarms can be set to trip when either value exceeds thresholds that the user
sets, and these alarms behave the same way alarms on any other sensor
does.
Monitoring Airflow
Some of the climate monitors also have internal airflow sensors, and
an external temperature/humidity/dew point/airflow sensor is available.
Measuring airflow helps detect fans that are failing, or have failed.
Multiple external airflow sensors will illustrate how the A/C vents are
88
distributing air across the room, and help you put the most air in the hottest
spot.
Note: the airflow sensors sold by ITWatchDogs for use with our
monitoring systems are not calibrated in CFM (cubic feet per minute) or
any similar standard units; instead, the sensors simply report a number
from 20 to 99, where 20 means very still air and 99 means very fast
moving air. (A “true” CFM measurement is difficult to achieve without
resorting to a mechanical measuring device – which would not only
increase the cost and complexity of the sensor, but would add its own
periodic-maintenance and long-term reliability issues to those of the fans
you’re trying to monitor!) Alarms can be set on the airflow sensors in the
same way as for any other sensor attached to a climate monitor.
Monitoring Voltages
ITWatchDogs offers two voltage
monitors, the City Power Monitor and the
-48 VDC Monitor. The City Power Monitor is intended to monitor the voltage
provided by the local power company. It monitors 100- to 240-volt AC
power lines and provides a warning if the power fails. It is often used in
situations where the gear is behind a UPS, but someone needs to be
notified when a power failure leaves the UPS running on battery power.
The power must be restored or the servers must shut down gracefully
before the UPS batteries are drained.
The City Power Monitor is an analog sensor, which means it must be
connected to one of the analog inputs on a climate monitor. If it is used
with a monitor such as the MiniGoose which does not have analog inputs,
or all the analog inputs are being used for other sensors, the City Power
Monitor can be connected to a “CCAT” device, which converts the analog
signal and can be plugged into a digital port.
The City Power Monitor output is one of two states, which correspond
to “off” and on”. If power fails and then is restored, the monitor output
will stay in the “off” state for 30 seconds. This is to make sure than even
a momentary failure is logged.
The -48 VDC monitor is intended to monitor 48-volt positive ground
power systems typically found in telecom installations. It also connects to
an analog port on the climate monitor or an appropriate CCAT device.
From the voltage level displayed by the monitor the user can tell if a
battery bank is discharged, charging, or overcharged.
89
Monitoring Current
Monitoring electrical current in a data center can be useful in at least two ways: making
sure that a power line is not overloaded and the
circuit breaker is not about to trip, and noticing
that some device has failed and stopped drawing
power. ITWatchDogs provides a clamp-on current transformer that measures AC current when
connected to an analog input or the appropriate
CCAT. It can be set to measure 30, 60 or 120amp circuits.
Alarms can be set in the usual way on the current reading. The
transformer works only on AC circuits, it will not work on DC. It must be
clamped around just one of the conductors. If it is clamped around both
conductors the magnetic fields will cancel each other out.
Monitoring Power
ITWatchDogs’ PowerGoose II adds the ability to measure the power
being drawn from a 10-outlet power strip on the back of its chassis. The
unit reports the same environmental measurements as the WeatherGoose
II, but also reports the voltage and peak voltage, current and peak current,
the real and apparent power, and power factor from the power strip.
Monitoring Light and Sound Levels
Several members of the climate monitor family have internal light and
sound sensors. These sensors measure the level of the light or sound, in
terms of “light” or “dark” and “quiet” or “loud”. Alarms can be set on the
levels in the usual way.
One of ITWatchDogs’ customers detected an intruder in their server
room when he turned on the lights in the middle of the night. Another
customer uses the light level sensor to log light and dark periods in a
biology experiment.
90
Smoke Alarm, Door Sensor and Water
Alarms
ITWatchDogs offers a smoke alarm that can be connected to an analog
input on the climate monitors, or thought a CCAT to a digital port. Several
alarms can be distributed in a room and daisy chained together, so an
alarm will be raised if any one trips.
A door contact sensor is also available. It can be wired to alarm if a
door is open when it shouldn’t be, or closed when it should be open.
Water is a huge problem in a computer room or anywhere else where
a lot of electronic equipment is located. Most commercial building are
required to have sprinkler systems, and a bad sprinkler head can put a lot
of water in a room in a hurry. The drip pan that collects condensed water
from an air conditioner can cause a serious problem too. If the drain gets
clogged up, the pan can fill up and start leaking. These pans are often
found in the ceiling of a room, where a leak can do more damage. This
can actually be a bigger problem that a sprinkler failure, because it
happens quietly and it might be a long time before someone discovers it.
ITWatchDogs offers two water sensors. One is a point sensor that sits
on the floor and trips a Goose alarm if it gets wet. The “water snake” is a
more sophisticated device that detects water anywhere along the length of
a detector cable (hence “snake”) that can be up to 300 feet long. Water
snakes are typically run around the room behind the racks to detect water
before it is visible. Both the point sensor and the water snake attach to
analog sensor inputs or to the appropriate CCAT.
91
Output Relays
In some situations it is useful for a climate monitor to do more than
display an alarm on a web page or send an email alert. Some fire or
burglar alarm systems can be triggered by an external contact closure.
Indicator lamps or strobes that are triggered by an alarm can help a data
center manager quickly identify which rack contains the bad unit.
The RelayGoose II includes three relays that can be energized when
alarms are tripped. The relays have “Form C” contacts, which means the
common, normally open and normally closed contacts are all brought to
the front panel. That allows the switch to open when the relay is energized, or to close when it is energized, whichever makes sense for the
application.
Conclusion
ITWatchDogs’ Climate Monitor family provides cost effective ways
for a data center manager or a system administrator to make sure all is well
in the equipment room. Various members of the family have different
characteristics so that the purchaser can find one that precisely meets his
or her needs.
92