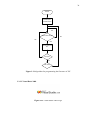
1
UNIVERSITI TEKNOLOGI MALAYSIA
PSZ 19:16 (Pind. 1/07)
DECLARATION OF THESIS / UNDERGRADUATE PROJECT PAPER AND COPYRIGHT
Author’s full name :
LIM ZI JIE
________________________________________________
Date of birth
:
26.01.1987
________________________________________________
Title
:
POWER MEASUREMENT AND PROFILE
________________________________________________
USING PC
________________________________________________
2010/2011
Academic Session: ________________________________________________
I declare that this thesis is classified as :
CONFIDENTIAL
(Contains confidential information under the Official Secret
Act 1972)*
RESTRICTED
(Contains restricted information as specified by the
organisation where research was done)*
OPEN ACCESS
I agree that my thesis to be published as online open
access (full text)
I acknowledged that Universiti Teknologi Malaysia reserves the right as follows :
1. The thesis is the property of Universiti Teknologi Malaysia.
2. The Library of Universiti Teknologi Malaysia has the right to make copies for the
purpose of research only.
3. The Library has the right to make copies of the thesis for academic exchange.
Certified by :
_______________________________
SIGNATURE
_______________________________
SIGNATURE OF SUPERVISOR
870126-08-5783
____________________________
EN.
ALIAS BIN MOHD. YUSOF
____________________________
(NEW IC NO. /PASSPORT NO.)
Date :
NOTES :
*
15 MAY 2011
NAME OF SUPERVISOR
Date :
15 MAY 2011
If the thesis is CONFIDENTAL or RESTRICTED, please attach with the letter from
the organization with period and reasons for confidentiality or restriction.
“I hereby declare that I have read this thesis and in my opinion this thesis
is sufficient in terms of scope and quality for the award of the
Degree of Bachelor of Engineering (Electrical).”
Signature: ………………………………………………
Name of Supervisor: En. Alias Bin Mohd. Yusof
Date : 15 MAY 2011
POWER MEASUREMENT AND PROFILE
USING PC
LIM ZI JIE
This thesis is submitted in partial fulfillment
of the requirements for the awarding of Degree in
Bachelor of Electrical Engineering
Faculty of Electrical Engineering
Universiti Teknologi Malaysia
MAY 2011
ii
“It is hereby declared that all the materials in this thesis are the effort of my own
work and idea except for works that have been cited clearly in the references. The
thesis has not been accepted for any degree and is not concurrently submitted in
candidature of any degree.”
Signature
: ……………………
Name of Author
: LIM ZI JIE
Date
: 15 MAY 2011
iii
Dedicated, in huge gratitude to my beloved father, mother, sisters and lover for their
care, understanding and encouragement
iv
ACKNOWLEDGEMENT
In this section of the thesis, I would like to express my most sincere gratitude
to my supervisor, Mr. Alias bin Mohd. Yusof for his continuous guidance. Due to his
constructive ideas and unrelentless support, I had been able to complete this project
with certain degree of quality. Without his support, I would not finish it on time.
Besides that, I would also like to say thanks to the Power Electronics
Laboratory and Advance Power Laboratory for allowing me to use their equipments
in the process of completing this project.
I am also grateful to have the support from my family and friends. Their
encouragement and constructive comments had always gives me strength to continue
to improve the system of my project and fix the weaknesses of the system by all
means.
My deepest appreciation goes to Miss Bong Mei Fern for her help in certain
part of the system development. She always supports me and stand by my side when
I faced fatal problem in the middle of the development. Without her help, I would not
gone this far.
Lastly, I felt grateful to have you all with me, thanks again for all the help
and support that I needed.
v
ABSTRACT
Power measurement is no longer an unfamiliar phrase among people and
industries. No matter they are researchers, electric companies, factories or common
people, they are doing power measurement at all time. Researchers need to do some
analysis on the field of electrical power, electrical companies need to optimize their
generators and calculate the tariff, factories need to monitor their power usage and
power factor and common people need power measurement to know how many
power that had been used throughout the year. This project aims to create a device to
measure the power of equipment and to monitor the power profile for a long time.
This power measurement device created is based on the data acquisition concept
using PIC microcontroller and USB interface. Software is developed to control the
device and to show the result is created using Visual Basic Language. The system
had been run and tested part by part before the whole system is being combined and
implemented. A benchmark is also done using the commercial power meter to
measure the actual power of the equipment used in the tests and then compare with
the result obtained from the system developed. The result shows that there is some
error due to the system speed is not fast enough to cater the requirement to produce
an accurate result.
vi
ABSTRAK
Pengukuran kuasa bukanlah suatu ungkapan yang baru kepada manusia dan
industri. Tak kira mereka adalah ahli kajian, kompani elektrik, kilang-kilang
mahupun rakyat biasa, mereka turut membuat pengukuran kuasa pada setiap masa.
Ahli kajian perlu membuat analisis dalam bidang electrik, kompani elektrik perlu
mempertingkatkan keupayaan penjana dan membuat pengiraan tariff, kilang-kilang
perlu memantau kegunaan kuasa dan faktor kuasa dan rakyat biasa perlu mengetahui
berapa kuasa yang telah digunakan dalam masa setahun. Projek ini bertujuan untuk
menghasilkan suatu alat untuk mengukur kuasa sesuatu alatan dan memantau profil
kuasa untuk jangka masa yang panjang. Alat pengukuran kuasa ini dicipta
berdasarkan konsep pengambilalihan data menggunakan PIC dan USB. Perisian
dihasilkan untuk mengawal alatan dan memaparkan keputusan dengan
menggunakan bahasa Visual Basic. Sistem ini telah dioperasikan dan diuji bahagian
demi bahagian sebelum seluruh sistem ini digabungkan. Suatu pembandingan juga
dijalankan dengan menggunakan meter kuasa yang ada dalam pasaran untuk
mengukur kuasa sebenar alatan yang diuji. Keputusan yang didapati terdapat sedikit
kekurangan disebabkan kelajuan sistem adalah terhad.
vii
TABLE OF CONTENTS
CHAPTER
TITLE
PAGE
THESIS STATUS CONFIRMATION FORM
SUPERVISOR CONFIRMATION
1
TITLE COVER
i
DECLARATION
ii
DEDICATION
iii
ACKNOWLEDGEMENT
iv
ABSTRACT
v
ABSTRAK
vi
TABLE OF CONTENTS
vii
LIST OF TABLES
x
LIST OF FIGURES
xi
LIST OF SYMBOLS
xiii
LIST OF ABBREVATION
xiv
LIST OF APPENDICES
xv
INTRODUCTION
1
1.1
Background
1
1.2
Problem Statement
2
1.3
Objectives
3
1.4
Scope
3
1.5
Methodology and Approach
4
1.6
Gantt Chart of FYP-1
5
1.7
Gantt Chart of FYP-2
6
viii
2
LITERATURE REVIEW
8
2.1
Introduction
8
2.2
Power Measurement Theory
8
2.3
Conventional Power Measurement Equipment
10
2.3.1 D‟Arsonval Galvanometer
10
2.3.2
11
2.4
3
Electrodynamic Meter
2.3.3 Electrodynamometer
11
2.3.4 Electronic Wattmeter
12
Reviews from Journals
13
2.4.1 Data Acquisition System
13
METHODOLOGY
17
3.1
Introduction
17
3.2
Hardware Design
18
3.2.1 Voltage Transducer
19
3.2.2 Current Transducer
20
3.2.3 Bridge Rectifier
22
3.2.4 Power Cord and Socket
23
Interface Design
24
3.3.1 Hardware Part
24
3.3
3.3.1.1 Peripheral Interface Controller (PIC) 24
Microcontroller
3.3.1.2 Analog to Digital Converter (ADC) 28
in PIC18F4550
3.3.1.3 SK40C Development Board
30
3.3.1.4 Ports
31
3.3.2 Software Part
34
3.3.2.1 Personal Computer
34
3.3.2.2 MPLAB IDE and PICkit2
34
3.3.2.3 Visual Basic 2008
36
ix
4
RESULT AND DISCUSSION
41
4.1
Introduction
41
4.2
Output from Transducers
41
4.2.1 Procedures
42
4.2.2 Result
43
Output from Transducer through Bridge Rectifier
43
4.3.1 Procedures
44
4.3.2 Result
44
Output of the Whole Circuit System
45
4.4.1 Procedures
46
4.4.2 Result
47
4.5
Result from Power Meter
51
4.6
Discussion
52
4.3
4.4
5
CONCLUSION AND RECOMMENDATIONS
56
5.1
Conclusion
56
5.2
Recommendations
57
REFERENCES
59
APPENDICES A-F
61-114
x
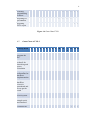
LIST OF TABLES
TABLE NO
TITLE
PAGE
3.1
Pins used in project
28
3.2
USB Standard Pinout
33
3.3
USB Mini/Micro Pinouts
34
3.4
The description of the software interface
39
4.1
Result of first test
43
4.2
Result of second test
45
4.3
Result of system test
50
4.4
Result of power meter
52
xi
LIST OF FIGURES
FIGURE NO.
TITLE
PAGE
1.1
Hardware Part (Interface)
4
1.2
Software Part (Interface)
4
1.3
Hardware Design
5
1.4
Gantt Chart FYP 1
5-6
1.5
Gantt Chart FYP 2
6-7
2.1
D'Arsonval meter at the University of Toronto
10
2.2
One of the latest wattmeter available
12
3.1
Block diagram of the whole circuit system
18
3.2
Schematic of the hardware design
18
3.3
Voltage Transducer LV 25-P
19
3.4
Connection of LV 25-P
19
3.5
Current Transducer LA 25-NP
20
3.6
Connection of LA 25-NP
21
3.7
Bridge rectifier
22
3.8
Power cord and socket
23
3.9
Schematic of the interface design
24
3.10
PIC Microcontroller
24
3.11
Microprocessor
25
3.12
PIC18F4550
26
3.13
Pinouts of PIC18F4550
27
3.14
Part of the firmware
29
3.15
SK40C development board
30
3.16
Schematic of the connection of SK40C board
30
3.17
Parallel port
31
3.18
Serial port
31
3.19
USB port
31
xii
3.20
Types of USB port
33
3.21
Algorithm for programming the firmware of PIC
36
3.22
Visual Studio 2008 Logo
36
3.23
The interface of the software
38
3.24
Algorithm of software
40
4.1
Output from oscilloscope 1 (electric kettle)
42
4.2
Output from oscilloscope 1 (electric toaster)
43
4.3
Output from oscilloscope 2 (electric kettle)
44
4.4
Output from oscilloscope 2 (electric toaster)
45
4.5
The whole system
46
4.6
The result from the software (electric kettle)
47
4.7
The result from the software (electric toaster)
48
4.8
Voltage profile (electric kettle)
48
4.9
Current profile (electric kettle)
49
4.10
Power profile (electric kettle)
49
4.11
Voltage profile (electric toaster)
49
4.12
Voltage profile (electric toaster)
50
4.13
Power profile (electric toaster)
50
4.14
Connection of power meter
51
4.15
Power meter (kettle)
51
4.16
Power meter (toaster)
52
4.17
Calculation of power factor
54
xiii
LIST OF SYMBOLS
P
-
Power
PF
-
Power Factor
V
-
Volt
W
-
Watt
A
-
Ampere
Hz
-
Hertz
-
rate of change of power
-
rate of change of charge
C
-
Coulomb
J
-
Joule
-
Current
-
rate of change of time
-
maximum voltage
-
maximum current
xiv
LIST OF ABBREVIATIONS
PIC
-
Peripheral Interface Controller
USB
-
Universal Serial Bus
AC
-
Alternate current
DC
-
Direct current
ADC
-
Analog to digital converter
RAM
-
Random Access Memory
ROM
-
Read Only Memory
I/O ports
-
Input/ output ports
EEPROM
-
Electrical Erasable Programmable Read Only Memory
RS-232
-
Recommended Standard 232
IEEE
-
Institute of Electrical and Electronics Engineers
GUI
-
Graphical User Interface
IDE
-
Integrated Development Environment
HID
-
Human Interface Device
PID
-
Product ID
VID
-
Vendor ID
RMS
-
Root mean square
xv
LIST OF APPENDICES
APPENDIX
TITLE
PAGE
A
PIC18F4550 Datasheet
61-69
B
LV 25-P Voltage Transducer Datasheet
70-72
C
LA 25-NP Current Transducer Datasheet
73-74
D
SK40C Development Board User Manual
75-77
E
Firmware of PIC18F4550
78-91
F
Coding of Software Interface
92-114
CHAPTER 1
INTRODUCTION
1.1
Background
Power measurement is important from research area to domestic houses. It is
used in all kinds of field especially in the electrical engineering. Power measurement
is useful in measuring the power consumption of a house or factory, thereby knowing
its rate of power consumption each day or monthly and hence be able to make plans
to conserve electric usage or to know the power used by each machine. As for the
electrical supplier, the generation sector need to know the power produced by their
generators while for transmission and distribution sector, they need to know how
much electrical power is needed to install suitable transformer to give constant and
uninterrupted electricity.
Until today, many kinds of power measuring method and equipment had been
invented. From the conventional analog wattmeter using D‟arsonval meter and
electrodynamometer to advanced digital wattmeter, power measurement technique is
improving day by day. The improvement of the power measurement is scaled by the
increasing ability of giving accurate result in a short time. Availability and handling
difficulties also give impacts to the quality of the power measuring device. As the
technology in science and industry is flourishing, more advance and fast power
measurement equipment is needed in the industry and research area. In many kinds
of applications, data need to be collected and stored for further uses such as research
and analysis. Common method of storing data is not efficient and involved a lot of
handwriting which waste a lot of time and resources.
2
1.2
Problem Statement
Although there was a lot of advanced power measurement equipment
available in the market, however, the trade-off of these sensitive and powerful tools
is the cost. To build sensitive and powerful equipment, it needs better components
and they are more expensive, hence increasing the total cost of power measuring.
Besides that, some of the equipment needs a complicated connection or a lot
wires and cable connect to the load in order to measure the power and shows the
results. A more complex procedure and careful steps as well as tests and precaution
need to be made to ensure that the system is well designed. This had brought
inconvenience to the user in his/her power measuring process.
In most of the time, we need not only to acquire the values for the power
measured but also to store the result and data from time to time. Data storing is very
important for further references and analysis for further usage. Conventional method
requires us to copy data one by one using handwriting and this process are slow and
not efficient. Besides, it also limits us in terms of the interval that we can acquire
data, which means that we are unable to store the data fast enough and affect our
work. In any way, data storing using conventional methods are troublesome and
sometimes frustrating.
Other than that, for constant reading and to check the condition of a load, the
profile of the load needs to be monitored in a clear diagram and must be able to do it
in short time. Except some sophisticated machines, there are rarely cheaper and
reliable equipment for doing so.
3
1.3
Objectives
The main objective of this project is to design and create a device to measure
the power through a load by using personal computer (PC) as measurement tool and
to monitor the power profile. The objectives of the project also includes measuring
the rms voltage, rms current, power factor and average power of the electrical
appliances, to create a software used to calculate and show results of the measured
parameters, to use PIC and USB port as the interfacing devices as well as to plot the
voltage, current and power profile of the load. Computer is a very powerful
calculator and is able to receive data and the process it in lightning speed. By using
computer, data can also be easily stored without much effort. These data can be
called at anytime and the result can be monitor with just a few clicks on the keyboard.
An accurate graph can be plot instantly and show on the screen with ease.
1.4
Scope
The scope of the project includes:
•
Write a program using programming language Visual Basic to calculate and
show data such as voltage, current, power factor and power through load and
its power profile
•
Design a circuit to convert the single phase analog voltage and current to
digital signal using PIC and transducers
•
Create a circuit to allow load or equipments to connect to the circuit system
to be measured
•
Implement the designed circuit system into hardware and interfacing the
hardware to computer using USB ports
•
The system is for domestic uses which the voltage rating is 230V and
5A<I<30A
4
1.5
Methodology and Approach
The overview of the methodology and approach of the project is shown
below. Careful planning and steps had been suggested and information had been
gathered in producing the required steps to achieve the objective of the project. The
project is been divided into two parts which consist of Interface and Hardware design.
Interface Design can be further divided into Hardware Part and Software Part. Below
are the steps that must be taken to complete the project.
1. Choose title, identify
objective, scope, and
problem statement of the
project
2. Analyses the project and
search for the information and
materials needed
3. Learn and implement the
use of PIC to interface with the
PC through USB
4. Obtain results from testing
with batteries and LEDs as well
as switches
5. If the PIC works, proceed to
implement it in hardware part,
if the system does not work,
start from step 3 again
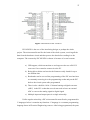
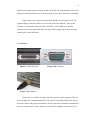
Figure 1.1 Hardware Part (Interface)
1. Design the interface
of the software
2. Write the software to
initiate the data
transfering from PIC to
USB
3. Write software to
calculate the parameters
that obtained from the
USB
4. Create database to
store data collected from
USB
5. Draw graph from the
data collected and verify
all the results, if not
satisfy, start from 2 again
Figure 1.2 Software Part (Interface)
5
•Design the circuit system in PCB
STEP 1
STEP 2
STEP 3
STEP 4
•Interfacing the hardware with personal computer
using ports
•Use the written program to collect and calculate
data and parameters needed
•Display the results in a user-friendly program
interface
•If the result shown does not satisfy the objectives,
redo the steps according to whichever part that is
defected
Figure 1.3 Hardware Design
1.6
Gantt Chart of FYP-1
Activity/Week
7
8
9
10
11
12
/
/
/
/
/
/
/
/
/
/
Analysis of
components
/
/
/
Analysis of
equipment
/
/
/
Decide title of
project
1
2
3
4
5
/
/
/
/
6
Define
objective
/
/
Define scope
/
/
Searching for
information
/
/
Drafting
methodology
13 14 15
/
/
6
Learning
programming
software
Preparing for
presentation
/
/
/
/
/
/
/
Preparing
FYP1 report
/
/
/
/
Figure 1.4 Gantt Chart FYP 1
1.7
Gantt Chart of FYP-2
Activity/Week
1
2
3
4
5
6
7
Learn and
program the
PIC
/
/
/
/
/
/
/
Develop
software for
interfacing and
power
calculation
/
/
/
/
/
/
/
Preparing
components for
hardware
implementation
/
/
/
Design the
hardware
circuit in
protoboard and
test to get the
result
/
/
/
/
/
/
/
Build the
circuit system
Obtain a few
sample result
and finalized
Complete the
8
9
10
11
1
2
13 14 15
/
/
/
/
/
/
/
/
/
/
/
/
/
/
/
/
/
/
/
/
/
/
/
7
FYP-2 report
and
presentation
slides
Figure 1.5 Gantt Chart FYP 2
CHAPTER 2
LITERATURE REVIEW
2.1
Introduction
This chapter discusses about the theory and concept of power measurement,
different power measurement equipment and techniques developed throughout the
history and core components of ADC. The work related to this project will also be
discuss in the further part of this chapter to give a brief idea how the whole system
will work and an early preview of the expected result.
2.2
Power Measurement Theory
To know how to measure the power, we must first know its parameter that
forms it. Voltage or potential difference is the energy required to move a unit charge
through an element measured in volts (V). By mathematically derivation,
, where Vab is the voltage between two points a and b, w is the
energy in joule (J) and q is the charge in coulombs (C). In this term, the voltage also
can be interpret as the work that is required to move a unit charge from point a to
point b in an electric circuit, given the potential at point b is lower than the potential
at point b.
Current is the rate of change of charge measured in amperes (A). The
relationship between charge q, current I, and time t can be express in mathematical
equation as follow:
9
, where I is the current in ampere, q is charge in coulomb and t is time
in second. Given 1 ampere is equal to 1 coulomb/second. There are two types of
currents, one is which the current remains constant at all time that we called direct
current (DC) and another one is called alternate current (AC) where its current
changes sinusoidally with time.
Power is the time rate of expending or absorbing energy, measured in watts
(W). The relationship of power with voltage and current is given by:
, where P is power in watt (W), w is energy in joule
and t is time in second. For direct current and voltage, the above expression for
power persists. However, nowadays, we use alternating supply in domestic as well as
most transmission and distribution sector. Therefore, in terms of AC power, the
instantaneous power at anytime varies and average power is used to measure the
power through a load. Average power can be express as the average of the
instantaneous power over one period of time. The mathematical expression of
average power,
of a cycle,
is the maximum voltage,
, where T is the period
is the maximum current and (
) is
the phase difference of voltage and current. The cosine of phase difference can also
be stated as the power factor of the system [1], [6].
10
2.3
Conventional Power Measurement Equipment
2.3.1
D’Arsonval Galvanometer
Figure 2.1 D'Arsonval meter at the University of Toronto
D‟Arsonval Galvanometer was invented by two Frenchmen in the early
1880s, who were Jacques D‟Arsonval (1851-1940) and Marcel Deprez (1843-1918).
Jacques was born in La Porcherie worked as a professor of experimental medicine as
well as the director of a biological physics laboratory. Marcel on the other hand was
born in Aillant-sur-Milleron and he was an electrical engineer. Both of them had
developed the galvanometer with permanent magnet and moving coils which is
suspended by flat ribbon of wires. At the lower end of the coil, the connection is
supplied by a light and helical spring. This spring is used to give the restoring torque
so that it will return to original position. From the Ohm‟s Law developed by Georg
Ohm which states that the voltage across a conductor is directly proportional to the
current through it, measurement of voltage and current can be made and hence power
can be obtained. To be able to do this, the electromagnetic torque produced by the
moving coils and magnet is proportional to the current in the coil and the restoring
torque is proportional to the angle of twist of the suspension fiber. At equilibrium
11
state, the current flowing through it is directly proportional to the angle of deflection.
Scales can then be made to acquire the voltage [2].
The form of D‟Arsonval galvanometer today is built with a coil of wire in
surrounding the permanent magnet. The magnet produces magnetic field and this
magnetic field will act against the magnetic field produced by the coil when current
flows through the coil. The coil will be twisted due to this action and will push
against the spring which is connected to the meter pointer. The pointer will points to
the value of the current or voltage measured [3].
2.3.2
Electrodynamic Meter
Electrodynamic meter consists of a pair of fixed coil known as current coil
and a movable coil which is the potential coil. The potential coil which connected in
parallel with the circuit carries a needle that moves over a scale to show the
measured value. The current coils that are connected in series with the circuit
generate electromagnetic field around the coil when current flows through it and the
strength of the magnetic field is proportional to the line current and in phase with it.
Because of such an arrangement, the deflection of the needle is proportional to the
both the current and voltage leading to the equation P=VI in a DC circuit. Whereas in
an AC circuit, the deflection of the needle is proportional to the average
instantaneous product of voltage and current, and hence the real power that we
needed is measured [4].
2.3.3
Electrodynamometer
Electrodynamometer was invented by Werner von Siemens (1816-1892) in
the early 1880s. Siemens was an electrical businessman as well as an inventor.
Siemens had used the principal that was published by Wilhelm Weber (1804-1891)
which states that when the same current passes through two concentric coils placed at
12
right angles to each other, the resulting torque depends on the square of the current in
his paper in 1848. In Siemens invention, there were stationary coils which made of a
few turns of heavy wires and a rotating coil which made of many turns of fine wires.
The stationary coil is connected in series with the circuit while the rotating coil is
connected across the load. A multiplier resistance is connected in series with the load
to allow measurement of voltage to be done. Therefore, the power on a load is
measured by taking the current passing through the coils times with the voltage drop
in the load [5].
2.3.4
Electronic Wattmeter
Figure 2.2 One of the latest wattmeter available
An electronic wattmeter is a small digital power measurement tool which is
capable of measuring power with ease and accurately as it display real digital values
[4].
13
2.4
Reviews from Journals
2.4.1
Data Acquisition System
In today, we are required to monitor a lot of system so that to know the
parameters, the effects of a change done to a system, to know the reliability and
constrain of a system, to do analysis of certain control system and much more. For
examples, a soft drink production factory need to control the rate of flow of the water
into the cans and a thermal power plant needs to control the heat of the boiler so that
the power plant can effectively generate the required amount of power. To be able to
do these, a data monitoring and acquisition system must be made to obtain the data
and to do analysis on the data logged somewhere, whether handwritten or directly
copied into computers or other equipment. Most of the data that we obtain directly
from the external world is in analog form. As digital system is rapidly developed,
many of these analog data have to be converted into digital form in various ways.
One of the easiest ways is to use an analog to digital converter.
However, this is still not enough. Most of the data acquisition system
contains its own unique circuit or machine, which every output must be shown in
within the interface of the machine only. Although in some machines, the data can be
exported through external disk, this process will take time and is not efficient as we
had to continuously copy data from the machine and read it in our own computers.
Otherwise, some devices provides direct linking through traditional port such as
parallel and serial port which is rarely available in a more portable computer, that is a
laptop. We do not want to carry our huge home desktop computer wherever we
wanted to work. Hence a more portable and flexible data acquisition system must be
produced. To make the operations autonomous and efficient, a microcontroller can
be used in the system. A microcontroller is flexible electrical equipment that
provides lots of function according to what we tell the microcontroller to do. It can
control from small electrical circuit to a robot or a large system depending on our
applications.
14
In the year 2004, M.Popa, an IEEE member, M. Marcu and A.S. Popa had
proposed a data acquisition system using microcontroller. Furthermore, the system
uses USB as the interfacing device. They selected the P89C51RD2 microcontroller
as the core of the system. The microcontroller will control the USB interface device
to receive and send data by using the interrupt from the microcontroller. The USB
interface, ISP1181 is using USB 1.1 specifications and is connected directly to the
microcontroller. Two TLC0820 ADCs are solely controlled by software created in
the computer. When signal is sent from the microcontroller to tell the USB interface
to initiate its operations, the USB interface will start receiving data from the data bus.
Before anything can be received, the ADCs must be activated first in the software.
Because the ADCs do not require control signals from the microcontroller, therefore
the speed of conversion is faster and will be able to directly send the converted signal
into the 16 bit data bus of the microcontroller and USB interface. Then the data will
be sent to the computer through the USB ports to show in the software [13].
Another suggestion from Yanpeng Wang and Mingming Fu about the data
acquisition system using microcontroller with USB interface device was made in the
year 2010 in WASE International Conference on Information Engineering. The main
idea was to create a portable data acquisition device by implementing USB ports. To
obtain high-speed data acquisition and to meet the real time requirements, the
conventional method of data transmission is too slow to realize the concept of the
project. The data transmission using parallel port is complicated and expensive. Even
by using RS232 serial port, the speed is relatively slow. With the emergence of USB
protocols, all these limits had been broke off.
The system developed by the two China people uses ADC0820, PDIUSBD12
USB interface and AT89S51 microcontroller as the main system components.
ADC0820 is an 8-bit analog to digital converter and it received the output signals
from the sensors. The ADC will then convert the signal into digital form with the
command from the host via microcontroller. Later, the microcontroller will activate
the conversion process of ADC and received the digital signal from the ADC. After
that, it will transmit the data through PDIUSBD12 to the computer. The software
15
created using LabVIEW software developed by National Instruments will act to store
and display the data collected. LabVIEW provide a graphical programming
environment mostly needed by the engineers and scientists who want to do
measurement, graphical plotting and analysis using the data from the external
devices. LabVIEW can also interact with other development software such as Matlab
and C Languages. The advantages of this method used are the GUI of the interface
and data presentation is good and the information can be stored for further analysis
[14].
Almost similar data acquisition system based on USB also been developed by
Bi Bo, Sun Shuyung and Wang Chunping in the year 2007 and was published in The
Eighth International Conference on Electronic Measurement and Instruments. Using
USB protocol allows intercommunication between peripheral devices and plug-andplay services. Plug-and-play services provide the users to easily connect or
disconnect the device without problem of damaging the USB device or installing
before used. Various speeds can be chosen including Low Speed, Full Speed and
High Speed depending on the applications.
In the design, an interface circuit and a function circuit was combined to form
the whole circuit system. The interface circuit is used to link the computer and the
function circuit together while the function circuit collect the signals from the
equipment and send it to the interface circuit. The EZ-USB chip was used to
communicate with the ADC of the system. When the system operates, the external
analog signal will be sent to the sample-holding circuit. The signal will be process by
the ADC chip, MAX197 and after the conversion process is completed, the data will
be transferred to the USB interface chip and then to the PC application software. The
equipment was used to detect an industrial-control system and the project gave high
stability and precision [15].
In the paper published by Dmytro Titkov, Volodymyr Shvaichenkoa and
Olena Shvaichenko, the use of microcontroller with USB interface was again proved
the significant advantage in data acquisition and controlling system. USB protocol
was used as small computer models such as laptop does not support RS232 or
16
parallel port. In order to allow communication with the PC, PIC with USB support is
still the best way to implement the required system. It is many times much cost
effective than using method other than mentioned above [16].
CHAPTER 3
METHODOLOGY
3.1
Introduction
This project is divided into two phase that is interface design and hardware
design. Interface design phase focus on designing a workable circuit to connect the
hardware part to the interface part and then create a software as the interface for the
whole circuit system. Therefore, the Interface Design can be split up into two parts
which is Hardware Part and Software Part. Hardware Part of the Interface Design is
responsible for designing a circuit using PIC and Bridge Rectifier to collect data
from the Hardware Design and to convert the analog signal to digital signal so that
the computer can read the data transferred. It also filters out the negative phase of the
sinusoidal signal which the PIC cannot receive. The Software Part is to create an
interface using Visual Basic to do all the calculations of parameter after received
from the PIC and then display and save the data and results collected. Hardware
Design phase is to create a circuit system using voltage and current transducer as
their main components in to convert the high voltage and current into the range
where the PIC could handle.
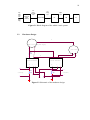
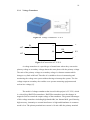
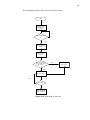
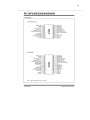
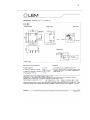
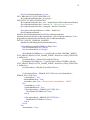
Below is the block diagram of the whole circuit system:
18
High
analog
input
from
single
phase
supply
Low
analog
sinusoidal
input
Voltage and
Current
Transducer
Low
analog
input
Digital
output
Bridge Rectifier
PIC
USB
PC
Figure 3.1 Block diagram of the whole circuit system
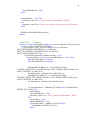
3.2
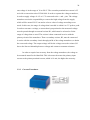
Hardware Design
E
power cord (single phase supply)
N
L
power socket
R1
39k
L
L
N
+HT
N
-HT
1-5
Voltage Transducer
M
+
6-10
Current Transducer
-
M
+
-
+
+
V(voltage)
R2
200
R3
150
V(current)
-
+15V
0
-15V
0
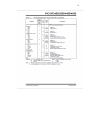
Figure 3.2 Schematic of the hardware design
19
3.2.1
Voltage Transducer
Figure 3.3 Voltage Transducer LV 25-P
R1
+
+
+HT
R2
M
0V
-
-
-HT
Figure 3.4 Connection of LV 25-P
A voltage transducer is a special type of transformer where they convert the
primary voltage to secondary voltage almost the same phase with the primary voltage.
The ratio of the primary voltage to secondary voltage is a known constant which
changes very little with load. Therefore it is suitable to be use in measuring and
monitoring the voltage on a system without having to interrupt the system. The low
voltage output at secondary also enables us to operate measuring equipments and
tools at low voltage [6].
The model of voltage transducer that is used in this project is LV 25-P, which
is a closed loop Hall Effect transducer. Hall Effect transducer uses the changes in
magnetic field to control the output voltage of the transducer. The general advantages
of this voltage transducer including high bandwidth, low thermal drift, good linearity,
high accuracy, immunity to external interference is high and disturbance in common
mode is low. The primary nominal rms current is 10 mA while the primary nominal
20
rms voltage is in the range of 10 to 500 V. The secondary nominal rms current is 25
mA with a conversion ratio of 2500:1000. In order to operate the voltage transducer,
it needs a supply voltage of ±12 to 15 V connected to the + and – pins. The voltage
transducer carries the responsibility to convert the high voltage from the supply
which will be around 230 V rms and to a lower value of voltage according to our
needs. In this case, the range of voltage that is needed is within 0 to 5 V peak to peak.
In order to measure a voltage, a current that is proportional to the measured voltage
must be passed through an external resistor R1, which must be selected to fit the
range of voltage that we need. The resistor is then connected in series with the
primary circuit of the transducer. Then a secondary resistor, R2, must be connected
in series with the secondary circuit through pin M of the voltage transducer, to obtain
the converted voltage. The output voltage will be the voltage across the resistor, R2
due to the linear relationship between voltage and current at constant resistance.
In order to acquire best accuracy from the voltage transducer, the voltage to
be measured must first be identified. This is because the nearer the primary input
current to the primary nominal current, which is 10 mA, the higher the accuracy.
3.2.2
Current Transducer
Figure 3.5 Current Transducer LA 25-NP
21
+
+
IN
1-5
Ip
M
OUT
Is
R2
0V
6-10
-
-
Figure 3.6 Connection of LA 25-NP
Current transformer/transducer is a transformer that converts the primary
current proportionally to secondary current, with negligible phase change, normally
less than one degree. In this case, we can use it to monitor and measure the current in
a line isolated from the primary circuit [6].
A current transducer is used to measure and convert the input current from
single phase supply so that PIC will be able to read the values. LA 25-NP is the
model of the current transducer used in this project. It is like the twin brother of LV
25-P which carries almost identical features and advantages with it. It is also a Hall
Effect transducer with galvanic isolation between the primary circuit and secondary
circuit. The primary nominal rms current is 25 A while the secondary nominal rms
current is 25 mA with conversion ratio of 1-2-3-4-5:1000. Depending on the
conversion ratio, the primary nominal rms current ranges from 5 to 25 A suit
different needs of the users. Because to obtain accurate results from the current
transducer, the input current must first be determined first so that the conversion ratio
and hence the primary input current will be in the range of the primary nominal
current. To choose different setting for the conversion ratio, the connections of the
IN and OUT pins of the transducer must follow the recommended connections in the
datasheet provided. IN pins which consist of pin 1 to 5 is connected to the primary
circuit while the OUT pins from pin 6 to 10 is connected to the equipment to be
measured. Just like its twin brother, LA 25-NP also requires ±15 V to activate the
electronics circuit inside the transducer. They are connected to the + and – pin of the
transducer.
22
A resistor R3 is connected to the M pin of the transducer and the voltage
across R3 will be measured as the output voltage. This output voltage will then be
calculate and revert back to obtain the actual input current by using the
proportionality relationship of voltage and current.
3.2.3
Bridge Rectifier
2 bridge rectifiers which the model name is KBP402 is connected to the
output of from both the voltage and current transducer to filter out the negative signal
of the sinusoidal waveform. PIC18F4550 that we used in the project can only receive
positive voltage signal and hence the rectifiers plays a vital role in the conversion
process. The outputs voltage from current and voltage transducer is feed into the „AC‟
pins of the bridge rectifier while the output after rectified from + pin and – pin is
connected to the input port of the PIC and ground respectively.
Figure 3.7 Bridge rectifier
23
3.2.4
Power Cord and Socket
Figure 3.8 Power cord and socket
A power cord is used to provide the single phase supply from the main socket
to the whole circuit system as well as to the equipment to be measured. The power
socket provides a stand to the electrical equipment to draw the power supply required
to operate. In this project, domestic load is used and hence a regular 3 pins 13 A
power cord and socket is used. The life wire will be connected to the input of the
voltage and current transducer while the neutral wire is connected with only the
voltage transducer. This will form a parallel connection to the voltage transducer so
that the voltage of the load can be measured. The output of the current transducer
will connect to the power socket to form series connection with the life wire to obtain
the current flows in the load.
24
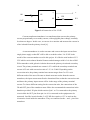
3.3
Interface Design
SW1
SW PUSHBUTTON
0
+
RA0
GND
V(voltage)
-
0
bridge
rectifier
PIC18F4550
+
RA1
Crystal Oscillator
V(current)
20MHz
-
OSC1
USB
OSC2
bridge
rectifier
0
Figure 3.9 Schematic of the interface design
3.3.1
Hardware Part
3.3.1.1 Peripheral Interface Controller (PIC) Microcontroller
Figure 3.10 PIC Microcontroller
PC
25
Figure 3.11 Microprocessor
PIC microcontroller can be considered as a category of the microprocessor.
Microprocessor such as Pentium 4, Core 2 Duo and now i7 is very high in
performance with extremely fast processing speed. Microprocessor is a standalone
microchip and it cannot do anything on its own. It requires additional peripheral such
as Random Access Memory (RAM), Input and Output Ports (I/O ports), Read Only
Memory (ROM) and others to function as a system. Unlike the microprocessor,
although a microcontroller is not as fast as a microprocessor, but it contains all the
components needed to be able to function on its own. The microcontroller have
build-in RAM, ROM, a number of I/O ports, Timer, USB ports, Serial ports
depending on the type and model.
Microcontroller can be found everywhere in our electronics devices such as
washing machine, video games, DVD player, refrigerators and in most of the more
“intelligent” machines. This is because the size of the microcontroller itself and the
flexibility to program it to do the job we wanted.
In a microcontroller, there are many types of memories. ROM is one of the
basic memories in a microcontroller. Read only memory, as its name suggest, can
only be read and the data inside the memory is fixed. The memory is being
programmed during manufactured and cannot be deleted even power is removed
from the ROM. Therefore, the users can only use the sole function provided by the
manufacturer.
26
Random Access Memory (RAM) is a volatile memory that allows data to be
read and write continuously. A volatile memory does not retain its data when power
supply is removed from it. RAM comes in different size.
Electrical Erasable Programmable Read Only Memory (EEPROM) is yet
another type of memory in a microcontroller. It is a non volatile memory and the data
can be erased and reprogram using external programming devices. EEPROM is slow
memory and only used to save basic configuration information and programming
functions in it.
A supply voltage must be applied to a microcontroller for it to operate. +5 V
is mostly used in the microcontroller with some tolerance. The microcontroller
contains its own instruction set. The users must use the instruction set available in
order to program the microcontroller. Not all the instruction set for every
microcontroller is the same. Therefore the users must study what is available for
them before starting to write the program in it.
There are a number of Input and Output ports (I/O ports) available for users
to program and use them. Some of the ports are analog or digital or both, depending
on the initiation done in the firmware. They can be input port or otherwise output
port. Users no longer needed to worry about the insufficient of input or output ports
and buy another microcontroller to cater with ports that is fixed on the type [7].
i)
PIC18F4550
Figure 3.12 PIC18F4550
27
Figure 3.13 Pinouts of PIC18F4550
PIC18F4550 is the core of the interfacing design, or perhaps the whole
project. The microcontroller act like the brain of the whole system, receiving all the
data from the hardware circuit and then process the data before sending it to the
computer. The reason why PIC18F4550 is chosen is because of several reasons:
a) USB support, which means that we no longer need to use a RS-232
converter if we wanted to connect it to the PC
b) Being able to delete and rewrite the firmware easily lasted for up to
one million time
c) Bootloader can be use to allow programming of the PIC need not have
to constantly removing it to the programming socket and put the PIC
back to the circuit system after programmed
d) There is also a build in 10-bit 13 channel analog to digital converter
(ADC) in the PIC so that the users do not need to have an external
ADC to convert the analog signal to digital signal
e) Multiple input and output ports in a single microchip
Unlike regular microchip, a PIC microcontroller must first be programmed in
C languages before it contains any functions. C language is a common programming
language learnt in Electrical Engineering courses. After being programmed, the ports
28
that are already activated will be able to receive input and provide the output
required. The pins that are involved in this project are shown in the table below:
Table 3.1: Pins used in project
Pin Name
Pin No.
Description
MCLR
1
Reset when high
RA0
2
Analog input of V(voltage)
RA1
3
Analog input of V(current)
OSC1
13
Connect to oscillator
OSC2
14
Connect to oscillator
GND
31
Ground of the whole system
RB0/SW1
33
The PIC will operate when button is pressed
D+
24
USB data +
D-
23
USB data -
3.3.1.2 Analog to Digital Converter (ADC) in PIC18F4550
The integrated ADC in the PIC is 10-bit in size and has a total of 13 channels.
There are 5 registers in the ADC which is A/D Control Register 0 (ADCON0), A/D
Control Register 1(ADCON1), A/D Control Register 2(ADCON2), A/D Result High
Register (ADRESH) and A/D Result Low Register (ADRESL). The first control
register, ADCON0 is used to control the operation of the A/D module while
ADCON1 works to set the functions of the port pins. ADCON2 is the register that
configures the acquisition time and A/D clock source. These registers are extremely
important and must be configures properly or the ADC will not work as needed. Both
the ADRESH and ADRESL store the result of the conversion.
From the datasheet, the minimum required acquisition time is 2.45 μs. This
time shows that the ADC requires some time to make sure that the whole conversion
process is completed before follow up with another conversion. For a 10-bit device,
the minimum step size of the converter is 1/1023.
29
To configure the port pins of the PIC to receive analog signal and convert it
into digital form, the registers need to be set in the firmware. Below shows a part of
the coding in order to use port A0 and port A1 as the analog input port with ADC on.
Figure 3.14 Part of the firmware
30
3.3.1.3 SK40C Development Board
Figure 3.15 SK40C development board
USB
V (voltage)
RA0
V (current)
RA1
GND
DCrystal
Oscillator
20MHz
D+
RESET
SW1
Figure 3.16 Schematic of the connection of SK40C board
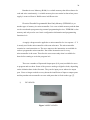
The SK40C is a device made by Cytron Technologies to provide the users to
speed up the development of a PIC related projects. This board only contains some
basic components needed to do programming such as reset button, connector for
programmer, power indicator LED, USB connector, programmable push buttons and
others. All the interface and program must be written and construct by the users
themselves. By using the development board, many soldering work can be eliminated
31
and users no longer requires to plug-in and out the PIC for programming. All in all, it
helps new microcontroller users to develop their project faster and more comfortable.
Figure shows the connection made on the SK40C development board. The
output voltages from the rectifiers were fed into port RA0 and RA1. The crystal
oscillator is connected on the port OSC1 and OSC2. The USB port is already
connected well in the board and hence the port can be plugged in directly using the
suitable pair of the USB head.
3.3.1.4 Ports
Figure 3.17 Parallel port
Figure 3.18 Serial port
Figure 3.19 USB port
Ports are use to link the circuitry and the computer system together. They act
as the medium for communication link. Ports such as serial and parallel port will be
chosen to achieve the purpose mentioned. Serial ports allow information transferring
and receiving one bit at a time. Serial port uses RS232 standard as its protocol [8].
32
On the other hand, parallel interfacing which uses parallel port as communication
and transmission link is able to transmit and receive bits of data at the same time.
Parallel port also known as printer port and it uses IEEE 1284 standard [9].
USB port is a newer version of the standard port used in a computer. USB
ports are smaller and are able to transfer data way much faster than parallel and serial
port could. It is also able to supply the required power to the USB devices without
needing external supply [10].
i)
USB
In today‟s computers and laptops, USB can be found at any corners of the
powerful calculator. Compared to 10 years ago which uses Serial and Parallel ports
as the interfacing medium for the external devices, USB is way much faster and
smaller. With the continuous development of the USB by many leading companies in
computer and electronics, more and more advanced version of USB specification had
been released. From the original USB 1.0 specification which carries transfer rate of
1.5 Mbit/s to transfer rate up to 5 Gbit/s in USB 3.0, the speed of the USB is faster
day by day. Compared to serial port that has data transfer rate of maximum 115200
bit/s and parallel port of 16Mbit/s, USB is obviously many times faster than these
conventional ports. Besides, USB is also smaller and lighter compared to its
predecessor and can fit more ports in a single PC. Due to the various reasons above,
USB had replaced serial and parallel ports in this modern days where speed and size
matters. Therefore, to make sure that this device made can fit all the computers that
might be used by the users, USB as the interfacing medium is very important.
33
Figure 3.20 Types of USB port
USB comes in many device classes such as Audio, Communication, Printer,
Mass Storage, Human Interface Device (HID) and so on. In this project, HID classes
had been implemented because HID is much easier to be programmed without
having to worried about drivers. All the required drivers had been made inside
Windows and we just have to specify the device classes by addressing the
appropriate Product ID (PID) and Vendor ID (VID) in the firmware. PID and VID is
a 16-bit number which PC used to identify and provide the driver for the USB device.
USB comes in various design including Standard, Mini and Micro USB
connector. USB only need +5 V in order to function and hence the power
consumption is very small. There are 4 pins in a standard USB while 5 pins in mini
and micro types. The data of the pins are shown in table below:
Table 3.2: USB Standard Pinout
PIN
NAME
DESCRIPTION
1
Vbus
+5 V
2
D-
Data -
3
D+
Data +
4
GND
Ground
34
Table 3.3: USB Mini/Micro Pinouts
PIN
NAME
DESCRIPTION
1
Vbus
+5 V
2
D-
Data -
3
D+
Data +
4
ID
Allow the computer to differenciate between A
plug and B plug
5
3.3.2
GND
Ground
Software Part
3.3.2.1 Personal Computer
A computer is a powerful calculator with the ability to process data in a short
interval. Nowadays, computer is very important equipment to not only working
people but also students. Computer in 21st century has a lot of functions and helps
not only in processing data with ease and speed but also support a lot of software.
Computer had become a part of our life and developing a device that can
communicate with it is a relief to all the users.
3.3.2.2 MPLAB IDE and PICkit2
MPLAB IDE is called an Integrated Development Environment (IDE) as it
allows users to develop code for microcontroller in a single software environment. It
contains a compiler, software and hardware debugger, editor, project manager, linker
and execution engines. This software is developed by Microchip Technology and is
used for the programming of the microcontroller [11].
35
PICkit2 programmer application is also produced by Microchip Technology.
It is used for writing the firmware written in MPLAB IDE into the EEPROM and
Flash microcontroller [12]. With both the software, it is sufficient to activate most of
the microcontroller devices available in the market.
MPLAB IDE uses C language and it is a very fundamental language in
programming. By having this PIC programming software, everything the users need
in all in one packet. Users can check the memory requirement, stability of the
firmware and direct compilation after finished programmed. If there is any error,
MPLAB IDE also provides a debugger to trace the bugs in it.
PICkit2 is used to burn the firmware into the microchip. Combined with
MPLAB IDE, they can complete the whole microchip programming function in a
quick manner.
36
START
INITIALIZATION
1) Initialize ports
2) Initialize button
NO
Initialize and set ADC
NO
NO
YES
Write firmware into
PIC
Test ports
YES
Test result
Figure 3.21 Algorithm for programming the firmware of PIC
3.3.2.3 Visual Basic 2008
Figure 3.22 Visual Studio 2008 Logo
37
Visual Basic 2008 is a programming language in Visual Studio 2008 that
allows user to design and create software of his own. Visual basic is a rather easy
understandable programming language and operates in Windows. Visual Basic has
the advantages in the development of graphical user interface (GUI) comparing to
the traditional language such as C, FORTRAN and C++. As the world slowly
adopting GUI, Visual Basic is becoming more and more popular among
programmers and software developers. GUI provides users an easy to learn and
understand interface. Just by looking at the description on a button, the user knows
that it can be pressed and will be able to expect what to get when the button is
pressed.
With Visual Basic, a nice GUI can be made without needing to write
thousands of coding. A simple button can be added to the system by dragging or
inserting a button control in Visual Basic interface toolbox but if we wanted to have
a button in C, we need to use coding to specified the width, length, texts in the
buttons and is very troublesome if we want the software to have a lot of buttons and
textboxes.
Other than buttons and textboxes, Visual Basic gives the user a lot of
functions that is required in most GUI based development such as checkbox,
graphical plot, background editing, drop boxes and so on. All these objects can be
add into the software by just a single click and then add some command for the
objects to function or respond to events. Hence, Visual Basic provides the user to
create an user friendly interface software with greater ease [10].
i)
Visual Basic Based Interface Software
After all the hardware and data transferring system had been developed, there
must be someone to control all these processes and handle the data transferred.
Software based on Visual Basic will be the one who will collect these data
38
transferred from the hardware as well as indirectly give command to the hardware to
start or stop working.
Visual Basic is chosen as the programming language because it is easier to
understand and write. This software will detect whether the device is connected or
not, then send a signal to start receiving data after the push button on the SK40C
board had been pressed. The software will start receiving data from the PIC and then
calculations will be done in the software to get the values of voltage, current, power
factor and power of the equipment being measured. The profile of all the parameters
will also be plotted automatically by the software itself. Users can easily interact
with the software through clearly labeled push buttons on the interface of the
software.
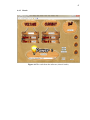
Figure 3.23 The interface of the software
39
Table 3.4: The description of the software interface
No.
Description
1
Instantaneous voltage
2
Instantaneous current
3
Power factor
4
Average power
5
Highest rms voltage logged
6
Highest rms current logged
7
Time logged when the highest rms voltage occurs
8
Time logged when the highest rms voltage occurs
9
Push buttons to show the profile of voltage, current and power
10
“Insert data” button is used when we want to save the result in database,
“delete” button will clear all the database and “Restart” button stop and
reset the timer
11
Detect whether the circuit is connected to the USB port of computer
When the system runs, the data from both transducers will be sent to the PIC
and then converted into digital form. The digital signals will then be sent to the
computer via USB cable and then capture by the software interface. The software
will get the data alternately and then calculate and shows in area 1 and 2. As the data
keep flowing into the system, the software will continue to capture the values of the
instantaneous voltage and current. If the value of instantaneous voltage and current
captured is higher than the one captured before, it will be logged into area 5 and 6.
The time logged that is area 7 and 8 will be the time obtained when the system gets
the highest voltage and current logged in the area 5 and 6. The power factor of the
system at area 3 is calculated using the time logged in 5 and 6. The average power at
area 4 will then be calculated by the system by using all the parameters above.
40
The working algorithm of the software is shown below:
Start
Software starts
and SW1 is
pressed
NO
Collect data. Done?
YES
Press “Restart”
button
Press “Insert
Data”
Is a message box
popup said insert
complete?
NO
Wait for message
box popup
YES
Analyse Data
YES
NO
Finished?
Press “delete” to
clear database
Figure 3.24 Algorithm of software
CHAPTER 4
RESULT AND DISCUSSION
4.1
Introduction
In this project, a few tests had been done to verify and obtain the results from
the system developed. An electric kettle and an electric toaster had been used to test
the effectiveness of the device. Firstly, the output voltage and current from the
transducers with the electrical appliances connected will be measured and captured
by the oscilloscope along with its waveforms. Then the outputs will be run through
the bridge rectifier and the results were saved again. Later the whole circuit system
will be implemented and the rms voltage, rms current, power factor and average
power of the electrical equipment tested were obtained and shown in the interface
software. Lastly, a power meter is used to verify the experimental results with the
actual values. Analysis is done later on to compare the results and comment on the
effectiveness of the system.
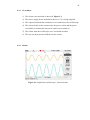
4.2
Output from Transducers
Tests had been conducted to make sure that the signal that will flow in the
PIC is well under 5 V. This is important as the rated input of the PIC must be less
than +5 V or the PIC will burn.
42
4.2.1
Procedures
1) The circuit was connected as shown in Figure 3.2.
2) The power supply for the transducers that is ±15 V is being supplied.
3) The outputs from both the transducers were connected to the oscilloscope.
4) The electric kettle is then connected to the power socket and the power
cord which is connected to the power outlet was switched on.
5) The results from the oscilloscope were saved and recorded.
6) The test was then repeated with the electric toaster.
4.2.2
Result
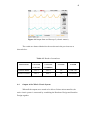
Figure 4.1 Output from oscilloscope 1 (electric kettle)
43
Figure 4.2 Output from oscilloscope 1 (electric toaster)
The result from the tests is shown in the table below:
Table 4.1: Result of first test
ELECTRICAL
RMS VOLTAGE
RMS VOLTAGE
POWER
AVERAGE
APPLIANCES
(VOTAGE)
(CURRENT)
FACTOR
POWER
Electric Kettle
2.96 V
2.64 V
1.0
2026.02 W
Electric Toaster
2.88 V
0.85 V
1.0
636.48 W
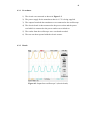
4.3
Output from Transducer through Bridge Rectifier
After the value of voltage and current were reduced into a acceptable range,
the outputs from the previous test are passed through the bridge rectifier to filter out
the negative values.
44
4.3.1
Procedures
1) The circuit was connected as shown in Figure 3.2.
2) The power supply for the transducers that is ±15 V is being supplied.
3) The outputs from both the transducers were connected to the oscilloscope.
4) The electric kettle is then connected to the power socket and the power
cord which is connected to the power outlet was switched on.
5) The results from the oscilloscope were saved and recorded.
6) The test was then repeated with the electric toaster.
4.3.2
Result
Figure 4.3 Output from oscilloscope 2 (electric kettle)
45
Figure 4.4 Output from oscilloscope 2 (electric toaster)
The results are almost identical to the test shown in the previous test as
shown below:
Table 4.2: Result of second test
ELECTRICAL
RMS
RMS
POWER
AVERAGE
APPLIANCES
VOLTAGE
VOLTAGE
FACTOR
POWER
(VOTAGE)
(CURRENT)
Electric Kettle
2.93 V
2.61 V
1.0
1988.3 W
Electric Toaster
2.85 V
0.88 V
1.0
652.08 W
4.4
Output of the Whole Circuit System
When all the outputs were tested to be able to fit into microcontroller, the
entire circuit system is connected by combining the Hardware Design and Interface
Design together.
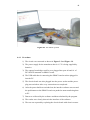
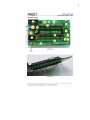
46
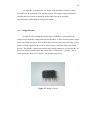
Figure 4.5 The whole system
4.4.1
Procedure
1) The circuit was connected as shown in Figure 3.2 and Figure 3.9.
2) The power supply for the transducers that is ±15 V is being supplied by
batteries.
3) The outputs from bridge rectifier were plugged into port A0 and A1 of
PIC18F4550 mounted on SK40C board.
4) The USB cable that is connecting the SK40C board was then plugged in
into the PC.
5) The electric kettle was also plugged into the power socket and the power
plug was switch on after every connection was completed.
6) After the power had been switched on, the interface software was run and
the push button on the SK40C board was pushed to start transferring data
to PC.
7) Data were collected by the software and then calculated by the program
8) The results were clearly shown in the interface of the software.
9) The test was repeated by replacing the electric kettle with electric toaster.
47
4.4.2
Result
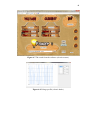
Figure 4.6 The result from the software (electric kettle)
48
Figure 4.7 The result from the software (electric toaster)
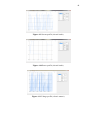
Figure 4.8 Voltage profile (electric kettle)
49
Figure 4.9 Current profile (electric kettle)
Figure 4.10 Power profile (electric kettle)
Figure 4.11 Voltage profile (electric toaster)
50
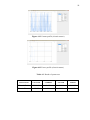
Figure 4.12 Current profile (electric toaster)
Figure 4.13 Power profile (electric toaster)
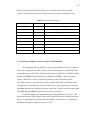
Table 4.3: Result of system test
ELECTRICAL
RMS
RMS
POWER
AVERAGE
APPLIANCES
VOLTAGE
CURRENT
FACTOR
POWER
Electric Kettle
231.96 V
8.9 V
-0.9981
-2060 W
Electric Toaster
236.7
1.9
0.989
444.5
51
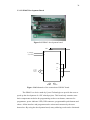
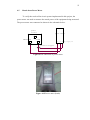
4.5
Result from Power Meter
To verify the result of the circuit system implemented in this project, the
power meter was used to measure the actual power of the equipment being measured.
The power meter was connected as shown in the schematic below:
power
socket
power meter
NEUTRAL
LIFE
- +
Current clipper port
Current Clipper
Figure 4.14 Connection of power meter
Figure 4.15 Power meter (kettle)
52
Figure 4.16 Power meter (toaster)
Table 4.4: Result of power meter
ELECTRICAL
RMS
APPLIANCES
VOLTAGE
Electric Kettle
241 V
Electric Toaster
244 V
4.6
RMS CURRENT
POWER
AVERAGE
FACTOR
POWER
9.2 V
1.0
2220 W
2.9 V
1.0
709 W
Discussion
From the first test on the ability of voltage and current transducer, the
waveform and values that were obtained are almost as accurate. The output
waveforms show the sinusoidal waveform with frequency of 50 Hz and different
amplitudes. Hence the test had proven that the transducers successfully convert the
high voltage and current from supply in within ±5 V.
In the second phase, the outputs from the transducers were fed into the bridge
rectifiers. The result shows that the negative side of the sinusoidal waveform had
been successfully filtered out with a small drop in voltages. This happens because the
rectifier requires a small forward voltage before it conduct electric.
53
When the whole system were being ran, output result that is shown gives
almost accurate values comparing to the actual values measured by using power
meter. There is about 10 % of error when compared with the values obtained from
power meter with the one using the circuit system when tested with electric kettle.
On the other hand, the test with the electric toaster yielded larger error about 37%. In
order to acquire more accurate result, the system needs to find the actual highest rms
voltage and current when operating. Because the speed limitation of the system, it
needs to operate for a longer time in order to become more accurate.
Also, from the comparison between the different ratings of power of
electrical appliances, because the minimum nominal value of current is 5 A, hence
the power of the equipment being measured must have at least 1 kW to obtain the
best accuracy from the system. The error of the accuracy increases as the value of
current of the input decreases. From the case of electric kettle, it clearly shows that
the current of the input will heavily affect the accuracy of the system. From
calculations, the nominal value of the input current of the electric toaster should be
around 3 A and this value is well below the rating of the nominal current and hence
the accuracy suffers.
Regarding the power factor of the system, because the time used to calculate
the power factor is depending on the ability of system to obtain the highest rms
values of both the voltage and current, hence it will take time for the power factor to
be stable and accurate too.
54
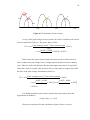
A
B
c
D
Voltage
current
0.02
0.04
0.06
Figure 4.17 Calculation of power factor
Let say if the peak voltage occurs at point A at 0.005 sec and the peak current
occurs at point B at 0.006 sec. The power factor will be:
But because the system cannot capture the peak current at a short interval
after it capture the peak voltage, hence it might capture the peak current at another
cycle. Then we do the calculations when the time captured at point C or at point D
where the current is at peak value at time 0.026 sec and 0.046 sec respectively while
the time of the peak voltage is maintain at 0.005 sec.
It is found out that the power factor remains the same because from the
trigonometrical identities,
Hence the concept used in the calculation of power factor is correct.
55
Besides that, the voltage, current and power profile were shown when the
buttons on the software interface. The graph of voltage, current, and power against
time were plotted.
CHAPTER 5
CONCLUSION AND RECOMMENDATIONS
5.1
Conclusion
In conclusion, power measurement is used not only in industry and research
area but also slowly adapt in domestic houses. One will be able to know how much
the total power consumed daily and can plan their use of each electrical appliance.
As for the research group, they can store the data collected with ease and read them
anytime they want. Analysis on the power profile can be made easily using the user
friendly software interface. The industry can also use the power measurement tools
to identify the machine that consume the most reactive power and probably can
increase the power factor of the machine or factory by changing or installing
capacitors.
By using basic components such as transducers and microcontroller, the data
acquisition system can be easily developed and used in the measurement of power
and profile of the electrical equipment. The voltage, current and power factor can be
measured easily and stored in any computer with the software installed in it. Whether
it is a home desktop PC or laptop to a netbook, each and every computer now have at
least 2 USB ports. This means that the portability of this device is very high and can
be used almost everywhere without constrain from computer hardware.
In most power meter or wattmeter, although it is can be handheld and
portable, but they lack data storing ability of this device developed. Some of the
available power meters are able to plot graph on the LCD screen, however, to save it
57
remains a problem for them. This device solves all the weakness of the currently
available power measurement devices and contains almost as strong measuring
power as them.
The software developed used to calculate and store data using GUI from
Visual Basic Language is very easy to be used. Everything they can see on the
interface is clearly shown and can be use directly. Long manual books or training is
not required when using the software and the device. Hence it is user-friendly and
acceptable even to someone with little knowledge about electronics and electric. All
they need is just to know how to read and understand the description on the interface.
In overall, most of the objectives had been successfully achieved. The
accuracy and the speed of the system to obtain data is the only concern in this project.
This might be due to the programming software used is slower and affect the ability
of the data acquisition process.
5.2
Recommendation
In this project, the speed of the system is an important criterion in the system.
The accuracy of the system to measure the power and power factor depend heavily
on the speed of the data logged in the software. This is because to obtain power in
the system, the calculations of peak voltage and current are needed and these
parameters have to be as close to actual peak values as possible. This means that the
system needs to get more data in a cycle so that the peak current and voltage can be
obtained more easily and increase the efficiency and accuracy of the system.
Regarding the power factor, the method used is also relies on the accuracy of how
fast the system finds the highest voltage and current. Power factor calculation can
differ much even the error of the system is low. This is because the frequency of the
system is 50 Hz and hence in one cycle, the time is only 0.02 s. Difference in 0.01 s
will cause 50% of error in the system and that is why the speed of the system to
acquire data utmost important.
58
In order to make the system more stable and accurate, the speed of the system
to obtain data from must be increased. To improve the speed of the system, a faster
programming language such as C or C++ can be used so that the running of the code
in the software is faster and hence the speed of the system.
Besides that, an external memory can also be used as the temporary storage
for the system to store the data from the PIC first. After all the data had been
collected in the external memory, the data will only be sent to the PC using USB to
reduce the time to transfer and process data.
Other than that, another method such as Zero Crossing to calculate the power
factor can also be used so that the phase difference between voltage and current can
be easily found. This is because the method used in this project is to find the highest
point in the sinusoidal waveform of voltage and current. This method can be hard to
obtain the accurate highest point especially there is a short time interval between the
acquisitions of 2 data.
Also, another PIC which contains a higher bit of ADC can be used to improve
the step size to reduce error in the system. Two PIC or PIC with two ADC can also
improve the speed of the system. This is because in this project, only one ADC is
available in the PIC and there are 2 parameters that is needed to collect at a time.
Therefore the ADC had to switch from one parameter to another to be converted into
digital signal and this had wasted 50% of the time if 2 ADCs were available.
59
REFERENCES
[1] Sadiku and Alexander (2007), Fundamental of Electric Circuit 3rd Edition,
New York, McGraw-Hill.
[2] http://en.wikipedia.org/wiki/Jacques-Ars%C3%A8ne_d'Arsonval
[3] http://en.wikipedia.org/wiki/Galvanometer
[4] http://en.wikipedia.org/wiki/Wattmeter
[5] http://physics.kenyon.edu/EarlyApparatus/Electrical_Measurements/Electrody
namometer/Electrodynamometer.html
[6] Wildi, Theodore (2006), Electrical Machine, Drives, and Power Systems
International Sixth Edition, US, Pearson Prentice Hall.
[7] Ibrahim, Dogan (2008), Advanced PIC Microcontroller Projects in C From
USB to RTOS with the PIC18F Series, Elsevier Ltd., United States of America.
[8] http://en.wikipedia.org/wiki/Serial_port
[9] Smith, George (2000), Computer Interfacing, Newnes, Oxford.
[10] Bradley,Julia Case (2005), Programming in Visual Basic.NET, McGrawHill/Irwin, New York.
[11] MPLAB IDE Help, Microchip Technology Inc.
[12] PICkit2 Programmer/Debugger User’s Guide, Microchip Technology Inc.
60
[13] M.Popa, IEEE member, M. Marcu, A.S. Popa (2004), A Mirocontroller based
Data Acquisition System with USB Interface, Electrical, Electronics and
Computer Engineering, 2004. 5-7 September. Cairo, Egypt: IEEE, 206-209.
[14] Yanpeng Wang and Mingming Fu (2010), A Portable USB Data Acquisition
System, 2010 WASE International Conference on Information Engineering,
14-15 August, Beidaihe, Hebei: IEEE 169-172.
[15] Bi Bo, Sun Shuying and Wang Chunping (2007), Design of Data Acquisition
Equipment Based on USB, The Eighth International Conference on
Electronic Measurement and Instruments, 16 August- 18 July, Xian, China:
IEEE 1-866.
[16] Dmytro Titkov, Volodymyr Shvaichenko and Olena Shvaichenko, Features
of Interface of Microcontroller and Computer through USB, 2010 TCSET
Conference, 23-27 February, Lviv Polytechnic National University, Ukraine:
IEEE 247.
61
APPENDIX A
PIC18F4550 Datasheet
62
63
64
65
66
67
68
69
70
APPENDIX B
LV 25-P Voltage Transducer Datasheet
71
72
73
APPENDIX C
LA 25-NP Current Transducer Datasheet
74
75
APPENDIX D
SK40C Development Board User Manual
76
77
78
APPENDIX E
Firmware of PIC18F4550
Hardware profile:
#ifndef HARDWARE_PROFILE_PICDEM_FSUSB_H
#define HARDWARE_PROFILE_PICDEM_FSUSB_H
#define tris_self_power TRISAbits.TRISA2
#if defined(USE_SELF_POWER_SENSE_IO)
#define self_power
PORTAbits.RA2
#else
#define self_power
1
#endif
//#define USE_USB_BUS_SENSE_IO
#define tris_usb_bus_sense TRISAbits.TRISA1
#if defined(USE_USB_BUS_SENSE_IO)
#define USB_BUS_SENSE
PORTAbits.RA1
#else
#define USB_BUS_SENSE
1
#endif
#define PROGRAMMABLE_WITH_USB_HID_BOOTLOADER
#define DEMO_BOARD PICDEM_FS_USB
#define PICDEM_FS_USB
#define CLOCK_FREQ 48000000
/** SWITCH **/
#define mInitAllSwitches() TRISBbits.TRISB0=1;
#define button
PORTBbits.RB0
/** POT ***/
#define mInitPOT1()
{TRISA=0b00000001;ADCON0=0b00000001;ADCON1=0x00;ADCON2=0b10010
100;}
#define mInitPOT2()
{TRISA=0b00000010;ADCON0=0b00000101;ADCON1=0x00;ADCON2=0b10010
100;}
79
/** USB external transceiver *****/
#define tris_usb_vpo
TRISBbits.TRISB3
#define tris_usb_vmo
TRISBbits.TRISB2
#define tris_usb_rcv
TRISAbits.TRISA4
#define tris_usb_vp
TRISCbits.TRISC5
#define tris_usb_vm
TRISCbits.TRISC4
#define tris_usb_oe
TRISCbits.TRISC1
#define tris_usb_suspnd
TRISAbits.TRISA3
// Output
// Output
// Input
// Input
// Input
// Output
// Output
/** I/O pin definitions ************/
#define INPUT_PIN 1
#define OUTPUT_PIN 0
#endif //HARDWARE_PROFILE_PICDEM_FSUSB_H
Main.c:
#ifndef MAIN_C
#define MAIN_C
#include "./USB/usb.h"
#include "HardwareProfile.h"
#include "./USB/usb_function_hid.h"
/** CONFIGURATION **********/
#if defined(PICDEM_FS_USB)
#pragma config BORV = 3
#pragma config VREGEN = ON
#pragma config WDT
= OFF
#pragma config WDTPS = 32768
#pragma config MCLRE = ON
#pragma config LPT1OSC = OFF
#pragma config PBADEN = OFF
#pragma config CCP2MX = ON
#pragma config STVREN = ON
#pragma config LVP
= OFF
#pragma config PLLDIV = 5
#pragma config CPUDIV = OSC1_PLL2
#pragma config USBDIV = 2
#pragma config FOSC = HSPLL_HS
#pragma config FCMEN = OFF
#pragma config IESO = OFF
#pragma config PWRT = OFF
#pragma config BOR
= ON
80
//
//
//
//
//
//
//
//
//
#pragma config ICPRT = OFF
#pragma config XINST = OFF
#pragma config CP0
= OFF
#pragma config CP1
= OFF
#pragma config CP2
= OFF
#pragma config CP3
= OFF
#pragma config CPB = OFF
#pragma config CPD
= OFF
#pragma config WRT0 = OFF
#pragma config WRT1 = OFF
#pragma config WRT2 = OFF
#pragma config WRT3 = OFF
#pragma config WRTB = OFF
#pragma config WRTC = OFF
#pragma config WRTD = OFF
#pragma config EBTR0 = OFF
#pragma config EBTR1 = OFF
#pragma config EBTR2 = OFF
#pragma config EBTR3 = OFF
#pragma config EBTRB = OFF
#else
#error No hardware board defined, see "HardwareProfile.h" and __FILE__
#endif
/** VARIABLES ****/
#pragma udata
#if defined(__18F14K50) || defined(__18F13K50) || defined(__18LF14K50) ||
defined(__18LF13K50)
#pragma udata usbram2
#elif defined(__18F2455) || defined(__18F2550) || defined(__18F4455) ||
defined(__18F4550)\
|| defined(__18F2458) || defined(__18F2453) || defined(__18F4558) ||
defined(__18F4553)
#pragma udata USB_VARIABLES=0x500
#else
#pragma udata
#endif
unsigned char ReceivedDataBuffer[64];
unsigned char ToSendDataBuffer[64];
#pragma udata
USB_HANDLE USBOutHandle = 0;
USB_HANDLE USBInHandle = 0;
BOOL blinkStatusValid = TRUE;
81
/** PRIVATE PROTOTYPES ********/
void BlinkUSBStatus(void);
BOOL Switch2IsPressed(void);
BOOL Switch3IsPressed(void);
static void InitializeSystem(void);
void ProcessIO(void);
void UserInit(void);
void YourHighPriorityISRCode();
void YourLowPriorityISRCode();
void USBCBSendResume(void);
WORD_VAL ReadPOT(void);
void delay(unsigned long data);
int i=1;
/** VECTOR REMAPPING ********/
#if defined(__18CXX)
PROGRAMMABLE_WITH_USB_LEGACY_CUSTOM_CLASS_BOOTLOADER
#if defined(PROGRAMMABLE_WITH_USB_HID_BOOTLOADER)
#define REMAPPED_RESET_VECTOR_ADDRESS
0x1000
#define REMAPPED_HIGH_INTERRUPT_VECTOR_ADDRESS
0x1008
#define REMAPPED_LOW_INTERRUPT_VECTOR_ADDRESS
0x1018
#elif
defined(PROGRAMMABLE_WITH_USB_MCHPUSB_BOOTLOADER)
#define REMAPPED_RESET_VECTOR_ADDRESS
0x800
#define REMAPPED_HIGH_INTERRUPT_VECTOR_ADDRESS
0x808
#define REMAPPED_LOW_INTERRUPT_VECTOR_ADDRESS
0x818
#else
#define REMAPPED_RESET_VECTOR_ADDRESS
0x00
#define REMAPPED_HIGH_INTERRUPT_VECTOR_ADDRESS
0x08
#define REMAPPED_LOW_INTERRUPT_VECTOR_ADDRESS
0x18
#endif
#if
defined(PROGRAMMABLE_WITH_USB_HID_BOOTLOADER)||defined(PROG
RAMMABLE_WITH_USB_MCHPUSB_BOOTLOADER)
extern void _startup (void
#pragma code REMAPPED_RESET_VECTOR =
REMAPPED_RESET_VECTOR_ADDRESS
82
void _reset (void)
{
_asm goto _startup _endasm
}
#endif
#pragma code REMAPPED_HIGH_INTERRUPT_VECTOR =
REMAPPED_HIGH_INTERRUPT_VECTOR_ADDRESS
void Remapped_High_ISR (void)
{
_asm goto YourHighPriorityISRCode _endasm
}
#pragma code REMAPPED_LOW_INTERRUPT_VECTOR =
REMAPPED_LOW_INTERRUPT_VECTOR_ADDRESS
void Remapped_Low_ISR (void)
{
_asm goto YourLowPriorityISRCode _endasm
}
#if
defined(PROGRAMMABLE_WITH_USB_HID_BOOTLOADER)||defined(PROG
RAMMABLE_WITH_USB_MCHPUSB_BOOTLOADER)
#pragma code HIGH_INTERRUPT_VECTOR = 0x08
void High_ISR (void)
{
_asm goto REMAPPED_HIGH_INTERRUPT_VECTOR_ADDRESS
_endasm
}
#pragma code LOW_INTERRUPT_VECTOR = 0x18
void Low_ISR (void)
{
_asm goto REMAPPED_LOW_INTERRUPT_VECTOR_ADDRESS
_endasm
}
#endif //end of "#if
defined(PROGRAMMABLE_WITH_USB_HID_BOOTLOADER)||defined(PROG
RAMMABLE_WITH_USB_LEGACY_CUSTOM_CLASS_BOOTLOADER)"
#pragma code
#pragma interrupt YourHighPriorityISRCode
void YourHighPriorityISRCode()
{
#if defined(USB_INTERRUPT)
USBDeviceTasks();
#endif
83
}
#pragma interruptlow YourLowPriorityISRCode
void YourLowPriorityISRCode()
{
}
#endif
/** DECLARATIONS ****/
#pragma code
/*******************************************************************
* Function:
void main(void)
*******************************************************************/
#if defined(__18CXX)
void main(void)
#else
int main(void)
#endif
{
InitializeSystem();
#if defined(USB_INTERRUPT)
USBDeviceAttach();
#endif
while(1)
{
#if defined(USB_POLLING)
USBDeviceTasks
#endif
ProcessIO();
}
}
/*******************************************************************
*
* Function:
static void InitializeSystem(void)
*******************************************************************/
static void InitializeSystem(void)
{
#if (defined(__18CXX) & !defined(PIC18F87J50_PIM))
84
ADCON1 |= 0x0F;
// Default all pins to digital
#endif
#if defined(USE_USB_BUS_SENSE_IO)
tris_usb_bus_sense = INPUT_PIN;
#endif
#if defined(USE_SELF_POWER_SENSE_IO)
tris_self_power = INPUT_PIN;
#endif
UserInit();
USBDeviceInit();
}
/*******************************************************************
***********
* Function:
void UserInit(void)
**/
void UserInit(void)
{
//Initialize the push buttons
mInitAllSwitches();
USBOutHandle = 0;
USBInHandle = 0;
}
/*******************************************************************
*
* Function:
void ProcessIO(void)
*
*******************************************************************/
void ProcessIO(void)
{
while(button==0)
{
if((USBDeviceState < CONFIGURED_STATE)||(USBSuspendControl==1))
return;
85
if(!HIDRxHandleBusy(USBOutHandle))
{
switch(ReceivedDataBuffer[0])
{
case 0x37:
//Read POT command. Uses ADC to measure an analog
voltage on one of the ANxx I/O pins, and returns the result to the host
{
WORD_VAL w;
if(!HIDTxHandleBusy(USBInHandle))
{
if(i%2==1)
{
mInitPOT1();
w = ReadPOT();
ToSendDataBuffer[0] = 0x37;
//Echo back to the host the command we are fulfilling in the first byte. In this
case, the Read POT (analog voltage) command.
ToSendDataBuffer[1] = w.v[0];
//Measured analog voltage LSB
ToSendDataBuffer[2] = w.v[1];
//Measured analog voltage MSB
USBInHandle =
HIDTxPacket(HID_EP,(BYTE*)&ToSendDataBuffer[0],64);
delay(1);
}
else if(i%2!=1)
{
mInitPOT2();
w = ReadPOT();
ToSendDataBuffer[0] = 0x37;
ToSendDataBuffer[1] = w.v[0];
//Measured analog voltage LSB
ToSendDataBuffer[2] = w.v[1];
//Measured analog voltage MSB
USBInHandle =
HIDTxPacket(HID_EP,(BYTE*)&ToSendDataBuffer[0],64);
86
delay(1);
}
}
}
break;
}
USBOutHandle = HIDRxPacket(HID_EP,(BYTE*)&ReceivedDataBuffer,64);
}
}
}//end ProcessIO
/********************************************
* Function:
WORD_VAL ReadPOT(void)
**************************************/
WORD_VAL ReadPOT(void)
{
WORD_VAL w;
#if defined(__18CXX)
if (i%2==1)
{
mInitPOT1();
ADCON0bits.GO = 1;
// Start AD conversion
while(ADCON0bits.NOT_DONE); // Wait for conversion
w.v[0] = ADRESL;
w.v[1] = ADRESH;
i++;
delay(1);
}
else if (i%2!=1)
{
mInitPOT2();
ADCON0bits.GO = 1;
// Start AD conversion
while(ADCON0bits.NOT_DONE); // Wait for conversion
w.v[0] = ADRESL;
w.v[1] = ADRESH+4;
87
delay(1);
i++;
}
#endif
return w;
}
/*******************************************************************
* Function:
void USBCBSuspend(void)
*******************************************************************/
void USBCBSuspend(void)
{
#if defined(__C30__)
_IPL = 1;
USBSleepOnSuspend();
#endif
}
/******************************************************************
* Function:
void _USB1Interrupt(void)
*******************************************************************/
#if 0
void __attribute__ ((interrupt)) _USB1Interrupt(void)
{
#if !defined(self_powered)
if(U1OTGIRbits.ACTVIF)
{
IEC5bits.USB1IE = 0;
U1OTGIEbits.ACTVIE = 0;
IFS5bits.USB1IF = 0;
//USBClearInterruptFlag(USBActivityIFReg,USBActivityIFBitNum);
USBClearInterruptFlag(USBIdleIFReg,USBIdleIFBitNum);
//USBSuspendControl = 0;
}
#endif
}
#endif
88
/***********************************
* Function:
void USBCBWakeFromSuspend(void)
******************************************************/
void USBCBWakeFromSuspend(void)
{
}
/*******************************************************************
*
* Function:
void USBCB_SOF_Handler(void)
*******************************************************************/
void USBCB_SOF_Handler(void)
{
}
/*******************************************************************
* Function:
void USBCBErrorHandler(void)
*******************************************************************/
void USBCBErrorHandler(void)
{
}
/*******************************************************************
* Function:
void USBCBCheckOtherReq(void)
*******************************************************************/
void USBCBCheckOtherReq(void)
{
USBCheckHIDRequest();
}/
/*******************************************************************
* Function:
void USBCBStdSetDscHandler(void)
*******************************************************************/
void USBCBStdSetDscHandler(void)
{
}
/*******************************************************************
* Function:
void USBCBInitEP(void)
*******************************************************************/
void USBCBInitEP(void)
89
{
USBEnableEndpoint(HID_EP,USB_IN_ENABLED|USB_OUT_ENABLED|USB_
HANDSHAKE_ENABLED|USB_DISALLOW_SETUP);
USBOutHandle = HIDRxPacket(HID_EP,(BYTE*)&ReceivedDataBuffer,64);
}
/*******************************************************************
*
* Function:
void USBCBSendResume(void)
*
void USBCBSendResume(void)
{
static WORD delay_count;
if(USBGetRemoteWakeupStatus() == TRUE)
{
//Verify that the USB bus is in fact suspended, before we send
//remote wakeup signalling.
if(USBIsBusSuspended() == TRUE)
{
USBMaskInterrupts();
//Clock switch to settings consistent with normal USB operation.
USBCBWakeFromSuspend();
USBSuspendControl = 0;
USBBusIsSuspended = FALSE; //So we don't execute this code again,
//until a new suspend condition is detected.
//Section 7.1.7.7 of the USB 2.0 specifications indicates a USB
//device must continuously see 5ms+ of idle on the bus, before it sends
//remote wakeup signalling. One way to be certain that this parameter
//gets met, is to add a 2ms+ blocking delay here (2ms plus at
//least 3ms from bus idle to USBIsBusSuspended() == TRUE, yeilds
//5ms+ total delay since start of idle).
delay_count = 3600U;
do
{
delay_count--;
}while(delay_count);
//Now drive the resume K-state signalling onto the USB bus.
USBResumeControl = 1;
// Start RESUME signaling
delay_count = 1800U;
// Set RESUME line for 1-13 ms
do
{
delay_count--;
}while(delay_count);
USBResumeControl = 0;
//Finished driving resume signalling
90
USBUnmaskInterrupts();
}
}
}
/*******************************************************************
* Function:
BOOL USER_USB_CALLBACK_EVENT_HANDLER(
*
USB_EVENT event, void *pdata, WORD size)
*******************************************************************/
BOOL USER_USB_CALLBACK_EVENT_HANDLER(USB_EVENT event, void
*pdata, WORD size)
{
switch(event)
{
case EVENT_TRANSFER:
//Add application specific callback task or callback function here if desired.
break;
case EVENT_SOF:
USBCB_SOF_Handler();
break;
case EVENT_SUSPEND:
USBCBSuspend();
break;
case EVENT_RESUME:
USBCBWakeFromSuspend();
break;
case EVENT_CONFIGURED:
USBCBInitEP();
break;
case EVENT_SET_DESCRIPTOR:
USBCBStdSetDscHandler();
break;
case EVENT_EP0_REQUEST:
USBCBCheckOtherReq();
break;
case EVENT_BUS_ERROR:
USBCBErrorHandler();
break;
case EVENT_TRANSFER_TERMINATED:
break;
default:
break;
}
return TRUE;
}
void delay(unsigned long data)
{
for(;data>0;data--);
91
}
/** EOF main.c *************************************************/
#endif
92
APPENDIX F
Coding of Software Interface
Form1:
Imports Microsoft.Win32.SafeHandles
Imports System.Runtime.InteropServices
Imports System.Threading
Imports System.Data.SqlClient
Public Class Form1
Dim DeviceIDToFind As String = "Vid_04d8&Pid_003f"
Const DIGCF_PRESENT As UInteger = &H2
Const DIGCF_DEVICEINTERFACE As UInteger = &H10
Const FILE_ATTRIBUTE_NORMAL As Short = &H80
Const INVALID_HANDLE_VALUE As Short = -1
Const GENERIC_READ As UInteger = &H80000000
Const GENERIC_WRITE As UInteger = &H40000000
Const CREATE_NEW As UInteger = &H1
Const CREATE_ALWAYS As UInteger = &H2
Const OPEN_EXISTING As UInteger = &H3
Const FILE_SHARE_READ As UInteger = &H1
Const FILE_SHARE_WRITE As UInteger = &H2
Const WM_DEVICECHANGE As UInteger = &H219
Const DBT_DEVICEARRIVAL As UInteger = &H8000
Const DBT_DEVICEREMOVEPENDING As UInteger = &H8003
Const DBT_DEVICEREMOVECOMPLETE As UInteger = &H8004
Const DBT_CONFIGCHANGED As UInteger = &H18
Const DBT_DEVTYP_DEVICEINTERFACE As UInteger = &H5
Const DEVICE_NOTIFY_WINDOW_HANDLE As UInteger = &H0
Const ERROR_SUCCESS As UInteger = &H0
Const ERROR_NO_MORE_ITEMS As UInteger = &H103
Const SPDRP_HARDWAREID As UInteger = &H1
Structure SP_DEVICE_INTERFACE_DATA
Dim cbSize As UInteger
Dim InterfaceClassGuid As Guid
Dim Flags As UInteger
Dim Reserved As IntPtr
End Structure
93
Structure SP_DEVICE_INTERFACE_DETAIL_DATA
Dim cbSize As UInteger
Dim DevicePath() As Char
End Structure
Structure SP_DEVINFO_DATA
Dim cbSize As UInteger
Dim ClassGuid As Guid
Dim DevInst As UInteger
Dim Reserved As IntPtr
End Structure
Structure DEV_BROADCAST_DEVICEINTERFACE
Dim dbcc_size As UInteger
Dim dbcc_devicetype As UInteger
Dim dbcc_reserved As UInteger
Dim dbcc_classguid As Guid
Dim dbcc_name() As Char
End Structure
<DllImport("setupapi.dll", CharSet:=CharSet.Unicode, SetLastError:=True)> _
Public Shared Function SetupDiGetClassDevs(ByRef ClassGuid As Guid, ByVal
Enumerator As IntPtr, ByVal hwndParent As IntPtr, ByVal Flags As UInteger) As
IntPtr
End Function
<DllImport("setupapi.dll", CharSet:=CharSet.Unicode, SetLastError:=True)> _
Public Shared Function SetupDiEnumDeviceInterfaces(ByVal DeviceInfoSet As
IntPtr, ByVal DeviceInfoData As IntPtr, ByRef InterfaceClassGuid As Guid, ByVal
MemberIndex As UInteger, ByRef DeviceInterfaceData As
SP_DEVICE_INTERFACE_DATA) As Boolean
End Function
<DllImport("setupapi.dll", CharSet:=CharSet.Unicode, SetLastError:=True)> _
Public Shared Function SetupDiDestroyDeviceInfoList(ByVal DeviceInfoSet As
IntPtr) As Boolean
End Function
<DllImport("setupapi.dll", CharSet:=CharSet.Unicode, SetLastError:=True)> _
Public Shared Function SetupDiEnumDeviceInfo(ByVal DeviceInfoSet As IntPtr,
ByVal MemberIndex As UInteger, ByRef DeviceInterfaceData As
SP_DEVINFO_DATA) As Boolean
End Function
<DllImport("setupapi.dll", CharSet:=CharSet.Unicode, SetLastError:=True)> _
Public Shared Function SetupDiGetDeviceRegistryProperty( _
ByVal DeviceInfoSet As IntPtr, _
ByRef DeviceInfoData As SP_DEVINFO_DATA, _
ByVal dwProperty As UInteger, _
94
ByRef PropertyRegDataType As UInteger, _
ByVal PropertyBuffer As IntPtr, _
ByVal PropertyBufferSize As UInteger, _
ByRef RequiredSize As UInteger) As Boolean
End Function
<DllImport("setupapi.dll", CharSet:=CharSet.Unicode, SetLastError:=True)> _
Public Shared Function SetupDiGetDeviceInterfaceDetail( _
ByVal DeviceInfoSet As IntPtr, _
ByRef DeviceInterfaceData As SP_DEVICE_INTERFACE_DATA, _
ByVal DeviceInterfaceDetailData As IntPtr, _
ByVal DeviceInterfaceDetailDataSize As UInteger, _
ByRef RequiredSize As UInteger, _
ByVal DeviceInfoData As IntPtr) As Boolean
End Function
<DllImport("setupapi.dll", CharSet:=CharSet.Unicode, SetLastError:=True)> _
Public Shared Function SetupDiGetDeviceInterfaceDetail( _
ByVal DeviceInfoSet As IntPtr, _
ByRef DeviceInterfaceData As SP_DEVICE_INTERFACE_DATA, _
ByVal DeviceInterfaceDetailData As IntPtr, _
ByVal DeviceInterfaceDetailDataSize As UInteger, _
ByVal RequiredSize As IntPtr, _
ByVal DeviceInfoData As IntPtr) As Boolean
End Function
<DllImport("user32.dll", CharSet:=CharSet.Unicode, SetLastError:=True)> _
Public Shared Function RegisterDeviceNotification( _
ByVal hRecipient As IntPtr, _
ByVal NotificationFilter As IntPtr, _
ByVal Flags As UInteger) As IntPtr
End Function
<DllImport("kernel32.dll", CharSet:=CharSet.Unicode, SetLastError:=True)> _
Public Shared Function CreateFile( _
ByVal FileName As String, _
ByVal dwDesiredAccess As UInteger, _
ByVal dwShareMode As UInteger, _
ByVal lpSecurityAttributes As IntPtr, _
ByVal dwCreationDisposition As UInteger, _
ByVal dwFlagsAndAttributes As UInteger, _
ByVal hTemplateFile As IntPtr) As SafeFileHandle
End Function
<DllImport("kernel32.dll", CharSet:=CharSet.Unicode, SetLastError:=True)> _
Public Shared Function WriteFile( _
ByVal hFile As SafeFileHandle, _
ByVal Buffer As Byte(), _
ByVal nNumberOfBytesToWrite As UInteger, _
ByRef lpNumberOfBytesWritten As UInteger, _
95
ByVal lpOverlapped As IntPtr) As Boolean
End Function
<DllImport("kernel32.dll", CharSet:=CharSet.Unicode, SetLastError:=True)> _
Public Shared Function ReadFile( _
ByVal hFile As SafeFileHandle, _
ByVal lpBuffer As IntPtr, _
ByVal nNumberOfBytesToWrite As UInteger, _
ByRef lpNumberOfBytesRead As UInteger, _
ByVal lpOverlapped As IntPtr) As Boolean
End Function
Dim InterfaceClassGuid As New Guid("4D1E55B2-F16F-11CF-88CB001111000030")
Dim AttachedState As Boolean =
Dim AttachedButBroken As Boolean = False
Dim DetailedInterfaceDataStructure As New
SP_DEVICE_INTERFACE_DETAIL_DATA
Dim ReadHandleToUSBDevice As SafeFileHandle
Dim WriteHandleToUSBDevice As SafeFileHandle
Dim DevicePath As String
Dim ADCValue As Integer = 0
Dim Mytime As Double
Dim MyMiliseconds As Double
Dim Mytime2 As Double
Dim MyMiliseconds2 As Double
Dim index As Integer
Dim voltageValue As Double
Dim num As Integer
Dim voltageID As Integer
Dim currentID As Integer
Dim powerID As integer
Dim idcounter As Integer
Dim idcounterCurr As Integer
Dim idcounterPow As Integer
Dim randomTime As Double
Dim randomValue As Double
Dim ispause As Integer
Dim MyMilisecondsA As Double
Dim MyMilisecondsB As Double
Dim intloop As Integer
'current array
96
Dim currentValue(10000000) As Double
Dim currentMiliSecond1(10000000) As Double
Dim currentMiliSecond2(10000000) As Double
Dim CurrentArrindex As Integer
'voltage array
Dim voltagearrValue(10000000) As Double
Dim voltagearrMilisecond1(10000000) As Double
Dim voltagearrMilisecond2(10000000) As Double
Dim voltageArrindex As Integer
'power array
Dim powerarrValue(10000000) As Double
Dim powerarrMilisecond1(10000000) As Double
Dim powerarrMilisecond2(10000000) As Double
Dim powerArrindex As Integer
Dim voltarrayIndex As Integer
Dim currarrayIndex As Integer
Dim highestvoltage As Double
Dim highestvoltageTime As Double
Dim highestcurrentTime As Double
Dim highestcurrent As Double
Dim startTime As DateTime
Dim startTime2 As DateTime
Dim powerFactor As Double
Dim radian As Double
Dim powerValue As Double
Dim isTimerReset As Integer
'//FUNCTION:
Form1_Load()
Private Sub Form1_Load(ByVal sender As Object, ByVal e As System.EventArgs)
Handles Me.Load
Me.PowerProfileTableAdapter.Fill(Me.Database1DataSet.powerProfile)
Me.CurrentProfileTableAdapter.Fill(Me.Database1DataSet.currentProfile)
Me.VoltageProfileTableAdapter.Fill(Me.Database1DataSet.voltageProfile)
idcounter = Me.Database1DataSet.voltageProfile.Count()
idcounterCurr = Me.Database1DataSet.currentProfile.Count()
idcounterPow = Me.Database1DataSet.powerProfile.Count()
highestvoltage = 0
voltageID = idcounter
currentID = idcounterCurr
powerID = idcounterPow
97
Dim DeviceBroadcastHeader As New
DEV_BROADCAST_DEVICEINTERFACE
DeviceBroadcastHeader.dbcc_devicetype =
DBT_DEVTYP_DEVICEINTERFACE
DeviceBroadcastHeader.dbcc_size = Marshal.SizeOf(DeviceBroadcastHeader)
DeviceBroadcastHeader.dbcc_reserved = 0 '//Reserved says not to use...
DeviceBroadcastHeader.dbcc_classguid = InterfaceClassGuid
Dim pDeviceBroadcastHeader As IntPtr = IntPtr.Zero '
pDeviceBroadcastHeader =
Marshal.AllocHGlobal(Marshal.SizeOf(DeviceBroadcastHeader
Marshal.StructureToPtr(DeviceBroadcastHeader, pDeviceBroadcastHeader, False)
RegisterDeviceNotification(Me.Handle, pDeviceBroadcastHeader,
DEVICE_NOTIFY_WINDOW_HANDLE)
Marshal.FreeHGlobal(pDeviceBroadcastHeader)
If CheckIfPresentAndGetUSBDevicePath() Then
Dim ErrorStatusWrite As UInteger
Dim ErrorStatusRead As UInteger
WriteHandleToUSBDevice = CreateFile(DevicePath, GENERIC_WRITE,
FILE_SHARE_READ Or FILE_SHARE_WRITE, IntPtr.Zero, OPEN_EXISTING,
0, IntPtr.Zero)
ErrorStatusWrite = Marshal.GetLastWin32Error()
ReadHandleToUSBDevice = CreateFile(DevicePath, GENERIC_READ,
FILE_SHARE_READ Or FILE_SHARE_WRITE, IntPtr.Zero, OPEN_EXISTING,
0, IntPtr.Zero)
ErrorStatusRead = Marshal.GetLastWin32Error()
If (ErrorStatusWrite = ERROR_SUCCESS) And (ErrorStatusRead =
ERROR_SUCCESS) Then
AttachedState = True
AttachedButBroken = False
StatusBox_txtbx.Text = "Device Found, AttachedState = TRUE"
Else
AttachedState = False
AttachedButBroken = True
If ErrorStatusWrite = ERROR_SUCCESS Then
WriteHandleToUSBDevice.Close()
End If
If ErrorStatusRead = ERROR_SUCCESS Then
ReadHandleToUSBDevice.Close()
End If
End If
Else
AttachedState = False
98
AttachedButBroken = False
End If
If AttachedState = True Then
StatusBox_txtbx.Text = "Device Found, AttachedState = TRUE"
Else
StatusBox_txtbx.Text = "Device not found, verify connect/correct firmware"
End If
ReadWriteThread.RunWorkerAsync()
End Sub
'//FUNCTION:
WndProc()
Protected Overrides Sub WndProc(ByRef m As System.Windows.Forms.Message)
If m.Msg = WM_DEVICECHANGE Then
If ((m.WParam = DBT_DEVICEARRIVAL) Or (m.WParam =
DBT_DEVICEREMOVEPENDING) Or (m.WParam =
DBT_DEVICEREMOVECOMPLETE) Or (m.WParam =
DBT_CONFIGCHANGED)) Then
If CheckIfPresentAndGetUSBDevicePath() = True
If ((AttachedState = False) Or (AttachedButBroken = True)) Then
Dim ErrorStatusRead As UInteger
Dim ErrorStatusWrite As UInteger
WriteHandleToUSBDevice = CreateFile(DevicePath,
GENERIC_WRITE, FILE_SHARE_READ Or FILE_SHARE_WRITE, IntPtr.Zero,
OPEN_EXISTING, 0, IntPtr.Zero)
ErrorStatusWrite = Marshal.GetLastWin32Error()
ReadHandleToUSBDevice = CreateFile(DevicePath,
GENERIC_READ, FILE_SHARE_READ Or FILE_SHARE_WRITE, IntPtr.Zero,
OPEN_EXISTING, 0, IntPtr.Zero)
ErrorStatusRead = Marshal.GetLastWin32Error()
If ((ErrorStatusWrite = ERROR_SUCCESS) And (ErrorStatusRead =
ERROR_SUCCESS)) Then
AttachedState =
AttachedButBroken = False
StatusBox_txtbx.Text = "Device Found, AttachedState = TRUE"
Else
AttachedState = False
AttachedButBroken = True
If ErrorStatusWrite = ERROR_SUCCESS Then
WriteHandleToUSBDevice.Close()
End If
99
If ErrorStatusRead = ERROR_SUCCESS Then
ReadHandleToUSBDevice.Close()
End If
End If
End If
Else
If AttachedState = True Then
AttachedState = False
WriteHandleToUSBDevice.Close()
ReadHandleToUSBDevice.Close()
End If
AttachedState = False
AttachedButBroken = False
End If
End If
End If
MyBase.WndProc(m)
End Sub
'//FUNCTION: CheckIfPresentAndGetUSBDevicePath()
Private Function CheckIfPresentAndGetUSBDevicePath() As Boolean
Try
Dim DeviceInfoTable As IntPtr = IntPtr.Zero
Dim InterfaceDataStructure As New SP_DEVICE_INTERFACE_DATA()
Dim DetailedInterfaceDataStructure As New
SP_DEVICE_INTERFACE_DETAIL_DATA()
Dim DevInfoData As New SP_DEVINFO_DATA()
Dim InterfaceIndex As UInteger = 0
Dim dwRegType As UInteger = 0
Dim dwRegSize As UInteger = 0
Dim dwRegSize2 As UInteger = 0
Dim StructureSize As UInteger = 0
Dim PropertyValueBuffer As IntPtr = IntPtr.Zero
Dim MatchFound As Boolean = False
Dim ErrorStatus As UInteger = 0
Dim LoopCounter As UInteger = 0
Dim DeviceIDToFind As String = "Vid_04d8&Pid_003f"
DeviceInfoTable = SetupDiGetClassDevs(InterfaceClassGuid, IntPtr.Zero,
IntPtr.Zero, DIGCF_PRESENT Or DIGCF_DEVICEINTERFACE)
If DeviceInfoTable <> IntPtr.Zero Then
While True
InterfaceDataStructure.cbSize = Marshal.SizeOf(InterfaceDataStructure)
100
If SetupDiEnumDeviceInterfaces(DeviceInfoTable, IntPtr.Zero,
InterfaceClassGuid, InterfaceIndex, InterfaceDataStructure) Then
ErrorStatus = Marshal.GetLastWin32Error()
If ErrorStatus = ERROR_NO_MORE_ITEMS
SetupDiDestroyDeviceInfoList(DeviceInfoTable
Return False
End If
DevInfoData.cbSize = Marshal.SizeOf(DevInfoData)
SetupDiEnumDeviceInfo(DeviceInfoTable, InterfaceIndex,
DevInfoData)
SetupDiGetDeviceRegistryProperty(DeviceInfoTable, DevInfoData,
SPDRP_HARDWAREID, dwRegType, IntPtr.Zero, 0, dwRegSize)
PropertyValueBuffer = Marshal.AllocHGlobal(CType(dwRegSize,
IntPtr))
SetupDiGetDeviceRegistryProperty(DeviceInfoTable, DevInfoData,
SPDRP_HARDWAREID, dwRegType, PropertyValueBuffer, dwRegSize,
dwRegSize2)
ErrorStatus = Marshal.GetLastWin32Error()
Dim DeviceIDFromRegistry As String
DeviceIDFromRegistry =
Marshal.PtrToStringUni(PropertyValueBuffer)
Marshal.FreeHGlobal(PropertyValueBuffer
DeviceIDFromRegistry = DeviceIDFromRegistry.ToLowerInvariant()
DeviceIDToFind = DeviceIDToFind.ToLowerInvariant()
MatchFound = DeviceIDFromRegistry.Contains(DeviceIDToFind)
If MatchFound Then
DetailedInterfaceDataStructure.cbSize =
Marshal.SizeOf(DetailedInterfaceDataStructure)
SetupDiGetDeviceInterfaceDetail(DeviceInfoTable,
InterfaceDataStructure, IntPtr.Zero, 0, StructureSize, IntPtr.Zero)
Dim pUnmanagedDetailedInterfaceDataStructure As IntPtr =
IntPtr.Zero .
pUnmanagedDetailedInterfaceDataStructure =
Marshal.AllocHGlobal(CType(StructureSize, IntPtr
DetailedInterfaceDataStructure.cbSize =
Marshal.StructureToPtr(DetailedInterfaceDataStructure,
pUnmanagedDetailedInterfaceDataStructure, False)
101
If SetupDiGetDeviceInterfaceDetail(DeviceInfoTable,
InterfaceDataStructure, pUnmanagedDetailedInterfaceDataStructure, StructureSize,
IntPtr.Zero, IntPtr.Zero) Then
Dim pToDevicePath As IntPtr
pToDevicePath =
pUnmanagedDetailedInterfaceDataStructure.ToInt32() +
DevicePath = Marshal.PtrToStringUni(pToDevicePath)
SetupDiDestroyDeviceInfoList(DeviceInfoTable)
Marshal.FreeHGlobal(pUnmanagedDetailedInterfaceDataStructure
Return True
Else
Dim ErrorCode As UInteger = Marshal.GetLastWin32Error()
SetupDiDestroyDeviceInfoList(DeviceInfoTable
Marshal.FreeHGlobal(pUnmanagedDetailedInterfaceDataStructure)
Return False
End If
End If
InterfaceIndex = InterfaceIndex + 1
LoopCounter = LoopCounter + 1
If LoopCounter = 10000000
Return False
End If
Else
ErrorStatus = Marshal.GetLastWin32Error()
SetupDiDestroyDeviceInfoList(DeviceInfoTable
Return False
End If
End While
End If
Return False
Catch ex As Exception
Return False
End Try
End Function
'//FUNCTION:
FormUpdateTimer_Tick()
Private Sub FormUpdateTimer_Tick(ByVal sender As System.Object, ByVal e As
System.EventArgs) Handles FormUpdateTimer.Tick
102
If AttachedState = True Then
StatusBox_txtbx.Text = "Device Found: AttachedState = TRUE"
End If
If (AttachedState = False) Or (AttachedButBroken = True) Then
StatusBox_txtbx.Text = "Device Not Detected: Verify Connection/Correct
Firmware"
ADCValue = 0
End If
If (ispause = 0) Then
voltagetxtbox.Text = ADCValue
End If
End Sub
'//FUNCTION:
ReadWriteThread_DoWork()
Private Sub ReadWriteThread_DoWork(ByVal sender As System.Object, ByVal e
As System.ComponentModel.DoWorkEventArgs) Handles
ReadWriteThread.DoWork
Dim OUTBuffer(65) As
Dim INBuffer(65) As
Dim BytesWritten As UInteger = 0
Dim BytesRead As UInteger = 0
Dim ErrorStatus As UInteger
While True
Try
If AttachedState = True Then
103
OUTBuffer(0) = 0 '//The first byte is the "Report ID" and does not get
sent over the USB bus, unless the HID report descriptor uses Report IDs. Assume
the HID report descriptor does not, then always set this byte to 0
OUTBuffer(1) = &H37 '//READ_POT command (see the firmware
source code), gets 10-bit ADC Value
'//Initialize the rest of the 64-byte packet to "0xFF". Binary '1' bits do
not use as much power, and do not cause as much EMI
'//when they move across the USB cable. USB traffic is "NRZI"
encoded, where '1' bits do not cause the D+/D- signals to toggle states.
'//This initialization is not strictly necessary however.
For i As Integer = 2 To 65
OUTBuffer(i) = &HFF
Next
'//To get the ADCValue, first, we send a packet with our "READ_POT"
command in it.
If WriteFile(WriteHandleToUSBDevice, OUTBuffer, 65, BytesWritten,
IntPtr.Zero) Then
INBuffer(0) = 0
'//Now get the response packet from the firmware.
If ReadFileManagedBuffer(ReadHandleToUSBDevice, INBuffer, 65,
BytesRead, IntPtr.Zero) Then
'//INBuffer[0] is the report ID, which we don't care about.
'//INBuffer[1] is an echo back of the command (see microcontroller
firmware).
'//INBuffer[2] and INBuffer[3] contains the ADC value (see
microcontroller firmware).
If INBuffer(1) = &H37 Then
ADCValue = (CType(INBuffer(3), UInteger) << 8) + INBuffer(2)
'//Need to reformat the data from two unsigned chars into one unsigned int.
End If
End If
Else
ErrorStatus = Marshal.GetLastWin32Error()
End If
End If
Catch ex As Exception
'//Exceptions can occur during the read or write operations. For example,
'//exceptions may occur if for instance the USB device is physically
unplugged
'//from the host while the above read/write functions are executing.
'//Don't need to do anything special in this case. The application will
automatically
104
'//re-establish communications based on the global AttachedState boolean
variable used
'//in conjunction with the WM_DEVICECHANGE messages to
dyanmically respond to Plug and Play
'//USB connection events.
End Try
End While
End Sub
'//FUNCTION: ReadFileManagedBuffer()
Private Function ReadFileManagedBuffer(ByVal hFile As SafeFileHandle, ByRef
INBuffer() As Byte, ByVal nNumberOfBytesToRead As UInteger, ByRef
lpNumberOfBytesRead As UInteger, ByVal lpOverlapped As IntPtr) As Boolean
Dim pINBuffer As IntPtr = IntPtr.Zero
Try
pINBuffer = Marshal.AllocHGlobal(CType(nNumberOfBytesToRead,
Integer))
'//Allocate some unmanged RAM for the receive data buffer.
If ReadFile(hFile, pINBuffer, nNumberOfBytesToRead,
lpNumberOfBytesRead, lpOverlapped) Then
Marshal.Copy(pINBuffer, INBuffer, 0, lpNumberOfBytesRead) '//Copy
over the data from unmanged memory into the managed byte[] INBuffer
Marshal.FreeHGlobal(pINBuffer)
Return True
Else
Marshal.FreeHGlobal(pINBuffer)
Return False
End If
Catch ex As Exception
If pINBuffer <> IntPtr.Zero Then
Marshal.FreeHGlobal(pINBuffer)
Return False
End If
End Try
End Function
105
Private Sub progressBar1_Click(ByVal sender As System.Object, ByVal e As
System.EventArgs)
End Sub
Private Sub Label1_Click(ByVal sender As System.Object, ByVal e As
System.EventArgs)
End Sub
Private Sub StatusBox_lbl_Click(ByVal sender As System.Object, ByVal e As
System.EventArgs) Handles StatusBox_lbl.Click
End Sub
Private Sub VoltageProfileBindingNavigatorSaveItem_Click(ByVal sender As
System.Object, ByVal e As System.EventArgs) Handles
VoltageProfileBindingNavigatorSaveItem.Click
Me.Validate()
Me.VoltageProfileBindingSource.EndEdit()
Me.TableAdapterManager.UpdateAll(Me.Database1DataSet)
End Sub
Private Sub Timer1_Tick(ByVal sender As System.Object, ByVal e As
System.EventArgs) Handles Timer1.Tick
Dim span As TimeSpan = DateTime.Now.Subtract(startTime)
Label1.Text = span.Minutes.ToString & ":" & _
span.Seconds.ToString & "." & span.Milliseconds
Mytime = span.TotalMilliseconds
MyMiliseconds = Mytime / 1000
End Sub
Private Sub voltagetxtbox_TextChanged(ByVal sender As System.Object, ByVal
e As System.EventArgs) Handles voltagetxtbox.TextChanged
powerID = powerID + 1
If (voltagetxtbox.Text < 1024) Then
voltageID = voltageID + 1
volttextbox.Text = ((((voltagetxtbox.Text / 1024 * 5)) / 200 / 2.5 * 39000) /
System.Math.Sqrt(2)) * 1.1
voltageValue = volttextbox.Text
If (voltageValue > highestvoltage) Then
highestvoltage = voltageValue
106
highestvoltageTime = MyMiliseconds2
End If
voltagetime.Text = highestvoltageTime
highestVoltageTxt.Text = highestvoltage
voltagearrValue(voltageArrindex) = voltageValue
voltagearrMilisecond1(voltageArrindex) = MyMiliseconds
voltagearrMilisecond2(voltageArrindex) = MyMiliseconds2
voltageArrindex = voltageArrindex + 1
Else
currentID = currentID + 1
currtextbox.Text = (((voltagetxtbox.Text - 1024) / 1024 * 5 / 150 * 500) /
System.Math.Sqrt(2)) * 1.1
voltageValue = currtextbox.Text
If (voltageValue > highestcurrent) Then
highestcurrent = voltageValue
highestcurrentTime = MyMiliseconds2
End If
highestCurrenttxt.Text = highestcurrent
currentTimetext.Text = highestcurrentTime
currentValue(CurrentArrindex) = voltageValue
currentMiliSecond1(CurrentArrindex) = MyMiliseconds 'normal time
currentMiliSecond2(CurrentArrindex) = MyMiliseconds2 ' graph time
CurrentArrindex = CurrentArrindex + 1
End If
powerarrValue(powerArrindex) = powerValue
powerarrMilisecond1(powerArrindex) = MyMiliseconds
powerarrMilisecond2(powerArrindex) = MyMiliseconds2
powerArrindex = powerArrindex + 1
timetext.Text = MyMiliseconds
End Sub
107
Private Sub Button2_Click(ByVal sender As System.Object, ByVal e As
System.EventArgs) Handles Button2.Click
idcounter = Me.Database1DataSet.voltageProfile.Count()
idcounterCurr = Me.Database1DataSet.currentProfile.Count()
idcounterPow = Me.Database1DataSet.powerProfile.Count()
'voltage delete
For intloopIndex As Integer = 0 To idcounter
Me.VoltageProfileTableAdapter.Delete(intloopIndex)
Next intloopIndex
'current delete
For intloop As Integer = 0 To idcounterCurr
Me.CurrentProfileTableAdapter.Delete(intloop)
Next intloop
For intloopPower As Integer = 0 To idcounterPow
Me.PowerProfileTableAdapter.Delete(intloopPower)
Next intloopPower
'fill the data to data grid view
Me.VoltageProfileTableAdapter.Fill(Me.Database1DataSet.voltageProfile)
Me.CurrentProfileTableAdapter.Fill(Me.Database1DataSet.currentProfile)
Me.PowerProfileTableAdapter.Fill(Me.Database1DataSet.powerProfile)
'reset id
voltageID = 0
currentID = 0
powerID = 0
highestcurrent = 0
highestvoltage = 0
Array.Clear(voltagearrValue, 0, voltageArrindex)
Array.Clear(voltagearrMilisecond1, 0, voltageArrindex)
Array.Clear(voltagearrMilisecond2, 0, voltageArrindex)
Array.Clear(currentValue, 0, CurrentArrindex)
Array.Clear(currentMiliSecond1, 0, CurrentArrindex)
Array.Clear(currentMiliSecond2, 0, CurrentArrindex)
Array.Clear(powerarrValue, 0, powerArrindex)
Array.Clear(powerarrMilisecond2, 0, powerArrindex)
voltageArrindex = 0
108
powerArrindex = 0
CurrentArrindex = 0
End Sub
Private Sub PictureBox1_Click(ByVal sender As System.Object, ByVal e As
System.EventArgs) Handles PictureBox1.Click
Form2.Show()
End Sub
Private Sub PictureBox2_Click(ByVal sender As System.Object, ByVal e As
System.EventArgs) Handles PictureBox2.Click
Form3.Show()
End Sub
Private Sub Button3_Click(ByVal sender As System.Object, ByVal e As
System.EventArgs) Handles Button3.Click
If (Timer2.Enabled) Then
Button3.Text = "Restart"
ispause = 1
Timer1.Stop()
Timer2.Stop()
Else
startTime = DateTime.Now()
startTime2 = DateTime.Now()
Me.Text = "Click to Stop"
Button3.Text = "Stop"
ispause = 0
Timer1.Start()
Timer2.Start()
End If
End Sub
Private Sub CurrentTextBox_TextChanged(ByVal sender As System.Object,
ByVal e As System.EventArgs) Handles CurrentTextBox.TextChanged
End Sub
Private Sub VoltageTextBox_TextChanged(ByVal sender As System.Object,
ByVal e As System.EventArgs) Handles VoltageTextBox.TextChanged
109
End Sub
Private Sub Stopwatch_Load(ByVal sender As System.Object, ByVal e As
System.EventArgs) Handles MyBase.Load
startTime = DateTime.Now()
startTime2 = DateTime.Now()
Timer1.Start()
Timer2.Start()
End Sub
Private Sub highestVoltageTxt_TextChanged(ByVal sender As System.Object,
ByVal e As System.EventArgs) Handles highestVoltageTxt.TextChanged
Dim radian As Double
radian = (highestcurrentTime - highestvoltageTime) / 0.02 * 360 * Math.PI /
180
powerFactor = System.Math.Cos(radian)
powerFactortxt.text = powerFactor
End Sub
Private Sub highestCurrenttxt_TextChanged(ByVal sender As System.Object,
ByVal e As System.EventArgs) Handles highestCurrenttxt.TextChanged
Dim radian As Double
radian = (highestcurrentTime - highestvoltageTime) / 0.02 * 360 * Math.PI /
180
powerFactor = System.Math.Cos(radian)
powerFactortxt.Text = powerFactor
End Sub
Private Sub powerFactortxt_TextChanged(ByVal sender As System.Object,
ByVal e As System.EventArgs) Handles powerFactortxt.TextChanged
powerValue = highestvoltage * highestcurrent * powerFactor
powerText.Text = powerValue
End Sub
Private Sub Timer2_Tick(ByVal sender As System.Object, ByVal e As
System.EventArgs) Handles Timer2.Tick
Dim span2 As TimeSpan = DateTime.Now.Subtract(startTime2)
Label2.Text = span2.Minutes.ToString & ":" & _
span2.Seconds.ToString & "." & span2.Milliseconds
Mytime2 = span2.TotalMilliseconds
MyMiliseconds2 = Mytime2 / 1000
110
End Sub
Private Sub PictureBox3_Click(ByVal sender As System.Object, ByVal e As
System.EventArgs) Handles PictureBox3.Click
Form4.Show()
End Sub
Private Sub Button1_Click(ByVal sender As System.Object, ByVal e As
System.EventArgs) Handles Button1.Click
ispause = 1
'################################################################
'##########################voltage insert value
########################
'################################################################
For intloopInsertvolt As Integer = 0 To voltageArrindex + 1
If (voltagearrMilisecond2(intloopInsertvolt) > 0) Then
Me.VoltageProfileTableAdapter.Insert(intloopInsertvolt,
voltagearrMilisecond1(intloopInsertvolt), voltagearrValue(intloopInsertvolt),
voltagearrMilisecond2(intloopInsertvolt))
End If
If (powerarrMilisecond2(intloopInsertvolt) > 0) Then
Me.PowerProfileTableAdapter.Insert(intloopInsertvolt,
powerarrMilisecond1(intloopInsertvolt), powerarrValue(intloopInsertvolt))
End If
If (currentMiliSecond2(intloopInsertvolt) > 0) Then
Me.CurrentProfileTableAdapter.Insert(intloopInsertvolt,
currentMiliSecond1(intloopInsertvolt), currentValue(intloopInsertvolt),
currentMiliSecond2(intloopInsertvolt))
End If
Next intloopInsertvolt
'fill the data to data grid view
Me.VoltageProfileTableAdapter.Fill(Me.Database1DataSet.voltageProfile)
Me.CurrentProfileTableAdapter.Fill(Me.Database1DataSet.currentProfile)
Me.PowerProfileTableAdapter.Fill(Me.Database1DataSet.powerProfile)
MessageBox.Show("Insert finish")
End Sub
End Class
111
Form2:
Imports System.Data
Imports System.Data.SqlClient
Imports System.Windows.Forms.DataVisualization.Charting
Public Class Form2
Private Sub Form2_Load(ByVal sender As System.Object, ByVal e As
System.EventArgs) Handles MyBase.Load
'TODO: This line of code loads data into the 'Database1DataSet.voltageProfile'
table. You can move, or remove it, as needed.
Me.VoltageProfileTableAdapter.Fill(Me.Database1DataSet.voltageProfile)
Dim random As New Random()
Dim ChartArea1 As ChartArea = New ChartArea()
Dim Legend1 As Legend = New Legend()
Dim Series1 As Series = New Series()
Dim Chart1 = New Chart()
Me.Controls.Add(Chart1)
ChartArea1.Name = "ChartArea1"
Chart1.ChartAreas.Add(ChartArea1)
Legend1.Name = "Legend1"
Chart1.Legends.Add(Legend1)
Chart1.Location = New System.Drawing.Point(13, 13)
Chart1.Name = "Chart1"
Series1.ChartArea = "ChartArea1"
Series1.Legend = "Legend1"
Series1.Name = "Series1"
Series1.ChartType = SeriesChartType.Spline
Chart1.Series.Add(Series1)
Chart1.Size = New System.Drawing.Size(1000, 800)
'Chart1.TabIndex = 0
'Chart1.Text = "Chart1"
Chart1.Series("Series1").XValueMember = "timeGraph"
Chart1.Series("Series1").YValueMembers = "voltage"
Chart1.DataSource = Me.Database1DataSet.voltageProfile
End Sub
112
Private Sub VoltageProfileBindingNavigatorSaveItem_Click(ByVal sender As
System.Object, ByVal e As System.EventArgs) Handles
VoltageProfileBindingNavigatorSaveItem.Click
Me.Validate()
Me.VoltageProfileBindingSource.EndEdit()
Me.TableAdapterManager.UpdateAll(Me.Database1DataSet)
End Sub
End Class
Form 3:
Imports System.Data
Imports System.Data.SqlClient
Imports System.Windows.Forms.DataVisualization.Charting
Public Class Form3
Private Sub CurrentProfileBindingNavigatorSaveItem_Click(ByVal sender As
System.Object, ByVal e As System.EventArgs) Handles
CurrentProfileBindingNavigatorSaveItem.Click
Me.Validate()
Me.CurrentProfileBindingSource.EndEdit()
Me.TableAdapterManager.UpdateAll(Me.Database1DataSet)
End Sub
Private Sub Form3_Load(ByVal sender As System.Object, ByVal e As
System.EventArgs) Handles MyBase.Load
'TODO: This line of code loads data into the 'Database1DataSet.currentProfile'
table. You can move, or remove it, as needed.
Me.CurrentProfileTableAdapter.Fill(Me.Database1DataSet.currentProfile)
Dim random As New Random()
Dim ChartArea1 As ChartArea = New ChartArea()
Dim Legend1 As Legend = New Legend()
Dim Series1 As Series = New Series()
Dim Chart1 = New Chart()
Me.Controls.Add(Chart1)
ChartArea1.Name = "ChartArea1"
Chart1.ChartAreas.Add(ChartArea1)
113
Legend1.Name = "Legend1"
Chart1.Legends.Add(Legend1)
Chart1.Location = New System.Drawing.Point(13, 13)
Chart1.Name = "Chart1"
Series1.ChartArea = "ChartArea1"
Series1.Legend = "Legend1"
Series1.Name = "Series1"
Series1.ChartType = SeriesChartType.Spline
Chart1.Series.Add(Series1)
Chart1.Size = New System.Drawing.Size(1000, 800)
'Chart1.TabIndex = 0
'Chart1.Text = "Chart1"
Chart1.Series("Series1").XValueMember = "timeGraph"
Chart1.Series("Series1").YValueMembers = "current"
Chart1.DataSource = Me.Database1DataSet.currentProfile
End Sub
End Class
Form 4:
Imports System.Data
Imports System.Data.SqlClient
Imports System.Windows.Forms.DataVisualization.Charting
Public Class Form4
Private Sub Form4_Load(ByVal sender As System.Object, ByVal e As
System.EventArgs) Handles MyBase.Load
'TODO: This line of code loads data into the 'Database1DataSet.powerProfile'
table. You can move, or remove it, as needed.
Me.PowerProfileTableAdapter.Fill(Me.Database1DataSet.powerProfile)
Dim ChartArea1 As ChartArea = New ChartArea()
Dim Legend1 As Legend = New Legend()
Dim Series1 As Series = New Series()
Dim Chart1 = New Chart()
Me.Controls.Add(Chart1)
ChartArea1.Name = "ChartArea1"
Chart1.ChartAreas.Add(ChartArea1)
Legend1.Name = "Legend1"
114
Chart1.Legends.Add(Legend1)
Chart1.Location = New System.Drawing.Point(13, 13)
Chart1.Name = "Chart1"
Series1.ChartArea = "ChartArea1"
Series1.Legend = "Legend1"
Series1.Name = "Series1"
Series1.ChartType = SeriesChartType.Spline
Chart1.Series.Add(Series1)
Chart1.Size = New System.Drawing.Size(1000, 800)
'Chart1.TabIndex = 0
'Chart1.Text = "Chart1"
Chart1.Series("Series1").XValueMember = "time"
Chart1.Series("Series1").YValueMembers = "power"
Chart1.DataSource = Me.Database1DataSet.powerProfile
End Sub
Private Sub PowerProfileBindingNavigatorSaveItem_Click(ByVal sender As
System.Object, ByVal e As System.EventArgs) Handles
PowerProfileBindingNavigatorSaveItem.Click
Me.Validate()
Me.PowerProfileBindingSource.EndEdit()
Me.TableAdapterManager.UpdateAll(Me.Database1DataSet)
End Sub
End Class