1
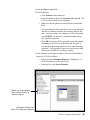
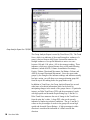
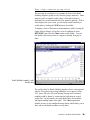
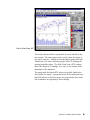
Section III. Top-Down Approach to Stock Selection Using AIQ's Group/Sector Capabilities In This Section TradingExpert provides the tools 54 View Market Log for sector rotation 54 Next: view Group Analysis Report for leading/lagging industry groups 57 Next step: examine group chart 59 Final step: stock selection 60 Section III: Top-Down Stock Selection 53 TradingExpert Pro provides the tools The majority of investors use a bottom-up approach to stock selection. They find particular stocks that interest them, possibly from a fundamental story or a mention in Investors Business Daily, and then proceed to analyze those stocks. A secondary consideration may be whether or not the stocks are in attractive industry groups. The original AIQ software only provided tools for bottom-up investing, with products limited to screening stocks and reporting those with high Expert Ratings. However, with the 1992 release of AIQs original TradingExpert, tools for top-down stock selection utilizing industry group and sector analysis were integrated into the software. Industry group analysis is based on the fact that all stocks in a particular industry tend to be in favor or out of favor at the same time. Since, very often, a bad stock in a good industry group outperforms a good stock in a bad industry group, knowing which groups are in and out of favor can be quite advantageous. The sector and group features contained in TradingExpert are designed to provide the user with the ability to follow industry groups and to determine which groups are currently moving in and out of favor. Then, with TradingExperts Explore feature, finding the best stocks to trade within the selected groups is a simple matter. With top-down stock selection, the initial screening step is not concerned with individual stocks but with industry sectors and groups (a sector is a set of groups). Although you may have 1500 stocks in your data base, you are only concerned with those stocks in the most attractive industry groups. TradingExpert provides analysis reports on industry groups that are helpful for investors who prefer to buy into a trend as well as for those who like to buy near the low. Lets look at an example. View Market Log for sector rotation The easiest method of spotting sector rotation is to follow the daily Sector Rotation report (In previous versions, this report was part of the Market Log Report). To display this report on your screen, follow these steps: 54 New Users Guide 1. Open the Reports application. 2. Do the following: Click Generate on the menu bar. From the submenu, choose the Generate All command. The Generate Reports dialog box will appear. Make sure that all options are selected in the section titled Daily. You can change the date in the Market box to any historical date that you want to examine (you must have data for this date). In order to follow the example we will be discussing, enter 01/28/98. On that date, a confirmed market timing buy signal was registered. Click OK and reports will be generated for the date entered. Depending on the size of your data base and the speed of your machine, generating reports can be a time-consuming procedure. Once generated, reports are stored on your hard disk and are available for viewing or printing. 3. In the left panel of the Reports window, select the Sector Rotation report for 01/28/98 as follows: Display the list of Summary Reports by clicking the + in the box located next to the report iicon. From this list, select Sector Rotation. Market Log Sector Rotation report selected from list of Summary Reports AIQ Reports Window with Select Date dialog box displayed Section III: Top-Down Stock Selection 55 Note Unlike all other reports where only the most currently generated report is stored, Market Log reports are stored for 15 days. The Select Date dialog box lists the dates available for viewing. The Select Date dialog box which appears lists the dates of the Market Log reports available for viewing. From this box, choose 01/28/98 and click OK. 4. You should see a report screen similar in style to the one displayed below. Sector Rotation Report for 01/28/98 The Sector Rotation report includes a graphical display of the bullishness/bearishness of each industry sector. This easy-to-read barometer, which is found in the two columns titled Bearish and Bullish, clearly shows which sectors are bullish and which are bearish. The barometer is based on the readings of several price and volume indicators. When all of these indicators are bullish for a particular 56 New Users Guide sector, 12 arrows are shown pointing in the bullish direction. The opposite is true when all indicators are bearish. When arrows appear in both columns, some indicators are bullish and others are bearish. Obviously, the strongest sectors are those with the most arrows in the bullish direction. The seven columns on the right contain information taken directly from the daily Sector Analysis Report. This information is helpful in identifying sectors that are ready to turn up or down. (For a detailed explanation of all data fields on this report, see Daily/Weekly Sector Reports in Chapter V of the User Manual.) The Sector Rotation report displayed, for the date January 28, 1998, lists the Standard & Poors industry sectors. Your report should be similar to the one displayed. On January 28, 1998, the Bullish/ Bearish barometer readings show the most strength in the Retailing sector. The majority of other sectors have bullish readings as well. Next: view Group Analysis Report for leading/lagging industry groups The next step in our process is to look at the daily Group Analysis Report, which shows leading/lagging industry groups. To display this report on your screen, do the following: 1. Open the Reports application. 2. If you have already generated the Market Log reports for the date 01/28/98, you can view the Group Analysis Report for this date by continuing with step 3. If you have not generated reports for the date 01/28/98, follow the instructions in step 2, page 49. 3. In the left panel of the Reports window, click Group Reports to see a list of available reports. Next, click the icon for Group Analysis. 4. The Group Analysis Report for 01/28/98 will appear in the right panes of the Report window. You should have on your screen a report similar to the one displayed on the next page. Even though you are tracking a data base of 500 or more stocks, this report enables you to concentrate your analysis on just those stocks in the top-rated groups. Looking for retailing groups, the Retailing (Building Supplies) group is rated twelth best (out of about 85 industry groups), followed by Retail-Food Chains. (You can also begin your top-down approach with the Group report rather than first examining the Sector Rotation). Section III: Top-Down Stock Selection 57 Group Analysis Report for 01/28/98 The Group Analysis Report is sorted by Trend Score (TS). The Trend Score, which is an indicator of the overall strength or weakness of a group, is derived from an AIQ Expert System that examines the strength/weakness of six special indicators to arrive at a score between -100 and +100, where +100 is the strongest reading. These indicators, which were selected because they are all trend-following indicators, include MACD, Volume Accumulation Percentage, Positive Volume, Directional Movement, On-Balance Volume, and ADX/R (Average Directional Movement). Since the report ranks groups by the strength of the indicator readings and indicators usually lead price action, you will often see a strong performing group fall from the top of the ranking before the group makes a top. In addition to Trend Score, the Group Analysis Report lists several other items of technical information which can be useful in anticipating changes in the trends of the groups shown. Of particular interest, are Delta Trend Score (DTS) and the percentage of stocks with high upside and downside Expert Ratings (up % and dn %). Delta Trend Score measures the rate of change in the Trend Score from the prior days value. A large DTS value can be an early indication of improving technical conditions. The up % and dn % values are the percentages of stocks in the group with recent high upside and downside Expert Ratings. A high percentage in either direction is considered an indication of a future trend in that direction. 58 New Users Guide Next step: examine group chart The next step in our analysis is to examine the chart of the Retail (Building Supplies) group to verify that the group is attractive. Some analysts prefer to examine weekly charts, which allows them to determine the overall trend and search for attractive patterns. With a chart displayed on your screen, you can easily switch from daily to weekly data by clicking the W/D button on the toolbar. To display a chart of Electronics (Semiconductors) while viewing the Group Analysis Report, all you have to do is highlight its ticker RETAILBU, then click the Chart button on the toolbar. You can also double click on any ticker in a report to instantly bring up its chart. Retail (Building Supplies), with weekly data The weekly chart for Retail (Building Supplies) shows a nice uptrend with the 28-week moving average tending to act as support. In late 1997, prices fell to the 28-week Moving Average and a resistance trendline could be drawn by connecting the high point on several weekly bars. In late January, the group broke above this trendline and began trending higher once again. (The Charts application includes an easy-to-use trendline drawing feature which allows you to draw and save multiple trendlines on any chart.) Section III: Top-Down Stock Selection 59 Final step: stock selection Reminder... More detailed information about TradingExpert Pro features and functions can be found in your User Manual or by clicking on the Help command buttons. Now that an attractive group within an attractive sector has been located, the final step in the top-down approach is stock selection. For this task, you can use TradingExperts Explore feature. Explore is a feature of the Charts application that takes advantage of the pyramid-like structure of the Group/Sector List. Explore is used to facilitate the work of viewing (or exploring) charts of the sectors, groups, and stocks that comprise this list. With Explore, you can quickly view charts of all of the stocks within a group without having to enter the names of any of the stocks. To examine the charts of all of the stocks within the Electronics (Semiconductors) group, proceed as follows: 1. Display a chart of Retail (Building Supplies) on your screen by: Double clicking on its ticker (RETAILBU) in the Group Analysis Report or Opening the Charts application, clicking on the Chart Ticker toolbar button, and entering the symbol RETAILBU in the Chart Ticker dialog box. 2. The List Box on the chart near the right end of the toolbar should display SP500, the name of the S&P 500 Group/Sector List. If the name of another list appears, change to SP500 before proceeding. 3. Notice the four arrows located to the left of the List Box. These are the Explore arrows Click on the down arrow. A chart of HD, the first of the three stocks that comprise the Retail (Building Supplies) group, should appear, replacing the group chart. 4. To view the next stock in the group, click on the right arrow. Repeat until you have examined all five stocks. Shown is a chart of Home Depot (HD), which is a member of the Retail (Building Supplies) group. In late-December, HD registered an ER Up 99 buy signal . This signal was not initially confirmed as the Phase indicator was decreasing. The signal was soon confirmed when the Phase indicator reversed direction and began to advance.. The confirmed Expert Rating up signal together with positive readings from indicators makes HD an excellent buy candidate. The top-down approach to stock selection, in this case, proved successful. 60 New Users Guide Chart of Home Depot (HD) The analysis discussed above is geared for investors who like to buy into strength. The same reports can be used by those who prefer to buy closer to the low. Instead of concentrating on groups with high Trend Score (TS) values, find those groups whose TS readings are gaining ground the fastest. The Delta Trend Score (DTS) column shows the change in TS readings. In a sense, it is a measure of the momentum of the indicators. The groups with the highest DTS values are typically found in the lower half of the report. A group that is low in the ranking but has a high DTS relative to the other groups is a group that has been weak but its indicators are beginning to show strength. Section III: Top-Down Stock Selection 61 62 New Users Guide