1
INTENSIVE COURSE ON SA/SD/RT
METHOD AND PROSA/SA CASE TOOL
TRAINING COURSE:
PROSA/SA/M-USE
(C) Copyright Insoft April 1998
All rights reserved.
Insoft Oy
P.O.BOX 9
FIN-90101 Oulu, FINLAND
Information in this document is subject to change without notice and does not represent a
commitment on the part of Insoft Oy. The software, which includes information in any
database, described in this document is furnished under a license agreement or
nondisclosure agreement and may be used or copied only in accordance with the terms of
the agreement. It is against the law to copy the software except as specifically allowed in
the license or nondisclosure agreement. No part of this manual may be reproduced or
transmitted in any form or by any means, electronic or mechanical, including
photocopying and recording, for any purpose, without written permission from Insoft Oy.
Insoft, Prosa, Prosa/om, Prosa/sa, Prosacpp, Prosac, Prosasql and Prosacdm are
trademarks of Insoft Oy.
All other brands, product names and company names mentioned in this document are
trademarks or registered trademarks of their respective holders.
(C) Copyright Insoft Oy 1986-1998. All rights reserved.
Document Number IPa10422003-98
PROSA/SA/M-USE Intensive course
1
INTENSIVE COURSE ON SA/SD/RT METHOD AND
PROSA/SA CASE TOOL
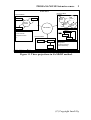
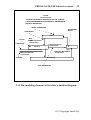
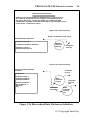
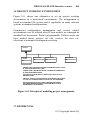
1. Structured Analysis and Design (SA/SD/RT) method
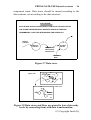
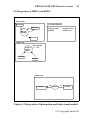
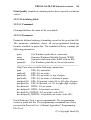
In SA/SD/RT the application system is modeled with three models
completing each others. The environment model consists of context
diagram and event list documents. The context diagram determines
the boundary between the application and its environment. The
event list presents externals events which the application system
must generate response to. The behavioural model consists of data
flow diagrams, state transition diagrams and minispecifications.
The functions of the application system are modeled with data flow
diagrams. Data flow diagrams are hierarchical modeling the
hierarchical decomposition of the application into functional
subunits. State transition diagrams model the control and timing of
the application. Minispecifications are used on the lowest hierarchy
level of the data flow diagrams to model the behaviour of
transformations. The information model uses ER diagrams to
define the data entities and their composition and relationships in
the application. All model information is stored in data dictionary.
Figure 1.1 presents the principle of SA/SD/RT method.
(C) Copyright Insoft Oy
PROSA/SA/M-USE Intensive course
INSOFT
2
SA/SD/RT Method
Behavioural Model
Functions
Environment Model
Supplier
User
DMS
Control
Manage
Orders
Manage
Deliveries
Manage
Purch.
Customer
Manage
Sales
APPLICATION
Control
Waiting
Event List
Order
E Man..
1. Order received ..
Orders
2. Shipment received ..
Information Model
3. ...
Sales
Customer
Order
Minispecification
Manage Sales
Item
Author Insoft Oy
Project
Status
Appr
Title
Vers
For pending customer
orders make delivery ..
Three projections in Structured Analysis
File safig.dfd
Date
Time
21-04-1998
15:29:43
Figure 1.1 Three projections in SA/SD/RT method.
(C) Copyright Insoft Oy
PROSA/SA/M-USE Intensive course
3
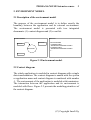
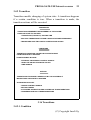
2. ENVIRONMENT MODEL
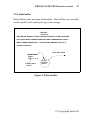
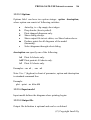
2.1 Description of the environment model
The purpose of the environment model is to define exactly the
boundary between the application and its external environment.
The environment model is presented with two integrated
documents: (1) context diagram and (2) event list.
CONTEXT DIAGRAM
EVENT LIST
Terminator
Terminator
APPLICATION NAME
1. EXTERNAL EVENT 1
* DESCRIPTION OF RESPONSE TO EVENT1
APPLICATION
2. EXTERNAL EVENT 2
* DESCRIPTION OF RESPONSE TO EVENT2
3. ...
Figure 2.1 Environment model.
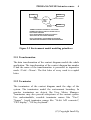
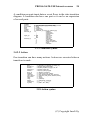
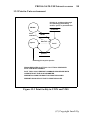
2.2 Context diagram
The whole application is modeled in context diagram with a single
data transformation. The context diagram is named with the system
or application name and context diagram is numbered with number
-1. The environment of the application is modeled with terminators.
The interaction between the application and its environment is
modeled with flows. Figure 2.2 presents the modeling primitives of
the context diagram.
(C) Copyright Insoft Oy
PROSA/SA/M-USE Intensive course
4
Track
Train
0
Train
Controls
Manage
Train
Traffic
Train Locations
Switch
Switch
Controls
TERMINATOR MARKS THE EDGE OF THE SYSTEM
TERMINATORS ARE ALLOWED TO APPEAR ONLY IN
THE CONTEXT DIAGRAM
DATA TRANSFORMATION MODELS THE WHOLE
APPLICATION IN THE CONTEXT DIAGRAM
DATA FLOWS MODEL THE INFORMATION EXCHANGE
AND MESSAGING BETWEEN SYSTEM AND ENVIRONMENT
Figure 2.2 Environment model modeling primitives.
2.2.1 Transformation
The data transformation of the context diagram models the whole
application. The transformation of the context diagram has number
0 and the name of the transformation is presented in imperative
mode <Verb> <Noun>. The first letter of every word is a capital
letter.
2.2.2 Terminator
The terminators of the context diagram mark the edge of the
system. The terminators model the environment boundary. In
practice terminators are objects like User, Motor, Manager.
Terminators may also present subsystems of the current system.
Use understandable, reusable terminator names like "User",
"Sensor". Avoid terminator names like "16-bit A/D converter",
"CRT display", "102 key keyboard".
(C) Copyright Insoft Oy
PROSA/SA/M-USE Intensive course
5
When selecting terminators it is very important to use general
purpose concepts in terminators and to group or package such
external objects with similar functionality into one terminator. So
e.g. User terminator can contain many kinds of users. Instead of
using terminators Robot1, Robot2, Robot3, ... one packaged
terminator Robot is much better.
2.2.3 Flows
Flow are used in the context diagram to present the information
flow between the system and its environment. The data flows are
named so that the name illustrates the contents of the information.
SA/SD/RT method supports several data flow types. Data flow
types have been presented in Section 5 Behavioural model.
The data flows appearing in the context diagram must have the
same abstraction level as the context diagram itself has. This
means that it is not according to good modeling practice to present
such low abstraction level data flows in the context diagram which
can be understood only by knowing already the whole application.
E.g. if you are modeling the interaction between "Customer"
terminator and "Deliver Products" transformation in the context
diagram, the whole interaction is normally modelled with one input
flow "Customer data" and one output flow "Delivery data". The
detailed data flow contents is defined in Data Dictionary (See
Section ? Behavioural model) when the modeling proceeds further.
(C) Copyright Insoft Oy
PROSA/SA/M-USE Intensive course
6
2.3 Event list
Event list is a complementary document for the environment
model. Event list is a textual document listing external events from
the environment to application to which the application must
generate response. The notation of the event list is presented in
Figure 2.3.
EVENT LIST
APPLICATION NAME
1. EXTERNAL EVENT 1
* DESCRIPTION OF RESPONSE
2. EXTERNAL EVENT 2
* DESCRIPTION OF RESPONSE
3. ...
Figure 2.3 Event list.
(C) Copyright Insoft Oy
PROSA/SA/M-USE Intensive course
7
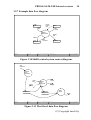
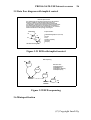
2.4 Example environment model
GATE CONTROL SYSTEM
Green
lamp
Red
lamp
Display
Ticket
reader
1. Valid ticket read.
* Open gate
* Light green for 5 seconds
2. Expired ticked read.
* Light red for 10 seconds
3. Valid ticked that passed gate
within 5 minutes.
* Light red for 10 seconds
4. Person passed the gate.
* Lock the gate
Host
computer
5. "Operate", "Stop" or
"Status report"- command received
from host computer.
Gate
opening/
closing
system
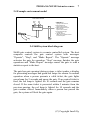
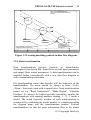
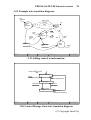
2.4 Skilift system block diagram
Skilift gate control system is a remote controlled system. The host
computer controls the gate control system with messages
"Operate", "Stop", and "Make Report". The "Operate" message
activates the gate for operation, "Stop" message finishes the gate
operations and "Make Report" message causes the gate to send a
statistics report to the host.
The gate has gate opening/closing system, a ticket reader, a display
for presenting messages and green/red lamps for alarms. In normal
operation when a person presents a valid ticket, the gate lights
green lamp for 5 seconds and opens the gate. If an expired ticket is
read, the red lamp is lighted for 10 seconds and the gate remains
closed. If the same ticket is presented within 5 minutes from the
previous passing, the red lamp is lighted for 10 seconds and the
gate remains closed. Immediately when a person has passed the
gate, the system will lock the gate again.
(C) Copyright Insoft Oy
PROSA/SA/M-USE Intensive course
Person
passed
gate
Ticket
reader
Ticket
data
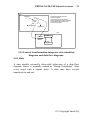
8
Gate
Gate
control
0
Manage
Gate Control
Display
data
Report
Host
computer
Author
Project
Status
Appr
Title
Vers
Host
command
Display
-1 Gate Control System
File dgate.dfd
Date
Time
11-09-1995
16:51:49
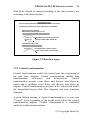
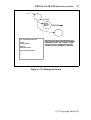
2.5 Gate Control context diagram
Gate Control System
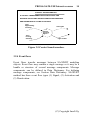
Event list
1. Valid ticket read.
* Open gate
* Light green for 5 seconds
2. Expired ticked read.
* Light red for 10 seconds
3. Valid ticked that passed gate within 5 minutes.
* Light red for 10 seconds
4. Person passed the gate.
* Lock the gate
5. "Operate", "Stop" or "Status report"- command received
from host computer.
2.6 Gate Control System event list
(C) Copyright Insoft Oy
PROSA/SA/M-USE Intensive course
9
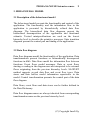
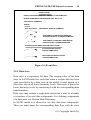
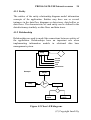
3. BEHAVIOURAL MODEL
3.1 Description of the behavioural model
The behavioural model presents the functionality and control of the
application. The functionality and the information flow in the
application is presented by hierarchically refined data flow
diagrams. The hierarchical data flow diagrams present the
hierarchical decomposition of the application into functional
subunits. Textual minispecifications are used on the lowest
hierarchy level to describe the primitive processes. State transition
diagrams present the control part and timing of the application.
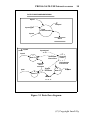
3.2 Data flow diagram
Data flow diagrams model the functionality of the application. Data
transformations present functions or hierarchically decomposed
functions in dfd's. Data flows model the information flow between
functions. Event flows model messages. Data or event flows
starting or ending in the diagram area are interpreted to be external
flows originating from the previous hierarchy levels. SA/SD/RT
method supports several data flow and event flow types. Data
stores and data buffers model information repositories in the
model. Control transformation presents the control part of the data
flow diagram.
Data flows, event flows and data stores can be further defined in
the Data Dictionary.
Data flow diagram names are always inherited from corresponding
transformation name on the previous hierarchy level.
(C) Copyright Insoft Oy
PROSA/SA/M-USE Intensive course
10
DATA FLOW DIAGRAM DESIGN
Input1
Output1
Inputsignal
Data
Transformation
Input2
Store
Input2
Inputsignal
Input1
4
Control
Transf
1
Activation
Event Flow
Data Tr
Deactivation
Event Flow
Store
put2
2
T
Trigger
activation
3
Data Tr
Output1
Data Tr
Buffer
Figure 3.1 Data flow diagram.
(C) Copyright Insoft Oy
PROSA/SA/M-USE Intensive course
11
Place control transformation and
control specific data flows/event flows in
this area.
In1
.1
Transf1
Out1
.2
In2
Transf2
Out2
.3
Transf3
Store1
Store2
Out3
The main direction
of information flow.
Place data transformations on
this diagonal.
Place data flows and data stores connecting
data transformations in this area.
Author
Project
Status
Appr
Title
Vers
File
dfdplac.dfd
Date
Time
12-09-1995
08:00:29
Figure 3.2 Locating modeling symbols in data flow diagram.
3.2.1 Data transformation
Data transformation presents function or hierarchically
decomposed function in dfd. Input flows present input parameters
and output flows output parameters. A data transformation can be
modeled further hierarchically with a new data flow diagram or
with a textual minispecification.
Use transformation names that describe well the behaviour of the
transformation. The name should be always in form <Verb>
<Noun>. Start each word with a capital letter. Good transformation
names are e.g. "Read Temperature", "Make Report", "Calculate
Position". To achieve the highest possible reusability, number the
transformations with running numbers starting .1, .2, .3 inside a
model. The actual hierarchy number of each transformation is
constructed by combining the model number i.e. number preceding
the diagram name and the transformation number. Position
transformations so that the main information flow in the model
(C) Copyright Insoft Oy
PROSA/SA/M-USE Intensive course
12
goes from up-left to down-right. This kind of positioning policy
makes models easy to read and understand.
DATA TRANSFORMATION
A DATA TRANSFORMATION CHANGES INCOMING FLOWS
TO OUTGOING FLOWS
Optical
Scan Data
Object Position
.1
Calculate
Position
Scanner
Position
Figure 3.3 Data transformation.
3.2.2 Data flows
Data flows transfer information between SA/SD/RT modeling
objects. Data flow may contain a single data element or it may be a
packaged bundle flow or a structure of several data components.
The abstraction level data flows and corresponding data flow
diagram should be in balance i.e. you should not introduce such
detailed data flows into the model which are not needed on that
detail level yet in the model. Instead you should use information
packaging and hide the details in Data Dictionary. For defining
complex data structures, see Section Data Dictionary. SA/SD/RT
method has three data flow types (1) Discrete data flow, (2)
Bidirectional discrete data flow and (3) Continuous data flow.
(C) Copyright Insoft Oy
PROSA/SA/M-USE Intensive course
13
Data flows should be named according to the data contents, not
according to the data structure.
DATA FLOWS
DATA FLOWS PROVIDE INFORMATION ABOUT LEVELS OR VALUES,
IN ADDITION TO SIGNALLING THAT SOMETHING IS HAPPENING
DISCRETE DATA FLOW AND
BIRECTIONAL DISCRETE DATA FLOW
Flight Plan
Message
HAS SIGNIFICANT VALUE AT ISOLATED
POINTS IN TIME (TIME - DISCRETE)
CONTINUOUS DATA FLOW
Temperature
HAS SIGNIFICANT VALUE AT EVERY
POINT IN TIME (TIME - CONTINUOUS)
Figure 3.4 Data flow types.
3.2.3 Control transformation
Control transformation models the control part, the sequencing of
the data flow diagram. Control transformation models data
transformation
activations
and
deactivations.
Control
transformation accepts event flows and discrete data flows as
inputs and it produces event flows and discrete data flows as
outputs. Control transformation presents in the behavioural model
the integration between data flow diagrams and state transition
diagrams.
A good default naming of control transformation is to put verb
"Control" at the beginning of the model name where the control
transformation appears. Control transformation is numbered
similarly as data transformations.
(C) Copyright Insoft Oy
PROSA/SA/M-USE Intensive course
14
CONTROL TRANSFORMATION
A CONTROL TRANSFORMATION ACCEPTS EVENT AND
DISCRETE DATA FLOWS AS INPUTS AND PRODUCES EVENT
AND DISCRETE DATA FLOWS AS OUTPUTS.
Train
Approaching
Crossing
Close gate
.7
Control
Crossing
Signal
Train
Leaving
Crossing
Light control
Figure 3.5 Control transformation.
3.2.4 Event flows
Event flows transfer messages between SA/SD/RT modeling
objects. Event flow may contain a single message or it may be a
bundle or structure of several message components. Message
components can be defined in Data Dictionary. For defining
message components, see Section Data Dictionary. SA/SD/RT
method has three event flow types (1) Signal, (2) Activation and
(3) Deactivation.
(C) Copyright Insoft Oy
PROSA/SA/M-USE Intensive course
15
EVENT FLOWS
EVENT FLOWS PROVIDE ONLY ONE BIT OF INFORMATION,
EITHER SOMETHING IS HAPPENING OR IT ISN'T, OR
THEY GIVE A COMMAND
SIGNAL
Open Input Valve
E/D
T
THIS SIGNAL GIVES A COMMAND
THIS SIGNAL ENABLES AND DISABLES
THE EXECUTION OF A TRANSFORMATION
THIS SIGNAL ACTIVATES A SEQUENTIAL
EXECUTION OF A TRANSFORMATION
ACTIVATION AND DEACTIVATION EVENT FLOW
ACTIVATION ACTIVATES
TRANSFORMATIONS
DEACTIVATION DEACTIVATES
TRANSFORMATIONS
Figure 3.6 Event flow.
3.2.5 Data store
Data store is a repository for data. The scoping rules of the data
store in SA/SD model are such that when a certain data has been
once specified to be a data store in the model, it must appear as a
data store also in all lower hierarchy levels. Data store is passed to
lower hierarchy levels by connecting it with the corresponding data
transformation.
Data store may contain a single data element or it may be a bundle
or structure of several data components. For defining components
of a data store, see Section Data Dictionary.
In SA/SD model it is allowed to use also data store components.
Then you must name the corresponding data flow with the store
(C) Copyright Insoft Oy
PROSA/SA/M-USE Intensive course
16
component name. Data stores should be named according to the
data contents, not according to the data structure.
DATA STORE
DATA STORE ACTS AS A REPOSITORY FOR DATA. DATA VALUES OF
THE STORE ARE MODIFIED AT DISCRETE POINTS IN TIME AND
REMEMBERED OVER THE INTERVENING TIME INTERVALS
Object
Position
.2
.1
Produce
Tracks
Record
Position
Object
Movements
Terrain
Data
Figure 3.7 Data store.
Upper lever
F1
S1
1
tr1
4
Dstore
F2
2
3
Lower level
S1
F1
Dstore
tr1
Figure 3.8 Data stores and flows are passed to lower hierarchy
levels by connecting them with data transformation.
(C) Copyright Insoft Oy
PROSA/SA/M-USE Intensive course
17
3.2.6 Data buffer
Data buffers store message information. Data buffers are normally
used to model stack and queue type data storage.
BUFFER
BUFFER IS A SPECIAL TYPE OF STORE IN WHICH FLOWS PRODUCED
BY ONE OR MORE TRANSFORMATIONS ARE CONSUMED BY ONE OF
MORE TRANSFORMATIONS.
BUFFER IS AN ABSTRACTION OF A
STACK OR QUEUE
Open Input Valve
Output Valve
Status
Output Valve
Closed
.3
Control
Reaction
Vessel
Figure 3.9 Data buffer.
(C) Copyright Insoft Oy
PROSA/SA/M-USE Intensive course
18
3.2.7 Example data flow diagram
Person
passed
gate
Ticket
reader
Gate
Ticket
data
Gate
control
0
Manage
Gate Control
Display
data
Report
Host
command
Host
computer
Author
Project
Status
Appr
Title
Vers
Display
-1 Gate Control System
File dgate.dfd
Date
Time
11-09-1995
16:51:49
Figure 3.10 Skilift control system context diagram.
Host
command
.1
Interpret
Host
Command
Ticket
data
Person
passed
gate
.2
Manage
Gate
Equipment
Gate
control
Display
data
.3
Parameters
Author
Project
Status
Appr
Gate passing
data
Title
Vers
Make
Report
Report
0 Manage Gate Control
File \msaexa\dgate\dgate0t.dfd
Date
Time
12-09-1995
09:02:54
Figure 3.11 The 0-level data flow diagram.
(C) Copyright Insoft Oy
PROSA/SA/M-USE Intensive course
19
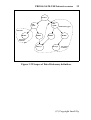
3.3 System and subsystem modeling
SA/SD/RT method can be used on all modeling abstraction levels
from company's business and strategic planning down to module
and programming level. In a very large systems the developing can
be divided into subsystems where the subsystem is modelled from
the context level.
DESIGNING SUBSYSTEM
Main system model:
Subsystem model:
s1
p1
m1
s2
s1
m2
m3
s1
m2
m1
Author Insoft Oy
Project
Status
Appr
Title
Vers
File
subsys.dfd
m3
Date
Time
12-09-1995
09:12:21
Figure 3.12 System and subsystem modeling.
Data bases can be arranged according to projects, designers,
subsystems and reusable library objects. The protection of the
model is realized in the diagram level and data dictionary
protection is automatically consistent with the model protection.
(C) Copyright Insoft Oy
PROSA/SA/M-USE Intensive course
Project
manager
20
dir: /mt
path: /mt,/mta/,/mtb/,/lib1/,/lib2/
Product
Designer 2
Designer 1
dir: /mtb
mread path: /mtb/,mtb/modb1/,
Sub/mtb/modb2/,/mt/,..
system B
lread path: /lib1/,/lib2/
Subsystem A
ModA1
ModA2
ModB2
ModB1
/mtb/modb2
/mtb/modb1
Library 1
Library 2
/lib1
/lib2
Access rights
Product SubA SubB Lib1 Lib2
Project manager RWD
R R R R
Designer 1
R
RWD - R R
Designer 2
R
- RWD R R
Library manager - - RWD RWD
Author
Project
Status
Appr
Title
Vers
File
.\ldbases.dfd
Date
Time
18-09-1995
09:10:35
Figure 3.13 System and subsystem modeling.
3.4 State transition diagram
State transition diagram models the control part of the data flow
diagram. State transition diagram consists of states and transitions.
A state models externally observable behaviour of a data flow
diagram. Transition models how state changes in state transition
diagram. Control transformation presents the abstraction of the
control in data flow diagrams. In SA/SD/RT method the control
modeling is hierarchical and supports concurrent execution in
different parts of the model.
(C) Copyright Insoft Oy
PROSA/SA/M-USE Intensive course
21
DFD
InputEvent
Control transformation presents
control part of DFD.
Input event flows and data flows to
control transformation map to conditions
in STD. Output event and data flows
map to actions in STD.
Control
Transf
OutputEvent1
OutputEvent2
STD
State
InputEvent
OutputEvent1
OEvent2
State
3.14 Control transformation integrates state transition
diagrams and data flow diagrams.
3.4.1 State
A state models externally observable behaviour of a data flow
diagram. States is normally named as "Doing Something". Start
every word with a capital letter. A state may have several
transitions in and out.
(C) Copyright Insoft Oy
PROSA/SA/M-USE Intensive course
22
STATE
A STATE IS A MODE OF BEHAVIOUR OF THE SYSTEM.
A STATE REPRESENTS AN EXTERNALLY OBSERVABLE
MODE OF BEHAVIOUR.
INITIAL TRANSITION
TRANSITORY
STATE
TRANSITION
Idle
STATE
Start
E Heat to Reaction
Temperature
CONDITION
Heating
D Heat to Reaction
Temperature
Reaction Temperature Reached
D Heat to Reaction Temperature
E Maintain Reaction
Temperature
ACTIONS
Stop
D Maintain Reaction
Temperature
Maintaining
ELSE TRANSITION
3.15 The modeling elements of the state transition diagram.
(C) Copyright Insoft Oy
PROSA/SA/M-USE Intensive course
23
3.4.2 Transition
Transition models changing of system state. A transitions happens
if a certain condition is true. When a transition is made, the
transition actions will be executed.
TRANSITIONS
TRANSITIONS REPRESENT THE MOVEMENT OF THE SYSTEM
FROM ONE STATE TO ANOTHER
- TRANSITIONS (LOGICALLY) TAKE NO TIME
- MULTIPLE TRANSITIONS TO/FROM A GIVEN STATE ARE PERMISSIBLE
- TRANSITIONS HAVE TWO PARTS: CONDITION AND ACTION
CONDITIONS
TRANSITION CONDITIONS CAUSE THE SYSTEM TO MOVE
FROM ONE STATE TO ANOTHER
CONDITIONS MAY INCLUDE:
- EXTERNAL OR INTERNAL CONTROL SIGNALS
- ABSOLUTE OR RELATIVE DATA VALUES
- TIME SIGNALS
ACTIONS
TRANSITION ACTIONS ARE CARRIED OUT BY THE SYSTEM AS IT
MOVES FROM ONE STATE TO ANOTHER
ACTIONS MAY INCLUDE:
- ISSUING CONTROL SIGNALS
- SETTING TIMERS
- ACTIVATING OR DEACTIVATING CONTINUOUS TRANSFORMATIONS
- TRIGGERING ONE SHOT TRANSFORMATIONS
3.16 Transitions.
3.4.2.1 Condition
(C) Copyright Insoft Oy
PROSA/SA/M-USE Intensive course
24
A condition presents input data or event flows in the state transition
diagram. A condition can have one part or it can be an expression
of several parts.
Condition syntax:
condition
operand
local_variable
literal
string
constant
operator
arithmetic_op
logical_op
relational_op
::= [operator] operand [{operator operand}]
::= input_event_flow | local_variable | literal | constant
::= string
::= "string"
::= {character}
::= integer | float
::= [arithmetic_op | logical_op | relational_op]
::= +
*addition*
*subtraction*
*
*multiplication*
/
*division*
::= AND
*logical and*
OR
*logical or*
NOT
*logical not*
::= <
*less than*
>
*greater than*
<=
*less or equal than*
>=
*greater or equal than*
==
*equal*
!=
*not equal*
3.17 Condition syntax.
3.4.2.2 Action
One transition can have many actions. Actions are executed when a
transition is made.
Action syntax:
action
executive_ac
Eheader
::= [executive_ac | signalling_ac | assign_ac]
::= Eheader data_transformation
::= E(nable) | D(isable) | T(rigger) | Ac | De
signalling_ac
Sheader
::= Sheader output_flow
::= R(aise) | L(ower) | S(ignal)
assign_ac
identifier
expression
asgn_operand
local_variab
literal
string
::=
::=
::=
::=
::=
::=
::=
operator
arithmeticop
logicalop
::= [arithmeticop | logicalop]
::= [ + | - | * | / ]
::= [ AND | OR | NOT ]
identifier = expression
[output_flow | local_variable]
asgn_operand [operator asgn_operand]
[input_flow | local_variab | constant | literal]
string
"string"
{character}
3.18 Action syntax.
(C) Copyright Insoft Oy
PROSA/SA/M-USE Intensive course
25
3.4.3 Example state transition diagrams
Host
command
Status report
.1
Operate
Interpret
Host
Command
E
.4
Stop
Control
Manage
Gate
E
E/D
.2
Ticket
data
Manage
Gate
Equipment
Person
passed
gate
Gate
control
Display
data
Report
done
E/D
.3
Parameters
Author
Project
Make
Report
Gate passing
data
Status
Appr
Title
Vers
Report
0 Manage Gate Control
File dgate0.dfd
Date
Time
12-09-1995
09:54:26
Date
Time
09-10-1994
17:00:29
3.19 Adding control transformation.
E
E Interpret Host Command
Waiting for host data
Operate
E Manage Gate Equipment
Stop
D Manage Gate Equipment
Managing gate
Status report
Report done
D Make Report
E Make Report
Making status
report
Author
Project
Status
Appr
Title
Vers
Stop
D Make Report
D Manage Gate Equipment
4 Control Manage Gate
File .\sgate0.std
3.20 Control Manage Gate state transition diagram.
(C) Copyright Insoft Oy
PROSA/SA/M-USE Intensive course
26
3.5 Data flow diagram with implicit control
DFD with implicit control
The standard way of presenting sequencing is the state transition
diagram. In addition to state transition based sequencing
- sequencing of a model is derived automatically from the data
flow diagram. In data flow based sequencing control transformation
and state transition diagram are not needed. The user attaches a
Trigger or Enable activation to data transformations. The execution
order is determined from the topology of the diagram.
SA/SD Model
T
in1
Do
C Implementation
ret
in2
T
out
Close
Title=Data Flow Diagram
int DataFlowDiagram(int in1,char in2)
{
char out;
int ret;
ret=Do(in1,in2,&out);
Close(out);
return(ret);
}
Figure 3.21 DFD with implicit control.
DFD Sequencing
T
In
TransfA
Execution order:
T
TransfA(In,&Store1);
TransfB(&Store1);
TransfC(Store1,&Store2);
TransfD(Store2,Out);
TransfB
T
TransfC
T
Store1
TranfsD
Store2
Out
Figure 3.22 DFD sequencing.
3.6 Minispecification
(C) Copyright Insoft Oy
PROSA/SA/M-USE Intensive course
27
.1
Frame Packet
.2
Check
Receive
Errors
Received Frame
.3
1.2 Check Receive Errors
Inputs
Frame Packet
Outputs
Received Frame
MINISPECIFICATIONS ARE DESIGNED FOR
DATA TRANSFORMATIONS ON THE LOWEST
HIERARCHY LEVEL. THE FORMAT OF MINISPECIFICATIONS CAN BE FREE TEXTUAL
FORMAT OR PROGRAMMING LANGUAGE.
User minispecification
------
Figure 3.23 Minispecification.
(C) Copyright Insoft Oy
PROSA/SA/M-USE Intensive course
28
DFD
.1
Number
.2
Update
display
Status
.3
Minispecification
int UpdateDisplay(int Number)
{
}
Minispecification is created automatically
whenever you give filename extension .c
in Push command. Prosa/sa checks the
consistency between graphical model and
minispecification and integrates data
transformation and minispecification together.
Mhead property controls minispecification
header generation.
Figure 3.24 Minispecification in C syntax.
(C) Copyright Insoft Oy
PROSA/SA/M-USE Intensive course
29
3.7 Data Dictionary
Data flows, event flows, data stores and buffers appearing in data
flow diagrams can be further defined in the Data Dictionary. By
using Data Dictionary you can effectively package information in
your models. Always when a new modeling element is taken into
SA/SD model, the element name will be put into the Data
Dictionary.
DATA DICTIONARY SUPPORT: DEFINE FUNCTION
Upper level:
Invoice
By define function the
composition of Invoice
is defined
Data Dictionary
Invoice =
Header +
Body
Header =
.....
Edit
Lower level:
Header
Body
Data dictionary entry can be viewed
in the lower level and visit function
can be selected from Options menu to
visit the owner of the entry.
Data Dictionary
Options
View
Invoice =
Header +
Body
Header =
.....
Figure 3.25 Defining information in Data Dictionary.
(C) Copyright Insoft Oy
PROSA/SA/M-USE Intensive course
30
Data Dictionary Definition
Data flows can be collected into data dictionary in higher level of
the hierarchy and those flows can appear in the desired level of
the design hierarchy. To keep the model clear detail level data
components are hided in the data dictionary in high abstraction level
of the model. - Information hiding.
Upper lever of the hierarchy:
Define -command in flow menu
Data Dictionary definition:
Customer delivery =
* Comments between asterisks *
Customer invoice +
Customer delivery list
Maintain
customer
delivery
Customer
delivery
Lower level of the hierarchy:
Hierarcical data dictionary
definition:
Customer
invoice
Customer =
Customer name +
Customer number +
Customer address
Customer address =
Street address +
Zip code +
City
Make
customer
invoice
Customer
Customer
delivery
list
Make
customer
delivery
list
Figure 3.26 Hierarchical Data Dictionary definition.
(C) Copyright Insoft Oy
PROSA/SA/M-USE Intensive course
31
DataEntity =
[comment]
[aliasname]
component [{operator component}]
[{component =
component [{operator component}] } ]
::= flow | store | entity
DataEntity
::= string
flow
::= string
store
::= string
entity
::= string [typespecifier | aliasname | comment] | comptype
component
::= [ and | or ]
operator
::= +
and
::= |
or
::= cmtstart a=component cmtstop
aliasname
::= cmtstart [string] t=comptype [string] cmtstop
typespecifier
::= string |
* Variable type *
comptype
string* |
* Pointer type *
(string [{string}])
* Type with specifiers *
::= cmtstart string cmtstop
comment
::= *
* a space, tabulator or newline character must precede *
cmtstart
::= *
* a space or tabulator character must precede *
cmtstop
::= {character}
string
Figure 3.27 Data Dictionary syntax.
Example data dictionary definition:
Customer =
* Customer data store definition *
CompanyName +
Address
Address=
StreetAddress+
ZipCode+
City
Figure 3.28 Data Dictionary definition example.
(C) Copyright Insoft Oy
PROSA/SA/M-USE Intensive course
32
Product
SubsystB
SubsystA
flowb=struc_type
flowa=int
ModA1
ModA2
ModB2
ModB1
the scope
of flowa
Library 1
Library 2
the scope
of flowb
Figure 3.29 Scopes of Data Dictionary definition.
(C) Copyright Insoft Oy
PROSA/SA/M-USE Intensive course
33
4 INFORMATION MODEL
4.1 Description of the information model
Information model defines the data of the application. Information
model or data model is presented with entity relationship diagrams.
In entity relationship diagramming Chen's and Bachman's notations
are supported. In information models the application data entities
and their relationships are modelled. Information models and
behavioural models integrate with each others - data which is
defined in information model is created and maintained in
behavioural models. Although information models are commonly
understood to be a part of information systems analysis and design,
they can be used in all kinds of applications.
ENTITY RELATIONSHIP DIAGRAM DESIGN
DFD
Goods Order
.1
Prepare
Goods
Order
Supplier
Product
ERD
Supplier
M
Supplies
N
Product
Figure 4.1 Using information modeling.
(C) Copyright Insoft Oy
PROSA/SA/M-USE Intensive course
34
4.1.1 Entity
The entities of the entity relationship diagram model information
concepts of the application. Entities may have one or several
instances in the data flow diagrams as data stores, data buffers or
data flows. The characteristics of each entity can be defined in the
data dictionary similarly as data flows and data stores.
4.1.2 Relationship
Relationships are used to model the connections between entities of
the application. Relationships have an important role when
implementing information models in relational data base
management system.
relation
entity
normal
inverse
super
sub
associative
Example:
Temp
Param
N
Is
used
in
1
Channel
report
Report
Daily
report
Figure 4.2 Chen's ER diagram.
(C) Copyright Insoft Oy
PROSA/SA/M-USE Intensive course
35
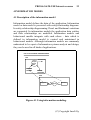
4.2 Integration of ERD's and DFD's
delivery.dfd
Property window for
the context diagram
Operator
0
Manage
delivery
Property name:
syspddo
Property value:
ordman.erd
ordpro.dfd
.1
Prepare
Goods
Order
Goods Order
Product
Supplier
ordman.erd
Supplier
M
Supplies
N
Product
Figure 4.3 Integration of information and behavioural models.
(C) Copyright Insoft Oy
PROSA/SA/M-USE Intensive course
36
4.3 Example information model
Parameters
Is
used
in
Gate passing
data
Report
Error
report
Statistics
report
Author
Project
Status
Appr
Title
Vers
Skilift gate control system
File egate.erd
Date
Time
10-10-1994
07:16:14
Figure 4.4 Skilift gate control system information model.
(C) Copyright Insoft Oy
PROSA/SA/M-USE Intensive course
37
5. NAMING INSTRUCTIONS
5.1 Model and model file naming
Use descriptive model names. In hierarchical behavioural model
the child model automatically inherits the name of its parent. Name
model files so that the context diagram filename describes the
project name. The event list has the same filename as context
diagram except the extension is .elt. Append 0 to the end of context
diagram file name to create the 0-level data flow diagram file name
e.g. dremix0.dfd. Name all other model files according to function
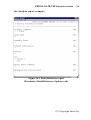
that it performs. Figure 5.1 presents file name extensions and prefix
characters for different model types.
Context diagram
dappnam.dfd
* derived from application name
Event list
dappnam.elt
* derived from application name
0-level dfd
dappnam0.dfd *
0-level std
sappnam0.std
*
Other dfd's
ddgrnam.dfd
* derived from diagram name
Other std's
sdgrnam.std
*
Minispecifications
cmsnam.mst
* derived from transform. name
ER-diagrams
edgrnam.erd
* derived from application name
Figure 5.1 Model file name usage.
5.2 Naming of SA/SD/RT modeling elements
The naming instructions have been presented in corresponding
sections of Environment model, Behavioural model and
Information model.
(C) Copyright Insoft Oy
PROSA/SA/M-USE Intensive course
38
6. PROSA/OM/SA CASE ENVIRONMENT
PROSA CASE ENVIRONMENT
Supports method
UML UNIFIED
MODELING LANGUAGE
OMT OBJECT
MODELING TECHNIQUE
SA/SD/RT
STRUCTURED
ANALYSIS AND
DESIGN
PROSA/OM
PROSA/SA
MODELING
EDITOR
PROSACPP
C/C++ CODE
GENERATOR
PROSASQL
SQL CODE
GENERATOR
PROSACDM
CONCURRENT
DOCUMENT
MANAGER
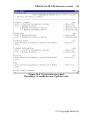
* PROSA MODELING EDITOR IS CONFIGURED TO UML, OMT OR
SA/SD/RT MODE THROUGH PROSA CONFIGURATION DIALOG
IN DESIGN>>CONFIG..>>METHOD PAGE.
* PROSA MODELING EDITOR INCLUDES PRINTING TOOL AND PMA
(PROSA MODEL ANALYZER) TOOL FOR REPORTING
* PROSACPP, PROSASQL AND PROSACDM DETECT AUTOMATICALLY
THE METHOD AND PRODUCE OUTPUT ACCORDINGLY
Figure 6.1 Prosa Case Environment.
(C) Copyright Insoft Oy
PROSA/SA/M-USE Intensive course
39
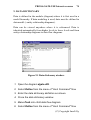
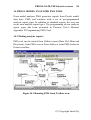
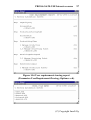
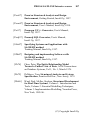
7. SETTING UP PROJECT, CONFIGURING PROSA
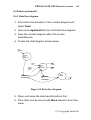
7.1 Setting up a project
Prosa/sa model consists of a set of diagrams. Prosa/sa links the
diagrams together to form an integrated model. Each diagram is a
separate document or file in project folder(s). The following
presents the steps of setting up a project:
1.
2.
3.
4.
Create project folder.
Start Prosa/sa.
Add the name of the project folder to Model Read Paths
of Prosa/sa through Path page of the Prosa/sa
Configuration dialog. Configuration dialog opens by
selecting Config… item from the Design menu.
If you intend to reuse existing model libraries, add the
location of your libraries to Library Read Paths in the
same dialog.
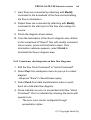
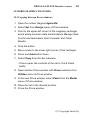
At the beginning of each modeling session, you must change the
working directory to your project folder through Chdir item in the
Utilities menu.
In Windows environment you can change the working directory of
Prosa permanently. Click on Prosa icon, press the right mouse
button and select Properties/Shortcut page.
Figures7.1-4 present an example of creating project folder, adding
the folder to Prosa Model Read Paths and changing Prosa working
directory.
(C) Copyright Insoft Oy
PROSA/SA/M-USE Intensive course
40
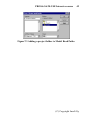
Figure7.1 Creating project folder.
(C) Copyright Insoft Oy
PROSA/SA/M-USE Intensive course
41
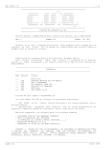
Figure7.2 Opening Prosa Configuration Dialog.
(C) Copyright Insoft Oy
PROSA/SA/M-USE Intensive course
42
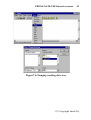
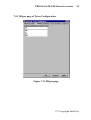
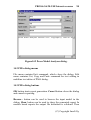
Figure7.3 Adding a project folder to Model Read Paths.
(C) Copyright Insoft Oy
PROSA/SA/M-USE Intensive course
43
Figure7.4 Changing working directory.
(C) Copyright Insoft Oy
PROSA/SA/M-USE Intensive course
44
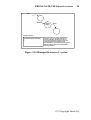
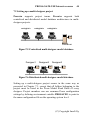
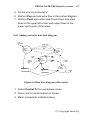
7.2 Setting up a multi-designer project
Prosa/sa supports project teams. Prosa/sa supports both
centralised and distributed model database architectures in multidesigner projects.
Designer1
Designer2
Designer3
Fileserver
Figure7.5 Centralised multi-designer model database.
Designer1
Designer2
Designer3
Figure7.6 Distributed multi-designer model database.
Setting up a multi-designer project occurs in the same way as
presented in Chapter 7.1, except that all folders belonging to the
project must be listed in the Prosa Model Read Paths of every
designer. Project members can use common Prosa configuration
settings by defining environment variable PROSACFG to point to
the same configuration file on the operating system level.
(C) Copyright Insoft Oy
PROSA/SA/M-USE Intensive course
45
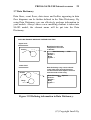
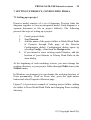
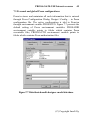
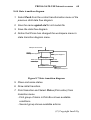
7.3 Personal and global Prosa configurations
Prosa/sa stores and maintains all such information that is entered
through Prosa Configuration Dialog Design>>Config… in Prosa
configuration file. The active configuration is told to Prosa/sa
through environment variable PROSACFG. Figure 7.7 presents the
default setting of Prosa environment variables. PROSADIR
environment variable points to folder which contains Prosa
executable files, PROSAAUTH environment variable points to
folder which contains Prosa authorization files.
Figure7.7 Distributed multi-designer model database.
(C) Copyright Insoft Oy
PROSA/SA/M-USE Intensive course
46
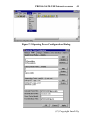
7.4 Making a personal Prosa configuration
The following steps show how you create a personal configuration
in Unix environments. In Windows NT you use System item in the
Control panel for the same purpose.
1. Make personal configuration file and change
PROSACFG environment variable.
# cp /usr/prosa/prosa.cfg <usr login dir>
# PROSACFG=<usr login dir>prosa.cfg
# export PROSACFG
After starting Prosa, the functionality and working ergonomics of
Prosa/sa can be configured through Config… item in Design
menu. Prosa/sa configuration information is stored in Prosa
configuration file. Prosa/sa searches the configuration file name
from PROSACFG environment variable, which by default after
installation points to the file prosa.cfg in Prosa/sa home directory.
According to your needs, it is thus possible to have global, project
specific or personal Prosa/sa configurations.
(C) Copyright Insoft Oy
PROSA/SA/M-USE Intensive course
47
Figure 7.8 Opening Prosa/sa configuration dialog.
(C) Copyright Insoft Oy
PROSA/SA/M-USE Intensive course
48
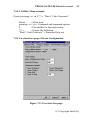
7.4.1 Method page of Prosa Configuration
Figure 7.9 Method page.
7.4.1.1 Modeling Method
SA/SD/RT selects Structured Analysis and Design for Real-Time
systems-method. UML selects Unified Modeling Language
method. OMT selects Use Case/OMT, Object Modeling Technique
-method.
(C) Copyright Insoft Oy
PROSA/SA/M-USE Intensive course
49
7.4.1.2 Name Prefixes
Defines default prefixes for class and instance names in OMT
mode. Prefixes are applied when Prosa automatically maps
between object and class names in Pick -operation between UCDOMD or OID-OMD or DFD-OMD.
7.4.1.3 ERD Notation
In SA/SD/RT modeling mode either Bachman's or Chen's ERD
notation can be selected.
7.4.1.4 Date Format
Defines format for automatically maintained date stamp in the title
block of a diagram.
(C) Copyright Insoft Oy
PROSA/SA/M-USE Intensive course
50
7.4.2 Path page of Prosa Configuration
Figure7.10 Path page.
$(PROSADIR) is a placeholder for the value of PROSADIR
environment variable.
7.4.2.1 Model Read Paths
The path list defines all directories which are searched when Prosa
opens or saves a diagram. With model read path you can set up
your project environment and allocate effectively your project
between subsystems and/or designers in team environment.
(C) Copyright Insoft Oy
PROSA/SA/M-USE Intensive course
51
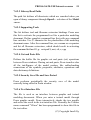
7.4.2.2 Library Read Paths
The path list defines all directories which are searched when you
open a library component through OpenL... selection of the Model
-menu.
7.4.2.3 Supporting Tools
The list defines tool and filename extension bindings. Prosa uses
this list to activate the programmed tool for a particular modeling
document. Define complete command line first with any command
line switches. Use '$' character for the placeholder of the modeling
document name. After the command line, use comma as a separator
and list all filename extensions, which should result in activating
the command defined. E.g.: notepad $,.mst,.elt,.c,.cpp
7.4.2.4 Cut and Paste File
Defines the buffer file for graphic cut and paste (set) operations
between Prosa windows. During cut and paste, Prosa transfers also
all the intelligence of the model portion, like rubberbanding
connections of the symbols, properties, attributes, operations and
data dictionary definitions.
7.4.2.5 Security Save File and Save Period
Prosa performs periodically the security save of the model
currently being edited in Prosa window.
7.4.2.6 Text Interface File
The file is used as an interface between graphic and textual
modeling documents. When you enter a textual model through
Prosa graphic model, Prosa interactively checks the two models
and writes the result in the text interface file. Normally the Utilities
menu command "VError" has been programmed to show this file in
the text editor.
(C) Copyright Insoft Oy
PROSA/SA/M-USE Intensive course
52
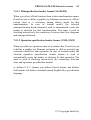
7.4.3 MSpec page of Prosa Configuration
Figure 7.11 MSpec page.
(C) Copyright Insoft Oy
PROSA/SA/M-USE Intensive course
53
7.4.3.1 Minispecification header format (SA/SD/RT)
When you select a Push function from a data transformation menu,
Prosa lets you to define a graphic (no filename extension or .dfd) or
textual (.mst or .c extension, among others) model for that
transformation. In case of textual model, the selected
minispecification header format is used to automatically create the
header or skeleton for that transformation. The same is used in
checking interactively the consistency between data flow diagrams
and minispecifications.
7.4.3.2 Operation specification header format (UML, OMT)
When you click on operation name of a certain class, Prosa lets you
to define a graphic (no filename extension or .dfd) or textual (.cpp
extension) model for that operation. In case of textual model, the
selected operation specification header format is used to
automatically create the header or skeleton for that operation. The
same is used in checking interactively the consistency between
class and operation specification models.
cc defines C/C++ format, pas defines Pascal format, ada defines
Ada format, std defines standard natural English like specification
language.
(C) Copyright Insoft Oy
PROSA/SA/M-USE Intensive course
54
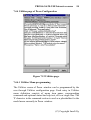
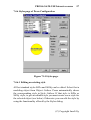
7.4.4 Utilities page of Prosa Configuration
Figure 7.12 Utilities page.
7.4.4.1 Utilities Menu programming
The Utilities -menu of Prosa -window can be programmed by the
user through Utilities configuration page. Each entry in Utilities
menu definition consists of menu item name, corresponding
command and optional status-bar help text, all in a single line. The
'$' character in the command section is used as a placeholder for the
model name currently in Prosa -window.
(C) Copyright Insoft Oy
PROSA/SA/M-USE Intensive course
55
7.4.4.2 Utilities Menu example
Prosac prosacpp -cc -m $ *\*.c "Run C Code Generator"
Prosac
= Menu item
prosacpp –cc –m = Command and command options
$
= Placeholder for the model name
*\*.c
= Output file definition
"Run C Code Generator" = Statusbar Help text
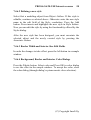
7.4.5 User interface page of Prosa Configuration
Figure 7.13 User Interface page.
(C) Copyright Insoft Oy
PROSA/SA/M-USE Intensive course
56
7.4.5.1 User Interface Mode
Pop-up menus of Prosa can be activated either by Left (default) or
Right mouse button. Correspondingly the other button is used in
dragging and moving modeling symbols and symbol names.
7.4.5.2 Time Delays
Menu Click/Release Delay. Pop-up menus can be activated by two
ways. 1. Press the mouse button down and while holding the button
down drag the mouse to desired menu item and make the selection
by releasing the button, or 2. Click the mouse button fast to bring
the menu permanently visible. Make the selection with another
click. Menu Click/Release Delay defines the time (in milliseconds)
how fast you must click to achieve the situation of method 2.
Flow Click Delay. In association, flow and transition generation,
fast click creates a corner or bending point. Flow Click Delay
defines the time (in milliseconds) how fast you must click to create
a corner point. If this delay expires, a flow submenu is shown to
direct you further.
7.4.5.3 Workspace Options
You can hide or show Statusbar, Toolbar and Grid. Snap to Grid,
when enabled, allows symbol placement and association/transition
generation only in the grid. In text editing field the size of grid can
be defined (in millimeters, e.g 2.50).
Heavy Dialog Use shows frequently filename dialogs when
traversing between various diagrams in a certain model.
Border File Dialog shows the dialog for reading prefilled diagram
as a basis for a new model in Prosa Push to operation model or
child data flow diagram.
(C) Copyright Insoft Oy
PROSA/SA/M-USE Intensive course
57
7.4.6 Styles page of Prosa Configuration
Figure 7.14 Styles page.
7.4.6.1 Editing an existing style
All but standard styles StFlo and StObj can be edited. Select first a
modeling object from Object -listbox. Prosa automatically shows
the corresponding style in Style -listbox. If that style is StFlo or
StObj -style, to get an editable style you must create a new style for
the selected object (see below). Otherwise you can edit the style by
using the functionality offered by the Styles dialog.
(C) Copyright Insoft Oy
PROSA/SA/M-USE Intensive course
58
7.4.6.2 Defining a new style
Select first a modeling object from Object -listbox. If this style is
editable, continue as advised above. Otherwise enter the new style
name in the edit field of the Style -combobox. Press the Add
button. Prosa inserts and highlights the new style in Style listbox.
Now you can edit the style by using the functionality offered by the
Styles dialog.
After the new style has been designed, you must associate the
selected object and the newly created style by pressing the
Associate -button.
7.4.6.3 Border Width and Interior Size Edit Fields
In order the changes to take effect, press the left button in a sample
window.
7.4.6.4 Background, Border and Interior Color Dialogs
Press the Palette button. Select color and Press OK in color dialog
to see the effect in the sample window. To accept the color, close
the color dialog (through dialog's system menu's close selection).
(C) Copyright Insoft Oy
PROSA/SA/M-USE Intensive course
59
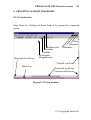
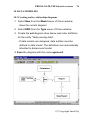
8. CREATING SA/SD/RT DIAGRAMS
8.1 User interface
Start Prosa by clicking on Prosa icon or by typing the command
prosa.
Horizontal scroll box
Window title
Menubar
Toolbar
Workspace
Diagram area
Close
Maximize
Minimize
Vertical scroll bar
Status bar
Horizontal scroll bar
Vertical scroll box
Figure 8.1 Prosa window.
(C) Copyright Insoft Oy
PROSA/SA/M-USE Intensive course
60
8.1.1 Command button
Prosa/sa can be controlled with a single mouse button.
Command button is the left button by default. The second button
(drag button) is optional and can be used if desired.
The command button is used to activate menus. The pull-down
menus in the menu bar of the Prosa/sa window are activated with
the command button. The context sensitive menus in the diagram
or client area are activated with the command button.
When a command has been selected, the same button can be used
to bring the selected function or operation to the successful end.
8.1.2 Drag button
Drag button is the right button by default. The use of drag button is
optional.
With drag button you can attach to symbols and texts and change
their position. Drag button can be used to initiate a selection of a
diagram area for copy or deletion.
All these operations can be done also with command button
through menus. Thus the drag button is available for activating
certain default functions without a menu selection.
8.1.3 Command/drag button programming
You can swap the button definitions through Config selection in
the Design menu. Select the User Interface -page in the
configuration dialog.
(C) Copyright Insoft Oy
PROSA/SA/M-USE Intensive course
61
8.2 Changing working directory
Create folder/directory demo. Select Chdir from Utilities menu.
Change the default directory to demo.
8.3 Environment model
8.3.1 Context diagram
Person
passed
gate
Ticket
reader
Ticket
data
Gate
Gate
control
0
Manage
Gate Control
Display
data
Report
Host
computer
Host
command
Display
Figure 8.2 Context diagram.
1. Select Datatr from workspace menu.
2. Symbol menu is activated by pointing the symbol and
holding the button down.
3. Set Number and Name of the data transformation.
4. Select Terminator from workspace menu. Name it.
(C) Copyright Insoft Oy
PROSA/SA/M-USE Intensive course
62
5. A flow is drawn from source to destination. Use flow type
Discr Data.
- Bending point is made by fast click.
- Flow is terminated by pointing the destination and
clicking.
6. Scroll down the Prosa window to find the Title block.
Fill in:
Author, Project and Title fields.
7. Save the diagram dgate.dfd by selecting Save As...
from Model menu.
(C) Copyright Insoft Oy
PROSA/SA/M-USE Intensive course
63
8.3.2 Event list
Point the data transformation and select Property.
Figure 8.3 Opening event list.
1.
2.
3.
4.
5.
6.
7.
Type property name elist.
Enter tab to separate name and value field.
Type property value >dgate.elt.
The > -character states that the value is file name.
Select Visit... from Options menu.
Your text editor is started and you can type the event list.
Type some events in the event list.
Close the text editor.
(C) Copyright Insoft Oy
PROSA/SA/M-USE Intensive course
64
Figure 8.4 Event list.
(C) Copyright Insoft Oy
PROSA/SA/M-USE Intensive course
65
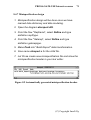
8.4 Behavioural model
8.4.1 Data flow diagram
1. Point data transformation of the context diagram and
select Push.
2. Give name dgate0.dfd for the child data flow diagram.
3. Save the context diagram when Prosa asks
Save/Nosave.
4. Create the child diagram shown below.
Host
command
.1
Interpret
Host
Command
Ticket
data
Person
passed
gate
.2
Manage
Gate
Equipment
Gate
control
Display
data
.3
Parameters
Gate passing
data
Make
Report
Report
Figure 8.5 Data flow diagram.
5. Place and name the data transformations first.
6. Flow stubs can be moved with Move selection from flow
menu.
(C) Copyright Insoft Oy
PROSA/SA/M-USE Intensive course
66
7. Input flows are connected by attaching with Modify
command to the arrowhead of the flow and terminating
the flow to destination.
8. Output flows are connected by attaching with Modify
command to the start point of the flow and routing it to
source.
9. Finish the diagram shown above.
10. Train the termination of the flow to diagram area. Attach
to the arrowhead of "Report" flow with modify command,
move mouse, press and hold button down. Flow
termination submenu appears, select Finish to
terminate the flow to diagram area.
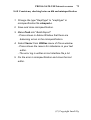
8.4.2 Consistency checking between data flow diagrams
1. Edit the flow "Host Command" to "xHost Command".
2. Select Pop from workspace menu to pop up to context
diagram.
- Respond "Save" to Save/Nosave query.
3. Select Push from data transformation menu to push
back into child data flow diagram.
4. Prosa indicates an error in unmatched child flow "xHost
Command". Error is indicated by showing the name with
special color.
-
The error color can be configured through
presentation styles.
(C) Copyright Insoft Oy
PROSA/SA/M-USE Intensive course
67
5. Fix the error by removing 'x'.
6. Perform Pop and add extra flow in the context diagram.
7. Perform Push and notice how Prosa brings new input
flows in the upper left corner and output flows in the
upper right corner of the sheet.
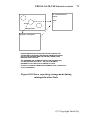
8.4.3 Adding control to data flow diagram
Host
command
Status report
.1
Operate
Interpret
Host
Command
.4
Stop
Control
Manage
Gate
E
E/D
Ticket
data
Person
passed
gate
.2
Manage
Gate
Equipment
Gate
control
Display
data
Report
done
E/D
.3
Parameters
Make
Report
Gate passing
data
Report
Figure 8.6 Data flow diagram with control.
1. Select Control Tr from workspace menu.
2. Place control transformation as shown.
3. Make connections indicated above.
(C) Copyright Insoft Oy
PROSA/SA/M-USE Intensive course
68
8.4.4 State transition diagram
1. Select Push from the control transformation menu of the
previous child data flow diagram.
2. Give the name sgate0.std for std model file.
3. Save the data flow diagram.
4. Notice that Prosa has changed the workspace menu to
state transition diagram menu.
E Interpret Host Command
Waiting for host data
Operate
E Manage Gate Equipment
Stop
D Manage Gate Equipment
Managing gate
Status report
Report done
D Make Report
E Make Report
Making status
report
Stop
D Make Report
D Manage Gate Equipment
Figure 8.7 State transition diagram.
5. Place and name states.
6. Draw initial transition.
7. Point transition and Select Pick a (Pick action) from
transition menu.
- First group of items in Pick Box shows available
conditions.
- Second group shows available actions.
(C) Copyright Insoft Oy
PROSA/SA/M-USE Intensive course
69
- Third group shows local variables declared in std
(if any).
8. Pick and place action for initial transition.
9. Route all transitions and place conditions/actions with
Pick c/Pick a selections in transition menu.
- Be careful to open the transition menu above that
transition where you want to add condition/action to
maintain the logical relation between text and transition
arrow.
8.4.5 Consistency checking between dfd and std
1. Open diagram sgate0.std.
2. Edit condition "Operate" to "xOperate".
3. Add extra action "E Process1":
- Select Action from transition menu.
- Point to the <new> token, click button and
type the action name.
4. Select Pop from workspace menu to Pop to dfd. Save
the std.
5. Select Push from control transformation menu.
6. Notice the indication of unmatched condition and action.
7. Select Pick c from transition menu. Notice the 'M'
character in front of "Operate" condition item in the
Pick Box. 'M' denotes missing item.
(C) Copyright Insoft Oy
PROSA/SA/M-USE Intensive course
70
8.4.6 Hierarchical data flow diagram design
1. Open diagram dgate0.dfd.
2. Make Push into "Make Report" data transformation.
3. Give name dmreport.dfd to the child file.
4. Create the diagram shown below for the functional
refinement of "Make Report" data transformation.
E/D
.1
Determine
Asked
Data
Repframe
Report
done
.2
Build
Report
Gaterep
Report
.3
Parameters
Gate passing
data
Send
Report
Figure 8.8 Data flow diagram (1 -level).
(C) Copyright Insoft Oy
PROSA/SA/M-USE Intensive course
71
8.4.7 Minispecification design
1. Minispecification design will be done once we have
learned data dictionary and data modeling.
2. Open the diagram dmreport.dfd.
3. Point the flow "Repframe", select Define and type
definition repfrtype.
4. Point the flow "Gaterep", select Define and type
definition gatereptype.
5. Make Push into "Build Report" data transformation.
6. Give name cbreport.c for the child file.
7. Let Prosa create new minispecification file and show the
minispecification header in your text editor.
Figure 8.9 Automatically generated minispecification header.
(C) Copyright Insoft Oy
PROSA/SA/M-USE Intensive course
72
8.4.8 Consistency checking between dfd and minispecification
1. Change the type "Repfrtype" to "xrepfrtype" in
minispecification file cbreport.c.
2. Save and close minispecification.
3. Make Push into "Build Report".
- Prosa shows in Advice Window that there are
balancing errors in the minispecification.
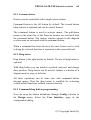
4. Select Verror from Utilities menu of Prosa window.
- Prosa shows the reason for imbalance in your text
editor.
- The error log is written in text interface file p.txt.
5. Fix the error in minispecification and close the text
editor.
(C) Copyright Insoft Oy
PROSA/SA/M-USE Intensive course
73
tif - text interface file
Parent:
....
Push
Child:
....
dmreport.dfd
cbreport.c minispecif.
DURING MINISPECIFICATION PUSH PROSA CHECKS THE
CONSISTENCY BETWEEN THE HEADER GENERATED FROM
DATA FLOW DIAGRAM AND THE HEADER FOUND FROM
MINISPECIFICATION FILE.
THE HEADERS AND POSSIBLE ERROR LOG ARE WRITTEN
TO TEXT INTERFACE FILE TIF. THE TIF FILENAME IS
DEFINED IN PATH SECTION OF PROSA.CFG FILE.
THE TIF FILE CAN BE VIEWED WITH VERROR (VTIF) SELECTION
OF UTILITIES MENU.
Figure 8.10 Error reporting arrangement during
minispecification Push.
(C) Copyright Insoft Oy
PROSA/SA/M-USE Intensive course
74
9. DATA DICTIONARY
Data is defined in the module (diagram) where it is first used in a
model hierarchy. If data modeling is used, data must be defined in
data model (=entity relationship diagrams).
Data can be viewed anywhere where it is referenced. Data is
inherited automatically from higher levels to lower levels and from
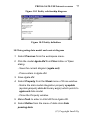
entity relationship diagrams to data flow diagrams.
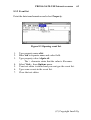
Figure 9.1 Data dictionary window.
1. Open the diagram dgate.dfd.
2. Select Define from the menu of "Host Command" flow.
3. Enter the data dictionary definition as shown.
4. Close the data dictionary window.
5. Make Push into child data flow diagram.
6. Select Define from the menu of "Host Command" flow.
(C) Copyright Insoft Oy
PROSA/SA/M-USE Intensive course
75
7. Notice that data dictionary window is now in View-mode.
8. Select Visit from the Options menu of data dictionary
window.
9 Prosa reads the diagram dgate.dfd where "Host
Command" has been defined and the definition can be
edited.
10. Select Return from the Design menu of Prosa window.
- Prosa brings you back to the diagram where visit was
made.
(C) Copyright Insoft Oy
PROSA/SA/M-USE Intensive course
76
10. DATA MODELING
10.1 Creating entity relationship diagrams
1. Select New from the Model menu of Prosa window.
- Save the current diagram.
2. Select ERD from the Type menu of Prosa window.
3. Create the erd diagram show below and enter definition
for the entity "Gate passing data".
- If data models are designed, data entities must be
defined in data model. The definitions are automatically
inherited to behavioural model.
4. Save the diagram with the name egate.erd.
(C) Copyright Insoft Oy
PROSA/SA/M-USE Intensive course
77
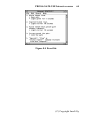
Figure 10.1 Entity relationship diagram.
Figure 10.2 Entity definition.
10.2 Integrating data model and context diagram
1. Select Previous from the workspace menu.
2. Pick the model dgate.dfd from Files listbox of Open
dialog.
- Save the current diagram (egate.erd).
- Prosa enters in dgate.dfd.
3. Save dgate.dfd.
4. Select Property from the Sheet menu of Prosa window.
- Notice the data model integration property syspddo
(system property data dictionary origin) which points to
egate.erd data model.
- Close the Property window.
5. Make Push to enter in child dfd from dgate.dfd.
6. Select Define from the menu of data store Gate
passing data.
(C) Copyright Insoft Oy
PROSA/SA/M-USE Intensive course
78
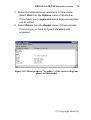
7. Notice that data dictionary window is in View-mode.
- Select Visit from the Options menu of dd window.
- Prosa takes you to egate.erd where Gate passing data
can be edited.
8. Select Return from the Design menu of Prosa window.
- Prosa brings you back to dgate0.dfd where visit
originated.
Figure 10.3 Sheet property "syspddo" of the context diagram
points to data model
(C) Copyright Insoft Oy
PROSA/SA/M-USE Intensive course
79
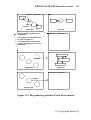
10.3 Integration of multipage data models and context diagram
Previous
syspddo: egate1.erd
Next
syspddo: dgate.dfd,egate2.erd
Appl
dgate.dfd
egate1.erd
syspddo: egate1.erd,nil
egate2.erd
MENU SELECTION "NEXT" IN ERD DIAGRAMMING LINKS MULTIPAGE
ERD DIAGRAMS TOGETHER.
"NEXT" AND "PREVIOUS" SELECTIONS IN ERD DIAGRAMMING ARE
USED TO TRAVERSE BETWEEN ERD'S.
"PREVIOUS" SELECTION IN FIRST ERD DIAGRAM (emta1.erd) IS
USED TO LINK THE WHOLE DATA MODEL TO APPLICATION
(CONTEXT DIAGRAM).
Figure 10.3 Multipage erd diagrams.
(C) Copyright Insoft Oy
PROSA/SA/M-USE Intensive course
80
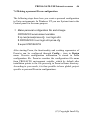
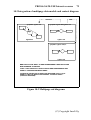
11. SUMMARY: DIAGRAM INTEGRATION
Figure 11.1 summarizes the integration between various SA/SD/RT
models.
Prosa manages diagram linking in Push/Pop and Next/Previous
functions automatically. In standard configuration, once the link
has been established Prosa does not prompt the link when changing
diagram during Push/Pop or Next/Previous functions.
The Push/Pop and Next/Previous prompt dialog can be switched on
by Heavy Dialog Use checkbox on in User Interface page of the
Prosa configuration dialog.
The Push (child) link can also be edited by opening the Property
window for the particular object. The link is internally stored as a
syspfdn (system property file down) -property.
The Pop (parent) link can also be edited with Property selection
from Sheet menu of the Prosa window. The link is internally stored
as a syspfup (system property file up) -property.
The Next/Previous link (horizontal links between erd or class
diagrams) can also be edited with Property selection from Sheet
menu of the Prosa window. The link is internally stored as a
syspddo (system property data dictionary origin) -property. If there
are two link names, first is previous and second is next, single item
denotes next link always.
(C) Copyright Insoft Oy
PROSA/SA/M-USE Intensive course
81
syspddo: egate.erd
Appl
elist
syspfdn
dgate.dfd
egate.erd
Sheet property syspddo points
to egate.erd.
dgate.elt
event list
The property elist of Appl points
to event list dgate.elt.
The automatically created Push
property syspfdn points to child
dgate0.dfd.
syspfdn
dgate0.dfd
sgate0.std
cbreport.c minispecif.
syspfdn
dmreport.dfd
Figure 11.1 Diagram integration in Prosa Environment.
(C) Copyright Insoft Oy
PROSA/SA/M-USE Intensive course
82
12. BALANCE CHECKING IN BATCH MODE
Prosa checks the consistency between diagrams interactively
during design. The consistency or balancing of the whole hierarchy
of models can also be checked with a single command.
1. Open the context diagram dgate.dfd.
2. Select Balance from Design menu of Prosa window.
- Click OK to accept balance report name.
- Point the data transformation to start balancing.
- Answer No to "Save diagrams during check?" question.
(Yes would instruct Prosa to write error indications also
in diagrams as they are shown in interactive checking.)
- Prosa checks all diagrams and minispecifications in the
model hierarchy and shows the result report in your
text editor.
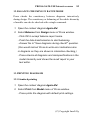
13. PRINTING DIAGRAMS
13.1 Standard printing
1. Open the context diagram dgate.dfd.
2. Select Print from Model menu of Prosa window.
- Prosa prints the diagram with default print settings.
(C) Copyright Insoft Oy
PROSA/SA/M-USE Intensive course
83
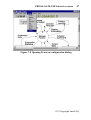
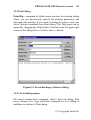
13.2 Print dialog
Print Dlg... command in Model menu activates the printing dialog
where you can interactively specify the printing parameters and
then make the printing. If you want to change the printer used, you
select Options command from Print dialog. The Help page can be
opened by dragging the Help button (?-button) from the upper right
corner of the dialog above a field or above a button.
Figure13.1 Prosa Hardcopy Software dialog.
13.2.1 Print dialog menus
File menu contains Exit command, which closes the dialog. Edit
menu contains Cut, Copy and Paste command for text editing in
multiline text editor of Print dialog.
(C) Copyright Insoft Oy
PROSA/SA/M-USE Intensive course
84
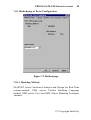
13.2.2 Print dialog buttons
OK button starts printing. Cancel button closes the dialog and
cancels printing.
Options... button activates the printer driver options dialog, see
Figure13.2. Note that you must fill all other fields of Prosa
Hardcopy Software dialog before pressing Options.
Browse... button can be used to browse the input model in the
dialog. Show button can be used to show the contents of the ouput
file in the text editor. If output file definition is wildcard, select
(highlight) the unique filename in multiline text editor and press
Show. Note that certain print formats are not viewable in text
editor.
Figure13.2 Example print options dialog.
OK button starts printing, Cancel button returns you back to Prosa
Hardcopy Software dialog, Setup button opens printer driver
specific setup pages. In Print Range selections Diagram prints
current model, Select allows to browse input models, Hierarchy
prints current model and all child models. Params field contains
the values collected from the Prosa Hardcopy Software dialog.
(C) Copyright Insoft Oy
PROSA/SA/M-USE Intensive course
85
Print Quality combobox contains printer driver specific resolution
values.
13.2.3 Print dialog fields
13.2.3.1 Command
Command defines the name of the executable.
13.2.3.2 Parameter
Parameter defines hardcopy formatting record in the prosa.fmt file.
The parameter combobox shows all pre-programmed hardcopy
formats available in prosa.fmt. The standard delivery contains the
following parameters:
print
Use Windows print driver, autorotate.
meta
Generate Windows Metafile Format (WMF).
metabw
Generate black and white WMF with no fills.
printrot0
Use Windows print driver, do not autorotate.
----------------------------------------------------------------------------Only Unix users need the following parameters:
psa4
EPS, A4, autorotate.
psa4rot0
EPS, A4, no rotate.
psa4rot0t
EPS, A4, no rotate, to top of paper.
psa4rot0b
EPS, A4, no rotate, to bottom of paper.
psa4prot90l EPS, A4 portrait, rotate 90, to left edge of paper.
psa4prot90r EPS, A4 portrait, rot. 90, to right edge of paper.
hco ha4rot0 HPGL, A4, no rotate.
hco ha4prot0 HPGL, A4 portrait, no rotate.
hco ha4rot0_50HPGL, A4, no rotate, scale 50%.
hco ha4prot0_50HPGL, A4 portrait, no rotate, scale 50%.
Prosa Hardcopy Tool is user programmable. The programming
occurs in prosa.fmt file. The programming commands have been
presented in Prosa/sa User’s Manual Appendix C Programming
Plot Tool.
(C) Copyright Insoft Oy
PROSA/SA/M-USE Intensive course
86
13.2.3.3 Options
Options field can have two option strings: option sheetoption,
where option can consist of following switches:
a
b
c
d
e
m
s
Autoclip, i.e. clip empty sheet edges.
Drop border (sheet symbol).
Print changed diagrams only.
Show dialog always.
Show output file in text editor, see Show button above.
Produce prints for all diagrams of the model
(hierarchy).
Select diagrams through select dialog
sheetoption can specify one of the following:
A4 Print A4 sheets only.
A4P Print portrait A4 sheets only.
A3 Print A3 sheets only.
Examples: cm a4 , -cm -a4
Note: Use '-' (hyphen) in front of parameter, option and sheetoption
in standard command line.
Example:
plot –print –m dfas.dfd
13.2.3.4 Input model
Input model defines the diagram where printing begins.
13.2.3.5 Output file
Output file definition is optional and can be a wildcard.
(C) Copyright Insoft Oy
PROSA/SA/M-USE Intensive course
87
13.2.3.6 Log file
Log file defines optional file where all output appearing in
multiline editor is also written.
13.2.3.7 Message window
Message window presents information about the progress of the
printing job.
(C) Copyright Insoft Oy
PROSA/SA/M-USE Intensive course
88
13.3 Print in Unix environment
Printing is configured through
hco (hardcopy) formatting
section "print" in prosa.fmt file.
PROSA
prosa.fmt
Print
selected
prprint
Model
Plot call
PLOT
plot file
Hardcopy file to print spooler
PROSA EXECUTES PLOT TOOL. PLOT TOOL PRODUCES
PLOT FILE IN EPS FORMAT.
PLOT TOOL CALLS PRPRINT COMMAND PROCEDURE WITH
CURRENT PLOT FILE AS A PARAMETER.
PRPRINT ALLOWS FLEXIBILITY IN PRINT SPOOLING.
PRPRINT SPOOLS PLOT FILE TO PRINT SPOOLER.
Figure 13.3 Print facility in UNIX and VMS.
(C) Copyright Insoft Oy
PROSA/SA/M-USE Intensive course
89
14. PROSA MODEL ANALYZER PMA TOOL
Prosa model analyzer PMA generates reports from Prosa's model
data base. PMA tool contains with a set of pre-programmed
analysis report types. In addition to standard reports, the user can
create own analysis report types. The programming of new analysis
report types has been presented in Prosa/sa User’s Manual,
Appendix D. Programming PMA Tool.
14.1 Making analysis reports
PMA tool can be started from Utilities menu (Data, Ref, Mini and
Req items), from PMA icon in Prosa folder or from PMA button in
Prosa/sa toolbar.
Figure14.1 Running PMA from Toolbar icon.
(C) Copyright Insoft Oy
PROSA/SA/M-USE Intensive course
90
Figure14.2 Prosa Model Analyzer dialog.
14.2 PMA dialog menus
File menu contains Exit command, which closes the dialog. Edit
menu contains Cut, Copy and Paste command for text editing in
multiline text editor of PMA dialog.
14.3 PMA dialog buttons
OK button starts report generation. Cancel button closes the dialog
and cancels reporting.
Browse... button can be used to browse the input model in the
dialog. Show button can be used to show the generated report. In
module based reports the output file definition is wildcard. Then
(C) Copyright Insoft Oy
PROSA/SA/M-USE Intensive course
91
select (highlight) the unique filename in multiline text editor and
press Show.
14.4 PMA dialog fields
14.4.1 Command
Command defines the name of the executable.
14.4.2 Parameter
Parameter defines analysis report type. The parameter combobox
shows all programmed reports available in prosa.fmt. Prosa/sa
delivery contains the following standard report types:
DataDictionaryData dictionary analysis.
CrossReferenceCross reference analysis.
MiniSpecificationMinispecification analysis.
UserRequirementsTracingUser requirements tracing analysis.
ProjectModelDatabaseModel data base analysis.
UndefinedDataUndefined data analysis.
PrimitiveData Primitive data analysis.
ProjectAnalysisProject analysis.
ModuleBasedDataModule based data
dictionary analysis.
ModuleBasedRequirementsModule based requirements
tracing analysis.
The user can create also own report types. The programming of
new report types occurs in prosa.fmt file. The programming
commands have been presented in Appendix D Programming PMA
Tool.
(C) Copyright Insoft Oy
PROSA/SA/M-USE Intensive course
92
14.4.3 Options
Options can have the following switches:
d
e
g
m
Show dialog always.
Show output file in text editor, see Show button before.
Produce global report for the whole model (default)
Produce report module by module. This option
requires Prosacdm licence.
Examples: d, dm, -d , -dm
Note: Use '-' (hyphen) in front of parameter and options fields in
standard command line.
14.4.4 Input model
Input model defines the diagram where PMA reporting begins.
14.4.5 Output file
Output file defines report file.
14.4.6 Log file
Log file defines optional file where all output appearing in
multiline editor is also written.
14.4.7 Message window
Message window presents information about the progress of the
reporting.
(C) Copyright Insoft Oy
PROSA/SA/M-USE Intensive course
93
14.5 PMA command line syntax
You always run PMA tool from Utilities menu command, from
toolbar, from PMA icon or through running Prosacdm. The
command line parameters can be used to control the operation of
the PMA tool. You can change the command line parameters by
changing the parameters through Utilities page of Prosa
configuration dialog or in the case of Prosacdm by changing the
command line parameters in Prosacdm command file.
The PMA tool is executed by the command
- pma -parameter [-option] modelname reportname
Command line items correspond to dialog items presented above.
(C) Copyright Insoft Oy
PROSA/SA/M-USE Intensive course
94
14.6 Analysis report examples
Figure 14.3 Data dictionary report
(Parameter=DataDictionary; Options=-ed).
(C) Copyright Insoft Oy
PROSA/SA/M-USE Intensive course
95
Figure 14.4 Cross reference report
(Parameter=CrossReference; Options=-ed).
(C) Copyright Insoft Oy
PROSA/SA/M-USE Intensive course
96
Figure 14.5 Minispecification report
(Parameter=MiniSpecification; Options=-ed).
(C) Copyright Insoft Oy
PROSA/SA/M-USE Intensive course
97
Figure 14.6 User requirements tracing report
(Parameter=UserRequirementsTracing; Options=-ed).
(C) Copyright Insoft Oy
PROSA/SA/M-USE Intensive course
98
Figure 14.7 Model names report
(Parameter=ProjectModelDatabase; Options=-ed).
Figure 14.8 Undefined data report
(Parameter=UndefinedData; Options=-ed).
(C) Copyright Insoft Oy
PROSA/SA/M-USE Intensive course
99
Figure 14.9 Module based data report
(Parameter=ModuleBasedData; Options=-dm;
Outputfile=*.dat).
(C) Copyright Insoft Oy
PROSA/SA/M-USE Intensive course
100
14.7 Requirements tracing report
User Requirements document
id. code
Requirement descr.
r203
aaabbbcccc
r306
xxxyyyzzzz
User Requirements (textual)
document is created in
Requirements definition
phase of development cycle.
Each requirement item has
an identification code, which
can be chapter number or
more specific code.
The identification codes are
attached to SA/SD/RT
modeling elements as req
properties.
Requirements tracing report
id. code
r203
SA/SD/RT modeling element
SA/SD/RT modeling element
........
Requirements tracing facility
of PMA tool collects the
identification codes in
alphabetical order and lists
all elements in the application
model which have particular
id code attached.
r306
SA/SD/RT modeling element
THE PURPOSE OF REQUIREMENTS TRACING REPORT IS TO
PROVIDE INFORMATION WHICH PARTS OF THE MODEL NEED
ATTENTION WHEN CERTAIN USER REQUIREMENT IS GOING
TO BE CHANGED.
Figure 14.10 Principle of requirements tracing.
(C) Copyright Insoft Oy
PROSA/SA/M-USE Intensive course
101
Example of user requirements tracing:
1. Open the data flow diagram dgate0.dfd.
2. Point Manage Gate Equipment data transformation and
open Property window.
3. Type property name "req", enter tab and type property
value "r203"
- Manage Gate Equipment data tr has reference to
item "r203" in User Requirements Document.
4. Add requirements reference "r306" to Make Report data
transformation.
5. Save the diagram dgate0.dfd.
6. Select Pop from workspace menu to enter context
diagram.
- Answer "Save" to Save/Nosave query.
7. Select Req from Utilities menu of Prosa window.
- PMA creates requirements tracing report.
8. Select Vreq from Utilities menu of Prosa window to
view the requirements tracing report.
9. Close the text editor.
(C) Copyright Insoft Oy
PROSA/SA/M-USE Intensive course
102
15 MORE GRAPHICS FEATURES
15.1 Copying between Prosa windows
1. Open the context diagram dgate.dfd.
2. Select Set from Design menu of Prosa window.
3. Point to the upper-left corner of the imaginary rectangle
which wholly encloses data transformation Manage Gate
Control and terminators Host Computer and Ticket
Reader.
4. Click the button.
5. Move mouse to the lower-right corner of that rectangle.
6. Press and hold button down.
7. Select Copy from the Set submenu.
- Prosa copies the contents of the set to Cut & Paste
buffer.
8. Open another Prosa window with Prosa selection from
Utilities menu of Prosa window.
9. In the new Prosa window, select Paste from the Model
menu of Prosa window.
10. Place the set to the desired position.
11. Close the Prosa window.
(C) Copyright Insoft Oy
PROSA/SA/M-USE Intensive course
103
15.2 Comment text
1. Select Comment from the Design menu of Prosa
window.
2. Type comment text (3 lines).
3. Place the comment and click.
4. Attach the comment by pointing to the beginning and
clicking.
5. Edit the comment text.
6. Place the comment and click.
7. New comments are added with Comment selection and
existing comments are edited by attaching to the
beginning of the string and doing the editing.
15.3 Panning and zooming
15.3.1 Panning
1. Experience the standard panning with scrollbars.
2. Next simultaneous panning in two dimensions is taught.
3. Select Screen from the workspace menu.
- The inner rectangle called pan/zoom rectangle in the
centre of Prosa window shows the area which currently
is displayed in Prosa window.
4. Point to the centre of the pan/zoom rectangle, press and
hold the button down, and while holding the button down
drag the mouse to move the rectangle to different
position.
(C) Copyright Insoft Oy
PROSA/SA/M-USE Intensive course
104
5. Release the button.
6. Exit the Screen function by pointing outside the lowerright corner of the pan/zoom rectangle.
- Notice the change of area displayed now in Prosa
window.
15.3.2 Zooming
1. Select Screen from the workspace menu.
- The inner rectangle called pan/zoom rectangle in the
centre of Prosa window shows the area which
currently is displayed in Prosa window.
2. If pan/zoom rectangle is not in the centre of diagram,
move it as described above.
3. Point to the upper-right corner of the pan/zoom
rectangle, press and hold the button down, and while
holding the button down drag the mouse to resize the
rectangle.
4. Release the button.
5. Exit the Screen function by pointing outside the lowerright corner of the pan/zoom rectangle.
- Notice the change of zoom level in Prosa window.
6. Repeat steps 1-3.
7. While changing the size of pan/zoom rectangle, notice
how the border of the rectangle is drawn.
- Solid line indicates the zoom levels where ratio of
graphics and text is correct.
(C) Copyright Insoft Oy
PROSA/SA/M-USE Intensive course
105
- Thick solid line indicates the default zoom level which
is recommended for all design work.
15.4 Help facility
1. Experience with Help menu.
2. Help Index selection allows different entry levels to Help
system.
- The '+' inside the graphic box indicates that more
detailed level of information is available by clicking the
mouse.
3. Close the Help window.
4. Getting Started selection leads you to study small
application examples.
- See the contents of boxes by clicking inside the box.
5. Close the Help window.
6. SA/SD Method selection teaches the principle of the
method.
- See the contents of boxes by clicking inside the box.
7. Close the Help window.
8. Using Prosa/sa selection teaches the principle of
Prosa's user interface.
9. Close the Help window.
(C) Copyright Insoft Oy
PROSA/SA/M-USE Intensive course
106
16. PROJECT WORKING ENVIRONMENT
Figure 16.1 shows one alternative to set up project working
environment in a networked environment. The arrangement is
based on standard file system and is applicable in many network
systems in standard configurations.
Commercial configuration management and version control
environments can be utilised where Prosa models are managed as
standard text documents. Prosa's programmable Utilities menu can
have needed insert, retrieve for edit, retrieve for view etc.
selections to automate the diagram accessing.
Project
System
models
Submodel1
Submodel2
dir
dir
.....
SubmodelN
dir
dir
HIGHER LEVEL DIAGRAMS FORM SYSTEM MODEL AND LOCATE
IN THEIR OWN DIRECTORY (-IES).
LOWER LEVELS ARE MODELED AS A NUMBER OF SUBMODELS
IN THEIR OWN DIRECTORIES.
PROTECTION IS REALIZED IN A DIRECTORY LEVEL OR IN A
DIAGRAM LEVEL.
PROJECT SPECIFIC CONFIGURATION FILE PROSA.CFG IS USED
TO LIST ALL POSSIBLE SEARCH PATHS FOR THE DIAGRAMS.
PROSA'S SEARCH PATH ALLOWS A DISTRIBUTED MODEL
DATA BASE WHERE INDIVIDUAL DIAGRAMS MAY LOCATE
ANYWHERE IN THE NETWORK.
Figure 16.1 Principle of modeling project arrangement.
17. REFERENCES
(C) Copyright Insoft Oy
PROSA/SA/M-USE Intensive course
[Prsa97]
107
Prosa/sa Structured Analysis and Design
Environment, Getting Started, Insoft Oy, 1997.
[Prsau97] Prosa/sa Structured Analysis and Design
Environment, User’s Manual, Insoft Oy, 1998.
[Prc97]
Prosacpp C/C++ Generator, User's Manual,
Insoft Oy, 1997.
[Prsql97] Prosasql SQL Generator, User's Manual,
Insoft Oy, 1997.
[SAtr97] Specifying Systems and Applications with
SA/SD/RT method,
Training Manual, Insoft Oy, 1997.
[SDtr97] Designing and implementing Software with
SA/SD/RT method,
Training Manual, Insoft Oy, 1997.
[Ch76]
Chen, Peter, The Entity Relationship Model
Toward a Unified View of Data, ACM Transactions
on Database Systems, Vol 1, No. 1, March 1976.
[De79]
DeMarco, Tom, Structured Analysis and System
Specification, Prentice-Hall Inc., New Jersey, 1979.
[Wa86]
Ward, Paul, Mellor, Stephen, Structured Development
for Real-Time Systems, Volume 1: Introduction and
Tools, Volume 2: Essential Modelling Techniques,
Volume 3: Implementation Modelling, Yourdon Press,
New York, 1985-86.
(C) Copyright Insoft Oy
PROSA/SA/M-USE Intensive course
1
TABLE OF CONTENTS
1. STRUCTURED ANALYSIS AND DESIGN (SA/SD/RT) METHOD................... 1
2. ENVIRONMENT MODEL ................................................................................. 3
2.1 Description of the environment model................................................................................................... 3
2.2 Context diagram ...................................................................................................................................... 3
2.2.1 Transformation................................................................................................................................. 4
2.2.2 Terminator........................................................................................................................................ 4
2.2.3 Flows................................................................................................................................................ 5
2.3 Event list................................................................................................................................................... 6
2.4 Example environment model .................................................................................................................. 7
3. BEHAVIOURAL MODEL.................................................................................. 9
3.1 Description of the behavioural model .................................................................................................... 9
3.2 Data flow diagram ................................................................................................................................... 9
3.2.1 Data transformation........................................................................................................................ 11
3.2.2 Data flows ...................................................................................................................................... 12
3.2.3 Control transformation ................................................................................................................... 13
3.2.4 Event flows..................................................................................................................................... 14
3.2.5 Data store ....................................................................................................................................... 15
3.2.6 Data buffer ..................................................................................................................................... 17
3.2.7 Example data flow diagram............................................................................................................ 18
3.3 System and subsystem modeling........................................................................................................... 19
3.4 State transition diagram ....................................................................................................................... 20
3.4.1 State................................................................................................................................................ 21
3.4.2 Transition ....................................................................................................................................... 23
3.4.3 Example state transition diagrams.................................................................................................. 25
3.5 Data flow diagram with implicit control.............................................................................................. 26
(C) Copyright Insoft Oy
MODELING/SA Training course
ii
3.6 Minispecification ................................................................................................................................... 26
3.7 Data Dictionary...................................................................................................................................... 29
4 INFORMATION MODEL.................................................................................. 33
4.1 Description of the information model .................................................................................................. 33
4.1.1 Entity.............................................................................................................................................. 34
4.1.2 Relationship.................................................................................................................................... 34
4.2 Integration of ERD's and DFD's .......................................................................................................... 35
4.3 Example information model.................................................................................................................. 36
5. NAMING INSTRUCTIONS.............................................................................. 37
5.1 Model and model file naming ............................................................................................................... 37
5.2 Naming of SA/SD/RT modeling elements ............................................................................................ 37
6. PROSA/OM/SA CASE ENVIRONMENT ........................................................ 38
7. SETTING UP PROJECT, CONFIGURING PROSA ....................................... 39
7.1 Setting up a project ............................................................................................................................... 39
7.2 Setting up a multi-designer project...................................................................................................... 44
7.3 Personal and global Prosa configurations ........................................................................................... 45
7.4 Making a personal Prosa configuration .............................................................................................. 46
7.4.1 Method page of Prosa Configuration ............................................................................................. 48
7.4.2 Path page of Prosa Configuration................................................................................................... 50
7.4.3 MSpec page of Prosa Configuration............................................................................................... 52
7.4.4 Utilities page of Prosa Configuration ............................................................................................. 54
7.4.5 User interface page of Prosa Configuration ................................................................................... 55
7.4.6 Styles page of Prosa Configuration ................................................................................................ 57
8. CREATING SA/SD/RT DIAGRAMS ............................................................... 59
8.1 User interface......................................................................................................................................... 59
(C) Copyright Insoft Oy
MODELING/SA Training course
iii
8.1.1 Command button ............................................................................................................................ 60
8.1.2 Drag button .................................................................................................................................... 60
8.1.3 Command/drag button programming.............................................................................................. 60
8.2 Changing working directory................................................................................................................. 61
8.3 Environment model ............................................................................................................................... 61
8.3.1 Context diagram ............................................................................................................................. 61
8.3.2 Event list ........................................................................................................................................ 63
8.4 Behavioural model................................................................................................................................. 65
8.4.1 Data flow diagram.......................................................................................................................... 65
8.4.2 Consistency checking between data flow diagrams........................................................................ 66
8.4.3 Adding control to data flow diagram.............................................................................................. 67
8.4.4 State transition diagram.................................................................................................................. 68
8.4.5 Consistency checking between dfd and std .................................................................................... 69
8.4.6 Hierarchical data flow diagram design ........................................................................................... 70
8.4.7 Minispecification design ................................................................................................................ 71
8.4.8 Consistency checking between dfd and minispecification.............................................................. 72
9. DATA DICTIONARY ....................................................................................... 74
10. DATA MODELING........................................................................................ 76
10.1 Creating entity relationship diagrams ............................................................................................... 76
10.2 Integrating data model and context diagram.................................................................................... 77
10.3 Integration of multipage data models and context diagram ............................................................ 79
11. SUMMARY: DIAGRAM INTEGRATION ....................................................... 80
12. BALANCE CHECKING IN BATCH MODE................................................... 82
13. PRINTING DIAGRAMS ................................................................................ 82
13.1 Standard printing ................................................................................................................................ 82
13.2 Print dialog........................................................................................................................................... 83
13.2.1 Print dialog menus........................................................................................................................ 83
(C) Copyright Insoft Oy
MODELING/SA Training course
iv
13.2.2 Print dialog buttons ...................................................................................................................... 84
13.2.3 Print dialog fields ......................................................................................................................... 85
13.3 Print in Unix environment .................................................................................................................. 88
14. PROSA MODEL ANALYZER PMA TOOL ................................................... 89
14.1 Making analysis reports...................................................................................................................... 89
14.2 PMA dialog menus .............................................................................................................................. 90
14.3 PMA dialog buttons............................................................................................................................. 90
14.4 PMA dialog fields ................................................................................................................................ 91
14.4.1 Command ..................................................................................................................................... 91
14.4.2 Parameter ..................................................................................................................................... 91
14.4.3 Options ......................................................................................................................................... 92
14.4.4 Input model .................................................................................................................................. 92
14.4.5 Output file .................................................................................................................................... 92
14.4.6 Log file......................................................................................................................................... 92
14.4.7 Message window .......................................................................................................................... 92
14.5 PMA command line syntax ................................................................................................................. 93
14.6 Analysis report examples .................................................................................................................... 94
14.7 Requirements tracing report ............................................................................................................ 100
15 MORE GRAPHICS FEATURES .................................................................. 102
15.1 Copying between Prosa windows ..................................................................................................... 102
15.2 Comment text ..................................................................................................................................... 103
15.3 Panning and zooming ........................................................................................................................ 103
15.3.1 Panning....................................................................................................................................... 103
15.3.2 Zooming ..................................................................................................................................... 104
15.4 Help facility ........................................................................................................................................ 105
16. PROJECT WORKING ENVIRONMENT..................................................... 106
(C) Copyright Insoft Oy
MODELING/SA Training course
v
17. REFERENCES ........................................................................................... 106
(C) Copyright Insoft Oy