1
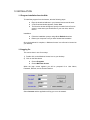
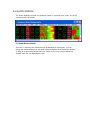
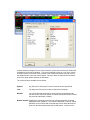
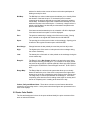
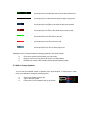
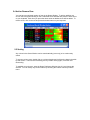
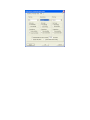
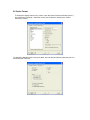
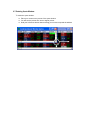
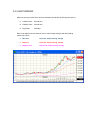
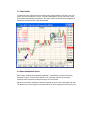
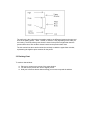
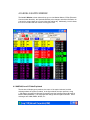
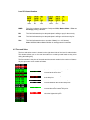
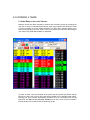
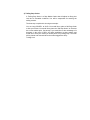
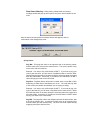
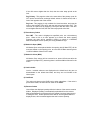
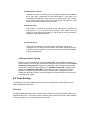
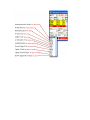
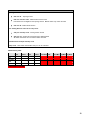
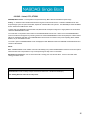
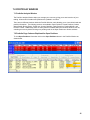
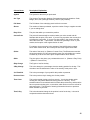
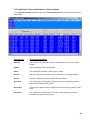
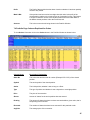
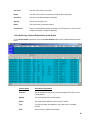
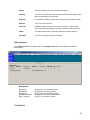
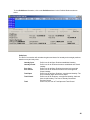
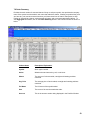
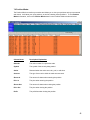
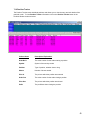
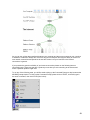
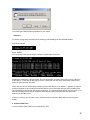
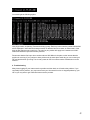
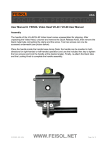
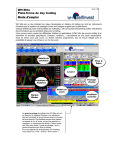
Maximus Access – Level 1.5 USER MANUAL - Version 4.0 TABLE OF CONTENTS 1.0 INSTALLATION ......................................................................................................... 4 1.0 INSTALLATION ......................................................................................................... 4 1.1 Program Installation from the Web ...................................................................... 4 1.2 Logging On .............................................................................................................. 4 2.0 QUOTE WINDOW ...................................................................................................... 5 2.1 Quote Window Details ............................................................................................ 5 2.2 Quote Color Details................................................................................................. 7 2.3 Add or Change Symbols ......................................................................................... 8 2.4 Add or Remove Row ............................................................................................... 9 2.5 Sorting ...................................................................................................................... 9 2.6 Quote Format ........................................................................................................ 11 2.7 Resizing Quote Window ....................................................................................... 12 3.0 CHART WINDOW..................................................................................................... 13 3.1 Chart Details.......................................................................................................... 14 3.2 About Candlestick Charts .................................................................................... 14 3.3 Resizing Chart ....................................................................................................... 15 4.0 LEVEL II QUOTE WINDOW .................................................................................. 18 4.1 NASDAQ Level II Fields Explained.................................................................... 18 4.2 Time and Sales....................................................................................................... 19 5.0 ENTERING A TRADE .............................................................................................. 20 5.1 Order Entry on the Level II Screen .................................................................... 20 5.2 Electronic Communication Networks (ECNs) & Order Types ........................ 22 5.3 Order Types Explained ........................................................................................ 22 5.4 Extended Hours Trading ...................................................................................... 26 6.0 Trade Routing ............................................................................................................ 26 6.1 ARCA - Listed, OTC, OTCBB ........................................................................... 28 6.2 ISLD – Listed, OTC, OTCBB .............................................................................. 35 6.3 Route: NYSE / AMEX – Listed Only .................................................................. 37 6.4 MLX – Listed Only ............................................................................................... 39 6.5 EDGE - Listed, OTC............................................................................................ 40 6.6 BTRD – OTC Only .............................................................................................. 41 6.7 ATD – OTC, LISTED, OTCBB ........................................................................... 41 7.0 PORTFOLIO WINDOW ........................................................................................... 42 7.1 Portfolio Analysis Window................................................................................... 42 7.2 Portfolio Page Columns Explained for Open Positions ..................................... 42 7.3 Portfolio Page Columns Explained for Closed Positions................................... 44 7.4 Portfolio Page Columns Explained for Orders .................................................. 45 7.5 Portfolio Page Columns Explained for Order Details ....................................... 46 7.6 Buying Power ........................................................................................................ 47 7.7 Profit/Loss .............................................................................................................. 47 7.8 Order Summary .................................................................................................... 50 7.9 Position Minder ..................................................................................................... 51 7.10 Position Tracker .................................................................................................. 52 8.0 CONNECTIVITY ....................................................................................................... 53 1.0 INSTALLATION 1.1 Program Installation from the Web To install the program from the Internet, take the following steps: Enter the download address in your internet browser and hit enter A File Download window appears, Select Save The Save As window will appear, specify a location for the file to be saved, in most cases you should save to your root drive, which is drive C: Installation: Follow the installation prompt, using all the Default selections Reboot your computer once you have finished the installation Once the download is complete, a Maximus Access icon will now be located on your desktop. 1.2 Logging On This can be done in one of two ways: 1) Double click on the Maximus Access icon on your desktop 2) Click on the Start button Choose Programs Choose Maximus Access When the login screen appears you will be prompted for a User Name, Password, Domain, and an Account Number. Select Connect and the application will log you on to the network. 2.0 QUOTE WINDOW The Quote Windows provides and unlimited number of real-time price quotes for all US stocks and major US indexes. 2.1 Quote Window Details There are 17 different quote columns that can be displayed for each symbol. You can change the columns displayed on the quote window through the Quote Preference Window. To bring up the preference window place your mouse on any of the column headers (e.g. “Symbol”) and click your Right Mouse button. Column headers that appear in the “Visual Columns” section of the Preference Window will be displayed on the Quote Window. To move an individual column in or out of the “Visual Columns” section click on the column criteria in the Preference Window and then click on the middle arrow to move the column criteria. Once you have all Visible Columns chosen, click on the Apply button and then the OK button. The column features available are as follows: Symbol: Any US stock or index symbol can be entered into the symbol field. Last: The last price of the stock or index printed on the exchange. Bid/Ask: The current best bid and ask price quote based on all exchange data. Use the Level II window for details on market participates various bid and ask prices and the depth of market. BidSize AskSize: Displays the combined volume from all market participates on the bid (BidSize) and ask (AskSize). The volume is displayed in 100’s of shares. A BidSize quote of 525 would mean that total volume bid at the best bid price from all market participates was 52,500 shares. Use the Level II window for details on the amount of share each market participates is bidding at each price level. Bid Map: The Bid Map is a colored coded system that allows you to visually follow the direction of the best bid price. If the best bid price increases compared to the previous best bid price a single green bar is added to the Bid Map. An additional green bar is added to the Bid Map for each additional increase in the best bid price. Conversely, a single red bar is added to the Bid Map if the best bid price decreases compared to the previous best bid price. Tick: If the last executed transaction price is a downtick a D will be displayed. If the last executed is an uptick a U will be displayed. Prev: The previous market day’s closing price of the stock or index. Closing price is based on the regular US market close at 4:00 AM EST. Open: The opening price of the stock or index on the exchange. Opening price is based on the regular US market open at 9:30 AM EST. Net Change: Change between the last printed price and the previous day’s close. High: The highest price of the stock or index printed on the exchange during the current market day. Low: The lowest price of the stock or index printed on the exchange during the current market day. Range%: The Range% is the Net Change divided by the total price range since the stock previous day’s closing price. For example, if the stock closed the previous day at $25.00, opened at $26.00, had a high of $27.00 and a current price of $26.50 the current Range% would be: $1.50 / $2.50 = 60%. Range Map: The Range Map is a colored code system that allows you to visually determine where the price of the stock is compared to the highest and lowest prices of the day, including the stock previous day’s closing price. The range map is a visual representation of the Range%. If the bar is completely green than the stock is trading at the highs for the day and if the bar is completely red it is trading at the lows for the day. Volume, Daily and Minute Chart: These three columns are new features that will be released in an upcoming version. At the present time these figures are represented in the three chart displays. 2.2 Quote Color Details The font and background colours in the quote window identify the price movement of the stock or indexes as follows: Green font on black background: The last print price is higher than the previous day’s closing price. Red font on black background: The last print price is lower than the previous day’s closing price. White font on blue background: The last print price is higher or the same as the previous trade. White font on red background: The last print price is lower or the same as the previous trade. Black font on green background: The last print price is a new high for the day. Black font on red background: The last print price is a new low for the day. Black font on grey background: The last print price is a new 52 week high or low. Updating Level II or Chart windows by changing symbols in the quote window: Click on the symbol and hold down your left mouse Drag you mouse over any part of the Level II or Chart window Release your mouse button and the window will automatically update 2.3 Add or Change Symbols You can view an unlimited number of symbols in the quote window. To add a stock or index to the quote window or change an existing symbol: Click on the symbol or empty box Type in the new symbol Press enter or click anywhere else on the screen 2.4 Add or Remove Row You can have an unlimited number of rows in the Quote Window. To add an addition row, click on the last symbol showing on the Condensed Quote Window and press the down arrow on your keyboard. Each time you press the down arrow an additional row will be added. To remove a row, click on the row and press the delete button on your keyboard. 2.5 Sorting Any column in the Quote Window can be sorted statically (once only) or be continuously sorted. To sort any column once, double click on a column header and it will sort the data in the table by that column. It will first sort ascending, then by double clicking again, it will then sort descending. To establish a running sort, open the Quote Preference Window (see 2.1) and choose the Sort tab. You can sort by any column feature by choosing the column from the pull down menu. 2.6 Quote Format To change the display format of any column, open the Quote Preference Window (see 2.1) and choose the Format tab. Select the column you would like to modify in the “Select Column(s)” window. To change the display format of any quote table, open the Quote Preference Window (see 2.1) and choose the Table tab. 2.7 Resizing Quote Window To resize the quote window: Place your mouse on any corner of the quote window You will see the pointer turn into an angular pointer Hold your left mouse button down and drag your mouse to expand the window. 3.0 CHART WINDOW Maximus Access provides three real-time candlestick charts with the following time period. 1-Minute Chart: 90 total bars 5-Minute Chart: 90 total bars Daily Chart: 260 Days Each chart displays volume and three colour coded simple averages with the following period and colours: Blue Line: 20 period, simple moving average Red Line: 50 period, simple moving average Magenta Line: 200 period, simple moving average 3.1 Chart Details To obtain the open, high and low price and moving average details of any bar move your pointer over the bar with your mouse. A window will appear in the top, left corner of the chart window that displays price details. The trade volume for the bar will be displayed in the bottom, left hand corner of the chart window. 3.2 About Candlestick Charts Each chart is created using standard candlestick. Candlesticks have been around for hundreds of years. They are often referred to as "Japanese Candles" because the Japanese would use them to analyze the price of rice contracts. Similar to a bar chart, candlestick charts also display the open, close, daily highs and lows. The difference in colour displays if the stock was up or down compared to the previous bar. The real body is the 2-dimensional rectangle made by the difference between the open and close of the trading period – either 1 minute, 5 minute or 1 day depending on the chart you are viewing. The body will be green when the close for the period is higher than then the previous bars close, and red that it closes lower than the previous bars close. The thin vertical line above and/or below the real body is called the upper/lower shadow, representing the high/low price extremes for the period. 3.3 Resizing Chart To resize a chart window: Place your mouse on any corner of the quote window You will see the pointer turn into an angular pointer Hold your left mouse button down and drag your mouse to expand the window. To hide any window, click on the dash bar in the top right hand corner of the window. All hidden windows will be displayed along the bottom of the trade window. To expand any hidden window click on the expand button. 4.0 LEVEL II QUOTE WINDOW The Level II Window, shown below allows you to view Market Makers, ECNs (Electronic Communication Network), the Specialist Bid/Ask price changes and trade information on a second by second basis as it occurs during the trading day. Additionally, Level II allows the user to view Bid and Ask volume at every price level. 4.1 NASDAQ Level II Fields Explained The title bar will display open positions, the name of the symbol selected, and the exchange where the symbol is traded. In the figure below, the open position is Long 1,100 shares, the symbol is Microsoft Corporation and the exchange where Microsoft is traded: NNM (NASDAQ). The exchanges will change with the symbol selected. Some exchanges are: NNM, AMEX, NYSE, etc… Level II Column Headers MMID This field indicates the Market Participant ECN, Market Maker / Firm or Exchange posting a Bid/Ask. Bid This field indicates the price the participant is willing to pay for the security. Ask This field indicates the price the participant is willing to sell the security for. Size This field indicates the size or number of lots (1 lot = 100 shares). Note: NASDAQ Market Maker Bid/Ask is usually posted in hundreds. 4.2 Time and Sales The time and sales screen is located on the right hand side of the Level II trade window. This window allows you to view real time sales on a trade-by-trade basis as they occur during the trading day. The first number is the price of the trade and the second number is the number of shares. All price prints are colour coded as follows: Green font on a black background: Trade occurred at the offer price. Red font on a black background: Trade occurred at the bid price. White font on a black background: Trade occurred between the bid and ask prices. Black font on a green background: Trade occurred above the lowest offer price. White font on a red background: Trade occurred below the highest bid price. 5.0 ENTERING A TRADE AN ORDER 5.1 Order Entry on the Level II Screen Maximus Access has been designed to enhance the execution process by providing the user with an easy to understand and efficient order entry interface that allows the trader to focus on trading not on the trading software. The Order Entry Window allows you to control every aspect of an order. With a click of your mouse you can select the routing of your order to any ECN, Market Maker or Specialist. To place an order, enter your desired stock symbol into the symbol input field at the top left corner of the Level II screen. We have chosen GOOG for our example shown above. Entering your quote request automatically accesses all Level I information such as last trade price and size, hi, low, bid, ask, volume as well as the Level II screen located in the two parallel colour-coded boxes of streaming quotes. Type in the desired price. You can also click on any price in the Level II trading window and the price window will automatically update. Use the arrows to move the desired price up or down in 0.01 (cent) increments. Type in the quantity/volume of shares desired. Use the arrows to move the desired share amounts up or down in 100 share increments. Choose the routing to be used from the pull down menu. The default route is ARCA for all exchanges. For more information on each route see the information on trading routing below. Choose the order type from the pull down menu. Not all routes offer the same order types. The order list will automatically change to match the route you choose. For more information on each order type see the information on trade type below. Choose the order expiration from the pull down menu. Not all routes offer the same expiration types. The list will automatically change to match the route you choose. For more information on each expiration type see the information below. Once the price, volume, route and order type information above is entered press on the BUY button to execute a buy order. Once the price, volume, route and order type information above is entered press on the SELL button to execute a sell order. Once the price, volume, route and order type information above is entered press on the SHORT button to execute a short order. The “R” tab resets the Level II screen to the saved Trade Defaults. The “P” tab populates the open position for the symbol selected within the Level II. The open position is then reflected in the volume field in the Order Entry Box. This allows for quick and easy entry of an open position. 5.2 Electronic Communication Networks (ECNs) & Order Types The Electronic Communication Networks are separate pools of liquidity that traders buy and sell stock through. Island is an example of an ECN. Its symbol on a Level II screen is CINN / Island. Traders post limit orders through Island and other traders execute their limit orders through Island. Trades are electronically matched up without the decision making process that a true Market Maker such as Goldman Sachs goes through. There are a number of ECNs that are available. Island (CINN) and Archipelago (ARCA) are the only ECNs, which allow you to post limit orders. They both have execution buttons embedded in the order entry system for you to access easily. You may choose the ECN you prefer by clicking on the Route drop-down menu. 5.3 Order Types Explained 1) Stop Market Order In general, Stop Orders are placed to enter or exit a position at price levels that are predetermined by the trader. They are routed and automatically executed based on the trader’s set parameters. A stop order to buy must always be executed when the buy price is at or above the stop price. A stop order to sell must always be executed when the sell price is at or below the stop price. There are three types of stop orders and these are as follow: A Stop Market Order is an order to buy or sell at the market price once the security has traded at a specified price called the stop price. A stop order becomes a market order when the stop price is reached. You may use a Stop Market Order to exit a position or enter a position. 2) Stop Limit Order A Stop Limit Order is an order to buy or sell at a specified price or better (called a stop-limit price), but only after a given stop price has been reached or passed. It is a combination of a stop order and a limit order. 3) Trailing Stop Orders A Trailing Stop Order is a Stop Market Order that will adjust its Stop price level due to favorable conditions. You will be responsible for entering the trailing amount. The best way to explain this is using an example: You are Long 500 DELL at 20.50. You would like to place a Sell Stop Order to limit your losses. You would like to place the “Sell Stop Order” at .50 below the current market price. Conversely if you would like to take advantage of a decrease in the price of DELL and have established a short position and would like to limit your losses you would place a buy trailing-stop. The order will be placed and executed when the market triggers the StopTrailing Limit Stop Orders Warning – When placing a Stop Order incorrectly a message window will pop-up and require a new price / share number for the order. After the order has been placed a message window will appear to ask for confirmation of the changed stop order. 4) Peg Orders Peg Mkt - This pegs the order to the opposite side of the primary market; and the order price moves as the market moves. The order is priced to buy on the offer, and sell on the bid. Example: You want to buy 1000 shares of MSFT. If you want to peg your order to the best offer, you will enter a Peg Market order to track the Offer. Island ECN will keep track of the order during the execution phase and report back the trade details. Conversely, if you want to sell 1000 shares of MSFT Island will peg your order to the current bid. Peg Best - Peg Best Orders will be sent to Island at the current Bid or Offer depending on which side of the Market you are on. The order will peg itself to the current price based upon whether you are buying or selling. Example: You want to buy 1000 shares of MSFT. If you want to peg your order to the best bid, you will enter a Peg Best order to track the bid. Island ECN will keep track of the order during the execution phase and report back the trade details. Conversely, if you want to sell 1000 shares of MSFT Island will peg your order to the current Offer. Peg Mid - This pegs the order to the midpoint between the bid and offer, with a limit at the primary offer. It rounds buy orders down to the nearest penny and sell orders up to the nearest penny. The client can set an explicit limit by supplying a limit price with the order. If the offer moves higher than the limit, then the order stays priced at the limit. Peg Primary - This pegs the order to the same side of the primary quote for OTC stocks and the best exchange bid/ask values for Listed stocks, with a limit of the opposite side of the market. Peg Last - This pegging is only available for Listed securities, and pegs the order to the last sale of the stock, with the limit being the primary offer. The client set an explicit limit by supplying a limit price with the order. If the offer moves higher than the limit, then the order stays priced at the limit. 5) Discretionary Orders Disc LMT - The order is displayed at specified price, not a discretionary price. When a bid or an offer appears at or above the share quantity minimum, the order will be matched in ARCA, or routed to a NASDAQ Market Participant at their quoted price using SmartBook logic. 6) Market On Open (MOO) All Market Open orders placed before the opening bell (9:30am EST) will be executed, based on the opening price, at or around 10:00am assuming there is sufficient Market Volume for the order. 7) Market On Close (MOC) All Market Close orders will be executed at or around 45 minutes after the closing bell (4:00pm EST), assuming there is sufficient Market Volume for the order. 8) Limit Invisible Lmt-Inv - Invisible orders are not displayed on the Island book, they are not disseminated on the Island data feeds, and they are not included in the Island quote. 9) Limit Book The order only shows on the ISLD book to other subscribers. If the order is priced at the inside, the order will not show on the NBBO. 10) Reserve Orders User defines the displayed quantity while the balance of the reserve remains hidden. Displayed quantity is automatically replenished from the reserve. Market Participants are preferenced for the quoted size when hitting the bid or taking the offer. Orders preferenced to ARCA, at sizes greater than the displayed size, will be matched against the entire reserve quantity. 11) NYSE Direct + Orders Automatic execution of limit orders up to 1,099 shares against the published bid or offer with no opportunity for price improvement. If the order is not immediately executable the order will revert to a regular DOT order. Traders may not send Direct+ orders in the same stock and on the same side of the market more frequently than every 30 seconds. 12) Limit On Open LOO orders are entered for execution at the opening price, provided the opening price is at or within the limit specified. LOO orders permit the investor to scale interest to purchase or sell at various price increments in anticipation of possible imbalances. 13) Limit On Close LOC orders are entered for execution at the closing price, provided the closing price is at or within the limit specified. LOC orders permit the investor to scale interest to purchase or sell at various price increments in anticipation of possible imbalances. 5.4 Extended Hours Trading Maximus Access is available for trading until 8 p.m. EST. When traditional markets are closed, Maximus Access is open for business. Maximus Access offers one of the longest continuous trading sessions available to retail brokers, and currently matches orders that come in during before-hours trading, from 8:00AM to 9:30am EST, and after-hours trading, from 4:00pm to 8:00pm EST. Furthermore, we were among the first trading systems to recognize that the “bankers hours” followed by the exchanges were not meeting the demands of today’s investors allowing for greater flexibility and convenience in managing their assets. 6.0 Trade Routing The following is a list the available Routes for execution and the Order Types that each route offers through Maximus Access Overview The trading platform provides direct access to all US equity and option exchanges through every available market route. There are currently 9 different equity routes and 3 option routes available through the platform. The routing choices are as follows: 6.1 ARCA - Listed, OTC, OTCBB NYSE ARCA - formally known as ArcaEx History: In January 1997, the U.S. Securities and Exchange Commission (SEC) implemented new Order Handling Rules that revolutionized trading in NASDAQ securities. The new rules created the opportunity for Electronic Communications ® Networks (ECNs) to interact directly with the NASDAQ National Market System. The Archipelago ECN was formed in December 1996 in response to these rules. In 2007 ArcaEx was purchased by the New York Stock Exchange. About: NYSE Arca features a trading system that searches for the best execution for each order. NYSE Arca has an internal order book. If orders are not matched on the internal order book they are routed to other pools of liquidity (ECNs, Market Makers, etc) for execution. ARCA is known for its liquidity and smart routing ability. In 2003 ArcaEx purchased the GNET ECN for routing Over-thecounter bulletin board securities (OTCBB). GNET’s technology was integrated into the ARCA route in late 2003. Size: As of 1 March 2007, NYSE Arca is the second largest Electronic Communication Network in terms of shares traded. Approximately one out of every six shares traded on the American financial markets is traded on the system. For New York Stock Exchange-listed securities or Tape A, it accounts for just over 10% of the shares traded. For NASDAQ-listed securities, NYSE Arca accounts for approximately 20% of the trading volume. For exchange-traded funds, NYSE Arca accounts for 30-40% of the traded volume. Minimum Price Increment: 0.01 (not including OTCBB orders) The minimum price variation for quoting and entry of orders on NYSE Arca is .01. OTC and Listed sell orders sent to NYSE Arca with a price of more than two (2) decimals will automatically be rounded up to the nearest penny. OTC and Listed buy orders sent to NYSE Arca will be truncated to two (2) decimal places if they are entered with a price of three or more decimals. Sell Order Example: A sell order is entered at $5.503. NYSE Arca will round up to $5.51. Buy Order Example: A buy order is entered at $5.506. NYSE Arca will truncate the price to $5.50. How does NYSE Arca determine when to match or route an order? NYSE Arca looks for the best price for an order internally or externally. When routing externally, NYSE Arca will route to the Market Participant that has the best order/execution ratio (based on % fill history, time and size shown). For example: Market Participant 1 (MMID1) is bidding $50.625 for 1000 shares. Market Participant 2 (MMID2) is bidding $50.625 for 1000 shares. NYSE Arca is bidding $50 for 500 shares. An order to sell 500 shares at 50 is entered into NYSE Arca. This order will automatically be routed to MMID1 or MMID2 depending on which Market Participant has a better fill history. NYSE Arca facilitates "best execution" for investors and rewards price competition both on and off our system. Order Representation NYSE Arca’s top orders are also represented in the NASDAQ National Best Bid/Offer display and NYSE/AMEX display. These orders display as “ARCA” on the Level II screen. All other order from the ARCA book are shown as “Archip” on the Level II screen 28 Session Hours Opening Session: 8:00 a.m. to 9:30 a.m. ET 8:00 a.m. ET - Opening Auction 9:28 a.m. to 9:30 a.m. ET - Market Order Freeze Period Limit Orders are not eligible for the opening session. Market orders may not be canceled. 9:30 a.m. ET - Market Order Auction Core Trading Session: 9:30 a.m. to 4:00 p.m. ET 3:58 p.m. to 4:00 p.m. ET - Closing Auction Freeze 4:00 p.m. ET - Auction Run and Closing Price Disseminated All Orders entered for the core session will be canceled. Extended Hours: 4:00 pm to 8:00 p.m. ET 8:00 p.m. ET - Limit Orders entered after 4:00 p.m. ET are canceled. ARCA Routing Table Day Limit Market StopLimit StopMarket LMTTrail-Stop Book Dsc-LMT Peg-MKT Peg Best x x x x x x x x x x x x x x x x x x x x Day Plus x Now GTC x x (Not available on OTCBB) 29 Order Type: LMT (Limit Order) Availability: All sessions (core and after hours) Marketable limit orders are matched with the NYSE Arca Book or are routed to other trading venues when such venues have superior prices than those available on NYSE Arca . Order is price improved, if available. Non-marketable limit orders are posted to the NYSE Arca Book based on price-time priority. The best bid and offer in the Book will be displayed on Nasdaq Level II (MMID=ARCA). Limit Order Examples Book Bids $50.05 $50.04 $50.03 1000 500 1500 Book Offers $50.10 $50.12 $50.15 300 2000 1000 Away Market Bids Away Market Offers $50.04 $50.03 $50.00 $50.09 $50.10 $50.15 500 100 1000 700 500 3000 Limit Order: Buy 1000 shares at $50.09 Result: NYSE Arca routes 700 shares to the away market at $50.09. The balance of 300 shares is posted to the NYSE Arca Book at $50.09. Limit Order: Sell 3500 shares at $50.03 Result: NYSE Arca matches 1000 shares at $50.05 and 500 shares at $50.04 against the Book. Routes 500 shares at $50.04 to the away market, then matches the balance of 1500 shares at $50.03 with the NYSE Arca Book. Order Type: MKT (Market) Availability: Only during the core sessions Market orders are matched with the NYSE Arca Book if there is an order(s) at the inside. If NYSE Arca is not at the inside, the order is routed using NYSE Arca's SmartBook sweep logic. Any residual volume will not be routed to the next price level until all quotes at the current best bid offer are exhausted. Market Order Examples Book Bids Book Offers Away Market Bids Away Market Offers $50.05 1000 $50.10 300 $50.04 500 $50.09 $50.04 500 $50.12 2000 $50.03 100 $50.10 $50.03 1500 $50.15 1000 $50.00 1000 $50.15 Market Order: Buy 500 shares Result: NYSE Arca routes order to the away market with the best of $50.09. 700 500 3000 Market Order: Sell 2000 shares Result: NYSE Arca matches 1000 shares at $50.05 and 500 shares at $50.04 with the NYSE Arca Book and routes 500 shares to the away market with the next best price of $50.04. Order Type: Stop-Lmt (Stop Limit) Availability: only during the core sessions 30 A stop limit order to buy becomes a limit order when a transaction in the security occurs at or above the stop price; a stop limit order to sell becomes a limit order when a transaction in the security occurs at or below the stop price Stop Limit Order Example 1. Current NBBO- $19.85 - $20.05 2. Stop Limit Order to Buy 1000 shares with a stop price of $20.07 and a limit price of 20.07 3. Stock prints at $20.07 4. Stop limit order is elected. Limit order for 1000 shares at $20.07 is activated on NYSE Arca Order Type: Stop-Mkt (Stop Market) Availability: Only during the core sessions A stop market order to buy becomes a market order when a transaction in the security occurs at or above the stop price; a stop market order to sell becomes a market order when a transaction in the security occurs at or below the stop price. The transaction must occur between at or between the bid and offer for the order to be triggered. Stop Order Example 1. Current NBBO- $19.85 - $20.05 2. Stop Order to Buy 1000 shares with a stop price of $20.07 3. Stock prints at $20.08 4. Stop order is elected. Market order for 1000 shares is activated on NYSE Arca Order Type: Trailing-Stop (Trailing Stop) Availability: Only during the core sessions Will set your stop order the specified amount above or below the last print. The stop will adjust based on prints that occur between the NBBO. Order becomes a market order when stop is triggered (see MKT order). Order Type: Disc-Lmt (Discretionary Limit) Availability: All sessions (core and after hours) Order is displayed at your specified price not your discretionary price. When a bid or offer appears at or above your share quantity minimum your order will be matched in ARCA or routed to Nasdaq Market Participant at their quoted price using SmartBook logic. User defines Limit Price, Discretionary Price, and a Discretionary Limit quantity. The Discretionary Limit Order is a means to only go to away markets and Book orders at a discretionary price if their size satisfies or exceeds the size requirement on a quote per quote basis. Discretionary Limit orders can be used in conjunction with Reserve Orders Discretionary Order Example National Best Bid is on NYSE Arca at $50.05 / Best Offer is $50.09 Book Bids Price $50.05 Discretionary $50.10 Show Size 100 Reserve 5000 Limit Order to Sell 1000 shares at $50.07 Result: Order is matched with the NYSE Arca Book at $50.07. Order Type: Peg-Mkt (Pegged Market Orders) Availability: only during the core sessions Listed Securities Only 31 Pegged Orders are Limit Orders that move up or down depending on the change in the current NBBO Bid or Offer. These are called Tracking Orders. Peg market orders positions your order to the opposite side of the primary market NBBO (buy order will set at the current offer price, sell order set at bid price). Pegged Market Example National Best Bid is on NYSE Arca at $50.05 / Best Offer is $50.09 Book Bids $50.05 $50.04 $50.03 1000 500 1500 Book Offers Tracking* $50.10 $50.12 $50.15 1000 300 2000 1000 Away Market Bids Away Market Offers $50.04 $50.03 $50.00 $50.09 $50.10 $50.15 500 100 1000 700 500 3000 Market order to Buy 500 shares. Result: Order is matched with the NYSE Arca Tracking Order at $50.09. *Note that Tracking Orders are not displayed in the NYSE Arca Book and are listed here for explanatory reasons only. Order Type: Peg-Best (Pegged Best Orders) Availability: Only during the core sessions Listed Securities Only Pegged Orders are Limit Orders that move up or down depending on the change in the current NBBO Bid or Offer. These are called Tracking Orders. Peg best orders positions your order to the same side of the primary market NBBO (buy orders set at bid price, sell orders set at offer price). 32 Pegged Best Example National Best Bid is on NYSE Arca at $50.05 / Best Offer is $50.09 Book Bids $50.05 $50.04 $50.03 Book Offers 1000 500 1500 Tracking* $50.10 $50.12 $50.15 1000 300 2000 1000 Away Market Bids Away Market Offers $50.04 $50.03 $50.00 $50.09 $50.10 $50.15 500 100 1000 700 500 3000 Pegged Best order to Buy 500 shares. Result: Order is posted at $50.05. If the Bid price of the NBBO moves up to 50.06 then your order will be automatically adjust up to $50.06. *Note that Tracking Orders are not displayed in the NYSE Arca Book and are listed here for explanatory reasons only. Order Type: Reserve Orders User defines the displayed quantity while the balance of the reserve remains hidden. Displayed quantity is automatically replenished from the reserve. Market Participants are preferenced for the quoted size when hitting the bid or taking the offer. Orders preferenced to ARCA, at sizes greater than the displayed size, will be matched against the entire reserve quantity. A Reserve Order has a limit price, a displayed quantity, and a reserve size that is not displayed on the NYSE Arca Book, but is electronically accessible Reserve Order Example National Best Bid is on NYSE Arca at $50.05 NYSE Arca Book Bids Show Amt Reserve 100 5000 500 10000 1500 0 Price $50.05 $50.04 $50.03 Limit Order to Sell 5000 shares at $50.05 Result: Entire order is matched with the NYSE Arca Book at $50.05. NYSE Arca – Expiration Order: DAY - order is canceled at market close of the regular market session Order: DAY+ - order is canceled at the end of the after markets session Order: NOW Now orders will be matched with the NYSE Arca Book or routed for execution to a select group of Market Participants at their quoted price. Any residual volume will automatically be canceled if not executed at the quoted price or better. Now Participants include only those participants that have a direct connection to Archipelago for receiving orders, automatically execute those orders and can accept IOC orders. NOW orders may trade THROUGH better prices since they are routed only to electronic contra parties. Now Order Example: 33 Market Bid Size NYSE Arca NSDQ AMEX 50.00 50.00 50.00 1000 1000 1000 NOW Order to Sell 3000 shares is entered. Result: Order is instantly matched with the NYSE Arca Book at $50 and 1000 shares are routed to NSDQ at $50. The balance of the order is canceled since the AMEX is not a NOW Participant offering immediate execution. Order: GTC (Good to Cancel) - order remains open until cancelled on the date you specify on the pop-up calendar when the order is placed. NYSE Arca Short Sales Nasdaq Short Sales Short sales are not subject to the bid test when order is matched on NYSE Arca Book. Trades routed to other markets will abide by other market’s short sale rules. Limit Orders will be matched down to the limit price, which can potentially be outside the National Best Bid if routing to an away market would not satisfy that market’s short sale rule. In a down bid market when the NBB is from an away market with a bid test, Market Orders will be posted to the NYSE Arca Book at the NBB until they are eligible to trade at the NBB or better. Listed Short Sales For listed stocks, on a down tick from the last sale, a short sell is offered at $0.01 above the last sale. On an up tick, normal trading occurs. 34 6.2 ISLD – Listed, OTC, OTCBB NASDAQ Market Center – Formally INET ECN (Island+Instinet), BRUT ECN and NASDAQ Supermontage History: In 2002 the Instinet ECN and Island ECN merged to create the INET ECN. In 2003 the NASDAQ launch their Supermontage system to replace the SOES, SuperSoes and SelectNet order systems. The NASDAQ purchased the BRUT ECN in 2005 and the INET ECN in 2006. In March 2007 the NASDAQ merged the INET ECN, BRUT ECN and Supermontage into a single platform for all securities called the NASDAQ Market Center. The route ISLD on the platform routes orders to the NASDAQ Market Center book. Orders sent to the NASDAQ Market Center book will execute against any matching order from another NASDAQ Market Center book participant. Market orders (MKT) not immediately matched on the NASDAQ Market Center book are routed to other pools of liquidity (ECNs, Market Makers, etc) for immediate execution. The Level 2 quote for NASDAQ Market Center is displayed as both NSDQ and Island for NASDAQ and OTCBB stocks and Island for Listed Stocks. About Size: NASDAQ Market Center handles over half of all Nasdaq (OTC) orders NASDAQ Market Center is still not as liquid for listed securities and is responsible for only a small percentage of daily orders on the NYSE. Minimum Price Increment: 0.01 for all securities with a closing price of $1.00 and above. 0.001 for securities with a closing price below $1.00. Session Hours NASDAQ Market Center currently accepts and executes orders from 7:00 AM to 8:00 PM (ET). Core Trading Session: 9:30 a.m. to 4:00 p.m. ET 35 Market Center Book Routing Table Limit Day x Day Plus x GTC x IOC x FOK x M ark et Stop-Limit x x x LMT-Book x LMT-INV x Peg-MKT x Peg Best x x x x x x x x x x x x x Order Type: LMT (Limit) Availability: All sessions (core and after hours) Order is posted to the NASDAQ Market Center book at the specified price. NASDAQ Market Center’s top orders are represented in the NBBO as “NSDQ” and Island for NASDAQ and OTCBB stocks and Island for Listed stocks. Order Type: MKT (Market) Availability: Only during core session Market orders are matched with the NASDAQ Market Center Book if there is an order(s) at the inside. If Market Center Book is not at the inside, the order is routed using Market Center Book’s SmartBook sweep logic. Any residual volume will not be routed to the next price level until all quotes at the current best bid offer are exhausted. Order Type: Stop-LMT (Stop Limit) Availability: Only during core session A stop limit order to buy becomes a limit order when a transaction in the security occurs at or above the stop price; a stop limit order to sell becomes a limit order when a transaction in the security occurs at or below the stop price (See LMT order). The transaction must occur between at or between the bid and offer for the order to be triggered. Order Type: LMT-INV (Limit Invisible) Availability: All sessions (core and after hours) Invisible orders are not displayed on the NASDAQ Market Center book, they are not disseminated on the NASDAQ Market Center data feeds and they are not included in the Level II quote Order Type: PEG-MKT (Peg Market) Availability: All sessions (core and after hours) Peg market orders positions your order to the opposite side of the primary market NBBO (buy order will set at the current offer price, sell order set at bid price). The orders will then move up and down as the bid/offer moves. The order will only move up or down to the limit price you set. Order is displayed on NASDAQ level II as NSDQ and Island for Level II listed. Order Type: PEG-BEST (Peg Best) Availability: All sessions (core and after hours) Peg best orders positions your order to the same side of the primary market NBBO (buy orders set at bid price, sell orders set at offer price). The orders will then move up and down as the bid/offer moves. The order will only move up or down to the limit price you set. Order is displayed on NASDAQ level II as NSDQ and as Island for Level II listed. Order Type: Reserve Orders 36 Availability: All sessions (core and after hours) With Reserve order the user defines the displayed quantity while the balance of the reserve remains hidden. Displayed quantity is automatically replenished from the reserve. NASDAQ Market Center Expiration Order: DAY - order is canceled at market close of the regular market session Order: DAY+ - order is canceled at the end of the after markets session Order: IOC (Immediate or Cancel) – will fill all or part of your order. Order will cancel immediately – even with a partial fill. Order: GTC (Good to Cancel) - order remains open until cancelled on the date you specify on the pop-up calendar when the order is placed. Order: FOK (Fill or Kill) – will fill all or none of your order – no partials. If not filled, will cancel immediately. 6.3 Route: NYSE / AMEX – Listed Only About: NYSE orders are sent directly to the NYSE Specialist on the New York Trading floor through DOT. AMEX orders are sent directly to the AMEX Specialist on the American Stock Exchange Trading floor through DOT. Minimum Price Increment: 0.01 NYSE Routing Table Limit Market StopLimit StopMarket TrailStop MOO MOC LOO LOC Ndirect+ Xpress Day x x x x x x x x x x GTC x x x x x AMEX Routing Table Limit Market StopLimit StopMarket Trail-Stop MOO MOC LOO LOC Ndirect+ Day x x x x x x x x x GTC x x x x x 37 Order Type: LMT (Limit) Order is sent to the floor specialist. Order may not show on book. Order Type: MKT (Limit) Order is sent to the specialist. Order does not show on book. Order Type: Stop-Lmt (Stop Limit) A stop limit order to buy becomes a limit order when a transaction in the security occurs at or above the stop price; a stop limit order to sell becomes a limit order when a transaction in the security occurs at or below the stop price (see LMT order). The transaction must occur between at or between the bid and offer for the order to be triggered. Order Type: Stop-Mkt (Stop Market Limit) A stop market order to buy becomes a market order when a transaction in the security occurs at or above the stop price; a stop market order to sell becomes a market order when a transaction in the security occurs at or below the stop price (see MKT order). The transaction must occur between at or between the bid and offer for the order to be triggered. Order Type: Trailing-Stop (Trailing Stop) Will set your stop order the specified amount above or below the last print. The stop will adjust based on prints that occur between the bid and ask. Order Type: MOO (Market on Open) Will only execute at market open (see MKT order). Order Type: MOC (Market on Close) Will execute at market close (see MKT order). Order Type: LOO (Limit on Open) A limit order will be placed at open. If not filled at open the order will be cancelled. Order Type: LOC (Limit on Close) A limit order will be placed at close. Order Type: Ndirect+ Provides automatic and immediate executions of limit orders up to 1,099 shares at the published NYSE quote. NYSE Direct+ will be available on the first quote of the day, when the bid and/or offer is greater than 100 shares. It is not available during a trading halt or a non-firm quote. Note: Specialist can turn off the Ndirect+ system in fast moving market and the order will become a regular LMT order. 38 6.4 MLX – Listed Only About: MLX orders are sent directly to the NYSE/AMEX Specialist on the trading floor through DOT. NYSE/AMEX and MLX are essentially identical in that they both are routed to the floor specialist. However ISI/MLX uses different server technology for processing orders compared to NYSE/AMEX. Generally the NYSE/AMEX routing technology is superior to MLX although in most cases differences are fairly negligible. Minimum Price Increment: 0.01 MLX Routing Table Day GTC Limit Market x x x StopStop-Limit Market Trail-Stop MOO MOC Ndirect+ x x x x x x x x x Order Type: LMT (Limit) Order is sent to the floor specialist. Order may not show on book. Order Type: MKT (Limit) Order is sent to the specialist. Order does not show on book. Order Type: Stop-Lmt (Stop Limit) A stop limit order to buy becomes a limit order when a transaction in the security occurs at or above the stop price; a stop limit order to sell becomes a limit order when a transaction in the security occurs at or below the stop price (see LMT order). The transaction must occur between at or between the bid and offer for the order to be triggered. Order Type: Stop-Mkt (Stop Market Limit) A stop market order to buy becomes a market order when a transaction in the security occurs at or above the stop price; a stop market order to sell becomes a market order when a transaction in the security occurs at or below the stop price (see MKT order). The transaction must occur between at or between the bid and offer for the order to be triggered. Order Type: Trailing-Stop (Trailing Stop) Will set your stop order the specified amount above or below the last print. The stop will adjust based on prints that occur between the bid and ask. Order Type: MOO (Market on Open) Will only execute at market open (see MKT order). Order Type: MOC (Market on Close) Will execute at market close (see MKT order). Order Type: Ndirect+ Provides automatic and immediate executions of limit orders up to 1,099 shares at the published NYSE quote. NYSE Direct+ will be available on the first quote of the day, when the bid and/or offer is greater than 100 shares. It is not available during a trading halt or a non-firm quote. Note: Specialist can turn off the Ndirect+ system in fast moving market and the order will become a regular LMT order. 39 6.5 EDGE - Listed, OTC Direct Edge ECN About: Knight Capital Group owns and operates the Direct Edge ECN. EDGE is currently one of the largest ECNs for OTC securities. Size: EDGE currently handles approximately 5-10% of Nasdaq (OTC) orders. EDGE is still not as liquid for listed securities and is responsible for only a few percent of daily orders on the NYSE. Order Representation EDGE’s top orders are represented in the NASDAQ National Best Bid/Offer display as “EDGX” on the Level II screen. Minimum Price Increment: 0.01 Session Hours EDGE currently accept and executes orders from 8:00 AM to 5:00 PM (ET). Core Trading Session: 9:30 a.m. to 4:00 p.m. ET EDGE Routing Table Day Limit Market x x Day Plus x GTC x IOC x Order Type: LMT (Limit) Availability: All sessions (core and after hours) – OTC and Listed Order is posted to the EDGE book at the specified price. Order Type: MKT (Market) Availability: Only core session – OTC and Listed For immediate, aggressive executions. EDGE Market orders are not displayed in the EDGE book. The order only executes at the inside price (whether in the market or in the E DGE book), working its way through the inside. Orders are sent out at each price increment. Example: Enter a buy offer for 3000 XYZ filled at an average price of 72 (order filled at 71, 72, 73). EDGE Expiration Order: DAY - order is canceled at market close of the regular market session Order: DAY+ - order is canceled at the end of the after markets session Order: GTC (Good to Cancel) - order remains open until cancelled on the date you specify on the pop-up calendar when the order is placed. 40 6.6 BTRD – OTC Only Bloomberg ECN About: BTRD is one of the smaller ECNs and has less liquidity than ARCA, NASDAQ Book and EDGE. As a result orders may not be filled in a quick or efficient fashion depending on the security. Order Type: LMT (Limit) Availability: All sessions (core and after hours) Order is posted to the ATTN book at the specified price. Order Type: Stop-LMT (Stop Limit) Availability: Only during core session a stop limit order to buy becomes a limit order when a transaction in the security occurs at or above the stop price; a stop limit order to sell becomes a limit order when a transaction in the security occurs at or below the stop price. Order displayed on NASDAQ level II as BTRD. The transaction must occur between at or between the bid and offer for the order to be triggered. Order Type: MKT (Market) Availability: Only core session BTRD Market orders are not displayed in the BTRD book. The order only executes at the inside price, working its way through the inside. Orders are sent out at each price increment. Example: Enter a buy offer for 3000 XYZ filled at an average price of 72 (order filled at 71, 72, 73). 6.7 ATD – OTC, LISTED, OTCBB About: ATD was founded in 1988 and currently accounts for over 3% of NASDAQ and Listed volumes. ATD uses fully automated price-prediction systems to smart-route orders to various ECNs, market markets and specialists based on order criteria, price and destination. Share Size Limits: unlimited shares Minimum Price Increment: 0.01 or OTC and Listed Availability: Only during core session ATD Routing Table Limit Market Stop-LMT Stop-MKT Trail-Stop DAY x x x x x GTC x x x x 41 7.0 PORTFOLIO WINDOW THE PORTFOLIO PAGE 7.1 Portfolio Analysis Window The Portfolio Analysis Window helps you manage your accounts, giving you a total overview of your trading. All account information and positions are updated in real time. There are ten different windows within the Portfolio Window, each allowing you to view critical trade and portfolio information. The following sections are available: Open Positions, Closed Positions, Orders, Order Details, Buying Power, Profit/Loss, Account Statistics, Order Summary, Position Minder, and Position Tracker. Additionally, there are many features available within the Portfolio Window, such as, canceling an order by double-clicking on a pending order in the Open Positions or Orders sections. 7.2 Portfolio Page Columns Explained for Open Positions To view Open Positions information click on the Open Positions button in the Portfolio Window as shown below. 42 Column Name Description/ Explanation Symbol The Symbol for the stock you purchased. Acc Type The Account Type section declares 5 separate account type situations: Cash, Margin, Short, OV (Overnight Position), and DY (Day Position). Full Name The Full Name of the underlying stock held in the account. Shares The number of shares purchased; a positive number if long or negative number if you are selling short. Entry Price The price that which you entered the position. Current Price This price will automatically be retrieved when you make a trade and will fluctuate with the price of the stock. If you are long a position, the current price will reflect the current Bid. If you are in a short position, the current price will reflect the inside Ask. If pre-market, it is based off yesterday’s close. If postmarket, the last price in the regular session is used. For options, the current price is the average of the bid/offer during market hours. After market hours, the current price is the last regular hours trade. $Value The value of the stock i.e. (Shares x Current Price). The $Value assumes that prices are quoted in $, if they are quoted in cents you must divide your number of shares by a 100 or look at the price multiplier feature which follows. $Gain The price gain or loss since you purchased the stock i.e. (Shares x Entry Price) – (Shares x Current Price). $Day Change The $ gain or loss for the day. %Day Change This is the change in a percentage since the starting position for the day. This also takes into consideration the value of the security at this point in time. % of Portfolio This is the percentage of your portfolio this position represents. Previous Close This is the previous day’s closing price for the position. Theo Close This is a theoretical closing price for a security. Your broker-dealer and/or clearing firm may load a theoretical closing price for a security. This is sometimes done for securities that did not trade the previous day, and therefore have no previous closing price, or securities, which we do not receive a feed for and cannot price. The purpose of entering a theoretical close is to provide a better estimate of your P&L. Theo $ Day This is the theoretical change in the position’s value for the day. It is used in conjunction with the theoretical close. 43 7.3 Portfolio Page Columns Explained for Closed Positions To view Closed Positions information click on the Closed Positions button in the Portfolio Window as shown below. Column Name Description/ Explanation Order No This is the date and the order id number (Example 0731-5151) of the closed position. Symbol The stock symbol of the closed position Action The initial position, whether it was a Long or a Short Account The type of position and whether it was a day trade or an overnight position. Shares Amount of shares for the entire position that was entered Open Price The opening price of that position (This may be a blended opening position if there was more than one entry price). Shares Out The amount of shares that were closed out of an initial opening position of that stock Close Price The closing price of that position (This may be a blended closing position if there was more than one entry price). 44 Profit The Profit of that position that has been closed out whether it has been partially closed or fully closed. Mark 2 Mkt If the position has been carried overnight then this value is the profit of the closed position relative to the closing price as of yesterday’s close. This feature is unique to Maximus Access. Sum of Mark 2 Mkt column will match Mark to the Market closed positions under the Profit/Loss tab. Account This is the account that is being shown in the Portfolio Window. 7.4 Portfolio Page Columns Explained for Orders To view Orders information click on the Orders button in the Portfolio Window as shown below. Column Name Description/ Explanation Order No This is the date and the order id number (Example 0731-5151) of the closed position. Symbol The stock symbol of the closed position. Action The initial position, whether it was a Long or a Short. Type The type of position and whether it was a day trade or overnight position. Price The price of the execution. Shares Amount of shares for the entire position that was entered Pending The amount of shares that have not been executed within a given order, that is still pending to be executed. Executed The number of shares that have been executed for this particular order AvgPrice The average price of the execution. 45 Last Time The time of the order or execution Status The status of the order or execution (Cancelled, Filled, Rejected) Cancelled The amount of shares that were cancelled Stp-Info The price of the Stop Limit Route This is the route you sent the order to Commission There is a demonstration default commission of 0.05 per share. This is not the actually commission charged for the trade. 7.5 Portfolio Page Columns Explained for Order Details To view Order Details information, click on the Order Details button in the Portfolio Window as shown below. Column Name Description/ Explanation Order No This is the date and the order id number (Example 0731-5151) of the closed position. Symbol The stock symbol of the closed position. Action The initial position whether it was a Long or a Short. Type The type of position and whether it was a day trade or overnight position. Price The price that is entered for execution. 46 Shares Amount of shares of the entire position that entered. Pending The amount of shares that have not been executed within a given order that are still pending to be executed Executed The number of shares that have been executed for this particular order ExePrice The price of the execution Last Time Displays the date and time of the order or execution. When sorting within the Order Detail Window, the orders will sort by date, then time. Status The status of the order or execution (Cancelled, Filled, Rejected) Cancelled The amount of shares that were cancelled 7.6 Buying Power To view Buying Power information, click on the Buying Power button in the Portfolio Window as shown below. Buying Power Buy Stocks Short Stocks Buy Options Sell Naked Options Reg-T vs Equity Buying power for purchasing stocks. Buying power for shorting stocks. Buying power for purchasing options. Buying power for selling naked options. Reg-t vs. your amount of equity 7.7 Profit/Loss 47 To view Profit/Loss information, click on the Profit/Loss button in the Portfolio Window as shown below. Profit/Loss The Profit / Loss section will calculate the gains and losses for intraday and overnight positions based on entry and exit prices. Intraday Open Intraday Closed Prev Open Prev Closed Total Open Total Closed Total Profit/ Loss for all Open Positions established Intraday Profit/ Loss for all Positions that were established and Closed intraday Profit/ Loss for all Open Positions that were held overnight Profit/ Loss for all Positions that were held overnight and Closed intraday Profit/ Loss for all Open Positions, overnight and intraday. The Sum of Intraday Open and Previous Open Profit/ Loss for all Positions, overnight and intraday, that have been closed intraday. The Sum of Intraday Closed and Previous Closed. Profit/ Loss, the sum of Total Open and Total Closed 48 Mark to the Market Mark to the Market is a daily calculation of debit or credit margins resulting from price fluctuations of the underlying asset. It compares the equity and overnight positions closed for the day to the previous day’s close. Starting Equity Shows your starting equity Marked to the Market. Current Equity Shows your current equity Marked to the Market. Closed Positions Profit/ Loss for all closed positions based on the Previous Days Close as the entry price. Used to see if a traders positions were up or down for the day. Open Positions Profit/ Loss for all open positions based on the Previous Days Close as the entry price. Used to see if trader’s positions were up or down for the day. Total P/L Total Profit/ Loss for Open and closed positions with the entry Price using the Previous Days Close. Est Comm An estimate of your commissions for the day. You can establish an estimated commission per share in “Setup Port Win Options” Est Total An estimate of your total daily Profit/Loss. This is equal to your Total P/L minus your Estimated Commission. 49 7.8 Order Summary Provides the total number of executed shares of buys or sells per symbol, also provides the company name of the symbol and the trader's user name that traded the shares. If trading a symbol all day, and you have buy, sell, and short executions then you'll have three lines of data for that symbol; a total number of executed buy shares, total executed sell share, and a total executed shorted shares. To view Aggregate information, click on the Order Summary button in the Portfolio Window as shown in below. Column Name Description/ Explanation Symbol Stock symbol traded. Action Whether the stock was a buy, sell, or sell short. Shares The amount of volume traded, overnight and intraday positions combined. Avg. Price The average price of stock traded, overnight and intraday positions combined. Full Name The full name of the symbol traded. User The name of the user that made the trade. Account This is the account number being displayed in the Portfolio Window. 50 7.9 Position Minder The Position Minder reconciles your trades and allows you to view your positions as they were entered and closed. It will show your open positions, as well as, intraday closed positions. To view Position Minder information, click on the Position Minder button in the Portfolio Window as shown below. Column Name Description/ Explanation OrderNo The order number for a particular trade. Symbol The symbol of the security being traded. Action Shows whether the action was a buy, sell, or sell short. Account The type of account in which the trade was executed. Shares In The amount of shares when entering the position Price In The price when entering the position Shares Out The amount of shares when closing the position Price Out The price when closing the position Profit The profit/loss when closing the position 51 7.10 Position Tracker The Position Tracker tracks individual positions and allows you to view the entry and exit details of the particular order. To view Position Tracker information click on the Position Tracker button in the Portfolio Window as shown below. Column Name Description/ Explanation OrderNo In The order number for the trade entering a position Symbol Symbol of the security traded Position Type of position, whether short or long. Shares Number of shares traded. Price In The price at which the position was entered Order Out The order number for the trade closing a position Price Out The price at which the position was closed Profit The profit/loss when closing the position 52 8.0 CONNECTIVITY 14 COECTIVITY –PING AND TRACERT COMMANDS When using our Peak trading products it is important that you have a fast and reliable Internet connection. The large majority of the problems our clients encounter relate to the speed and/or reliability of their Internet connections. Most 56k dial-up connections will work. In fact, we have client on connections as low as 28K with reliable and fast quotes and executions. If you decide to use a 56k to 28.8k dial up connection it is important to understand that there are two broad categories of dial up connections, backbone providers such as UUNet and generic ISP's such as AOL. Generally the backbone providers are more stable and faster than generic ISP's. Below are the connections we recommend to the Peak platforms from fastest to slowest speeds. 1. T1/DSL - a dedicated internet connection is the best connection. 2. Cable connections are the next best solution. One of the problems with cable is that it uses shared bandwidth. In addition, cable connections tend to be less reliable than DSL. 3. Satellite connections can be very fast, but they also are less reliable than DSL. Satellite connections tend to download information quickly but also tend to slow down sending information out. 4. Dial-up Connection to a backbone provider. 5. Dial-up Connection to a generic ISP. Want to test if your Internet connection is slow today? The site below will help you discover your true connection to the Internet by sending you a file and seeing how long it takes to receive that data. If you have a high-speed connection but Internet traffic is bad, you may find you're connection is no better than a modem - http://bandwidthplace.com/speedtest Please keep in mind that when you use the Maximus Access platforms your computer is receiving realtime data feed from our servers. We receive our market information directly from the exchanges. Since the Peak products are real-time software you must have a real-time Internet connection in order to keep up with the flow of data. Below is a diagram which shows the connection between your computer and our trade servers. 53 As you can see, all the data transferred between your computer and the server must travel over a number of networks. Problems or delays can occur from any point in this path. We have the ability to monitor our own network connections and speed but do not have control over your local ISP or the Internet connections in general. If you question the speed or reliability of your Internet connection please run the following Internet connectivity tests. These two tests are a great way to see how you are connecting to the servers and where a potential problem might exist. To run any of the following tests, you will first need to bring up the Command Prompt or also known as the MS-DOS prompt window. To bring up the Command Prompt, please click on START, click RUN, type in the word "command", then click on OK (illus. below): 54 You should get a MS-DOS prompt window on your screen. 1. PING Test To perform a Ping test to our trade server please type the following into the MS-DOS window: ping 63.99.225.200 Press: ENTER After you press enter, you should get a series of replies that look like this: Reading the results from a ping is simple. The only information you really need to take note of is the time at the bottom - in this case an average of 122 ms - which tells you how many milliseconds it took for the packet to reach the host and return. There isn't any concern unless these numbers are over 200-300 ms or an asterisk "*" appears or "request timed out" appears. If the results do exceed 200-300ms, it may mean that there are some problems with your connection to the Internet, the server's connection, or a connection between you and our server. If an asterisk is displayed, there was no response and that also signifies a problem with the connection between you and the server. If there is a concern you will want to run a Traceroute test to see where the problem is occurring (see below) 2. Continual PING Test A more extensive PING TEST is the continual Ping Test. 55 To perform the continual ping test to our trade server type the following into the MS-DOS window ping -t 63.99.225.200 Press: ENTER After you press enter, you should get a series of replies that look like this: The continual ping test allows you to check your Internet connection over an extended period of time. After you have 20 to 30 lines of continual ping click on the icon in the upper left hand corner of the ping window and then click close. Reading the results from a continual ping is simple. The only information you really need to take note of is the time on each line in ms which tells you how many milliseconds it took for the packet to reach the host and return. There isn't any concern unless these numbers are over 200-300 ms or an asterisk "*" appears or "request timed out" appears. If the results do exceed 200-300ms, it may mean that there are some problems with your connection to the Internet, the server's connection, or a connection between you and our server. If an asterisk is displayed, there was no response and that also signifies a problem with the connection between you and the server. If there is a concern you will want to run a Traceroute test to see where the problem is occurring (see below) 3. Traceroute Test If you have Ping test results above 200-300ms you can use Traceroute to see where the problem is occurring. Traceroute works much like ping in that it sends data packets to a host you specify. However, rather than simply giving you the time it takes for the packets to return, traceroute sends back results for each hop the packet makes. Because of this, Traceroute is the perfect tool to see where network problems are occurring. To perform the Tracert test to the trade server, type: Tracert 63.99.225.200 It will look like: 56 You should get the following replies: Like ping's results, deciphering Traceroute's dialog is easy. Each hop in the route the packet has traveled will be displayed in order with the hostname and/or IP address. Next, the results, in milliseconds, of the three probes that are sent to each hop. The rules for ping results also apply here. Numbers near 200300ms and asterisks represent network problems. Please note that the first hop to show numbers above 200-300ms is the place on the internet that the problem is occurring. If you continue to have problems in the same place each day you can contact your ISP and provide them your Ping Test. In many cases an ISP can route around a troubled server on the Internet. 4. Troubleshooting Many times logging off your Internet service provider and then back on will resolve the problem. If you continually have a problem, you may want to have your line tested for noise or dropped packets by your ISP or you may want to get a different Internet service provider. 57