1
StreetSmart Pro® User Manual
Table Of Contents
Getting Started............................................................................................. 1
Getting Started............................................................................................ 2
New Features .............................................................................................. 4
Logging On & Off ......................................................................................... 9
Main Menu Bar ...........................................................................................10
Demo Mode ...............................................................................................19
Customizing Your Desktop............................................................................20
Configuration & Troubleshooting ...................................................................29
Quick Reference .........................................................................................37
Toolbars ..................................................................................................... 45
Main Tool Bar .............................................................................................46
BALANCES BAR ..........................................................................................48
CHART TOOL BAR .......................................................................................51
STATUS BAR ..............................................................................................55
Live Help ...................................................................................................56
Trading....................................................................................................... 57
Trading Overview........................................................................................58
SmartEx Trading.........................................................................................87
Direct Access Trading ..................................................................................95
Options ................................................................................................... 107
Extended Hours Trading............................................................................. 142
Order Status ............................................................................................ 146
Charts ...................................................................................................... 149
Charting Overview .................................................................................... 150
Studies and Trends ................................................................................... 168
Strategy Testing Tools ............................................................................. 185
Strategy Overview .................................................................................... 186
Strategy Center ........................................................................................ 191
Strategy Tester ........................................................................................ 201
Strategy Performance Details ..................................................................... 207
Strategy Ticker......................................................................................... 214
Strategy Matrix ........................................................................................ 220
Account Detail & Alerts ............................................................................ 223
Account Detail Overview ............................................................................ 224
Account Detail Menu.................................................................................. 225
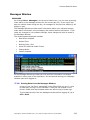
Messages Window ..................................................................................... 229
Order Status ............................................................................................ 230
Saved Orders ........................................................................................... 234
iii
StreetSmart Pro User Manual
Alerts ...................................................................................................... 236
Balances.................................................................................................. 277
Positions.................................................................................................. 286
Transactions ............................................................................................ 291
Market Data Tools .................................................................................... 293
Watch Lists .............................................................................................. 294
Tickers .................................................................................................... 308
Top Ten................................................................................................... 317
Options Top Ten ....................................................................................... 320
Highs & Lows ........................................................................................... 323
Sectors ................................................................................................... 327
News ........................................................................................................ 331
News Overview......................................................................................... 332
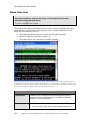
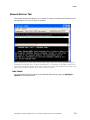
Breaking News Tab ................................................................................... 335
Recent Stories Tab .................................................................................... 337
News Watch Tab ....................................................................................... 340
Stock Screener ......................................................................................... 343
Stock Screener Overview ........................................................................... 344
Creating Stock Screener Queries ................................................................. 346
Screener List View .................................................................................... 349
Stock Screener List Menu ........................................................................... 350
Saving Screener Queries ............................................................................ 353
Query Filter Descriptions............................................................................ 355
Reference................................................................................................. 367
Glossary .................................................................................................. 368
StreetSmart Pro Training ........................................................................... 392
Navigating Online Help .............................................................................. 393
Identifiers ................................................................................................ 395
FAQs....................................................................................................... 396
Printable User Manuals .............................................................................. 408
Agreements ............................................................................................. 409
Link to Customer Education ........................................................................ 411
CSUK and Hong Kong Customers ................................................................ 412
iv
GETTING STARTED
1
StreetSmart Pro User Manual
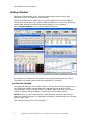
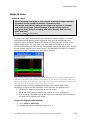
Getting Started
Welcome to StreetSmart Pro®, Schwab’s customizable trading cockpit with
advanced market information for your desktop.
Qualified Schwab Active Trader clients can stay plugged into the fast-changing
market with StreetSmart Pro, Schwab’s leading-edge suite of real-time streaming
market data software and advanced trading features for your desktop.
See the New Features in this version of StreetSmart Pro!
StreetSmart Pro features a customizable cockpit display that keeps key market
information on display without switching applications, including:
QUOTES AND TRADING
View potential liquidity with a detailed view of market activity that includes quotes
from ECNs and market makers. Approved traders get direct access to ECNs,
including INET, NYSE Arca, ONTD BTRD, and BRUT. Approved clients can utilize a
wealth of option trading strategies, including multi-leg complex options.
NOTE: Access to Level II data requires meeting certain eligibility requirements
based on trading frequency. For additional information, please contact your Schwab
Active Trader Team.
See Trading Overview for more information.
2
Copyright © Charles Schwab & Co., Inc. 2006. All rights reserved. (0106-5667)
Getting Started
MARKET DATA TOOLS
Customize and save a virtually unlimited number of streaming, real-time watch
lists. Get real-time streaming headlines providing you with news on the market or
companies you want to watch. View streaming updates on the day's top ten leading
gainers, decliners and volume movers for the NASDAQ and New York / American
Stock Exchanges. Get instant feedback on stocks reaching or approaching their
daily and/or 52-week highs and lows.
CHARTING AND STRATEGY TOOLS
View, Create, and change real-time streaming intraday, daily, and weekly charts
with a wide choice of technical indicators. Compare stocks against each other or
against indices, and construct custom technical analysis displays using the Strategy
Tools.
SOPHISTICATED RISK MANAGEMENT TOOLS
The StreetSmart Pro Alert Window can automatically notify you of potential
opportunities or prompt you to protect your positions, based upon the Alerts you
create. The Special Conditional Orders (an Alert Action choice) can automatically
place a trade for you if the Alert conditions you specify are met. Alerts can be set
up and then saved directly to your desktop, reducing the time spent creating alerts
daily.
STOCK SCREENER
The Stock Screener allows you to quickly find the stocks that meet your trading
strategy. The Stock Screener comes with built-in queries, or you can create and
save your own queries by choosing from many filter variables.
DEMO MODE
In Demo Mode, you can test your trading strategies without risking capital using
real-time data while simultaneously learning to use your software.
ONE-CLICK RESEARCH
Access in-depth, independent reports on schwab.com for the latest fundamental
research.
EDUCATION WEB LINK
Quickly link to all of the online training and educational material available at the
StreetSmart Pro Center with a direct toolbar link.
December 13, 2006
Copyright © Charles Schwab & Co., Inc. 2006. All rights reserved. (0106-5667)
3
StreetSmart Pro User Manual
New Features
The following enhancements are new to StreetSmart Pro® software version 4.5.
These enhancements are grouped by topic and under each new feature is a
hyperlink to direct you to the specific section of Online Help where this item is
discussed.
LAYOUT & CUSTOMIZATION
BACKUP LAYOUTS
The software will now save a backup of your layout on your computer, so that if
your layout becomes corrupted or you save changes to it that you wish to
reverse, you don't have to start from scratch.
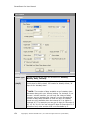
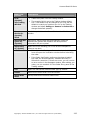
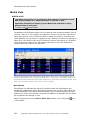
CUSTOMIZABLE BALANCES BAR
Select from 20+ account statistics to display at the top of your trading window at
all times. To enable this feature, click View > Balances Bar in the main menu.
You can select which statistics to display by clicking on Settings > Balances
Bar in the main menu or by right-clicking on the Balances Bar and selecting
Balances Bar...
You can also change any of the statistics to another statistics on the fly by rightclicking on the name of the stat and selecting a different one from the drop-down
list.
More on the Balances Bar
ENHANCED PRINTING FEATURES
Under the File menu in windows that allow printing, a new option called Page
Setup allows you to customize your printouts with headers, footers, grid lines,
etc.
LINKS TO SCHWAB.COM
In the main menu bar, click on the Schwab.com menu to access links back to
various Schwab.com features, such as research, market analysis, and much
more.
NEWS
ENHANCED NEWS INTERFACE
The News window has been updated to be more streamlined and intuitive, as well
as to include the ability to search for recent news based on News Codes.
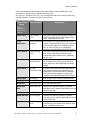
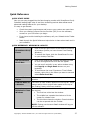
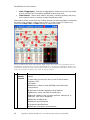
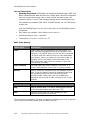
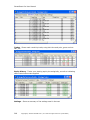
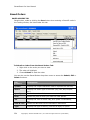
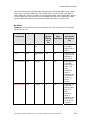
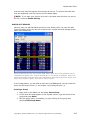
WATCH LISTS
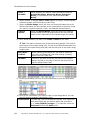
NEW WATCH LIST COLUMNS
Several new Watch List Columns have been added including the display of market
data for Opening and Closing Cross orders. NASDAQ and NYSE accept and store
on-close order types that are executable only at market close. Leading up to the
4
Copyright © Charles Schwab & Co., Inc. 2006. All rights reserved. (0106-5667)
Getting Started
close, the exchanges disseminate information about order imbalances in the
closing book, along with an indicative closing price.
At 4:00 p.m., Eastern Time (ET), the closing book and the continuous book are
brought together to create a single Closing Cross.
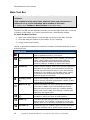
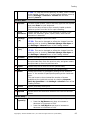
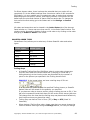
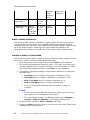
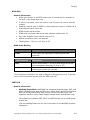
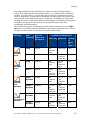
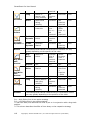
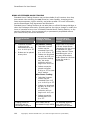
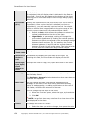
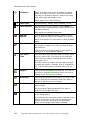
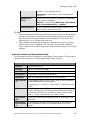
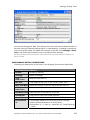
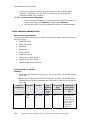
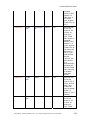
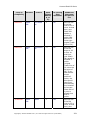
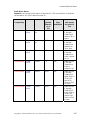
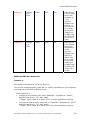
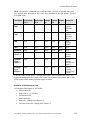
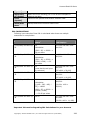
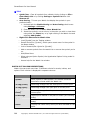
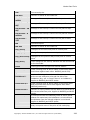
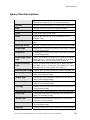
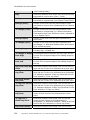
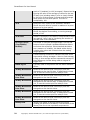
The new columns include:
Column Short
Name
Column Name
Description
Name
assigned in
Watch List
Column
Close Far $
Far Clearing
Price
The Close Crossing price at which orders in
the closing book would clear against each
other. NASDAQ stocks only.
Close
Imbalance
Close Imbalance The number of closing shares that would
Quantity
remain unexecuted at the current reference
price and the side of the imbalance (buy,
sell, or none if there is no imbalance).
Applies to both NASDAQ and NYSE stocks.
Close Near $
Near Clearing
Price
The Close Crossing price at which orders in
the closing book and continuous book
would clear against each other. NASDAQ
stocks only.
Close Paired
Number of
Paired Shares
The number of closing shares that are able
to be paired off at the current reference
price. Applies to both NASDAQ and NYSE
stocks.
Close Ref $
Current
Reference Price
A Close price within the NASDAQ inside at
which paired shares are maximized, the
imbalance is minimized and the distance
from the bid-ask midpoint is minimized.
Applies to both NASDAQ and NYSE stocks.
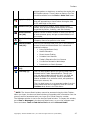
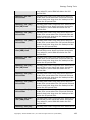
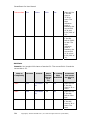
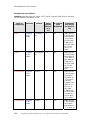
Ending Ask
Ending Ask
Ending ask of the regular trading session
Ending Bid
Ending Bid
Ending bid of the regular trading session
NYSE Ask
NYSE Ask Price
Current NYSE ask price
NYSE Ask
Size
NYSE Ask Size
Displays the highest number of shares
available from a specific MM/ECN within the
inside NYSE Ask.
NYSE Bid
NYSE Bid Price
Current NYSE Bid price.
NYSE Bid Size
NYSE Bid Size
Displays the highest number of shares
available from a specific MM/ECN within the
inside NYSE Bid.
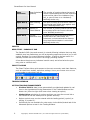
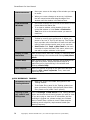
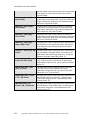
Open Far $
Far Clearing
Price
The Open Crossing price at which orders in
the opening book would clear against each
other. NASDAQ stocks only.
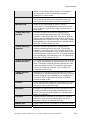
Copyright © Charles Schwab & Co., Inc. 2006. All rights reserved. (0106-5667)
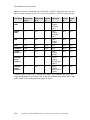
5
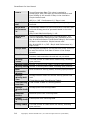
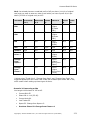
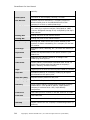
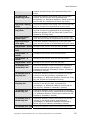
StreetSmart Pro User Manual
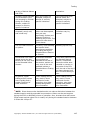
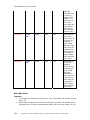
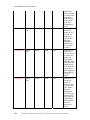
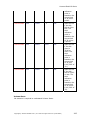
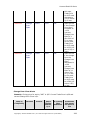
Open
Imbalance
Open Imbalance
Quantity
The number of opening shares that would
remain unexecuted at the current reference
price and the side of the imbalance (buy,
sell, or none if there is no imbalance).
NASDAQ stocks only.
Open Near $
Near Clearing
Price
The Open Crossing price at which orders in
the opening book would clear against each
other. NASDAQ stocks only.
Open Paired
Number of
Paired Shares
The number of opening shares that are able
to be paired off at the current reference
price. NASDAQ stocks only.
Open Ref $
Current
Reference Price
An Open price within the inside at which
paired shares are maximized, the
imbalance is minimized and the distance
from the bid-ask midpoint is minimized.
NASDAQ stocks only.
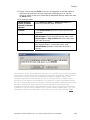
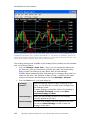
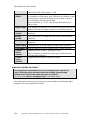
CHARTS
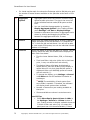
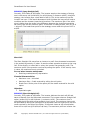
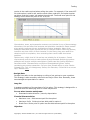
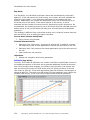
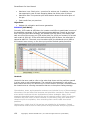
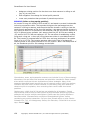
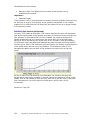
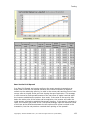
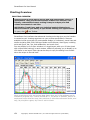
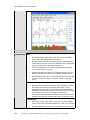
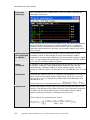
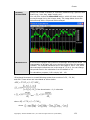
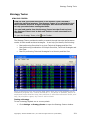
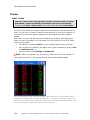
NEW STUDY - PARABOLIC SAR
The Parabolic SAR (stop and reverse) is a trend-following indicator that may help
establish stop loss parameters, as well as signaling opportune times to buy or sell
a stock. Because it's a trend-following indicator, it tends to be less useful in a
sideways market and more useful in a strongly trending market.
A line above the price may indicate a bearish trend, and a line below the price
may point to a bullish stock.
CHART TOOLBAR
The Chart Toolbar allows quick access to the most commonly used chart features,
such as trend lines, studies, and other settings. Hover your mouse over an icon
in the toolbar to see what it will do.
TRADING WINDOW
OPTION TRADING ENHANCEMENTS
6
•
Dividend Yield % data is now automatically provided and updated in real
time in the Hypothetical Pricing/Parameters in the Trade Window and the
Watch List (from the right-click menu when viewing an option).
•
Market Value calculation for option positions now uses the current bid or
ask instead of the last trade price for greater accuracy.
•
Option symbols may now be entered with the leading period (.symbol) or
trailing .o (symbol.o).
•
Sell-Writes are now available for order entry via the Write/Unwind tab of the
Advanced Options screen in the Trading Window.
Copyright © Charles Schwab & Co., Inc. 2006. All rights reserved. (0106-5667)
Getting Started
•
Option traders may now place Cash Secured Equity Puts (CSEPs) in both
cash and margin accounts. Cash will be withheld from buying power in the
amount of 100% of the assignment value of the short put position if it cannot
be paired with either a short position in the underlying stock or an existing
long put position.
•
Options trading in pennies (currently scheduled to begin in January 2007)
will be supported. For more information on the roll-out of option trading in
penny increments visit
http://www.sia.com/options_markets/html/penny_pilotprogram.html.
•
Dividend Reinvesting is now available in the Buy-Write order entry tab of the
Advanced Options screen of the Trading Window.
•
You may now view price indications from several exchanges in the Advanced
Option Order window.
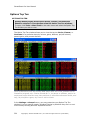
NASDAQ SINGLE BOOK
NASDAQ® has integrated SuperMontage, INET, and BRUT branded market data
facilities into a Single Book. While the integration does not impact the existing
order routing venues and order types, the migration results in Level II data
display changes within StreetSmart Pro®.
The software consolidates SIZE, BRUT and INET quotes into one INET quote at
each tier.
Visit the NASDAQTrader.com for more information on the NASDAQ Systems
Integration.
SUPERMONTAGE PREFERENCING
As part of NASDAQ efforts to become operational as an exchange and in order to
comply with exchange price/time priority rules, you may no longer preference
individual Market Participants via SuperMontage. All SuperMontage orders will
route as a "broadcast" order.
ECN NAME CHANGES
Due to ECN ownership changes, NTRD is now displayed as ONTD in your venue
selection menu and Level II/ECN book display.
TRADING WINDOW SETTINGS
•
In your Level I display, you may now choose whether to display Change
from Close, Change from Open, or Change from Previous Close. Select
your favorite from the Trading Window General Settings window under the
L1 Data tab.
•
In the L2 Data tab of the Trading Window General Settings, you can check
Remove Stale Quotes to filter out stuck Level II quotes during market
hours.
Copyright © Charles Schwab & Co., Inc. 2006. All rights reserved. (0106-5667)
7
StreetSmart Pro User Manual
8
•
The new Sort Quotes by Size setting in the L2 Data tab, if checked, will
sort all the posted quotes at each tier in Level II by Size and then Time, so
the largest quote would be at the top of the tier.
•
If checked, the new Color Watches at Inside Only feature of the L2 Data
tab will highlight the watched Market Makers/ECNs only when they are at the
inside bid or ask.
Copyright © Charles Schwab & Co., Inc. 2006. All rights reserved. (0106-5667)
Getting Started
Logging On & Off
Starting the Software and Logging On
1. Double-click on the StreetSmart Pro® icon located on the desktop (OR go
the Windows task bar, click on Start > Programs > Schwab >
StreetSmart Pro).
2. The main menu will open, and the Logon window will appear. (If you cancel
the logon window, you can reopen it from the File menu.)
3. Type the Logon ID assigned to your account.
NOTE: To logon to StreetSmart Pro® in either Live or Demo mode, you
must have a Schwab Logon ID and Password (the same password you use
for trading web site). The ID is either your Social Security number (domestic
clients only) or a Customized User ID (applicable to all clients) . StreetSmart
Pro® will not allow you to logon with your Schwab Account Number and
Password. If you need help logging on to StreetSmart Pro® or setting up an
User ID, please call your Schwab Active Trader Broker (domestic clients) or
your Schwab Investment Specialist (Europe and Hong Kong customers).
4. In the Password field, enter the password you selected upon opening your
account.
5. Click on Live Logon or Demo. When trading in Live mode you will effect
changes to your portfolio using your own capital while Demo mode allows
you to become familiar with the software and practice your trading in a
simulated environment. Refer to Demo Mode for more information.
6. If the log on is successful, it will prompt the default layout.
Logging Off and Exiting the Software
1. To exit the system you must go to the main menu
2. Click on File > Exit
3. Click OK to close any subsequent dialog boxes that appear
OR
1. Click on the close button
in the right-hand corner of the main menu.
2. The system will ask you to confirm the action.
NOTE: You will automatically be logged off if you close the Account Detail window.
Copyright © Charles Schwab & Co., Inc. 2006. All rights reserved. (0106-5667)
9
StreetSmart Pro User Manual
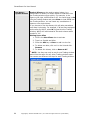
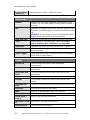
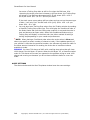
Main Menu Bar
Use the Menu Bar at the top of your window for quick access to
Schwab.com links, Live Help, layouts and other software settings, and
more.
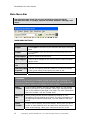
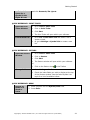
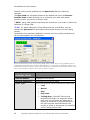
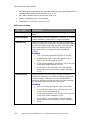
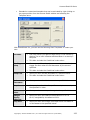
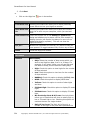
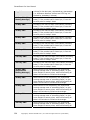
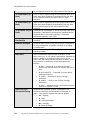
MAIN MENU OPTIONS
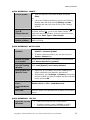
FILE
Logon
Click Logon to connect to your account and begin receiving
data.
Logoff
Click Logoff to exit your account and disconnect from the
servers.
Load Layout
Click to choose a saved layout.
Save Layout
Click to save changes to the current layout under the same
layout name.
Save Layout
As
Click to save the layout as a new name.
Recently Used The last five layouts used are listed for convenient loading.
Layouts
Click on the name of the layout you want to see.
Exit
Click Exit to logoff and close the software.
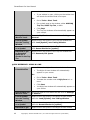
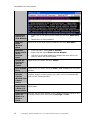
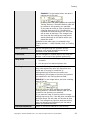
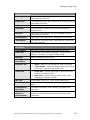
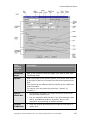
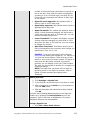
TOOLBARS
TIP: Click on any of the toolbars (except the Status Bar) and drag it to
move it to another location in your layout. Be sure to Save your layout under
the File menu if you make layout changes you wish to keep.
Main
Toolbar
Click to hide or display the main toolbar where you can access
many of the tools in your software. Hover your mouse over an
icon in the toolbar to see what it will open. For more information
about the toolbar, visit the Toolbar topic.
Balances
Bar
Select among several account statistics to display in your
StreetSmart Pro® window at all times. For more information on
configuring the statistics displayed, visit the Balances Bar topic
below.
Chart
Toolbar
Click to hide or display the Chart toolbar, which gives you quick
access to chart features such as trend lines, retracements, and
other chart settings. Hover your mouse over an icon in the
10
Copyright © Charles Schwab & Co., Inc. 2006. All rights reserved. (0106-5667)
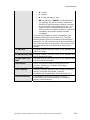
Getting Started
toolbar to see what it will open. See Chart Toolbar for more
information on this tool.
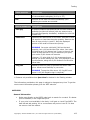
Status Bar Click to hide or display the server and order routing status bar at
the bottom of the software window. See Status Bar for more
information.
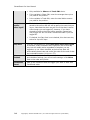
Live Help
Bar
Click to hide or display the Live Help bar, which you can click to
open a chat session with a StreetSmart Pro client support
representative.
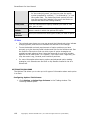
! NOTE:
It is important that you do not use the Live Help panel
in StreetSmart Pro to request, authorize or effect the purchase or
sale of any security or commodity, to send fund transfer
instructions, or to effect any other transactions. Any such
requests, orders or instructions that you send will not be accepted
and will not be processed by Schwab.
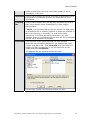
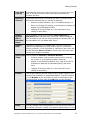
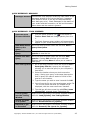
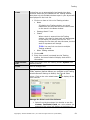
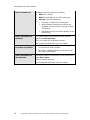
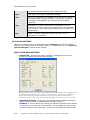
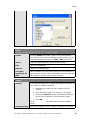
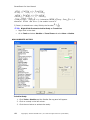
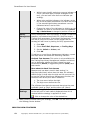
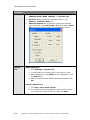
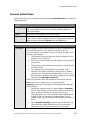
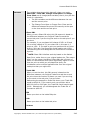
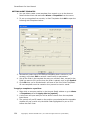
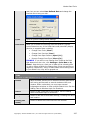
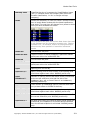
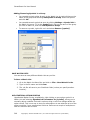
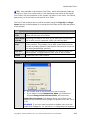
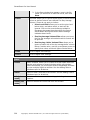
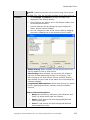
Customize
The Customize menu option provides you with access to
customize the information displayed in the Balances Bar, Chart
Toolbar, and Status Bar. Click Customize, and then select the
toolbar you wish to customize, or you can right-click on the
toolbar and select Customize...
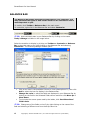
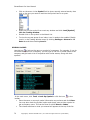
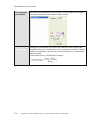
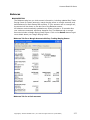
For Balances Bar, the following window will open:
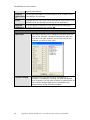
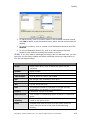
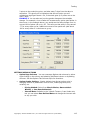
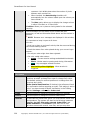
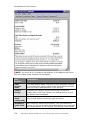
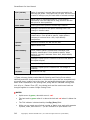
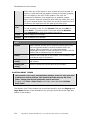
For the Chart Toolbar, the following window will open:
Copyright © Charles Schwab & Co., Inc. 2006. All rights reserved. (0106-5667)
11
StreetSmart Pro User Manual
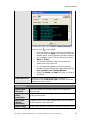
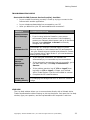
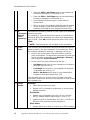
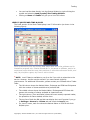
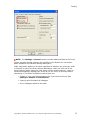
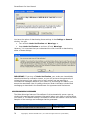
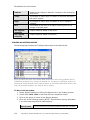
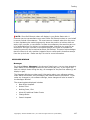
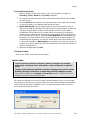
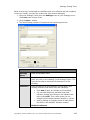
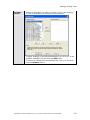
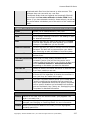
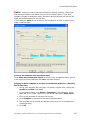
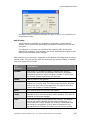
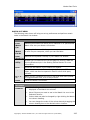
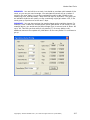
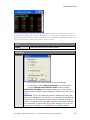
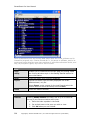
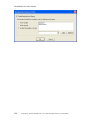
For the Status Bar, the following window will open:
Check the routing venues you wish to monitor in the Status Bar
at the bottom of your window. If the route is available, it will
display in green; if unavailable, red.
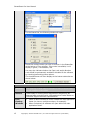
You may also indicate whether the Caps Lock and/or Number
Lock should be permanently enabled or disabled in the software
by checking/unchecking those options.
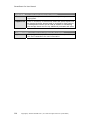
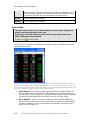
The checked boxes will then display at the bottom status bar as
shown below:
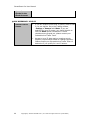
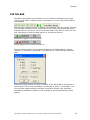
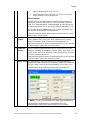
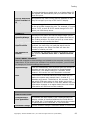
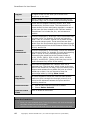
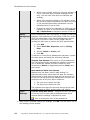
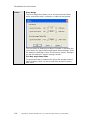
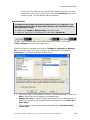
SETTINGS
GENERAL
You must log off after making changes to many of these fields
for the changes to take effect.
Servers
These fields for making server adjustments should only be
changed after consulting with a Schwab Active Trader Broker or
Technical Support Services representative.
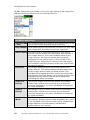
FreeFloating
Windows
•
Check to allow windows to move outside the main application
frame (to view on multiple monitors, for example).
•
When unchecked, all windows will open within the main
application frame.
12
Copyright © Charles Schwab & Co., Inc. 2006. All rights reserved. (0106-5667)
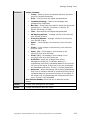
Getting Started
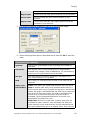
Auto-Save
Layouts
Automatically saves the current layout of your screen when you
exit. If you do not want to save your layout upon exiting,
uncheck this box.
Inactivity
Timeout
Customize the amount of time that you wish to remain online
before the software logs you off due to inactivity.
•
Select a number between 1 & 8. The default setting is 1.
•
When you change this setting, a confirmation message will
appear in the Messages window.
•
Logging off and then back on is not required for this
setting to take effect.
Update
Equities
P&L in
Extended
Hours
When checked, allows you to choose Last Trade Price or
Bid/Ask Price to calculate after hours P&L. When unchecked,
P&L calculations will use the closing bid/ask to calculate P&L, so
the calculation will not update after hours.
Update
Rate
Increase or decrease your Update Rate. This will control the
speed of the data that your CPU must process. If you have a
slower processor, it may be helpful to reduce this rate. Move the
pointer between Slow and Fast to control how many times per
second your window refreshes.
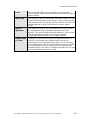
Open Links
Using:
Choose between Internal or External Browser.
•
Controls whether web browsers launch within (internal)
the cockpit or as a separate window (external).
•
Applies to the Education Weblink icon, right-click links to
Schwab.com Research & Extended Quotes, and News
links.
•
Logging off and then back on is not required for this
setting to take effect.
Folders
The Folders settings provide a way to save certain types of files
used by the software in a predictable location. Type the location
or click Browse to find a location in which to save each of the
following types of files, then click OK when you are finished.
Proxy
You can change Proxy configurations if you use a Proxy server or
are behind a firewall. Contact your Network Administrator for the
Copyright © Charles Schwab & Co., Inc. 2006. All rights reserved. (0106-5667)
13
StreetSmart Pro User Manual
appropriate settings.
Level II
Subscriptio
n
Click to get information on subscribing to Level II Data in your
StreetSmart Pro software.
Fonts
Change the font, style and size as well as the Script style of your
balances that are displayed at the top of the application.
Account
Nickname
You can assign a nickname to the account youre viewing by
entering the nickname and clicking OK.
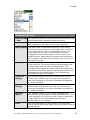
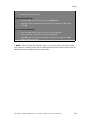
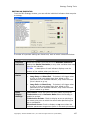
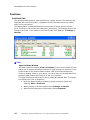
TOOLS
Start Tool
This feature allows you to change the windows that are
open in the software. Windows listed on the right can
only have one open instance; put a check next to the
windows you wish to have open.
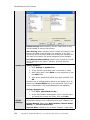
Symbol Lookup
Use this tool to look up the name or symbol of a
company. For example, if you do not know the symbol
for a company, you can type in the full or partial name of
the company and get back a list of companies with
similar names, along with their symbols.
14
Copyright © Charles Schwab & Co., Inc. 2006. All rights reserved. (0106-5667)
Getting Started
In the main menu, click Tools > Look Up Symbol or
click the icon
Find Active Tool
in the toolbar.
•
Enter the name or as much partial information as
you have and click Enter. You may also check the
Symbol option and simply enter a ticker symbol to
get a company name. This can be done for either
Stock or Index.
•
The closest matches to what you entered will
appear at the top of the list.
•
You can load the data directly into the Quotes
Window by right-clicking the symbol and selecting
Load [symbol] into Trading Window.
•
Clicking on Name and Index will give you a list of
all indices.
Restores active windows that may be hidden or
minimized. Click Find Active Tool, and then select the
window you wish to view.
Schwab.com
Quotes and
Research
Opens a Schwab.com browser session to the Quotes &
Research tab.
Ken Tower
Daily
Comments
Recap of the previous trading day and a technical forecast
of the upcoming day.
Ken Tower
Weekly
Comments
In-depth review of the past trading weeks with an analysis
of the market's long-term trend.
Market Edge
Access stock ratings, workshops, market commentary, and
Copyright © Charles Schwab & Co., Inc. 2006. All rights reserved. (0106-5667)
15
StreetSmart Pro User Manual
Ratings
much more from Market Edge.com.
Market Insight
Get insightful market and investing commentary by Schwab
Center for Investment Research.
Options Street
Access Schwab.com option trading tools, including
advanced options, screeners, calculators and more.
Options Street
- Spread
Search
Go straight to the Schwab.com option spread search tool.
Account
History
Open a Schwab.com browser session to your account
history.
Account
Performance
View your account performance on Schwab.com.
Account
Transfers and
Payments
Manage and view any transfers or payments coming in or
out of your Schwab.com account.
Online
Seminars
Access information and schedules for online seminars
through Schwab.com.
Schwab
Investing
Workshops
Find out when a Schwab Investing Workshop will be in your
area.
Customer
Service
Go directly to the Customer Service page of Schwab.com
where you can get more information on transfers and
payments, account services, managing your profile, and
much more.
Subscribe to
Level II
Click here for instructions and information on subscribing to
Level II data.
Add Direct
Access
If you already have a subscription to Level II data service,
you may qualify for Direct Access trading, which allows you
to target and send orders directly to ECNs and NASDAQ
Market Makers. Select this menu item to get more
information on Direct Access trading.
Disclosures/
Agreements
View the user agreements that may be associated with your
account. If you have questions about which agreements
apply to your account, contact your Schwab Active Trader
representative.
At A Glance
Get an overview of basic balance information for your
account(s) on Schwab.com.
My Benefits
See what services, tools, and products are available to you
based on the type of account you hold with Schwab.
StreetSmart
Pro
Access the StreetSmart Pro section of Schwab.com where
you can learn more about the product, download the latest
version, access online seminars, and more.
16
Copyright © Charles Schwab & Co., Inc. 2006. All rights reserved. (0106-5667)
Getting Started
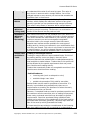
HELP
Live Help
The Live Help window allows you to communicate directly with a
Schwab Active Trader Representative without having to pick up
the phone. Just open the Live Help window, type your question,
and the representative will respond in real time.
Sending Messages:
1. In the Main Menu, click Help > Live Help or click the
icon in the toolbar
2. Type in the message under Enter Message
3. Click Send
4. To clear previous messages, click Clear.
5. Click Exit to close down the box.
! NOTE:
It is important that you do not use the Live Help
window in the Schwab® trading platforms to request, authorize
or effect the purchase or sale of any security or commodity, to
send fund transfer instructions, or to effect any other
transactions. Any such requests, orders, or instructions that
you send will not be accepted and will not be processed.
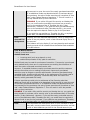
Reconnect
to Servers
If the Status Bar indicates you have been disconnected from the
server (one of the two indicator lights would be red) and
automatic reconnection was not successful, click Reconnect to
Servers.
If the problem persists, log off and try logging on again.
Contact your Schwab Active Trader team if you are still unable
to connect.
Online Help
Click to open the online help files.
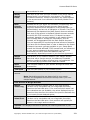
Layout
The Layout Assistant helps you identify the right layout for your
Copyright © Charles Schwab & Co., Inc. 2006. All rights reserved. (0106-5667)
17
StreetSmart Pro User Manual
Assistant
style of trading. Click through the tabs at the top of the window
and move your mouse around the screen to see a description of
each window highlighted on the right.
Once you have found a layout you wish to use (you can
continue to customize the layout once you have selected it),
click Select This Layout.
New
Features
Click to read about the new features of the version you are
using.
Click for copyright and version information for your software.
About
StreetSmart
Pro
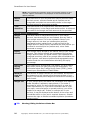
TIPS:
Auto Save Layouts
All layouts have been set to auto-save so that any modifications you make to a
layout will be automatically saved when you log out of the software.
To disable this feature, go to Settings > General and uncheck Auto Save
Layouts.
StreetSmart Pro Timeout Feature
StreetSmart Pro software is designed to automatically log out after a specified
period of time of inactivity.
18
•
To change this setting from the default of 1 hour, go to application main
menu and click on Settings > General.
•
If your session is timed out or you lose connection, simply Logon again.
Copyright © Charles Schwab & Co., Inc. 2006. All rights reserved. (0106-5667)
Getting Started
Demo Mode
Familiarize yourself with all the features in StreetSmart Pro® without
risking any capital by logging on in Demo mode.
To access, choose Demo instead of Live when logging on.
Demo mode allows you to:
•
Get familiar with all aspects of the software: indicators, chart, confirmation
messages, settings, etc.
•
Practice entering orders quickly, including changing share size, price, and
execution venue.
•
Observe the Level II information, the movement of Market Makers and ECNs.
•
Correlate price movements on a stock with market or sector movements.
•
Learn what momentum may look like in the Level II screen.
•
Observe the different types of stocks and different ways of trading based on
spreads, volume, velocity, and momentum.
•
Observe chart pattern formation.
! NOTE:
You should not determine the success rate of a trading strategy based
on demo mode or simulator performance. Orders placed in Demo mode are filled
randomly, with no regard to price, so the fill rates have no resemblance to those
you might experience in Live mode. Only use demo mode for learning the
mechanics of the software.
Copyright © Charles Schwab & Co., Inc. 2006. All rights reserved. (0106-5667)
19
StreetSmart Pro User Manual
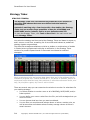
Customizing Your Desktop
CUSTOMIZING YOUR DESKTOP
Window Layouts
You can design and modify your window layout as often as you like. The window
layout that appears when you log on is a default layout. You can:
•
Keep the default layout.
•
Change it to one of the alternative built-in layouts.
•
Build your own layout by opening, closing, resizing and moving the windows.
Remember to save your layout, click File > Save Layout As...
To open a built-in Layout or one of your customized layouts:
•
Go to the Main Menu and click File.
•
Click Load Layout, then click on the layout of your choice.
Window Tabs
You can further customize the layout by adding Tabs to following windows:
•
Watch Lists
•
Charts
•
Top 10
•
High/Low
See Adding Tabs to Windows for instructions on inserting, editing, or deleting tabs
in the windows that support them.
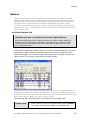
Toolbars
In the Toolbars menu, select which toolbars you wish to display. You can click and
drag each toolbar to relocate it anywhere in your software window. When placed
around the edge of the window, it will snap to the perimeter of the window, or it
can be free-floating in the layout.
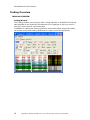
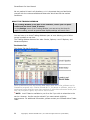
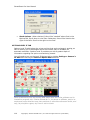
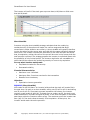
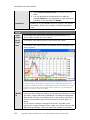
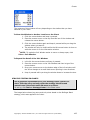
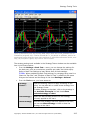
ADDING TABS TO WINDOWS
Tabs allow you to maximize screen space while still having quick access to multiple
Chart, Watch List, and other tab-enabled windows. When tabs are enabled, your
window will look something like this:
20
Copyright © Charles Schwab & Co., Inc. 2006. All rights reserved. (0106-5667)
Getting Started
Stock symbols and price and volume data shown here and in the software are for
illustrative purposes only. Charles Schwab & Co., its parent or affiliates, and/or its
employees and/or directors may have positions in securities referenced herein, and
may, as principal or agent, buy from or sell to clients.
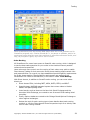
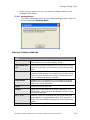
Windows that have the tab functionality will have a Tab menu in their menu bar. To
access the menu bar, right-click in the window and select Show Menu. The
following options will be available:
Enable
When checked, allows you to maximize screen space while still
having quick access to several windows within one window.
When unchecked, you must open several independent windows
to view multiple Charts/Watch Lists/etc.
Insert
Select to add a new tab to the window.
Edit [tab
name]
•
Select to edit the current tab's settings, including the name
and location.
•
You can also edit a tab name by double-clicking on the tab
and entering the new tab name.
Delete [tab
name]
Select to delete the current tab from the window.
*Use same
symbol for
all tabs
When checked, loading a symbol into one of the chart's tabs will
also load the symbol on every tab in that chart window.
*This option is only available in the Chart Tabs menu.
To enable Tabs:
1. Click Tabs > Enable in the window menu.
Copyright © Charles Schwab & Co., Inc. 2006. All rights reserved. (0106-5667)
21
StreetSmart Pro User Manual
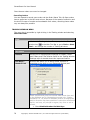
2. To create tabs, click Insert. The Insert Tab window will open as shown
below.
3. Enter a name for the tab and specify its location in relation to existing tabs
in the window using the Insert, Before/After, [tab name] fields.
4. You can use another tab as the basis for your new tab by selecting the other
tab from the Copy settings from drop-down. Select <Default settings>
to create your tab with default settings.
5. Click OK, and the tab will display in the Tab window. To change the name
later, you need only right-click on the tab label and select Edit. Then, enter
a new name. To remove a tab, click on the tab label and select Remove.
6.
Use same symbol for all tabs [Chart Window Only]: Select this menu
item (so that it is checked) if you want every tab to load the same symbol
when you change the symbol in one tab. For instance, if you have this
checked and you enter ABCD into one of the tabs in the window and press
Enter, ALL tabs in that chart window will load ABCD.
TIP: You may establish different tabs for each new window you open. The tabs
and other changes to your windows are saved when you save your layout.
ADDING WINDOWS
Windows can be added by either:
•
Clicking on the appropriate toolbar icon or,
•
Using the Start Tool window located in the main menu bar. Go to Tools >
Start Tool.
CLOSE UNUSED WINDOWS
You can hide/delete windows in your layout permanently or temporarily.
To Permanently Close a Window:
1. Click on
in the window you want to close.
2. Save the new layout with the closed window. Go to Saving Layouts for more
information.
22
Copyright © Charles Schwab & Co., Inc. 2006. All rights reserved. (0106-5667)
Getting Started
To Temporarily Close a Window:
1. Click the Minimize button
in the top right corner of the window.
2. The window will be minimized and put at the bottom of the window above
the Task Bar.
To Reopen a Window:
•
Go to Tools > Find Active Tool in the Main Menu bar and click on the
window you want to open.
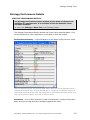
SAVING LAYOUTS
StreetSmart Pro® software remembers the last layout you used and displays it
when you logon. However, it’s best to save your preferred layouts after
customizing. There are two simple ways to save your layouts:
Save Layout Under Same Name
1. Go to the Main Menu Bar and click File.
2. Click Save Layout under the current layout name.
or
Save Layout Under New Name
1. Go to the Main Menu Bar and click File.
2. Click Save Layout As.
3. Enter a name for the Layout at the bottom of the Save window, for
example, Layout 4.
4. Click Save.
TIP:
When You Save a Layout
You cannot save over a built-in layout as they are read-only files. However, you
can save your changes to a built-in layout by following the Save Layout Under
New Name directions above.
Backup Layouts
Each day when you log on, a backup of your layout is saved on your computer, so
that if your layout becomes corrupted or you save changes to it that you wish to
reverse, you don't have to start from scratch. The application will store backup files
for the last 3 days that you logged into the application. The backup files are saved
in a folder called Backup Layout (in your Layout folder) and have the same name as
the original layout with the date of the backup appended to the name (for example,
"10202006Options.lyt").
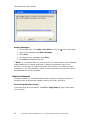
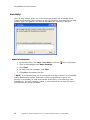
If the software detects an irregular or invalid exit from your previous session, it will
ask you if you want to open the last good saved layout. Selecting Yes will prompt
you to save the backup layout to your regular layout folder before proceeding.
You can also restore a layout from a backup by going to File > Load Layout and
navigating to the Backup folder.
Copyright © Charles Schwab & Co., Inc. 2006. All rights reserved. (0106-5667)
23
StreetSmart Pro User Manual
Open the layout you want to restore and you will be prompted to save it to your
regular Layouts folder.
SHRINK OR ENLARGE WINDOWS
Each window in the software can be resized to allow for additional windows or to
accommodate the size of your monitor.
To Resize the Width/Height of a Window
1. Place the mouse pointer on a side of the window until an up/down or
left/right arrow appears.
2. Left-click and hold the mouse button while resizing the window, then release
the mouse button.
To Resize the Entire Window
1. Place the mouse pointer on the corner of the window until the diagonal
arrow appears.
2. Left-click and hold the mouse button while resizing the window, then release
the mouse button.
MOVE WINDOWS
StreetSmart Pro® windows can be arranged any way you like within the frame of
the software.
To Move Windows:
1.
2.
Click and hold your mouse pointer on the top bar of the window and drag to
the new location.
Let go of the button when the window is where you want it.
or
1.
24
Right-click on the top bar of the window.
Copyright © Charles Schwab & Co., Inc. 2006. All rights reserved. (0106-5667)
Getting Started
2.
Click Move and an expansion arrow (a plus sign with arrows at each end)
will appear.
3.
Use the Up, Down, Right, Left arrows on your keyboard to position the
window.
4.
Left-click the mouse button to ground the window.
CREATE FREE-FLOATING WINDOWS
Your StreetSmart Pro® windows can also be dragged anywhere on your desktop
outside the frame of the software (when you want spread the data across multiple
monitors, for example).
To Enable/Disable Free-Floating Windows:
1. Log off, but do not exit the software (click File > Logoff in the Main Menu
bar).
2. In the Main Menu, click Settings > General.
3. To choose an unframed layout – allowing you to move windows outside the
frame, check Free Floating Windows in the Settings window or,
4. To choose a framed layout - framing all windows in one large window uncheck Free-Floating Windows in the Settings window.
You must restart the software for the changes to take effect.
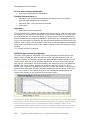
CHANGING BACKGROUND & FONT COLORS
StreetSmart Pro® software allows you to change the background and font colors in
most windows.
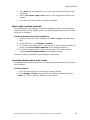
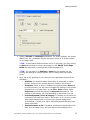
To Change Colors:
1. Go to the Main Menu of the window you want to change.
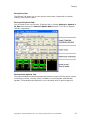
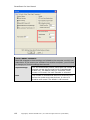
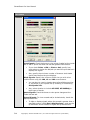
2. Click Settings > Colors. One of three Color Selector windows will open:
Figure 1 - Click on the color wheels to modify colors.
Copyright © Charles Schwab & Co., Inc. 2006. All rights reserved. (0106-5667)
25
StreetSmart Pro User Manual
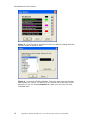
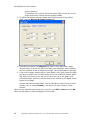
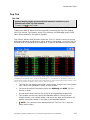
Figure 2 - Controls Charts. Highlight the area you want to change and click
the color wheel to assign a color.
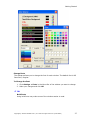
Figure 3 - Controls the Trading Window. The lower area gives you several
color options for Level II, for which you can choose one of the built-in color
schemes, or you can choose Custom and create your own color for each
individual level.
26
Copyright © Charles Schwab & Co., Inc. 2006. All rights reserved. (0106-5667)
Getting Started
Change Fonts
The software allows you to change the font for each window. The default font is MS
Sans Serif, Regular.
To Change the Font
1. Click Settings > Fonts in the Menu Bar of the window you want to change.
2. Make your changes and click OK.
TIP:
Bold Fonts
Using bold fonts may make some of the windows easier to read.
Copyright © Charles Schwab & Co., Inc. 2006. All rights reserved. (0106-5667)
27
StreetSmart Pro User Manual
BUILT-IN LAYOUTS
StreetSmart Pro® software comes with several built-in layouts. To maximize all
available screen space and fit the size and resolution of your computer screen, it
may be necessary to select an alternative StreetSmart Pro built-in layout.
The default layout, the layout you see when you first log on, is designed for a
screen resolution of 1024x768. If your screen resolution is set lower than
1024x768, the windows in the layout may be too big to fit your screen. To correct
the problem, go to File and select Default (800x600) from the list of layouts
located at the bottom of the drop-down menu.
There are other layouts which use different features of the StreetSmart Pro
application. All layouts are provided to give you ideas for customizing your own
layout. You can start from scratch or use one of the layouts provided as a starting
point for your own custom design.
To access all of the available pre-loaded layouts go to File > Load Layout in the
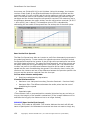
main menu.
You may also use the Layout Assistant tool in the Help menu. It will show you
the features of each layout and allow you to choose the best starting layout for
your style of trading.
28
Copyright © Charles Schwab & Co., Inc. 2006. All rights reserved. (0106-5667)
Getting Started
Configuration & Troubleshooting
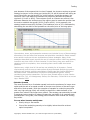
CONFIGURING THE SYSTEM
To Change General Software Settings:
Go to the Main Menu and choose Settings > General. Change any of the following
settings in the General Settings panel:
•
Make server adjustments. ! NOTE: Server adjustments should be made
only after consulting with a Schwab Active Trader Broker or Technical
Support Services Representative.
•
Change to/from a free-floating windows layout.
•
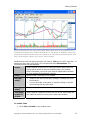
Auto-save your layouts.
•
Increase your timeout setting from 1 to 8 hours. ! NOTE: If you leave your
computer logged on overnight there are some circumstances where you may
find that you are still logged on the following morning. If this happens, you
must log off and log back on before placing any trades.
•
Choose to use an internal or external browser.
•
Increase or decrease your Update Rate. This will control the speed of the
data that your CPU must process. If you have a slower processor, it may be
helpful to reduce this rate.
SYSTEM REQUIREMENTS
To effectively run StreetSmart Pro®, your computer must meet these minimum
requirements:
•
Windows® 2000 or the Windows XP operating system. This application is
NOT available for Macintosh or Linux operating systems.
•
All versions should be run in conjunction with Microsoft Internet Explorer 6.0
or higher due to encryption requirements. You can experience logon issues if
you do not have IE 5.5 or higher. Netscape and other browsers are not
recommended.
•
Pentium® III type processor 500MHz or greater
•
40 MB of available hard drive space
•
128MB of RAM
•
56K modem (minimum) -- a Cable Modem, DSL, ISDN line or other
broadband service is recommended
•
Internet connection through an Internet Service Provider (ISP)
•
We suggest using at least a 17" monitor when using the software with one
monitor.
•
Due to the large number of windows and layouts offered in the software (See
Customizing Your Desktop), you may want to use more than one monitor to
display data.
Copyright © Charles Schwab & Co., Inc. 2006. All rights reserved. (0106-5667)
29
StreetSmart Pro User Manual
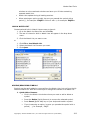
DOWNLOADING THE SOFTWARE
Qualified Schwab Active Trader clients can download the StreetSmart Pro®
software from the download website. (Check the site for qualifications.)
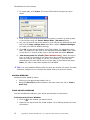
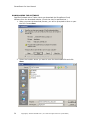
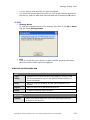
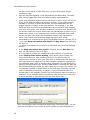
1. When you start the download process, you will be prompted to save or open
the file. Choose Save.
2. Select the location where you want to save the downloaded file and click
Save.
30
Copyright © Charles Schwab & Co., Inc. 2006. All rights reserved. (0106-5667)
Getting Started
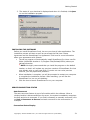
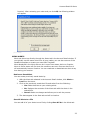
3. The status of your download is displayed and when it is finished, click Open
to run the installation program.
INSTALLING THE SOFTWARE
Before you install StreetSmart Pro®, be sure you close all other applications. The
installation process will start as soon as you accept the End User License
Agreement and the StreetSmart Pro Agreement. Click here for more information
about your agreements with Schwab.
•
The set-up program will automatically install StreetSmart Pro into a new file
folder (the default location is C:/Program Files/Schwab/SSPro) unless you
indicate otherwise.
! NOTE: We highly recommend that you install the program on the default
location, so that it will replace any previous versions of StreetSmart Pro that
may already exist on your hard drive. If you do not over-write previous
versions, you may experience problems.
•
When installation is complete, you will be prompted to restart your computer
to complete the installation process. After restarting, you will see the
StreetSmart Pro icon on your desktop.
•
Click the icon to launch StreetSmart Pro on your computer.
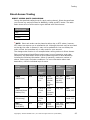
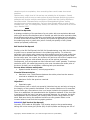
SERVER CONNECTION STATUS
Auto-Reconnect
The auto-reconnect feature is part of all modules within the software. When a
window/module is disconnected from its server, the system immediately recognizes
the fault and tries to reconnect. If you find it necessary to manually reconnect, click
on Help > Reconnect to Servers and wait a moment for the reconnection to
transpire.
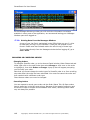
Connection Status Display
Copyright © Charles Schwab & Co., Inc. 2006. All rights reserved. (0106-5667)
31
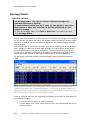
StreetSmart Pro User Manual
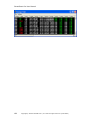
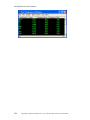
In the Status Bar at the bottom of your software window, two green lights indicate
the flow of data to your computer from the servers. The first one indicates the
status of your connection to the Account Server and the second indicates status of
the chart, Level II, and other data. They will turn red if you lose your connection to
either the data servers or the account servers.
Shows fully logged on and functional.
Shows logged off with no data coming in.
TIP: To display the Status Bar, click Toolbars > Status Bar in the main menu.
Routing Connection Status
You can also display the connection status of certain routing venues in the Status
Bar. Click Toolbars > Customize > Status Bar in the main menu and check the
routes for which you wish to see connection status.
You may also indicate whether the Caps Lock and/or Number Lock should be
permanently enabled or disabled in the software by checking/unchecking those
options.
PROXY SETTINGS
In the Settings > Proxy menu, you can change proxy configurations if you’re
running your software on a proxy server or behind a firewall.
Go to the Main Menu Bar, choose Settings > Proxy and enter your changes in the
Proxy Settings panel.
! NOTE: StreetSmart Pro® supports logon via an HTTP Proxy only. Be sure to
contact your system/network administrator for the appropriate proxy settings.
SOFTWARE UPDATES
As new upgrades and enhancements become available, you will receive an
announcement starting the first time you Logoff after the upgrade or enhancement
is available. You can choose to automatically load the upgrade or postpone loading
it. The update announcement window will continue to appear at each Logoff until it
has been loaded onto your computer.
! NOTE: It is recommended to accept upgrades and enhancements as they
become available to you for the best user experience.
32
Copyright © Charles Schwab & Co., Inc. 2006. All rights reserved. (0106-5667)
Getting Started
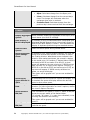
TROUBLESHOOTING GUIDE
Start with this ISP (Internet Service Provider) checklist:
•
Is your modem functioning correctly? Check by trying to connect to the
Internet with another application.
•
Is your telephone/data/cable line connected to your PC?
•
Have you dialed into your ISP and established a connection?
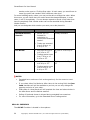
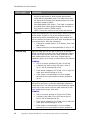
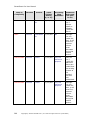
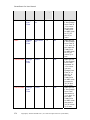
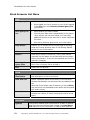
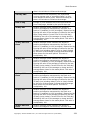
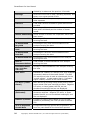
PROBLEM
POSSIBLE SOLUTION
Cannot Connect
•
Complete the ISP checklist above.
Error Message
•
If you’re using behind a firewall or proxy server
environment (which are common in the workplace),
contact your Network Administrator and go to the Menu
Bar and choose Settings > General to correctly
configure the software.
Invalid
Password or ID
StreetSmart Pro requires a Schwab logon ID (Social
Security Number or self-selected User ID) and password
not your Schwab account number and password. Contact
your Schwab Active Trader Broker if you need assistance
setting up your logon ID.
Disconnected
from Data
Servers
•
If you lose your connection, the software will
automatically try to reconnect any lost connections.
•
If the automatic reconnection was not successful, go to
the Main Menu Bar, click Help > Reconnect to
Servers.
•
If the problem persists, log off (File > Logoff) then
log back on (File > Logon). Contact your Schwab
Active Trader Broker if you are still unable to connect.
•
Complete the ISP checklist above.
Data Is Not
Updating
Charts Not
Printing Clearly
Try changing the background color to white for a clearer
image.
LIVE HELP
The Live Help window allows you to communicate directly with a Schwab Active
Trader Representative without having to pick up the phone. Just open the Live Help
window, type your question, and the representative will respond in real time.
Copyright © Charles Schwab & Co., Inc. 2006. All rights reserved. (0106-5667)
33
StreetSmart Pro User Manual
Sending Messages:
1. In the Main Menu, click Help > Live Help or click the
icon in the toolbar
2. Type in the message under Enter Message
3. Click Send
4. To clear previous messages, click Clear.
5. Click Exit to close down the box.
! NOTE: It is important that you do not use the Live Help window in the Schwab®
trading platforms to request, authorize or effect the purchase or sale of any
security or commodity, to send fund transfer instructions, or to effect any other
transactions. Any such requests, orders, or instructions that you send will not be
accepted and will not be processed.
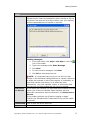
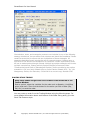
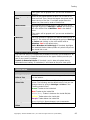
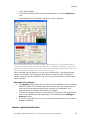
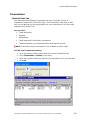
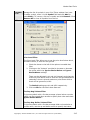
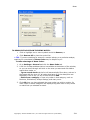
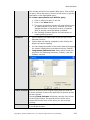
PRINTING WINDOWS
Printing is available in most StreetSmart Pro® windows, including the ability to
customize your printouts with headers, footers, grid lines, and more.
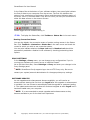
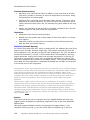
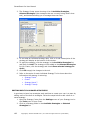
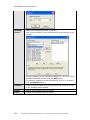
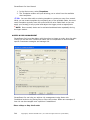
Customizing Window Printing
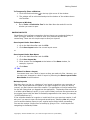
In windows with the Print feature, click File > Page Setup to begin customizing
your print job.
34
Copyright © Charles Schwab & Co., Inc. 2006. All rights reserved. (0106-5667)
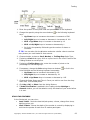
Getting Started
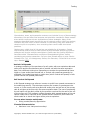
1. Select a Portrait or Landscape orientation. For wider windows, like charts,
Watch Lists, etc., landscape may be the better choice to fit all the content
on one page width.
TIP: If the window contents still do not fit on the page, you may choose
to Scale the printing to a lower percentage or click Shrink To Fit Page
Width for the printer to automatically scale the page to fit.
TIP: You can also go to Settings > Fonts for the window you are
printing and enlarge or reduce the font size to change how the window
prints.
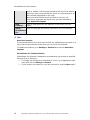
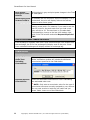
2. Next, set up the qualities of your print job (only applicable choices will be
available):
•
Gridlines: For windows where information is presented in a table
format, check this box to keep the lines visible in the printout.
•
Greyscale: Check to print in shades of grey/black/white. Note that
for some printers, you will have to change this setting in your printer
properties for it to take effect. In the File > Print window, select
Properties and find the setting for Greyscale and select it. The
location of this setting will vary depending on the printer you use.
•
Print Background (colors & images): If checked, the printout will
look exactly like what you have on the screen. So if you print a chart
with a black background, it will print with a black background.
If unchecked, it would print with a white background and white text
would print black.
•
Expand Columns to Fit: If checked, printouts involving columns of
data, such as Watch Lists, will print with the full heading of the
Copyright © Charles Schwab & Co., Inc. 2006. All rights reserved. (0106-5667)
35
StreetSmart Pro User Manual
column showing.
If unchecked, the columns will be the same width as they are on the
screen and column names may be partially hidden.
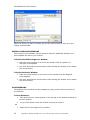
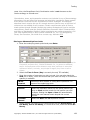
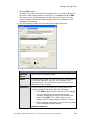
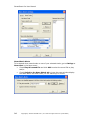
3. To adjust the Margins and the Header and Footer content of the printed
page, click the Margins & Header/Footer tab.
4. Decreasing the size of the Margins may help fit more data onto a page
without having to shrink the size of the data, thus keeping it more readable.
Use the up/down arrows to adjust the margin size on each edge of the page.
5. If you wish to apply Header and/or Footer data to your page, select the data
you wish to display from the drop-down lists in the Headers & Footers panel.
The items you choose in the top row will be at the top of the page in the
Left/Center/Right positions, and the bottom row selections will appear at the
bottom of the page.
Choose either the provided fields, such as Tab Name, Date & Time, Account
Number, etc. or choose Custom... and enter your own header or footer
content.
When you are finished customizing your print job, go to File > Print and click OK
when you are ready to send the page(s) to the printer.
36
Copyright © Charles Schwab & Co., Inc. 2006. All rights reserved. (0106-5667)
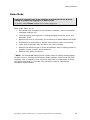
Getting Started
Quick Reference
QUICK START GUIDE
Now you can stay plugged into the fast-changing market with StreetSmart Pro® Schwab’s leading-edge suite of real-time streaming market data software and
advanced trading features for your desktop.
It’s easy to get started:
•
Check the system requirements and be sure your system can meet them.
•
Since you need an Internet Service Provider (ISP) to run the software,
connect to your ISP before you begin.
•
If you have trouble installing the software, call your Schwab Active Trader
Broker.
•
Read through the Quick Reference topics below to learn about each tool in
your software.
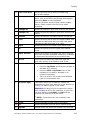
QUICK REFERENCE: WINDOWS & LAYOUTS
Minimize
StreetSmart Pro®
Frame
Use the Window
Scroll Bars
•
Click in the top right corner of the frame to minimize
all windows (unless you have chosen Free-Floating
Windows).
•
To restore the frame, click the StreetSmart Pro icon
on your desktop Task Bar.
•
Click in the window that contains the data you want
to scroll through and the scroll bar will appear.
•
You can scroll vertically in any active window using
the Page Up and Page Down buttons on your
keyboard.
•
To scroll down the Level II quotes or Time & Sales
screens, right-click in the frame you want to see and
select Show Scroll Bar.
Make a Window
Active
Click on any window you want to make your active
window.
Find the Name of
a Window
The name of each window appears on the top bar. Stock
names and/or ticker symbols also appear at the top of
the Trading, News, and Chart windows.
Maximize,
Minimize or Close
Windows
Each window has three small boxes in the right corner of
the top bar:
•
The first box minimizes the window.
•
The middle box expands the window to fit the
screen for a better view.
•
The third box closes the window. Closed windows
can be re-opened with the Toolbar.
NOTE: Closing your Account Detail window will log you
off the software.
Copyright © Charles Schwab & Co., Inc. 2006. All rights reserved. (0106-5667)
37
StreetSmart Pro User Manual
Resize Windows
Find Minimized
Windows
Open Closed or
Additional
Windows
•
Move your cursor to the edge of the window you want
to resize.
•
When your cursor changes to an arrow, hold down
the left mouse button and drag the edge of the
window until the window is the desired size.
•
Minimized windows can be found at the bottom of the
frame above the Status Bar.
•
To re-open a window, either double click on the
minimized window or click Tools > Find Active
Tool, then click on the window name you want to
maximize.
•
Toolbar: Get a quick description of each icon in the
Toolbar by moving your mouse over it. When you
pause on an icon, a Tool Tip will pop up. The Toolbar
topic provides more information on each tool and how
many of each window can be open at any one time.
•
Start Tools: Click Tools > Start Tools in the main
menu bar to open the Start Tools menu, where you
can add or reopen windows in the layout.
Display or Hide
Menu Bars
Each window has a Menu Bar. Display or hide Menu Bars
by right-clicking in the window and clicking Hide/Show
Menu.
<Tool> Help
Each window has a context sensitive help available from
the right-click menu. Access the Online Help for a
particular tool by right-clicking in the window and
clicking <Tool> Help.
Save Layouts
Save your layouts by going to the Main Menu Bar and
selecting File > Save Layout As. Then, save each
layout by name.
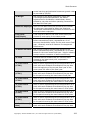
QUICK REFERENCE: TRADING
StreetSmart Pro®
Trading Window
Turning on and
off Level II and
ECN quotes
38
•
Enter your order in the Order Entry panel in the
Trading window.
•
If the Order Entry panel in the Trading window has
been minimized, simply click the Open/Close Order
Entry Panel arrow (under "Last" quotes).
Click on Settings > Data Source in the Trading Window
menu and choose which level of quotes you wish to view.
If you are trying to view Level II information and the
checkbox is grayed out, please contact your Schwab
Active Trader Team. Access to Level II data requires
meeting certain eligibility requirements based upon
trading frequency.
Copyright © Charles Schwab & Co., Inc. 2006. All rights reserved. (0106-5667)
Getting Started
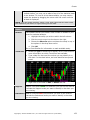
QUICK REFERENCE: CHARTS
Load a Symbol
•
Type the symbol in the Chart window and press
Enter.
or
•
Link to the Trading window by going to the Trading
window Menu Bar and clicking Settings > Links.
Highlight the chart you wish to link to the Trading
window.
Change Chart
Type &
Range/Interval
Click Settings > General, click on the Chart Type
or Chart Interval
icons on the Chart Toolbar, or
right-click the Chart window. From the right-click menu,
select a new Chart Type or Chart Range.
Improve Print
Quality of Chart
Try changing the background color of the chart to white
before printing.
QUICK REFERENCE: WATCH LISTS
Add or Remove
Symbols
•
Right-click in the Watch List window and click Add
Symbol or Remove Symbol.
•
To add or remove symbols, you can also use your
Insert or Delete keys.
Search for News
on a Symbol
Right-click on the symbol in the Watch List window and
click Recent Stories for [symbol].
Load a Symbol
into the Trading
Window
Right-click on the symbol in the Watch List window and
click Load [Symbol] into Trading Window.
Change Data You
Want to Track
•
Right-click on the Watch List column heading and
select a different set of data for that column.
•
Alternatively, go to Settings > Columns, choose the
column number you want to update and the new field
name, and click OK.
Save New Watch
Lists /
Go to the Watch List Menu Bar and click File > Save
Watch List As or File > Load Watch List.
Open Old Watch
Lists
Sort Data
See Sort Watch List Data and Set Up Watch List Columns
topics.
QUICK REFERENCE: TOP TEN
Open the Top Ten
Windows
•
Click on the Top Ten icon in the toolbar.
•
If neither window is open (NASDAQ or NYSE),
clicking on the toolbar icon will launch both
Copyright © Charles Schwab & Co., Inc. 2006. All rights reserved. (0106-5667)
39
StreetSmart Pro User Manual
windows.
•
If one window is open, clicking on the toolbar icon
will launch the window that is not open.
Or:
•
Go to Tools > Start Tools.
•
Put a check next to the window, either NASDAQ
Top Ten, NYSE Top Ten, or both.
•
Click Start
•
The Top Ten windows will automatically appear on
your cockpit.
Change Data You
Want to Track
Go to the Top Ten Menu Bar and click on Settings >
General.
Load a Symbol
into the Trading
Window
Right-click on the symbol in the Top Ten window and
click Load [Symbol] into Trading Window.
Search for News
on a Symbol
Right-click on the symbol in the Top Ten window and
click Recent Stories for [symbol].
Research or get
an Extended
Quote for a
symbol in the Top
Ten
Right-click on the symbol in the Top Ten window and
click Research/Ext. Quote.
QUICK REFERENCE: HIGHS & LOWS
Open the Highs &
Lows Windows
•
Click on the Highs & Lows icon in the toolbar.
•
The Highs & Lows window will automatically
appear on your screen.
Or:
•
Go to Tools > Start Tools.
•
Increase the number next to High/Low to 1 or
more.
•
Click Start
•
The High/Low window will automatically appear on
your screen.
Change Data You
Want to Track
Go to the Highs & Lows Menu Bar and click on Settings
> General.
Load a Symbol
into the Trading
Window
Right-click on the symbol in the Highs & Lows window
and click Load [Symbol] into Trading Window.
Search for News
on a Symbol
Right-click on the symbol in the Highs & Lows window
and click Recent Stories for [symbol].
Research or get
Right-click on the symbol in the Highs & Lows window
40
Copyright © Charles Schwab & Co., Inc. 2006. All rights reserved. (0106-5667)
Getting Started
an Extended
Quote for a
symbol in the
Highs & Lows
and click Research/Ext. Quote.
QUICK REFERENCE: PRINT TICKER
Open the Print
Ticker Window
Load a Stock List
•
Go to Tools > Start Tools
•
Click on Print Ticker
•
Click Start
•
The Print Ticker will open within your software.
•
Go to File > Load Stock List and select a list of
stocks to load.
•
Or go to Settings > Symbol List to create a new
list.
QUICK REFERENCE: SECTORS
Open the Sectors
Window
•
Go to Tools > Start Tools
•
Click on Sectors
•
Click Start
•
The Sectors window will open within your software.
or
Change Indices
in the Toolbar
•
Click on the Sectors icon
•
Go to Settings > Indices
•
Check the index fields you wish to display at the top
of the Sectors window. See the Index Symbol List
topic for a list of available indices.
QUICK REFERENCE: NEWS
Search for
News on a
Stock or
Index
1. Enter a symbol into the Symbol/Code field.
2. Press Enter.
Copyright © Charles Schwab & Co., Inc. 2006. All rights reserved. (0106-5667)
41
StreetSmart Pro User Manual
Open News
Article in a
New Window
•
Right-click on the News window headlines and click Open Story.
OR
•
Double-click on story headline.
Hide the
News
Window
Menu
Right-click on the News window headlines and click Hide Menu.
Read the
News Article
in the
Preview
Panel
•
From the menu, select View > Preview.
•
Right-click and select Show Preview Window
•
Left-click on the News headline to display the news article you
want to read in the Preview panel.
Search the
Article for
Specific
Topics
Right-click in an article and click Search.
Print a News
Story
Right-click in an article and click Print or File > Print from the News
window.
Load a Stock
into the
Trading
Window from
a News
Article
Every stock symbol in a news article is hyperlinked to the Trading
Window. Simply click the symbol you want, and it will automatically
load into the Trading Window.
Get More
News About
a Stock in a
News Article
Right-click on the symbol to query for other news articles on that
stock/Index.
Automatically You can link the News window to the Trading window by going to the
Query for
Trading window menu and choosing Settings > Links.
News on a
Stock or
Index
42
Copyright © Charles Schwab & Co., Inc. 2006. All rights reserved. (0106-5667)
Getting Started
QUICK REFERENCE: MESSAGES
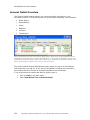
Messages Window StreetSmart Pro® displays streaming order status in the
Messages window for the current day only (messages
from sessions earlier in the day are differentiated by
their dark grey color). Check Messages for the status of
your orders and their execution, as well as information
about alerts and the market in general.
QUICK REFERENCE: STOCK SCREENER
Open the Stock
Screener Window
•
Click the Stock Screener icon
in the toolbar or
Tools > Start Tool and change quantity from 0 to
1.
•
The Stock Screener query window will automatically
appear on your screen defaulting to a built-in query.
View What Filters
Make up the
Query
Go to the Stock Screener Menu Bar and click View >
Query Description.
View a Different
Query
Go to the Stock Screener Menu Bar and click Built-In
Queries to view the list.
Create Your Own
Query
Go to the Stock Screener Menu Bar and click User
Queries. Clicking Edit will allow you to edit User
Queries, while clicking New will allow you to create a
new query.
Save Your Queries
1. Go to the Stock Screener Menu Bar and click File >
Save Query File As. A pop up box will appear
allowing you to save the query to your computer's
hard drive.
2. Select the location where you wish to save the
query. Saving your query in the same place as the
built-in query will make it easier to find all of the
queries in one location.
3. Type the name you wish to save it as and click OK.
4. You will see the file you just saved appear under File.
The 5 most recent files that you viewed will be
displayed, with the most recent one 'checked'.
5. The title bar will show a new line with File: (name
of your file), example shows Technology.qry
Load a Symbol
into the Trading
Window
Right-click on the symbol in the Stock Screener window
and click Load [Symbol] into Trading Window.
Search for News
on a Symbol
Right-click on the symbol in the Stock Screener window
and click Recent Stories for [symbol].
Research or get
an Extended
Right-click on the symbol in the Stock Screener window
and click Research/Ext. Quote for [symbol].
Copyright © Charles Schwab & Co., Inc. 2006. All rights reserved. (0106-5667)
43
StreetSmart Pro User Manual
Quote for a
symbol in the
Stock Screener
QUICK REFERENCE: LEVEL II
Obtain Level II
Access
44
•
If you are unable to see Level II quotes, check to see
if you are eligible. Go to the Trading window,
Settings > General > L2 Data. If you are
qualified for Level II access, you should be able to
click the Book quotes checkboxes. If those
checkboxes are grayed out, please contact your
Schwab Active Trader Team.
•
Access to Level II data requires meeting certain
eligibility requirements based on trading frequency.
Please contact your Schwab Active Trader Team to
determine if you qualify for Level II access.
Copyright © Charles Schwab & Co., Inc. 2006. All rights reserved. (0106-5667)
TOOLBARS
45
StreetSmart Pro User Manual
Main Tool Bar
The Main Tool Bar allows quick access to individual windows in the
software.
Click anywhere in the main menu, and then hover your mouse over a
button to see a ToolTip indicating which window it will open.
To enable, click Toolbars > Main Tool Bar in the main menu.
The Main Tool Bar can be displayed vertically on the left/right hand side, or the top
or bottom of the frame, or it can be removed to be a free-floating window.
To move the Main Tool Bar:
1. Move your mouse pointer to the thin bar on the top of the Main Tool Bar.
2. Click and drag the window to the location of your choosing.
3. Let go of the mouse button.
Values in parentheses indicate the maximum number of windows that can be open
at any one time.
Toolbar Icons
46
Start Tool
Opens the Start Tool window, which allows you to add
new or additional tools to your layout.
Trading Window
(3)
Opens a Trading window, which is where you can see
Level I and II data and place all Stock, Options,
Advanced Options trades (Optionsand Advanced
Options trading is available to approved clients).
Charts (6)
Opens a Chart window, where you can see a graphical
depiction of a symbol's price movements for the last
minute up to the last few years. If you use technical
analysis in your trading, you can also view a variety
of Studies in the chart window and draw several
different types of trend lines.
Strategy Tester
(1)
Opens the Strategy Tester window where you can
search through historical performance results of backtested technical strategies.
Watch List (6)
Opens the Watch List, which allows you to create or
view built-in watch lists of stocks and select what
data you wish to see for each list, including options
data, news, level I data, price change, volume, daily
high/low, and much more.
My Positions
(1)
Works like the Watch List window, but only displays
symbols in which you have an open position.
News (3)
The News window lets you query for news on a
specific stock, list of stocks, or keyword. Or you can
have it alert you to breaking news across the market.
Top Ten (2)
Opens the Top Ten window, which you can customize
to show NASDAQ and/or NYSE stocks that are the
Copyright © Charles Schwab & Co., Inc. 2006. All rights reserved. (0106-5667)
Toolbars
biggest gainers or decliners, as well as the stocks with
the highest volume. There is also an Options Top Ten
window available from the Tools > Start Tool menu.
High/Low (4)
The High/Low window shows you stocks and indices
that are approaching or have broken through a daily
or 52 week high or low price.
Sectors Tool (5)
Opens the Sectors window, which displays basic
values, such as price change and volume, for stocks
organized by Sector, Industry, and Sub-industry.
Stock Screener
List (10)
Opens a Stock Screener window in which you can run
a stock screener query and get a customizable list of
the results.
Symbol Lookup
(1)
Open the Symbol Lookup window to search for the
company name of a symbol or vice versa.
Education Web
Link (10)
Click on the Education Web Link icon in the toolbar to
access Schwab and StreetSmart Pro's educational
material including:
•
Using StreetSmart Pro®
•
Market Education
•
Direct Access Trading
•
Printable User Manuals
•
Trader's Education On-Line Courses
•
Live Online Interactive Workshops
•
Introduction to Stock Screener
Web Browser
(10)
Opens an internet browser within your software.
Live Help (1)
The Live Help window allows you get live help from a
Schwab Active Trader Representative. Though you
may not place trades through this tool, you may ask
questions about the software, check on shortable
shares available for a particular stock, ask questions
about your account, etc.
The Live Help button is on a separate toolbar from the
main toolbar and can be toggled on and off from the
Toolbars drop-down in the Main Menu.
! NOTE: The Account Detail window cannot be accessed using the Main Toolbar.
When you logon, the Account Detail window will populate with information from the
primary account associated with your logon ID or Social Security number.
The Messages window is tied to the Account Detail window. To reopen this window,
go to View > Messages in the Account Detail menu, or go to the software main
menu and select Tools > Find Active Tool and select Account Detail.
Copyright © Charles Schwab & Co., Inc. 2006. All rights reserved. (0106-5667)
47
StreetSmart Pro User Manual
BALANCES BAR
The Balances Bar keeps important account data at your fingertips. You
may customize the types of data shown based on the information that's
most important to you.
To enable, click Toolbar > Balances Bar in the main menu.
To customize, right-click in the Balances Bar and select Customize.
TIP: Hide individual stats in your Balances Bar by clicking on the name.
Today's Change is hidden in the image below.
Select the statistics to display by clicking on Toolbars > Customize > Balances
Bar in the main menu or by right-clicking on the Balances Bar and selecting
Customize... The following settings window opens:
•
Click on an item in the Available Column to view a description of it, then click
Add to select the item for display in the Balances Bar.
•
Change the order in which the fields are displayed in your Balances Bar by
clicking on the field in the Selected Fields column and then click Move Up or
Move Down.
•
To minimize the screen space used by the labels, click Use Abbreviated
Field Labels.
TIP: Change any of the fields on the fly by right-clicking on the name of the
field and selecting a different one from the drop-down list.
48
Copyright © Charles Schwab & Co., Inc. 2006. All rights reserved. (0106-5667)
Toolbars
BALANCES BAR FIELDS
Avail to Trade The maximum amount of money in your account that you can
- Cash
use to trade without accessing margin borrowing.
Day Trade BP
Total market value of new securities into which you may enter
and subsequently exit without incurring a margin call.
Margin Equity The dollar value of marginable securities in your margin
account, less the amount you owe Schwab, plus any cash in
your margin account. This is the liquidation value of your
margin account, but does not include option positions,
segregated money market funds, or cash not held in the
margin account. Margin Equity represents the total amount
you invested in securities plus any excess cash, minus funds
borrowed on margin.
Equity Pct
Your margin equity divided by the market value of your
margin account. This amount reflects the percentage of the
current margin account value you would receive if you
liquidated the margined securities, paid off any margin debt
and withdrew the funds. Options, cash account positions and
segregated money market funds are not included when
calculating the equity percentage.
Today's %
Change
The percent change in value of the account since today's
market open, whether due to security price movements,
securities transactions, any other withdrawals and deposits,
or credits and debits.
Today's
Change
The change in value in dollars of the account since today's
market open, whether due to security price movements,
securities transactions, any other withdrawals and deposits,
or credits and debits.
Acct. Net
Worth
The 'liquidation value' of your account (excluding fees,
commissions, pending interest credits and debits, etc.), which
is the combined value of all your cash, money market funds,
margin balances, securities and any miscellaneous
debits/credits in your account.
Cash
The total dollar value of your unswept or intra-day cash,
money market funds, bank deposit accounts, and net credit or
debit balances.
Copyright © Charles Schwab & Co., Inc. 2006. All rights reserved. (0106-5667)
49
StreetSmart Pro User Manual
Margin BP
The maximum value of marginable securities in which you can
invest without depositing more equity in your margin account;
this includes funds you can borrow from Schwab, but does not
include balances in your Cash Account or Money Market
Funds.
Avail to
Withdraw
The maximum amount you can withdraw from your account
by requesting a check or transferring funds to another
account. This value includes the cash balance in your account,
plus the maximum amount you can borrow against
marginable securities held in your margin account.
Settled Cash
to Trade
Trading in a Cash account requires using Settled funds. If a
security is purchased using settled funds, there are no
requirements surrounding the time frame of when the newly
purchased securities can be sold. Settled funds are comprised
of: incoming cash (such as a deposit or wire transfer), any
available Margin Loan Value, or settled proceeds from the sale
of securities that have been fully paid.
50
Copyright © Charles Schwab & Co., Inc. 2006. All rights reserved. (0106-5667)
Toolbars
CHART TOOL BAR
The Chart Toolbar allows quick access to the most commonly used chart
features.
To enable, click Toolbars > Chart Toolbar in the main menu.
•
Most buttons clicked in the Chart Toolbar will affect the most recently
accessed Chart window.
EXAMPLE You have 3 chart windows open, and you most recently clicked
on Chart #2. When you click the Add/Edit Studies button, it will open for
Chart #2. If you want the button you press to affect another chart, click that
chart first and then click the button in the toolbar.
•
The Regular, Snap to, and Best Fit trendlines are the exceptions and can be
clicked in the toolbar and applied to any chart in your layout.
•
Click anywhere in the main menu, and then hover your mouse over a button
to see a Tool Tip that says what the button will do.
•
All the buttons in the Chart Toolbar correspond to a feature also found in the
menu of each Chart window.
CUSTOMIZING THE CHART TOOLBAR
Customize which icons are displayed on your chart toolbar. Select Toolbars >
Customize > Chart Tool Bar from the main menu or right-click on the Chart Tool
Bar and select Customize... The Chart Tool Bar customization window will open.
You can then select which tools you want displayed on your toolbar.
•
Use the Add/Remove buttons to move buttons between the Available and
Current columns.
•
Use the Move Up/Move Down buttons to put the buttons in the Current
toolbar in the order you prefer.
•
Click Close when you are finished customizing your Chart Toolbar.
MOVING THE CHART TOOLBAR
The Chart Toolbar can be displayed vertically on the left/right hand side, or the top
or bottom of the frame, or it can be removed to be a free-floating window.
1. Move your mouse pointer to the thin bar on the left side of the Chart Tool
Bar.
2. Click on that bar and then drag the window to the location of your choosing.
3. Let go of the mouse button.
Toolbar Features
Not all buttons are displayed by default. To add a button, click Toolbars >
Customize > Chart Tool Bar in the main menu.
Chart General
Settings
Open the General Settings for the most recently
accessed Chart window.
Copyright © Charles Schwab & Co., Inc. 2006. All rights reserved. (0106-5667)
51
StreetSmart Pro User Manual
Crosshairs
Select to change your cursor to display a crosshair
when you click on the chart. The Crosshair pointer
can help you pinpoint prices on a chart more easily
than when using the regular cursor.
Select again to turn off Crosshairs.
Chart Type
Choose Monthly, Weekly, Daily, Intraday, or Tick
Chart Interval
Choose from 5 to 120 minutes or select Other to
open the Chart Settings window where you can enter
a different interval.
Only applies to Intraday chart types.
Add/Edit
Studies
Click to open the Add/Edit Studies window, which
lets you add technical analysis studies to your chart.
Go to Chart Studies for information on each available
study.
Trend Lines
Click to draw Trend Lines on the chart. The pointer
will change to a pencil icon. Click and drag to draw
the trend line.
Click the Trend Line button again to stop drawing
trend lines (or select another button).
Edit Trend
Lines
Click and select from the drop-down list which Trend
Line you wish to edit. The button is only available
when the most recently selected chart has trend
lines drawn on it.
The Edit Trend Line window lets you select the type
of trend line (regular, Fibonacci, best fit (regression),
etc.), as well as the color and label (name) for the
line.
Support
Adds a horizontal GREEN line wherever you click on
the chart to indicate the Support levels you want to
identify in the chart you are viewing.
Resistance
Adds a horizontal RED line wherever you click on the
chart to indicate the Resistance levels you want to
identify in the chart you are viewing.
New Tab
Click to add a new tab to the most recently accessed
chart window.
You must have Tabbing enabled for the chart in
order to click the New Tab icon.
Show All Data
If checked, shows chart for the time frame specified
in the Range (days).
If unchecked, this will display what is indicated in the
Data to show field. A scroll bar will appear at the
bottom of the chart allowing you to move back
and/or forth through Range (days) selected.
52
Copyright © Charles Schwab & Co., Inc. 2006. All rights reserved. (0106-5667)
Toolbars
Edit Tick Data
Allows you to change bad chart price data, which
may impact the technical studies enabled on the
chart.
Click the Edit Tick Data button in the toolbar and
then click the price point you need to edit on the
chart. A window will open that allows you to change
all four price points for that period (open, close,
high, low).
Delete
Click the Delete icon to see a list of studies and trend
lines in the most recently accessed chart so that you
may delete one or more of them. You can also chose
Delete All Studies to clear all studies from the
chart.
Delete will not clear support and resistance lines. You
must right-click on the line and select Delete to
remove it.
Graph Style
Switch between Bar, Candlestick, Line or Point &
Figure chart types.
Read more about each of these graph styles in the
Chart Menu Bar topic.
Time Lines
Click to hide or show the vertical time lines on the
chart.
Price Lines
Click to hide or show the horizontal price lines on the
chart.
Best Fit
Click the button and then click on the chart to apply
a Best Fit Regression trend line to the chart.
Read more about Best Fit in the Trend Lines topic.
Snap To
Click the button and then click and drag a line on the
chart to apply a trend line that "snaps to" the open,
high, low, or close of the trend being studied.
To change which price the trend line snaps to (the
default setting is Close), click the Edit Trend Lines
button in the toolbar and choose the Snap To line
you wish to edit.
Read more about Snap To in the Trend Lines topic.
Fibonacci
Retracement
Click the button and then click on the chart to draw a
Fibonacci Retracement line.
Read more about Fibonacci lines in the Trend Lines
topic.
Fibonacci Fan
Click the button and then click on the chart to draw a
Fibonacci Fan line.
Read more about Fibonacci lines in the Trend Lines
topic.
Copyright © Charles Schwab & Co., Inc. 2006. All rights reserved. (0106-5667)
53
StreetSmart Pro User Manual
Fibonacci Arc
Click the button and then click on the chart to draw a
Fibonacci Arc line.
Read more about Fibonacci lines in the Trend Lines
topic.
54
VAP
Click to show lines bars on the chart where the
highest Volume Average Prices have occurred.
Alerts
Click to add a Conditional Order or Alert on the
security in the most recently accessed Chart window.
Help
Open the Online Help directly to information on using
Charts in StreetSmart Pro.
Copyright © Charles Schwab & Co., Inc. 2006. All rights reserved. (0106-5667)
Toolbars
STATUS BAR
The Status Bar displays at the bottom of your window and indicates server and
routing venue status, trading session, and whether you have Caps Lock and Num
Lock enabled.
The two lights indicate the flow of data to your computer from the servers. The first
one indicates the status of your connection to the Account Server and the second
indicates status of the chart, Level II, and other data. They will turn red if you lose
your connection to either the data servers or the account servers.
Shows fully logged on and functional.
Shows logged off with no data coming in.
You can edit the amount of information displayed in the Status Bar by clicking
Toolbars > Customize > Status Bar in the main menu. The following window will
open:
Check the routing venues you wish to monitor in the Status Bar at the bottom of
your window. If the route is available, it will display in green; if unavailable, red.
You may also indicate whether the Caps Lock and/or Number Lock should be
permanently enabled or disabled in the software by checking/unchecking those
options.
Copyright © Charles Schwab & Co., Inc. 2006. All rights reserved. (0106-5667)
55
StreetSmart Pro User Manual
Live Help
The Live Help window allows you to communicate directly with a Schwab Active
Trader Representative without having to pick up the phone. Just open the Live Help
window, type your question, and the representative will respond in real time.
SENDING MESSAGES:
1. In the Main Menu, click Help > Live Help or click the
icon in the toolbar
2. Type in the message under Enter Message
3. Click Send
4. To clear previous messages, click Clear.
5. Click Exit to close down the box.
! NOTE:
It is important that you do not use the Live Help window in the Schwab®
trading platforms to request, authorize or effect the purchase or sale of any
security or commodity, to send fund transfer instructions, or to effect any other
transactions. Any such requests, orders, or instructions that you send will not be
accepted and will not be processed.
56
Copyright © Charles Schwab & Co., Inc. 2006. All rights reserved. (0106-5667)
TRADING
57
StreetSmart Pro User Manual
Trading Overview
TRADING OVERVIEW
Trading Window
The Trading window is the primary order routing interface in StreetSmart Pro® and
was designed to put important information at your fingertips to help you act on a
security’s most relevant, up-to-date data.
In addition to trading and viewing quotes for stocks and indices, approved traders
can access quotes and trading capabilities for single- and multi-leg options.
58
Copyright © Charles Schwab & Co., Inc. 2006. All rights reserved. (0106-5667)
Trading
Stock symbols and price and volume data shown here and in the software are for
illustrative purposes only. Charles Schwab & Co., its parent or affiliates, and/or its
employees and/or directors may have positions in securities referenced herein, and
may, as principal or agent, buy from or sell to clients.
Order Routing
All StreetSmart Pro users have access to SmartEx order routing, which is designed
to see the best trade execution for your order in the timeliest manner possible
unless otherwise specified.
Users who want more control over the routing of their orders may wish to enable
Direct Access Trading for their accounts. Direct Access trading entails certain risks
and responsibilities. As a result, we have established special eligibility requirements
for Direct Access trading. These eligibility requirements are posted on the
StreetSmart Pro Center of Schwab.com, in the section called Trade Routing.
With Direct Access, in addition to SmartEx order routing, you can route orders
directly to:
•
Direct Access ECNs, including INET, ARCA, ONTD, BTRD, and BRUT.
•
SuperMontage, NASDAQ-operated system that routes orders to Market
Makers and participating ECNs.
•
Listed stocks, such as those on the New York Stock Exchange and the
American Stock Exchange, are routed to one of several ECNs trading listed
securities.
•
Finally, Options trades are routed to the Chicago Board Options Exchange or
other regional exchanges.
•
Review the topic for each routing type to learn details about each routing
method, or visit the Direct Access Route Comparison topic for a side-by-side
view of each routing method.
Copyright © Charles Schwab & Co., Inc. 2006. All rights reserved. (0106-5667)
59
StreetSmart Pro User Manual
No one method is best in all situations, so it is important that you familiarize
yourself with the routes available and determine which best fits the market
conditions.
ABOUT THE TRADING WINDOW
The Trading Window is the hub of the software, where you can place
trades and get Level I and II quotes.
In the Settings menu of the Trading Window, you can set up Hot Keys for
rapid-fire trading, as well as general data display settings and much more.
You can have up to three Trading Windows open at once allowing you to follow
several symbols at one time.
The Trading Window features four tabs: Stocks, Options, Level II Options, and
Advanced Options.
The Stocks Tab:
The Stocks Tab has 3 segments:
Stock symbols and price and volume data shown here and in the software are for
illustrative purposes only. Charles Schwab & Co., its parent or affiliates, and/or its
employees and/or directors may have positions in securities referenced herein, and
may, as principal or agent, buy from or sell to clients.
! NOTE:
Level II data is available to you for a fee if you wish to subscribe to the
service. However, the fee may be waived if you meet certain eligibility
requirements. For additional information, please contact your Schwab Active Trader
Team.
60
Copyright © Charles Schwab & Co., Inc. 2006. All rights reserved. (0106-5667)
Trading
The Options Tab:
The Options Tab allows you to view options chains and, if approved for options
trading, place options trades.
The Level II Options Tab:
You will need to turn on the Level II Options tab by clicking Settings > General >
L2 Data and checking the Show L2 Option Data selection. The Level II Options
Tab has 4 segments:
The Advanced Options Tab:
The Advanced Options tab allows approved traders to place multi-leg option orders,
including buy/writes, rollouts, collars, straddles, vertical spreads, and calendar
spreads. The available tabs depend on your individual level of options approval.
Copyright © Charles Schwab & Co., Inc. 2006. All rights reserved. (0106-5667)
61
StreetSmart Pro User Manual
Commissions, taxes, and transaction costs are not included in any of the following
strategy discussions, but can affect final outcome and should be considered. Please
contact a tax advisor to discuss the tax implications of these strategies. All
strategies described herein require the use of a margin account. Options carry a
high level of risk and are not suitable for all investors. Certain requirements must
be met to trade options through Schwab. Multiple leg options strategies will involve
multiple commissions. Please read the Options Disclosure Document titled
"Characteristics and Risks of Standardized Options" before considering any option
transaction. Call your local Schwab office or write Charles Schwab & Co., Inc. 101
Montgomery Street, San Francisco, CA 94104 for a current copy. Member SIPC
PLACING STOCK TRADES
Place stock trades and get Level I and II data in the Stocks tab of the
Trading Window.
Enter a symbol, select the variables for the order such as Quantity, Limit/Stop
prices, and more. Then click the button for the action you wish to take (Buy,
Sell, etc.) to send the order.
You may route an order from the Trading Window using the following steps. For
more detailed information about each feature of the Order Entry panel, go to the
Stock Tab Features topic.
62
Copyright © Charles Schwab & Co., Inc. 2006. All rights reserved. (0106-5667)
Trading
1. Enter the symbol in the symbol field and press Enter on the keyboard
2. Change the quantity using the arrow buttons
keys:
or the following keyboard
•
Up/Down keys to increase or decrease in increments of 500
•
Left/Right keys to increase or decrease in increments of 100
•
Shift + Up/Down keys to increase or decrease by 10
•
Shift + Left/Right keys to increase or decrease by 1
•
Or click in the quantity field and type the number of shares or
contracts.
TIP: You can also click the $ button and enter a dollar value to see how
many shares you could trade for that amount.
3. Choose whether to place a Limit, Market, or Trailing Stop Order Type.
4. If placing a Limit order type, click on a price level in the Level II area of the
Trading window to set the price.
5. If placing a Trailing Stop order, enter the number of points or the
percentage for the trailing stop.
6. If necessary, change the Price using the arrow buttons
Price field and use the following keyboard commands:
or click in the
•
Up/Down keys to increase or decrease by .05
•
Left/Right keys to increase or decrease by .01
•
Shift + Up/Down keys to increase or decrease by .005
7. Choose the Order Route and Time in Force you wish to use from the dropdown lists, if not already done.
8. Click Buy, Sell, or Short from the Action Buttons.
9. If Order Verification is enabled in the Trading window Settings >
General window, you will be asked to verify the details of your order before
it is sent.
STOCK TAB FEATURES
In the Stocks tab, you can view:
•
Level I data - Real-time best bid/ask quotes, volume, change from close,
high/low prices, etc.
•
Level II data - Shows the depth of the market in a stock by displaying in
real-time the quotes of each Level II market participant.
Copyright © Charles Schwab & Co., Inc. 2006. All rights reserved. (0106-5667)
63
StreetSmart Pro User Manual
•
Level II aggregate - Displays an aggregation of each price level to provide
a quick overview of the quantity available at each price level.
•
Time & Sales - Shows each trade in the stock, including quantity and price,
color-coded to show its relation to best bid and ask prices.
Most orders will be routed from the Trading window, so there are fields for selecting
the order price, quantity, venue, time-in-force (i.e. Day, Good 'Til Cancel, etc.).
Then use the Buy, Sell, or Short buttons to submit the order.
Stock symbols and price and volume data shown here and in the software are for
illustrative purposes only. Charles Schwab & Co., its parent or affiliates, and/or its
employees and/or directors may have positions in securities referenced herein, and
may, as principal or agent, buy from or sell to clients.
A
Company
Name/
Market
Shows the company name and the market on which the stock
trades.
A letter after the security name is the Financial Status
Indicator (FSI).
FSI Codes
D Deficient: Failed to meet NASDAQ continued listing
requirements
E Delinquent: Missed regulatory filing deadline
Q Bankrupt: Issuer has filed for bankruptcy
N Normal (Default): Not currently deficient, delinquent, or
bankrupt. -Will not be displayed
G Deficient and Bankrupt
H Deficient and Delinquent
J Delinquent and Bankrupt
K Deficient, Delinquent, and Bankrupt
64
Copyright © Charles Schwab & Co., Inc. 2006. All rights reserved. (0106-5667)
Trading
TIP: To view the current quote for an index, Level 1 needs
to be enabled. Enable Level 1 in the Trading Window menu by
clicking Settings > General > L2 Data tab and then
checking Level 1.
Level I Data
C
Symbol
To enter a new symbol, click in the field, type the new symbol,
and press Enter on your keyboard.
Click on the down arrow to show recently loaded symbols.
Select a symbol from this list for rapid reloading.
D
Tick
Direction
Shows whether the stock is on a downtick or uptick. Colorcoded: red, downtick; green, uptick; black, stock can be
shorted on a downtick.
E
Change
($)
Shows the change in price from close.
Change
(%)
Shows the percent change from close.
G
Volume
Shows cumulative volume for the day.
H
Last
Shows the last price at which the stock traded. Red indicates
the price was down from the previous sale, and green means
the price was up from the previous sale.
I
Open
Shows the price at which the stock opened today.
J
Hi
Shows the highest price the stock has reached today.
K
Ratio
Shows the number of participants posting at the inside bid
price "x" the number of participants posting at the inside ask
price.
F
TIP: This can be changed to reflect the change from the
opening price by checking Calculate Change from Open in
the Settings > General menu of the Trading window.
TIP: This can be changed to reflect the change from the
opening price by checking Calculate Change from Open in
the Settings > General menu of the Trading window.
This can be set to show instead the number of shares
available at the inside bid and ask by checking Compute
Ratio by Quantities in the Settings > General menu of the
Trading window.
L
Close
Shows yesterdays close price.
M
Lo
Shows the lowest price the stock has reached today.
N
Spread
Spread shows the difference between the inside bid and ask
prices.
Order Entry
O
Order
Quantity
There are several ways to change the order quantity.
•
Press the Up/Down arrow keys to increase or
decrease in increments of 500.
•
Press the Left/Right arrow keys to increase or
decrease in increments of 100.
Copyright © Charles Schwab & Co., Inc. 2006. All rights reserved. (0106-5667)
65
StreetSmart Pro User Manual
P
$
(Compute
Shares
from
Quantity)
•
Press the Shift + Up/Down keys on the keyboard to
increase or decrease in increments of 10.
•
Press the Shift + Left/Right keys on the keyboard to
increase or decrease in increments of 1.
•
In the Quantity field and type in a new share or
contract size.
•
Tab to or click in the quantity field and press a number
on the keypad to enter that quantity times 100 (for
instance, pressing 5 on your keypad will enter 500).
Calculates the number of shares for your order from the dollar
amount you enter.
For instance, if you have $10,000 to spend on a stock that is
trading at $5 on the inside ask, you would click the $ button,
type "10000", click OK and the share size field will fill in with
2000.
! NOTE:
Q
Limit
Price
Commissions are not included in this calculation.
This is where you should enter the price at which you wish to
place an order if you have selected a Limit order type. There
are multiple methods for entering or adjusting your price.
•
Click on the arrows next to the price field to scroll the
price up and down. To adjust the increments by which the
arrows increase or decrease go to Settings > General,
then change the Price Increment.
•
Click or tab to the price window and use the:
o
Up/Down arrow keys on your keyboard to increase or
decrease the price by .05
o
Left/Right arrow keys on your keyboard to increase
or decrease the price by .01
o
Shift + Up/Down arrow keys on your keyboard to
increase or decrease the price by .005
You may also click on a price in Level II to load it into the
price field. Double-click an ECN to route directly to that ECN at
their posted price.
R
Order
Route
SmartEx:
•
Enter the limit price you want
•
Routes 24/7 to Schwab for submission in current/next
Standard session.
Pre-Market
•
Can be sent to Schwab from 8:05 p.m. to 9:15 a.m.
EST for trading session beginning at 7:30 a.m. ET.
•
Cannot be sent to Schwab from 9:15 a.m. to 8:05 p.m.
EST and menu selection will be grayed-out.
After Hours
•
66
Can be sent from 4:05 p.m. to 8:00 p.m. ET for trading
Copyright © Charles Schwab & Co., Inc. 2006. All rights reserved. (0106-5667)
Trading
session beginning at 4:15 p.m. ET.
•
Cannot be sent from 8:00 p.m. to 4:05 p.m. ET and
menu selection will be grayed-out.
Direct Access:
Double-click on the participant in Level II that you wish to
send your order to and it will fill in this field with either the
ECN, or if a Market Maker, SuperMontage. Or click the arrow
to see a drop-down list of all routing choices available to you.
If you have a stock loaded that is on a listed exchange, you
will see the Listed Order routing options.
See the individual Order Route topics for information on how
each routing venue works.
S
Order
Types
Some order routes will have multiple order types, such as
Limit, Market, Stop Limit, etc. After selecting your routing
venue, choose an Order Type from the drop-down list.
See the Direct Access Route Comparison topic for an overview
of what Order Types each route may offer.
U
Time-InForce
Some routing venues will have one or more Time-In-Force
options, including Immediate or Cancel (IOC), Day (DAY), Fill
or Kill (FOK), etc. After selecting your routing venue, choose a
TIF from the drop-down list.
See the Direct Access Route Comparison topic for an overview
of what Order Types each route may offer.
V
Spec Cond If checked when you send an order, a Special Conditions
window will open allowing you to specify additional conditions
for your order, such as Minimum Quantity, All or None, etc.
See the topic for the Routing Venue you are using for a
description of its available Special Conditions.
! NOTE: If you do not change your order type to Market or
use the Spec Cond checkbox, StreetSmart Pro" will
automatically make your order type a Day Limit order.
Copyright © Charles Schwab & Co., Inc. 2006. All rights reserved. (0106-5667)
67
StreetSmart Pro User Manual
W Sell All
X
Action
Buttons
If you are selling a long position, you can check the Sell All
checkbox to sell the entire position, including fractional
shares. Read the Sell All Checkbox topic for more information.
Once the order fields are set up to reflect the type of order,
price and share size, click on the Buy, Sell, or Short button
to route the order. The Save button appears when any
SmartEx order route is selected, allowing you to save the
order to the saved order window.
Level II Aggregate
Y
Aggregate •
Quotes
Aggregate quotes shows the number of shares being
quoted at each price level.
•
You can view/hide the aggregation by checking Display
Aggregate Quotes in the Trading window menu Settings
> L2 Data > Display Settings.
•
Increase or decrease the number of aggregate levels
shown by clicking on the divider bar between the
aggregate and regular Level II area and dragging it up or
down.
Level II
Z
Level II
Shows the depth of all bids and offers in a stock. Each line
shows the four-letter Market Maker, ECN ID, or listed stock
Exchange, the price at which they are bidding or offering, and
the number of shares they are making available at that price.
! NOTE:
Level II data is available to you for a fee if you wish
to subscribe to the service. However, the fee may be waived if
you meet certain eligibility requirements. For additional
information, please contact your Schwab Active Trader Team.
Note that NASDAQ quotes and Level II ECN quotes are in
upper-case and ECN book quotes (when the book is turned
on) are in lower-case. Other non-NASDAQ quotes are noted
with an asterisk (*).
Level II Tips
68
•
Check Show Equity Quote Volumne in 100s in the
Settings > General > L2 Data window of your
Trading window to display available shares at 1/100th
of their real value (e.g. 10 means the participant has
1000 shares available). If there are parentheses ( )
around the number, it is for fewer than 100 shares and
is the "actual" number of shares they are making
available (For example: If you see (75), the participant
has exactly 75 shares to buy or sell.)
•
SIZE ID: Market Makers and ECNs can post to Level II
anonymously by sending Non-Attributed orders to the
market. Non-Attributed orders are displayed in the
Level II montage with the SIZE identifier. For each
price level, all non-attributed orders are aggregated
Copyright © Charles Schwab & Co., Inc. 2006. All rights reserved. (0106-5667)
Trading
under the SIZE identifier.
•
If you have Directional Quote Change Arrow
checked in your Trading window settings, you may see
some small up and down arrows in the Level II area of
the Trading window. What these arrows indicate is the
direction that market participant just moved in relation
to the inside price. For instance, if Market Maker GSCO
is on the bid at 65.25 but backs off to 65.125, a down
arrow will appear at the new price level. If GSCO
moves back up to 65.25, an up arrow will appear.
Similarly, if GSCO is on the ask at 65.25 and moves up
to 65.35, an up arrow will appear.
•
You can also view the Status of the bids and offers.
Check Show Status of Bid/Ask in the Trading
window Settings > General window to display:
O = open, meaning this is a current, valid quote for
the participant;
L = open for trading, but the quote has not been
refreshed;
K = closed for trading.
Time & Sales
a
Time &
Sales
Shows every trade being reported through NASDAQ and the
INET book trades (denoted by "-inet"), as well as the share
size of the trade and the time of the trade. Time & Sales is
color-coded:
Green: Prints at the inside Ask
Red: Prints at the inside Bid
White/Gray: Prints in between the inside Bid/Ask
Yellow: Prints above the inside Ask
Purple: Prints below the inside Bid
Grey Highlight: Inside quote change
TIP: Set the number of trades back to view through the
Settings > General menu. To expand this view up to the last
1000 trades, right-click in the T&S window and select
Request Expanded T&S.
GETTING QUOTES IN THE TRADING WINDOW
There are several ways to load a symbol into the Trading window:
•
Enter the symbol of the security in the Symbol box and press Enter.
Copyright © Charles Schwab & Co., Inc. 2006. All rights reserved. (0106-5667)
69
StreetSmart Pro User Manual
•
Click on the arrow in the Symbol field to show recently entered stocks, then
click on the one you want to load into the Symbol box for a quote.
•
Right-click on the symbol from most any window and click Load [Symbol]
into the Trading window.
•
Double-click on the symbol in the Watch List.
•
To view the current quote for an index, Level 1 needs to be enabled. Enable
Level 1 in the Trading Window menu by clicking Settings > General > L2
Data tab and then checking Level 1.
SYMBOL LOOKUP
Use this tool to look up the name or symbol of a company. For example, if you do
not know the symbol for a company, you can type in the full or partial name of the
company and get back a list of companies with similar names, along with their
symbols.
In the main menu, click Tools > Look Up Symbol or click the icon
toolbar.
70
in the
•
Enter the name or as much partial information as you have and click Enter.
You may also check the Symbol option and simply enter a ticker symbol to
get a company name. This can be done for either Stock or Index.
•
The closest matches to what you entered will appear at the top of the list.
Copyright © Charles Schwab & Co., Inc. 2006. All rights reserved. (0106-5667)
Trading
•
You can load the data directly into the Quotes Window by right-clicking the
symbol and selecting Load [symbol] into Trading Window.
•
Clicking on Name and Index will give you a list of all indices.
LEVEL II QUOTES AND TIME & SALES
The lower portion of the Stock Tab displays Level II information (as shown in the
following figure):
Stock symbols and price and volume data shown here and in the software are for
illustrative purposes only. Charles Schwab & Co., its parent or affiliates, and/or its
employees and/or directors may have positions in securities referenced herein, and
may, as principal or agent, buy from or sell to clients.
! NOTE:
Level II data is available to you for a fee if you wish to subscribe to the
service. However, the fee may be waived if you meet certain eligibility
requirements. For additional information, please contact your Schwab Active Trader
Team.
•
The left column shows the Market Maker, Exchange and ECN best Bid quotes
with the number of shares available at a particular bid.
•
The middle column shows the Market Maker, Exchange and ECN best Ask
quotes with number of shares available at a particular ask.
•
The right column (Time and Sales) shows the most recently reported trades,
the quantities of shares traded, and the time.
•
The top line of both the Bid and Ask can display the Level I quotes if you go
to Settings > General > L2 Data tab and check the Level 1 box.
•
For Level II users, each line shows the Market Maker or ECN ID with their
Bid/Ask price.
Copyright © Charles Schwab & Co., Inc. 2006. All rights reserved. (0106-5667)
71
StreetSmart Pro User Manual
•
A
For Listed equities each line shows the Exchange with its Bid/Ask price and
the number of actual shares available on the specialist order book or ECN
book.
Aggregate
Quotes
•
Aggregate quotes show the number of shares being
quoted at each price level. The size is the sum of all
of the individual market maker/ECN quotes at that
level.
•
You can view/hide the aggregation by checking
Display Aggregate Quotes in the Trading window
menu Settings > L2 Data > Display Settings.
•
Increase or decrease the number of aggregate levels
shown by clicking and dragging the divider bar
between the aggregate and Level II areas.
B
Level I
Shows only the inside bid and ask for a stock. It does not
reflect the depth of the bids and asks. It is reflected as
"L1" in both the bid and ask boxes. You will still be able
to view certain ECN quotes, but not the individual Market
Makers or Exchanges.
C
Level II
Shows the depth of all bids and asks in a symbol. The left
column shows the Bids; the middle column displays the
Asks. Each line shows:
•
The four-letter Market Maker, ECN, or Exchange
ID,
•
Their best Bid or Ask price (while this is their best
price, it may not reflect their entire book),
•
The Market Maker will always be displayed in
capital letters, while the ECNs will only display in
capital letters if only their best Bid/Ask quote is
displayed. Other non-NASDAQ quotes are noted
with an asterisk (*).
•
To change the display, go to Settings > General
> L2 Data and click all available ECN books or
exchanges.
! NOTE: The availability of book quotes from
some ECNs is sporadic. If checked, the software
will display these quotes when available.
•
Number of shares they are making available at
that price.
•
Shares available are shown in actual amounts.
Level II Tips
•
72
Check Show Equity Quote Volume in 100s in
the Settings > General > L2 Data window of
your Trading window to display available shares at
1/100th of their real value (e.g. 10 means the
participant has 1000 shares available). If there
Copyright © Charles Schwab & Co., Inc. 2006. All rights reserved. (0106-5667)
Trading
are parentheses ( ) around the number, it is for
fewer than 100 shares and is the "actual" number
of shares they are making available (For example:
If you see (75), the participant has exactly 75
shares to buy or sell.)
•
Direction Quote Change Arrow: Activates small
up / down arrows in the Level II area of the
Trading window indicating the direction a market
participant just moved in relation to the inside
price.
EXAMPLE If Market Maker ABCD is on the bid at
65.20, but backs off to 65.17, a down arrow will
appear at the new price level. If ABCD moves
back up to 65.20, an up arrow will appear.
To add this to your display, go to Settings
General > L2 Data tab and click Show
Directional Quote Change Arrow.
•
D
Time & Sales
Show Status of Bid/Ask: You can view the
Status of the bids and offers. Check Show Status
of Bid/Ask in the Trading window Settings >
General window to display:
O = open, displays a current, valid quote for the
participant;
L = open for trading, but the quote has not been
refreshed;
K = closed for trading.
Shows every trade being reported through NASDAQ and
NYSE plus the INET book trades (denoted by "-inet"), as
well as the share size and time the trade was reported.
Time & Sales is color-coded. These colors may be
changed by going to Settings > Colors in the Trading
window menu.
The default colors are::
•
Green: Trades at the inside Ask
•
Red: Trades at the inside Bid
•
White/Gray: Trades in between the inside
Bid/Ask
•
Yellow: Trades above the inside Ask
•
Purple: Trades below the inside Bid
•
Grey Highlight: Inside quote change. Not a
transaction.
Set the number of trades back to view through the
Settings > General menu. To expand this view up to
the last 1000 trades, right-click in the T&S window and
select Request Expanded T&S.
Copyright © Charles Schwab & Co., Inc. 2006. All rights reserved. (0106-5667)
73
StreetSmart Pro User Manual
TIPS:
Maximizing Level II Depth
You can maximize the depth of Level II data by hiding the Order Entry panel.
Just click the Open/Close Order Entry Panel arrow.
You can also select Hide Menu from the right-click menu to further maximize
the depth of the quotes display.
Viewing More Level II Quotes
To view more quotes, right-click in the Bids, Asks, or Time & Sales area of Level
II and select Show Scroll Bar. This will allow you to scroll down and see the
quotes that do not fit in the screen.
View Entire ECN Books
Go to Settings > General > L2 Data tab and check those boxes under
Display Bid/Ask Quotes. When the entire book is displayed, the ECN ID and
quote data will appear in red lower case text.
ABOUT THE ACTION BUTTONS
•
Once the Order Entry fields are set up to reflect the attributes you want,
choose your action: Sell, Short, Buy, or Save.
•
If the Spec Cond box has been checked, when you click on an Action button,
an additional Order Entry window will pop-up allowing you to specify further
details about your order.
•
If the Spec Cond box has not been checked, when you click on an Action
button the order verification window will display unless you have elected to
turn it off. See the Order Verification topic for more information.
•
The Save button is actionable only when either SmartEx, Schwab Pre Market
or Schwab After Hours is selected in the order route drop-down. This feature
allows you to save the order to the Saved Order tab for later submission.
•
If the account is restricted to liquidations only, the action buttons will be
grayed-out.
•
To liquidate equities and options in a restricted account, go to the Account
Detail Positions tab and select Close from either the right-click or the
Positions drop-down menu.
ORDER VERIFICATION
StreetSmart Pro® software provides you with Order Verification and Warning &
Informational Messages related to your order. These two settings are found in the
Trading window menu under Settings > General and the default settings are
checked to activate these important features.
74
Copyright © Charles Schwab & Co., Inc. 2006. All rights reserved. (0106-5667)
Trading
! NOTE:
The Settings > General window includes additional features for Direct
Access and other display settings. See Configuring the System for information
about updates to the General Settings dialog box.
Order Verification applies to all orders regardless of whether you route your order
to SmartEx or one of the Direct Access destinations. After you click one of the
action buttons (when routing an order using a Direct Access channel), a pop-up
window automatically displays your order so you can verify its accuracy before
submitting it. The Order Verification window gives you:
• Details of your order and estimated cost if you have set this up (See
Settings > General > Commissions)
• Warning and informational messages
• Error messages related to the order
Copyright © Charles Schwab & Co., Inc. 2006. All rights reserved. (0106-5667)
75
StreetSmart Pro User Manual
You have the option of deactivating these settings in the Settings > General
window. You can:
•
Turn off both Order Verification and Warnings, or
•
Keep Order Verification on and turn off only Warnings.
However, it is important that you understand the risks involved in deactivating
either of these settings.
IMPORTANT: If you turn off Order Verification, your orders are immediately
submitted without a verification screen, so you will not have the opportunity to
review the terms of your order prior to entry and will not see warning or
informational messages related to your orders. By unchecking this feature, you
accept the associated risks of trading without an Order Verification window and
messaging as described in the StreetSmart Pro Agreement and Disclosures.
ORDER WARNING MESSAGES
The Order Warnings feature of StreetSmart Pro® automatically opens a pop-up
window with warnings and important information about your order to review before
you submit it. The default setting is checked to activate this feature. Here are some
samples of the warnings and messages that be generated.
Warning Messages include:
Triggered by:
You have an open order for this security.
Duplicate order
76
Copyright © Charles Schwab & Co., Inc. 2006. All rights reserved. (0106-5667)
Trading
The security you are buying is not marginable.
Security cannot be bought
on margin or sold short
Please Note: The margin requirement for (your
symbol) is XX%.
Maintenance margin of the
security is something other
than the standard 30%.
The price you have entered is below the last
available quote. If you believe this condition
should not exist, please re-examine your order
for any possible errors.
Limit price is away from
current price
The price you have entered is above the last
available quote. If you believe this condition
should not exist, please re-examine your order
for any possible errors.
Limit price is away from
current price
The order you have requested "Buy at a Limit of
$LIMIT_PRICE" is significantly above this
security's closing price. If you believe this
condition should not exist, please re-examine
your order for any possible errors.
•
Limit price is away from
current price
•
Extended hours session
The order you have requested "Sell or Sell Short •
at a Limit of $LIMIT_PRICE" is significantly below
this security's closing price. If you believe this
•
condition should not exist, please re-examine
your order for any possible errors.
Limit price is away from
current price
Extended hours session
Please note: A special maintenance requirement
of 100% is required for this purchase because
the price per share of (your symbol) is below
$3.00.
Stock prices below $3.00
require 100% maintenance
Please note: You are placing a cash secured put.
Your available cash will be reduced by the
assignment value of the put.
Entering into an equity put
position in a Level 1 IRA or
Cash account creates a
CSEP position.
IMPORTANT: If you turn off Warnings (Trading window Settings > General >
Orders), your orders are automatically submitted without displaying Warning &
Informational Messages related to your orders. By unchecking this feature, you
accept the associated risks of trading without Order Verification as described in the
software Agreement and Disclosures.
CHANGING OR CANCELING ORDERS
Changing Orders
To change a SmartEx order, go to the Account Detail window, Order Status tab and
either right-click on the open order then select Change or click once on the order
to highlight it, then click Orders > Change. A pop-up box will appear prompting
you to modify your order.
Note that you cannot change the order type of a SmartEx order to or from a trailing
stop order after the order has been submitted. You must first cancel the order and
then resubmit with a different order type.
Copyright © Charles Schwab & Co., Inc. 2006. All rights reserved. (0106-5667)
77
StreetSmart Pro User Manual
Direct Access orders can never be changed.
Canceling Orders
You can request to cancel open orders via the Order Status Tab. All Open orders
have a green box in the left-most column. Because of the speed of execution and
the short life span of market and marketable limit orders, canceling these orders
may not always be possible.
TRADING WINDOW MENU
The menu bar is accessible by right-clicking in the Trading window and selecting
Show Menu Bar.
FILE
Close
Will close the Trading window. To reopen, click the Trading
in the Main Tool Bar or go to Tools > Start
window icon
Tool… and change the number of Trading Windows.
SETTINGS
General
Allows you to change general settings for Orders, Level I
and II data, and Time & Sales. Refer to the Trading Window
Settings topic for details about this important feature.
Hot Keys >
Number Pad
Number Pad allows you to assign either Symbols or
Quantities to the keys on your keyboard number pad.
Stock symbols and price and volume data shown here and
in the software are for illustrative purposes only. Charles
Schwab & Co., its parent or affiliates, and/or its employees
and/or directors may have positions in securities referenced
herein, and may, as principal or agent, buy from or sell to
clients.
1. Check Enable Number Pad Hot Keys
78
Copyright © Charles Schwab & Co., Inc. 2006. All rights reserved. (0106-5667)
Trading
2. Decide whether to use the number pad keys for
Symbols or Quantities.
3. If you select Use for Symbol Load, enter the full
stock symbol in the fields at the bottom of the
window. EXAMPLE If you enter WXYZ in the 7
field, when you are in the Trading window and press
7 in your number pad, WXYZ will load in the
Trading window.
4. If you select Use for Quantity, you can set up
different quantities depending on whether you're in
the Stocks or Options tab. Select the type of
security from the drop-down list and enter the
quantity you wish to assign to each key in the fields
at the bottom of the window.
5. Another alternative when using the number pad keys
for quantities is to Aggregate Quantity
Increments.
EXAMPLE If you have Number Pad Key 1 set to
100 and Number Pad Key 2 set to 500, you could
set the share size to 700 by pressing 1 and then 2.
- To reduce by the quantity assigned, press Ctrl +
the Number Pad Key assignment by which you wish
to reduce your quantity.
- Press the divide symbol (/) on the number pad to
set the quantity back to zero.
6. Click OK to save your changes.
Copyright © Charles Schwab & Co., Inc. 2006. All rights reserved. (0106-5667)
79
StreetSmart Pro User Manual
Hot Keys >
Symbol Aliases
Symbol Aliases can be used to assign letters (or a
combination of letters) to certain stocks to load them into
the Trading window more quickly. For example, in the
figure to the right, AMZN's alias is AZ. You would type in AZ
into the Trading window and press Enter to load AMZN into
the Trading window. You can insert any combination of
letters or use single letters.
If you choose to use the aliases, this will take precedence
over New York stocks. For example, if W has been assigned
as the alias for WXYZ, when W is typed into the Trading
window, WXYZ will load instead of the stock whose actual
symbol is "W."
Setting Up an Alias
1. Click in the Use Aliases box to activate
2. Type in a Symbol and Alias
3. Press the Add key or Enter to add it to the list
4. To delete one alias, click on it in the list and click
Remove
5. To delete ALL aliases, click on Remove All
! NOTE:
Hot Keys can only be set for one Trading window
and will be the same for any other Trading windows open.
You cannot set different Hot Keys for each Trading window.
80
Copyright © Charles Schwab & Co., Inc. 2006. All rights reserved. (0106-5667)
Trading
Links
Links allow you to automatically load stocks into other
windows when they are loaded into the Trading window.
Note that only the linkable windows open in your layout will
be displayed in the Links list.
1. Click on an item to link to the Trading window.
•
News
If linked to the Trading window, any stock
loaded here will also load the most recent news
on the stock in the News window.
•
Strategy Matrix™ tool
•
Charts
When a stock is entered into the Trading
window, the chart for that stock will also appear
in the charts you select from this list. The
settings for the chart will stay the same, but the
stock it represents will change.
TIP: You may link one chart to multiple
Trading windows.
•
Other Trading windows
2. Click on OK.
3. Every time a stock is entered into the Trading
window, the items linked will display that stock's
information.
Clear Symbol
List
Clears all symbols from the Trading window Symbol field
and drop-down.
Fonts
Click to change fonts.
Color
Through the Color option you can change the background,
ECNs, watches (Market Makers you specified in the Trading
window General Settings to Watch) and Time & Sales
colors. Click on the color wheel button
color choices.
to display all the
Change the Price Level Color Scheme
1. Select from the drop-down list whether to use the
Custom, Traditional, Earth, etc. color scheme. An
example of the colors will display at the bottom of
Copyright © Charles Schwab & Co., Inc. 2006. All rights reserved. (0106-5667)
81
StreetSmart Pro User Manual
the window.
2. For Custom, click on a level and then click the color
wheel button to select a new color for that level.
3. The Price Level scheme can also be inverted to view
the Level II data in black over a red background. To
invert, check the Inverted box with the mouse.
4. Click on Color Rotation to keep colors with the
price levels as they move.
TRADING WINDOW SETTINGS
By clicking on Settings > General, the Trading Window Settings will open and
changes can be made.
! NOTES:
Global Settings: Bold check boxes are global changes (for all open Trading
windows). Changing a setting marked with a bold check box affects all Trading
windows simultaneously.
Non-Global Settings: Non-bold check boxes are local and only affect the Trading
window in which you are working.
ORDERS
EXECUTION SETTINGS
Order Verification
If checked, requires you to verify orders before they are
sent, allowing you to reduce the risk of sending an
incorrect order.
! NOTE: For important information about this subject,
go to Order Verification.
View Warnings
StreetSmart Pro® automatically provides Order
Verification and Warning & Informational Messages
related to your order.
The default setting is active.
! NOTE:
For important information about this subject,
go to Order Warning Messages.
Default INET
Orders to IOC
If checked, every INET order you send will automatically
be sent as an Immediate or Cancel order, which requests
an immediate fill for any number of shares that may be
available with the possibility of a partial fill. Any
remaining shares that are unfilled will be cancelled.
This option will be grayed out if you do not have Direct
Access capability.
Default MM
Double-Click to
SuperMontage
82
If checked and you double-click on a Market Maker ID in
the Level II screen, your order entry fields will
automatically set up a SuperMontage order.
Copyright © Charles Schwab & Co., Inc. 2006. All rights reserved. (0106-5667)
Trading
If unchecked and you double click on a Market Maker ID,
the system will automatically set up to send an order at
that limit price.
Pop-up Execution
Panel Outside Lvl
II
Will position any order routing pop-up windows so that
they do not pop-up on top of the Level II display.
Price Increment
You can change the increments by which the arrows next
to the price field change the price. For example, if it were
set to 0.125, a stock at 20.50 would change to 20.625
when you click the up arrow.
QUANTITY
Save Current
Quantity Always
Clicking on this option will set the default share size to
the share size that is currently in the Share Size field of
the Trading window. So, when you pull up a new stock,
the share size will remain the same.
Set Quantity to
Open Position
If you have an open position in a stock and this box is
checked, the next time you load that stock into the
Trading window, the Share Size field will show the
number of shares you hold.
Set Quantity to
Default
If selected, the software will default the quantity field to
the specified Default Share Size or Default Contract
Size.
AUTO CANCEL TIMEOUTS
Note that changes to these settings are isolated to the computer on which you
make them. If you access your software from another computer, you will need
to change your timeout settings there as well.
SuperMontage
This will automatically send a cancel after the number of
seconds you put into the text box for SuperMontage
orders only. The default setting is 0 seconds, which
means it will remain live until canceled or executed.
ECN
The number of seconds that direct ECN orders are live
before the system auto-cancels them. A value of 0
disables auto-cancel. The default is 180 seconds. To find
out which ECNs post orders to their books, go to that
ECNs section in this manual or visit their website. As ECN
information changes on a regular basis the most reliable
information will be found on their website.
L1 DATA
DISPLAY SETTINGS
Compute Ratio
from Quantities
If checked, the ratio display in the Trading window will
display number of shares available at the inside Bid vs.
the inside Ask. If unchecked, the ratio shows the number
of participants at the inside Bid vs. the inside Ask.
Calculate Change
Choose whether change is calculated based on one of the
Copyright © Charles Schwab & Co., Inc. 2006. All rights reserved. (0106-5667)
83
StreetSmart Pro User Manual
from:
following:
•
Open: Calculates change from the Open price.
•
Close: Calculates change from the current day's
close. The change will recalcuate when the
exchange close price is received.
•
Previous Close: Calculates change from the
previous day's close received from the exchange.
L2 DATA
DISPLAY SETTINGS
Display Aggregate When checked, displays an aggregate of the top 20 price
Quotes
levels above your Level II montage.
Hide Primary if
Book is Displayed
If checked, for any ECN Book data that is displayed (see
Displayed Bid/Ask Quotes below), the primary quote for
that ECN will NOT display in Level II. This eliminates the
display of duplicate quotes during the standard session.
Remove Stale
Quotes
Filters out stuck quotes during market hours.
Show Directional
Quote Change
Arrow
If enabled in your Trading window settings, you may see
some small up and down arrows in the Level II area of
the Trading window. What these arrows indicate is the
direction that market participant just moved in relation
to the inside price. For instance, if Market Maker GSCO is
on the bid at 65.25 but backs off to 65.125, a down
arrow will appear at the new price level. If GSCO moves
back up to 65.25, an up arrow will appear. Similarly, if
GSCO is on the ask at 65.25 and moves up to 65.35, an
up arrow will appear. If GSCO merely refreshes his
quote, no arrow will display.
This option will be grayed out if you are not enabled for
Level II.
Show Equity
Quote Volume in
100's
If unchecked, the full volume for a quote will display. If it
is checked, the quote will display without the last two
zeros to save screen space.
Show L2 Options
Data
Check to display the Level 2 Options tab in the Trading
window. For more information on Level 2 options, review
the Level 2 Options Tab topic.
Show Status of
Bid/Ask
This information will appear in Level II. Status of Bid/Ask
shows the current status of the Market Maker.
"K"=closed, "O"=open, "L"= open (non-refreshed) in the
morning and closed in the evening.
This option will be grayed out if you are not enabled for
Level II.
Show Time of
Bid/Ask
84
Displays in Level II the time that the price server
received the quote.
Copyright © Charles Schwab & Co., Inc. 2006. All rights reserved. (0106-5667)
Trading
This option will be grayed out if you are not enabled for
Level II.
Sort Quotes by
Size
Sorts all the posted quotes at each Tier in Level II by
Size and then Time, where the largest size quote would
be at the top of the tier. If multiple quotes have the
same size, then sort by order of oldest first.
Watch ECNs
Will highlight all ECNs on Level II. Set the color of the
highlight by going to Settings > Colors and clicking on
the color wheel next to Watches. Red is the default
color.
This option will be grayed out if you are not enabled for
Level II.
Watches
You may choose to highlight four Market Makers/ECNs in
Level II. The colors can be changed by going to Settings
> Colors and clicking on the color wheel next to
Watches. Red is the default color.
Color Watches at Inside Only: If checked, highlights
the watched Market Makers/ECNs only when they are at
the inside bid or ask.
DISPLAY BID/ASK QUOTES
You have the option to integrate any available ECN books (not available for all
ECNs) into Level II. Check the boxes next to the types of data you wish you
see in your Level II montage.
Update in Extended Hours: If checked, Level 1 data will update during
extended hours trading. If unchecked, it will freeze at the prior close price.
TIME & SALES
DISPLAY SETTINGS
New Time & Sales
Info at Top
This makes all new time & sales to appear from the top
vs. the bottom.
Color Time &
Sales Info
Will color-code the Time and Sales for regular and ECN
prints. The following are the default colors, but you can
change these by going to Settings > Colors in the
Trading window menu.
Green: Trades at the inside Ask
Red: Trades at the inside Bid
White/Gray: Trades in between the inside Bid/Ask
Yellow: Trades above the inside Ask
Purple: Trades below the inside Bid
Gray Highlight: Quote change; not a transaction
Show Time on
Sales
This option will display the time of each print.
Copyright © Charles Schwab & Co., Inc. 2006. All rights reserved. (0106-5667)
85
StreetSmart Pro User Manual
Print Quote
Changes in Time
& Sales
Will highlight in grey and print quote changes in the Time
& Sales panel.
Show Equity Print
Volume in 100's
If checked, the full volume for a print will display. If it is
unchecked, the print will display without the last two
zeros to save screen space.
T&S Trades Back
Shows a certain number of trades backward when
loading a new stock. For instance, if you want to see the
last 20 prints for the stock each time you load a new
one, set this to 20. The maximum is 40 trades back.
To expand this view up to the last 1000 trades, rightclick in the T&S window and select Request Expanded
T&S.
DISPLAY EXCHANGE LABELS ON PRINTS
If an exchange is checked, each time a print comes through Time & Sales from
that exchange, the ID for the exchange will display next to the print. Prints
from unchecked exchanges will display without an exchange tag.
COMMISSIONS
DISPLAY SETTINGS
Display Estimated
Order Cost
Including
Commissions
If checked, the estimated order amount displayed in the
Order Verification window will include the estimated
commissions specified in the fields below.
Equities/Options
Commissions
Enter the estimated commissions to use in calculating
the estimated order cost.
! NOTE:
Only enter a commission value for the type of
commission structure currently assigned to your account.
Do not enter a value in both the 'per trade' and 'per
share' fields. Leave one of the fields blank.
86
Copyright © Charles Schwab & Co., Inc. 2006. All rights reserved. (0106-5667)
Trading
SmartEx Trading
HOW SMARTEX ORDERS ROUTE
SmartEx is a trade execution technology that combines the best of intelligent order
routing (IOR) with market maker liquidity enhancements. SmartEx is designed to
deliver trade executions that are as good as, if not better than, what you would
expect to receive using IOR alone. Currently, SmartEx technology is used for
executing NASDAQ National Market securities. Orders for listed securities continue
to be executed according to the individual execution methods of receiving
specialists.
SmartEx is an electronic execution technology designed to "hunt and seek" the best
available price for your retail sized marketable orders. SmartEx automatically seeks
the liquidity from the best price displayed in the market whether it is from an ECN
or a market maker, and provides an execution based on the liquidity available. If
there is insufficient size at the best price in the marketplace, SmartEx will
automatically continue to route the remainder of your order at each subsequent
price until your entire order has been filled or your limit order price (if any) has
been reached. In addition, your order may receive enhanced liquidity in excess of
the current liquidity displayed in the market. SmartEx order routing is available
during the standard session only. It is not available during the extended hours
sessions.
With SmartEx, there is only one commission charge and one order number (unless
you change or cancel the order) regardless of the number of executions it takes to
fill your order.
PLACING A SMARTEX ORDER IN THE STANDARD MARKET SESSION
1. Enter the symbol in the symbol field and press Enter on the keyboard
2. The symbol field background should be white. (If it’s blue, the window has
not been updated with the quote information for the new symbol. To make
the symbol field background white, press Enter on your keyboard.)
3. If necessary, change the quantity using the arrow buttons or the following
keyboard keys:
•
Up/Down keys to increase or decrease in increments of 500
•
Left/Right keys to increase or decrease in increments of 100
•
Shift + Up/Down keys to increase or decrease by 10
•
Or click in the quantity field and type the number of shares or
contracts.
TIPS:
•
You can also click the $ button and enter a dollar value to see how
many shares you could trade for that amount.
•
To set the default quantity to a different amount go to Settings >
General > Orders > Quantity in the Trading window menu.
4. Choose whether to place a Limit, Market, or Trailing Stop Order Type.
Copyright © Charles Schwab & Co., Inc. 2006. All rights reserved. (0106-5667)
87
StreetSmart Pro User Manual
5. If placing a Limit order type, click on a price level in the Level II area of the
Trading window to set the price.
6. If placing a Trailing Stop order, enter the number of points or the
percentage for the trailing stop.
7. If necessary, change the Price using the arrow buttons or click in the Price
field and use the following keyboard commands:
•
Up/Down keys to increase or decrease by .05
•
Left/Right keys to increase or decrease by .01
•
Shift + Up/Down keys to increase or decrease by .005
8. Select the session in which you wish to trade from the order routing field:
SmartEx, Schwab Pre Market, Schwab After Hours. For a comparison
of each route, view the SmartEx Order Types topic.
9. For SmartEx and extended hours orders the Time in Force (TIF) will always
default to Day. If you wish to use a different TIF check the Spec Cond
checkbox.
10. You can check the Spec Cond box to set any additional order qualifiers or to
submit a Stop or Stop Limit order. This will require one more window to be
reviewed prior to the Order Verification window.
11. To sell your entire position, check the Sell All box. The quantity will default
to the shares you have available to sell. When checked, the quantity will
become shaded. See the Sell All topic for more information.
12. Once the Order Entry fields are set up to reflect the attributes you want,
choose your action: Sell, Short, Buy, or Save.
13. If Order Verification is enabled in the Trading window Settings >
General window, you will be asked to verify the details of your order before
it is sent.
14. Click Place Order to submit the order or Do Not Place Order to cancel
your action.
PARTIAL FILLS
SmartEx
An order routed through SmartEx may have partial fills. Schwab will continue
attempting to fill the order until it's completed.
•
For a Day Limit order, there is only one commission charge and generally
one order number assigned unless you change your order, regardless of the
number of fills it takes to complete the order.
•
Good 'Till Cancelled orders have the potential for multiple commissions if
the order takes more than one day to complete. One commission will be
charged for each day's combined fills, based on execution prices and
quantities.
Direct Access
If you have Direct Access enabled for your account, it is your responsibility to make
sure your order is filled to your satisfaction. Partially filled orders require a decision
on your part to either enter an additional order for the remaining shares or not.
88
Copyright © Charles Schwab & Co., Inc. 2006. All rights reserved. (0106-5667)
Trading
For Direct Access orders, there is always the potential that your order will not
completely fill. As the default settings have a maximum value of 180 seconds for
ECN orders, it is very possible not to complete an order in under three minutes,
depending upon the symbol, market, and routing method. Commissions will be
based upon the price and number of shares filled on each order. To change the
Auto cancel timeout setting go to the Orders tab in the Settings > General
window.
All orders and executions can be viewed in the Order Status tab of the Account
Detail window or, if there was more than one fill, in the Order Detail window. This
window can be accessed by double clicking on the order or by clicking on the order
and going to Orders > Detail in the menu.
SMARTEX ORDER TYPES
StreetSmart Pro® allows you to select any of these SmartEx order and action
types:
Order Types
Action Types
Market
Buy
Limit
Sell
Stop
Sell Short
Stop Limit
Save
Trailing Stop
Cancel
Change
Trailing Stops
•
A SmartEx Trailing Stop Buy/Sell/Short order is a stop order whose stop
price will trail either the current inside ask (if buying) or inside bid (if
selling/shorting) at the time the order was submitted by the number of
points or the percent you specified in the Trailing Amount field.
EXAMPLE In the image below, we have a trailing stop of 5% set.
If at any point the price retraces the specified Trailing Amount, a SmartEx
Market order will be routed for the quantity you specified.
If you place an order to close a position using a trailing stop set to 5%, if the
bid price increases 9% and then drops 5% the order will be sent at that time.
The change from the time that the trailing stop was placed would effectively
be 4% above where you placed the order.
•
Trailing Stop can have a Time in Force (TIF) of Day or GTC (Good 'til
Canceled).
•
When placing a Trailing Stop order, please note that you cannot change the
order to another order type using the Change feature, nor can you change
Copyright © Charles Schwab & Co., Inc. 2006. All rights reserved. (0106-5667)
89
StreetSmart Pro User Manual
another order type to a Trailing Stop order. In both cases, you would have to
cancel the order and resubmit with a different order type.
For some NASDAQ equity orders, you may not be able to change the order. When
this occurs you will notice that your order cannot be changed because, in most
cases, it will fill immediately. You can always request to cancel a limit order that
has not completely filled. Market orders can not be cancelled during Standard
Market Session.
And you can designate which session you want your order placed in:
Trade Types
Available
Not Available
Standard Session /
SmartEx
•
Routes 24/7 to
Schwab for
submission in
current/next Standard
session.
Always available.
•
Trades are executed
from 9:30 a.m. to
4:00 p.m. ET.
•
Only from 8:05 p.m.
to 9:15 a.m. ET.
•
Trading session open
from 7:30 a.m. to
9:15 a.m. ET.
•
Only from 4:05 p.m.
to 8:00 p.m. ET.
•
Trading session open
from 4:15 p.m. to
8:00 p.m. ET.
Pre Market
After Hours
9:15 a.m. to 8:05 p.m.
ET
8:00 p.m. to 4:05 p.m.
ET
! NOTES:
•
Extended hours orders are limit orders good only for the current or next
session.
•
If you select either Pre Market or After Hours in the routing field, the Spec
Cond checkbox will still be available to you but you can only change the
quantity and price of your order.
•
ECN trades on Listed stocks will still populate the time and sales window in
the After Hours and Pre Market sessions.
•
Selling of fractional shares is allowed during extended hours sessions.
•
For more information, go to the Extended Hours Trading section.
SELL ALL CHECKBOX
The Sell All Checkbox is located in three places:
90
Copyright © Charles Schwab & Co., Inc. 2006. All rights reserved. (0106-5667)
Trading
•
the Trading window
•
the Execute SmartEx Order window accessed when you check Spec Cond,
and
•
when selling from the Positions tab of your Account Details.
Stock symbols and price and volume data shown here and in the software are for
illustrative purposes only. Charles Schwab & Co., its parent or affiliates, and/or its
employees and/or directors may have positions in securities referenced herein, and
may, as principal or agent, buy from or sell to clients.
When checked, Sell All allows you to sell your entire position, including fractional
shares, via SmartEx. As the quantity field does not allow the input of fractional
shares, using the Sell All checkbox is the only way to send orders to sell fractional
share amounts.
When Sell All is checked:
•
The Quantity field displays the full share amount available for sale, including
fractional shares. This quantity takes into account any open orders that you
may have and any shares held that are currently non-negotiable. This
amount cannot be changed when Sell All is checked.
•
The Sell All checkbox can be turned on and off. If turned off the quantity will
revert to the default amount designated in the Trading window Settings >
General window.
•
If you are using Sell All to sell your remaining fractional shares, only Market
Orders are allowed.
SPECIAL CONDITIONS SETTINGS
Copyright © Charles Schwab & Co., Inc. 2006. All rights reserved. (0106-5667)
91
StreetSmart Pro User Manual
SmartEx orders can be qualified with the Spec Cond (Special Conditions)
checkbox.
The Spec Cond box is already checked as the default and opens the Execute
SmartEx Order window allowing you to customize your order with special
conditions when you submit or save an order.
! NOTE:
Using order qualifiers can delay the execution of your order or reduce the
likelihood of it being filled.
TIP: For faster submission of Day Market and Day Limit Orders, you can
uncheck the Spec Cond box and submit those orders directly from the Trading
window.
StreetSmart Pro® has been designed to prevent you from sending variables that
will not be accepted in the marketplace.
Stock symbols and price and volume data shown here and in the software are for
illustrative purposes only. Charles Schwab & Co., its parent or affiliates, and/or its
employees and/or directors may have positions in securities referenced herein, and
may, as principal or agent, buy from or sell to clients.
SPECIAL CONDITIONS
CHECKBOX FIELDS
STATUS / ACTION
Account Number
Displayed in the title bar
Security and Action
Displayed and cannot be edited
Order Type
Use this drop-down menu to select your order type:
92
•
Limit
•
Market
•
Stop
•
Stop Limit
•
Trailing Stop: A SmartEx Trailing Stop
Buy/Sell/Short order is a stop order whose
stop price will trail either the inside ask (if
buying) or inside bid (if selling/shorting) at
the time the order was submitted by the
number of points or the percent you specified
in the Trailing Amount field.
Copyright © Charles Schwab & Co., Inc. 2006. All rights reserved. (0106-5667)
Trading
EXAMPLE In the image below, we have a
trailing stop of 5% set.
If at any point the price retraces the specified
Trailing Amount, a SmartEx Market order will
be routed for the quantity you specified.
If you place an order to close a position using
a trailing stop set to 5%, if the bid price
increases 9% and then drops 5% the order
will be sent at that time. The change from
the time that the trailing stop was placed
would effectively be 4% above where you
placed the order.
Defaults to the order type you selected in the
Trading window –– either Market, Limit, or Trailing
Stop.
Share Quantity
Can be changed using the up/down arrows,
however, only whole share amounts can be
accepted in the quantity field.
Limit Price
Can be changed via manual input or by using the
arrows - can be up to four decimal places only.
Stop Price
•
Can only be entered if Stop or Stop Limit order
is chosen.
•
Can be up to four decimal places only.
Trailing Amount
A SmartEx Trailing Stop Buy/Sell/Short order is a
stop order whose stop price will trail either the
inside ask (if buying) or inside bid (if
selling/shorting) at the time the order was
submitted by the number of points or the percent
you specified in the Trailing Amount field.
EXAMPLE In the image below, we have a trailing
stop of 5% set.
If at any point the price retraces the specified
Trailing Amount, a SmartEx Market order will be
routed for the quantity you specified.
If you place an order to close a position using a
trailing stop set to 5%, if the bid price increases 9%
and then drops 5% the order will be sent at that
time. The change from the time that the trailing
stop was placed would effectively be 4% above
where you placed the order.
Reinvest Dividends
Check to reinvest dividends for this security.
Copyright © Charles Schwab & Co., Inc. 2006. All rights reserved. (0106-5667)
93
StreetSmart Pro User Manual
Special Conditions
Order Verification is
Selected
Designate special conditions, including:
•
AON (All or None)
•
DNR (Do Not Reduce) for GTC orders only
•
Min Qty (Minimum Quantity)
•
Use only for orders over 300 shares.
•
When checked, the amount field can be
changed, but the amount must be at least
200 shares.
•
Designating minimum shares applies to the
first fill only.
The action button at the bottom of the window
should read Verify Order.
Click it to open the Verification window.
See Trading Window Menu topic for details.
Save Button displayed
at bottom of window
Order Verification is
Not Selected
•
Click to post the order to the Saved Orders tab
in the Account Detail window.
•
No further validation/editing will be done until
the order is submitted.
The action button at the bottom of the window will
read Place Order.
Click to submit the order.
See Trading Window Menu topic for details.
94
Copyright © Charles Schwab & Co., Inc. 2006. All rights reserved. (0106-5667)
Trading
Direct Access Trading
DIRECT ACCESS ROUTE COMPARISON
During the specified trading times for each routing channel, Direct Access allows
you to enter buy and sell orders for NASDAQ, Listed, and OTC stocks. The table
below shows a list of all the action types allowed with Direct Access.
Action Types
Buy
Sell
Cancel
! NOTE: Short sale orders can be placed as either day or GTC orders; however,
GTC orders can expose you to substantial risk. Although the stock may be borrowed
on the day the order is entered, it may not be available for loan on the day the
order is filled. An immediate buy-in may result for your account.
The change order function is not accepted when routing orders via Direct Access.
Each routing channel has different order types, hours of operation, and order
conditions. The table below shows a quick reference guide for each destination
including the following information: hours of operation, maximum number of
shares, order types, and order conditions. For more information about each
destination, view the individual topic for each.
Order
Destination
Type of
Channel
Hours of
Operatio
n
(Eastern
Time)
Order
Types
Order
Security
Conditions Types
Traded
ARCA
(NYSE Arca)
ECN
7:00 a.m.
- 8:00
p.m.
Limit,
Market,
MarketPeg,
PrimaryPeg
Day, IOC,
Max Floor,
Peg Diff,
Discretion
NNM,
Listed, OTC
BRUT
(NASDAQ Stock
Market, Inc.)
ECN
7:00 a.m.
- 8:00
p.m.
Limit,
Limit
Invisible,
Market
Day, IOC
NNM,
Listed, OTC
BTRD
(Bloomberg)
ECN
7:30 a.m.
- 5:30
p.m.
Limit
Day, IOC
NNM,
Listed, OTC
INET
(formerly
ISLD/INCA)
ECN
7:00 a.m.
- 8:00
p.m.
Limit,
Limit
Invisible,
Day, IOC,
Max Floor,
Peg Diff,
NNM, Listed
Copyright © Charles Schwab & Co., Inc. 2006. All rights reserved. (0106-5667)
95
StreetSmart Pro User Manual
ONTD
(OnTrade)
ECN
SuperMontage Market
(NASDAQ)
Makers
and
Participati
ng ECNs
MarketPeg,
PrimaryPeg
Minimum
Quantity
8:00 a.m.
- 5:00
p.m.
Limit
Day
8:00 a.m.
- 4:00
p.m.
Limit,
Market
NNM, OTC
NNM, OTC
DIRECT ACCESS ELIGIBILITY
Direct Access order routing is available to eligible clients who want more control
over the routing of their orders. Direct Access trading entails certain risks and
responsibilities. As a result, we have established the special eligibility requirements
for Direct Access Trading. These eligibility requirements are posted on the
StreetSmart Pro® Center of Schwab.com, in the section called "Trade Routing."
PLACING A DIRECT ACCESS ORDER
Placing a Direct Access order is similar to placing a SmartEx order, except you may
use one of a variety of ECNs or NASDAQ SuperMontage.
1. Enter the symbol in the symbol field and press Enter on the keyboard
2. The symbol field background should be white. (If it’s blue, the window has
not been updated with the quote information for the new symbol. To make
the symbol field background white, press Enter on your keyboard.)
3. If necessary, change the quantity using the arrow buttons or the following
keyboard keys:
•
Up/Down keys to increase or decrease in increments of 500
•
Left/Right keys to increase or decrease in increments of 100
•
Shift + Up/Down keys to increase or decrease by 10
•
Shift + Left/Right keys to increase or decrease by 1
•
Or click in the quantity field and type the number of shares or
contracts.
TIPS:
•
You can also click the $ button and enter a dollar value to see how
many shares you could trade for that amount.
•
To set the default quantity to a different amount go to Settings >
General > Orders > Quantity in the Trading window menu.
4. Choose whether to place a Limit or Market Order Type.
5. If placing a Limit order type, click on a price level in the Level II area of the
Trading window to set the price
96
Copyright © Charles Schwab & Co., Inc. 2006. All rights reserved. (0106-5667)
Trading
6. If necessary, change the Price using the arrow buttons or click in the Price
field and use the following keyboard commands:
•
Up/Down keys to increase or decrease by .05
•
Left/Right keys to increase or decrease by .01
•
Shift + Up/Down keys to increase or decrease by .005
7. Select the Direct Access order route you wish to use, or you may use
SmartEx. For a comparison of each Direct Access route, view the Direct
Access Route Comparison topic.
8. The default Time in Force (TIF) will always be Day. Select a different TIF if
available for the order route you have chosen.
9. You can check the Spec Cond box to set any additional order qualifiers such
as pegging or Max Floor. This will require one more window to be reviewed
prior to the Order Verification window.
10. To sell your entire position, check the Sell All box. The quantity will default
to the shares you have available to sell. When checked, the quantity will
become shaded. See the Sell All topic for more information.
11. Once the Order Entry fields are set up to reflect the attributes you want,
choose your action: Sell or Buy. Use the SmartEx venue if you wish to place
a Short order.
12. If Order Verification is enabled in the Trading window Settings >
General window, you will be asked to verify the details of your order before
it is sent.
13. Click Place Order to submit the order or Do Not Place Order to cancel
your action.
ARCA ECN
General Information
•
The order will try to find a match in the ARCA (NYSE Arca) Book. If a better
price is available in the book, then it will target that price.
•
If no match is made, the order will post to the ARCA Book. The best bid and
ask posting 100 or more shares will post on Level II if it does not cross or
lock the market.
•
A market order is available by selecting Market in the drop-down menu once
ARCA is chosen as the order route. The default is a limit order.
•
Minimum decimal increment in order price: .001.
•
Day order available if Auto Cancel time is set to 0.
•
Default cancellation time: 180 seconds.
•
Trading Hours 7:00 a.m. to 8:00 p.m. ET for Limit orders
•
Trading Hours 9:30 a.m. to 4:00 p.m. ET for Market orders
•
All ARCA limit orders will be canceled after the close at 8:00 p.m. ET.
ARCA Order Routing
Copyright © Charles Schwab & Co., Inc. 2006. All rights reserved. (0106-5667)
97
StreetSmart Pro User Manual
Order Types
Description
Limit
•
Marketable Limit Orders - Matched with the ARCA
book or preferenced to other market participants
using ARCA's SmartBook logic. The order price may
be improved if a better price appears after your order
has been routed by ARCA.
•
Non-Marketable Limit Orders - The order is posted to
the ARCA book. ARCA posts the best bid and offer in
their book to Level II (MMID=ARCA)
NOTE: Your price may not cross or lock the market.
Market
*Market Peg
These are matched with the ARCA book if there is volume
at the inside. If ARCA is not at the inside the order is
routed using ARCA's SmartBook logic. Any residual will
not be routed to the next price level until all quotes at the
current best bid or offer are exhausted
•
Criteria for routing orders: % fill history, time, and
size shown.
•
Market orders are not accepted after 3:59 p.m. ET.
Pegs the order price to the ask if buying or to the bid if
selling, meaning the order price will automatically adjust
as the bid or ask moves until the order executes or the
stock trades beyond your limit price. Orders may be
adjusted a penny up or down to avoid locking the market.
EXAMPLE
*Primary Peg
•
XYZ is currently quoted at 20 bid x 20.05 ask.
•
A Market Peg order to buy XYZ with a limit of
20.10, will be submitted at 20.05.
•
If the quote changes to 20.05 bid x 20.10 ask, the
order price would change to 20.10.
•
If the order is not executed, it will not update
beyond the limit price and will remain posted at
20.10.
Pegs the order price to the bid if buying or the ask if
selling OTC securities, or the best exchange bid/ask for
Listed securities. The order price will automatically adjust
as the bid or ask moves until the order executes or the
stock trades beyond your limit price.
EXAMPLE
98
•
XYZ is currently quoting at 20 bid x 20.05 ask.
•
A Primary Peg order to buy XYZ with a limit of
20.05, will be submitted at 20.
•
If the quote changes to 20.05 bid x 20.10 ask, the
order price would change to 20.05.
•
If the order is not executed, it will not update
beyond the limit price and will remain posted at
Copyright © Charles Schwab & Co., Inc. 2006. All rights reserved. (0106-5667)
Trading
20.05.
Times In Force
Description
Day
Can be entered after 7:00 AM ET and expire at the end of
the extended trading day (8:00 p.m. ET)
IOC
Portions of the order not filled immediately upon reaching
the market are canceled.
Special Conditions
Description
*Discretion
Allows you to have a displayed price and a discretionary
price. You can place the order at the price you’d like to
receive with a discretion amount for the
maximum/minimum amount you’re willing to pay.
Available for limit orders only.
EXAMPLE A limit order to buy with a displayed price of
50 and a discretionary price of 50.25 is presented as:
Price = 50
Discretion = 0.25
*Max Floor
Specifies the reserve size for the order. Must be a round
lot equal to or less than the order quantity. Reserve size
has no time priority in Level II. Only the displayed
portion of the order will have time priority.
EXAMPLE You enter a bid with 5,000 as the total
quantity, but 1,000 as the Max Floor value. Your order
will display as 1,000 shares, but if yours is the only bid
when an offer arrives for 10,000 shares at your price,
your entire 5,000 shares will execute.
However, if 3 other bids for 3,000 shares each were
behind you at the same price, only your displayed 1,000
would execute, along with 9,000 shares from the other
three bids.
*Peg Diff
Added to the bid or offer to produce the actual order
price. Allows more flexibility in your order executions.
EXAMPLE To peg the offer minus .02, Peg Diff must
equal -0.02 (the negative sign is required).
* Features only available when Spec Cond is checked in the Trading window.
The information provided on this page is subject to change at any time.
BRUT ECN
Copyright © Charles Schwab & Co., Inc. 2006. All rights reserved. (0106-5667)
99
StreetSmart Pro User Manual
General Information
•
NASDAQ Single Book: NASDAQ® has integrated SuperMontage, INET, and
BRUT branded market data facilities into a Single Book. While the integration
does not impact the existing order routing venues and order types, the
migration results in Level II data display changes within StreetSmart Pro®.
The software consolidates SIZE, BRUT and INET quotes into one INET quote
at each tier.
Visit the NASDAQTrader.com for more information on the NASDAQ Systems
Integration.
•
Day orders are available if Auto Cancel time is set to 0.
•
Default cancellation time: 0 seconds.
•
Trading Hours 7:00 a.m. to 8:00 p.m. ET
BRUT Order Routing
Order Types
Limit
Description
These orders are not displayed in the BRUT book. The
order executes through the inside price (whether in the
market or in the BRUT Book) up until the limit is reached
- at which point the order will time out. Non-Marketable
Limit Orders - Will try to match with any other order on
the BRUT book. If no match is found will post to the
BRUT order book. Day orders can remain on the book
until the end of the day.
Limit Invisible
Invisible orders are never displayed in the book or in
Level II and therefore never cross or lock the market.
Market
Market orders are available during the standard session
only. If the full quantity cannot be matched in the book
the remaining shares will be routed via the BRUT
Liquidity Finder. Orders are sent out at NBBO only.
Execution will only stop if order executes in full or user
cancels.
Times In Force
Description
Day
Can be entered after 7:00 AM ET and expire at the end
of the extended trading day (8:00 p.m. ET)
IOC
Portions of the order not filled immediately upon
reaching the market are canceled.
The information provided on this page is subject to change at any time. To get the
most current information please go to the BRUT web site.
100
Copyright © Charles Schwab & Co., Inc. 2006. All rights reserved. (0106-5667)
Trading
BTRD ECN
General Information
•
Order goes directly to the BTRD order book. If a better price is available in
the book, it will target that price.
•
If there is not match, order will post on Level II (must not cross or lock the
market).
•
Sending a market order to BTRD in a fast market can result in a slower fill at
a worse price than a limit order.
•
BTRD accepts odd lot orders.
•
BTRD does not accept order prices with fractions smaller than .01.
•
Day order available if Auto Cancel time set to 0.
•
Default cancellation time: 180 seconds.
•
Trading hours: 7:30 a.m. to 5:30 p.m. ET.
BTRD Order Routing
Order Types
Description
Limit
Limit orders are supported for NASDAQ and listed
securities.
Times In Force
Description
Day
Can be entered after 7:30 AM ET and expire at the end
of the extended trading day (5:30 p.m. ET)
IOC
Portions of the order not filled immediately upon
reaching the market are canceled.
The information provided on this page is subject to change at any time. To get the
most current information please go to the BTRD web site.
INET ECN
General Information
•
NASDAQ Single Book: NASDAQ® has integrated SuperMontage, INET, and
BRUT branded market data facilities into a Single Book. While the integration
does not impact the existing order routing venues and order types, the
migration results in Level II data display changes within StreetSmart Pro®.
The software consolidates SIZE, BRUT and INET quotes into one INET quote
at each tier.
Visit the NASDAQTrader.com for more information on the NASDAQ Systems
Integration.
Copyright © Charles Schwab & Co., Inc. 2006. All rights reserved. (0106-5667)
101
StreetSmart Pro User Manual
•
INET does NOT accept Good 'Till Canceled orders and any open orders will be
canceled when trading hours end at 8:00 p.m. ET.
•
Day order available if Auto Cancel time is set to 0.
•
Default cancellation time: 180 seconds.
•
Trading Hours 7:00 a.m. to 8:00 p.m. ET
INET Order Routing
Order Types
Description
Limit
Matched against existing orders on the NASDAQ Single
Book.
Limit Invisible
These orders are never displayed on the book or in Level
II and, therefore, cannot lock or cross the market.
*Market Peg
Pegs the order price to the ask if buying or to the bid if
selling, meaning the order price will automatically adjust
as the bid or ask moves until the order executes or the
stock trades beyond your limit price. Orders may be
adjusted a penny up or down to avoid locking the
market.
EXAMPLE
*Primary Peg
•
XYZ is currently quoted at 20 bid x 20.05 ask.
•
A Market Peg order to buy XYZ with a limit of
20.10, will be submitted at 20.05.
•
If the quote changes to 20.05 bid x 20.10 ask, the
order price would change to 20.10.
•
If the order is not executed, it will not update
beyond the limit price and will remain posted at
20.10.
Pegs the order price to the bid if buying or the ask if
selling OTC securities, or the best exchange bid/ask for
Listed securities. The order price will automatically
adjust as the bid or ask moves until the order executes
or the stock trades beyond your limit price.
EXAMPLE
102
•
XYZ is currently quoting at 20 bid x 20.05 ask.
•
A Primary Peg order to buy XYZ with a limit of
20.05, will be submitted at 20.
•
If the quote changes to 20.05 bid x 20.10 ask, the
order price would change to 20.05.
•
If the order is not executed, it will not update
beyond the limit price and will remain posted at
20.05.
Copyright © Charles Schwab & Co., Inc. 2006. All rights reserved. (0106-5667)
Trading
Times In Force
Description
Day
Can be entered after 7:00 AM ET and expire at the end
of the extended trading day (8:00 p.m. ET)
IOC
Portions of the order not filled immediately upon
reaching the market are canceled.
Special Conditions
Description
*Min Qty
A special condition that specifies the minimum execution
quantity the client will accept (with any amount up to
the specified Quantity thereafter). Available for limit IOC
orders only.
*Max Floor
Specifies the reserve size for the order. Must be a round
lot equal to or less than the order quantity. Reserve size
has no time priority in Level II. Only the displayed
portion of the order will have time priority.
EXAMPLE You enter a bid with 5,000 as the total
quantity, but 1,000 as the Max Floor value. Your order
will display as 1,000 shares, but if yours is the only bid
when an offer arrives for 10,000 shares at your price,
your entire 5,000 shares will execute.
However, if 3 other bids for 3,000 shares each were
behind you at the same price, only your displayed 1,000
would execute, along with 9,000 shares from the other
three bids.
*Peg Diff
Added to the bid or offer to produce the actual order
price. Allows more flexibility in your order.
EXAMPLE To peg the offer minus .02, Peg Diff must
equal -0.02 (the negative sign is required).
* Features only available when Spec Cond is checked in the Trading window.
The information provided on this page is subject to change at any time. To get the
most current information please go to the INET web site.
ONTD ECN
General Information
•
Order goes directly to the ONTD order book to search for a match. If a better
price is available, it will target that price.
•
If your price is not available in the book, it will post on Level II as ONTD. The
best bid and ask posting 100 or more shares will post on Level II if it does
not cross or lock the market.
Copyright © Charles Schwab & Co., Inc. 2006. All rights reserved. (0106-5667)
103
StreetSmart Pro User Manual
•
Odd lots are NOT allowed.
•
Day order available if Auto Cancel time is set to 0.
•
Default cancellation time: 180 seconds.
•
Trading Hours 8:00 a.m. to 5:00 p.m. ET
ONTD Order Routing
Order Types
Description
Limit
Only limit orders are available through ONTD. The order
will not fill at a less favorable price than the limit you
set.
Times In Force
Description
Day
Can be entered after 8:00 AM ET and expire at the end
of the extended trading day (5:00 p.m. ET)
The information provided on this page is subject to change at any time.
NASDAQ SUPERMONTAGE
SuperMontageSM is NASDAQ's display and order execution system designed to help
reduce market fragmentation, provide best execution, expand the number of
choices to Market Participants, and better handle the growth of the market.
General Information
•
SuperMontage system will attempt to match your order with the best price
available at the time it is received.
•
Non-marketable SuperMontage order may be posted to the Level 2 as SIZE.
•
Odd lots are accepted, but will be grouped with other odd lots to create
round lots before being executed.
•
Hours: Marketable limit orders and market orders may be entered into
SuperMontage during the normal market hours of 9:30 a.m. to 4:00 p.m.,
ET; SuperMontage is not operational for after hours trading.
Order Routing
Order Types
Description
Limit
•
Matched against existing orders on the NASDAQ
Single Book. If no match found will post to the
book.
Market
•
Order is sent at the inside bid or ask.
Time In Force
104
Description
Copyright © Charles Schwab & Co., Inc. 2006. All rights reserved. (0106-5667)
Trading
Day
Orders may be sent starting at 9:30 A.M. and will
expire at 4:00 P.M. ET
Other SuperMontage Features
NASDAQ Single Book
NASDAQ® has integrated SuperMontage, INET, and BRUT branded market data
facilities into a Single Book. While the integration does not impact the existing
order routing venues and order types, the migration results in Level II data display
changes within StreetSmart Pro®.
The software consolidates SIZE, BRUT and INET quotes into one INET quote at each
tier.
Visit the NASDAQTrader.com for more information on the NASDAQ Systems
Integration.
AUTO CANCEL SETTINGS
Most Direct Access orders, while designated as day orders, are only active in the
market place for up to 3 minutes. While each route has its own rule regarding how
long an order remains active until it is canceled for going unfilled, the StreetSmart
Pro® software provides an automatic order cancel feature for your Direct Access
orders. This cancel feature may protect you in a fast market and will also provide
you with protection in the event of a network or system outage.
Auto cancel settings for Direct Access can be changed by going to the Trading
window menu and clicking Settings > General. See the Trading Window Menu
topic for more details about these important settings.
Copyright © Charles Schwab & Co., Inc. 2006. All rights reserved. (0106-5667)
105
StreetSmart Pro User Manual
AUTO CANCEL TIMEOUTS
Note that changes to these settings are isolated to the computer on which you
make them. If you access your software from another computer, you will need
to change your timeout settings there as well.
SuperMontage
This will automatically send a cancel after the number of
seconds you put into the text box for SuperMontage
orders only. The default setting is 0 seconds, which
means it will remain live until canceled or executed.
ECN
The number of seconds that direct ECN orders are live
before the system auto-cancels them. A value of 0
disables auto-cancel. The default is 180 seconds.
106
Copyright © Charles Schwab & Co., Inc. 2006. All rights reserved. (0106-5667)
Trading
Options
Options carry a high level of risk and are not suitable for all investors. Certain
requirements must be met to trade options through Schwab. Multiple leg options
strategies will involve multiple commissions. Please read the Options Disclosure
Document titled "Characteristics and Risks of Standardized Options" before
considering any option transaction. Call your local Schwab office or write Charles
Schwab & Co., Inc. 101 Montgomery Street, San Francisco, CA 94104 for a current
copy. Member SIPC.
OPTIONS TRADING TAB
View the calls and puts being traded for a stock and place trades on
individual contracts in the Options tab of the Trading Window.
Enter the underlying symbol, select the option you wish to trade, select the
variables for the order such as Quantity, Limit/Stop prices, and more. Then
click the button for the action you wish to take (Buy to Open, Sell to Close,
etc.) to send the order.
The Options Trading tab includes real-time, streaming options data and, for clients
approved for options trading, automatic electronic access to all primary listed
options exchanges. You may also trade index options such as $OEX. Use the Adv.
Options tab to if you wish to place multi-leg option trades.
Stock symbols and price and volume data shown here and in the software are for
illustrative purposes only. Charles Schwab & Co., its parent or affiliates, and/or its
employees and/or directors may have positions in securities referenced herein, and
may, as principal or agent, buy from or sell to clients.
The following table describes some of the features of the Options tab.
Symbol Field
•
Enter a stock symbol in the symbol field and press Enter.
The option chain will be loaded into the Option tab.
Copyright © Charles Schwab & Co., Inc. 2006. All rights reserved. (0106-5667)
107
StreetSmart Pro User Manual
•
If you know an option symbol, but don't know the symbol
for the underlying stock, you can you enter the option
symbol preceded by a period (".") or followed by ".o" into
the symbol field. The underlying stock symbol will load
into the symbol field (whether you are on the Stocks or
Options tab within the Trading window).
Calls/Puts
Click the check boxes to specify whether you want to view
calls, puts or both.
Expiration
Month
Click the down arrow next to the call/put display buttons to
select a month in which the options will expire.
Action
Buttons
Allow you to determine what type of trade you want to place.
TIPS:
•
The red and green boxes you may see around the bid and ask prices indicate
changing quotes, and the color indicates the direction of the change.
•
To see the details and cash requirements of option positions you have
entered, go to the Account Detail window and click on the Positions tab. See
the Positions Tab topic to find out which types of option strategies are
available at each approval level. Note that approval for one level includes
approval for all lower levels. For instance, if you have Level 3 approval, you
may also enter Long, Covered, and Protective positions.
•
For more information about equity options and advanced option trading
strategies, visit Schwab.com and click on My Benefits located in the At a
Glance tab.
OPTIONS TAB COLUMNS
The Options Tab allows you to view up to 19 types of information about each option
in a chain.
Configuring Options Tab Columns
1. Click Settings > Option Page Columns in the Trading window. The
following window opens:
108
Copyright © Charles Schwab & Co., Inc. 2006. All rights reserved. (0106-5667)
Trading
2. To add a column, click on a column name in the Available Columns list and
click Add to add it to the Selected Columns (which are the columns that will
display).
3. To remove a column, click on a name in the Selected Columns list and click
Remove.
4. To sort the Selected Columns list, click on a name and use the Move
Up/Move Down buttons to change its location in the list.
TIP: If you only want to rearrange the columns but not add new ones, you can
right-click on the column header and select a different column for that position or
you can use drag-and-drop.
Available Columns
Strike
Option strike price; price at which the option may be
exercised
Symbol
Option symbol
Last
Price at which the option last traded
Time of Last
Time at which this option last traded
Net
Net change from yesterday's close price
Bid
Current inside bid price
Ask
Current inside ask price
Size
The available number of contracts for the bid and ask,
displayed as [bid quantity] x [ask quantity].
Volume
Cumulative volume for the day
Open Interest
Total number of outstanding option contracts in a particular
series
Implied
Volatility
The estimated volatility of a stock underlying an option
based on the option price.
Delta
Indicates how much the price of a call option moves for
every one-point move in the price of the underlying
security.
Copyright © Charles Schwab & Co., Inc. 2006. All rights reserved. (0106-5667)
109
StreetSmart Pro User Manual
Gamma
Measures the change in delta for a change in the underlying
stock price.
Theta
The change in option price in relation to the time left before
the option expires.
Vega
The change in option price in relation to a 1% change in
volatility.
Rho
The change in the price of an option resulting from a 1%
change in interest rates.
Ask Implied
Volatility
Implied Volatility based on ask price.
Bid Implied
Volatility
Implied Volatility based on bid price.
PLACING AN OPTIONS ORDER
The following figure shows the Trading window open to the Options tab.
Stock symbols and price and volume data shown here and in the software are for
illustrative purposes only. Charles Schwab & Co., its parent or affiliates, and/or its
employees and/or directors may have positions in securities referenced herein, and
may, as principal or agent, buy from or sell to clients.
To Buy or Sell an Option:
1. Access Options trading by clicking the Options tab in the Trading window.
2. Check either Calls, Puts or both and select an expiration month.
3. Click on the option of choice in the Options Window.
4. Click one of the following options (NOTE: These buttons are only actionable
if you have been approved to trade options):
Sell to Close
110
Click to sell any long option positions that are currently
Copyright © Charles Schwab & Co., Inc. 2006. All rights reserved. (0106-5667)
Trading
in your account.
Buy to Open
Click to buy new long option positions for your account.
Sell to Open
Click to create new short option position in your
account.
Buy to Close
Click to buy back any short option positions that are
currently in your account.
5. The Options Execution window will open as in the following image:
6. Select the appropriate options (described below) and click OK to send the
order.
Options Execution Settings
Quantity
Click on the up and down arrows to change the number of
contracts.
Limit Price
The bid/ask price of the selected option is automatically
entered here, though it may be adjusted in .05 increments by
clicking on the arrow buttons next to the field.
Min Qty
You may specify a minimum quantity for the order to fill if
your order quantity is 2 or greater.
AON
All or None; All contracts must be filled or the order will be
canceled.
Order Type:
Limit: Limit order (will accept improvement over limit price)
Limit Orders
Stop: A market order that is only activated when there is a
print or quote that is at or through the stop price. On sell-stop
orders, the order is activated when the offer is at or below the
stop price. On buy-stop orders, the order is activated when
the bid is at or above the stop price. Once the order is
activated, you are guaranteed execution, but there is no
guarantee of the execution price.
Stop Limit: Similar to a stop order in that a stop price will
activate the order. However, once activated, the stop limit
order becomes a limit order and can only be executed at the
limit price specified by you or at a better price. Thus, you are
Copyright © Charles Schwab & Co., Inc. 2006. All rights reserved. (0106-5667)
111
StreetSmart Pro User Manual
not guaranteed an execution with a stop limit order.
DAY
Day Order; Will cancel at the end of the day
FOK
Fill or Kill; Requests an immediate fill for the entire number of
contracts similar to an All Or None. If the entire number of
contracts is not available, the order will be immediately
cancelled.
IOC
Immediate or Cancel; Requests an immediate fill for any
number of contracts that may be available with the possibility
of a partial fill. Any remaining contracts that are unfilled will
be cancelled.
GTC
Good ‘Til Cancel; Order will remain live until it fills, is
rejected, or is canceled.
OPTION TAB SETTINGS
Options tab settings can be accessed through the Settings menu of the Trading
window or by right-clicking on an option symbol. In both cases, you must have the
Options tab open to access these settings.
RIGHT-CLICK MENU SETTINGS
•
Option Data - Displays the option multiplier, exchanges on which the
contract is trading, and other advanced data.
Stock symbols and price and volume data shown here and in the software are
for illustrative purposes only. Charles Schwab & Co., its parent or affiliates,
and/or its employees and/or directors may have positions in securities
referenced herein, and may, as principal or agent, buy from or sell to clients.
•
112
Hypothetical Pricing - Allows you to manually adjust variables involved in
option pricing to see how changes affect the option values.
EXAMPLE 1 You are bullish on a stock, but decide to purchase calls instead
of the stock, so you can get more leverage. You anticipate the stock will go
up about 2 points in the next week. You use the hypothetical model to add
Copyright © Charles Schwab & Co., Inc. 2006. All rights reserved. (0106-5667)
Trading
2 points to the underlying price, and take away 7 days from the days to
expiration. This gives you an indication that the call option you are
considering might gain about 1.54, if the stock goes up 2 points over a the
next 7 days.
EXAMPLE 2 You can also see how the greeks change as the variables
change. For example, since a Delta will increase as an option gets farther in
the money, in the example above, you would see the Delta change from its
current level of about .68 up to .90. This tells you that while it only earned
.77 for every dollar so far, additional moves to the upside will yield about
.90 for every dollar if it continues to go up.
SETTINGS MENU OPTIONS
•
Option Page Columns - You can rearrange Options tab columns by either
right-clicking on the column and selecting a different column or by adding
columns. See the Options Tab Columns topic for directions.
•
Option Greeks Settings - Greeks indicate how fast an option price is
changing relative to parameters such as time, underlying stock price,
volatility, etc.
o
Pricing Method: Select from Black-Scholes, Barone-AdesiWhaley, or Cox-Ross-Rubinstein.
o
Interest Rate: Defaults to the 3-Month Treasury I-rate Index rate,
but you can select User Defined Rate and change the interest rate
to any you wish.
Copyright © Charles Schwab & Co., Inc. 2006. All rights reserved. (0106-5667)
113
StreetSmart Pro User Manual
•
Stack Options - When checked, Calls will be "stacked" above Puts in the
Options tab. Scroll down to view Puts. Otherwise, Puts will be listed to the
right of the Calls. Scroll to the right to view Puts.
OPTIONS LEVEL II TAB
Options Level II tab displays the prices and size that each exchange is posting, as
well as alerting you to exchanges where the contract may be available for
automatic execution. Options Level II provides you with a greater depth of
information regarding the option contract being viewed.
You will need to turn on the Level II Options tab by clicking Settings > General >
L2 Data and checking the Show L2 Option Data selection.
Stock symbols and price and volume data shown here and in the software are for
illustrative purposes only. Charles Schwab & Co., its parent or affiliates, and/or its
employees and/or directors may have positions in securities referenced herein, and
may, as principal or agent, buy from or sell to clients.
114
Copyright © Charles Schwab & Co., Inc. 2006. All rights reserved. (0106-5667)
Trading
A
Last Trade Price
Shows the last price at which the underlying
stock/index traded.
B
Stock Symbol
Shows the underlying stock symbol. To enter a new
stock, click in the field, type the new stock symbol,
and press Enter on your keyboard.
Click on the down arrow to show recently loaded
stocks. Select a stock from this list for rapid
reloading.
C
D
Change ($)
Shows the change in price from close for the option.
Change (%)
Shows the percent change in price from close for the
option.
E
Volume
Shows the option’s cumulative volume for the day.
F
Last
Shows the last price at which the option traded. Red
indicates a trade below the prior trade, and green
indicates a trade above the prior trade.
G
Open
Shows the price of the option upon market open.
H
Hi
Shows the highest price the option has reached
today.
I
Open Interest
Shows the number of contracts still open, meaning
they have not been exercised, closed out, or allowed
to expire as of the close from the previous day.
J
Arrow
Clicking on this button will open and close the
execution portion of the Options Level II tab.
K
Contract Size
There are several ways to change the share size.
L
$ (Dollar sign)
•
Press the Up/Down arrow keys to increase or
decrease by 1 contract.
•
Press the Shift + Up/Down keys on the
keyboard to increase or decrease in 10
contract increments.
•
Tab to or click in the contract size field and
type in a new contract size.
This button allows you to base the number of
contracts you place your order for on the amount of
money you want to spend on the trade.
EXAMPLE You have $10,000 to spend on a option
that is trading at $5 on the inside ask, so you click
on the $ button, type 10000, click OK and the
contract size field will fill in with 2000.
! NOTE:
Commissions are not included in this
calculation.
M
Close
Shows yesterday’s close price for the option.
N
Lo
Shows the lowest price the option reached today.
O
Spread
Spread shows the difference between the inside bid
Copyright © Charles Schwab & Co., Inc. 2006. All rights reserved. (0106-5667)
115
StreetSmart Pro User Manual
and ask prices.
P
Expiration Month
Shows the month and year that the selected option
will expire.
S
Strike Price
The available strike prices for the selected Expiration
Month are listed here. Click on the arrow to scroll
through the list and select the strike price you
desire. The Level II display will change to show the
details of the option at that strike price.
V
Action Buttons
Sell to Close: Click this button to sell long call or
put options.
Buy to Open: Click this button to establish call or
put options.
Sell to Open: Click this button to write covered calls
or puts.
Buy to Close: Click this button to close a covered
call or put position.
Cancel: Click this button to cancel any pending
orders for the option that is currently loaded.
W
Call/Put
Select whether to view the Call or Put for the current
option.
Y
Option Symbol
Shows the volume for the current option on each
exchange.
Volume
Z
Level II
Shows the depth of all bids and offers in an option.
Each line shows the exchange ID, the price at which
they are bidding or offering, and the number of
contracts they are making available at that price.
TIP: By going to Settings > Colors, you can
specify unique colors for the different types of quotes
displayed in Level II, such as Non-Firm Quotes and
Auto Executing Exchanges.
a
Time & Sales
Shows every trade being reported, as well as the
share size of the trade and the time of the trade.
Time & Sales is color-coded:
Green: Prints at the inside Ask
Red: Prints at the inside Bid
White/Gray: Prints in between the inside Bid/Ask
Yellow: Prints above the inside Ask
Purple: Prints below the inside Bid
Grey Highlight: Inside quote change
ADVANCED OPTIONS
Advanced Options Overview
116
Copyright © Charles Schwab & Co., Inc. 2006. All rights reserved. (0106-5667)
Trading
The Advanced Options tab simplifies the process of entering Complex Option
orders. By displaying potential pairings based on your spread ranges, expiration
months, or by amounts “in, at, out and near the money” all entered at one net
credit or debit price, Complex Option strategies can be entered more quickly and
with potentially less market risk than by “legging in.” In addition to saving time
creating the order, having direct access to an exchange (if available) may improve
the quality and speed of the execution by routing both legs of the order
immediately and electronically.
StreetSmart Pro® offers the following Complex Option strategies from the Adv.
Opt tab in the Trading window depending on your options approval level. Click on
the links for descriptions of each type of complex option order:
Strategy
Straight
Calls
Straight
Puts
Vertical
Call
Spreads
Vertical Put
Spreads
SubStrategy
For use
when view
of stock is:
Long
Financial Characteristics
Max Loss
Max Gain
Change
in
value
in
time**
Bullish
Net
Premium
Paid
Unlimited
Loss
Short
Bearish
Unlimited
Net
Premium
Received
Gain
Long
Bearish
Net
Premium
Paid
Strike Net
Premium
Paid
Loss
Short
Bullish
Strike Net
Premium
Received
Net
Premium
Received
Gain
Debit
Spreads
Bullish
Net
Premium
Paid
SHigh-SLowNet
Premium
Paid
Loss
Credit
Spreads
Bearish
SHigh-SLowNet
Premium
Received
Net
Premium
Received
Gain
Debit
Spreads
Bearish
Net
Premium
Paid
SHigh-SLowNet
Premium
Paid
Loss
Credit
Spreads
Bullish
SHigh-SLowNet
Premium
Net
Premium
Received
Gain
Copyright © Charles Schwab & Co., Inc. 2006. All rights reserved. (0106-5667)
117
StreetSmart Pro User Manual
Received
Straddles
Long
Bullish or
bearish, with
rising volatility
Net
Premium
Paid
Unlimited
Loss
Short
Neutral and
falling
volatility
Unlimited
Net
Premium
Received
Gain
Bearish/
Protective
Stock
Price SLow +/Net
Premium*
SHighStock
Price +/Net
Premium*
Variable
Debit
Spreads
Moderate
Bullish
Net
Premium
Paid
Unlimited+
Gain++
Credit
Spreads
Moderate
Bearish
Unlimited+
Net
Premium
Received
Loss++
Collars
Calendar
Spreads***
Rollout
The strategic and financial characteristics of Rollouts can vary
greatly depending on the specifics of the order.
Buy-Write
and
Unwind
Sell-Write
and
Unwind
Strangles
Combos
BuyWrite
Neutral to
Bullish
Purchase
Price of
Stock Premium
Received
Strike Purchase
Price +
Premium
Gain++
Unwind
N/A
N/A
N/A
N/A
SellWrite
Neutral to
Bearish
Unlimited
Short
Sale Price
+
Premium
- Strike
Gain++
Unwind
N/A
N/A
N/A
N/A
Long
Bullish/Bearish
and rising
volatility
Net
Premium
Paid
Unlimited
Loss
Short
Neutral and
falling
volatility
Unlimited
Net
Premium
Received
Gain
The strategic and financial characteristics of Combination orders
can vary greatly depending on the specifics of the order.
SHigh : High Strike Price in two option strategy
SLow : Low Strike Price in two option strategy
* Collar Max Gain/Loss assumes the collar is put on in conjunction with a long stock
position.
** This column describes the effect of time decay on the respective strategy
118
Copyright © Charles Schwab & Co., Inc. 2006. All rights reserved. (0106-5667)
Trading
holder's position.
*** The discussion of Calendar Spreads that follows is for the debit spread only.
+
Max. Gain for Debit Spread is unlimited only after the expiration of the short
option. Max. Loss for Credit Spread is unlimited when the long calls expire prior to
the short calls, in which case, the position would not qualify as a spread.
++
The gain or loss with time for calendar spreads applies only during the period
when both options in the spread have not yet expired or been assigned. Once the
near-term option has expired or been assigned, the situation will reverse (Gain will
change to Loss and vice-versa.) Although not common, calendar spreads may be
neutral.
Commissions, taxes, and transaction costs are not included in any of these strategy
discussions, but can affect final outcome and should be considered. Please contact
a tax advisor to discuss the tax implications of these strategies. Many of the
strategies described herein require the use of a margin account. Options carry a
high level of risk and are not suitable for all investors. Certain requirements must
be met to trade options through Schwab. Multiple leg options strategies will involve
multiple commissions. Please read the Options Disclosure Document titled
"Characteristics and Risks of Standardized Options" before considering any option
transaction. Call your local Schwab office or write Charles Schwab & Co., Inc. 101
Montgomery Street, San Francisco, CA 94104 for a current copy. Member SIPC
Straight Calls
Straight Calls refers to the purchasing or selling of call options to open a position.
This strategy is also commonly referred to as Long or Short Calls. Generally, these
two strategies are speculative in nature.
Long Call
A strategy consisting of the purchase of a Call option. This strategy is generally
used to speculate on the upward move of the underlying security or index.
For use when investor anticipates:
•
Upward market direction / security appreciation
Financial Characteristics:
•
Maximum Loss: Debit amount paid for the option*
•
Maximum Profit: Unlimited
•
Break Even: Strike price of the option plus the debit amount paid for the
option
Objective:
•
Speculative gain
* The maximum loss on a straight Call is limited as long as, and only as long as,
the investor does not exercise the long call. There is an additional risk associated
with the expiration weekend. If the long call is exercised, the investor ends up with
a long position in the stock. Bad news during the weekend could force even greater
losses on the investor before he can exit the long equity position.
Copyright © Charles Schwab & Co., Inc. 2006. All rights reserved. (0106-5667)
119
StreetSmart Pro User Manual
EXAMPLE (Long Straight Call)
Currently, XYZ trades at $25/share. The investor employs the strategy of buying
one in-the-money call (strike $20) for $6.00/share (1 contract= $600). Using this
strategy, the investor pays a cash debit of $6.00. This is the maximum loss the
investor can incur. If the stock decreases to $19.00/share the long call will expire
worthless and the investor loses the $6 premium. The maximum gain if the stock
price is higher than the strike is the difference between the closing price and the
call strike, less the call premium spent. If the stock is trading at $30, then 30-20-6
= $4 profit. The break even point for the strategy occurs when the price of XYZ is
at $26.
Short Call
The Short Straight Call may allow an investor to profit from downward movements
in the underlying security or index. It uses the exact opposite structure as the Long
Call. If the security or index falls in value, the investor can generally profit. The
maximum profit is the premium received by selling the option. If the security rises
in value, the maximum loss is unlimited.
For use when investor anticipates:
•
Declining market/security depreciation
Financial Characteristics:
•
Maximum Loss: Unlimited
•
Maximum Gain: Credit received by selling the call option
•
Break Even: Strike price of the option plus the credit received for the sold
option
Objective:
•
Speculative gain
EXAMPLE (Short Straight Call)
Currently, XYZ trades at $25/share. The investor believes the stock will fall and
wants to benefit from the downward movement. The investor shorts a Straight Call
option (strike $20) for $6.00/share (1 contract= $600). The maximum loss is
unlimited should the stock prices suddenly rise in price. The maximum loss would
be calculated by taking the closing price at expiration less the strike price, less the
credit received on the sale of the option. If the stock closes at $32 on expiration,
there will be a $6 loss ($32-$20-$6=$6 loss). The maximum profit an investor can
120
Copyright © Charles Schwab & Co., Inc. 2006. All rights reserved. (0106-5667)
Trading
receive is the credit received when selling the option. For example, if the same XYZ
20 strike option is sold for $6, and the stock closes under $20, the option expires
worthless, and the investor can pocket the entire $6. The break even point for the
strategy occurs when the price of XYZ is at $26.
Commissions, taxes, and transaction costs are not included in any of these strategy
discussions, but can affect final outcome and should be considered. Please contact
a tax advisor to discuss the tax implications of these strategies. Many of the
strategies described herein require the use of a margin account. With long options,
investors may lose 100% of funds invested. In-the-money long puts need to be
closed out prior to expiration, since exercising them could create short stock
positions.
Options carry a high level of risk and are not suitable for all investors. Certain
requirements must be met to trade options through Schwab. Multiple leg options
strategies will involve multiple commissions. Please read the Options Disclosure
Document titled "Characteristics and Risks of Standardized Options" before
considering any option transaction. Call your local Schwab office or write Charles
Schwab & Co., Inc. 101 Montgomery Street, San Francisco, CA 94104 for a current
copy. Member SIPC
Straight Puts
Straight Puts refers to the purchasing or selling of put options to open a position.
This strategy is also commonly referred to as Long or Short Puts. Generally, these
two strategies are speculative in nature.
Long Put
A strategy consisting of the purchase of a Put option. This strategy is designed for a
prediction that the underlying stock or index may decline.
For use when investor anticipates:
•
Downward market direction / security depreciation
Financial Characteristics:
•
Maximum Loss: Debit amount paid for the option*
•
Maximum Profit: Strike price less debit paid for option**
•
Break Even: Strike price of option less the debit amount paid for the option
Objective:
Copyright © Charles Schwab & Co., Inc. 2006. All rights reserved. (0106-5667)
121
StreetSmart Pro User Manual
•
Speculative gain
*The maximum loss on a long put is limited as long as the investor does not
exercise it which will result in a short stock position for their account. There is an
additional risk associated with the expiration weekend. If the long put is exercised
the investor ends up with a short position in the stock. Good news during the
weekend could force even greater losses on the investor before he can exit the
short equity position.
**The maximum profit or gain is realized if the stock prices goes to zero.
EXAMPLE (Long Put)
Currently, XYZ trades at $25/share. The investor employs the strategy of buying
one in-the-money put (strike $30) for $6.00/share (1 contract= $600). Using this
strategy, the investor pays a cash debit of $6.00. This is the maximum loss the
investor can incur. If the stock increases to $31.00/share, the long put will expire
worthless, and the investor loses the $6 premium. The maximum gain, if the stock
price is lower than the strike, is the difference between the put strike and the
closing price, less the premium debit spent in buying the put. If the stock is trading
at $19, then 30-19-6 = $5 profit. The break even point for the strategy occurs
when the price of XYZ is at $24.
Short Put
The Short Put generally will allow an investor to profit from upward movements in
the underlying security or index. It uses the exact opposite structure as the Long
Put. If the security rises in value, the investor can generally profit. The maximum
the investor can profit is the premium received by selling the option. If the security
declines in value, the maximum the investor can lose is the strike price less the
credit received for selling the put.
For use when investor anticipates:
•
Increasing market/security appreciation
Financial Characteristics:
•
Maximum Loss: Strike Price less credit received from sale of option
•
Maximum Gain: Credit received by selling the put option
•
Break Even: Strike Price of the option less the credit received for the sold
option
122
Copyright © Charles Schwab & Co., Inc. 2006. All rights reserved. (0106-5667)
Trading
Objective:
•
Speculative gain
EXAMPLE (Short Straight Put)
Currently, XYZ trades at $25/share. The investor believes the stock will rise and
wants to benefit from the upward movement. The investor shorts a Straight Put
option (strike $30) for $6.00/share (1 contract= $100). The maximum loss is the
difference between the strike of the option and the premium received through the
sale of the put ($30-$6=$24). If the stock closes at $19 on expiration, there would
be a $5 loss ($30-$19-$6=$5 loss). The maximum profit an investor can receive is
the credit received when selling the option. For example, if the same XYZ 30 strike
put option sold for $6, and the stock closed over $30, the option would expire
worthless, and the investor could pocket the entire $6. The break even point for the
strategy occurs when the price of XYZ is at $24.
Commissions, taxes, and transaction costs are not included in any of these strategy
discussions, but can affect final outcome and should be considered. Please contact
a tax advisor to discuss the tax implications of these strategies. Many of the
strategies described herein require the use of a margin account. With long options,
investors may lose 100% of funds invested. In-the-money long puts need to be
closed out prior to expiration, since exercising them could create short stock
positions.
Options carry a high level of risk and are not suitable for all investors. Certain
requirements must be met to trade options through Schwab. Multiple leg options
strategies will involve multiple commissions. Please read the Options Disclosure
Document titled "Characteristics and Risks of Standardized Options" before
considering any option transaction. Call your local Schwab office or write Charles
Schwab & Co., Inc. 101 Montgomery Street, San Francisco, CA 94104 for a current
copy. Member SIPC
Buy-Writes & Unwinds
Of the kinds of multi-legged orders that can be placed ‘as a package’ using this
feature, buy-writes and unwinds are unique in that one leg of the trade is for an
option, the other is for an equity. Because one leg trades on an option exchange
and the equity leg on a separate, equity exchange, the circumstances in which the
‘Net’ price indication will be better than the prices for the separate legs combined
will be uncommon. (Please note the indicative prices are not firm quotes and may
not be available when an order is sent for execution.)
Copyright © Charles Schwab & Co., Inc. 2006. All rights reserved. (0106-5667)
123
StreetSmart Pro User Manual
Buy-Write
In a Buy/Write, the individual purchases a stock and simultaneously writes calls
against it. If the call expires out of the money, the investor will have collected the
premium of the option – he is effectively generating income against his long
position. Additionally, the investor will participate in any rise in the security up to
the strike price of the option. If the option expires in-the-money, it will be
exercised and the investor will have to sell his shares at the given strike price. On
the downside, the underlying security has to fall further than the collected premium
before money is lost, so the written call also gives a limited amount of downside
protection.
This strategy is different from covered call writing only in that the investor does not
own the security prior to selling the option contracts.
For use when investor anticipates:
•
Flat to Slowly rising market
Financial Characteristics:
•
Maximum Loss: Stock price – premium for written call. In addition, investor
has opportunity cost of stock appreciation beyond the strike price of the call
•
Maximum Gain: Call premium plus stock appreciation up to the strike price of
the call
•
Cash credit from call premium
Objectives:
•
Modest risk mitigation and income generation
EXAMPLE (Buy-Write)
Currently, XYZ trades at $25/share. An investor would like to participate in some of
the upward movement in the stock and to generate additional income at the same
time. Using the Buy-Write strategy, the investor buys the stock (100 shares) and
sells one out-of-the-money call ($30 strike price) for $3.00 per share, for a total
cash credit of $300.00. If the stock appreciates past $30.00/share, the total gain is
capped at $800.00. The stock must fall below $22 (the breakeven price) before the
investor loses money, so the short call provides limited downside protection.
124
Copyright © Charles Schwab & Co., Inc. 2006. All rights reserved. (0106-5667)
Trading
Unwinds
Unwind is the term used to refer to the order that closes out the positions opened
in a buy-write strategy. The unwind for the example in buy-writes above would be
to sell XYZ and to ‘buy to close’ the $30 short call. Unwinds should be viewed more
as a closing transaction than as a true option trading strategy.
Commissions, taxes, and transaction costs are not included in any of these strategy
discussions, but can affect final outcome and should be considered. Please contact
a tax advisor to discuss the tax implications of these strategies. Many of the
strategies described herein require the use of a margin account. With long options,
investors may lose 100% of funds invested. In-the-money long puts need to be
closed out prior to expiration, since exercising them could create short stock
positions.
Options carry a high level of risk and are not suitable for all investors. Certain
requirements must be met to trade options through Schwab. Multiple leg options
strategies will involve multiple commissions. Please read the Options Disclosure
Document titled "Characteristics and Risks of Standardized Options" before
considering any option transaction. Call your local Schwab office or write Charles
Schwab & Co., Inc. 101 Montgomery Street, San Francisco, CA 94104 for a current
copy. Member SIPC
Sell-Writes & Unwinds
Of the kinds of multi-legged orders that can be placed ‘as a package’ using this
feature, sell-writes and unwinds are unique in that one leg of the trade is for an
option, the other is for an equity. Because the option leg trades on an option
exchange and the equity leg on a separate, equity exchange, the circumstances in
which the ‘Net’ price indication will be better than the prices for the separate legs
combined will be uncommon. (Please note the indicative prices are not firm quotes
and may not be available when an order is sent for execution.)
Sell-Write
In a Sell/Write, an investor sells a stock short, and simultaneously writes puts
against it. If the puts expire out of the money, the investor will have collected the
premium of the option – he is effectively generating income against his short
position. Additionally, the investor will participate in any drop in the security down
to the strike price of the option. If the option expires in-the-money, it will be
exercised and the investor will have to buy back his shares at the option strike
price. On the upside, the underlying security has to rise further than the collected
premium before money is lost, so the written put also provides a limited amount of
upside protection.
This strategy is different from covered put writing only in that the investor does not
have a short position in the security prior to selling the option contracts; rather
they are done at the same time.
For use when investor anticipates:
•
Flat to Slowly dropping market
Financial Characteristics:
Copyright © Charles Schwab & Co., Inc. 2006. All rights reserved. (0106-5667)
125
StreetSmart Pro User Manual
•
Maximum Loss: Stock price – premium for written put. In addition, investor
has opportunity cost of stock dropping below the strike price of the put
•
Maximum Gain: Put premium plus stock decline down to the strike price of
the put
•
Cash credit from put premium
Objectives:
•
Modest risk mitigation and income generation
EXAMPLE (Sell-Write)
Currently, XYZ trades at $25/share. An investor would like to participate in some of
the downside movement in the stock and generate additional income at the same
time. Using the Sell-Write strategy, the investor sells the stock (100 shares) and
sells one out-of-the-money put ($20 strike price) for $3.00 per contract, for a total
cash credit of $300.00. If the stock declines below $20.00/share, the total gain is
capped at $800.00. The stock must rise above $28 (the breakeven price) before
the investor loses money, so the short put provides limited upside protection.
Unwinds
Unwind is the term used to refer to the order that closes out the positions opened
in a buy-write or sell-write strategy. The unwind for the example in sell-writes
above would be to buy XYZ and to ‘buy to close’ the $20 short put. Unwinds should
be viewed more as a closing transaction than as a true option trading strategy.
Commissions, taxes, and transaction costs are not included in any of these strategy
discussions, but can affect final outcome and should be considered. Please contact
a tax advisor to discuss the tax implications of these strategies. Many of the
strategies described herein require the use of a margin account. With long options,
investors may lose 100% of funds invested. In-the-money long puts need to be
closed out prior to expiration, since exercising them could create short stock
positions.
Options carry a high level of risk and are not suitable for all investors. Certain
requirements must be met to trade options through Schwab. Multiple leg options
126
Copyright © Charles Schwab & Co., Inc. 2006. All rights reserved. (0106-5667)
Trading
strategies will involve multiple commissions. Please read the Options Disclosure
Document titled "Characteristics and Risks of Standardized Options" before
considering any option transaction. Call your local Schwab office or write Charles
Schwab & Co., Inc. 101 Montgomery Street, San Francisco, CA 94104 for a current
copy. Member SIPC
Rollouts
A Rollout, also known as a Roll Forward, is comprised of an order to close out of an
option position with a near-term expiration date and an order to open a new
position in the same type (Call or Put) of option with the same underlying and with
the same or *different strike price and a longer-term expiration date.
(*Also known as a Rollup or Rolldown when the strike price is different.)
Commissions, taxes, and transaction costs are not included in any of these strategy
discussions, but can affect final outcome and should be considered. Please contact
a tax advisor to discuss the tax implications of these strategies. Many of the
strategies described herein require the use of a margin account. With long options,
investors may lose 100% of funds invested. In-the-money long puts need to be
closed out prior to expiration, since exercising them could create short stock
positions.
Options carry a high level of risk and are not suitable for all investors. Certain
requirements must be met to trade options through Schwab. Multiple leg options
strategies will involve multiple commissions. Please read the Options Disclosure
Document titled "Characteristics and Risks of Standardized Options" before
considering any option transaction. Call your local Schwab office or write Charles
Schwab & Co., Inc. 101 Montgomery Street, San Francisco, CA 94104 for a current
copy. Member SIPC
Collars
A collar allows an investor to help hedge a long (short) underlying security position
by buying (selling) a put with a strike price beneath the current stock price and
selling (buying) a call with a strike above it. Both options have the same expiration
date. The user accepts a cap on his upside (downside) gains for a floor on his
downside (upside) losses.
For use when investor anticipates:
•
Volatile market conditions
•
Any missed opportunities are perceived to be worth the risk mitigation
Financial Characteristics:
•
Maximum Loss vs. Long Stock: Current Stock Price - Strike Price of Put +/Net Premiums
•
Maximum Loss vs. Short Stock: Strike Price of Call +/- Net Cost of Collar Current Stock Price
•
Maximum Gain vs. Long Stock: Strike Price of Call - Current Stock Price +/Net Premiums
•
Maximum Gain vs Short Stock: Current Stock Price - Strike Price of Put +/Net Premiums
Objectives:
Copyright © Charles Schwab & Co., Inc. 2006. All rights reserved. (0106-5667)
127
StreetSmart Pro User Manual
•
Hedge an existing position for the short term that customer is willing to sell
(buy in) at a set price.
•
Risk mitigation in exchange for limited profit potential
•
Lower cost protection than purchase of protective put alone
EXAMPLE (Collar on long equity position)
An investor is long 100 shares of XYZ at $64.00, and wants to protect his downside
risk using a protective collar. The important things are the percentage loss the
customer is willing to assume, and the point that the investor is willing to lose the
stock through assignment of the short call position. Lets assume that the investor is
only willing to lose 5 to 10 percent on the downside, and will only sell his stock on a
10 to 20 percent move upwards. Let’s assume that the XYZ 60 Puts are trading at
.95, and the XYZ 75 Calls are trading at .95. The net effect of establishing a collar
(long stock +long put + short call) using these two strikes is a net debit/credit of
$0. The investor is protected after a 6.25% loss, and may participate in an upside
move of up to 17.2%. The investor assumes some risk of loss in exchange for
retaining some of the upside potential of his XYZ position. With a net debit/credit of
$0, the breakeven price for this strategy remains $64.
Commissions, taxes, and transaction costs are not included in any of these strategy
discussions, but can affect final outcome and should be considered. Please contact
a tax advisor to discuss the tax implications of these strategies. Many of the
strategies described herein require the use of a margin account. With long options,
investors may lose 100% of funds invested. In-the-money long puts need to be
closed out prior to expiration, since exercising them could create short stock
positions.
Options carry a high level of risk and are not suitable for all investors. Certain
requirements must be met to trade options through Schwab. Multiple leg options
strategies will involve multiple commissions. Please read the Options Disclosure
Document titled "Characteristics and Risks of Standardized Options" before
considering any option transaction. Call your local Schwab office or write Charles
Schwab & Co., Inc. 101 Montgomery Street, San Francisco, CA 94104 for a current
copy. Member SIPC
128
Copyright © Charles Schwab & Co., Inc. 2006. All rights reserved. (0106-5667)
Trading
Straddles
A strategy consisting of the purchase or sale of both a call and put option with the
same expiration date and strike price. A long straddle offers an opportunity to
make money when a stock or index moves substantially. A short straddle offers an
opportunity to make money when a stock or index stays within a narrow range.
Long straddles
Long straddles may allow an investor to profit from dramatic price movements in a
specific security or index. An investor might employ a long straddle when he
expects a surprising movement by the security, but is unsure of the direction. Long
straddles involve simultaneously buying calls and puts with identical strike prices
and expiration dates, typically ‘at-the-money’.
The investor may benefit from either a large increase or a large decrease in the
price of the stock. However, the stock must move up or down further than the total
premium paid for the investor to profit at expiration.
Prior to expiration, if the underlying security moves substantially up or down, the
investor may choose to realize a profit by selling the in-the-money option before its
expiration date. In this case, while the in-the-money option will have been losing
time value since it was purchased, the losses in time premium are offset by the
gains in intrinsic value. The investor may continue to hold the out-of -the-money
option for the possibility to participate in any further, opposite movement by the
underlying security. However, there is no guarantee the out of the money option
would retain a high premium even with an increase in volatility.
Rather than selling following a dramatic price move, the investor can continue to
hold both options until expiration - anticipating even more dramatic price
movements in the future. However, unless such movements do occur, time decay
will eventually take its toll on both options' premiums.
For use when investor anticipates:
•
Dramatic movements in security price (e.g. due to an earnings
announcement), but unclear whether movement will be up or down
•
Increased volatility
Financial Characteristics:
•
Maximum Loss: Total premiums paid
•
Maximum Gain: Unlimited
•
Loses value with time
Objective:
•
Speculative gain
EXAMPLE (Long Straddle)
XYZ trades at $25.00/share. An investor anticipates that the stock will dramatically
rise or fall in the near future. The investor purchases one at-the-money put for
$2.00 and one at-the-money call for $2.00 to participate in large movements in
either direction. Since each contract represents 100 shares, the total cost to the
investor for buying both contracts is $400.00. To break even, the stock must either
fall $4.00/share to $21.00 or rise $4.00/share to $29.00 at or before expiration.
Copyright © Charles Schwab & Co., Inc. 2006. All rights reserved. (0106-5667)
129
StreetSmart Pro User Manual
The investor will profit if the stock goes up more than $4.00/share or falls more
than $4.00/share.
Short Straddle
Investors using the short straddle strategy anticipate that the underlying
market/security of the options will trade in a narrow range and that large
movements in either direction are unlikely. A short straddle will typically therefore
involve the sale of at-the-money puts and calls with the same expiration date and
strike price. The investor receives the premiums for the calls and puts and hopes
that, at expiration, neither the call nor the put will be more in-the-money than the
total premium received. The strategy exposes the investor to unlimited losses with
the possibility of only limited profits. The investor might also sell a straddle at a
strike that he/she expects the underlying security to move to by expiration.
For use when investor anticipates:
•
Flat/Neutral market for the security
•
Decreased volatility
Financial Characteristics:
•
Maximum Loss: Unlimited
•
Maximum Gain: Premiums received in the transaction
•
Benefits from time decay
Objective:
•
Speculative income generation
EXAMPLE (Short Straddle)
XYZ trades at $25.00/share. An investor believes that the stock will remain flat in
the near term. He puts on a short straddle, selling one 25 call for $2.00 and selling
one 25 put for $2.00. Since each contract represents 100 shares, the investor
receives a cash credit of $400.00. To break even or make a profit, the stock must
trade between $21.00/share and $29.00/share. If the stock increases or decreases
past these prices the investors suffers a loss. The maximum profit the investor can
earn ($4) is if the stock closes at exactly 25 at expiration. At that price, the
investor would retain the entire premium.
130
Copyright © Charles Schwab & Co., Inc. 2006. All rights reserved. (0106-5667)
Trading
Commissions, taxes, and transaction costs are not included in any of these strategy
discussions, but can affect final outcome and should be considered. Please contact
a tax advisor to discuss the tax implications of these strategies. Many of the
strategies described herein require the use of a margin account. With long options,
investors may lose 100% of funds invested. In-the-money long puts need to be
closed out prior to expiration, since exercising them could create short stock
positions.
Options carry a high level of risk and are not suitable for all investors. Certain
requirements must be met to trade options through Schwab. Multiple leg options
strategies will involve multiple commissions. Please read the Options Disclosure
Document titled "Characteristics and Risks of Standardized Options" before
considering any option transaction. Call your local Schwab office or write Charles
Schwab & Co., Inc. 101 Montgomery Street, San Francisco, CA 94104 for a current
copy. Member SIPC
Vertical Call Spreads
A strategy consisting of the purchase of a call option with one expiration date and
strike price and the simultaneous sale of another call with the same expiration
date, but a different strike price. Depending on whether the purchased call has a
higher or lower strike than the sold call, a vertical call spread can generally be
profitable if the underlying stock or index rises (a bull vertical call spread) or falls
(a bear vertical call spread) sufficiently.
Bull Vertical Call Spread
A Bull Spread strategy may allow an investor to profit from upward movements in
the underlying security. The technique requires the investor to purchase at-themoney or in-the-money calls at a particular strike price and sell out-of-the-money
calls at a higher strike price with the same expiration date. The cost of purchasing
the call option will be partly offset by the premium received for the sale of the outof-the-money call. This strategy is often termed a debit spread because of the net
capital outlay that is required. A Bull Spread delivers maximum profit when the
stock trades at or above the higher strike price at expiration.
For use when investor anticipates:
•
Rising market/Security appreciation
Financial Characteristics:
•
Maximum Loss: Net premium outlay*
Copyright © Charles Schwab & Co., Inc. 2006. All rights reserved. (0106-5667)
131
StreetSmart Pro User Manual
•
Maximum Gain: The difference of the strike prices less the cost of
establishing the spread
Objective*:
•
Speculative gain
*The maximum loss on a spread position remains limited to premium outlay as long
as, and only as long as, the integrity of the spread is maintained. If the investor
trades out of or exercises the low-strike call, the maximum loss is no longer limited
to the premium outlay.
EXAMPLE (Bull Vertical Call Spread)
Currently, XYZ trades at $25/share. The investor believes the stock will appreciate
and wants to participate in the upward movement, but does not want to simply buy
calls because of the expense/risk involved. Instead, the investor employs the
spread strategy buying an in-the-money call (strike $20) for $6.00/share and
selling an out-of-the-money call (strike $30) for $1.00/share. Using this strategy,
the maximum loss is the difference between the premiums paid and the premiums
received ($5 or $500). The maximum profit an investor can receive is the difference
of the strike prices less the cost of the position. The breakeven price of 25 is
calculated by adding the net debit of the spread to the strike price of the long
option.
As can be seen from the following chart and table, the investor who buys the
spread rather than simply investing in the call reduces his maximum loss by 1/6th,
breaks even at $25 instead of $26, and only loses out to the call buyer if the stock
price rises above 31 (at which point he would have a 100% return on his
investment).
Spread vs. Long Call
132
Copyright © Charles Schwab & Co., Inc. 2006. All rights reserved. (0106-5667)
Trading
Bear Vertical Call Spread
In a Bear Call Spread, an investor performs the exact opposite transactions as
those used in the Bull Call Spread. Because the investor maintains a negative
outlook on the underlying security, he sells in-the-money calls and buys out-of-themoney calls at a higher strike price but sharing the same expiration. This strategy
is often termed a credit spread because of the net inflow of capital received when
the investor establishes the position. As a result, if the value of the security falls
below the strike price of the written call at expiration, the investor will retain the
initial amount received to establish the spread. However, if the security increases in
value, the investor may suffer a loss. The spread strategy caps the maximum value
of this loss at the difference between the two option strike prices involved in the
transaction, less the net premium received when putting on the spread*.
Copyright © Charles Schwab & Co., Inc. 2006. All rights reserved. (0106-5667)
133
StreetSmart Pro User Manual
For use when investor anticipates:
•
Declining market/security depreciation
Financial Characteristics**:
•
Maximum Loss: The difference between the strike prices less amount
received when establishing the spread*
•
Maximum Gain: The net premium received
•
Cash credit
Objective*:
•
Speculative income generation
*The maximum loss on a bear call spread is limited as long as, and only as long as,
the integrity of the spread is maintained. If the investor trades out of or exercises
the high-strike call, the maximum loss is no longer limited. There is an additional
risk associated with the expiration weekend. If the short call is assigned, while the
long is not (exercised, for example, the stock finishes between the two strikes) the
investor ends up with a short position in the stock. Good news during the weekend
could force even greater losses on the investor before he can exit the short equity
position.
** A margin account is required
EXAMPLE (Bear Vertical Call Spread)
Currently, XYZ trades at $25/share. The investor believes the stock will fall and
wants to earn income but does not want to simply sell calls because of the risk
involved. Instead, the investor employs the Bear Spread strategy selling an in-themoney (strike $20) call for $6.00/share and buying an out-of-the-money (strike
$30) call for $1.00/share. Using this strategy, the maximum loss is the difference
between the option strikes, less the call premium received (30-20-5 = $5 or
$500)* (see * above). The maximum profit an investor can receive is the premium
received from selling the call less the premium paid for the out-of-the-money call
(6-1 = $5 or $500). The breakeven price of 25 is calculated by adding the net
credit of the spread, to the strike price of the short option.
Commissions, taxes, and transaction costs are not included in any of these strategy
discussions, but can affect final outcome and should be considered. Please contact
a tax advisor to discuss the tax implications of these strategies. Many of the
strategies described herein require the use of a margin account. With long options,
investors may lose 100% of funds invested. In-the-money long puts need to be
134
Copyright © Charles Schwab & Co., Inc. 2006. All rights reserved. (0106-5667)
Trading
closed out prior to expiration, since exercising them could create short stock
positions.
Options carry a high level of risk and are not suitable for all investors. Certain
requirements must be met to trade options through Schwab. Multiple leg options
strategies will involve multiple commissions. Please read the Options Disclosure
Document titled "Characteristics and Risks of Standardized Options" before
considering any option transaction. Call your local Schwab office or write Charles
Schwab & Co., Inc. 101 Montgomery Street, San Francisco, CA 94104 for a current
copy. Member SIPC
Vertical Put Spreads
A strategy consisting of the purchase of a put option with one expiration date and
strike price and the simultaneous sale of another put with the same expiration date,
but a different strike price. Depending on whether the purchased put has a higher
or lower strike than the sold put, a vertical put spread can generally be profitable if
the underlying stock or index rises (a bull vertical put spread) or falls (a bear
vertical put spread) sufficiently.
Bull Vertical Put Spread
Similar to the Bull Call Spread, the Bull Put Spread strategy may allow the investor
to profit from an upward movement in the underlying security. To utilize this
technique, the investor sells puts at one strike and buys puts at a lower strike that
share the same expiration date. The high-strike puts have higher premiums than
the low-strike puts. As a result, the investor will receive a net inflow of capital since
the price of the options sold exceeds the price of the options purchased.
Consequently, bull put spreads are often referred to as ‘credit’ spreads. To achieve
maximum profit, the underlying security price must rise above the strike price of
the short (written) put at expiration, rendering both puts worthless.
For use when investor anticipates:
•
Upward market direction / security appreciation
Financial Characteristics:
•
Maximum Loss: The difference between the strike prices less the amount
received to establish the spread*
•
Maximum Profit: Net premium received
Objective*:
•
Speculative gain
*The maximum loss on a bull put spread is limited as long as, and only as long as,
the integrity of the spread is maintained. If the investor trades out of or exercises
the low-strike put, the maximum loss is no longer limited to the premium outlay.
There is an additional risk associated with the expiration weekend. If the short put
is assigned, while the long is not auto-exercised (because, for example, the stock
closes between the two strikes) the investor ends up with a long position in the
stock. Bad news during the weekend could force even greater losses on the
investor before he can exit the long equity position.
EXAMPLE (Bull Vertical Put Spread)
Currently, XYZ trades at $25/share. The investor employs the spread strategy
selling one in-the-money put (Strike $30) for $6.00/share and buying one out-of-
Copyright © Charles Schwab & Co., Inc. 2006. All rights reserved. (0106-5667)
135
StreetSmart Pro User Manual
the-money put (Strike $20.00) for $1.00/share. Using this strategy, the investor
receives a cash credit of the difference between the premiums received and the
premiums paid (6-1=$5 or $500) and this is the maximum profit the investor can
earn. If the stock rises to $30.00/share, the long and short put positions expire
worthless and the investor keeps the net premium received. The maximum loss is
the difference between the option strikes, less the call premium received (30-20-5
= $5 or $500) (see * above). The breakeven price of 25 is calculated by
subtracting the net credit of the spread from the strike price of the short option.
Bear Vertical Put Spreads
The Bear Put Spread may allow an investor to profit from downward movements in
the underlying security. It uses exactly the opposite structure of the Bull Vertical
Put Spread and requires the investor to buy a high-strike put and sell a low-strike
put (with a lower premium). The sale of the less expensive, out-of-the-money put
will partly offset the cost of purchasing the in-the-money put. The maximum the
investor can profit is the difference between the strike prices used to create the
spread less the cost of establishing the spread. If the security rises in value, the
maximum the investor can lose is the difference between the premium paid for the
long put and the premium received from the short put.
For use when investor anticipates:
•
Declining market/security depreciation
Financial Characteristics:
•
Maximum Loss: Net premium outlay (Premium Received – Premium Paid)*
•
Maximum Gain: The difference between the strike prices less the cost of
establishing the spread
Objective*:
•
Speculative gain
*The maximum loss on a spread position remains limited as long as, and only as
long as, the integrity of the spread is maintained. [If the investor trades out of or
exercises the long put, the maximum loss is no longer limited].
EXAMPLE (Bear Vertical Put Spread)
Currently, XYZ trades at $25/share. The investor believes the stock will fall and
wants to participate in the downward movement but does not want to simply buy
136
Copyright © Charles Schwab & Co., Inc. 2006. All rights reserved. (0106-5667)
Trading
puts because of the expense/risk involved. Instead, the investor employs a spread
strategy buying an in-the-money put (strike $30) for $6.00/contract and selling an
out-of-the-money put (strike $20) for $1.00/contract. Using this strategy, the
maximum loss is the difference between the premiums paid and the premium
received* (6-1=$5 or $500). The maximum profit an investor can receive is the
difference between the strike prices of the options used to create the position less
the cost to establish the spread (30-20-5=$5 or $500). In this example, the
strategy breaks even at $25.00/share. The breakeven price of 25 is calculated by
subtracting the net debit of the spread from the strike price of the long option.
Commissions, taxes, and transaction costs are not included in any of these strategy
discussions, but can affect final outcome and should be considered. Please contact
a tax advisor to discuss the tax implications of these strategies. Many of the
strategies described herein require the use of a margin account. With long options,
investors may lose 100% of funds invested. In-the-money long puts need to be
closed out prior to expiration, since exercising them could create short stock
positions.
Options carry a high level of risk and are not suitable for all investors. Certain
requirements must be met to trade options through Schwab. Multiple leg options
strategies will involve multiple commissions. Please read the Options Disclosure
Document titled "Characteristics and Risks of Standardized Options" before
considering any option transaction. Call your local Schwab office or write Charles
Schwab & Co., Inc. 101 Montgomery Street, San Francisco, CA 94104 for a current
copy. Member SIPC
Calendar Spreads
The most common form of calendar spread involves the purchase of a longer-term
option and the sale of an equal number of shorter-term options of the same type
and strike. Most spreads, (with the exception of spreads on underlying securities
with very high carrying costs) will initially be placed for a debit because of the
greater time value of the longer-term options. This strategy can potentially be used
to generate income and/or to reduce/increase the cost basis of an eventual stock
purchase/sale. Using calls, this strategy has similarities with covered call writing /
buy-writes.
For use when investor anticipates:
•
Slowly rising or flat market
•
Price of the underlying security to be slightly below the strike at short
option's expiration
Copyright © Charles Schwab & Co., Inc. 2006. All rights reserved. (0106-5667)
137
StreetSmart Pro User Manual
Financial Characteristics:
•
Maximum Loss: Net Premium Paid. In addition, client may have to exit the
long early (via sale or exercise) to cover an assignment on the short, losing
the opportunity for further gains
•
Maximum Gain: Unlimited, once the short option expires. If the short call is
assigned on or before expiration, the client will have a short position whose
losses, should the stock price rise, will outweigh any gains made on the long
option
•
Ideally, the cost basis of the long call is eventually reduced to zero, and the
investor begins to get paid to hold his long position
Objectives:
•
Generate income from the short positions
•
Benefit from the greater rate of time decay of short-term options vs. longerterm options
•
Potentially realize any gains from a movement in the underlying security
after the near-term option expires
EXAMPLE (Calendar Spread)
An investor feels that stock XYZ, which is trading at 60, will trade at this price for at
least the next 3 weeks, and then might rally. The investor could sell the June 65
Calls (trading at 2.10), and buy the July 65 Calls (trading at 4.10). The net debit to
the account would be 2, or $200. If XYZ is below 65 at June expiration, the short
expires worthless, leaving the investor with a simple long position in the July 65
Calls that he can maintain, simply sell, or spread off with other July options. The
short-term breakeven price cannot be calculated exactly. The long-term breakeven
price (after the June expiration) is calculated by adding the net debit of the spread
to the strike price of the long option.
Commissions, taxes, and transaction costs are not included in any of these strategy
discussions, but can affect final outcome and should be considered. Please contact
a tax advisor to discuss the tax implications of these strategies. Many of the
strategies described herein require the use of a margin account. With long options,
investors may lose 100% of funds invested. In-the-money long puts need to be
closed out prior to expiration, since exercising them could create short stock
positions.
Options carry a high level of risk and are not suitable for all investors. Certain
requirements must be met to trade options through Schwab. Multiple leg options
strategies will involve multiple commissions. Please read the Options Disclosure
Document titled "Characteristics and Risks of Standardized Options" before
considering any option transaction. Call your local Schwab office or write Charles
Schwab & Co., Inc. 101 Montgomery Street, San Francisco, CA 94104 for a current
copy. Member SIPC
Combos
The Combo tab allows you to manually input two legged spreads and other two
legged options strategies not specifically supported in any of the other Advanced
Options tabs.
Note that because Schwab currently only accepts two legged orders, if you
complete a stock leg (Leg 1), you will not be able to complete Leg 3, and vice
138
Copyright © Charles Schwab & Co., Inc. 2006. All rights reserved. (0106-5667)
Trading
versa. Also, the StreetSmart Pro® Combination order is not the same as the
Combo strategy on Schwab.com.
Commissions, taxes, and transaction costs are not included in any of these strategy
discussions, but can affect final outcome and should be considered. Please contact
a tax advisor to discuss the tax implications of these strategies. All strategies
described herein require the use of a margin account. Options carry a high level of
risk and are not suitable for all investors. Certain requirements must be met to
trade options through Schwab. Multiple leg options strategies will involve multiple
commissions. Please read the Options Disclosure Document titled "Characteristics
and Risks of Standardized Options" before considering any option transaction. Call
your local Schwab office or write Charles Schwab & Co., Inc. 101 Montgomery
Street, San Francisco, CA 94104 for a current copy. Member SIPC
Placing an Advanced Options Order
1. Enter the underlying stock symbol and press Enter.
Stock and/or option symbols and price and volume data shown here are for
illustrative purposes only. Charles Schwab & Co., its parent or affiliates,
and/or its employees and/or directors may have positions in securities
referenced herein, and may, as principal or agent, buy from or sell to
clients.
2. Select the Time in Force (Day is currently the only TIF available)
3. Enter the number of contracts you wish to trade. You may also check the
AON (All or None), which will ensure that your order will only fill if the entire
quantity is available.
WriteUnwind
Remember each contract in a Buy/Write represents 100
shares of the underlying stock.
4. Select the expiration month or Near for the nearest expiration month.
Rollout
Select the expiration month for the option position you
wish to Close and the month for the position you wish
to Open. Setting the Open to Near will automatically
select the next nearest month beyond the current
month.
Calendar
Spread
Select the Near and Far expiration months.
5. Select whether you want to view combinations that are At the Money, In
the Money, Out of the Money, or to see all at once, leave the default All
Money.
Copyright © Charles Schwab & Co., Inc. 2006. All rights reserved. (0106-5667)
139
StreetSmart Pro User Manual
Collar /
Straddle
Select whether you want to view combinations that are
Around the Money, Above the Money, Below the
Money, or to see all at once, leave the default All
Money.
6. Select whether to display Calls or Puts (applies to Rollout, Vertical Spread,
Calendar Spread, and Combination orders only).
7. Select the Strike Range, which will show you potential trades where the
difference between the two contract prices is equivalent to the strike range
you specify. (Applies to Rollout, Collar, and Calendar Spread orders.)
Vertical
Spread
Select the Spread Range, which will show you potential
spread trades where the range between the two contract
strike prices is equivalent to the spread range you specify.
8. Now, decide whether you want a net credit or debit for the order.
TIP: The debit is the ask price of the option being bought. The credit is
the bid price of the option being sold. The net is the difference between the
bid price of the option being sold (bid) and the ask price of the option being
bought (ask).
Buy/Write Unwind
When opening a Buy/Write you will need to select the
price from the Debit side, and when closing (Unwind),
select from the Credit side.
Straddle
The net is the total of the two bid prices of the options
being sold (bid) or the total of the two ask prices of the
options being bought (ask).
9. Select the Exchange you wish to price indications for from the drop-down
list.
10. Click on the combination you want to trade. In the image above, you can
see the selected strategy highlighted in blue.
Combination
140
For each leg, click on the desired contract, then right-click
and select which leg you want to apply that contract to
(i.e., Load [ZQN ED] to Leg2…), or manually select the
Expiration month and Strike price.
Copyright © Charles Schwab & Co., Inc. 2006. All rights reserved. (0106-5667)
Trading
11. Finally, ensure that the Price is correct. It will default to the Net value of
the quote you selected, but you may enter a different price or use the
arrows to select a new price. Note that all Advanced Options orders are sent
as Limit orders.
12. To send the order:
Write/Unwind,
Collar, Vertical
Spread, Calendar
Spread
Click Submit to Open or Submit to Close and
then verify that the order is correct.
Rollout
Click Submit Order and then verify that the order
is correct.
Straddle
If you are placing a sell order, click Sell to Close or
Sell to Open. If you are placing a buy order, click
Buy to Open or Buy to Close and then verify that
the order is correct.
Combination
Select the Leg Action for each individual leg (only
two legs per order). To send the order, click
Submit Order and then verify that the order is
correct.
Commissions, taxes, and transaction costs are not included in any of these strategy
discussions, but can affect final outcome and should be considered. Please contact
a tax advisor to discuss the tax implications of these strategies. Many of the
strategies described herein require the use of a margin account. Options carry a
high level of risk and are not suitable for all investors. Certain requirements must
be met to trade options through Schwab. Multiple leg options strategies will involve
multiple commissions. Please read the Options Disclosure Document titled
"Characteristics and Risks of Standardized Options" before considering any option
transaction. Call your local Schwab office or write Charles Schwab & Co., Inc. 101
Montgomery Street, San Francisco, CA 94104 for a current copy. Member SIPC
Copyright © Charles Schwab & Co., Inc. 2006. All rights reserved. (0106-5667)
141
StreetSmart Pro User Manual
Extended Hours Trading
EXTENDED HOURS TRADING
Extended Hours Trading is made possible by computerized order matching systems
known as ECNs or Electronic Communications Networks. Generally Schwab routes
all Extended Hours orders to the Archipelago Exchange. The Schwab Pre Market /
After Hours order routes are available to you if you wish to route your extended
hours orders in this way.
With Direct Access, you can send orders for NASDAQ equities direct to ECNs. Unlike
orders sent to Schwab for execution, direct access orders sent during the extended
hours can remain on the ECN's book for all sessions, if you have changed your ECN
Auto-Timeout setting to zero. This means they will not be outed, or canceled at the
end of the Pre-Market session nor at the end of the standard trading session. ECNs
have one trading session, which lasts from the time they open for business until
their designated closing time.
! NOTE:
Listed securities participating in the extended hours sessions and all
short sales will continue to be routed using Schwab's Extended Hours offerings.
EXTENDED HOURS TRADING VIA SMARTEX
Extended Hours Trading is made possible by computerized order matching systems
known as ECNs or Electronic Communications Networks.
Trading Sessions
Schwab's Extended Hours Trading offering has two components: the Pre Market
and the After Hours sessions. Both sessions are independent from the Standard
Market Session.
•
Pre-Market Session: Orders can be entered from 8:05 p.m. on the
previous trading day to 9:15 a.m. ET, but trades are not eligible for
execution until the session officially opens for trading at 8:00 a.m. ET.
•
After-Hours Session: Orders can be entered from 4:05 p.m. to 8:00 p.m.
ET, but trades are not eligible for execution until the session officially opens
for trading at 4:15 p.m. ET.
•
Separate trading sessions do not apply to Direct Access orders.
•
Schwab reserves the right to change its extended hours session and may
cancel extended hours sessions without prior notice.
•
No matter when you submit a Direct Access Order, you can only request a
cancel, you can never change your order.
Eligible Securities
Most NASDAQ and listed securities are currently eligible for extended hours trading
at Schwab. However, at any time, any number of securities may not be available
due to lack of trading interest during the Extended Hours Trading Session.
142
Copyright © Charles Schwab & Co., Inc. 2006. All rights reserved. (0106-5667)
Trading
Order Types
Only limit orders and short sell limit orders - not market orders - are accepted
during extended hours. The maximum order size is 5,000 shares.
Quotes
Quotes for the Extended Hours Trading session reflect the best Bid (buy) and Ask
(sell) orders currently available through the participating ECNs.
! NOTE:
Because Schwab Pre Market and After Hours orders are executed on
Archipelago, you should consider the ARCA quote as the most accurate indicator of
bid/ask prices available to you.
To View the NYSE Arca Order Book
1. Go to the Trading window
2. Click Settings > General > L2 Data tab
3. When the configuration box opens, check ARCA Book.
Changing and Canceling Orders
You can attempt to change or cancel an Extended Hours order within the same
Extended Hours session, as long as the status of your order is open.
Unexecuted Trades
Unexecuted orders do not carry over into the next Standard or Extended Hours
Trading Session. Any open orders will be automatically canceled at the end of the
current Pre-Market or After Hours session. Unexecuted Direct Access orders will not
carry over to the next day. If a Direct Access order is not executed, it will
automatically be canceled at the time the ECN (to which you routed your order)
closes. Direct Access orders that are not auto-canceled will be outed at the time the
venue (to which you routed your order) closes.
Direct Access orders that are not auto-canceled will be outed at the time the venue
(to which you routed your order) closes.
Conditional Orders
Conditional orders are triggered by Alerts with pre-defined variables you choose
and are only available during the Standard Market Session Alerts are not available
for use during Extended Hours.
Risks of Extended Hours Trading
Extended Hours Trading Sessions may not be suitable for all investors since they
pose certain risks including, but not limited to: lower liquidity, changing prices,
news announcements, higher volatility, and wider spreads. For more information,
see the StreetSmart Pro Disclosures and Agreement.
Extended Hours Trading Sessions do not take place on official Exchange holidays or
when the Exchanges close early. Schwab reserves the right to change or modify the
hours of operation at any time. A Schwab Extended Hours Trading Session, or any
security traded therein, may be temporarily or permanently suspended without
prior notice at any time at our discretion.
Copyright © Charles Schwab & Co., Inc. 2006. All rights reserved. (0106-5667)
143
StreetSmart Pro User Manual
RISKS OF EXTENDED HOURS TRADING
Extended Hours Trading Sessions may not be suitable for all investors since they
pose certain risks including, but not limited to: lower liquidity, changing prices,
news announcements, higher volatility, and wider spreads. For more information,
see the StreetSmart Pro® Agreement and Disclosure.
Extended Hours Trading Sessions do not take place on official Exchange holidays or
when the Exchanges close early. Schwab reserves the right to change or modify the
hours of operation at any time. A Schwab Extended Hours Trading Session, or any
security traded therein, may be temporarily or permanently suspended without
prior notice at any time at our discretion.
Standard Market
Hours
•
•
Extended Hours
Trading at Schwab
Individual investor
Pre-Market Trading
orders may be
• Individual investor
executed from 9:30
orders may be
a.m. to 4:00 p.m. ET.
executed from 8:00
a.m. to 9:15 a.m. ET.
Orders can be placed
at any time.
• Orders can be placed
as early as 8:05 p.m.
the previous trading
day, but order
execution will not
begin until 8:00 a.m.
•
Extended Hours
Trading via Direct
Access
Please refer to the table
in Direct Access Route
Comparison for the hours
of operation for each
routing channel. These
destinations do not in
any way differentiate
orders based on the time
of day the order is
submitted.
Orders cannot be
placed until after
8:00 p.m. ET for next
day's session.
After-Hours Trading
Trading occurs on
NASDAQ and the
exchanges through a
144
•
Individual investor
orders may be
executed from 4:15
p.m. to 8:00 p.m. ET.
•
Orders can be placed
as early as 4:05 p.m.
ET, but order
execution will not
begin until 4:15 p.m.
•
Orders cannot be
placed after 8:00
p.m. ET.
Your orders will be
For NASDAQ equities,
processed through ARCA. your orders will be
routed to your chosen
Copyright © Charles Schwab & Co., Inc. 2006. All rights reserved. (0106-5667)
Trading
variety of Market Makers
and ECNs.
destination.
All orders types available
via StreetSmart Pro®
are accepted by Schwab
during this Trading
Session, subject to
account or security
specific limitations.
Only limit orders are
accepted, subject to
account or security
specific limitations.
All order sizes are
accepted (round, odd,
and mixed lots).
While odd and mixed lot Maximum order size
orders can be accepted,
limitations vary by
their use may
channel.
significantly reduce your
chance of finding a
matching buy or sell. The
maximum order size is
5,000 shares.
You can trade securities
or options.
Currently, most NASDAQ
and certain listed
securities are available
for trading during the
Extended Hours Session
at Schwab.
NASDAQ equities only.
Unexecuted limit orders
placed during the day
session do not carry over
to the Extended Hours
Session.
Unexecuted extended
hours orders are
canceled at the end of
the session, and do not
carry over to the next
standard market or
Extended Hours Trading
Sessions.
Like orders placed during
the Standard Market
Session, unexecuted
shares are either autocanceled or remain on
the books of the ECN
until the end of the day if
you have changed your
Auto-Timeout setting to
zero.
In general, higher
trading activity means
more liquidity and a
greater likelihood of
order execution.
Lower trading activity
may result in lower
likelihood of order
execution, plus wider
spreads and greater
price fluctuation.
Lower trading activity
may result in lower
likelihood of order
execution, plus wider
spreads and greater
price fluctuation.
Limit orders and some
market orders are
accepted, subject to
account or security
specific limitations.
! NOTE:
Direct Access order destinations do not make a distinction between the
standard session and the extended hours sessions. Orders can be sent anytime
during the ECN's or NASDAQ's hours of operation. Also, be aware that while some
ECNs accept market orders this is usually only during the standard session between
9:30am and 4:00pm ET.
Copyright © Charles Schwab & Co., Inc. 2006. All rights reserved. (0106-5667)
145
StreetSmart Pro User Manual
Order Status
ORDER STATUS
The Order Status tab in the Account Detail window displays all orders - both open
and closed - placed via any Schwab channel, including Schwab.com , TeleBroker™
and Velocity.
The Order Status tab displays:
•
Open orders, closed orders that have been filled, or canceled orders:
You can sort on any column in the Order Status window by clicking on the
column header you want as your sort key.
•
Contingent Orders: This applies to SmartEx trailing stop orders that are
held up until the trailing stop price is met. Once the price is met the order
status changes to Open and a market order is submitted for execution.
Stock symbols and price and volume data shown here and in the software
are for illustrative purposes only. Charles Schwab & Co., its parent or
affiliates, and/or its employees and/or directors may have positions in
securities referenced herein, and may, as principal or agent, buy from or sell
to clients.
•
Partial fills: The Quantity Filled At column displays information for the
first fill. If there are additional fills, this column displays the average price
with the number of shares. To view the individual fills, double-click on the
order and an Order Details window will open displaying the fill events at the
bottom.
•
Sorting by Column: Click on a column name to sort by that column (click
again to reverse the sort order). Press Shift and click on a second column to
perform a secondary, more detailed sort within the primary sort. For
instance, if you wanted to see all the Open Buy orders, you could do a
primary sort on Status and a secondary sort on Action and the Open Buy
orders would be grouped together.
Order Status automatically updates when orders are executed either via
StreetSmart Pro or other Schwab channels.
146
Copyright © Charles Schwab & Co., Inc. 2006. All rights reserved. (0106-5667)
Trading
! NOTE:
Short Sell-Exempt orders will display in your Order Status tab. A
customer service representative may enter Short Sell-Exempt orders on your behalf
in certain limited circumstances. The most common instance when this may occur
is when liquidating the underlying security where the position is held as either an
equity right, warrant, or convertible. In these circumstances, the securities are not
in an acceptable form for delivery on settlement date. Note that you must file an
exercise for the right, warrant or convertible before your order to liquidate the
underlying security can be marked as Short Sell-Exempt. This action acknowledges
that the intent is to sell a position instead of short a stock and is therefore exempt
from the up-tick rule. Please see Up-Tick rule for more information.
MESSAGES WINDOW
Messages
By clicking View > Messages in the Account Detail menu, you can view streaming
order status in the Messages window for the current day only. If you log off and
back on multiple times during the day, all messages for the previous session(s) will
display in gray.
The Messages Window provides useful information about your software settings,
order status information, alert messages, and market session information. If you
make any changes to your software settings, these changes will also be noted in
the Messages Window.
The streaming data displayed includes:
•
New Order Accepted
•
Orders Filled
•
Nothing Done / Out
•
Alerts & Conditional Order Events
•
Change Order
•
Cancel Accepted
Copyright © Charles Schwab & Co., Inc. 2006. All rights reserved. (0106-5667)
147
StreetSmart Pro User Manual
As the Messages Window provides you with real-time information not always
available in other parts of the application, we recommend leaving your Messages
Window open while logged on.
TIP: Printing Data From the Messages Window
A copy of your log files is maintained in the SSPro folder on your C: drive
for each day you log in to the software. These files can printed in text
format. Please note that Schwab retains the official copy of these logs.
To print data directly from the Messages window before logging off, go to
File > Print.
CHANGING OR CANCELING ORDERS
Changing Orders
To change a SmartEx order, go to the Account Detail window, Order Status tab and
either right-click on the open order then select Change or click once on the order
to highlight it, then click Orders > Change. A pop-up box will appear prompting
you to modify your order.
Note that you cannot change the order type of a SmartEx order to or from a trailing
stop order after the order has been submitted. You must first cancel the order and
then resubmit with a different order type.
Direct Access orders can never be changed.
Canceling Orders
You can request to cancel open orders via the Order Status Tab. All Open orders
have a green box in the left-most column. Because of the speed of execution and
the short life span of market and marketable limit orders, canceling these orders
may not always be possible.
148
Copyright © Charles Schwab & Co., Inc. 2006. All rights reserved. (0106-5667)
CHARTS
149
StreetSmart Pro User Manual
Charting Overview
CHARTING OVERVIEW
Charts provide a quick way to absorb data and understand a security's
performance. They provide vast amounts of data in an efficient, userfriendly, customizable format, making it easy to analyze price and
volume movements in real time.
Add Studies, Trend Lines, and even technical analysis Strategies to
charts to enhance your ability to spot trends and buy/sell opportunities.
To open, click
in the Toolbar.
StreetSmart Pro® software has advanced charting tools that give you the freedom
to customize your charting experience to your precise specifications. Features
available include more than 25 customizable studies (or indicators); trend lines and
studies including SMA, EMA, Bollinger Bands and Envelopes; chart types, including
point and figure, bar, line, and candlestick; and much more.
You may display up to 6 chart windows in a single layout with up to 20 tabs (each
with unique chart settings) in each window, effectively allowing you to display up to
120 charts in one layout. Each tab can be setup to copy the setting from another
tab or be unique to the tab itself.
Stock symbols and price and volume data shown here and in the software are for
illustrative purposes only. Charles Schwab & Co., its parent or affiliates, and/or its
employees and/or directors may have positions in securities referenced herein, and
may, as principal or agent, buy from or sell to clients.
150
Copyright © Charles Schwab & Co., Inc. 2006. All rights reserved. (0106-5667)
Charts
CHARTING MENU BAR
FILE
Load Default
Loads the Default settings to a chart or tab.
Set as Default
Click Set as Default when you want the Chart window or
individual tab to open with the current settings every time
you open a new chart.
TIP: The defaults work on an individual tab basis, so if
you set a default in one tab, it is the settings of that tab
that become the default; not the settings of the whole
chart window.
Reset Default
Return to the program Default settings.
Page Setup
Enables you to customize the current page for printing.
Read the Printing Windows topic in the Getting Started
section for more information.
Print
Click to print the chart currently displayed.
Close
Click to close the chart currently displayed.
Printing Charts Tip: If charts are not printing clearly, try changing the
background color to white.
EDIT
Symbol
Changes the symbol current being displayed in the Chart.
! NOTE: This can also be done by right clicking on the
chart or by just typing a new symbol when the Chart
window is active
Tick Data
Allows you to change specific bad data displayed in a chart
that may impact the technical studies you are using. To
edit tick data:
1. Click on the bar, line, or candle that has bad data.
2. Click on Edit > Edit Tick Data
3. The date at the top should be for the date you last
clicked, if it is not, you can select the date or time
from the pull-down menu.
4. Make the appropriate changes to Open, High,
Low, or Close.
5. Click OK.
Delete Selected
Item
1. Select the item to remove by clicking on the label for
any study or trend line, or for support and resistance
lines, click on the line itself.
Copyright © Charles Schwab & Co., Inc. 2006. All rights reserved. (0106-5667)
151
StreetSmart Pro User Manual
2. Select Delete Selected Item to remove it from the
chart.
3. You can also delete the selected line or label by
pressing Delete on your keyboard or right-clicking on
the label or line and selecting Delete.
Delete All
Deletes all of the available items for a group. The groups
are Studies, Trend Lines, Support Lines and Resistance
Lines.
VIEW
Time
Lines
If checked, lines marking the time frame the chart spans (i.e.,
hours, days, months, etc.) are visible.
Price
Lines
If checked, lines marking various price levels are visible.
VAP
If checked, lines marking where the highest Volume Average Prices
have occurred.
Stock symbols and price and volume data shown here and in the
software are for illustrative purposes only. Charles Schwab & Co., its
parent or affiliates, and/or its employees and/or directors may have
positions in securities referenced herein, and may, as principal or
agent, buy from or sell to clients.
Info
Windo
w
The Info Window provides the statistical data for the point on the
chart you have clicked on. When you first open the window from the
pull-down, today's data will be displayed. To change the displayed
data, either left-click on a specific point on the chart or hold down
the left mouse button and move the mouse to find the date you
want.
If you haven't made any changes to the chart, the data in the
window will include that day's Open, High, Low, Close, Volume, and
BOL (Bollinger Bands). When you add more studies to the chart,
152
Copyright © Charles Schwab & Co., Inc. 2006. All rights reserved. (0106-5667)
Charts
they will also appear in the window. As you increase the number of
viewed studies, you may not be able to see all of the statistical data
in the window. To view all of the data available, you may need to
resize the window by dragging the corner with the cursor until the
all data is displayed.
NOTE: You can access Settings, Views, Tools, and Trend lines by either using
the respective pull-downs or right-clicking on the chart.
INSERT
Studies
The software allows you to add a vast number of studies to your
chart for technical analysis.
1. Highlight the study you wish to add in the left column.
2. Click the >> to move it to the box on the right.
3. Choose the Show In option and place the study in any of
the options in the drop down menu.
4. Click OK.
Go to Chart Studies for information on each available study.
Trend line
•
Select the Type of trend line to display. Go to Trend Lines for
more information on which Trend lines are available.
•
Type a label for the trend line so that you can identify it on
the chart. In the chart below, we have identified an upward
trend.
•
Right-click on the label to Edit or Delete the line.
Support
Adds a horizontal GREEN line wherever you click on the chart to
indicate the Support levels you want to identify in the chart you
are viewing.
Resistance
Adds a horizontal RED line wherever you click on the chart to
indicate the Resistance levels you want to identify in the chart
you are viewing.
Copyright © Charles Schwab & Co., Inc. 2006. All rights reserved. (0106-5667)
153
StreetSmart Pro User Manual
SETTINGS
GENERAL
Data Options
Chart Type
Choose the period the chart will be based on: Monthly,
Weekly, Daily, Intraday.
Range
(days)
Enter number of periods up to 240 months for Monthly charts,
3,000 days for Daily charts, 250 weeks for Weekly charts, 30
days for an Intraday chart.
! NOTE:
The number of days available on an Intraday chart
decreases along with your Interval setting. For instance, if you
choose 1 minute intervals, you will only see 4 days of data;
however, as you increase your interval, you can increase the
number of days back available to view. 60 days of Intraday
charts are only available when the interval is 10 or higher in
intervals of 5. For example you can get 10 days for Intervals of
10, 15, 20, 30, 60. You can only get 5 days for Intervals of 1-5
minutes or any other number that is not devisable by 5.
154
Copyright © Charles Schwab & Co., Inc. 2006. All rights reserved. (0106-5667)
Charts
Interval
(minutes)
Applicable to Intraday charts only.
Overlay
Symbol
Enter a symbol to overlay on your chart.
Market
Hours
Enter the hours you want chart data for in military time (for
example, 1600 for 4:00 p.m. ET).
! NOTE: Beginning time can be no earlier than 0600 and no
later than 0930 ET. Closing time can be no earlier than 1600
and no later than 2000 ET.
Default times are for the standard session only (09:30 to 16:00
ET). As extended hours quotes are only available streaming, it
is possible to have gaps in you chart if you ask for all session
times (i.e., 0600 to 2000 ET). The only way to view this data
consistently on a chart is to leave that chart open during Pre
Market or After Hours Sessions. If you switch stocks within the
same chart, this will generate gaps as the data is not presented
to the chart while open. Charts will not populate data for times
prior to when the chart was opened, regardless of the settings
of the chart.
Chart 60
Min Bars on
the Hour
If checked, starting at 10:00 a.m. ET, a chart using 60 minute
bars will be based on the hour (10-11, 11-12, etc.) rather than
the half-hour (9:30-10:30, 10:30-11:30, etc.)
Use %
Scale with
Overlay
When overlaying another symbol on the chart, checking this box
will change the display to a percent scale. Percentages are
based off the performance over the time period (intraday, daily,
monthly, etc.)
TIPS:
1. For the classic look, a line chart can be selected with a
line overlay. Go to Settings > Colors to configure the
colors of these lines for best display.
2. The current price will display in the right-hand scale that
defines the percentages. To remove that display go to
Settings > General and uncheck the Show last trade
label box located at the bottom of that window.
3. Use a support or resistance line and place it at the zero
percent level. This level can be easily located as the
starting point on the left when the symbol and overlay
begin plotting.
4. Use the crosshairs to see the exact percentage numbers.
Copyright © Charles Schwab & Co., Inc. 2006. All rights reserved. (0106-5667)
155
StreetSmart Pro User Manual
Display Options
Graph Style
Bar
•
On a daily chart, each bar is one day. On an intraday
chart, each bar represents one interval.
•
On Bar charts, the left rung indicates the opening price
of the stock, and the right rung indicates the closing/last
price of the stock for the day or interval.
•
The top and bottom of the bar represent the high and
low for that day or interval.
•
Green indicates the security's closing/last price for the
day or interval was higher than today's opening price.
•
Red indicates the security's closing/last price for the day
or interval was less than or equal to today's opening
price.
Calculate Change From Open/Close
•
Allows you to select the basis for the calculation of bars.
By default this setting is Change from Open, which
calculates a bar as up or down based on the difference
between the open and closing price. When set to Change
from Close, the color (or change) of each bar is
determined by the difference between the previous bars
closing price and the current bars last (or closing) price.
Candlestick
156
•
On a daily chart, each stick is one day. On an intraday
chart, each stick represents between 1 and 120 minutes.
•
Green indicates the security's closing/last price for the
Copyright © Charles Schwab & Co., Inc. 2006. All rights reserved. (0106-5667)
Charts
day or interval was higher than today's opening price.
•
Red indicates the security's closing/last price for the day
or interval was less than today's opening price.
•
Gray indicates the security's closing/last price for the
day or interval was equal to today's opening price.
•
The top and bottom of the line behind it represent the
high and low for the day/period.
Outline Candlesticks
•
Check or uncheck your preference to have the
Candlesticks outlined or not. This is only available when
candlestick is selected as graph style.
Line
•
Yellow Opening price for that day or interval.
•
Green High price for that day or interval.
•
Red Low price for that day or interval.
•
Blue Closing/last price for that day or interval.
Line Graph
•
When selected, you can choose which lines to view:
Open, High, Low or Close.
Point & Figure Charts
When selected, you can choose how to display the following
items for Point & Figure:
•
Box size from 0.05 to 500
•
Using either High/Low or Close
•
Reversal from 1 to 5.
Overlay
Style
If applying an overlay of a second symbol, the style is set here.
Graph Line
Width
This gray field is adjustable with the up or down arrows to the
right of the field. The higher the number, the bolder the line in
the chart.
! NOTE:
Study Line
Width
This gray field is adjustable with the up or down arrows to the
right of the field. The higher the number, the bolder the line in
the chart.
! NOTE:
Data to
show
A higher setting may cause distortion to the graph.
A higher setting may cause distortion to the graph.
Specify the number of days to display in the chart at any one
time.
! NOTE:
This is only applicable when the Show all data field is
unchecked.
Show all
If checked, shows chart for the time frame specified in the
Copyright © Charles Schwab & Co., Inc. 2006. All rights reserved. (0106-5667)
157
StreetSmart Pro User Manual
data
Range (days).
If unchecked, this will display what is indicated in the Data to
show field. A scroll bar will appear at the bottom of the chart
allowing you to move back and/or forth through Range (days)
selected.
Price scale
($'s)
Specify the increments for the price scale, from .05 to Auto or
Logarithmic. Once a price interval is selected (not Auto or
Logarithmic), you can manually input an interval. You should
select an interval that is appropriate to the price range of the
security you are charting for the selected Range (days).
•
Default is Auto, which allows the software to select the
optimal scale based on the size of the chart.
•
Logarithmic, or percentage, scaling will change the
price scale's appearance by making the vertical spacing
between two points correspond to the percentage change
between those numbers. So, for instance, the vertical
distance between 10 and 20 and the vertical distance
between 50 and 100 will be the same. This helps provide
a truer picture of charts with large vertical ranges.
Show Last
Trade Label
Highlights the last trade price in the Price Scale.
Show Price
Scale on
Left
The Default will display the Price Scale on the right. By
checking this field, the Price Scale will display on the left.
Show High,
Low, Open,
Close
Values on
Chart
Overlays the lines for High, Low, Open and Close on the chart.
Chart Type
Allows you to quickly change between Monthly, Weekly, Daily,
and Intraday charts.
The Settings > General window determines how many days or
intervals are displayed.
Back Test
You can change the Back Test settings when applying a
Strategy to the chart to see how having a different starting
equity or trade quantity, or adding commissions to the cost of
the trades, will affect the outcome of the test.
Fonts
Click to change the font style in the chart.
1. When the Font box opens, select the type, style and size.
2. Click OK.
! NOTE:
Large font sizes may not allow for a clean view of the
text displayed in the chart.
Colors
To change the colors in a chart:
•
158
Select the item you wish to change, then press the color
Copyright © Charles Schwab & Co., Inc. 2006. All rights reserved. (0106-5667)
Charts
button to change, and click OK.
TABS
For more on tabs visit the Adding Tabs to Windows topic
Enable
Clicking Enable will create 2 tabs in the Chart Window,
your current chart, plus an additional chart which you can
customize separately using the Tabs > Edit menu item.
Insert
Add more tabs than the 2 added when enabled.
Edit
Edit the selected tab.
Remove
Remove the selected tab
Use same
symbol for all
tabs
When checked, all of the tabs within the Chart window will
use the same symbol. When unchecked, all of the tabs can
have specific symbols saved within the tabs.
TOOLS
Studies
The software allows you to add a vast number of studies to
your chart for technical analysis.
1. Highlight the study you wish to add in the left
column.
2. Click the >> to move it to the box on the right.
3. Choose the Show In option and place the study in
any of the five options in the drop down menu.
4. Click OK
Go to Chart Studies for information on each available
study.
Strategy Center
Open the Strategy Center to apply a strategy to the chart.
Copyright © Charles Schwab & Co., Inc. 2006. All rights reserved. (0106-5667)
159
StreetSmart Pro User Manual
You can also edit or create a new strategy from the
Strategy Center.
To add a strategy to the chart, click on the strategy in the
Available Strategies list and check Show selected
strategy on chart.
Edit Strategy
Opens the Edit Strategy window for the strategy currently
applied to the chart and will allow you to make changes to
both the Strategy details and the chart display.
Show Strategy
Once an initial strategy has been applied to the chart, you
can use Show Strategy to hide or show the strategy on
the chart.
Strategy
Performance
Details
The Strategy Performance Details window breaks down the
details and statistics of the strategy being tested in the
Chart window.
Crosshairs
Select to change your cursor to display a crosshair when
you click on the chart. The Crosshair pointer can help you
pinpoint prices on a chart more easily than when using the
regular cursor.
Select again to turn off Crosshairs.
Zoom In
Allows you to zoom in on a smaller area of a chart without
having to change your Chart settings.
1. Click Zoom In
2. Click and hold the mouse button on the point within
the chart where you wish to start to zoom in
3. Drag your mouse across to the point where you wish
to end the zoom in and release the mouse button.
TIP: Right-Click Charts Shortcut
Right-clicking on a chart opens a menu allowing you to:
160
•
Recent Stories for [Symbol]
•
Research/Ext. Quote for [Symbol]
•
Apply an Alert to [Symbol]
•
Change Symbol...
•
View: Time Lines, Price Lines, VAP (Volume At Price), and Info
Window
•
Chart Type (Monthly, Weekly, Daily or Intraday)
•
Show all Data
•
Trend, Support, and Resistance lines
•
Tools: Studies, Strategies, Crosshairs, Edit Tick Data, Zoom-in
•
Hide/Show Menu
Copyright © Charles Schwab & Co., Inc. 2006. All rights reserved. (0106-5667)
Charts
CHART TOOL BAR
The Chart Toolbar allows quick access to the most commonly used chart
features.
To enable, click Toolbars > Chart Toolbar in the main menu.
•
Most buttons clicked in the Chart Toolbar will affect the most recently
accessed Chart window.
EXAMPLE You have 3 chart windows open, and you most recently clicked
on Chart #2. When you click the Add/Edit Studies button, it will open for
Chart #2. If you want the button you press to affect another chart, click that
chart first and then click the button in the toolbar.
•
The Regular, Snap to, and Best Fit trendlines are the exceptions and can be
clicked in the toolbar and applied to any chart in your layout.
•
Click anywhere in the main menu, and then hover your mouse over a button
to see a Tool Tip that says what the button will do.
•
All the buttons in the Chart Toolbar correspond to a feature also found in the
menu of each Chart window.
Customizing the Chart Toolbar
Customize which icons are displayed on your chart toolbar. Select Toolbars >
Customize > Chart Tool Bar from the main menu or right-click on the Chart Tool
Bar and select Customize... The Chart Tool Bar customization window will open.
You can then select which tools you want displayed on your toolbar.
•
Use the Add/Remove buttons to move buttons between the Available and
Current columns.
•
Use the Move Up/Move Down buttons to put the buttons in the Current
toolbar in the order you prefer.
•
Click Close when you are finished customizing your Chart Toolbar.
Moving the Chart Toolbar
The Chart Toolbar can be displayed vertically on the left/right hand side, or the top
or bottom of the frame, or it can be removed to be a free-floating window.
1. Move your mouse pointer to the thin bar on the left side of the Chart Tool
Bar.
2. Click on that bar and then drag the window to the location of your choosing.
3. Let go of the mouse button.
Toolbar Features
Not all buttons are displayed by default. To add a button, click Toolbars >
Customize > Chart Tool Bar in the main menu.
Chart General
Settings
Open the General Settings for the most recently
accessed Chart window.
Copyright © Charles Schwab & Co., Inc. 2006. All rights reserved. (0106-5667)
161
StreetSmart Pro User Manual
Crosshairs
Select to change your cursor to display a crosshair
when you click on the chart. The Crosshair pointer
can help you pinpoint prices on a chart more easily
than when using the regular cursor.
Select again to turn off Crosshairs.
Chart Type
Choose Monthly, Weekly, Daily, Intraday, or Tick
Chart Interval
Choose from 5 to 120 minutes or select Other to
open the Chart Settings window where you can enter
a different interval.
Only applies to Intraday chart types.
Add/Edit
Studies
Click to open the Add/Edit Studies window, which
lets you add technical analysis studies to your chart.
Go to Chart Studies for information on each available
study.
Trend Lines
Click to draw Trend Lines on the chart. The pointer
will change to a pencil icon. Click and drag to draw
the trend line.
Click the Trend Line button again to stop drawing
trend lines (or select another button).
Edit Trend
Lines
Click and select from the drop-down list which Trend
Line you wish to edit. The button is only available
when the most recently selected chart has trend
lines drawn on it.
The Edit Trend Line window lets you select the type
of trend line (regular, Fibonacci, best fit (regression),
etc.), as well as the color and label (name) for the
line.
Support
Adds a horizontal GREEN line wherever you click on
the chart to indicate the Support levels you want to
identify in the chart you are viewing.
Resistance
Adds a horizontal RED line wherever you click on the
chart to indicate the Resistance levels you want to
identify in the chart you are viewing.
New Tab
Click to add a new tab to the most recently accessed
chart window.
You must have Tabbing enabled for the chart in
order to click the New Tab icon.
Show All Data
If checked, shows chart for the time frame specified
in the Range (days).
If unchecked, this will display what is indicated in the
Data to show field. A scroll bar will appear at the
bottom of the chart allowing you to move back
and/or forth through Range (days) selected.
162
Copyright © Charles Schwab & Co., Inc. 2006. All rights reserved. (0106-5667)
Charts
Edit Tick Data
Allows you to change bad chart price data, which
may impact the technical studies enabled on the
chart.
Click the Edit Tick Data button in the toolbar and
then click the price point you need to edit on the
chart. A window will open that allows you to change
all four price points for that period (open, close,
high, low).
Delete
Click the Delete icon to see a list of studies and trend
lines in the most recently accessed chart so that you
may delete one or more of them. You can also chose
Delete All Studies to clear all studies from the
chart.
Delete will not clear support and resistance lines. You
must right-click on the line and select Delete to
remove it.
Graph Style
Switch between Bar, Candlestick, Line or Point &
Figure chart types.
Read more about each of these graph styles in the
Chart Menu Bar topic.
Time Lines
Click to hide or show the vertical time lines on the
chart.
Price Lines
Click to hide or show the horizontal price lines on the
chart.
Best Fit
Click the button and then click on the chart to apply
a Best Fit Regression trend line to the chart.
Read more about Best Fit in the Trend Lines topic.
Snap To
Click the button and then click and drag a line on the
chart to apply a trend line that "snaps to" the open,
high, low, or close of the trend being studied.
To change which price the trend line snaps to (the
default setting is Close), click the Edit Trend Lines
button in the toolbar and choose the Snap To line
you wish to edit.
Read more about Snap To in the Trend Lines topic.
Fibonacci
Retracement
Click the button and then click on the chart to draw a
Fibonacci Retracement line.
Read more about Fibonacci lines in the Trend Lines
topic.
Fibonacci Fan
Click the button and then click on the chart to draw a
Fibonacci Fan line.
Read more about Fibonacci lines in the Trend Lines
topic.
Copyright © Charles Schwab & Co., Inc. 2006. All rights reserved. (0106-5667)
163
StreetSmart Pro User Manual
Fibonacci Arc
Click the button and then click on the chart to draw a
Fibonacci Arc line.
Read more about Fibonacci lines in the Trend Lines
topic.
VAP
Click to show lines bars on the chart where the
highest Volume Average Prices have occurred.
Alerts
Click to add a Conditional Order or Alert on the
security in the most recently accessed Chart window.
Help
Open the Online Help directly to information on using
Charts in StreetSmart Pro.
CHART WINDOW SETTINGS
Chart Settings
StreetSmart Pro® software gives you real-time interactive charting capability with
a wide range of customizable features. You can:
Open a New Chart
Open as many as six charts at one time.
1. Go to the Toolbar.
2. Click the chart icon
.
Link Charts to the Trading Window
A chart, or multiple charts, will automatically load the symbol of the stock in the
Trading window if they are linked.
To link charts to the Trading window:
1. From the Trading Window, select Settings > Links.
2. This allows you to link from a Trading Window to any chart or combination
of charts. To link to multiple charts, such as Chart 2, Chart 2 must be open
prior to going to Settings > Links.
Open Charts That Are Not Linked to the Trading Window
1. Highlight the chart by clicking it.
2. Type the symbol you want and press Enter.
Get Chart Statistics
While in the chart, click the left mouse button and the following information window
will appear:
164
Copyright © Charles Schwab & Co., Inc. 2006. All rights reserved. (0106-5667)
Charts
The contents of this window will vary depending on the studies that you have
selected in your chart.
To Move the Window to Another Location on the Chart:
1. Click the mouse button and keep it pressed.
2. Place the mouse cursor on the top blue title bar of the window and
release the mouse button.
3. Click the mouse button again and keep it pressed while you drag the
window where you want it.
4. The window will only be visible while the left mouse button is down or
while the cursor is on the information window.
! NOTE: To make the Info Window easier to move or always open, click
View > Info Window.
To Expand the Detail of the Info Window:
1. Left-click the mouse button and keep it pressed.
2. Place the mouse cursor on the Info Window and then let go of the
mouse button.
3. Drag your mouse cursor to the bottom edge of the info window until
the arrow changes to a small black arrow pointing in two directions.
4. Keep it pressed while you drag the window down to increase the size.
STRATEGY TESTING IN CHARTS
See a graphical representation of your Strategy Tester results in a
chart. View the entry and exit points the strategy identifies and
instantly see if the stock really did move up or down.
To set up, click Tools > Strategy Center in the Chart menu.
The image below shows long entry and exit points based on the Bollinger Band
strategy, which was applied to the chart.
Copyright © Charles Schwab & Co., Inc. 2006. All rights reserved. (0106-5667)
165
StreetSmart Pro User Manual
Stock symbols and price and volume data shown here and in the software are for
illustrative purposes only. Charles Schwab & Co., its parent or affiliates, and/or its
employees and/or directors may have positions in securities referenced herein, and
may, as principal or agent, buy from or sell to clients.
The strategy testing tools available in the Strategy Tester window are also available
here in the Chart window:
•
From the Settings > Back Test... menu, you can change the settings for
the back test, such as commissions, quantity per trade, and initial equity.
Refer to Back Test Settings to learn about each of those settings.
TIP: When establishing Back Test settings for a strategy being used in a
Chart the "Bar Size" and “Number of Bars for Test” is effectively the same
thing as the Interval and the Range in the chart Settings > General.
•
From the Tools menu, you have access to:
Strategy
Center...
Open the Strategy Center to apply a strategy to the
chart. You can also edit or create a new strategy from
the Strategy Center.
To add a strategy to the chart, click on the strategy in
the Available Strategies list and check Show
selected strategy on chart.
166
Edit Strategy...
Opens the Edit Strategy window for the strategy
currently applied to the chart.
Show Strategy
Once an initial strategy has been applied to the chart,
you can use Show Strategy to hide or show the
strategy on the chart.
Copyright © Charles Schwab & Co., Inc. 2006. All rights reserved. (0106-5667)
Charts
Strategy
Performance
Details...
The Strategy Performance Details window breaks down
the details and statistics of the strategy being tested in
the Chart window.
Copyright © Charles Schwab & Co., Inc. 2006. All rights reserved. (0106-5667)
167
StreetSmart Pro User Manual
Studies and Trends
CHART STUDIES
Chart Studies use a stock's price movements, volume, and other
historical information to attempt to find patterns that may indicate
shifting price trends.
By learning what a particular study may be indicating and then
applying that study to your charts, you may be able to identify trading
opportunities, points of support or resistance at certain price
thresholds, price trends, and more.
Add Studies to a chart from the Tools > Studies menu.
StreetSmart Pro® software allows you to incorporate studies into your charts for
technical analysis. Studies can:
•
Overlay on the price chart
•
Display below the price chart (use the Show In drop-down located in the
Studies window to put additional studies in separate panels in the Chart
Window.)
! NOTE:
The same study can be displayed in both places.
Choose from the following default study parameters:
Study Name
Description
Adaptive RSI
Adapts the standard RSI to a smoothing constant. Default of 14 periods
(minutes, hours, days, etc.) can be changed.
For calculation purposes, Adaptive RSI is somewhat similar to an
exponential moving average, but instead of averaging prior values using a
fixed percentage, it uses a variable percentage based on the RSI. The
formula is
for t < n
for t >= n
where
Average DM
(ADX)
168
and n is the RSI period (i.e. an n-period RSI).
Average Directional Movement is an oscillator that fluctuates between 0
and 100, reading above 60 are relatively rare. It's values are interrelated
with +DI, -DI and DX.*
Copyright © Charles Schwab & Co., Inc. 2006. All rights reserved. (0106-5667)
Charts
Average True
Range
Measures a security's volatility by averaging the True Range over a period
of time you specify when setting up the study. True Range is the greatest
of the following:
•
The current high minus the current low.
•
The absolute value of the current high less the previous close.
•
The absolute value of the current low less the previous close.
Default of 14 periods can be changed.
The ATR formula is an exponential average of the true range. True range
takes into account any gap up or down from the previous day as well as
the high and low for the current day. The formula is
where TR is the largest of the absolute values of | High-Low |, | HighYesterdays Close |, and | Yesterdays Close-Low |.
Bollinger Bands
The top and bottom lines are placed n-standard deviations above and
below the center line*. Since standard deviations are a measure of
volatility, the bands widen during volatile price action and contract when
the trading range tightens. You can change the variables used in the
calculation from the defaults of period=20 and n=2 standard deviations
above and below.
*The center line is not included when applying a Bollinger Bands study. To
get a center line, add a Moving Average - Simple study for the same
number of periods (default=20) to the chart.
Rather than two bands that are always an equal percentage away from
the central average, Bollinger Bands expand and contract based on the
standard deviation of the historical volatility of the price action. The
formulas for the upper and lower bands are
where m is the number of standard deviations and the formula for
Copyright © Charles Schwab & Co., Inc. 2006. All rights reserved. (0106-5667)
169
is
StreetSmart Pro User Manual
CCI
The Commodity Channel Index ("CCI") measures the variation of a
security's price from its statistical mean. High values show that prices are
unusually high compared to average prices whereas low values indicate
that prices are unusually low. Contrary to its name, the CCI can be used
effectively on any type of security, not just commodities. The formula is
where
Directional
Movement (DX)
The Directional Movement study indicates the strength of a trend,
independent of whether that trend is up or down. The study combines
several components: +DI measures upward moves, -DI measures
downward moves, DX combines +DI and -DI, and ADX is a smoothed
version of DX.*
DM(+DI)
Positive
The basic Directional Movement trading system involves comparing the
14-day +DI ("Directional Indicator") and the 14-day -DI. This can be done
by plotting the two indicators on top of each other or by subtracting the
+DI from the -DI. The study indicates buying when the +DI rises above
the -DI and selling when the +DI falls below the -DI. You can change the
periods used in the calculation from the default of 14.*
DM(-DI) Negative
The basic Directional Movement trading system involves comparing the
14-day +DI ("Directional Indicator") and the 14-day -DI. This can be done
by plotting the two indicators on top of each other or by subtracting the
+DI from the -DI. The study indicates buying when the +DI rises above
the -DI and selling when the +DI falls below the -DI. You can change the
periods used in the calculation from the default of 14.*
Envelope
Employing an Envelope is similar to Bollinger Bands, except equidistant
from the center average, in that the Envelope helps define the upper and
lower boundaries of a security's normal trading range. When the security
reaches the upper band, this may indicate a sell opportunity, whereas the
security reaching the lower band may indicate a buy opportunity. Default
of 20 periods with Upper and Lower % default of 6 can be changed. The
formulas for the upper and lower envelopes are
where F is a factor such as 6% (i.e. 0.06 for the formulas above).
170
Copyright © Charles Schwab & Co., Inc. 2006. All rights reserved. (0106-5667)
Charts
Historical
Volatility
Reflects how far an equity's price has deviated from its average price over
the number of periods you specify. This study only applies to Daily,
Weekly, and Monthly charts. Default of 20 periods can be changed.
Historical volatility is calculated:
Keltner
Channels
Keltner Channels consist of two bands that are not equidistant from the
SMA.
Rather than two bands that are always an equal percentage away from
the SMA, Keltner Channels expand and contract based on a moving
average of the True Range (TR). The formulas for the upper and lower
bands are
where F is a factor,
, and
Copyright © Charles Schwab & Co., Inc. 2006. All rights reserved. (0106-5667)
171
StreetSmart Pro User Manual
Last Close
(Intraday)
When selected with an intraday chart, a line will display indicating the
prior day's close price.
Stock symbols and price and volume data shown here and in the software
are for illustrative purposes only. Charles Schwab & Co., its parent or
affiliates, and/or its employees and/or directors may have positions in
securities referenced herein, and may, as principal or agent, buy from or
sell to clients.
Moving Average
Conv/Divergen
ce (MACD)
A trend-following momentum indicator using 3 exponential moving
averages: a short or fast average, a long or slow average, and an
exponential average of their difference (the last used as a signal or trigger
line). You can change the periods used in the calculation from the defaults
of 12 and 26. Used with Signal Line below.
MACD
Histogram
A variation of the MACD that plots the difference between the Signal Line
and MACD. Changes in the spread between these two lines may be
spotted faster, potentially leading to earlier trading signals. You can
change the periods used in the calculation from the defaults of 12, 26, and
9.
Momentum
Measures the amount the price of a security has changed over the last 14
days. If the current trading session today hasn't closed yet, it uses the
last sale price. You can change the periods used in the calculation from
the default of 14.
The formula for an n-period Momentum is
Money Flow
Money Flow keeps a running total of the money flowing into and out of a
security. The direction of the Money Flow line is the important component
to watch, not the actual dollar amount. This indicator can be used to
confirm underlying strength or weakness of a price trend.
The formula for an n-period Money Flow is
172
Copyright © Charles Schwab & Co., Inc. 2006. All rights reserved. (0106-5667)
Charts
Money Flow
Percent
Money Flow Percent normalizes the Money Flow calculation above by
dividing by the cumulative volume for the period.
You can change the periods used in the calculation from the default of 14.
The formula for an n-period Money Flow Percent is
Moving Average
Exponential
(EMA)
While similar to the SMA, the exponential moving average uses a
"smoothing factor" to give more weight to recent prices, while allowing all
prices in the window to influence the average. The default of 20 periods
can be changed.
The EMA formula is an inductive formula; that is, the value at time t is
based on the value at time t-1 and a current amount. The formula is
where Price is set to the Average
variable you select when you set up the study. F (Factor) can theoretically
be any value between 0 and 1 but is generally related to an n-period SMA
by the formula
Moving Average
Simple (SMA)
The average of the last 8-periods close values including current day. If
current trading session hasn't closed yet, the last sale price is used. The
default of 8 periods can be changed.
The formula for an n-period SMA is
Moving Average
- Geometric
(GMA)
A moving average weighted on the price movement relative to the stock
price, so that a $1 increase in a $5 stock is represented on the chart as a
much greater move than a $1 increase in a $75 stock.
where
The formula for an n-period GMA is
Price is set to the Average variable you select when you set up the study.
Copyright © Charles Schwab & Co., Inc. 2006. All rights reserved. (0106-5667)
173
StreetSmart Pro User Manual
Moving Average
- Smoothed
(OMA)
An exponential moving average with a longer period used to determine
the average, as older prices are never removed from the calculation but
are given less weight. Best used in trending markets.
The initial value of an n-day OMA is the same as the initial value of an nperiod SMA indicator. Subsequent values are determined using an
inductive formula, in the manner of the EMA described above.
The formula for the initial value of OMA is
The formula for subsequent values is
On Balance
Volume (OBV)
This indicator relates volume to price changes by adding volume to a
running total when the price closes up for a period, then subtracts the
volume if the stock closes down for a period. You can overlay the study on
or underneath the price chart.
The formula is
where
and
174
if
if
Copyright © Charles Schwab & Co., Inc. 2006. All rights reserved. (0106-5667)
Charts
Parabolic SAR
The Parabolic SAR (stop and reverse) is a trend-following indicator that
may help establish stop loss parameters, as well as signaling opportune
times to buy or sell a stock. Because it's a trend-following indicator, it
tends to be less useful in a sideways market and more useful in a strongly
trending market.
A line above the price may indicate a bearish trend, and a line below the
price may point to a bullish stock.
The formula is
SARTomorrow = SARToday + AF (EPTrade – SARToday)
where AF (Acceleration Factor) is one of a progression of numbers
beginning at .02 and ending at .20. The AF is increased by .02 each day
that a new high is made. You can change these values by editing the
Minimum Step and Maximum Step fields when setting up the study on
your chart.
And EPTrade = Extreme Price Point of the trade made so far. If you choose
Long from the Position drop-down, EP is the extreme high price for the
trade; if Short, EP is the extreme low price for the trade.
Pivot Points
(Intraday)
Uses the previous day high, low, close, and open price to generate a pivot
line, two support levels (S1 & S2), and two resistance levels (R1 & R2).
This study is only displayed on Intraday charts. In the Studies window,
you may check the lines you wish to view: R2, R1, Pivot, S1, S2
! NOTE:
Pivot Point lines may not be visible depending on the price scale
you have set in Settings > General, and the price discrepancy between
the previous and the current trading day.
Pivot Points are calculated:
Pivot = ( YesterdaysHigh + YesterdaysLow + YesterdaysClose ) / 3.0;
S1 = 2.0 * Pivot - YesterdaysHigh;
R1 = 2.0 * Pivot - YesterdaysLow;
S2 = Pivot - ( R1 - S1 );
R2 = Pivot + ( R1 - S1 );
Copyright © Charles Schwab & Co., Inc. 2006. All rights reserved. (0106-5667)
175
StreetSmart Pro User Manual
Price Relative
(to Symbol)
Compares the performance of the symbol currently loaded in the chart to
the symbol specified in the studies settings window.
Rate of Change
Change in price between the current price and the close 5 periods ago,
divided by the price 5 periods ago. You can change the number of periods
used in the calculation, and you can overlay the study on or underneath
the price chart.
The formula for an n-period Rate of Change
is
176
Copyright © Charles Schwab & Co., Inc. 2006. All rights reserved. (0106-5667)
Charts
Relative
Strength Index
Indicates the degree of positive and negative movement by the stock on a
scale of 0 (weakest) to 100 (strongest). Determined by figuring the ratio
of the average up closes for the last 14 days (using today's current price
for the 15th day) divided by the sum of the average up closes and the
average down closes for the same period. This ratio is multiplied by 100.
You can change the number of periods used in the calculation from the
default of 15, and you can overlay the study on or underneath the price
chart.
The initial value of an n-period RSI is based on the price action for the
first n periods. Subsequent values are determined using an inductive
formula, analogous to the EMA formula described earlier.
The formula for the initial value of RSI is
for all
where
and
for all
Subsequent values of RSI are determined using the formula
where
and
where
and
if
>0 and 0 otherwise,
if
<0, 0 otherwise
Signal Line
Used with MACD. You can change the periods used in the calculation from
the defaults of 12, 26 and 9.
Stochastic %D
Part of the stochastic indicator along with %K. Shows the degree of
smoothing, or moving average period, of %K. You can change the periods
used in the calculation from the default of 14 periods and 3 periods.
For calculation purposes, %D is an SMA of %K below.
Copyright © Charles Schwab & Co., Inc. 2006. All rights reserved. (0106-5667)
177
StreetSmart Pro User Manual
Stochastic %D Slow
Similar in principle to %D, %D Slow represents a slower, less volatile
indicator that simply adds an additional degree of smoothing, or moving
average period, to the original %D. You can change the period used in the
calculation from the default of 14 periods, 3 periods, and 3 periods.
For calculation purposes, %D Slow is an SMA of %D above.
Stochastic - %K
Part of the stochastic indicator along with %D. Shows the price level of a
stock in relation to its price range over a given period. You can change the
period used in the calculation from the default of 14 periods.
The formula for an n-period %K is
Stochastic RSI
Plots the Stochastic %D line of the RSI (Relative Strength Index) to
represent the level of the RSI indicator relative to its range over the
number of periods you specify. Default of 14 Stochastic and RSI periods,
as well as the default Slowing Factor of 1 can be changed.
You can also check the Ten Grid Lines box to display lines from 0.1 to 0.9
instead of two lines at .25 and .75.
The formula for an m-period stochastic of an n-period RSI is
178
Copyright © Charles Schwab & Co., Inc. 2006. All rights reserved. (0106-5667)
Charts
Volume/
Volume SMA
Simply the number of shares (or contracts) traded during a specified time
frame (e.g., hour, day, week, month, etc).
You may also choose the Show SMA feature, which will show a simple
moving average line in the Volume study. The image below shows the
Volume study with a 20 period SMA overlayed.
Williams % R
A momentum indicator that measures overbought and oversold levels. The
interpretation of Williams %R is very similar to that of the %K stochastic
indicator. The oversold indications are in the range of -80 to -100, while
the overbought indications are in the range of -20 to 0. You can change
the periods used in the calculation from the default of 12.
For calculation purposes, %R is simply %K - 100.
*Directional Movement is a trend-following system that consists of +DI, - DI, DX,
and ADX. These values are interrelated as shown below.
if the denominator > 0; 0 otherwise
and
where
,
where
Copyright © Charles Schwab & Co., Inc. 2006. All rights reserved. (0106-5667)
179
StreetSmart Pro User Manual
is
otherwise. If both
if > 0; 0 otherwise.
is
and are > 0, the smaller is set to 0.
F (Factor) is related to an n-day SMA by the formula
if > 0; 0
.
TIP: Right-Click Shortcut to Add a Study or Trend Line
•
Right-click in the chart.
•
Go to Tools and select Studies or Trend lines and select New or Delete.
ADD OR DELETE A STUDY
To Add a Study:
1. Click Tools > Studies and the Studies Set-up panel will appear.
2. Click on a study in the left column.
3. Click the >> button to activate the study.
180
Copyright © Charles Schwab & Co., Inc. 2006. All rights reserved. (0106-5667)
Charts
To Customize the Study:
1. When it appears in the right column, click on the study to change its
Period(s), Color, Show in, and Label properties.
2. To change the default period, click in the window and add the new variable
for your period.
3. Use the Show In drop-down to overlay the study in the main chart window
or place the study in a separate pane below the chart.
4. Study Data Points: Certain studies may be more precise when using a
larger set of data to calculate the study results, but occasionally, a chart will
not have enough data to maximize the precision of the results. What
StreetSmart Pro® charts do for studies where this applies is extend the
period used to calculate the study up to 4x the study period to achieve the
most accurate study results. Checking Auto Optimize will automatically try
to achieve the most precise results given the amount of data available. By
unchecking Auto Optimize, you have a choice about how much data to use
in the study calculation. Max Display will use data only from the number of
periods you specify. Max Precision will use data from the specified number of
periods multiplied by 4.
5. Make the changes and click OK.
To Delete a Study:
Click on the study, then click the << button.
TREND LINES
Trend Lines are a technical indicator where a straight line is drawn
connecting a series of prices with either a clear downward or upward
trend.
Traders incorporating trend lines into their strategy may look for prices
breaking through a trend line to potentially identify changing trends.
Set up Trend Lines from the Insert > Trend Line menu or click on one of the
trend line icons from the Chart Tool Bar.
Up trends are defined by a trend line that is drawn between two or more troughs
(low points) to identify price support within the trend. Down trends are defined by
trend lines that are drawn between two or more peaks (high points) to identify
price resistance within the trend.
Copyright © Charles Schwab & Co., Inc. 2006. All rights reserved. (0106-5667)
181
StreetSmart Pro User Manual
Regular
A regular trend line will allow you to draw a line
anywhere on the chart.
Snap To
Using a Snap to trend line, will place the trend line on
the open, high, low, or close of the trend being studied.
Fibonacci Studies
There are four popular Fibonacci studies: arcs, fans,
retracements, and time zones. The interpretation of
these studies involves anticipating changes in trends as
prices near the lines created by the Fibonacci studies.
StreetSmart Pro includes fan, arc, and retracement
studies.
Fibonacci Fan
Lines are displayed by drawing a trend line between two
extreme points, for example, a trough and opposing
peak. Then an "invisible" vertical line is drawn through
the second extreme point. Three trend lines are then
drawn from the first extreme point so they pass through
the invisible vertical line at the Fibonacci levels of 38.2%,
50.0%, and 61.8%
Fibonacci
Retracement
Lines are displayed by first drawing a trend line between
two extreme points, for example, a trough and opposing
peak. A series of nine horizontal lines are drawn
intersecting the trend line at the Fibonacci levels of
0.0%, 23.6%, 38.2%, 50%, 61.8%, 100%, 161.8%,
261.8%, and 423.6%. (Some of the lines may not be
visible because they will be off the scale.)
Fibonacci Arcs
This trend line separates the Fibonacci Arcs into a
separate view. The three arcs, which center on the last
point of the trend line you draw, help you identify where
support and resistance may affect the price as a stock
trends up or down. You can choose to show the
percentage labels by clicking Show Levels.
Best Fit
Regression
A Linear Regression trend line uses the least squares
method to plot a straight line through prices so as to
minimize the distances between the prices and the
resulting trend line.
Delete Selected
1. Click on the Trend line you wish to delete
2. Choose Delete Selected
Clear All Trend
Lines
Click to erase all trend lines.
Draw the Trend Line:
182
•
Once you have selected which Trend line to draw, left click at the spot on
the chart where the line should start.
•
Hold the mouse button down and move it across the chart to the end
Copyright © Charles Schwab & Co., Inc. 2006. All rights reserved. (0106-5667)
Charts
point for the line.
•
Release the mouse button.
Label the Trend Line:
•
From the New trend line box, go to the Label field.
•
Type the name or description as you want it to appear on the chart.
•
Click OK.
Color of the Trend Line:
•
From the New trend line box, click on the Color palette.
•
Select the color you would like to have displayed.
•
Click OK once to get back to the New trend line box, then click OK
again to apply the color.
! NOTE:
Once a Trend line has been drawn, it can be moved. Moving the trend
line is done by clicking on the line to modify and then either end of the line can be
adjusted to fit the slope of the line to the chart.
Copyright © Charles Schwab & Co., Inc. 2006. All rights reserved. (0106-5667)
183
STRATEGY TESTING TOOLS
185
StreetSmart Pro User Manual
Strategy Overview
Find out how you would have done in the market if you had used a
particular technical strategy. The Strategy Tester is our backtesting tool
that combines technical analysis strategies with historical market data
to help you make future trading decisions.
You can load results from the Strategy Tester into the Chart tool and
the Strategy Ticker® tool to help you find buy or sell opportunities in
real-time.
To open the Strategy Tester, click
in the Toolbar.
StreetSmart Pro® offers a comprehensive suite of tools that work in concert to
assist in providing a more user-friendly approach to technical analysis than is often
found in institutional trading software. If you use trading strategies based on
technical analysis principles or if you are interested in using back testing as part of
your stock selection process, the following tools aim to facilitate your efforts:
Strategy Center - At the heart of the Strategy tools is the Strategy Center, where
you create, save, and manage all the strategies you use in the Strategy tools. A
strategy consists of one or more indicators (such as a price crossover on Bollinger
Bands, Moving Average, Envelope, etc.) with an associated trade action (such as
Long Entry, Short Exit, etc).
The information you get from each strategy depends on what tool you apply it in.
For example, applying a strategy in the Strategy Tester tool or in a Chart will apply
the strategy for a certain period of time going backwards to see how well the
selected strategy would have performed historically for a stock or list of stocks.
Whereas in the Strategy Ticker and Strategy Matrix, the strategies are applied to
real-time data in order to flag occurrences of the selected strategy crossing
whatever threshold is set by the strategy.
The Strategy Center is accessible from any of the Strategy tools or from your
Charts.
186
Copyright © Charles Schwab & Co., Inc. 2006. All rights reserved. (0106-5667)
Strategy Testing Tools
Strategy Tester - Provides the ability to search through historical performance
results of back-tested technical strategies. It can help you identify the following:
•
Best performing Securities for a given Technical Strategy and Bar Size
•
Best performing combination of multiple Securities, Technical Strategies, and
Bar Sizes
•
Best 50 performing Technical Strategies for a Security and Bar Size
Stock symbols and price and volume data shown here and in the software are for
illustrative purposes only. Charles Schwab & Co., its parent or affiliates, and/or its
employees and/or directors may have positions in securities referenced herein, and
may, as principal or agent, buy from or sell to clients.
Charts - Visualize your back testing entry and exit points for individual positions in
your charts. The Charts tool has the same strategies available to it as the Strategy
Copyright © Charles Schwab & Co., Inc. 2006. All rights reserved. (0106-5667)
187
StreetSmart Pro User Manual
tools, and many of the studies in the Charts can be viewed in concert with the
corresponding Strategy to help you identify what triggered each trade.
EXAMPLE In the image below, we have a Bollinger Band study along with a
strategy utilizing a Bollinger Band indicator. You can see where the closing price of
any 15 minute bar crosses over the lower line, an entry is triggered, and where it
crosses above the top line, the position is exited.
Strategy Performance Details - For the historical testing tools like the Strategy
Tester and Charts, Performance Details provide a wealth of data for each stock and
strategy combination being tested. It not only summarizes all the data collected in
the process of the test, such as performance percentages, buy & hold performance
stats, winning/losing trade stats, hold times, etc., but it also breaks down each
execution, each round trip trade, and tracks equity history.
You can even change your Strategy Tester settings (i.e. changing the estimated
commission per trade, quantity per trade, initial equity, period for the test, etc.) to
see immediately how they affect the bottom line in the test.
188
Copyright © Charles Schwab & Co., Inc. 2006. All rights reserved. (0106-5667)
Strategy Testing Tools
Strategy Matrix™ - The Strategy Matrix tool lets you monitor technical strategies
for individual securities or indexes crossing thresholds specified by the strategies
being monitored.
Strategy Ticker® - The Strategy Ticker tool monitors the entire market and/or a
defined set of equity or index symbols in real-time for triggers against specific
technical strategies.
Once you have established one or more strategies to use in your trading, the
Strategy Ticker and Matrix tools will help identify opportunities based on those
strategies using real-time data.
Copyright © Charles Schwab & Co., Inc. 2006. All rights reserved. (0106-5667)
189
StreetSmart Pro User Manual
190
Copyright © Charles Schwab & Co., Inc. 2006. All rights reserved. (0106-5667)
Strategy Testing Tools
Strategy Center
STRATEGY CENTER OVERVIEW
The Strategy Center, which is accessible from any of the Strategy tools and the
Charts, is the heart of the Strategy suite of tools. It is the window in which you can
create, save, and manage all the strategies you use in the Strategy tools.
What is a Strategy?
A strategy consists of one or more indicators (such as a price crossover on Bollinger
Bands, SMA, Envelope, etc.) with an associated trade action (such as Long Entry,
Short Exit, etc).
The information you get from each strategy depends on what tool you apply it in.
For example, applying a strategy in the Strategy Tester or in a Chart will apply the
strategy for a certain period of time going backwards to see how well the selected
strategy would have performed historically for a stock or list of stocks.
Alternately, in the Strategy Ticker® and Strategy Matrix™, the strategies are
applied to real-time data in order to flag occurrences of the selected strategy
crossing whatever threshold is set by the strategy.
Using Strategies
You can apply strategies in several ways. Follow the links below to learn about each
approach:
•
Apply a built-in strategy
•
Create a new strategy, either based on a built-in strategy or from scratch
•
Edit a built-in or saved strategy and then apply it
To learn how to understand the results of running your strategies in any of the
Strategy Tools, click on the specific tool name below:
•
Strategy Tester
•
Charts
•
Strategy Matrix™
•
Strategy Ticker™
APPLYING BUILT-IN OR SAVED STRATEGIES
Several common strategies are provided with your software to get you started.
Using these at first can help you learn the tools as well as learn to create your own
strategies.
TIP: The following steps apply to any of the Strategy Tools. The only difference
is that the Chart window only allows one Strategy to be applied at a time, whereas
the other tools allow multiple strategies at once. Exceptions for this difference are
noted below.
1. In the strategy tool of choice, click Settings > Strategy Center... in the
menu (for Charts, click Tools > Strategy Center...)
Copyright © Charles Schwab & Co., Inc. 2006. All rights reserved. (0106-5667)
191
StreetSmart Pro User Manual
2. The Strategy Center opens showing a list of Available Strategies,
Selected Strategies (the strategies that are currently being used in that
tool), and buttons allowing you to manage these two lists:
3. To see what an individual strategy does, click on it and a description of the
strategy will display at the bottom of the window.
4. To apply the strategy, click the strategy in the Available Strategies list
and then click Add. The strategy will be added to the Selected Strategies
list (for Charts, click the strategy and check Show selected strategy on
chart).
5. Click OK to apply the changes to the tool.
6. Refer to the topics for each individual Strategy Tool to learn about the
information the strategy is returning:
•
Strategy Tester
•
Charts
•
Strategy Matrix™
•
Strategy Ticker®
EDITING BUILT-IN OR SAVED STRATEGIES
A good way to learn how strategies work and how to create your own is to start by
editing some of the built-in strategies. Follow the steps below to edit a built-in or
saved strategy:
1. Open the Strategy Center from the Settings menu of your Strategy tool or
the Tools menu of your Chart.
2. Click on a Strategy either in the Available Strategies or Selected
Strategies list.
192
Copyright © Charles Schwab & Co., Inc. 2006. All rights reserved. (0106-5667)
Strategy Testing Tools
3. Click the Edit button.
TIP: If you want to preserve the original built-in or saved strategy but
still build a new strategy based on the original, click Copy instead of Edit
and a copy of the original strategy will open with a new name (you may
want to change the name and Notes so they reflect the changes you are
making to the strategy).
4. The Edit Strategy window will open and look something like this:
EDIT STRATEGY FIELDS
Strategy
Name
Edit or enter the strategy name
Notes
An optional field. What you type here will be what displays
in the Notes field when you click on a strategy in the
Strategy Center. This field can be used to document the
description of the strategy.
Indicators
Lists the name(s) of the indicator(s) being used in the
strategy and the Trade Action they are indicating.
•
Click Add to apply another indicator to the strategy.
•
You can edit the period, deviation and other
indicator settings by clicking on the indicator and
then clicking Edit. This is also where you can
change how the trade indicators display in a chart.
•
Refer to Editing an Indicator to learn about the fields
in the Add/Edit Indicator window.
Multiple Indicators
Copyright © Charles Schwab & Co., Inc. 2006. All rights reserved. (0106-5667)
193
StreetSmart Pro User Manual
Money
Managemen
t
•
While it may simplify analysis to use one indicator at
a time (and then apply multiple strategies to the
tool), you can have more than one indicator per
strategy.
•
When using multiple indicators, the indicator at the
top of the list takes precedence over each one below
it, the second highest takes precedence over the
indicators below it and so forth.
•
Change the order of the indicators by clicking on the
indicator you wish to move and then clicking Move
Up or Move Down to change its position in the list.
Money Management tells the strategy to trigger a trade exit
based on a pre-determined Profit Exit, Stop Loss and/or
Trailing Stop percentage. If the Money Management criteria
are met, a Long Exit or Short Exit will trigger and the
strategy will start over by looking for Entry opportunities.
1. Click Add
2. Select Profit Exit, Stop Loss, or Trailing Stop
3. Set the %Gain or %Loss, and
4. Click OK.
To add two or more Money Management indicators, repeat
the steps above and select the remaining indicator.
On Back Test Assume: This option is only available with
the Trailing Stop Money Management indicator and allows
you to determine whether the test is based on more
conservative (Worst) or aggressive/positive (Best) back
test results.
More about On Back Test Assume
Because only bar data is used in back testing (i.e.
high/low/open/close) rather than tick data, the software
doesn't know in what order the high and low occurred. So,
to use the Trailing Stop Money Management function, the
software looks at two price action scenarios:
1. The Low occurs before the High
2. The High occurs before the Low
The software then labels the scenario that gives the most
profitable result as "Best" and the other one "Worst".
Chart
Settings
Connect Entry/Exit Points - A dashed line from the entry
to the exit point of each trade is displayed when this is
checked and the strategy is applied to a chart.
- Click to change the color of the dashed line.
5. When you are finished editing the strategy, click OK. This will return you to
the Strategy Center window.
CREATING NEW STRATEGIES
194
Copyright © Charles Schwab & Co., Inc. 2006. All rights reserved. (0106-5667)
Strategy Testing Tools
While several built-in strategies are available with your software and can be edited
to suit your needs, you may also create your own custom strategies.
1. Open the Strategy Center from the Settings menu of your Strategy tool or
the Tools menu of your Chart.
2. Click the New... button.
3. The New Strategy window will open and look something like this:
NEW STRATEGY FIELDS
Strategy
Name
Enter the strategy name
Notes
An optional field. What you type here will be what displays
when you click on the strategy in the Strategy Center. This
field can be used to document the description of the
strategy.
Indicators
Lists the name(s) of the indicator(s) being used in the
strategy and the Trade Action they are indicating.
•
Click Add to apply an indicator to the strategy.
•
You can edit the period, deviation and other
indicator settings by clicking on the indicator and
then clicking Edit. This is also where you can
change how the trade indicators display in a chart.
•
Refer to Editing an Indicator below to learn about
the fields in the Add/Edit Indicator window.
Multiple Indicators
Copyright © Charles Schwab & Co., Inc. 2006. All rights reserved. (0106-5667)
195
StreetSmart Pro User Manual
Money
Managemen
t
•
While it may simplify analysis to use one indicator at
a time (and then apply multiple strategies to the
tool), you can have more than one indicator per
strategy.
•
When using multiple indicators, the indicator at the
top of the list takes precedence over each one below
it, the second highest takes precedence over the
indicators below it and so forth.
•
Change the order of the indicators by clicking on the
indicator you wish to move and then clicking Move
Up or Move Down to change its position in the list.
Money Management tells the strategy to trigger a trade exit
based on a pre-determined Trailing Stop, Profit Exit, and/or
Stop Loss percentage. If the Money Management criteria
are met, a Long Exit or Short Exit will trigger and the
strategy will start over by looking for Entry opportunities.
1. Click Add
2. Select Profit Exit, Stop Loss, and/or Trailing
Stop.
3. Set the %Gain or %Loss, and
4. Click OK.
To add two or more Money Management indicators, repeat
the steps above and select the remaining indicator.
On Back Test Assume: This option is only available with
the Trailing Stop Money Management indicator and allows
you to determine whether the test is based on more
conservative (Worst) or aggressive/positive (Best) back
test results.
More about On Back Test Assume
Because only bar data is used in back testing (i.e.
high/low/open/close) rather than tick data, the software
doesn't know in what order the high and low occurred. So,
to use the Trailing Stop Money Management function, the
software looks at two price action scenarios:
1. The Low occurs before the High
2. The High occurs before the Low
The software then labels the scenario that gives the most
profitable result as "Best" and the other one "Worst".
Chart
Settings
Connect Entry/Exit Points - A dashed line from the entry
to the exit point of each trade is displayed when this is
checked and the strategy is applied to a chart.
- Click to change the color of the dashed line.
4. When you are finished creating the strategy, click OK. This will return you to
the Strategy Center window.
196
Copyright © Charles Schwab & Co., Inc. 2006. All rights reserved. (0106-5667)
Strategy Testing Tools
EDITING AN INDICATOR
From the Edit Strategy window, you can edit the individual indicators that comprise
a strategy.
A number of important settings are found here, each of which is described below:
EDIT INDICATOR FIELDS
Available
Indicators
Select an indicator from this set list of Available Indicators
and set the Period, Deviation, or any other variables that may
exist for the indicator.
TIP:
A description of each indicator displays near the
bottom of the window when you click on it.
Trade
Action
Chart
Display
Settings
Select which trade action types you want the indicator to flag.
•
Long Entry and Short Exit - If checked, will trigger when
a price or level cross takes place that, based on the
parameters of the selected indicator, may mean the stock
price is about to go up.
•
Long Exit and Short Entry - If checked, will trigger when
a price or level cross takes place that, based on the
parameters of the selected indicator, may mean the stock
price is about to go down.
Text Labels: Check the boxes to display labels showing the
Trade Action and/or Indicator Name when the Strategy is
applied to a chart.
Trade Action Pointer: Check to display an arrow pointing to
the exact price point at which the action takes place along the
bar or candlestick.
Directional Arrow: Check to display an up arrow when the
indicator parameters suggest an upturn in the stock price and a
Copyright © Charles Schwab & Co., Inc. 2006. All rights reserved. (0106-5667)
197
StreetSmart Pro User Manual
down arrow when the parameters suggest a downturn.
to change the color of the Text
Click the color wheel buttons
Labels, Trade Action Pointer, and Directional Arrow.
INDICATOR DESCRIPTIONS
Adaptive RSI (14) Price Cross
Strategy that enters long/exits short when the
trade price moves above the 14 period Adaptive
RSI and enters short/exits long when the trade
price falls below the 14 period Adaptive RSI.
Bollinger Bands (20, 2,
2) - Price Cross
Strategy that enters long/exits short when the
trade price moves above the lower band and
enters short/exits long when the price falls below
upper band on a 20 period BB with a deviation of
2.
DM(+DI) - DMI (-DI)
Cross
Strategy that enters long/exits short when the
DM(+DI) moves above the DM (-DI) and enters
short/exits long when the DM(+DI) falls below the
DM (-DI).
Envelope (21, 3%) Price Cross
Strategy that enters long/exits short when the
trade price moves above the lower band on a 21
period 3% Moving Average Envelope and enters
short/exits long when the price falls below upper
band.
MACD (12, 26) - SL (12,
26, 9) Cross
Strategy that enters long/exits short when the
(12, 26) period MACD moves above the 9 period
Signal Line and enters short/exits long when the
(12, 26) period MACD falls below the 9 period
Signal Line.
Money Flow % (20) Level (0) Cross
Strategy that enters long/exits short when the 20
Period Money Flow % moves above and enters
short/exits long when the 20 Period Money Flow
% falls below the zero (0) line.
Mov Avg - Exp (10) Exp (20) Cross
Strategy that enters long/exits short when the 10
period EMA moves above and enters short/exits
long when 10 period EMA falls below the 20
period EMA.
Mov Avg - Exp (20) Price Cross
Strategy that enters long/ exits short when the
trade price moves above the 20 period EMA and
enters short/exits long when the trade price falls
below the 20 period EMA.
Mov Avg - Exp (200) Price Cross
Strategy that enters long/ exits short when the
trade price moves above the 200 period EMA and
enters short/exits long when the trade price falls
below the 200 period EMA.
Mov Avg - Exp (50) Exp (200) Cross
Strategy that enters long/exits short when the 50
period EMA moves above and enters short/exits
198
Copyright © Charles Schwab & Co., Inc. 2006. All rights reserved. (0106-5667)
Strategy Testing Tools
long when 50 period EMA falls below the 200
period EMA.
Mov Avg - Exp (50) Price Cross
Strategy that enters long/ exits short when the
trade price moves above the 50 period EMA and
enters short/exits long when the trade price falls
below the 50 period EMA.
Mov Avg - Geo (10) Geo (20) Cross
Strategy that enters long/exits short when the 10
period GMA moves above and enters short/exits
long when 10 period GMA falls below the 20
period GMA.
Mov Avg - Geo (20) Price Cross
Strategy that enters long/ exits short when the
trade price moves above the 20 period GMA and
enters short/exits long when the trade price falls
below the 20 period GMA.
Mov Avg - Geo (200) Price Cross
Strategy that enters long/ exits short when the
trade price moves above the 200 period GMA and
enters short/exits long when the trade price falls
below the 200 period GMA.
Mov Avg - Geo (50) Geo (200) Cross
Strategy that enters long/exits short when the 50
period GMA moves above and enters short/exits
long when 50 period GMA falls below the 200
period GMA.
Mov Avg - Geo (50) Price Cross
Strategy that enters long/ exits short when the
trade price moves above the 50 period GMA and
enters short/exits long when the trade price falls
below the 50 period GMA.
Mov Avg - Sim (10) Sim (20) Cross
Strategy that enters long/exits short when the 10
period SMA moves above and enters short/exits
long when 10 period SMA falls below the 20
period SMA.
Mov Avg - Sim (20) Price Cross
Strategy that enters long/ exits short when the
trade price moves above the 20 period SMA and
enters short/exits long when the trade price falls
below the 20 period SMA.
Mov Avg - Sim (200) Price Cross
Strategy that enters long/ exits short when the
trade price moves above the 200 period SMA and
enters short/exits long when the trade price falls
below the 200 period SMA.
Mov Avg - Sim (50) Price Cross
Strategy that enters long/ exits short when the
trade price moves above the 50 period SMA and
enters short/exits long when the trade price falls
below the 50 period SMA.
Mov Avg - Sim (50) Sim (200) Cross
Strategy that enters long/exits short when the 50
period SMA moves above and enters short/exits
long when 50 period SMA falls below the 200
period SMA.
Mov Avg - Smo (10) -
Strategy that enters long/exits short when the 10
Copyright © Charles Schwab & Co., Inc. 2006. All rights reserved. (0106-5667)
199
StreetSmart Pro User Manual
Smo (20) Cross
period SmMA moves above and enters short/exits
long when 10 period SmMA falls below the 20
period SmMA.
Mov Avg - Smo (20) Price Cross
Strategy that enters long/ exits short when the
trade price moves above the 20 period SmMA and
enters short/exits long when the trade price falls
below the 20 period SmMA.
Mov Avg - Smo (200) Price Cross
Strategy that enters long/ exits short when the
trade price moves above the 200 period SmMA
and enters short/exits long when the trade price
falls below the 200 period SmMA.
Mov Avg - Smo (50) Price Cross
Strategy that enters long/ exits short when the
trade price moves above the 50 period SmMA and
enters short/exits long when the trade price falls
below the 50 period SmMA.
Mov Avg - Smo (50) Smo (200) Cross
Strategy that enters long/exits short when the 50
period SMA moves above and enters short/exits
long when 50 period SmMA falls below the 200
period SmMA.
RSI(14) - Level (70, 30)
Cross
Strategy that enters long/exits short when the 14
period Relative Strength Index moves above 30
and enters short/exits long when the 14 period
Relative Strength Index falls below 70.
Stoch %D (14, 3) Level (75, 25) Cross
Strategy that enters long/exits short when the
(14, 3) period %D moves above 25 and enters
short/exits long when the (14, 3) period %D falls
below 75.
Stoch %K (14) - %D
(14, 3) Cross
Strategy that enters long/exits short when the
(14) period %K moves above and enters
short/exits long when the (14) period %K falls
below the (14, 3) period %D.
Stoch RSI (14) - Level
(.75, .25) Cross
Strategy that enters long/exits short when the 14
period Stoch RSI moves below .75 and enters
short/exits long when the 14 period Stoch RSI
moves above .25.
Williams %R (14) Level (-25, -75) Cross
Strategy that enters long/exits short when the 14
period Williams %R moves below -25 and enters
short/exits long when 14 period Williams %R
moves above -75.
200
Copyright © Charles Schwab & Co., Inc. 2006. All rights reserved. (0106-5667)
Strategy Testing Tools
Strategy Tester
STRATEGY TESTER
Find out how you would have done in the market if you had used a
particular technical strategy. The Strategy Tester is our backtesting tool
that combines technical analysis strategies with historical market data
to help you make future trading decisions.
You can load results from the Strategy Tester into the Chart tool and
the Strategy Ticker® tool to help you find buy or sell opportunities in
real-time.
To open the Strategy Tester, click
in the Toolbar.
The Strategy Tester provides the ability to search through historical performance
results of back-tested technical strategies. It can help you identify the following:
•
Best performing Securities for a given Technical Strategy and Bar Size
•
Best performing combination of multiple Securities, Technical Strategies and
Bar Sizes
•
Best 50 performing Technical Strategies for a Security and Bar Size.
Stock symbols and price and volume data shown here and in the software are for
illustrative purposes only. Charles Schwab & Co., its parent or affiliates, and/or its
employees and/or directors may have positions in securities referenced herein, and
may, as principal or agent, buy from or sell to clients.
Testing a Strategy
To test a strategy against one or more symbols:
1. Click Settings > Strategy Center to open the Strategy Center window.
Copyright © Charles Schwab & Co., Inc. 2006. All rights reserved. (0106-5667)
201
StreetSmart Pro User Manual
2. Click on a strategy (notes with a description of each will appear at the
bottom of the window when clicked) and click Add. Repeat to add multiple
strategies.
3. If you wish to edit the strategy, you may also do this from the Strategy
Center.
4. Click OK to apply the strategy(ies).
Next, you will need to add the symbol(s) to test against.
1. Click Settings > Symbol List.
2. Add the symbol(s) to the list by typing the symbol and clicking Add, or by
loading a saved stock list by clicking Load List.
3. Click OK when you are satisfied with you Symbol List.
Now, you need to set up the parameters for the test:
1. Click Settings > Bar Sizes. The Bar Size, combined with the Number of
Bars to Test in the Back Test Settings (see below) determine the period for
which the test is executed.
2. Check one or more bar sizes. For scalping and other fast turnaround
techniques, a 5 Min bar size would be more appropriate, whereas a Daily
bar size would be better for someone with a longer term focus in their
trading. A separate test will be run for each bar size selected.
3. Click OK, and you should begin to see some data in your Strategy Tester if
you haven't already.
4. Finally, click Settings > Back Test.
5. Choose the desired Back Test Settings for the test:
BACK TEST SETTINGS
Number of Bars
for Test
This is used along with the Bar Size to determine
how far back to test and how frequently the price is
updated over that period.
EXAMPLE If Bar Size = 5 Min and Number of
Bars to Test = 100, the test will cover the last 500
minutes and base the test on the last trade price at
the end of each 5 minute interval.
Initial Equity
Choose from $10,000, $50,000, or $100,000 as
the "play money" being used in the test.
When the first trade is placed in the test, it will start
with the initial equity amount. Then, as trading
continues, your equity will increase or decrease
depending on the success of the trades.
Best
Performance
Determination
Your selection here will determine the initial sort
order of the list upon running the test.
APR% - Annual Percentage Rate. This value is
reached by multiplying a year (365 days) by the
Performance % and then dividing by the number of
days in the simulation. Simple interest used.
Sharpe Ratio - Risk adjusted profitability for the test
time period. $IRX will be used for the Risk Free Rate
202
Copyright © Charles Schwab & Co., Inc. 2006. All rights reserved. (0106-5667)
Strategy Testing Tools
of Return in the Sharpe formula.
Total Profit - Total Profit or Loss (includes open
positions)
Quantity per
Trade
Select how many shares or contracts to trade each
time a trade is triggered.
Equities - Choose from 100 Shares, 1000 Shares,
10% of Available Equity, or $5,000.
Commission per
Enter an approximate commission amount if you
want to factor that into your P&L.
TIPS:
•
Keep strategy/symbol/bar size combinations simple while you are learning to
use the tool so that you avoid getting frustrated by information overload.
Start by testing one symbol against a few strategies (or vice versa) and
selecting only one or two bar sizes at a time.
•
When establishing Back Test settings for a strategy being used in a Chart,
this setting will not be available. The "Bar Size" and “Number of Bars for
Test” is effectively the same thing as the Interval and the Range in the Chart
settings.
STRATEGY TESTER COLUMN DESCRIPTIONS
The following columns are available in the Strategy Tester window. To learn how to
configure columns, refer to Configuring Strategy Tester Columns.
STRATEGY TESTER COLUMNS
Symbol
Symbol for security
Strategy
Name of Technical Strategy
Bar Size
Time length of bar (e.g., 5 Min, 60 Min, Daily, etc.)
Closed P&L
Total profit or loss for closed positions
Open P&L
P&L from positions still open at the end of the test
Performance
%
A percentage measure of how much profit or loss the system
generated based on its initial equity
Performance % = ( Profit $ + Open P&L $) / Initial Equity($) *
100%
APR %
Annual Percentage Rate. This value is reached by multiplying
a year (365 days) by the Performance % and then dividing by
the number of days in the simulation. Simple interest used.
APR % = (365 * Performance %) / Days in test
Buy & Hold
P&L
Profit from a buy and hold strategy. Buy at beginning of test
and hold.
Buy & Hold
Performance
%
A percentage measure of how much profit or loss the a buy
and hold strategy would of generated based on its initial
equity.
Copyright © Charles Schwab & Co., Inc. 2006. All rights reserved. (0106-5667)
203
StreetSmart Pro User Manual
(Buy & Hold P&L/Initial Equity) * 100
Buy & Hold
APR %
Annual Percentage Rate for buy and hold strategy. This value
is reached by multiplying a year (365 days) by the Buy & Hold
Performance % and then dividing by the number of days in
the simulation. Simple interest used.
Buy & Hold APR % = (365 * Buy & Hold Performance %) /
Days in test
Sharpe Ratio
Risk adjusted profitability for the test time period. $IRX will be
used for the Risk Free Rate of Return in the Sharpe formula.
Winning
Trades
The total number of trades that made money, excluding open
positions.
Losing
Trades
The total number of trades that lost money, excluding open
positions.
Trade Profit $ Total profit from all profitable trades, excluding open
positions.
Trade Loss $
Total loss from all losing trades, excluding open positions.
Final Equity $ Ending equity from test (includes equity in open positions).
Highest
equity
balance
Highest amount of cash + position(s) value
Lowest
equity
balance
Lowest amount of cash + position(s) value
Note: Calculation is based on closing price of each bar and
includes open positions.
STRATEGY TESTING IN CHARTS
See a graphical representation of your Strategy Tester results in a
chart. View the entry and exit points the strategy identifies and
instantly see if the stock really did move up or down.
To set up, click Tools > Strategy Center in the Chart menu.
The image below shows long entry and exit points based on the Bollinger Band
strategy, which was applied to the chart.
204
Copyright © Charles Schwab & Co., Inc. 2006. All rights reserved. (0106-5667)
Strategy Testing Tools
Stock symbols and price and volume data shown here and in the software are for
illustrative purposes only. Charles Schwab & Co., its parent or affiliates, and/or its
employees and/or directors may have positions in securities referenced herein, and
may, as principal or agent, buy from or sell to clients.
The strategy testing tools available in the Strategy Tester window are also available
here in the Chart window:
•
From the Settings > Back Test... menu, you can change the settings for
the back test, such as commissions, quantity per trade, and initial equity.
Refer to Back Test Settings to learn about each of those settings.
TIP: When establishing Back Test settings for a strategy being used in a
Chart the "Bar Size" and “Number of Bars for Test” is effectively the same
thing as the Interval and the Range in the chart Settings > General.
•
From the Tools menu, you have access to:
Strategy
Center...
Open the Strategy Center to apply a strategy to the
chart. You can also edit or create a new strategy from
the Strategy Center.
To add a strategy to the chart, click on the strategy in
the Available Strategies list and check Show
selected strategy on chart.
Edit Strategy...
Opens the Edit Strategy window for the strategy
currently applied to the chart.
Show Strategy
Once an initial strategy has been applied to the chart,
you can use Show Strategy to hide or show the
strategy on the chart.
Copyright © Charles Schwab & Co., Inc. 2006. All rights reserved. (0106-5667)
205
StreetSmart Pro User Manual
Strategy
Performance
Details...
206
The Strategy Performance Details window breaks down
the details and statistics of the strategy being tested in
the Chart window.
Copyright © Charles Schwab & Co., Inc. 2006. All rights reserved. (0106-5667)
Strategy Testing Tools
Strategy Performance Details
STRATEGY PERFORMANCE DETAILS
The Strategy Performance Details window breaks down the details and
statistics of a strategy test. It is available in both the Strategy Tester
and Chart windows.
To view, click Settings > Back Test in the Strategy Tester.
The Strategy Performance Details window has 5 tabs, each described below. Click
on the tab names to view a description of the fields in each tab window.
Performance Summary - A total breakdown of the details of the test as a whole.
Stock symbols and price and volume data shown here and in the software are for
illustrative purposes only. Charles Schwab & Co., its parent or affiliates, and/or its
employees and/or directors may have positions in securities referenced herein, and
may, as principal or agent, buy from or sell to clients.
Executions - A list of each execution sorted chronologically, including information
about the type of trade and which strategy triggered the trade.
Copyright © Charles Schwab & Co., Inc. 2006. All rights reserved. (0106-5667)
207
StreetSmart Pro User Manual
Trades - Shows each round trip trade, entry/exit time and price, gross and net
P&L, etc.
Equity History - Tracks your starting equity chronologically, as well as indicating
where commissions were applied.
Settings - Shows a summary of the settings used in the test.
208
Copyright © Charles Schwab & Co., Inc. 2006. All rights reserved. (0106-5667)
Strategy Testing Tools
You can also change the Back Test settings from the Performance Details window to
see how having a different starting equity or trade quantity, or adding commissions
to the cost of the trades, will affect the outcome of the test. Click Settings > Back
Test in the Performance Details menu to configure those settings.
Strategy testing past performance data should not be construed as indicative of
future results.
PERFORMANCE DETAIL DESCRIPTIONS
Following are descriptions of the fields in the Strategy Performance Detail tabs:
PERFORMANCE SUMMARY
Symbol
Symbol for security
Strategy
Name of Strategy
Test
Date/Time
When the test was run
Bar Size
Time length of bar (e.g., 5 Min, 60 Min, Daily, etc.)
Back Test Bars
Maximum number of bars for which the test was run
Start
Date/Time
Date and time of the first bar of the test
End Date/Time
Date and time of the last bar of the test
Closed P&L
Total profit or loss from closed positions
Open P&L
Profit or loss on open positions at the end of the test
Performance
%
A percentage measure of how much profit or loss the
system generated based on its initial equity
Performance % = ( Profit $ + Open P&L $) / Initial Equity($)
* 100%
Copyright © Charles Schwab & Co., Inc. 2006. All rights reserved. (0106-5667)
209
StreetSmart Pro User Manual
APR %
Annual Percentage Rate. This value is reached by
multiplying a year (365 days) by the Performance % and
then dividing by the number of days in the simulation.
Simple interest used.
APR % = (365 * Performance %) / Days in test
Buy & Hold
P&L
Profit from a buy and hold strategy. Buy at beginning of test
and hold.
Buy & Hold
Performance
%
A percentage measure of how much profit or loss the a buy
and hold strategy would of generated based on its initial
equity.
(Buy & Hold P&L/Initial Equity) * 100
Buy & Hold
APR %
Annual Percentage Rate for buy and hold strategy. This
value is reached by multiplying a year (365 days) by the
Buy & Hold Performance % and then dividing by the number
of days in the simulation. Simple interest used.
Buy & Hold APR % = (365 * Buy & Hold Performance %) /
Days in test
Sharpe Ratio
Risk adjusted profitability for the test time period. $IRX will
be used for the Risk Free Rate of Return in the Sharpe
formula.
Total Trades
Total number of trades entered and exited. Does not
include a trade entered at the end and not yet exited.
Winning
Trades
The total number of trades which made money, excluding
open positions.
Winning Longs
Number of winning long trades, excluding open positions.
Winning Shorts Number of winning short trades, excluding open positions.
Most
Consecutive
Winning
Most consecutive winning trades, excluding open positions.
Average
Winning Hold
Time
Average number of bars for which a winning position was
held
Total Winning
Hold time
Total number of bars in a winning position
Average
Winning Profit
$
Average profit from winning trades
Maximum
Profit $
Maximum profit from a winning trade
Lowest
Winning Profit
$
Lowest profit from a winning trade
Losing Trades
The total number of trades which lost money, excluding
open positions.
210
(Total Winning Hold Time/Winning Trades)
Copyright © Charles Schwab & Co., Inc. 2006. All rights reserved. (0106-5667)
Strategy Testing Tools
Losing Longs
Number of losing long trades, excluding open positions.
Losing Shorts
Number of losing short trades, excluding open positions.
Average Loss $
Average loss from losing trades
Maximum Loss
$
Maximum loss from a losing trade
Lowest Loss $
Lowest $ loss from a losing trade
Average Losing Average number of bars for which a losing position was held
Hold Time
Most
Consecutive
Losing
Most consecutive losing trades, excluding open positions.
Average
Profit$/Averag
e Loss$
Ratio of average $ profit from winning trades divided by
average $ loss from losing trades.
Total Losing
Hold Time
Total number of bars in a losing position
Out of Market
Average
Average number of bars out of the market
Out of Market
Maximum
Maximum number of bars out of the market
Out of Market
Total
Total number of bars out of the market
Initial Equity
Initial equity used in test
Trade Profit $
Total profit from all profitable trades
Trade Loss $
Total loss from all losing trades
Commissions $
Total commissions paid in test
Final Equity $
Ending equity from test (includes equity in open positions)
Open Position
$
The dollar value for any position still open at the end of the
test
Highest Cash
Balance $
Highest amount “cash” in account.
Lowest Cash
Balance $
Lowest amount “cash” in account
Highest
Position Value
$
The most your open positions were worth simultaneously
during the test
Highest Open
Drawdown $
The largest equity dip (relative to the initial investment)
based on open position
Highest Closed
Drawdown $
The largest equity dip (relative to the initial investment)
based on closed out position.
Highest Equity
Balance $
Highest amount of cash + position(s) value
Copyright © Charles Schwab & Co., Inc. 2006. All rights reserved. (0106-5667)
211
StreetSmart Pro User Manual
Lowest Equity
Balance $
Lowest amount of cash + position(s) value
EXECUTIONS
Number
Shows when this order happened, consecutively. If this
number is 4, this order was the fourth order to happen in
the test.
Bar
Indicates on what bar the activity occurred, based on the
first date of the date range used when the simulation was
run.
EXAMPLE If this number is 6, the corresponding activity
happened on the sixth bar of the tested data.
Date and Time
Tells you the date and time when the activity occurred.
Type
Lists the type of order executed. Types include Buy,
Short, Indicator Exit, Profit Exit, and Stop Loss.
Trade Size
Indicates how many shares/contracts were executed.
Price
Shows the execution price of any order type if the order is
being executed.
Order Trigger
What initiated the order. Possible sources are Strategies,
Profit Exits, or Stop Losses.
TRADES
Position #
Tells you when the position was established,
consecutively.
Entry Bar
This number indicates on what bar the position was
established.
Entry Date and
Time
Tells you the date and time when the position was
established.
Entry Price
Price at which position was established.
Exit Bar
This number indicates on what bar the position was
exited.
Exit Date and
time
Tells you the date and time when the position was exited.
Exit Price
Price at which position was exited.
Bars
Number of bars between trade entry and exit
Trade Size
Number of shares/contracts of the position
Gross Profit /
Loss $
Profit or loss before commissions
Net Profit / Loss
$
Net profit or loss after commissions
Commission $
Commission paid on position
212
Copyright © Charles Schwab & Co., Inc. 2006. All rights reserved. (0106-5667)
Strategy Testing Tools
EQUITY HISTORY
Bar
The bar in the test that corresponds to the rest of the
information on that row.
Date/Time
The date and time on which the bar and its equity account
information occurred.
Cash
The cash balance
Overdraft
If the account is overdrawn, the amount below zero
appears here.
Position
The value of any position. (will be calculated using the
close price of each bar.)
Commissions
How much money was paid in commissions for this bar.
Total Equity
The value of the entire equity (cash+position) account at
the end of this bar.
SETTINGS
Initial Equity
The initial amount of equity at the start of the test
Trade Size
How position sizes where calculated. Can be as % of
equity, # of shares, or total transaction cost.
Strategy
Name of Strategy used for test
Strategy
Description
Detailed description of the strategy
Indicator #1...
Trade Exit
•
Name - Name of the indicator(s) used for the test
•
Trade Action - Actions selected for the test, such as
Long Entry, Long Exit, Short Entry, etc.
•
Profit Exit - Percent value gain at which the whole
position is closed for profit
•
Stop Loss - Percent value at which a stop loss is
triggered to close the position.
Bar Size
Time length of bar (e.g., 5 Min, 60 Min, Daily, etc.)
Back Test Bars
Number of bars for which the test was run (e.g., 100
bars)
Commissions
(Equities)
Per trade commission value (based on the Back Test
Settings)
Sharpe Ratio
Risk Free
Interest Rate
% used in Sharpe Ratio calculation. $IRX value at the
beginning of the back test period will be used in this
calculation.
Copyright © Charles Schwab & Co., Inc. 2006. All rights reserved. (0106-5667)
213
StreetSmart Pro User Manual
Strategy Ticker
STRATEGY TICKER®
The Strategy Ticker tool can continuously scans the entire market for
securities and indexes that meet pre-defined technical analysis
parameters.
Instead of watching only a few charts with a few studies, the Strategy
Ticker tool can monitor large quantities of data for all NASDAQ and
NYSE/AMEX stocks, indexes, and/or a user defined symbol list.
To open the Strategy Ticker, click Tools > Start Tool in the main menu and
select Strategy Ticker.
You select the strategy and time period the Strategy Ticker tool bases its scans on,
and it returns a real-time, streaming list of securities and indexes as predefined
strategy signals are generated.
The technical strategies available are similar to studies or combinations of studies
in Charts but are programmed to display a notification in the Strategy Ticker
window of a possible upward trend or downward trend based on selected
strategies.
Stock symbols and price and volume data shown here and in the software are for
illustrative purposes only. Charles Schwab & Co., its parent or affiliates, and/or its
employees and/or directors may have positions in securities referenced herein, and
may, as principal or agent, buy from or sell to clients.
There are several ways you can customize the window to monitor for what best fits
your trading strategy:
•
You select whether to monitor some or all of NASDAQ, NYSE/AMEX, and/or
Index symbols
•
You can define your own or select from the 30+ pre-built strategies that you
wish to monitor.
•
You can choose what bar sizes you want considered.
•
You can filter out securities and indexes above or below a certain price, as
well as securities and indexes whose five day average volume is below a
certain amount.
214
Copyright © Charles Schwab & Co., Inc. 2006. All rights reserved. (0106-5667)
Strategy Testing Tools
•
Finally, you can select from up to 15 columns of data to display in your
Strategy Ticker window.
TIP: Strategy Notes
To view the Notes/description of the strategy signal generated, right-click
on a row and select Strategy Notes.
STRATEGY TICKER® MENU BAR
FILE
Load Stock List
Selecting this feature will allow you to load a previously
saved Stock List into your Strategy Ticker.
Save Stock List
As
Selecting this feature will allow you to save your current
stock list to a file on your computer, which you can load
later.
Clear Stock List
Unloads the current Stock List leaving you with a blank
Strategy Ticker window. This enables you to start a new
Stock List from scratch (see Symbol List below for more
info on adding and deleting symbols).
Page Setup
Enables you to customize the current page for printing.
Read the Printing Windows topic in the Getting Started
section for more information.
Print
Prints the current stock list.
Export
Saves the current stock list to a text (.txt) file in your
SSPro folder, which can then be opened in Excel or other
third-party software.
0, 1, 2, 3...
Strategy Ticker will remember the last 9 files that have
been opened. To toggle between files, click on any of
them. This will be faster than going into the Symbol List
option.
Close
Closes the Strategy Ticker window.
Copyright © Charles Schwab & Co., Inc. 2006. All rights reserved. (0106-5667)
215
StreetSmart Pro User Manual
SETTINGS
General
Symbol
List
•
Securities: Select one or all security types to monitor:
NASDAQ, NYSE/AMEX, Indexes, or a Symbol List.
•
Bar Size: Select the bar size you want used (i.e., 5
Minutes, 15 Minute, Daily, etc.
•
Generate Signals at: To generate signals at the closing
price of the bar, select End of Bar. Otherwise, select Intrabar to generate signals within the timeframe of the bar.
Adding Symbols:
1. Click Settings > Symbol List.
2. In the Symbol List window type in the stock or index
3. After typing each, press Enter on your keyboard or click
the Add button
4. After all the stocks and indices have been entered, click
OK.
Saving a Symbol List:
1. Click File > Save Stock List As...
2. In the Save window that appears, type in the file name
you would like to save the list as, then click Save.
216
Copyright © Charles Schwab & Co., Inc. 2006. All rights reserved. (0106-5667)
Strategy Testing Tools
Strategy
Center
Select the Strategies you wish to monitor. Click on any strategy
to view its description at the bottom of the window.
To add a strategy to the Selected Strategies list, click on it in the
Available Strategies list and click the Add button.
To remove a strategy from the Selected list, click on it and then
click the Remove button.
Copyright © Charles Schwab & Co., Inc. 2006. All rights reserved. (0106-5667)
217
StreetSmart Pro User Manual
Filters
Price Range
The Price Range filter allows you to set the price level below
which, and above which, a security or index will be ignored.
Click on the arrow buttons provided to increase or decrease the
prices within the Ignore Below and Ignore Above settings. Prices
are based on yesterday's close. The minimum "below" setting is
$1 and the maximum "above" setting is $1000.
Five Day Avg Volume Filter
To ignore securities or indexes with a five day average volume
below a certain value, use the up and down arrows to specify
that value.
218
Copyright © Charles Schwab & Co., Inc. 2006. All rights reserved. (0106-5667)
Strategy Testing Tools
Columns
Visible Columns:
•
Trend – Green up arrow for possible uptrend, red down
arrow for possible downtrend
•
Price – Price at which the signal was generated
•
Technical Strategy – Name of the strategy that
generated the notification
•
Bar Size – Size of each bar used for which the signal was
generated (i.e. 5 Minute, 10 Minute, 15 Minute, 30
Minute, 60 Minute, or Daily)
•
Time – Date and time the signal was generated
•
20 Day Avg Volume – Average volume for the security
over the last 20 days
•
5 Day Avg Volume – Average volume for the security
over the last 5 days
•
Open* – Point change in the security’s price since the
Open
•
Close* – Point change in the security’s price since the
previous Close
•
Open* (%) – Percentage in price change in the
security’s price since the Open
•
Close* (%) – Percentage in price change in the
security’s price since the Close price
•
Profit Exit - When the strategy has a Money
Management Profit Exit % indicator defined, a
hypothetical Profit Exit is calculated based on the price at
the time of the signal. If the trend is Up, the percentage
will be added to the price. If Down, it will be subtracted.
•
Stop Loss - When the strategy has a Money Management
Stop Loss % indicator defined, a hypothetical Stop Loss is
calculated based on the price at the time of the signal. If
the trend is Up, the percentage will subtracted from the
price. If Down, it will be added.
Hide Column Header: Check the box to hide the column
names.
Colors
Change color settings with this option.
Fonts
Change font settings with this option.
Copyright © Charles Schwab & Co., Inc. 2006. All rights reserved. (0106-5667)
219
StreetSmart Pro User Manual
Strategy Matrix
STRATEGY MATRIX
The Strategy MatrixTM tool lets you monitor technical strategies for
individual securities or indexes.
It monitors the specified security or index for each period to see where
that security or index may meet the pre-defined parameters for each
technical strategy.
To open the Strategy Matrix, click Tools > Start Tool in the main menu and
select Strategy Matrix.
Rather than being limited to monitoring only a few studies for a single period length
as you would if you watch the chart, the Strategy Matrix tool can sift through large
quantities of data to provide immediate feedback across a broad range of periods
and strategies.
You select the technical strategy and time periods the Strategy Matrix tool displays,
and it displays in real-time whether each strategy over each period length meets
the pre-defined technical analysis parameters. The technical strategies available
are similar to studies or combinations of studies in Charts but are programmed to
display a possible upward or downward trend based on selected strategies.
An Up means a possible upward trend and Down means a possible downward
trend.
Stock symbols and price and volume data shown here and in the software are for
illustrative purposes only. Charles Schwab & Co., its parent or affiliates, and/or its
employees and/or directors may have positions in securities referenced herein, and
may, as principal or agent, buy from or sell to clients.
There are several ways you can customize the window to monitor for what best fits
your trading strategy:
•
You select which security or index to monitor.
•
You can define your own or select from the 30+ pre-built strategies that you
wish to monitor.
220
Copyright © Charles Schwab & Co., Inc. 2006. All rights reserved. (0106-5667)
Strategy Testing Tools
•
You can choose what bar sizes you want considered.
•
You select the earliest date from which you wish to get technical analysis for
the security, and any data older than that date will be changed to N (None).
TIPS:
•
Strategy Notes
To view the notes/description of the strategy, right-click on the Up or Down
flag and select Strategy Notes.
•
Info
Click on a trend flag (Up or Down) to open a window showing information
about the last time that signal was triggered.
STRATEGY MATRIX MENU BAR
FILE
Page
Setup
Enables you to customize the current page for printing. Read
the Printing Windows topic in the Getting Started section for
more information.
Print
Select to print the Strategy and Bar data displayed in the
window
Export
Select to export to a tab-delimited text file
Close
Closes the Strategy Matrix window
SETTINGS
General
Select the earliest date from which you wish to get technical
analysis for the security.
Copyright © Charles Schwab & Co., Inc. 2006. All rights reserved. (0106-5667)
221
StreetSmart Pro User Manual
Strategy
Center
Select the Strategies you wish to monitor.
Click on any strategy to view its description at the bottom of the
window.
To add a strategy to the Selected Strategies list, click on it in the
Available Strategies list and click the Add button.
To remove a strategy from the Selected list, click on it and then
click the Remove button.
Columns
Check the period length (bar size) columns that you wish to view
in the Strategy Matrix window.
Colors
Change color settings with this option.
Fonts
Change font settings with this option.
222
Copyright © Charles Schwab & Co., Inc. 2006. All rights reserved. (0106-5667)
ACCOUNT DETAIL & ALERTS
223
StreetSmart Pro User Manual
Account Detail Overview
The Account Detail window puts all your account-specific information in one
convenient location. This window gives you six tabs with streaming, real-time data:
•
Order Status
•
Saved Orders
•
Alerts
•
Balances
•
Positions
•
Transactions
Stock symbols and price and volume data shown here and in the software are for
illustrative purposes only. Charles Schwab & Co., its parent or affiliates, and/or its
employees and/or directors may have positions in securities referenced herein, and
may, as principal or agent, buy from or sell to clients.
The Account Detail window automatically opens when you log on to the software
and closes when you log off. If you are not interested in viewing this information,
this window can be minimized to increase available screen real estate.
If you minimized this window and want to quickly open it:
1.
Click on Tools in the Main menu.
2.
Select Find Active Tool > Account Detail.
224
Copyright © Charles Schwab & Co., Inc. 2006. All rights reserved. (0106-5667)
Account Detail & Alerts
Account Detail Menu
Right-click in the Account Detail window and select Show Menu Bar to access the
following options.
FILE
Page Setup
Enables you to customize the current page for printing. Read
the Printing Windows topic in the Getting Started section for
more information.
Print
Prints the current page of the Account Detail
Export
To save the data on a particular page into a text (.txt) file for
use in Excel or other programs, click on the tab whose data you
wish to export and select Export from the File menu
VIEW
Positions
When selected, a new window will pop up that is populated with
your account positions. This window is similar to the My
Positions watch List, but with only four columns; Symbol, Price,
Quantity, and Change.
•
The Symbol column displays the security symbols of the
positions in your account.
•
The Price column displays the last trade or closing price of
the security.
•
The Quantity column displays the quantity of shares held
of each position.
•
The Change column displays the net change of the
security from either yesterday's closing price or today's
opening price. The default is Change from Close, but can
be switched to Change from Open by going to the Account
Detail window Settings > General.
Within this window, there are three pull-down menu options:
File: Allows you to either print or close the window.
Settings: Allows you to change the following General Settings
of the window:
•
Display the Change column in either Text or Graphical
format. Text displays the numerical change from open or
close. Graphical displays the Change column as a
horizontal graph bar, with negative change displayed on
the left in red, no change as a magenta dash on the
middle dividing line, and a positive change on the right in
green.
•
When Graphical Display format has been selected, you
can change the Graph Settings fields. Unit Increment
determines the point change that the vertical lines
Copyright © Charles Schwab & Co., Inc. 2006. All rights reserved. (0106-5667)
225
StreetSmart Pro User Manual
represent. Unit Width determines the number of pixels
between each vertical line.
•
When checked, the Auto Sorting checkbox will
automatically sort the column based upon the column you
have clicked on.
•
The Data option allows you to display the change column
in either Point Gain or % Point Gain.
Position: Allows you to place a closing trade for the selected
security.
Messages
Check Messages for the status of your orders and their
execution, as well as information about alerts and the market in
general.
! NOTE:
Because error messages are displayed in this window,
it’s important to keep it open at all times.
You can:
- Scroll up or down to review all activity that has occurred during
the current trading session.
- Check the status of an order placed during your current logon
session.
- See why an order might have been rejected.
- Get color-coded order status:
•
White - Current session settings and added Alert details.
•
Black - Market session opening and closing information.
•
Blue - Any messages related to orders.
•
Black with yellow highlight - When an alert is
triggered.
SETTINGS
General
Calculate Change from Open: Allows you to view your
positions as either a change from open or change from close.
The default setting for account positions is a change from the
previous day’s close.
Order Cancel Confirmation: If checked, the software will ask
for confirmation before canceling an order. This setting is active
only if you have turned off Order Verification in the Trading
Window Settings > General > Orders tab.
Fonts
Use this option to change the Account Detail font settings.
Colors
Use this option to change the Account Detail colors.
Sounds
To activate the Sound Alert option you must have a sound card
and speakers. The system will alert at the following instances:
Log On, Log Off, Live order entered, Order filled, and
Order Canceled. Click Browse to find .wav files to use.
Windows comes with several .wav files, and you may also
226
Copyright © Charles Schwab & Co., Inc. 2006. All rights reserved. (0106-5667)
Account Detail & Alerts
download audio files from the internet or other sources. This
software does not come with any .wav files.
Conditional Orders that are triggered and eventually filled will
sound both the Live order entered and Order filled Sound
Alerts (if you have selected sounds for these actions), as well as
any sound alerts included as part of the action of the conditional
order.
ALERTS (Refer to the Alerts topic for more detailed information about Alerts)
Load
Allows you to load saved Alert (*.alr) files
Save All As
Allows you to save the alerts in your Alert tab to a file
New
Click to begin creating a new alert. See Adding an Alert
for detailed instructions
Edit
Click on the alert you wish to edit and then click Edit.
The Edit Alert window will open allowing you to make
changes. Click OK when you are finished.
Remove Selected
Click on the alert you wish to remove and click Remove
Selected. The alert will be removed from your Alerts
tab. Removing an alert will delete it from the system.
Remove All
Removes all alerts in the Alerts tab and permanently
deletes them.
Activate/Deactivate Alerts that you want readily available but not
Selected
necessarily active (live) all the time can be set to
Inactive when they are not in use. Click on an alert and
select Activate Selected or Deactivate Selected
depending on the status you want for that alert.
Activate All
Makes all alerts in the Alerts tab active so that they will
fire if their conditions are met.
Deactivate All
Makes all alerts in the Alerts tab inactive so that none
of them will fire regardless of whether the condition is
met (until they are made Active again).
Templates
The Alert Templates feature allows you to create alert
"shells" containing the variables that you use all the
time. Once established these can be quickly completed
to fit a specific situation and activated from windows
such as the Watch Lists, Charts, etc. See Applying Alert
Templates for detailed information
ORDER STATUS (only visible when Order Status tab is selected)
Cancel
Cancels a live order from the Account Detail. (Only appears if an
order is currently Live.)
Change Allows you to change the order you highlighted. Not all orders can be
changed, see Changing or Canceling Orders for more information.
Details
Allows you to view full details of the order you have highlighted,
including partial fills.
Copyright © Charles Schwab & Co., Inc. 2006. All rights reserved. (0106-5667)
227
StreetSmart Pro User Manual
POSITIONS (only visible when Positions tab is selected)
Close
Allows you to place an order to close the position you
highlighted.
Adjust Cost
Click on a Position in the Account Detail and select Adjust Cost
to change the dollar amount paid or received for that position.
That adjusted number will be used as a basis for calculating
the average share cost for any additional purchases and sales.
TRANSACTIONS (only visible when Transactions tab is selected)
Update
228
Allows you to view specific account transactions up to 90 days
old. See Transactions for more information.
Copyright © Charles Schwab & Co., Inc. 2006. All rights reserved. (0106-5667)
Account Detail & Alerts
Messages Window
MESSAGES
By clicking View > Messages in the Account Detail menu, you can view streaming
order status in the Messages window for the current day only. If you log off and
back on multiple times during the day, all messages for the previous session(s) will
display in gray.
The Messages Window provides useful information about your software settings,
order status information, alert messages, and market session information. If you
make any changes to your software settings, these changes will also be noted in
the Messages Window.
The streaming data displayed includes:
•
New Order Accepted
•
Orders Filled
•
Nothing Done / Out
•
Alerts & Conditional Order Events
•
Change Order
•
Cancel Accepted
As the Messages Window provides you with real-time information not always
available in other parts of the application, we recommend leaving your Messages
Window open while logged on.
TIP: Printing Data From the Messages Window
A copy of your log files is maintained in the SSPro folder on your C: drive
for each day you log in to the software. These files can printed in text
format. Please note that Schwab retains the official copy of these logs.
To print data directly from the Messages window before logging off, go to
File > Print.
Copyright © Charles Schwab & Co., Inc. 2006. All rights reserved. (0106-5667)
229
StreetSmart Pro User Manual
Order Status
ORDER STATUS
The Order Status tab in the Account Detail window displays all orders - both open
and closed - placed via any Schwab channel, including Schwab.com , TeleBroker™
and Velocity.
The Order Status tab displays:
•
Open orders, closed orders that have been filled, or canceled orders:
You can sort on any column in the Order Status window by clicking on the
column header you want as your sort key.
•
Contingent Orders: This applies to SmartEx trailing stop orders that are
held up until the trailing stop price is met. Once the price is met the order
status changes to Open and a market order is submitted for execution.
Stock symbols and price and volume data shown here and in the software
are for illustrative purposes only. Charles Schwab & Co., its parent or
affiliates, and/or its employees and/or directors may have positions in
securities referenced herein, and may, as principal or agent, buy from or sell
to clients.
•
Partial fills: The Quantity Filled At column displays information for the
first fill. If there are additional fills, this column displays the average price
with the number of shares. To view the individual fills, double-click on the
order and an Order Details window will open displaying the fill events at the
bottom.
•
Sorting by Column: Click on a column name to sort by that column (click
again to reverse the sort order). Press Shift and click on a second column to
perform a secondary, more detailed sort within the primary sort. For
instance, if you wanted to see all the Open Buy orders, you could do a
primary sort on Status and a secondary sort on Action and the Open Buy
orders would be grouped together.
Order Status automatically updates when orders are executed either via
StreetSmart Pro or other Schwab channels.
230
Copyright © Charles Schwab & Co., Inc. 2006. All rights reserved. (0106-5667)
Account Detail & Alerts
! NOTE:
Short Sell-Exempt orders will display in your Order Status tab. A
customer service representative may enter Short Sell-Exempt orders on your behalf
in certain limited circumstances. The most common instance when this may occur
is when liquidating the underlying security where the position is held as either an
equity right, warrant, or convertible. In these circumstances, the securities are not
in an acceptable form for delivery on settlement date. Note that you must file an
exercise for the right, warrant or convertible before your order to liquidate the
underlying security can be marked as Short Sell-Exempt. This action acknowledges
that the intent is to sell a position instead of short a stock and is therefore exempt
from the up-tick rule. Please see Up-Tick rule for more information.
VIEWING ORDER DETAILS
You can see additional details about your order not displayed in the Order Status
tab - like detail for individual fills- in the Order Detail pop-up window.
Copyright © Charles Schwab & Co., Inc. 2006. All rights reserved. (0106-5667)
231
StreetSmart Pro User Manual
Stock symbols and price and volume data shown here and in the software are for
illustrative purposes only. Charles Schwab & Co., its parent or affiliates, and/or its
employees and/or directors may have positions in securities referenced herein, and
may, as principal or agent, buy from or sell to clients.
To Open the Order Detail Window:
There are three ways to access the details of your orders:
•
Highlight the order and double-click on it.
•
Highlight the order, right-click on it, then select Details.
•
Highlight the order and select Details from the Orders drop-down menu
CHANGING OR CANCELING ORDERS
Changing Orders
To change a SmartEx order, go to the Account Detail window, Order Status tab and
either right-click on the open order then select Change or click once on the order
to highlight it, then click Orders > Change. A pop-up box will appear prompting
you to modify your order.
Note that you cannot change the order type of a SmartEx order to or from a trailing
stop order after the order has been submitted. You must first cancel the order and
then resubmit with a different order type.
232
Copyright © Charles Schwab & Co., Inc. 2006. All rights reserved. (0106-5667)
Account Detail & Alerts
Direct Access orders can never be changed.
Canceling Orders
You can request to cancel open orders via the Order Status Tab. All Open orders
have a green box in the left-most column. Because of the speed of execution and
the short life span of market and marketable limit orders, canceling these orders
may not always be possible.
Copyright © Charles Schwab & Co., Inc. 2006. All rights reserved. (0106-5667)
233
StreetSmart Pro User Manual
Saved Orders
SAVED ORDERS TAB
Saved orders, made by clicking the Save button when entering a SmartEx order in
the Trading window, are listed under this tab.
To Submit an Order From the Saved Orders Tab:
1. Right-click on the order you want to send.
2. The order will highlight.
3. Choose Submit to send the order.
You can also use the Saved Orders drop-down menu to access the Submit, Edit or
Delete functions.
Tab
Columns
Descriptions
Symbol
Displays the unique characters used to represent the security.
Action
Displays the action type of the order (Buy, Sell, Buy to Open,
etc.).
Quantity
Shows the number of shares or contracts to be traded.
Price
Shows the price at which you want the order placed.
TIF
Displays the Time In Force: Day, GTC (Good ‘Til Cancelled),
etc.
Date & Time
Shows the date and time the transaction was saved.
Type
Displays the type of security, such as an equity or option
234
Copyright © Charles Schwab & Co., Inc. 2006. All rights reserved. (0106-5667)
Account Detail & Alerts
Right-click
Options
Load
[Symbol]
into Trading
Window
Descriptions
•
Loads the symbol into the Trading window.
•
The quantity field is set to the Trading window default
size – this default may be changed or you may set the
default to match your position size. Go to the Trading
window and select Settings > General > Orders tab to
change the default quantity.
Recent
Stories for
[Symbol]
Stock
Loads the symbol into the Recent Stories tab of the News
window.
Research/Ext
Quote for
[Symbol]
Launches a web browser that automatically opens the
Schwab.com Quotes and Research tab and provides
information for your symbol.
Apply Alert
to [symbol]
Opens sub-menu allowing you to use an alert template or
create a new alert.
Submit
•
If the Order Verification preference is selected, clicking
here will open the Verification window before submitting
the order.
•
If the Order Verification preference has been disabled,
the order will be automatically validated and sent to
Schwab for execution. If there are errors, you will receive
an error notice in the Messages window. After editing you
order, you can resubmit it in the Order Entry panel of the
Trading window.
Edit
Opens the Edit Saved SmartEx Order pop-up window.
Delete
Removes the saved order from the window.
Show/Hide
Menu
Shows/removes the Account Detail menu.
Copyright © Charles Schwab & Co., Inc. 2006. All rights reserved. (0106-5667)
235
StreetSmart Pro User Manual
Alerts
ALERTS OVERVIEW
Alerts and Conditional Orders are designed to help you protect profits
and limit your loss potential by monitoring for the market conditions
you specify – even when you’re not online.
When logged in, you can have the software alert you when certain price
conditions you specify are met. Even if you are not logged in, you can
have orders placed automatically on your behalf when your Alert
conditions are met.
Set up alerts using the Alerts menu displayed in the Account Detail window
when the Alerts tab is selected.
Overview
StreetSmart Pro® software offers a variety of ways to keep you informed of specific
quote and volume changes for specific equities, options, and indices that you
select. Alerts range in degrees of complexity from basic to advanced. Examples of
each Alert type and how they function are included in this section of the manual.
Basic Alerts:
Basic alerts use a single "absolute" criterion to set off (trigger) the alert. Once the
alert condition is met, no additional calculations are required before the alert is
fired. There are two absolute criteria:
•
Increases to
•
Decreases to
Intermediate Alerts:
Intermediate alerts use a single "variable" criterion to trigger the alert. The variable
criterion is based upon a change from a value that is determined at the time that
the alert is created. If you create an alert to fire when the Bid for a particular
security gains 1 point, the software will reference the current inside Bid at the
moment that the alert was created. There are two variable criteria:
•
Gains
•
Loses
Advanced Alerts:
Profit and Loss alerts (Share P&L and Trade P&L) are advanced alerts that are
always based upon two separate calculations involving the criteria that you select.
The sequence of calculations in a P&L alert is as follows:
•
236
First, your current P&L is calculated. Trade P&L and Share P&L are
calculated differently although the end result is much the same. Your choice
depends on which you feel more comfortable using. When using Trade P&L
as a variable, you will need to input the cost of the trade vs. the per share
price. When using the Share P&L variable you will need to input the price
paid per share.
Copyright © Charles Schwab & Co., Inc. 2006. All rights reserved. (0106-5667)
Account Detail & Alerts
The application takes the Original Trade or Share Price that you enter and
compares it to the current Bid or Ask at the moment the alert was created to
determine your unrealized profit or loss. The Bid is used if you are long the
security and the Ask is used if you are short the security.
•
Second, a calculation is made based upon the criteria you select. Note that
when using the gains or loses criteria, the system is using the current P&L
amount or percent as a basis. If you are 10% profit already and you input
‘gains 5%’ the alert will trigger when your profit reaches 10.5% because a
5% gain on 10% is .5%.
You can also set up alerts and conditional order commands for using different
symbols for the condition and the conditional order. Useful combinations include an
index coupled with an individual stock or an order for an option using its underlying
equity for the condition.
Change from Open and Change from Close alerts can be more complex when using
the Gains % and Loses % criteria. See 'Change From Open' Alerts and 'Change
From Close' Alerts topics for more specific examples.
Persistent Alerts
StreetSmart Pro® Alerts support server-held alerts and conditional orders to better
customize your platform to your risk management needs. There are three ways to
manage the time-frame of an alert:
Persistent/GTC (Good ‘Til Cancel) Alerts:
This type of alert remains active, unless triggered, for 60 days regardless of your
logon status. To make your alert persistent/GTC, check Keep alert active after
logoff when setting up the alert. This alert can be set up at any time, but will be
active only during the standard session.
Persistent/Day Alerts:
Regardless of your logon status, these alerts will remain active, unless triggered,
during the current standard session and will automatically deactivate at market
close (4:00 p.m. ET). To make your alert persistent/Day, check Keep alert active
after logoff AND Day Alert when setting up your alert. Day Alerts can be set up
any time but must be manually activated by you on the day you wish to use them.
This alert type can be activated anytime beginning at midnight ET and throughout
the trading day until market close.
Logon Session Only:
This type of alert (initiated by not checking Keep alert active after logoff)
remains active only while logged on to the system. If you lose your connection to
the StreetSmart Pro servers, any open alerts will remain on the system for 10
minutes. This allows you to log back in without losing the alerts. You must
reestablish your connection within 10 minutes to ensure that any outstanding alerts
are not lost. If you do not log off or get disconnected and your alert has not
triggered, it will be deactivated at the end of the current standard session
(4:00 p.m. ET).
Copyright © Charles Schwab & Co., Inc. 2006. All rights reserved. (0106-5667)
237
StreetSmart Pro User Manual
triggered, it will be deactivated at the end of the current standard session (4:00
p.m. ET).
BASIC GUIDELINES ABOUT ALERTS
•
20
You can activate alerts outside of standard market hours, but because alerts
require updated Level 1 quote information to function, they will not be
initialized or become live (actionable) until the market opens. You can set up
new alerts or alerts created from templates at any time and they will display
in the Alerts tab.
o
Persistent alerts that are good for 60 days will automatically initialize
at the next market open.
o
Day Persistent alerts must be manually activated on the day of their
use but you do not need to wait until market open to do this.
o
Alerts that are good for the current logon session only do not
initialize until the open of the standard session (9:30 a.m. ET).
o
At the end of the standard market session, all open Day alerts are
deactivated.
o
Persistent alerts that are good for 60 days will remain active but will
not be acted upon until the next standard session.
o
All alerts will remain in the Alerts tab pending further action such as
editing, activation, deactivation or removal.
•
You can only use P&L alerts for securities in which you hold a position.
•
Alerts with Conditional Orders for Boxed Positions can only be routed via
SmartEx.
•
Alerts established with conditions that have already been met will instantly
fire when the alert is set.
•
If you lose your connection to StreetSmart Pro® servers, any open alerts
where Keep alert active after logoff is not checked will remain on the
system for 10 minutes. This allows you to log back in without losing the
alerts. You must reestablish your connection within 10 minutes to ensure
that any outstanding alerts are not lost. When you log back on, please check
the alert tab to make sure that all your alerts are still open and your
messages and order status in the event that your conditions were met and a
conditional order was sent.
•
You can enter either positive or negative values with the Increase to and
Decrease to criteria, depending upon your goal.
•
The Trailing Stop feature is only available with Gains and Loses alerts.
•
The Trailing Stop feature should not be confused with the Stop Order (order
type). All alerts with Trailing Stops will be entered as a Market or Limit order
types.
•
Alerts with conditional orders can execute trades based on bad or out of
range time and sales prints. You will be responsible for any orders that are
executed, even if they are based upon inaccurate information. To minimize
possible issues, the Bid or Ask variable should be considered when sending
conditional orders for NASDAQ stocks and the (last) Trade Price variable
should be considered when sending conditional orders for Listed securities.
Account Detail & Alerts
NOTE: This is not a guarantee that orders will not be sent based on ‘bad
prints’ and will not completely remove the risk of alerts firing based on
inaccurate data.
•
P&L Alerts are triggered off of the Bid price if you are long the security or Ask
price if you are short the security.
•
Alerts for indices should only be set up using the variables Trade Price,
Change from Open, and Change from Close. Although you can create
alerts for indices using other variables such as Bid or Ask, these alerts will
never fire because the variables do not exist for indices.
•
Avoid placing alerts on any stock that does not have bid/ask quotes. Such
alerts will not fire.
•
Positions with Fractional Shares: If an alert to sell a position will leave
only a fractional share in the account (less than one full share), the alert will
fire but the order will be rejected and not executed. If you are placing a sell
alert for a position that has fractional shares and desire to sell the full
position, please use the “close” feature located under the 'Action' drop down
and select 'All' under the 'Quantity' drop down in the Order Entry area of the
Alert template.
Critical Alert Information
•
Logging off, exiting the system, or being timed out from your session will
deactivate any alerts that do not have Keep alert active after logoff checked.
Saved alert files and Templates are still inactive, but can be easily loaded
when you logon again.
•
You may choose to confirm orders before sending. You must be logged on to
your software for a triggered alert to send an order if confirmation is
required.
If you do not have this setting checked, your active alert will trigger an order
without your confirmation whether you are logged in or not.
•
If you have alerts set without Keep alert active after logoff checked and
you lose your Internet connection due to system failures, like a computer
crash or network disconnection, those alerts will be held on the server for 10
minutes only. If you do not log on again in 10 minutes, the alerts are
automatically removed from the system. If your alert is triggered during that
10 minutes and you are still not logged on, the alert will not trigger or send
the order.
•
Alerts established with conditions that have already been met will fire
immediately after the alert is set.
•
When placing a Conditional order where you specify a certain number of
shares to trade, if the tradable quantity of your position is less than the
specified number, the software will send the order for the lesser amount
instead of not sending the order due to insufficient shares available to trade.
EXAMPLE You have 700 shares of AAPL with a trailing stop active that will
close 1000 shares if the bid loses .05 points. When the bid drops .05, a
SmartEx market order for 700 shares will be sent, as opposed to the
software trying to send 1000 shares and rejecting the order because you
don't have sufficient shares to cover the trade. The same will hold true if you
21
StreetSmart Pro User Manual
are short 1000 shares of AAPL and you try to buy 1500 shares using a
conditional order.
•
After an alert has triggered, it will automatically be deactivated. The same
alert cannot trigger more than once without being reactivated first.
•
Alerts with conditional orders to close (sell if long or buy if short) will not fire
if you do not hold the underlying security; however, if you hold a position,
liquidate it, and then re-enter the position, the alert established for the
original position will apply to any new positions. For example, if you hold
ABCD and have an Alert with a conditional order to sell ABCD that is based
on a prior entry point, once the Alert conditions have been met, the Alert will
fire and the order will be sent. While there are mechanisms in place to try to
prevent an oversell, if you manually exit a position you should ensure that
you do not have open Alerts with conditional orders to sell that position.
•
Alerts, Stop Losses and Conditional orders that have not fired will
automatically be cancelled at the end of the standard session (4:00pm ET) if:
- you check Keep alert active after logoff AND Day Alert when setting up
the alert, or
- if neither is checked and you do not log off before the end of the standard
session.
•
If just Keep alert active after logoff is checked, but not Day Alert, the
alert can stay active for up to 60 days.
•
It is important to review your conditional orders carefully. If you do not
select Confirm order before sending, which allows you to review your
order at the time your alert conditions are met, you will not have an
opportunity to review or verify your Stop Loss or Conditional order once the
Alert you have set is triggered. You may change or cancel this order while in
its conditional state (prior to the alert being triggered). This can be done by
going to the Alerts tab of your Account Detail window, selecting the alert and
then selecting Edit from either the Alerts drop-down or right click menus. For
more details, see Edit or Delete Alerts on the next page. Note that once the
order is submitted it becomes a live order. If your conditional order is a
market order it will probably fill before you would have a chance to cancel or
change it. If you specified that the conditional order be sent as a limit order,
it can be changed or cancelled just like any other Open order.
After completing the Alert window and specifying a Conditional Order, you will
receive a verification of your order to review (unless you have disabled this
22
Account Detail & Alerts
function). After reviewing your order and you click OK, the following window
will appear:
(2007-5984)
USING ALERTS
Alerts can be set up directly through the Alerts tab in the Account Detail window. If
you typically use the same criteria for all your trades, you can also use one of the
standard templates or create your own Alert Template.
Alerts displayed in the Alerts tab can be in one of two states: Active or Inactive.
Alerts in active status will fire when the conditions are met. Once an alert fires it
will automatically become Inactive. You can reactivate or deactivate an alert at any
time during your session.
Retrieve a Saved Alert
You can access previously saved alerts by:
1. With the Alerts tab selected in the Account Detail window, click Alerts >
Load from the menu.
2. Click on the previously saved alert file and select from the following:
•
Yes: Adds the alerts to your existing alerts
•
No: Replaces the contents of the Alerts tab with the alerts in the
selected file
•
Cancel: Makes no changes and allows you to exit the process
3. The alerts appear in the Alert tab and will be inactive.
Save All Alerts to a File
You can add all of your alerts to one file by clicking Save All As in the Alerts tab.
23
StreetSmart Pro User Manual
To retrieve these alerts at a future time select Load..., a window will appear
containing all of your alert files. Select the file you wish to load. All of the alerts
contained in the file will then be displayed in the Alert tab in an Inactive status. You
can then choose to activate each alert manually or Activate All at once. Either way
you choose you should review the details of each alert to ensure that you want to
activate each as it is currently set-up.
Save a Single Alert to a File
Select the alert you wish to save by clicking on it. Either right-click or click Alerts
> Edit in the menu. From this window click Save As at the bottom. You will then
be able to create a new file for the alert or add it to the existing file by selecting the
Append to file checkbox.
Add an Alert
When a standard template doesn't meet your needs, you can use this feature to
create your own alert:
1. Click Alerts > New.
2. Complete the fields in the Condition panel. For more information on how to
complete this window, go to Alert Settings.
- To add more than one condition, click the and or or radio buttons.
- Note that changes expressed as a percent must be used in conjunction
with the gains or loses variable.
3. Then specify the actions the alert should take in the Action panel.
4. Click OK to add the alert to the Alerts tab.
5. When added to the tab during the standard session the alert is activated,
and a confirmation will appear in the Messages window.
6. To save your alert(s) in a file, follow the process outlined in the previous
sections.
Edit or Remove an Open Alert
You can edit or delete an open alert by:
1. Click on the Alerts tab.
2. Click on the alert you want to edit or delete to highlight it.
3. From either the Alerts or the right-click menu select Edit to make changes
or Remove to delete the alert from the tab. NOTE: You can also doubleclick on the Alert to open the Edit window.
4. If editing, click OK to review your changes and activate the settings.
5. When the alert is either deleted or edited, a confirmation will appear in the
Messages window.
6. To save your settings in a file, go to the Alerts or the right-click menu and
select Save All As or Edit if saving a single alert. In the Save Alert window,
you can name it as a new file or add it to an existing file by selecting the
Append to file checkbox.
Remove an Alert
1. Click on the alert you wish to delete.
242
Copyright © Charles Schwab & Co., Inc. 2006. All rights reserved. (0106-5667)
Account Detail & Alerts
2. In the Alerts menu select Remove Selected.
3. The alert will be permanently deleted.
Remove All Alerts
Used when you wish to permanently delete all alerts in the tab.
•
In the Alerts menu select Remove All.
Activate an Alert
When an alert fires it will be automatically placed in inactive status. When an alert
is not active it will remain in the Alerts tab but will be dormant. Alerts can be
activated using the Activate Selected or Activate All menu items. There is no limit
on how many times an alert can be made active.
Activate Selected
1. Click on the alert that you wish to activate. NOTE: The alert must be in
inactive status or this menu selection will be grayed out.
2. In the Alerts menu select Activate Selected.
3. When the alert is activated you will be presented with the order verification
and Alert warning windows. You will also receive confirmation of this action
in the Messages window.
Activate All
1. In the Alerts menu select Activate All.
2. When the alerts are activated you will be presented with a series of order
verification and Alert warning windows. Once you have clicked through these
windows you will receive confirmation of these actions in the Messages
window.
Activation at Market Open
At market open, a window will pop up asking you whether you want to activate
your inactive alerts.
! NOTE: If you activate your alerts at this time, all inactive alerts regardless of
their prior history (whether triggered by the software or deactivated manually) will
become active.
Deactivate All
1. In the Alerts menu select Deactivate All.
2. All of the alerts previously in Active status will be changed to inactive status.
In this state they will be dormant until you choose to reactivate them. You
will also receive confirmation of this action in the Messages window.
Templates
Alert templates allow you to quickly set-up alerts. You can select from the sample
templates included with the software or choose to edit these, or create custom
templates that satisfy your specific needs. For more information about this feature
please go to the Templates topic.
Copyright © Charles Schwab & Co., Inc. 2006. All rights reserved. (0106-5667)
243
StreetSmart Pro User Manual
1. In the Alerts menu, select Templates.
2. The Templates window will open allowing you to select from the available
alert templates.
TIP: You can either edit an existing template or create your own from scratch.
While you can create templates by completing any of the available fields, the most
useful templates typically have the symbol and the value fields blank so you can
apply your strategy to any symbol and adjust the trigger points as appropriate.
! NOTE:
Once created, alerts can be activated and deactivate repeatedly during
the logon session.
ALERTS & RISK MANAGEMENT
StreetSmart Pro® provides Alerts with the option to trigger an order when the alert
criteria you set are met. Conditional orders can be incorporated to accommodate
specific investment strategies and manage risk.
StreetSmart Pro can help you achieve risk management using Alerts with
Conditional orders or by placing Stop or Stop Limit orders. Below are examples of
how risk can be managed once a position is established.
Place a Stop or Stop Limit order
244
Copyright © Charles Schwab & Co., Inc. 2006. All rights reserved. (0106-5667)
Account Detail & Alerts
•
You determine the exit point at which you want to limit your losses.
•
Select the position for which you wish to place a stop loss order in your
Account Detail Positions tab and select Close option from the right-click or
drop-down menu. Select the Stop or Stop Limit Order Type and complete
the screen.
•
Submitting this order will close the position once the price point has been
reached.
•
! NOTE:
Not all securities are eligible for Stop or Stop Limit Order Types.
Alert with a Conditional Order
•
An alternative to submitting a Stop or Stop Limit order is setting up an Alert
with a Conditional Order. Using this type of Alert will also allow you not to
show your order to the marketplace until your risk threshold has been
reached. It also allows you to set both a Profit exit and a Loss exit that would
trigger an order to close your position if either are reached.
•
To create a loss exit, if you are long a position, create a condition using Bid
decreases to as the criterion. You may also choose to use a Bid loses _
Points or _% providing more flexibility than what is available using a Stop
order. If you are short a position, you can do them same using an Ask
variable.
•
To create a profit exit, if you are long a position, create a condition using the
Ask increases to as the criterion. You may also choose to use Ask
increases __ Points or __% providing more flexibility than is available
using a Stop order. If you are short a position, you can do the same thing
using the Bid variable.
•
Be sure to select the Or radio button at the top of the second condition if you
are including both a loss exit and profit exit in you conditional order.
•
NOTE: While you can use this type of Alert to help with risk management, it
is only similar to a Stop order if you select Enter Order as one of the
Actions. If you choose not to Enter Order, the Alert will still let you know
when your risk management threshold has been reached, but you would
have to enter a new order from the Trading window to minimize your risk
exposure.
Alert With Conditional Order using Trailing Stop
•
The functionality is very similar to the Alert with a Conditional order. The
difference is that you now have a variable trigger (Trailing Stop) which will
become effective only after the price of the security has had an up tick.
•
! NOTE:
If no up tick occurs when using a Trailing Stop, the Conditional
order acts like a Stop order, as there is no price increase to 'Trail' back from.
•
To add a Trailing Stop to your Alert, check the Trailing Stop box. This box
only becomes available when the criterion is either gains or loses.
•
EXAMPLE You are long 1000 XYZ, which was purchased at $20 per share. If
you have a risk threshold of 10%, you would want to get out of the position
if the bid for XYZ decreases to $18 per share at the time you purchased it, or
10% less than highest price reached after that.
Copyright © Charles Schwab & Co., Inc. 2006. All rights reserved. (0106-5667)
245
StreetSmart Pro User Manual
You enter a Trailing Stop Alert at $20 to fire when the Bid loses 10%.
Assuming the stock price then increases to $25 per share, the Trailing Stop
will trigger if the Bid then decreases to $22.50 per share. $25 x 10% =
$2.50 per share. $25 - $2.50 = $22.50 per share.
If the stock never moves above $20 per share and you set up the same type
of Alert, it will only fire if the Bid loses 10% ($18). $20 x 10% = $2. per
share. $20 - $2 = $18.
•
You may also enter Trailing Stop orders from the Trading window by sending
a SmartEx Trailing Stop order type. This will display the conditional order in
the Order Status tab until the trailing stop condition is met and the order is
sent and becomes an Open order. Alerts with Conditional Orders using a
Trailing Stop will display in the Alerts tab. Use either method of setting a
trailing stop depending on your needs and preferences.
! NOTE:
When placing a Conditional order where the order action is Close and
where you specify a certain number of shares to trade, if the tradable quantity of
your position is less than the specified number, the software will send the order for
the lesser amount instead of not sending the order due to insufficient shares
available to trade.
EXAMPLE You have 700 shares of AAPL with a trailing stop active that will close
1000 shares if the bid loses .05 points. When the bid drops .05, a SmartEx market
order for 700 shares will be sent, as opposed to the software trying to send 1000
shares and erroring out because you do not have sufficient shares to cover the
trade.
ALERT SETTINGS
The Alerts window and the Alert Templates window have the same settings.
246
Copyright © Charles Schwab & Co., Inc. 2006. All rights reserved. (0106-5667)
Account Detail & Alerts
Alert
Settings
Window
Fields
Description
Conditions
Panel
Sets up the conditions that will trigger your Alert or Alert with
Conditional order.
Symbol
Enter the symbol of the stock or option, or click the down arrow
at the right of the box to choose from the current positions you
hold.
This symbol can be different than the symbol in the conditional
order command.
For options, you may enter the symbol as ".symbol" or
"symbol.o".
Option
Check Box
Original
Trade Price
•
Automatically checked if you select an option symbol from
the pull-down Symbol box.
•
You can manually check this box if you are creating an alert
and/or a conditional order for an option, but it is not
required if using entering an options symbol.
•
Enter the original purchase price you paid for the equity or
option here.
Copyright © Charles Schwab & Co., Inc. 2006. All rights reserved. (0106-5667)
247
StreetSmart Pro User Manual
Keep alert
active
after logoff
•
Only available for Share and Trade P&L alerts.
•
If the variable is Share P&L, enter the average share price
you paid for the position.
•
It the variable is Trade P&L, enter the total dollar amount
you paid for the position.
•
If checked and you log off the software, the alert will be
saved to the server and still will be active the next time you
log on. Note that the alert may still fire if the alert is active
even though you are logged off; however, if you have
elected to confirm the order before sending, these alerts
may trigger but will not send a conditional order if you are
logged off.
•
If checked, but Day Alert is not checked, this alert can stay
active for up to 60 days.
Day Alert
This box is available only when Keep alert active after logoff
is checked. A Day Persistent alert is good for the current day
only but will remain active regardless of whether you are
logged on or not. When checked, an Active Day Alert will
automatically deactivate and cancel the order at the end of that
day’s standard session (4:00 p.m. ET).
Save as
Default
When checked, this alert will save drop-down menu positions
and checkbox settings, but will not save settings in the Value
field or the order entry fields.
Conditions
Panel
Sets up the conditions that will trigger your Alert or Alert with
Conditional order.
248
Copyright © Charles Schwab & Co., Inc. 2006. All rights reserved. (0106-5667)
Account Detail & Alerts
Variable
The variable determines which data will trigger your order.
Share P&L, Trade P&L, Change From Open and Change
From Close are all change/delta variables, that is, they are the
result of a calculation.
•
The P&L variables are the difference between the cost
and the current price.
•
The Change From Open or Change From Close are the
difference between the price of the security at the open
or the close and the current price.
Share P&L
When you set a Share P&L alert, this P&L amount is based on
the difference between your Original Trade Price and the
current bid price if you are long the stock or the ask price if you
are short.
For example, if you purchased 100 shares of DELL at 30 and
it's currently trading at 33, your share P&L in this case is 3
points or 10%. If you want to exit your position with a 6 point
profit or 20% gain, the Share P&L would need to gain 100%.
Alternatively you could designate the Share P&L to Increase to
6 points.
! NOTE: Share P&L initializes each day based on the Market
Open Price, rather than on your original trade price. This means
that if you are using a Variable of Share P&L and a Criteria of
Gains or Loses and the stock opens significantly higher or lower
than the price at which you purchased the stock, the
initialization value could be applied further from the original
trade price than you might wish.
Trade P&L
When you set the alert, this P&L amount is based on the
difference between your Original Trade Price and the current
bid price times the number of shares you own if you are long
on the stock or the ask price if you are short.
Referencing the example in Share P&L above, your Trade P&L
would be $300.00. If you want to exit your position with a
$600.00 profit or 20% gain, the Trade P&L would need to gain
100%. Alternatively you could designate the Trade P&L to
Increase to $600.00.
Bid
Bases your alert on the inside Bid price.
Ask
Bases your alert on the inside Ask price.
Volume
Copyright © Charles Schwab & Co., Inc. 2006. All rights reserved. (0106-5667)
249
StreetSmart Pro User Manual
Bases your alert on the daily cumulative volume.
Trade Price
Bases your alert on the last sale price reported.
CAUTION: It is not uncommon for erroneous trade reports to
come through the Time & Sales display with prices away from
of the market. If an "erroneous price" triggers your order, it is
your responsibility and a subsequent execution cannot be
reversed. Exercise caution when basing Conditional orders on
Trade Price. Alternatively the current Bid or Ask can be used to
achieve result that closely matches the Trade Price variable.
Change from Open
You can set up an alert to trigger based on the difference
between the current price of a stock and the price at the open.
Note that the change amount itself is used as a basis for the
calculation, so that if the current Change from Open is .10 and
you want an alert to trigger when the Change from Open is .30,
we would need to set an alert that triggers when it Gains .20
points or 200% or Increases to .30.
Change from Close
You can set up an alert to trigger based on the difference
between the current price of a stock and the previous closing
price.
Note that the change amount itself is used as a basis for the
calculation so that if the Change from Close is 10 cents, for
example, and you want an alert to trigger when the Change
from Close is 30 cents, it would need to gain .20 points or
200%. Likewise, the Change from Open could increase to 30
cents.
250
Copyright © Charles Schwab & Co., Inc. 2006. All rights reserved. (0106-5667)
Account Detail & Alerts
Criteria
Value
There are four criteria available:
•
Increases to/above
•
Decreases to/below
•
Gains
•
Loses
The amount you want the criteria to change by.
For Gains and Loses criteria, if a negative value is entered,
the value will revert to 0.
! NOTE:
Choose Loses in the criteria window and enter a
positive value rather than trying to trigger an alert based on
negative gains. Increases To and Decreases To criteria will
accept either a positive or negative value depending on your
goal.
Points, $,
% or
Shares
Work in conjunction with the Variable and Criteria.
Trailing
Stop
Works only with the Gains and Loses criteria, and can be
applied to a point value or a percentage. It’s important to note
the difference between a Trailing Stop Alert and a Stop or Stop
Limit order. See Alerts & Risk Management topic for more
information
The Variable and Criteria you choose will change your available
options for these fields. Note that if you wish to set a
percentage value or set up a Trailing Stop you must use the
Gains or Loses criteria.
Trailing Stop Alert example:
You are long 1000 XYZ, which was purchased at $20 per share.
If you have a risk threshold of 10%, you would want to get out
of the position if the bid for XYZ decreases to $18 per share at
the time you purchased it, or 10% less than highest price
reached after that.
You enter a Trailing Stop Alert at $20 to fire when the Bid loses
10%. Assuming the stock price then increases to $25 per
share, the Trailing Stop will trigger if the Bid then decreases to
$22.50 per share. $25 x 10% = $2.50 per share. $25 - $2.50
= $22.50 per share.
If the stock never moves above $20 per share and you set up
the same type of Alert, it will only fire if the Bid loses 10%
($18). $20 x 10% = $2. per share. $20 - $2 = $18.
Copyright © Charles Schwab & Co., Inc. 2006. All rights reserved. (0106-5667)
251
StreetSmart Pro User Manual
And/Or
252
Allows you to add an additional condition to your Alert.
•
When you select And, both conditions must be met at
the same time for the alert to trigger.
•
When you select Or, either condition can trigger the
Alert independent from the other.
Copyright © Charles Schwab & Co., Inc. 2006. All rights reserved. (0106-5667)
Account Detail & Alerts
Action
Panel
Beep
If the system reaches all preset criteria, the machine will beep
once.
Pop-Up Messages Window
The Messages window will display a notification if the Alert is
triggered. If the Messages Window is not currently viewable, it
will pop-up displaying your triggered Alert notification.
! NOTE:
Whether or not you select this option, a notification
is always displayed in the Messages window.
Load Trading Window
Choose to have the stock or option load into the Trading
Window as soon as the Alert is triggered.
Play Sound File
The system can be set to play an audio file when an Alert is
triggered, if you have a sound card and speakers.
The software has two sound (.wav) files included with the
application. Additional sound files can be downloaded from the
Web and are also included in the Microsoft Windows operating
system software. To add a new sound file to your pull-down
options:
1. Check the Play Sound File box.
2. Click Add. Select the folder where your .wav files are
saved.
3. Select the file you want to add, then click Open.
4. To hear the sound file, click the 'play arrow' to the right
of the pull-down box.
5. You may remove any added sound file by selecting it in
the pull-down box and click Remove.
Enter Order
Check this option if you want the system to send out an order
once all criteria are met. Be sure that the following four fields
are completed first: Order Type, Shares, Price and Method.
These are known as Conditional orders.
! NOTE:
Unless you check the Confirm order before
sending checkbox, you will not receive an Order Verification
message when the Conditional Order is triggered. Be sure you
carefully review the terms of the Conditional Order before
submitting it.
Symbol
The condition symbol will automatically populate but can be
changed.
Copyright © Charles Schwab & Co., Inc. 2006. All rights reserved. (0106-5667)
253
StreetSmart Pro User Manual
Order Type
•
Choose from Buy, Sell, Short and Close.
•
Close will either submit a Buy or Sell depending on
whether you are long or short. If you input a share quantity
and your tradable position is less than this amount when
the alert fires, the software will send the order for that
lesser net tradable amount.
•
If you checked the Options box, you can choose from:
Buy to Open, Buy to Close, Sell to Open, Sell to Close
or Close.
Shares
Enter the quantity you want to submit in this box. If you are
using Close as the order type, you can use All in this field or
manually input a quantity.
Price
You can either select Market from the pull-down box or enter a
limit price.
Note that since conditional orders are not submitted until the
conditions that you specified are met, a Market order will
ensure fills at the current price of the security at the time the
order is received by the market.
Method
Conditional orders will be sent via SmartEx or via select Direct
Access routes (for those qualified for Direct Access trading).
Confirm
Order
Before
Sending
Choose to have an order verification window pop-up when the
order conditions are met and the order is sent.
Command
Description
Panel
Displays a full description of the Alert you have set up.
! NOTE:
•
When conditional orders are set up, an Order Verification
window will be displayed if you have Order Verification
enabled.
•
Click OK to prepare the Alert and Conditional order for
activation or click Save to save your alert to a file. To load
your alerts at a later time select Load in the Alerts menu
and then select your saved file.
Note that if you are not logged onto the system to confirm your
order at the time the order is triggered, it will not be sent.
ALERT TEMPLATES
StreetSmart Pro® provides you with:
•
Sample standard templates for commonly used trading strategies. They can
be customized or deleted.
•
An Alert Templates feature that allows you to add your own templates with
specific pre-set Alert, Trailing Stop or other Conditional order criteria.
254
Copyright © Charles Schwab & Co., Inc. 2006. All rights reserved. (0106-5667)
Account Detail & Alerts
•
Standard or customized template that can be activated by right-clicking on
any open position from the Account Detail window and selecting the
Template name.
With StreetSmart Pro, you can use the following Alert Templates or create your
own:
•
Can help protect you against large swings in the market by
alerting you to both increases and decreases in a security's
Bid price.
•
This Alert includes the Conditional order action.
•
Allows you to follow the price movement upward and only
trigger the Alert when the Bid decreases by the amount
specified.
•
This Alert includes the Conditional order action.
•
Alerts you when the Bid decreases to a specified Value.
•
This Alert includes the Conditional order action.
Ask
Increases
•
Alerts you when the Ask increases to a specified Value.
Buy In
•
Alert you when the Ask of a specific security increases by
the specified % Value.
Volume
Alert
•
Alerts you when security volume gains the specified Value.
Margin
Equity
Warning
•
Alerts you when the trade price decreases to 3.05. At
$3.00, marginability increases to 100%.
Day Alert
•
Alerts you when the Change from Open either Increases to
or Decreases to the specified Values.
Straddle
Trailing
Stop
Stop Loss
Copyright © Charles Schwab & Co., Inc. 2006. All rights reserved. (0106-5667)
255
StreetSmart Pro User Manual
SETTING ALERT TEMPLATES
1. You can either create a new template from scratch or go to the Account
Detail window Alerts tab and select Alerts > Templates from the menu.
2. To set up a template from scratch, in Alert Templates click Add to open the
following Add Template window:
3. Alternatively select one of the Sample templates that is similar to your
strategy, and select Edit to rename it and modify its parameters.
4. Set up the fields in the template the way you would an alert, except for the
fields you want to fill in at the time the order is placed, such as the Symbol.
5. Click OK when you’re finished and it will save to the list of Alert Templates.
All new templates must be named or they cannot be used or saved.
To apply a template to a position:
1. Right-click on an open position in the Account Detail window or go to Alerts
> Templates and select Apply Alert to [symbol].
2. A sub-menu will open and you will be able to choose from the templates
listed there.
3. The symbol will pre-fill based on the position you selected and the template
window will pop up with only the blank fields highlighted for you to fill in
before the alert is set.
256
Copyright © Charles Schwab & Co., Inc. 2006. All rights reserved. (0106-5667)
Account Detail & Alerts
! NOTE:
Unless you wish to set-up templates for specific positions, the symbol
and the value fields are left blank until you set the specific alert. If your alert
template includes a conditional order, the shares and price fields can also be left
blank and entered when you set the alert.
In this example, Value is the variable in the template to be filled in when you’re
ready to set the Alert.
To set up the template as a persistent alert:
Check Keep alert active after logoff at the top of the template window, then fill
in the rest of the blue fields and click OK to activate the alert.
To Apply an Alert Template to an Alert or Conditional Order For a Security
You Do Not Own:
1. Set up your template the same way you would a regular alert, leaving the
Symbol and Value fields blank.
2. In the Account Detail, click Alerts > Templates in the menu bar. If the
Menu Bar is not visible, right-click in the window and select Show Menu.
3. Click on the template for the alert you set up.
4. Click Complete or double-click the Alert Template name.
5. The template set-up window will appear and prompt you to complete the
remaining fields.
6. Click OK.
Copyright © Charles Schwab & Co., Inc. 2006. All rights reserved. (0106-5667)
257
StreetSmart Pro User Manual
7. Verify your conditional order and confirm that you have read the Alerts
Warning, if applicable, and the Alert set will appear in the Alerts and
Conditional Order Entry window.
TIP:
Remove Saved Templates
•
You can remove Templates by highlighting the Template you want to
remove and either click Remove or right-click to Remove.
•
You can also edit an existing template to meet your changing needs.
ALERT VARIABLE DESCRIPTIONS
Alert Variable Descriptions
The following tables describe various alerts that you can create, as well as how the
alert will trigger.
•
Trade P&L Alerts
•
Share P&L Alerts
•
Bid Alerts
•
Ask Alerts
•
Volume Alerts
•
Trade Price Alerts
•
Change From Open Alerts
•
Change From Close Alerts
•
Additional P&L Alert Scenarios
Trade Profit & Loss Alerts
Scenario:
•
You bought 1000 shares of stock at 30. The current Bid is 31 and the current
Ask is 32.
•
Based upon the Original Trade Price of 30 that you enter, the software has
calculated your current unrealized gain (Trade P&L) as $1,000 (1000 shares
X (31-30)).
Level of
Complexity
Variable
Advanced
Trade
P&L
258
Criteria
Increases
to
Value
(Points,
Shares,
$, or
%)
Is Trailing
Stop
Available?
$2000
No
Conditions
that cause
the alert to
fire
Alert will fire
if the Bid
rises to 32 or
more. At that
time, your
Trade P&L
equals or
Copyright © Charles Schwab & Co., Inc. 2006. All rights reserved. (0106-5667)
Account Detail & Alerts
exceeds
$2000 (1000
shares X 2
(Bid price of
32 minus
your original
Trade Price of
30)).
Advanced
Trade
P&L
Decreases
to
-$2000
No
Alert will fire
if the Bid
drops to 28
or less. At
that time,
your Trade
P&L equals or
exceeds $2000 (1000
shares X –2
(your original
Trade Price of
30 minus the
Bid price of
28)). If you
had entered
this as
+$2000, the
alert would
fire
automatically,
because the
current Trade
P&L of $1000
is already
less than
$2000.
Advanced
Trade
P&L
Gains
$2000
Yes
Alert will fire
if the Bid
rises to 33 or
more. At that
time, your
Trade P&L
has increased
$2000 (2
points X 1000
shares).
Advanced
Trade
P&L
Loses
$2000
Yes
Alert will fire
if the Bid
drops to 29
or less. At
that time,
your Trade
Copyright © Charles Schwab & Co., Inc. 2006. All rights reserved. (0106-5667)
259
StreetSmart Pro User Manual
P&L has
dropped from
+1000 to 1000 (1000
shares X -2
(Bid price of
31 at the
time that you
entered the
alert minus
the new Bid
price of 29)).
Advanced
Trade
P&L
Gains
20%
Yes
Alert will fire
if the Bid
rises to 31.20
or more. At
that time,
your Trade
P&L has risen
20% from its
value at the
time that you
created the
alert (Trade
P&L of $1000
plus 20%).
Advanced
Trade
P&L
Loses
20%
Yes
Alert will fire
if the Bid
drops to
30.80 or less.
At that time,
your Trade
P&L has
decreased
20% from its
value at the
time that you
created the
alert (Trade
P&L of $1000
less 20%).
Share P&L Alerts
Scenario:
•
You bought 1000 shares of stock at 30. The current Bid is 31 and the current
Ask is 32.
•
Based upon the Original Trade Price of 30 that you enter, the software has
calculated your current unrealized gain (Share P&L) as $1 per share (31-30).
260
Copyright © Charles Schwab & Co., Inc. 2006. All rights reserved. (0106-5667)
Account Detail & Alerts
Level of
Complexity
Variable
Criteria
Value
(Points,
Shares,
$, or
%)
Is Trailing
Stop
Available?
Advanced
Share
P&L
Increases
to
2
No
Alert will fire
if the Bid
rises to 32 or
more. At that
time, your
Share P&L
equals or
exceeds 2
points (Bid
price of 32
minus your
original Trade
Price of 30).
Advanced
Share
P&L
Decreases
to
-2
No
Alert will fire
if the Bid
drops to 28
or less. At
that time,
your Share
P&L equals or
exceeds -2
points
(original
Trade Price of
30 minus the
Bid price of
28). If you
had entered
this as
positive 2
points, the
alert would
have fired
automatically
fire, because
the current
Share P&L of
1 point is
already less
than 2
points.
*Advanced
Share
P&L
Gains
2
Yes
Alert will fire
if the Bid
rises to 33 or
more. At that
time, your
Copyright © Charles Schwab & Co., Inc. 2006. All rights reserved. (0106-5667)
Conditions
that cause
the alert to
fire
261
StreetSmart Pro User Manual
Share P&L
has increased
2 points from
the value
that existed
at the time
that you
created the
alert.
*Advanced
Share
P&L
Loses
2
Yes
Alert will fire
if the Bid
drops to 29
or less. At
that time,
your Share
P&L has
dropped 2
points from
+1 point to –
1 point.
*Advanced
Share
P&L
Gains
20%
Yes
Alert will fire
if the Bid
rises to 31.20
or more. At
that time,
your Share
P&L has risen
20% from its
value at the
time that you
created the
alert (Original
Share P&L of
+1 plus
20%).
*Advanced
Share
P&L
Loses
20%
Yes
Alert will fire
if the Bid
drops to
30.80 or less.
At that time,
your Share
P&L has
decreased
20% from its
value at the
time that you
created the
alert (Share
P&L of 1
point less
20%).
262
Copyright © Charles Schwab & Co., Inc. 2006. All rights reserved. (0106-5667)
Account Detail & Alerts
*Note that Share P&L initializes each day based on the Market Open Price, rather
than on your original trade price. This means that if you are using a Variable of
Share P&L and a Criteria of Gains or Loses and the stock opens significantly higher
or lower than the price at which you purchased the stock, the initialization value
could be applied further from the original trade price than you might wish.
Bid Alerts
Scenario: You bought 1000 shares of stock at 30. The current Bid is 31 and the
current Ask is 32.
Level of
Complexity
Variable
Criteria
Basic
Bid
Increases
to
Basic
Bid
Intermediate
Intermediate
Value
(Points,
Shares,
$, or
%)
Is Trailing
Stop
Available?
Conditions
that cause
the alert to
fire
33
No
Alert will fire
if the Bid
rises to 33 or
more.
Decreases
to
29
No
Alert will fire
if the current
Bid falls to
29 or less.
Bid
Gains
2
Yes
Alert will fire
if the Bid
rises to 33 or
more. The
alert
reference
point is
based on the
current Bid
of 33 (31
plus 2
points).
Bid
Loses
2
Yes
Alert will fire
if the Bid
falls to 29 or
less. The
alert
reference
point is
based on the
current Bid
of 31 minus
2 points.
Copyright © Charles Schwab & Co., Inc. 2006. All rights reserved. (0106-5667)
263
StreetSmart Pro User Manual
Intermediate
Bid
Gains
20%
Yes
Alert will fire
if the Bid
rises to
37.20 or
more. The
alert
reference
point is
based on the
current Bid
of 31 plus
6.20 (20% of
31).
Intermediate
Bid
Loses
20%
Yes
Alert will fire
if the Bid
falls to 24.80
or less. The
alert
reference
point is
based on the
current Bid
of 31 minus
6.20 (20% of
31).
Ask Alerts
Scenario: You bought 1000 shares of stock at 30. The current Bid is 31 and the
current Ask is 32.
Level of
Complexity
Variable
Basic
Ask
Increases
to
Basic
Ask
Intermediate
Ask
264
Criteria
Value
(Points,
Shares,
$, or
%)
Is Trailing
Stop
Available?
Conditions
that cause
the alert to
fire
33
No
Alert will fire
if the Ask
rises to 33 or
more.
Decreases
to
29
No
Alert will fire
if the Ask
falls to 29 or
less.
Gains
2
Yes
Alert will fire
if the Ask
rises to 34 or
more. The
alert
Copyright © Charles Schwab & Co., Inc. 2006. All rights reserved. (0106-5667)
Account Detail & Alerts
reference
point is
based on the
current Ask
of 32 plus 2
points.
Intermediate
Ask
Loses
2
Yes
Alert will fire
if the Ask
falls to 30 or
less. The
alert
reference
point is
based on the
current Ask
of 32 minus
2 points.
Intermediate
Ask
Gains
20%
Yes
Alert will fire
if the Ask
rises to
38.40 or
more. The
alert
reference
point is
based on the
current Ask
of 32 plus
6.40 (20% of
32.)
Intermediate
Ask
Loses
20%
Yes
Alert will fire
if the Ask
falls to 25.60
or less. The
alert
reference
point is
based on the
current Ask
of 32 minus
6.40 (20% of
32).
Volume Alerts
No scenario is required to understand Volume Alerts.
Copyright © Charles Schwab & Co., Inc. 2006. All rights reserved. (0106-5667)
265
StreetSmart Pro User Manual
Level of
Complexity
Variable
Criteria
Value
(Points,
Shares,
$, or %)
Is Trailing
Stop
Available?
Conditions
that cause
the alert
to fire
Basic
Volume
Increases
to
1,000,000
No
Alert will
fire if
Volume
equals or
exceeds
1,000,000
shares.
Basic
Volume
Decreases
to
1,000,000
No
Although
you can
create this
alert, it will
never fire,
because
Volume
never
decreases
during the
market
session.
Intermediate
Volume
Gains
1,000,000
Yes, but
serves no
purpose
Alert will
fire if
1,000,000
additional
shares are
traded than
the existing
Volume at
the
moment
the alert
was
established.
Intermediate
Volume
Loses
1,000,000
Yes, but
serves no
purpose
Although
you can
create this
alert, it will
never fire,
because
Volume
never
decreases
during the
market
session.
266
Copyright © Charles Schwab & Co., Inc. 2006. All rights reserved. (0106-5667)
Account Detail & Alerts
Trade Price Alerts
Scenario: You bought 1000 shares of stock at 30. The current Bid is 31 and the
current Ask is 32. Last Trade Price was 31.
Level of
Complexity
Variable
Criteria
Basic
Trade
Price
Increases
to
Basic
Trade
Price
Intermediate
Value
(Points,
Shares,
$, or
%)
Is Trailing
Stop
Available?
Conditions
that cause
the alert to
fire
33
No
Alert will fire
if the last
Trade Price
rises to 33 or
more.
Decreases
to
30
No
Alert will fire
if the last
Trade Price
declines to
30 or less.
Trade
Price
Gains
2
Yes
Alert will fire
if the last
Trade Price
rises 2 points
to 33.
Intermediate
Trade
Price
Loses
2
Yes
Alert will fire
if the last
Trade Price
loses 2
points to 29.
Intermediate
Trade
Price
Gains
20%
Yes
Alert will fire
if the last
Trade Price
gains 20% to
37.20 (31
plus 6.20
(20% of 31))
or more.
Intermediate
Trade
Price
Loses
20%
Yes
Alert will fire
if the last
Trade Price
loses 20% to
24.80 (31
minus 6.20
(20% of 31))
or less.
Copyright © Charles Schwab & Co., Inc. 2006. All rights reserved. (0106-5667)
267
StreetSmart Pro User Manual
Change From Open Alerts
Scenario: Opening price for equity "XYZ" is $15. Current Trade Price is $16 and
current Change from Open is +$1.
Level of
Complexity
Variable
Basic
Change
from
Open
Increases
to
Basic
Change
from
Open
Intermediate
Intermediate
268
Criteria
Value
(Points,
Shares,
$, or
%)
Is Trailing
Stop
Available?
Conditions
that cause
the alert to
fire
2
No
Alert will fire
if the Change
from Open is
+2 or more.
In this case,
Trade Price
for XYZ must
be 17 (15
plus 2) or
more.
Decreases
to
-2
No
Alert will fire
if the Change
from Open is
–2 or less. In
this case the
Trade Price
for XYZ must
be 13 (15
minus 2) or
less.
Change
from
Open
Gains
2
Yes
Alert will fire
if the Change
from Open
increases to
+3 or more
(current
Change from
Open of +1
plus 2). In
this case,
Trade Price
for XYZ must
increase to
18 (16 plus
2) or more.
Change
from
Open
Loses
2
Yes
Alert will fire
if the Change
from Open
decreases to
–1 or less. In
Copyright © Charles Schwab & Co., Inc. 2006. All rights reserved. (0106-5667)
Account Detail & Alerts
this case,
Trade Price
for XYZ must
decrease to
14 (16 minus
2) or less.
Advanced
Change
from
Open
Gains
20%
Yes
Alert will fire
if the Change
from Open
increases to
+1.20
(current
Change from
Open of 1
plus 20% of
1) or more.
In this case,
Trade Price
for XYZ must
be 16.20 (16
plus 0.20) or
more.
Advanced
Change
from
Open
Loses
20%
Yes
Alert will fire
if the change
from the
Change from
Open
decreases to
+0.80
(current
Change from
Open of +1
minus 20%
of 1) or less.
In this case,
Trade Price
for XYZ must
be 15.80 (16
minus 0.20)
or less.
Change From Close Alerts
Scenario: Closing price for equity "ABC" is $35. Current Trade Price is $36 and
current Change from Close is $1.
Level of
Complexity
Variable
Criteria
Value
(Points,
Shares,
$, or
Is Trailing
Stop
Available?
Copyright © Charles Schwab & Co., Inc. 2006. All rights reserved. (0106-5667)
Conditions
that cause
the alert to
fire
269
StreetSmart Pro User Manual
%)
Basic
Change
from
Close
Increases
to
2
No
Alert will fire
if the Change
from Close is
+2 or more.
In this case,
Trade Price
for ABC must
be 37 (35
plus 2) or
more.
Basic
Change
from
Close
Decreases
to
-2
No
Alert will fire
if the Change
from Close is
–2 or less. In
this case the
Trade Price
for ABC must
be 33 (35
minus 2) or
less.
Intermediate
Change
from
Close
Gains
2
Yes
Alert will fire
if the Change
from Close
increases to
+3 or more
(current
Change from
Close of +1
plus 2). In
this case,
Trade Price
for ABC must
increase to
38 (36 plus
2) or more.
Intermediate
Change
from
Close
Loses
2
Yes
Alert will fire
if the Change
from Close
decreases to
–1 or less. In
this case,
Trade Price
for ABC must
decrease to
34 (36 minus
2) or less.
270
Copyright © Charles Schwab & Co., Inc. 2006. All rights reserved. (0106-5667)
Account Detail & Alerts
Advanced
Change
from
Close
Gains
20%
Yes
Alert will fire
if the Change
from Close
increases to
+1.20
(current
Change from
Close of +1
plus 20% of
1) or more.
In this case,
Trade Price
for ABC must
be 36.20 (36
plus 0.20) or
more.
Advanced
Change
from
Close
Loses
20%
Yes
Alert will fire
if the Change
from Close
decreases to
+0.80
(current
Change from
Open of 1
minus 20%
of 1) or less.
In this case,
Trade Price
for ABC must
be 35.80 (36
minus 0.20)
or less.
Additional P&L Alert Scenarios*
Scenario 1:
You bought 1000 shares of XYZ at 20. Bid is 21.
Your current unrealized profit (Trade P&L) is +$1000. Depending on your objective,
you could set up the alert in different ways:
If your objective is...
•
A bigger profit of $2000, then enter "Trade P&L" "Increases to" "$2000",
Original Trade Price = "20", and "beep".
- Trigger: If XYZ trades at or above 22.00, then the application will beep.
•
To protect a profit of $500, then enter, if "Trade P&L" "Decreases to" "$500",
Original Trade Price = "20", and "beep".
- Trigger: If XYZ trades at or below 20.50, then the application will beep.
Copyright © Charles Schwab & Co., Inc. 2006. All rights reserved. (0106-5667)
271
StreetSmart Pro User Manual
•
To limit your loss to -$500, then enter, if "Trade P&L" "Decreases to" "$500", Original Trade Price = "20", and "beep".
- Trigger: If XYZ trades at or below 19.50, then the application will beep.
Scenario 2:
You bought 1000 shares of XYZ at 20. Bid is 19.
Your current unrealized loss (Trade P&L) is -$1000. Depending on your objective,
you could set up the alert in different ways:
If your objective is...
•
To limit your loss to -$2,000, then enter if "Trade P&L" "Decreases to" "$2000", Original Trade Price = "20", and "beep".
-Trigger: When XYZ trades at or below 18.00, then the application will beep.
•
To decrease your loss to -$500, then enter if "Trade P&L" "Increases to" "$500", Original Trade Price = "20", and "beep".
-Trigger: When XYZ trades at or above 19.50, then the application will beep.
•
A gain of $500, then enter, if "Trade P&L" "Increases to" "$500", Original
Trade Price = "20", and "beep".
-Trigger: When XYZ trades at or above 20.50, then the application will beep.
* Both Share P&L and Trade P&L logic functions the same way.
ALERT SCENARIOS
Alert Scenarios
The following four topics present different scenarios and show you different ways
that you can accomplish the same goal. You will notice that you can accomplish the
same thing with a Basic Alert as you can with an Advanced Alert.
Scenario 1: Gain
Scenario 2: Preserving a Gain
Scenario 3: Loss
Scenario 4: Minimizing a Loss
Scenario 1: Gain
You bought 1000 shares of XYZ at 45.
•
Current Bid=50.
•
Share P&L is +5 (50-45).
•
Current Ask=55.
•
Last Trade=50.
•
Open=49. Change from Open=+1.
•
Previous Close=48. Change from Close=+2.
272
Copyright © Charles Schwab & Co., Inc. 2006. All rights reserved. (0106-5667)
Account Detail & Alerts
Goal: You already have an unrealized profit of $5 per share (11.11% of original
cost) and you want to enter an order to sell when you have a profit of $10 per
share (22.22% of original cost) on XYZ.
Variables
Increases
to $
Decreases
to $
Gains
$
Gains %
Loses
$
Loses
%
Trade
P&L
10,000
N/A
5,000
100%
(Gains
$/Trade
P&L)
N/A
N/A
Share
P&L
10
N/A
5
100%
(Gains
$/Share
P&L)
N/A
N/A
Bid
55
N/A
5
10%
(Gains
$/Bid)
N/A
N/A
Ask
N/A
N/A
N/A
N/A
N/A
N/A
Volume
N/A
N/A
N/A
N/A
N/A
N/A
Trade
Price**
55
N/A
5
10%
(Gains
$/Bid)
N/A
N/A
Change
from
Open**
6
N/A
5
500%
(Gains
$/Chg from
Open)
N/A
N/A
Change
from
Close**
7
N/A
5
250%
(Gains
$/Chg from
Close)
N/A
N/A
**Alerts using "Trade Price", "Change from Open" and "Change from Close" are
triggered based upon Last Trade. Last Trade can be based upon either Bid or Ask,
so be careful when setting up these types of alerts.
Scenario 2: Preserving a Gain
You bought 1000 shares of XYZ at 45.
•
Current Bid=55.
•
Share P&L is +10 (55-45).
•
Current Ask=60.
•
Last Trade=55.
•
Open=52. Change from Open=+3.
•
Previous Close=51. Change from Close=+4.
Copyright © Charles Schwab & Co., Inc. 2006. All rights reserved. (0106-5667)
273
StreetSmart Pro User Manual
Goal: You have an unrealized profit of $10,000 (22.22% of original cost) and you
want to enter an order to sell if your profit decreases to $5000 (11.11% of original
cost).
Variables
Increases
to $
Trade
P&L
NR
Share
P&L
NR
Bid
Decreases
to $
Gains
$
Gains
%
Loses
$
Loses %
N/A
N/A
5,000
50%
(Loses
$/Trade
P&L
5
N/A
N/A
5
50%
(Loses
$/Share
P&L)
NR
50
N/A
N/A
5
9.09%
(Loses
$/Bid)
Ask
N/A
N/A
N/A
N/A
N/A
N/A
Volume
N/A
N/A
N/A
N/A
N/A
N/A
Trade
Price**
NR
50
N/A
N/A
5
9.09%
(Loses
$/Bid)
Change
from
Open**
NR
-2
N/A
N/A
5
167%
(Loses
$/Chg from
Open)
Change
from
Close**
NR
-1
N/A
N/A
5
125%
(Loses
$/Chg from
Close)
$5,000
**Alerts using "Trade Price", "Change from Open" and "Change from Close" are
triggered based upon Last Trade. Last Trade can be based upon either Bid or Ask,
so be careful when setting up these types of alerts.
Scenario 3: Loss
You bought 1000 shares of XYZ at 55.
•
Current Bid=50.
•
Share P&L is –5 (50-55).
•
Current Ask=55.
•
Last Trade=50.
•
Open=49. Change from Open=+1.
•
Previous Close=48. Change from Close=+2.
274
Copyright © Charles Schwab & Co., Inc. 2006. All rights reserved. (0106-5667)
Account Detail & Alerts
Goal: You have an unrealized loss of $5 per share (-9.09% of original cost) and
you want to enter an order to sell if your loss increases to $10 per share (-18.18%
of original cost).
Variables
Increases
to $
Decreases
to $
Gains
$
Gains
%
Loses
$
Loses %
Trade
P&L
N/A
-10,000
N/A
N/A
5,000
100%
(Loses
$/Trade
P&L
Share
P&L
N/A
-10
N/A
N/A
5
100%
(Loses
$/Share
P&L)
Bid
N/A
45
N/A
N/A
5
10%
(Loses
$/Bid)
Ask
N/A
N/A
N/A
N/A
N/A
N/A
Volume
N/A
N/A
N/A
N/A
N/A
N/A
Trade
Price**
N/A
45
N/A
N/A
5
10%
(Loses
$/Bid)
Change
from
Open**
N/A
-4
N/A
N/A
5
500%
(Loses
$/Chg from
Open)
Change
from
Close**
N/A
-3
N/A
N/A
5
250%
(Loses
$/Chg from
Close)
**Alerts using "Trade Price", "Change from Open" and "Change from Close" are
triggered based upon Last Trade. Last Trade can be based upon either Bid or Ask,
so be careful when setting up these types of alerts.
Scenario 4: Minimizing a Loss
You bought 1000 shares of XYZ at 60.
•
Current Bid=50.
•
Share P&L is -10 (50-60).
•
Current Ask=55.
•
Last Trade=50.
•
Open=51. Change from Open=-1.
•
Previous Close=52. Change from Close=-2.
Copyright © Charles Schwab & Co., Inc. 2006. All rights reserved. (0106-5667)
275
StreetSmart Pro User Manual
Goal: You have an unrealized loss of $10,000 (-16.67% of original cost) and you
want to enter an order to sell if your loss is only $5000 (-8.33% of original cost).
Variables
Increases
to $
Decreases
to $
Gains
$
Gains %
Loses
$
Loses
%
Trade
P&L
-5,000
N/A
5,000
50%
(Gains
$/Trade
P&L)
N/A
N/A
Share
P&L
-5
N/A
5
50%
(Gains
$/Share
P&L)
N/A
N/A
Bid
55
N/A
5
10%
(Gains
$/Bid)
N/A
N/A
Ask
N/A
N/A
N/A
N/A
N/A
N/A
Volume
N/A
N/A
N/A
N/A
N/A
N/A
Trade
Price**
55
N/A
5
50%
(Gains
$/Bid)
N/A
N/A
Change
from
Open**
4
N/A
5
500%
N/A
N/A
Change
from
Close**
3
N/A
N/A
(Gains
$/Chg from
Open)
N/A
5
250%
(Gains
$/Chg from
Close)
**Alerts using "Trade Price", "Change from Open" and "Change from Close" are
triggered based upon Last Trade. Last Trade can be based upon either Bid or Ask,
so be careful when setting up these types of alerts.
276
Copyright © Charles Schwab & Co., Inc. 2006. All rights reserved. (0106-5667)
Account Detail & Alerts
Balances
BALANCES TAB
The Balances tab gives you vital account information, including updated Day Trade
Buying Power for certain accounts, margin buying power on margin accounts, and
bank balances for Bank Sweep IRA accounts. If your accounts are in a margin call,
the amount will be shown on the last line of the Balances screen.
All balances are automatically updated every fifteen minutes or 30 seconds after
your orders are executed, whichever happens first. The Balances tab on margin
accounts includes a Margin Buying Power figure. Click on the Details button to get
more details about your Margin Buying Power.
Balances Tab For a Margin Account with Day Trading Buying Power:
Balances Tab for a Cash account:
Copyright © Charles Schwab & Co., Inc. 2006. All rights reserved. (0106-5667)
277
StreetSmart Pro User Manual
! NOTE: You must be in Live mode to see balances on the Balances tab. When
you are in Demo mode, balances will not display.
Tab
Columns
Descriptions
Total
Account
Value
The Total Account Value is the sum of your securities, unswept
or intra-day cash, money market funds, bank deposit accounts,
and net credit or debit balances in your account.
Today's
Change
Indicates the change in account value from the previous
trading day's close. This includes your trading activity, as well
as deposits and withdrawals.
Available to
Trade
(Using cash)
The maximum amount of money in your account that you can
use to trade without accessing margin borrowing.
Available to
Trade (Cash
+
Also known as "Margin Buying Power", this is the amount of
money you can use to trade marginable equities using cash and
the margin feature of your account. View Buying Power Details
278
Copyright © Charles Schwab & Co., Inc. 2006. All rights reserved. (0106-5667)
Account Detail & Alerts
Borrowing)
to understand this value for all security types. This value is
only shown in accounts with a margin feature. You will be
charged interest on any amount you borrow that exceeds the
Available Cash in the account.
Details
Button
Click on this button to open up the Buying Power Details
window, which displays the maximum amount of any given
security type that you can purchase using margin borrowing.
This value is only shown in accounts with a margin feature
Available to
Withdraw
(Using cash)
The maximum amount of money you can withdraw without
accessing margin borrowing. The amount is a combination of
credits in the account less any cash on hold.
Available to
Withdraw
(Cash +
Borrowing)
The maximum amount you can withdraw from your account to
by requesting a check or transferring funds to another account.
This value includes the cash balance in your account, plus the
maximum amount you can borrow against marginable
securities held in your margin account. Note that recent
deposits earn interest and are available for most types of
trading activity, but are not reflected in your authorization limit
until they are cleared. This value is only shown in accounts with
a margin feature. You will be charged interest on any amount
you borrow that exceeds the Available Cash in the account.
Settled Cash
Available to
Trade
Trading in the Margin Account
Trading on margin does not require settled funds. If 100% of
the trading activity occurs on margin, there will be no
difference between the settled funds to trade balance and the
total available to trade balance. Traders that fit this profile will
not be affected by the special requirements that may result
from Cash Account trading activity.
Traders that occasionally trade non-marginable securities in the
Cash Account should continue reading.
Settled funds are:
•
incoming cash (such as a deposit or wire)
•
available Margin Loan Value
•
settled sale proceeds of fully paid for securities.
Settled funds may be used for purchases of securities. If a
security is purchased using settled funds, there are no
requirements surrounding the timeframe of when the newly
purchased securities can be sold.
However, if unsettled funds are used to purchase securities and
the customer sells the securities prior to making full payment,
these newly purchased securities may be subject to special
requirements. Securities purchased using unsettled funds,
should not be sold prior to the settlement of the funds used to
purchase these securities (generally 3 business days after the
sale of the security which generated the funds).
If these securities are sold prior to settlement of the financing
sale then additional funds will be required to be deposited in
Copyright © Charles Schwab & Co., Inc. 2006. All rights reserved. (0106-5667)
279
StreetSmart Pro User Manual
the account to cover the cost of the newly purchased securities.
If no additional funds are deposited within 5 business days of
the purchase, the sale of these securities will constitute a "free
ride" under Federal Reserve Regulation T. This will result in a
90-day settled cash-up-front restriction.
EXAMPLE If you sold a fully paid for security on Monday the
1st, you could use the proceeds to purchase new a security
prior to the settlement day of Thursday the 4th (3 day
settlement). However, if you sold the newly purchased security
prior to the settlement date (Thursday the 4th), you would
then be required to deposit funds to pay for the purchase.
If you sold the new position on Thursday the 4th, or anytime
there after, no additional funds would be required.
Cash
Secured Put
Assignment
Displays the Cash Secured Requirement, 100% of assignment
value of the put position, when a Cash Secured Equity Put is in
the account.
This balance will only display if you have placed a cash secured
equity put and will be located below the Settled Cash available
to trade balance.
Cash & Money Market
Trading in the Cash Account
Settled funds are:
•
incoming cash (such as a deposit or wire)
•
settled sale proceeds of fully paid for securities.
Settled funds may be used for purchases of securities. If a security is purchased
using settled funds, there are no requirements surrounding the timeframe of
when the newly purchased securities can be sold.
However, if unsettled funds are used to purchase securities and the customer
sells the securities prior to making full payment, these newly purchased
securities may be subject to special requirements. Securities purchased using
unsettled funds, should not be sold prior to the settlement of the funds used to
purchase these securities (generally 3 business days after the sale of the
security which generated the funds).
If these securities are sold prior to settlement of the financing sale then
additional funds will be required to be deposited in the account to cover the cost
of the newly purchased securities. If no additional funds are deposited within 5
business days of the purchase, the sale of these securities will constitute a "free
ride" under Federal Reserve Regulation T. This will result in a 90-day settled
cash-up-front restriction.
EXAMPLE If you sold a fully paid for security on Monday the 1st, you could use
the proceeds to purchase new a security prior to the settlement day of Thursday
the 4th (3 day settlement). However, if you sold the newly purchased security
prior to the settlement date (Thursday the 4th), you would then be required to
deposit funds to pay for the purchase. If you sold the new position on Thursday
the 4th, or anytime there after, no additional funds would be required.
Cash
280
This represents the total dollar value of your unswept or intraday cash, money market funds, bank deposit accounts, and net
credit or debit balances you hold in the Schwab account you
Copyright © Charles Schwab & Co., Inc. 2006. All rights reserved. (0106-5667)
Account Detail & Alerts
have selected to view.
Money
Market
Funds
The value of the cash you have invested in the money market
sweep fund(s) you selected for your account. (For Schwab
Investment Accounts, interest is earned on any credit balances
in the account and is not reflected in the Money Market Fund
balance).
Bank
Deposit
Accounts
Schwab acts as your agent and custodian in establishing and
maintaining your Bank Deposit Accounts. Bank Deposit
Accounts constitute direct obligations of the Sweep Bank (as
defined below) and are not an obligation of Schwab. Free Credit
Balances will be deposited into Bank Deposit Accounts without
limit even if the amount in the Bank Deposit Accounts exceeds
the $100,000 FDIC insurance limits. For deposit insurance
purposes, deposits you may establish in one capacity directly
with a Sweep Bank or through an intermediary, such as
Schwab, will be aggregated with the Bank Deposit Accounts.
You are responsible for monitoring the total amount of deposits
you have with the Sweep Bank in order to determine the extent
of deposit insurance coverage available to you. Sweep Bank
means the Schwab-affiliated, FDIC-insured bank, as referenced
in your account statements and disclosed in your account
documents into which free credit balances may be
automatically deposited pursuant to your Account Agreement.
Margin
Balance
The balance of any credits or debits in your margin account.
Note that with a margin account, the balance of unsettled
debits or credits for trades will show here until settlement. You
do not start paying interest until trades are settled.
Short
Balance
The net Open balance in your account arising from short sale
transactions.
Total Cash
The net Cash balance in your Schwab account.
Securities: This displays the value of securities you hold long and short in your
account.
Note: Marginable securities are always held in your margin
account; non-marginable securities are always held in your nonmargin account.
Cash Account & Margin Account
Market
Value Long
The total marked-to-market value of your long positions
(broken out by marginable and non-marginable securities)
based on the last trade price. If for some technical reason realtime valuations are not available, the values displayed may be
based on the prices from the close of the previous business day
or on twenty-minute-delayed quotes.
Market
Value Short
The total marked-to-market value of your short positions
(broken out by marginable and non-marginable securities)
based on the last trade price. Such positions will typically be
shown in the margin account column.
Options: This displays the value of options you hold long and short in your
account.
Copyright © Charles Schwab & Co., Inc. 2006. All rights reserved. (0106-5667)
281
StreetSmart Pro User Manual
Note: Your options are typically held in the margin portion of your
account. Option information only displays for accounts that hold
option positions.
Market
Value
The total value of your long and short options positions based
on their current, real-time market prices. Options are not
marginable securities but are normally shown in the margin
account column for accounting purposes.
Total
Securities
The total values of all long and short securities positions,
including options, in the margin and cash accounts. A combined
net value for the margin and cash accounts is also provided.
Margin/Equity Requirements
Margin
Equity
The dollar value of marginable securities in your margin
account, less the amount you owe Schwab, plus any cash in
your margin account. This is the liquidation value of your
margin account, but does not include option positions,
segregated money market funds, or cash not held in the
margin account. Margin Equity represents the total amount you
invested in securities plus any excess cash, minus funds
borrowed on margin.
Equity
Percent
Your margin equity divided by the market value of your margin
account. This amount reflects the percentage of the current
margin account value you would receive if you liquidated the
margined securities, paid off any margin debt and withdrew the
funds. Options, cash account positions and segregated money
market funds are not included when calculating the equity
percentage.
Day Trade
Buying
Power
This field will only be displayed if we identify you as a pattern
day trader (there are rules governing this designation). For
information about Day Trading Buying Power (DTBP), please
consult your Schwab Active Trader Broker.
Month to
Date Int.
Owed
The amount of margin interest you owe Schwab, accrued from
the beginning of the interest period through the date of your
inquiry. The interest period begins on the second to last day of
each month.
Margin Call
If your margin equity falls below the percentage level required
under Schwab or regulatory requirements; if you make a
purchase for which you have insufficient equity to meet the
Fed's requirements; or if you have insufficient cash to cover
your open, uncovered option or spread positions, you will be
subject to a margin call. If there is a margin call on your
account, it may be displayed at the bottom of the screen and
immediate action on your part is required. However, Schwab
reserves the right to initiate immediate liquidation procedures
without notice.
TIP:
282
Showing/Hiding the Balance Status Bar
Copyright © Charles Schwab & Co., Inc. 2006. All rights reserved. (0106-5667)
Account Detail & Alerts
To hide your Net Worth or any other Balance Status Bar field from being
displayed on your screen, simply click on the label Net Worth next to the
numerical field. The Net Worth field will disappear.
BALANCES BAR
The Balances Bar keeps important account data at your fingertips. You
may customize the types of data shown based on the information that's
most important to you.
To enable, click Toolbar > Balances Bar in the main menu.
To customize, right-click in the Balances Bar and select Customize.
TIP: Hide individual stats in your Balances Bar by clicking on the name.
Today's Change is hidden in the image below.
Select the statistics to display by clicking on Toolbars > Customize > Balances
Bar in the main menu or by right-clicking on the Balances Bar and selecting
Customize... The following settings window opens:
•
Click on an item in the Available Column to view a description of it, then click
Add to select the item for display in the Balances Bar.
•
Change the order in which the fields are displayed in your Balances Bar by
clicking on the field in the Selected Fields column and then click Move Up or
Move Down.
•
To minimize the screen space used by the labels, click Use Abbreviated
Field Labels.
Copyright © Charles Schwab & Co., Inc. 2006. All rights reserved. (0106-5667)
283
StreetSmart Pro User Manual
TIP: Change any of the fields on the fly by right-clicking on the name of the
field and selecting a different one from the drop-down list.
BALANCES BAR FIELDS
Avail to Trade The maximum amount of money in your account that you can
- Cash
use to trade without accessing margin borrowing.
Day Trade BP
Total market value of new securities into which you may enter
and subsequently exit without incurring a margin call.
Margin Equity The dollar value of marginable securities in your margin
account, less the amount you owe Schwab, plus any cash in
your margin account. This is the liquidation value of your
margin account, but does not include option positions,
segregated money market funds, or cash not held in the
margin account. Margin Equity represents the total amount
you invested in securities plus any excess cash, minus funds
borrowed on margin.
Equity Pct
Your margin equity divided by the market value of your
margin account. This amount reflects the percentage of the
current margin account value you would receive if you
liquidated the margined securities, paid off any margin debt
and withdrew the funds. Options, cash account positions and
segregated money market funds are not included when
calculating the equity percentage.
Today's %
Change
The percent change in value of the account since today's
market open, whether due to security price movements,
securities transactions, any other withdrawals and deposits,
or credits and debits.
Today's
Change
The change in value in dollars of the account since today's
market open, whether due to security price movements,
securities transactions, any other withdrawals and deposits,
or credits and debits.
Acct. Net
Worth
The 'liquidation value' of your account (excluding fees,
commissions, pending interest credits and debits, etc.), which
is the combined value of all your cash, money market funds,
margin balances, securities and any miscellaneous
debits/credits in your account.
284
Copyright © Charles Schwab & Co., Inc. 2006. All rights reserved. (0106-5667)
Account Detail & Alerts
Cash
The total dollar value of your unswept or intra-day cash,
money market funds, bank deposit accounts, and net credit or
debit balances.
Margin BP
The maximum value of marginable securities in which you can
invest without depositing more equity in your margin account;
this includes funds you can borrow from Schwab, but does not
include balances in your Cash Account or Money Market
Funds.
Avail to
Withdraw
The maximum amount you can withdraw from your account
by requesting a check or transferring funds to another
account. This value includes the cash balance in your account,
plus the maximum amount you can borrow against
marginable securities held in your margin account.
Settled Cash
to Trade
Trading in a Cash account requires using Settled funds. If a
security is purchased using settled funds, there are no
requirements surrounding the time frame of when the newly
purchased securities can be sold. Settled funds are comprised
of: incoming cash (such as a deposit or wire transfer), any
available Margin Loan Value, or settled proceeds from the sale
of securities that have been fully paid.
Copyright © Charles Schwab & Co., Inc. 2006. All rights reserved. (0106-5667)
285
StreetSmart Pro User Manual
Positions
POSITIONS TAB
The Positions tab displays all open positions for a given account. The positions are
displayed with real-time quotes - regardless of which Schwab venue you used to
enter or exit the position.
The Market Value is calculated based on the number of shares and the current
price. The Price is the current last trade price (streaming). The Change value is the
Change from Close. If you prefer to view the Change from Open go to Settings >
General.
TIPS:
Open Positions Window
The Open Positions window (View > Positions) in the Account Detail window
allows you to execute the same functions as right-clicking on a position in the
Positions tab of the Account Detail window. With a the stand-alone Open
Positions window visible in your layout, you never have to tab back and forth
between Order Status and Positions to see your Positions.
The Open Positions window can be set to graphically display data. To change
the display from Text to Graphical:
1. Open the Open Positions window by going to Account Detail and
selecting View > Positions.
2. When the pop-up window opens, select Settings > General.
3. When the following pop-up box opens, select Graphical.
286
Copyright © Charles Schwab & Co., Inc. 2006. All rights reserved. (0106-5667)
Account Detail & Alerts
The Open Positions window will display the gain or loss of your positions in a
horizontal bar chart.
Auto Sorting
If Auto Sorting is checked, any changes to information in the Positions
window will be sorted into the existing information according to the current
sort order.
For example, if you have your Positions Tab sorted by P&L, as the price
changes for symbols in your window, the list will automatically adjust its sort
order to accommodate those changes.
Each position in your account is displayed in this window, including those in money
market funds. You can sort the table by clicking on any column heading. A second
click will reverse the sort order.
Tab
Columns
Descriptions
Symbol
The unique 1-5 characters used to represent the security.
Symbols are defined by the different markets or exchanges.
Sometimes a security might not have a symbol, in which case,
an internal Schwab reference # will be used.
Name
The full name of the security.
Quantity
For stocks or mutual funds, this field reflects the number of
shares you currently hold. For fixed income securities, this field
reflects the face value of the securities. For options, this field
reflects the number of option contracts.
Price
The price at which the security last traded.
Market
Value
This figure reflects the current value of your position, normally
calculated using real-time quotes, where possible. This value is
updated as the quote changes.
Cost
The total price paid for the position the position,. An asterisk
next to this value indicates that the amount displayed is in
most cases not correct. Usually this is due to incomplete data
on record for the position. If all or part of the position was
purchased before January 2004 then you will see an asterisk.
Copyright © Charles Schwab & Co., Inc. 2006. All rights reserved. (0106-5667)
287
StreetSmart Pro User Manual
Also note that the cost figure provided is the sum of all fills and
does not include commissions or other fees. To correct this
value use either the drop down or right click menu and select
Adjust Cost. You may enter the total amount paid or received
for the position using this function. Once this has been done
the asterisk will disappear even though future fills will not
include commissions and therefore may not be absolutely
accurate. You may adjust the cost as often as you like.
+/- (Profit
or Loss in
Dollars)
Displays the unrealized profit or loss on the position in dollar
format. P&L is calculated based on an average price paid per
share.
! NOTE:
Lot accounting is not used, so P&L is NOT calculated
on a LIFO/FIFO basis. (See example in P&L Calculations topic.)
There are limitations on the reporting of transactions/events
that make up the P&L amounts.
+/-%
(Profit or
Loss as a
percentage)
Displays the unrealized profit or loss on the position as a
percentage. P&L is calculated based on an average price paid
per share.
! NOTE: Lot accounting is not used, so P&L is NOT calculated
on a LIFO/FIFO basis. (See example in P&L Calculations topic.)
There are limitations on the reporting of transactions/events
that make up the P&L amounts.
DRI
This stands for Dividend Reinvestment Instructions. Certain
stocks and mutual funds pay a dividend. These dividends may
be reinvested into additional shares of the security, or can be
paid to you in cash, depending upon your instructions. "Yes"
indicates that the corresponding security's dividend is being
reinvested. "No" indicates that no dividends are being
reinvested for that security and that dividends will be paid in
cash.
Type
Describes what type of security the position is.
Right-click
Options
Load
[Symbol]
into Trading
Window
Descriptions
•
Loads the symbol into the Trading window.
•
The quantity field is set to the Trading window default
size - may not match your position size. Go to Settings
> General to change the default quantity to Set
Quantity to Open Position.
Recent
Stories for
[Symbol]
Loads the symbol into the News window.
Adjust Cost
for [Symbol]
Allows you to add and edit cost information for your position.
Research/Ext
Quote for
Launches a web browser that automatically opens at
schwab.com for quotes and research.
288
Copyright © Charles Schwab & Co., Inc. 2006. All rights reserved. (0106-5667)
Account Detail & Alerts
[Symbol]
Apply Alert
to [symbol]
Opens sub-menu allowing you to use an alert template or
create a new alert.
Close
[Symbol]
Closes out the position and sends a SmartEx order.
Show/Hide
Menu
Shows/removes the Account Detail menu.
P&L CALCULATIONS
Following is an example of how P&L is calculated when there are multiple
executions for one position:
Executions
Average Cost Per
Share
What the Positions
Tab Displays
1/15/04Buy 500 DELL @
20
20
1/15/04 500 DELL Cost
$10,000
Calculation:
(500 * 20) = 10000 -->
20 per share
1/15/04Buy 500 DELL @
30
25
Calculation:
1/15/04 1000 DELL Cost
$25,000
(500 * 30) = 15000 -->
(2500 / 1000) --> 25
per share
1/16/04Sell 200 DELL @
35
1/16/04Sell 400 DELL @
32
25
(note that the sell price
is irrelevant)
25
1/16/04 800 DELL Cost
$20,000
(25 x 800 = 20,000)
1/16/04 400 DELL Cost
$10,000
(25 x 400 = 10,000)
1/17/04Buy 600 DELL @
32
29.20
Calculation:
[(1000 - 200 - 400) *
25] = 10000
1/17/04 1000 DELL Cost
$29,200
(29.20 x 1000 =
29,200)
(600 * 32) = 19200 -->
(29200 / 1000)
--> 29.20 per share
1/17/04Sell 600 DELL @
34
29.20
1/17/04 400 DELL Cost
$11,680
(29.20 x 400 = 11, 680)
Important Information Regarding P&L Calculations for your Accounts
Copyright © Charles Schwab & Co., Inc. 2006. All rights reserved. (0106-5667)
289
StreetSmart Pro User Manual
An asterisk (*) indicates a position with cost data that may be incomplete because
it does not include transactions that occurred prior to August 2004. The cost and
profit and loss data may also be incomplete because it excludes commissions,
transaction fees, and corporate actions such as stock splits, stock dividends, spinoffs, mergers, and name changes. To correct the cost data, select the position and
use the right-click menu to select the “Adjust Cost” function. Please note that the
Account Detail tool is not the official record of your account. Your statements and
confirmations are the official records of your account.
290
Copyright © Charles Schwab & Co., Inc. 2006. All rights reserved. (0106-5667)
Account Detail & Alerts
Transactions
TRANSACTIONS TAB
The Transactions tab displays transactions for the current day, as well as
transactions made within the last 90 days. The Transactions view page is readonly, so the data can not be manipulated, but can be exported for use with other
programs such as MS Excel.
You can view:
•
Trade executions
•
Deposits
•
Withdrawals
•
Trade Away and Prime Broker transactions
•
Transfers between your brokerage and a bank deposit account
! NOTE: Transaction History information is not available in Demo mode.
To View Your Transaction History:
1. Go to the Account Detail window and click on the Transactions tab.
2. Click Transactions > Update in the menu.
3. Enter the number of days you want to view transactions for, up to 90 days.
4. Click OK.
Copyright © Charles Schwab & Co., Inc. 2006. All rights reserved. (0106-5667)
291
StreetSmart Pro User Manual
! NOTE: If your account includes transfers made to or received from a bank
deposit account, the footnote shown in the image above will display.
Tab
Columns
Descriptions
Date
The date the transaction occurred. For trade orders this reflects
the date the order was filled.
Action
This indicates whether a action was a Buy, Sell, Sell Short, or
is left blank for monetary transactions.
Quantity
•
The number of stock or mutual fund shares bought, sold
or sold short.
•
For fixed income securities, this number reflects the face
value of the security you bought or sold.
•
For options, this reflects the number of option contracts
you bought or sold.
•
For monetary transactions, this field will display a zero.
Symbol
The 1-5 letter abbreviation used to represent the security. For
monetary transactions, this field will display a zero.
Description
This field provides a description of the security or an
explanation of the transaction.
Price
This indicates the price you paid or received for the purchase
or sale of a unit of the security. For example, if you bought 10
shares of ABC at $90 a share, the price would be $90. For
monetary transactions, this field will display $0.00.
Amount
This indicates the total amount of the transaction. Numbers
inside ( ) indicate money was deducted from your account.
Numbers without the brackets mean money was deposited into
your account.
Commission
Displays the commission paid for a specific transaction. If no
commission applied or if the trade was executed today, you will
see an asterisk (*).
292
Copyright © Charles Schwab & Co., Inc. 2006. All rights reserved. (0106-5667)
MARKET DATA TOOLS
293
StreetSmart Pro User Manual
Watch Lists
WATCH LISTS
The Watch List allows you to monitor a wide range of streaming market
data (Last, Volume, etc.) about securities of interest to you.
Customize the data you display in your Watch List and save as many
different lists as you want.
To open, click
in the Toolbar.
StreetSmart Pro® software allows you to create as many customized watch lists as
you like - with up to 100 symbols per watch list. And you can have as many as six
watch lists open at a time. Choose the built-in watch list format or customize the
stock data any way you want it to appear on your desktop. In addition to having six
watch lists, you can also have up to 20 tabs per window, allowing up to 120 Watch
Lists running at the same time. Each tab can be setup to copy the setting from
another tab or be unique to the tab itself.
Stock symbols and price and volume data shown here and in the software are for
illustrative purposes only. Charles Schwab & Co., its parent or affiliates, and/or its
employees and/or directors may have positions in securities referenced herein, and
may, as principal or agent, buy from or sell to clients.
My Positions
StreetSmart Pro software also has a My Positions watch list that displays and
dynamically updates the equity and option positions you currently hold. Unlike the
customized Watch Lists, the My Positions Watch List will contain symbols for each
position you hold in your account. Symbols are added to or deleted from this watch
list as positions are bought or sold.
Open My Positions from the Tools > Start Tool window or by clicking the
in the toolbar.
294
Copyright © Charles Schwab & Co., Inc. 2006. All rights reserved. (0106-5667)
icon
Market Data Tools
WATCH LIST MENU
The following menu items will help you set up preferences and perform certain
tasks in the Watch List window:
FILE
Load
Watch
List
Selecting this feature will allow you to load built-in or personalized
Watch Lists into your Watch List window.
Save
Watch
List As
Selecting this feature will allow you to save your current stock list
to a file on your computer, which you can load later.
Clear
Removes the symbols currently in your Watch List window.
Stock List
Page
Setup
Enables you to customize the current page for printing. Read the
Printing Windows topic in the Getting Started section for more
information.
Print
Prints the information in your Watch List window.
Export
Saves the current stock list to a text (.txt) file in your SSPro
folder, which can then be opened in Excel or other third-party
software.
0, 1, 2,
3...
Watch List will remember the last 10 files that have been opened.
To toggle between files, click on any of them.
Close
Closes the Watch List window.
SETTINGS
Columns
•
Click Settings > Columns to change the data fields
displayed in the Watch List columns.
•
Move Columns you want to see in the Watch List over to the
Selected Columns
•
Column data can also be changed by right-clicking the Watch
List column heading.
•
You can change the order of the column data by dragging the
column heading box to the desired column location.
Copyright © Charles Schwab & Co., Inc. 2006. All rights reserved. (0106-5667)
295
StreetSmart Pro User Manual
Enable Sorting: When checked, you can simply click on any
column header to sort by that column.
Auto Sorting: When checked, the sort order will change in real
time as new data comes through. For example, if you were
sorting by the Price column and Auto Sorting was checked, the
sort order of the watch list would change as prices changed.
Long Names/Abbreviations: Select which format you would
like for displaying the Sector, Industry, and Sub-Industry
columns.
Symbol List Adding Symbols:
1. Click Settings > Symbol List.
2. In the Symbol List window type in the stock or index
3. After typing each, press Enter on your keyboard or click
the Add button
4. After all the stocks and indices have been entered, click
OK.
(Another way of adding/deleting stocks to the Watch List is by
pressing the Insert/Delete key on the keyboard. Type in the
stock to add/delete in the Insert/Delete box that appears.)
Saving a Symbol List:
1. Click File > Save Stock List As...
2. In the Save window that appears, type in the file name
you would like to save the list as, then click Save.
Option
Greeks
Settings
Greeks indicate how fast an option price is changing relative to
parameters such as time, underlying stock price, volatility, etc.
Pricing Method: Select from Black-Scholes, Barone-AdesiWhaley, or Cox-Ross-Rubinstein.
Interest Rate: Defaults to the 3-Month Treasury I-rate Index
296
Copyright © Charles Schwab & Co., Inc. 2006. All rights reserved. (0106-5667)
Market Data Tools
rate, but you can select User Defined Rate and change the
interest rate to any you wish.
Fonts
Click on Fonts to change these settings.
Colors
Click on Colors to change background and font colors.
Color Row
Allow you to match the coloring of all the fields for a given
symbol based on any of the fields that could potentially display
positive or negative data, including:
•
Change from Close (Close*)
•
Change from Previous (Prev*)
•
Change from Open Percent (Open*(%))
•
Percent Change from Close (Close*(%))
EXAMPLE If you wish to use Change from Close as the field
that determines the color, click Settings > Color Row > by
Close*. Upon doing so, each row of data will be colored green
or red to reflect whether the Change from Close was positive or
negative, respectively. If any of these fields are not being used
in your Watch List, they will be grayed out
TABS
For more on tabs visit the Adding Tabs to Windows topic
Enable
When checked, allows you to maximize screen space while
still having quick access to several windows within one
window. When unchecked, you must open several
independent windows to view multiple Watch Lists. See the
Adding Tabs to Windows topic for directions.
Insert
Select to add a new tab to the window. See the Adding
Tabs to Windows topic for directions.
Edit [tab name]
Select to edit the current tab's settings, including the name
and location.
Delete [tab
name]
Select to delete the current tab from the window.
Copyright © Charles Schwab & Co., Inc. 2006. All rights reserved. (0106-5667)
297
StreetSmart Pro User Manual
TIPS:
•
Quick Clear - Clear all symbols from a Watch List by clicking on File >
Clear Watch List or by clicking Settings > Symbol List then click
Remove All.
•
Auto Sorting - To have your Watch List display the symbols in your
preferred order:
1. Uncheck both the Enable Sorting and Auto-Sorting check boxes
using Settings > Columns.
2. Clear the Watch List via File > Clear Watch List.
3. Insert the symbols, one at a time, in the order you wish to view them
using either the Insert key or by right-clicking in the Watch List and
selecting Add Symbol.
•
Right-Click Shortcuts for Watch Lists
o
Load [Symbol] into the Trading window.
o
Recent Stories for [Symbol], which opens recent news for the symbol in
the News window
o
Link to Research/Ext. Quote for [Symbol].
o
Add or remove symbols from the watch list or remove the symbol you’re
on.
o
Hide/Show Menu.
o
When using an Option Symbol, the Hypothetical Option Pricing model is
available.
o
Access help for the Watch List window.
WATCH LIST COLUMN DESCRIPTIONS
Watch Lists can track more than 70 different criteria for stocks, indices, and
options. Each criterion is displayed in separate columns.
Column Name
Description
Symbol
Stock, option,or index symbol. This column cannot be
removed or moved within the Watch List.
% Chg (Close)
Percentage change from last close price to current price.
% Chg (Open)
Percentage change from open price to current price.
% Chg (Prev
Close)
Percentage change from the previous day's close to the
current price.
52 Wk High
Highest price reached in the past 52 weeks (not including
today)
52 Wk Low
Lowest price reached in the past 52 weeks (not including
today)
Alerts
Displays the name of any alerts you have activated for the
stock.
298
Copyright © Charles Schwab & Co., Inc. 2006. All rights reserved. (0106-5667)
Market Data Tools
Ask
Current ask price.
Ask Size
Number of shares at the inside ask.
Avg Volume - 1
month
Average of the security's volume for the past month.
Avg Volume - 5
day
Average of the security's volume for the past five days.
Avg Volume - 20
day
Average of the security's volume for the past 20 days.
Avg Volume - 6
months
Average of the security's volume for the past six months.
Avg Volume YTD
Average of the security's volume for the year to date.
Bid
Current bid price
Bid Size
Number of shares at the inside bid.
Chg (Close)
Change from the last close price to current price.
Chg (Open)
Change from open price to current price.
Chg (Prev Close)
Change from the previous day's close price to current
price.
Chg (Prev)
Total change for the security between the last and second
to the last trade.
Close
Closing price from the previous market session.
Close Far $**
Close Crossing price at which orders in the closing book
would clear against each other. NASDAQ stocks only.
Close
Imbalance**
Number of closing shares that would remain unexecuted
at the current reference price and the side of the
imbalance (buy, sell, or none if there is no imbalance).
Applies to NASDAQ and NYSE stocks.
Close Near $**
Close Crossing price at which orders in the closing book
and continuous book would clear against each other.
NASDAQ stocks only.
Close Paired**
Number of closing shares that are able to be paired off at
the current reference price. Applies to NASDAQ and NYSE
stocks.
Close Ref $**
A Close price within the NASDAQ inside at which paired
shares are maximized, the imbalance is minimized and
the distance from the bid-ask midpoint is minimized.
Applies to NASDAQ and NYSE stocks.
Delta
Indicates how much the price of a call option moves for
every one-point move in the price of the underlying
Copyright © Charles Schwab & Co., Inc. 2006. All rights reserved. (0106-5667)
299
StreetSmart Pro User Manual
security.
Description
Full name of the company, security, or index.
Div Amount
Taxable payment declared by a company's board of
directors and given to its shareholders out of the
company's current or retained earnings.
Dollar Volume
The dollar amount of shares/contracts traded for the day
on a security or options contract. Calculated as VWAP
(Volume Weighted Average Price) multiplied by the day's
total volume.
Ending Ask
Ending ask price of the market session
Ending Bid
Ending bid price of the market session
EPS (12 Mo)
Earnings Per Share shows net income divided by the
number of shares outstanding for a company for the last
12 months.
Exchange
Exchange (NYSE, NASDAQ, etc.) on which the security is
listed.
Expiration
Shows the expiration date of the option chains in your
Watch List.
Gamma
Measures the change in delta for a change in the
underlying security price.
GICS Code
Global Industry Classification Standard code. A two- to
eight-digit ordered code that indicates a company's
sector, industry, and sub-industry.
High
Highest price at which the security has traded for the day.
Impl Vol
Estimated volatility of a security underlying an option
price based on the option price.
Impl Vol (Ask)
Implied Volatility based on ask price.
Impl Vol (Bid)
Implied Volatility based on bid price.
Industry
GICS (Global Industry Classification Standard) Industry
classification. From broad to specific, helps define a
company's business focus. Also, helps identify
competitors.
Last Price
Last trade price for a stock or the last value for an index.
Last Size
Last trade size
Low
Lowest price at which the security has traded for the day.
Mkt Cap
Market value of all of a company's outstanding shares (in
millions).
300
Copyright © Charles Schwab & Co., Inc. 2006. All rights reserved. (0106-5667)
Market Data Tools
Mkt Cap Class
Classifies the size of a company by Small/Medium/Large
(the -/+ indicates where the company falls within the
broader classification, i.e. M+ is a larger mid-cap
company).
News
Shows the availability of news on a stock. Double-click the
icon to launch News window with the latest headlines on
that stock. The news icon will change from yellow to white
once you have accessed the article.
Stock symbols and price and volume data shown here and
in the software are for illustrative purposes only. Charles
Schwab & Co., its affiliates, and/or its employees and/or
directors may have positions in securities referenced
herein.
NYSE Ask
Current NYSE ask price
NYSE Ask Size
Highest number of shares posted by a particular market
participant within the inside NYSE Ask.
NYSE Bid
Current NYSE Bid price.
NYSE Bid Size
Highest number of shares posted by a particular market
participant within the inside NYSE Bid.
Open
Opening price for the day.
Open Far $**
Open Crossing price at which orders in the opening book
would clear against each other. NASDAQ stocks only.
Open
Imbalance**
Number of opening shares that would remain unexecuted
at the current reference price and the side of the
imbalance (buy, sell, or none if there is no imbalance).
NASDAQ stocks only.
Open Int
Total number of outstanding options contracts that have
not yet been offset or fulfilled for delivery.
Open Near $**
Open Crossing price at which orders in the opening book
would clear against each other. NASDAQ stocks only.
Open Paired**
Number of opening shares that are able to be paired off at
the current reference price. NASDAQ stocks only.
Open Ref $**
An Open price within the inside at which paired shares are
maximized, the imbalance is minimized and the distance
from the bid-ask midpoint is minimized. NASDAQ stocks
only.
Copyright © Charles Schwab & Co., Inc. 2006. All rights reserved. (0106-5667)
301
StreetSmart Pro User Manual
P/E (12 Mo)
Ratio of company's current share price compared to its
earnings per share. The higher the P/E ratio, the more the
market is willing to pay for each dollar of annual earnings.
Pos Dollar Value
Dollar value for existing position(s) in the account.
Calculation uses the bid price for long positions and the
ask price for short positions.
Prev Close
Closing price from previous market day's session.
Rho
Change in the price of an option resulting from a 1%
change in interest rates.
Sector
GICS (Global Industry Classification Standard) Sector
classification. From broad to specific, helps define a
company's business focus. Also, helps identify
competitors.
Spread
Difference between the Bid and the Ask.
Strike
Option Strike Price.
Sub-industry
GICS (Global Industry Classification Standard) SubIndustry classification. From broad to specific, helps
define a company's business focus. Also, helps identify
competitors.
Theta
Change in option price in relation to the time left before
the option expires.
Tick
Arrow indicating direction of last tick.
Vega
Change in option price in relation to a 1% change in
volatility.
Volume
Volume for the day.
**These columns display market data for Opening and Closing Cross orders.
NASDAQ and NYSE accept and store on-close order types that are executable only
at market close. Leading up to the close, the exchanges disseminate information
about order imbalances in the closing book, along with an indicated closing price.
At 4:00 p.m., Eastern Time (ET), the closing book and the continuous book are
brought together to create a single Closing Cross.
! NOTES:
•
Uptick arrow is green, downtick arrow is red.
•
The last trade is green when it is above the Ask and red when it's below the
Bid.
•
The Tick indicator is determined by the Chg (Prev) field.
•
While you can create an unlimited number of Watch Lists each with separate
symbols, fields, and columns -- you are limited to six open Watch List
302
Copyright © Charles Schwab & Co., Inc. 2006. All rights reserved. (0106-5667)
Market Data Tools
windows at a time and each window can have up to 20 tabs containing
separate watch lists.
•
Watch Lists update during all trading sessions.
•
When entering an option symbol, be sure you precede the symbol with a
period (.), for example: .INQFF or follow it with .o, for example: INQFF.o
LOAD A WATCH LIST
Customized and built-in Watch Lists are easy to launch:
1. Go to the Watch List Menu Bar and click File.
2. The last 10 viewed or built-in Watch Lists will appear in the drop-down
menu.
3. Click the Watch List you want to see.
or
1. Click File > Load Watch List.
2. Select the Watch List file name you want.
3. Click Open.
ADDING/REMOVING SYMBOLS
Symbols can be easily added or removed from the Watch Lists, but not from the My
Positions Watch List. Here are three ways to change the contents of a Watch List:
1. Quick Add or Remove
•
Click in the Watch List window where you want to add or delete a
symbol.
•
Press the Delete (Quick Remove) to remove the selected symbol.
•
Press Insert (Quick Add) key on your keyboard to add a symbol.
•
If you’re entering an option, be sure you precede the symbol with a
period ( . ), for example, .INQFF.
Copyright © Charles Schwab & Co., Inc. 2006. All rights reserved. (0106-5667)
303
StreetSmart Pro User Manual
•
If you’re entering an index, be sure you precede the symbol with a
dollar sign( $ ), for example, $SPX.
•
Press Enter or click OK.
•
! NOTE: This will not permanently change the stocks in your Watch
List. To save your changes, see Save Watch Lists.
2. Right-Click Add / Remove
•
Right-click in the Watch List window to be updated.
•
Click Add Symbol or Remove Symbol.
•
Right-click on a group name and select Add symbol to group to
add a new symbol to an existing group.
3. Add or Delete Using the Symbol List
To Add Symbols:
•
Click on Settings > Symbol List in the Watch List Menu.
•
Enter the new symbol in the Add Symbol window.
•
If you’re adding an option, precede the symbol with a period ( . ), for
example, .INQFF.
•
To add to a group, click the group name and then Add Symbol to
Group. To add the symbol independently, click Insert Symbol.
•
When you’re finished entering, click OK.
To Remove Symbols:
•
Highlight the symbol to be deleted from your list and click Remove.
•
When you’re finished, click OK.
•
! NOTE: This will not permanently change the stocks in the Watch
List. To save your changes, see Save Watch Lists.
SORT WATCH LIST DATA
It’s easy to sort data in your Watch Lists to extract information like:
•
The day’s best performers
•
The stock in your Watch List with the highest trading volume
To activate this feature, go to Settings > Columns, and check the Enable
Sorting box.
•
With Enable Sorting checked, you can sort the data by clicking the column
header for the criteria you want sorted. If you want to reverse the sorting
order of the column, click the column header again.
You can then select Auto Sorting. Auto Sorting allows you to select one column to
determine the order in which your symbols are displayed.
For example, when you have Enable Sorting and Auto Sorting selected, click on
the Volume column. The securities with the highest volume for the day will now be
displayed first and as the data changes through the day, it will continue to sort so
304
Copyright © Charles Schwab & Co., Inc. 2006. All rights reserved. (0106-5667)
Market Data Tools
that the stock with the highest volume stays at the top. To reverse the order that
they are displayed, click the Volume column header again.
! NOTE:
If you want your symbol list to be in the same order as when you set up
the list, 'uncheck' Enable Sorting.
WATCH LIST GROUPS
Not only may you add individual symbols to your Watch Lists, you may also add
Symbol Groups, which can help you organize your symbol lists and manage screen
space more effectively.
Stock symbols and price and volume data shown here and in the software are for
illustrative purposes only. Charles Schwab & Co., its parent or affiliates, and/or its
employees and/or directors may have positions in securities referenced herein, and
may, as principal or agent, buy from or sell to clients.
In the image above, you see that we have set up a Tech group. We can close this
group by clicking the minus (-) and reopen it by clicking the plus (+).
Creating a Group
1. Right-click in the Watch List and select Insert Group.
2. In the white box that appears in the Symbol column, type the name of the
group and press Enter.
3. Edit the group name, if necessary, by right-clicking on the group and
selecting Edit Group Name.
Copyright © Charles Schwab & Co., Inc. 2006. All rights reserved. (0106-5667)
305
StreetSmart Pro User Manual
Adding/Removing Symbols in a Group
•
You can add symbols either directly in the Watch List by right-clicking on the
name of the group and selecting Add Symbol to Group. Enter the symbol
and click OK.
•
You can add several symbols at once by clicking Settings > Symbol List in
the Watch List menu. Fill in the Symbol field, click on the name of the group
you wish to add it to, and click Add Symbol to Group.
•
To remove a symbol, right-click on it and select Remove [symbol].
SAVE WATCH LISTS
You can save as many different Watch Lists as you like.
To Save a Watch List:
1. Go to the Watch List Menu Bar and click on File > Save Watch List As.
2. Type in the file name and click Save.
3. The .stk file will save to your Stocklists folder (unless you specify another
location).
HYPOTHETICAL OPTION PRICING
Hypothetical Option Pricing, available by right-clicking on any option symbol in a
Watch List and selecting Hypothetical Parameters for [symbol], allows you to
manually adjust variables involved in option pricing to see how changes affect the
option values. This is one way to test your assumptions to see what the price of the
option would be if your assumptions hold true. Below are a couple of examples on
how this function can be used:
306
Copyright © Charles Schwab & Co., Inc. 2006. All rights reserved. (0106-5667)
Market Data Tools
EXAMPLE 1 You are bullish on a stock, but decide to purchase calls instead of the
stock, so you can get more leverage. You anticipate the stock will go up about 2
points in the next week. You use the hypothetical model to add 2 points to the
underlying price, and take away 7 days from the days to expiration. This gives you
an indication that the call option you are considering might gain about 1.54, if the
stock goes up 2 points over a the next 7 days.
EXAMPLE 2 You can also see how the greeks change as the variable change. For
example, since a Delta will increase as an option gets farther in the money, in the
example above, you would see the Delta change from its current level of about .68
up to .90. This tells you that while it only earned .77 for every dollar so far,
additional moves to the upside will yield about .90 for every dollar if it continues to
go up.
Copyright © Charles Schwab & Co., Inc. 2006. All rights reserved. (0106-5667)
307
StreetSmart Pro User Manual
Tickers
PRINT TICKER
The Print Ticker filters through large volumes of market data on stocks
and indices to help you identify incremental real-time price changes.
To open, click Tools > Start Tools in the main menu and select Print Ticker.
The Print Ticker helps you monitor trades being executed for several securities at
once. You can set it to show all trades for the securities in your list of symbols, or
you can filter out excess data by adjusting the increments at which a trade is
posted.
Each trade, or print, can also display the trade price, quantity, and change from
open or close for the trade. You may watch up to 250 symbols in the Print Ticker,
which can be loaded:
•
individually by pressing Insert on your keyboard and entering a symbol,
•
from a Stock List created in the Watch List or other windows by going to File
> Load Stock List, or
•
from the menu under Settings > Symbol List.
! NOTE: When using Stock Lists, you can only load one list into the window. If
you load a second list, it will replace the first list you had already loaded.
Stock symbols and price and volume data shown here and in the software are for
illustrative purposes only. Charles Schwab & Co., its parent or affiliates, and/or its
employees and/or directors may have positions in securities referenced herein, and
may, as principal or agent, buy from or sell to clients.
308
Copyright © Charles Schwab & Co., Inc. 2006. All rights reserved. (0106-5667)
Market Data Tools
TIP: Also available is the Position Print Ticker, which automatically loads any
securities in which you hold a position. The features are the same as the regular
Print Ticker, with the exception of the Symbol List option in the menu. You cannot
add stocks you do not own to the Position Print Ticker.
The Print Ticker window can be scrolled vertically using the Page Up and Page
Down buttons of the keyboard or by using the scroll bars at the right and bottom
of the window.
FILE
Load Stock
List
Selecting this feature will allow you to load a previously saved
Stock List into your Print Ticker.
Save Stock
List As
Selecting this feature will allow you to save your current stock
list to a file on your computer, which you can load later.
Clear Stock Unloads the current Stock List leaving you with a blank Print
List
Ticker window. This enables you to start a new Stock List from
scratch by Adding Symbols (see Symbol List below for more info
on adding and deleting symbols).
0,1,2,3...
Print Ticker will remember the last ten (10) stock list files you
have opened. To toggle between files, click on any of them.
Close
Closes the Print Ticker window.
SETTINGS
General
•
Put a check next to the columns you wish to display.
•
If you want to check Change from Open, you should first
uncheck Change from Previous Close, and vice versa.
Data Filter Increment: This feature allows you to filter prints
based on the increment value change you specify here, from .01 to
1.00.
EXAMPLE If you only want new prints to display every time the
trade price changes by .10, set this to .10 using the arrow buttons.
Copyright © Charles Schwab & Co., Inc. 2006. All rights reserved. (0106-5667)
309
StreetSmart Pro User Manual
Then when any of the stocks in your symbol list prints a trade .10
higher or lower than the last trade it printed, the symbol, quantity,
etc. will display in the Print Ticker window. The color will
correspond to whether it's a negative or a positive change.
Note, however, that the increment value trails the trade price, so if
the price reverses down a few cents but not the full amount of the
increment, the trade price will be reset to the lower price.
Symbol
List
Manage the list of symbols in your Print Ticker window from here.
To add a symbol, enter it in the Symbol field and click Add (or
press Enter). To remove, click on a symbol and click Remove.
Click Remove All to clear all symbols from the list.
Fonts
Click to adjust font settings.
Colors
Click to adjust color settings.
TABS
Enable
When checked, allows you to maximize screen space while
still having quick access to several windows within one
window. When unchecked, you must open several
independent windows to view multiple Print Tickers. See the
Adding Tabs to Windows topic for directions.
Insert
Select to add a new tab to the window. See the Adding Tabs
to Windows topic for directions.
Edit [tab
name]
Select to edit the current tab's settings, including the name
and location.
Delete [tab
name]
Select to delete the current tab from the window.
POSITION PRINT TICKER
The Position Print Ticker automatically displays prints for any securities
in which you hold a position. The features are the same as the Print
Ticker, except you cannot add stocks you do not own.
To open, click Tools > Start Tools in the main menu and select Position
Print Ticker.
The Position Print Ticker window can be scrolled vertically using the Page Up and
Page Down buttons of the keyboard or by using the scroll bars at the right and
bottom of the window.
310
Copyright © Charles Schwab & Co., Inc. 2006. All rights reserved. (0106-5667)
Market Data Tools
Stock symbols and price and volume data shown here and in the software are for
illustrative purposes only. Charles Schwab & Co., its parent or affiliates, and/or its
employees and/or directors may have positions in securities referenced herein, and
may, as principal or agent, buy from or sell to clients.
FILE
Close
Closes the Position Print Ticker window.
SETTINGS
General
•
Put a check next to the columns you wish to display.
•
If you want to check Change from Open, you should first
uncheck Change from Previous Close, and vice versa.
Data Filter Increment: This feature allows you to filter prints
based on the increment value change you specify here, from .01 to
1.00.
EXAMPLE If you only want new prints to display every time the
trade price changes by .10, set this to .10 using the arrow buttons.
Then when any of the stocks in your symbol list prints a trade .10
higher or lower than the last trade it printed, the symbol, quantity,
etc. will display in the Position Print Ticker window. The color will
correspond to whether it's a negative or a positive change.
Copyright © Charles Schwab & Co., Inc. 2006. All rights reserved. (0106-5667)
311
StreetSmart Pro User Manual
Note, however, that the increment value trails the trade price, so if
the price reverses down a few cents but not the full amount of the
increment, the trade price will be reset to the lower price.
Fonts
Click to adjust font settings.
Colors
Click to adjust color settings.
SCAN TICKER
The Scan Ticker alerts you on block trades and print quote changes on
stocks and index symbols in real-time.
Streaming, real-time visual cues show when large players execute a
trade, affecting market liquidity.
To open, click
in the Toolbar.
The Scan Ticker window consolidates four different types of trade alerts into one
customizable window:
Stock symbols and price and volume data shown here and in the software are for
illustrative purposes only. Charles Schwab & Co., its parent or affiliates, and/or its
employees and/or directors may have positions in securities referenced herein, and
may, as principal or agent, buy from or sell to clients.
•
Print Signals - Alerts you to trades taking place at the inside bid/ask, as
well as trades below or above the inside bid/ask by a specified amount, for
the securities in your symbol list. You can also specify the minimum quantity
a trade must have before its print signal is sent to the Scan Ticker.
•
Block Signals - Alerts you to large quantity trades on NYSE, NASDAQ, or
both. You can specify the minimum block size you wish to be notified about
as well as whether to receive signals about all available securities or just
those in your symbol list.
312
Copyright © Charles Schwab & Co., Inc. 2006. All rights reserved. (0106-5667)
Market Data Tools
•
Quote Signals - Alerts you to changes at the inside bid/ask for the
securities in your symbol list, and identifies whether the change was positive
or negative by coloring the quote in green or red respectively.
•
Spread Signals - Alerts you to stock whose inside bid/ask prices are
crossed and/or locked. You can also specify that spread signals where the
spread is greater than a specified amount are not displayed.
To add symbols to the Scan Ticker:
•
Click File > Load Stock List and select a stock list to load, or
•
Right-click in the window and select Add Symbol. Enter the symbol, click
OK, and the Scan Ticker will start scanning for activity in that stock.
To delete symbols from the Scan Ticker:
•
Click File > Clear Stock List to delete all symbols from the ticker, or
•
Right-click in the window and select Remove Symbol. Enter the symbol,
click OK, and the Scan Ticker will quit scanning for activity in that stock.
FILE
Load Stock
List
Selecting this feature will allow you to load a previously saved
Stock List into your Scan Ticker.
Save Stock
List As
Selecting this feature will allow you to save your current stock
list to a file on your computer, which you can load later.
Clear Stock
List
Clears the current stock list so that you no longer receive data
on those stocks.
0,1,2,3...
Scan Ticker will remember the last ten (10) stock list files you
have opened. To toggle between files, click on any of them.
Close
Closes the Scan Ticker window.
Copyright © Charles Schwab & Co., Inc. 2006. All rights reserved. (0106-5667)
313
StreetSmart Pro User Manual
SETTINGS
General
Print Signals: Check the boxes to view prints (trades) at the inside
Bid or Ask or prints less than the bid and greater than the ask.
•
If you check Prints < Bid or Prints > Ask, specify how
much above or below the bid/ask you want the print before it
displays the signal.
•
Also, specify the minimum number of shares a stock trade
should have before the print displays.
Block Signals: Specify the minimum block size you wish to be
notified about using the 100, 1k and 10k arrow buttons.
•
You can elect to receive signals about all available securities
or just those in your symbol list by checking or unchecking
Use Symbol List.
•
Also, select whether to include All NYSE, All NASDAQ or
both types of stocks.
Quote Signals: Check the boxes to view quote changes at the
inside bid and ask.
Spread Signals: To view crossed and/or locked stocks, check the
appropriate boxes.
•
314
To hide or display signals where the spread is greater than a
specified amount, check Don't display alerts... and use the
up and down arrow buttons to adjust the spread amount.
Copyright © Charles Schwab & Co., Inc. 2006. All rights reserved. (0106-5667)
Market Data Tools
Symbol
List
Manage the list of symbols in your Print Ticker window from here.
To add a symbol, enter it in the Symbol field and click Add (or
press Enter). To remove, click on a symbol and click Remove. Click
Remove All to clear all symbols from the list.
Filters
Price-Level Filter
The Price-Level Filter allows you to set the price level below which,
and above which, a stock will be ignored.
1. Check the boxes to the left of the options to enable that
filter.
2. Clicking on the "buttons" provided to increase or decrease
the prices within the Ignore Stocks Below and Ignore
Stocks Above settings.
These can be adjusted in $1 and $10 intervals such that the
minimum price below which a stock will be ignored based on
yesterday's close is $1 and maximum price above which a
stock will be ignored is $1000.
The Default settings are $1 and $200 respectively.
3. Click on OK after the filters have been set.
Five Day Avg Volume Filter
To ignore symbols with a five day average volume below a certain
value, use the up and down arrows to specify that value and check
Ignore Stocks Below...
Five Day Avg. Dollar Volume Filter
To ignore symbols with a five day average dollar volume below a
certain value, use the up and down arrows to specify that value,
Copyright © Charles Schwab & Co., Inc. 2006. All rights reserved. (0106-5667)
315
StreetSmart Pro User Manual
and check Ignore Stocks Below...
Fonts
Click to adjust font settings.
Colors
Click to adjust color settings.
316
Copyright © Charles Schwab & Co., Inc. 2006. All rights reserved. (0106-5667)
Market Data Tools
Top Ten
TOP TEN
Quickly identify highly active securities based on volume or price
changes using the Top Ten window.
To open, click
in the Toolbar.
Traders can react to active securities by quickly consulting the Top Ten window.
View Top Volume, Top Gainers, and/or Top Decliners for NASDAQ® and/or NYSE
Data. Also available for the options markets.
Top Volume, Gainers and Decliners shows the "Top 10" stocks in terms of volume
and largest advance and decline by either points or percentage. Up to two Top Ten
windows may be opened at a time and up to 2 tabs can be added to each window.
Stock symbols and price and volume data shown here and in the software are for
illustrative purposes only. Charles Schwab & Co., its parent or affiliates, and/or its
employees and/or directors may have positions in securities referenced herein, and
may, as principal or agent, buy from or sell to clients.
•
The Top Ten can display the symbol, total volume, change from close (points
up or down from yesterday's close) in each window.
•
You have the option of displaying either the NASDAQ and NYSE Top Ten
window or both.
•
As new stocks enter the Top Ten lists they are highlighted in baby blue.
•
This window is active only during the standard session. During the premarket session it will remain empty, and during the after hours session will
display information based on the close of the standard session.
•
! NOTE:
For a security to be displayed on the "Top Ten" list, it must be
above $2 per share.
Copyright © Charles Schwab & Co., Inc. 2006. All rights reserved. (0106-5667)
317
StreetSmart Pro User Manual
To open the Top Ten windows:
1.
Go to Tools > Start Tools.
2.
Put a check next to NASDAQ Top Ten, NYSE Top Ten, or both.
3.
Click Start
or
1. Click on the Top Ten icon
in the toolbar.
2. If neither window is open (NASDAQ or NYSE), clicking on the toolbar icon
will launch both windows.
3. If one window is open, clicking on the toolbar icon will launch the window
that is not open.
FILE
Close
Closes the Top Ten window.
SETTINGS
General
•
Visible Boxes: Check Top
Volume/Gainers/Decliners to see that data in your
Top Ten window. Uncheck to hide that box.
•
Visible Columns: Each box above can show up to three
columns of data, the viewing or hiding of these is
controlled here. Check next to Volume, Change from
Close, or % Change from Close to view; uncheck to
hide.
•
Layout: Vertical layout will align boxes above each
other. Horizontal layout will align them side-by-side.
•
Sort Gainers/Decliners by: You may choose whether
to sort your Top Ten windows by the securities' Change
from Close or % Change from Close.
•
Data Type: Defaulted and protected to the exchange
(NASDAQ or NYSE) for which the data is displayed.
•
Filter out zero prices, volumes & percentages:
When checked, this eliminates potentially erroneous
data from the display.
Fonts
Click to adjust font settings.
Colors
Click to adjust color settings.
TABS
Enable
Clicking Enable will add 2 tabs to the Top 10 Window.
Insert
Select to add a new tab to the window. See the Adding Tabs to
Windows topic for directions.
Edit [tab
name]
Select to edit the current tab's settings, including the name and
location.
318
Copyright © Charles Schwab & Co., Inc. 2006. All rights reserved. (0106-5667)
Market Data Tools
Delete [tab
name]
Select to delete the current tab from the window.
Copyright © Charles Schwab & Co., Inc. 2006. All rights reserved. (0106-5667)
319
StreetSmart Pro User Manual
Options Top Ten
OPTIONS TOP TEN
Quickly identify highly active option Series, Classes, and Contracts
based on volume or price changes using the Option Top Ten windows.
To open, click Tools > Start Tools in the main menu and select the Option Top
Ten window you wish to view.
The Option Top Ten window allows you to view the top ten Series, Classes, or
Contracts for a particular class by volume, gains, declines, put/call volume,
percent gains, and percent declines.
Stock symbols and price and volume data shown here and in the software are for
illustrative purposes only. Charles Schwab & Co., its parent or affiliates, and/or its
employees and/or directors may have positions in securities referenced herein, and
may, as principal or agent, buy from or sell to clients.
In the Settings > General menu, you may customize your Option Top Ten
window(s) to your specific needs, including filtering by whether they are in or outof-the-money and by particular expiration month.
320
Copyright © Charles Schwab & Co., Inc. 2006. All rights reserved. (0106-5667)
Market Data Tools
Opening an Option Top Ten Window
1. Go to Tools > Start Tool in the Main menu
2. Next to Options Top 10 (Class, Series, and/or Single), increase the number
of windows by clicking on the up and down arrow buttons.
3. Click Start.
FILE
Close
Closes the Options Top Ten window.
SETTINGS
General
The General Settings window is a little different for each type of
Option Top Ten window, but following are all the options
available among the three.
•
Visible Boxes: Check Top Volume/Gainers/Decliners
to see that data in your Top Ten window. Uncheck to hide
that box.
•
Visible Columns: Each box above can show up to three
columns of data, the viewing or hiding of these is
controlled here. Check next to Volume, Change from
Close, or % Change from Close to view; uncheck to
hide.
•
Layout: Vertical layout will align boxes one on top of the
other. Horizontal layout will align them side-by-side.
•
Sort Gainers/Decliners by: You may choose whether
to sort your Top Ten windows by the securities' Change
from Close or % Change from Close.
•
Filters:
o
In the Single Top Ten window, enter the
underlying symbol for which you wish to see the
top contracts in the Symbol field.
o
In Class Top Ten, you may enter up to 5 symbols
to exclude from your top ten window.
o
Select from the remaining options the type of
information you wish you see in your Option Top
Ten window: Show Stocks, Show Indices,
Show Calls, Show Puts, Show Option Name,
Show Zero Volume.
o
Also, select whether to view items that are only
In-the-money, only Out-of-the-money, or
both (All money).
o
Finally, select an expiration month or leave the
default All months.
Fonts
Click to adjust font settings.
Colors
Click to adjust color settings.
Copyright © Charles Schwab & Co., Inc. 2006. All rights reserved. (0106-5667)
321
StreetSmart Pro User Manual
TABS
Enable
Clicking Enable will add 2 tabs to the Options Top Ten
Window.
Insert
Select to add a new tab to the window. See the Adding Tabs to
Windows topic for directions.
Edit [tab
name]
Select to edit the current tab's settings, including the name
and location.
Delete [tab
name]
Select to delete the current tab from the window.
Options carry a high level of risk and are not suitable for all investors. Certain
requirements must be met to trade options through Schwab. Multiple leg options
strategies will involve multiple commissions. Please read the Options Disclosure
Document titled "Characteristics and Risks of Standardized Options" before
considering any option transaction. Call your local Schwab office or write Charles
Schwab & Co., Inc. 101 Montgomery Street, San Francisco, CA 94104 for a current
copy. Member SIPC
322
Copyright © Charles Schwab & Co., Inc. 2006. All rights reserved. (0106-5667)
Market Data Tools
Highs & Lows
HIGHS & LOWS
Stocks breaking new highs or lows may be breaking through resistance
or support levels, possibly indicating a changing trend.
Find stocks and indices trading at new highs and lows on an intraday
and/or 52-week basis. Take advantage of the proximity alerts to
recognize when stocks are trading near their intraday and 52-week
highs and lows.
To open, click
in the Toolbar.
The Highs and Lows window displays the stocks on either the NYSE or NASDAQ
exchanges that are breaking daily highs and lows, plus 52-week breaks and
proximity alerts. The NYSE window will display all listed equities, not only those
traded on the NYSE. You may open up to four High/Low windows at a time.
The NYSE information is active during the standard session and after hours. During
the pre-market session it will remain empty. The NASDAQ information is updated
during Pre Market, Standard, and After Hours sessions.
Stock symbols and price and volume data shown here and in the software are for
illustrative purposes only. Charles Schwab & Co., its parent or affiliates, and/or its
employees and/or directors may have positions in securities referenced herein, and
may, as principal or agent, buy from or sell to clients.
This figure shows a typical NASDAQ/NYSE High-Low window, with a brief
description of the colors and highlights. Colors used are the default colors.
•
CFFN has hit a daily high for the fourth time today.
•
SFUN and CREE have hit a Daily Low 11 and 37 times, respectively.
•
ICFI is hitting a 52 week high for the 11th time today and MICG is hitting a
52 week low for the 8th time today.
To open the Highs & Lows window:
1. Go to Tools > Start Tool.
2. Change the High/Low setting to either 2 or 1.
Copyright © Charles Schwab & Co., Inc. 2006. All rights reserved. (0106-5667)
323
StreetSmart Pro User Manual
3. Click Start.
or
•
Click on the High/Low
icon in the toolbar.
FILE
Load Stock List
Selecting this feature will allow you to load a previously
saved Stock List into your High/Low window.
Save Stock List
As
Selecting this feature will allow you to save your current
stock list to a file on your computer, which you can load
later.
Clear Stock List
Clears the Symbol List in the Settings > Symbol List
dialog and enables you to start a new list from scratch by
Adding Symbols (see Symbol List below for more info on
adding and deleting symbols). This will not clear the
High/Low history.
0,1,2,3...
Window will remember the last ten (10) stock list files you
have opened. To toggle between files, click on any of them.
Close
Closes the High/Low window.
SETTINGS
General
324
Data Display
•
Days: Select the number of days across which you
wish to see High/Low data, from 1 to 20 days. For
example, if you select 3 days, you will see high and
low data for today plus the last two trading days.
•
High: Check this option to view highs for the number
of days selected.
•
Low: Check this option to view lows for the number
of days selected.
•
NASDAQ: Check this option to display NASDAQ data.
•
NYSE: Check this option to display NYSE data.
•
Indices: Check this option to monitor Index highs
and lows.
•
52 Week High: Check this option to display 52-week
highs.
•
52 Week Low: Check this option to display 52 week
lows.
•
Mix Proximity Alerts & Hi/Lows: Proximity Alerts
inform you of stocks that are close to a daily high or
low or 52-week high or low. Checking this option will
combine the two in a single window.
•
Daily Hi/Lo Count: The Daily Hi/Lo Count is a
number to the right of the price that represents the
Copyright © Charles Schwab & Co., Inc. 2006. All rights reserved. (0106-5667)
Market Data Tools
number of times the stock has broken a new high or
low on the day. Even when the stock is highlighted
(meaning it is at a 52-week high), the Daily Hi/Low
Count still only represents the number of daily high
or low breaks.
•
Signal 52-week approach: Will indicate when a
stock is close to its 52-week high.
•
Signal daily approach: Will indicate when a stock is
approaching its daily high.
•
Upper Threshold: The window will display a stock in
yellow (unless otherwise changed) any stock that is
0.063 away from the daily or 52-week high. You can
choose to change this amount.
•
Lower Threshold: The window will display in purple
(unless otherwise changed) any stock that is 0.063
away from the daily or 52-week low. You can choose
to change this amount.
•
Data Filter Increment: This feature allows you to
filter prints based on the increment value change you
specify here, from .01 to 1.00.
EXAMPLE If you only want new prints to display
every time the trade price changes by .10, set this to
.10 using the arrow buttons. Then when any of the
stocks in your symbol list prints a trade .10 higher or
lower than the last trade it printed, the symbol,
quantity, etc. will display in the Print Ticker window.
The color will correspond to whether it's a negative or
a positive change.
NOTE: The Data Filter Increment will not apply to
proximity alerts in the High-Low window, such as
Signal 52-week approach and Upper/Lower
Threshold.
Symbol List
Adding Symbols:
1. Click Settings > Symbol List.
2. In the Symbol List window type in the stock or index
3. After typing each, press Enter on your keyboard or
click the Add button
4. After all the stocks and indices have been entered,
click OK.
(Another way of adding/deleting stocks to the High/Low
window is by pressing the Insert/Delete keys on the
keyboard. Type in the stock to add/delete in the Quick
Add/Quick Remove box that appears.)
Saving a Symbol List:
1. Click File > Save Stock List As...
Copyright © Charles Schwab & Co., Inc. 2006. All rights reserved. (0106-5667)
325
StreetSmart Pro User Manual
2. In the Save window that appears, type in the file
name you would like to save the list as, then click
Save.
Filters
The filter allows you to ignore stocks above or below the set
prices as well as below a user-defined Five Day Average
Volume. Filters do not apply to indices.
•
Price-Level Filter allows you to set the price level
below which, and above which, a stock will be
ignored. Click on the arrow buttons provided to
increase or decrease the prices within the Ignore
Stocks Below and Ignore Stocks Above settings
indicates these levels.
•
Five Day Average Volume Filter allows you to set
the five day average volume below which a stock will
be ignored.
•
Five Day Avg. Dollar Volume Filter allows you to
ignore symbols with a five day average dollar volume
below a certain value, use the up and down arrows to
specify that value, and check Ignore Stocks Below...
Fonts
Click to adjust font settings.
Colors
Click to adjust color settings.
TABS
Enable
When checked, allows you to maximize screen space while still
having quick access to several windows within one window.
When unchecked, you must open several independent windows
to view multiple High/Low window. See the Adding Tabs to
Windows topic for directions.
Insert
Select to add a new tab to the window. See the Adding Tabs to
Windows topic for directions.
Edit [tab
name]
Select to edit the current tab's settings, including the name and
location.
Delete [tab
name]
Select to delete the current tab from the window.
326
Copyright © Charles Schwab & Co., Inc. 2006. All rights reserved. (0106-5667)
Market Data Tools
Sectors
SECTORS
View information about companies grouped by sectors, industries, or
by sub-industries. Classifications are based on Morgan Stanley Capital
International and Standard & Poor GICS (Global Industry Classification
Standard).
The Sectors tool can assist traders using a Top-Down investing strategy
by identifying the top performing Sector, Industry, or Sub-Industry
over any one of many time periods, or in Bottom-Up Analysis to
compare an individual equity to its peers in its Sub-industry, Industry,
and Sector
To open, click
in the Toolbar.
TIP: You can add the stocks in a Sub-industry to the Watch List window by
clicking on the Sub-industry and dragging it to the Watch List window. However,
the Watch List limit is 100 stocks. If your Sub-industry list is greater than 100, it
will only pull over the first 100 securities in the Sub-industry based upon the
column that is being used for sorting. If no column has been selected for sorting, it
will load in the first 100 securities in alphabetical order.
! NOTE:
As of May 2, 2006, certain changes have been made to the Health Care
Sector and Real Estate Industry Group categories. Read more about these changes
at http://www2.standardpoors.com/spf/pdf/index/112805_GICS.pdf.
Click the plus (+) symbol to expand the Sector, Industry, or Sub-industry. Click the
minus (-) to contract a category.
Copyright © Charles Schwab & Co., Inc. 2006. All rights reserved. (0106-5667)
327
StreetSmart Pro User Manual
Stock symbols and price and volume data shown here and in the software are for
illustrative purposes only. Charles Schwab & Co., its parent or affiliates, and/or its
employees and/or directors may have positions in securities referenced herein, and
may, as principal or agent, buy from or sell to clients.
FILE
Page
Setup
Enables you to customize the current page for printing. Read
the Printing Windows topic in the Getting Started section for
more information.
Print
Prints the Sector rows currently displayed.
Export
Exports the Sector rows currently displayed into a tabdelimited text (.txt) file.
Select Export, enter a name for the text file and select the
location where it should be saved, and click Save.
Close
Closes the Sectors window.
SETTINGS
Indices
Checking Enable Indices will keep a list of up to 5 indices at
the top of your Sectors window at all times.
1. Enter the index symbols in the fields.
2. Put a check next to the ones you wish to view.
3. Click OK when you are finished.
328
Copyright © Charles Schwab & Co., Inc. 2006. All rights reserved. (0106-5667)
Market Data Tools
! NOTE:
Indices must start with a symbol using $.You cannot
use QQQ, SPY, DIA, etc, as these symbols do not start with a $.
Columns
•
Click Settings > Columns to change the data fields
displayed in the Sectors window.
•
Move Columns you want to see in the Sectors window over
to the Selected Columns
•
Column data can also be changed by right-clicking the
Sector window column heading.
•
You can change the order of the column data by dragging
the column heading box to the desired column location.
Enable Sorting: When checked, you can simply click on any
column header to sort by that column.
Auto Sorting: When checked, the sort order will change in
real time as new data comes through. For example, if you
were sorting by the Total Volume column and Auto Sorting
was checked, the sort order of the watch list would change as
volumes changed.
Long Names/Abbreviations: Select which format you would
like for displaying the Sector, Industry, and Sub-Industry
columns.
Sector Column Descriptions
•
Name: Shows Sectors, Industries, Sub-industries, and
finally, all stocks within each sub-industry.
•
Open*: Total amount the stock has gained/declined
since market open.
•
Close*: Total amount the stock has gained/declined
since yesterday's close.
Copyright © Charles Schwab & Co., Inc. 2006. All rights reserved. (0106-5667)
329
StreetSmart Pro User Manual
•
Open*(%): Percentage of change from open price to
current price.
•
Close*(%): Percentage of change from close price to
current price.
•
Total Volume: Total cumulative volume for the day.
•
Total Market Capitalization: The total market value of
all of a company's outstanding securities.
•
5-Day Close Perf (%): Difference between the Close
from 5 days ago and the Current Price expressed as a
percentage.
•
20-Day Close Perf (%): Difference between the Close
from 20 days ago and the Current Price expressed as a
percentage.
•
1 Month Close Perf (%): Difference between the Close
from 1 month ago and the Current Price expressed as a
percentage.
•
6 Month Close Perf (%): Difference between the Close
from 6 months ago and the Current Price expressed as a
percentage.
•
YTD Close Perf (%): Difference between the close from
the beginning of the year and the Current Price
expressed as a percentage.
Fonts
Click on this option to change this window's font settings.
Colors
Click on this option to change this window's color settings.
* The Global Industry Classification Standard (GICS) was developed by and is the
exclusive property of Morgan Stanley Capital International Inc. and Standard and
Poor's. GICS is a service trademark of MSCI and S&P and has been licensed for use
by Charles Schwab & Co.
330
Copyright © Charles Schwab & Co., Inc. 2006. All rights reserved. (0106-5667)
NEWS
331
StreetSmart Pro User Manual
News Overview
The News tool streams real-time breaking news right to your platform.
Scan the headlines, read the full story, and set up personal news
watches integrated with alerts.
To open, click
in the Toolbar.
The News window delivers the latest Dow Jones® and Acquire Media Corporation
news directly to your desktop. You may open up to 3 News windows at a time.
Using the news window, you can:
•
Get breaking market news as it comes out throughout the day,
•
Query for news by keyword or symbol, or
•
Set watch lists to see only news on specific symbols.
Stock symbols and price and volume data shown here and in the software are for
illustrative purposes only. Charles Schwab & Co., its parent or affiliates, and/or its
employees and/or directors may have positions in securities referenced herein, and
may, as principal or agent, buy from or sell to clients.
FILE
Page Setup
Enables you to customize the current page for printing.
Read the Printing Windows topic in the Getting Started
section for more information.
Print
•
Click to send the news to your printer for a hard copy.
•
For a shortcut, right-click in the Preview window and
332
Copyright © Charles Schwab & Co., Inc. 2006. All rights reserved. (0106-5667)
News
click Print Story.
Close
Click to close the News window.
VIEW
Preview
Open or close the Preview panel by clicking View >
Preview or right-clicking at the bottom of the News window
and selecting Show Preview Window.
To read an article when the Preview panel is closed, rightclick on the headline and choose either Open Story (to
display the news story in a pop-up window) or Show
Preview Window (to re-open the Preview panel for
viewing).
SETTINGS
Keyword Filter
Filters allow you to limit the volume and type of news that
appears in your Breaking News tab by only displaying
stories that have the key words or phrases you specify
here.
1. To start, click Settings > Keyword Filter while
viewing the Breaking News Tab.
2. check Enable Breaking News Filtering.
3. Select whether you want the keyword to appear in
the headline, story text, or either.
4. Type the keyword or phrase and click Add to add it
to the list.
5. To remove any of the words, click on the word and
click Remove.
6. Click OK when you are finished setting up your
filters.
News Alerts
If you wish to be alerted when new news arrives in either of
the three news tabs, click on the tab with the stories for
which you would like receive news alerts, go to Settings >
News Alerts and choose whether to play a sound file
Copyright © Charles Schwab & Co., Inc. 2006. All rights reserved. (0106-5667)
333
StreetSmart Pro User Manual
and/or switch the News window to display the tab.
Fonts
Click to change the font style in the News window.
Colors
Click to change the colors in your News window.
Right-Click Shortcuts for News
Several of the menu options above are also available by right-clicking in the News
window. If a security symbol is in the headline of an article you right-click on, you
will also see options to set an alert, load into Trading Window, access Research and
more.
334
Copyright © Charles Schwab & Co., Inc. 2006. All rights reserved. (0106-5667)
News
Breaking News Tab
The Breaking News tab gives you streaming, real-time general market news
headlines.
Stock symbols and price and volume data shown here and in the software are for
illustrative purposes only. Charles Schwab & Co., its parent or affiliates, and/or its
employees and/or directors may have positions in securities referenced herein, and
may, as principal or agent, buy from or sell to clients.
Click a headline in the Breaking News tab to retrieve the complete article. Use the
scroll bar on the right side of the window to move through the article or use the
Page Up and Page Down keys on your keyboard.
Filtering Breaking News:
You can limit the volume and type of news headlines that appear in your Breaking
News tab by only displaying stories that have the keywords you specify.
1. Click Settings > Keyword Filter in the News menu to open the Filters
window.
2. To start, check Enable Breaking News Filtering.
3. Select whether you want the keyword to appear in the headline, story text,
or either.
4. Type the keyword or phrase and click Add to add it to the list.
5. To remove any of the words, click on the word and click Remove.
6. Click OK when you are finished setting up your filters.
Copyright © Charles Schwab & Co., Inc. 2006. All rights reserved. (0106-5667)
335
StreetSmart Pro User Manual
336
Copyright © Charles Schwab & Co., Inc. 2006. All rights reserved. (0106-5667)
News
Recent Stories Tab
The Recent Stories tab allows you to watch for news on a particular symbol for the
current day or for up to 5 days in the past.
Stock symbols and price and volume data shown here and in the software are for
illustrative purposes only. Charles Schwab & Co., its parent or affiliates, and/or its
employees and/or directors may have positions in securities referenced herein, and
may, as principal or agent, buy from or sell to clients.
TIME FRAME
You can specify the time frame for the Recent News tab by going to Settings >
General in the News menu:
Copyright © Charles Schwab & Co., Inc. 2006. All rights reserved. (0106-5667)
337
StreetSmart Pro User Manual
Select whether to display news for Today, the Last 24 Hours, or select a starting
and ending date (as far back as 5 day prior).
RECENT NEWS ALERT SETTINGS
If you wish to be alerted when new news arrives for your watched symbol, go to
Settings > News Alerts and choose whether to play a sound file and/or switch
the News window to display the Recent Stories tab.
GET RECENT NEWS ON A STOCK IN THE TRADING WINDOW
1. In the Trading window, click Settings > Links.
2. In the Links window, click on News, then OK.
3. Next time you load a symbol into the Trading window, the news headlines for
that security will automatically appear in the Recent Stories tab of the News
window.
or
1. To run an impromptu query, if you have Enhanced User Interface selected,
you may right-click a symbol in any window and select Recent News for
[stock].
WATCH LIST NEWS
1. Set up your Watch List window so that News is one of the columns. When
news about a symbol in your symbol list becomes available, an icon will
appear in the News column (
338
).
Copyright © Charles Schwab & Co., Inc. 2006. All rights reserved. (0106-5667)
News
2. Double-click on the icon to display the headlines waiting for you in the Recent
News tab of your News window.
Copyright © Charles Schwab & Co., Inc. 2006. All rights reserved. (0106-5667)
339
StreetSmart Pro User Manual
News Watch Tab
The News Watch tab displays news for the symbols or news codes you specify.
Go to Settings > General to select individual symbols, watch lists, or news codes
to watch for new news.
Stock symbols and price and volume data shown here and in the software are for
illustrative purposes only. Charles Schwab & Co., its parent or affiliates, and/or its
employees and/or directors may have positions in securities referenced herein, and
may, as principal or agent, buy from or sell to clients.
To Add Stocks to the News Watch:
Go to Settings > General and,
340
•
Enter a Symbol or click Add Watch Lists and select one of the built-in
watch lists or scroll to the bottom of the list to Browse for your own list
•
Click Add to append the list of Selected Symbols with the symbol you
entered or the watch list you've selected.
•
Watch current positions will automatically watch for news on stocks in
which you have an open position if this feature is checked.
•
Watch breaking news will display breaking news in the News Watch
window in addition to, if you choose (see News Watch Alerts below), alerting
you to breaking news on the stocks you are watching.
Copyright © Charles Schwab & Co., Inc. 2006. All rights reserved. (0106-5667)
News
TO REMOVE STOCKS FROM THE NEWS WATCH:
•
Click to highlight one or more symbols and click Remove, or
•
Click Remove All to clear the symbol list.
TIP: If you are watching for news on a certain industry or a particular analyst,
watching for news based on News Codes may be helpful to you.
To take advantage of News Codes:
1. Go to Settings > General and click the News Code tab.
2. A full list of codes and descriptions is available at the bottom of the window,
so you can scroll through and click on the ones you want and click Add to
watch those codes, or
- Type a search word and the list will automatically filter down, such as in
the image with the term 'oil' all codes that have oil in the description are
displayed. Click on any (or all) of them and click Add.
- Select from a category to view only codes in that category, such as
Business, Publications, Analyst Ratings, and many more.
3. Click OK when you have selected the news codes you wish to monitor for
news. News on these categories will display along with news on any stocks
or watch lists you selected to watch.
Copyright © Charles Schwab & Co., Inc. 2006. All rights reserved. (0106-5667)
341
StreetSmart Pro User Manual
News Watch Alerts
To be alerted when news breaks on one of your selected stocks, go to Settings >
News Alert in the News menu.
•
Check Play this sound file and click Add to select the sound file to play
and/or
•
Check Switch to the News Watch tab to have the news window display
the News Watch tab when news you are watching for arrives.
342
Copyright © Charles Schwab & Co., Inc. 2006. All rights reserved. (0106-5667)
STOCK SCREENER
343
StreetSmart Pro User Manual
Stock Screener Overview
Find possible trading opportunities with the Stock Screener, a powerful
platform-based screening and signal generating tool. Match the
screening criteria to your strategies with over 140 available filtering
query choices. Select from a text and/or graphical view with the List
Display.
To open, click
in the Toolbar.
The key to creating useful queries is understanding which quantities and values to
include in the query to get the desired results. For instance, if you look for stocks
that are trending upward, you must understand which quantities are considered
trend indicators and what characteristics of these quantities determine the direction
of the trend. In other words, it’s not enough to just know that On Balance Volume
is a trend indicator, you must also know that positive OBV indicates that the trend
may continue.
There are many resources, outside of the scope of this online help, from which to
located on the
learn about these indicators. Using the Education Weblink icon
toolbar you can access the Introduction to the Stock Screener & Stock Selection
module located the Education page within the StreetSmart Pro® Center.
If after reading this section of the manual and experimenting with the Stock
Screener you still are unable to create a query to suit your needs, consider using
our built in queries to use as a guideline or call your Schwab Active Trader Broker
for assistance.
With the Stock Screener, you have the ability to construct queries based on
hundreds of variable combinations. These variables can be compared against each
other or compared against a value set by you. Then, stocks meeting these criteria
can be displayed in a list.
Each list view can contain up to 50 stocks and show up to 48 columns of data about
each stock retrieved by the query, all of which can be moved, removed, added,
subtracted and resized.
StreetSmart Pro® allows you to open up to 10 separate lists at once. The stock
screener results are based on current quote information for the standard as well as
the extended hours sessions.
OPEN THE STOCK SCREENER
1. Go to the Tools menu and select Start Tool.
2. Next to Stock Screener List and increase the field from 0 to 1 by using the
up arrow located to the right of the field.
3. Click Start
4. The Stock Screener Query window will automatically be displayed.
or
•
Click on the Stock Screener icon
in the toolbar.
The Stock Screener query window will automatically be displayed, allowing you to
view Built-In or User queries. Once you have opened the maximum number of
Stock Screeners (10) the icon will become grayed out.
344
Copyright © Charles Schwab & Co., Inc. 2006. All rights reserved. (0106-5667)
Stock Screener
TIP: Built-In Queries
The Stock Screener feature provides many Built-In Queries that you might find
useful. They may not be deleted, but can be edited for use as a starting point for
your own User Queries. Go to Settings > Queries and click on the Built-In
query you wish to use. Then click on View to edit and save your query with a
new name.
Copyright © Charles Schwab & Co., Inc. 2006. All rights reserved. (0106-5667)
345
StreetSmart Pro User Manual
Creating Stock Screener Queries
To create a new query, click User Queries > New Query.
To edit an existing query, clicking on User Queries > Edit Query.
TIPS:
•
Going to User Queries > Edit Query, when you are currently viewing a
Built-In query, you can see how the query is constructed. This is an
excellent method of learning to use the Stock Screener.
•
When editing a Built-In query, you must rename it in the Query Name
field.
PRIMARY FILTER
In the Primary Filter, you will query the broadest or most fundamental parameter in
your list of criteria, such as 'Current Price between 10 and 20', 'Volume greater
than 1,000,000', etc. The pool of data this creates will be narrowed when or if you
add Secondary Filters.
1. Choose the variable to query from the pull-down menu next to From the
(Criteria) List
2. Choose to query the:
346
Copyright © Charles Schwab & Co., Inc. 2006. All rights reserved. (0106-5667)
Stock Screener
•
Top: Gives you the top N stocks (N is the number you enter in the
Values field) sorted by the query variable that meets the query and
filter requirements. For example, if you query Volume for the top 20
stocks, your base query will consist of the 20 highest volume stocks.
•
Bottom: Gives you the bottom N stocks (N is the number you enter
in the Bottom field) sorted by the query variable that meet the query
and filter requirements. For example, if you query Change from Open
for the bottom 20 stocks, your base query will consist of the 20 stocks
with the lowest number when subtracting Current Price from Open
price (usually negative numbers).
•
Values: To use this option, you must also select a "relation" from the
pull-down menu on the right (i.e. greater than, between, etc.) and
enter a number in the neighboring value field. Two value fields will be
used when Between is the selected relationship.
3. Click on OK to run the query using the Primary Filter only and view the
results in the List window.
REFRESH PERIOD
Will recalculate and display your query as often as every 15 seconds or Never, if
you want the query output to remain constant. Keep in mind that the more
frequently your computer asks for a refresh, the more bandwidth your software will
use.
SECONDARY FILTERS
Secondary Filters enable you to further refine the query output. In the left column
is the list of Available Filters. These will be used in conjunction with the fields at
the bottom of the window to create the Selected Filters in the right column. For
instance, if you created a filter based on Volume, the Selected Filter will be called
Volume and will include the filtering settings applied to it by you in the fields at the
bottom of the window.
1. Click on the desired Available Filter.
2. Click the >> to add the filter to the Selected Filters list on the right.
3. Under Select stocks whose:, choose whether to filter by just the variable,
the difference between the variable and another variable, or the percent
difference between the variable and another variable.
•
EXAMPLE #1
To set a filter that will only list stocks with a greater than 15% change
from open, choose Change from Open (%) in the Available Filters
list and click the >> button to move it to Selected Filters. The rest
of the query should read:
Select stocks whose: Change from Open (%) is: greater than 15.
•
EXAMPLE #2
To set a filter that will only list stocks with a current Volume greater
than their one month average volume, choose Volume in the
Available Filters list and click the >> button to move it to Selected
Filters. The rest of the query should read:
Copyright © Charles Schwab & Co., Inc. 2006. All rights reserved. (0106-5667)
347
StreetSmart Pro User Manual
Select stocks whose: Volume is: greater than 1 Month Avg.
Volume.
•
EXAMPLE #3
To set a filter that will only list stocks that are 0.165 or less off their
52-week high, choose Current Price in the Available Filters list and
click the >> button to move it to Selected Filters. The rest of the
query should read:
Select stocks whose: difference between Current Price and 52
Week High is: less than or equal to 0.165.
•
EXAMPLE #4
To set a filter that will only list stocks within 2% above their 60 Day
Simple Moving Average (SMA), choose Current Price in the
Available Filters list and click the >> button to move it to Selected
Filters. The rest of the query should read:
Select stocks whose: % difference between Current Price and 60
Day SMA is: greater than or equal to 2.
4. To edit a Selected Filter, click on the filter you wish to change from the
Selected Filters list.
5. Repeat steps 1-3 to add as many as 10 filters per individual query.
6. When you are finished building your query, click OK.
7. You may also view the description of the selected query by clicking on
Description.
348
Copyright © Charles Schwab & Co., Inc. 2006. All rights reserved. (0106-5667)
Stock Screener
Screener List View
Lists start with a group of default columns, which you can adjust to view any of the
variables available, including any compound quantities (such as [High – Current
Price]) you created while building your query.
Stock symbols and price and volume data shown here and in the software are for
illustrative purposes only. Charles Schwab & Co., its parent or affiliates, and/or its
employees and/or directors may have positions in securities referenced herein, and
may, as principal or agent, buy from or sell to clients.
Columns can be customized in three ways:
1. Width: Change the width of the columns by placing your cursor over the
line between the column headers until the cursor changes to a doubleheaded arrow. Click and drag to compact or expand the column width.
2. Number of Columns: You can change the number of columns to view by
clicking on Settings > Columns in the menu bar (right-click within the
window and choose Show Menu if it is hidden). Use the up and down
arrows to adjust the number of columns. Click OK.
3. Column Name: You can change the order of the columns by right clicking
on the column header. A list will pop up with all the column choices. Click on
a different column name to replace the one currently in that position. For
example, if Volume is in column two but you want High there, right-click
on the Volume column heading and scroll until you find High.
! NOTE: If High is already a column in the list, it will simply switch places
with Volume. If High is not in the list already, Volume will be replaced.
Selecting Settings > Reset Columns you will reset all columns of the currently
viewed list for both Built-In Queries as well as User Queries. The first column will be
reset to the Symbol Name. The second column will be reset to match the Primary
Filter of the query. The remaining columns will change to a pre-determined order
up to the number of columns in the stock list.
Copyright © Charles Schwab & Co., Inc. 2006. All rights reserved. (0106-5667)
349
StreetSmart Pro User Manual
Stock Screener List Menu
FILE
Load Query File...
Save Query File
As...
•
Click to load previously saved Query files.
•
Once loaded, the list of queries in your file will appear
in the File menu as a Recently Viewed Query File
(see below).
•
Saves queries you have created.
•
You may save files either independently or as groups.
Once a query file has been saved, you may save
additional queries to the same file or under a different
file name.
•
See Saving Screener Queries for more information
Page Setup...
Enables you to customize the current page for printing.
Read the Printing Windows topic in the Getting Started
section for more information.
Print...
Print query results here.
Export...
Save query results to a text file (*.stk), which can be
imported into the Watch List window and various tickers
within the software. It can also be imported into Excel or
opened in Notepad.
Recently Viewed
Query Files
Shows a list of the most recently accessed User Query
files. Click on a query file to re-load it.
Exit
Closes the List Window
VIEW
Query
Description
When enabled, will open a separate window showing the
text description of the current query.
New Item List
Opens a separate panel at the bottom of the Screener
window that displays new stocks as they are added to the
list.
Note that if the refresh rate of the query is set to Never,
new stocks will not be added to the results and this panel
will remain empty.
Result Count
When enabled, will display in the bottom bar of the
window the number of stocks meeting the criteria of the
query.
SETTINGS
Queries
350
The Queries window gives you access to all Built-In queries
and User Queries that have been loaded (see Load Query
File above for more information on loading User Queries).
Copyright © Charles Schwab & Co., Inc. 2006. All rights reserved. (0106-5667)
Stock Screener
This window will allow you to add a New query, View a BuiltIn query, Edit a User query, Remove a User query or get the
Description of the highlighted query.
To create a query based on a Built-In query
1. Click on a Built-In query in the list
2. Click on the View button
3. The query construction window will open allowing you
to make changes to the query; however you must
change the name of the query to save it, because
Built-In queries cannot be edited or deleted.
4. See Creating Screener Queries for instructions on
creating/editing queries.
Columns
Reset Columns
•
Move Columns you want to see in the List over to the
Selected Columns
•
Column data can also be changed by right-clicking the
Watch List column heading.
•
You can change the order of the column data by dragging
the column heading box to the desired column location.
•
Long Names/Abbreviations: Select which format you
would like for displaying the Sector, Industry, and SubIndustry columns.
Returns columns to their original layout and will reset the
first two columns of the list for both Built-In Queries as well
as User Queries.
Choosing Reset Columns will always reset the first column
to the Symbol Name. The second column will be set to
match the Primary Filter of the query you are currently
viewing.
Fonts
Allows you to select the font, weight, and size for text used
in the Graph window.
Copyright © Charles Schwab & Co., Inc. 2006. All rights reserved. (0106-5667)
351
StreetSmart Pro User Manual
Colors
Allows you to choose the foreground and background text
colors to suit your preferences.
BUILT-IN QUERIES
Included with your software are several pre-designed queries that you may find
useful. They may not be edited or deleted, but they can be used as a starting
point for your own User Queries:
1. Click Settings > Queries in the Stock Screener menu
2. Click on the Built-In query you wish to start with
3. Click View
4. Make any desired edits to the query
5. Change the Query Name at the top of the window, and click OK to
save the query.
USER QUERIES
New Query
Click on this feature to create your own Stock Screener
queries. See Creating Screener Queries for instructions on
creating queries of your own.
Edit Query
Allows you to edit the current query, or if you are viewing
a Built-In Query, you can edit it and save under a new
name with this feature.
See Creating Screener Queries for instructions on
creating/editing queries.
Loaded Queries
This list shows all the User Queries in the current file.
Click on the one you wish to view.
To load a query file, go to File > Load Query File and
select the file you wish to open.
352
Copyright © Charles Schwab & Co., Inc. 2006. All rights reserved. (0106-5667)
Stock Screener
Saving Screener Queries
There are two ways to save and view queries that you create. Follow the steps
under Creating Stock Screener Queries to set up your own queries if you are not
familiar with this process.
CREATING QUERIES WITHOUT SAVING:
1. After creating your query and clicking the OK button, your query will
automatically be saved under the User Queries option in the menu bar. It
does not save it as a separate file to your computer.
2. Your new query(s) will appear at the top of the list under Settings >
Queries because the software automatically saves your query for later
viewing into the same file as the built-in queries. However, you will not see
your new queries in the Built-In drop-down list under Built-In Queries.
CREATING QUERIES AND SAVING THEM TO A FILE:
1. Create your new query and click OK.
2. Then, go to File > Save Query File As. A pop up box will appear allowing
you to save the query to your computer’s hard drive.
3. Select the location where you wish to save the query. Saving your query in
the same place as the built-in query will make it easier to find all of the
queries in one location.
4. Select the name you wish to attach to your newly created query list or you
can add to a previously saved query list to add the new query to an existing
list of queries. You will be prompted whether or not to overwrite the file.
5. Click OK.
6. If you saved the file as a new name, then the file you just saved will be
displayed under File > Recently Viewed Query Files (where Recently
Viewed Query Files shows the name of your new file with a check mark to
the left of it). If you saved the file as an existing file name, the file name
will be displayed under File > Recently Viewed Query Files, but the new
query added to the list will be located under User Queries.
7. The title bar will show a new line with File: (name of your file), example
shows Technology.qry
Copyright © Charles Schwab & Co., Inc. 2006. All rights reserved. (0106-5667)
353
StreetSmart Pro User Manual
354
Copyright © Charles Schwab & Co., Inc. 2006. All rights reserved. (0106-5667)
Stock Screener
Query Filter Descriptions
Current Price
Last trade price at the time the Stock Screener window
last retrieved data (every 15 seconds maximum)
Volume
Number of shares traded in the stock that market day
High
Highest price the stock has reached that day
Low
Lowest price the stock has reached that day
Open
Price at the most recent open
Close
Price at the most recent close (updated at 6 a.m.
Eastern Time)
Daily High Count
Number of times a new High has been reached that
day
Daily Low Count
Number of times a new Low has been reached that day
52 Wk High
Highest price a stock has reached in the past 52 weeks
(not including today)
52 Wk Low
Lowest price a stock has reached in the past 52 weeks
(not including today)
52 Wk High- Daily
High
Shows the distance between the 52 Week High and the
Daily High (i.e., if the stock's 52 week high is 45 and
the daily high is 42, this column will show a 3)
52 Wk Low-Daily
Low
Shows the difference between the 52 Week Low and
the Daily Low (i.e., if the stock's 52 week low is 7 and
the daily low is 8, this column will show a 1)
Previous Day's High
Highest price a stock reached the previous trading day
5 Day High
Highest price the stock has reached over the last five
days (not including today)
20 Day High
Highest price the stock has reached over the last 20
days (not including today)
1 Month High
Highest price the stock has reached over the last
month (not including today)
YTD High
Highest price the stock has reached over the last year
(not including today)
Previous Day's Low
Lowest price a stock reached the previous trading day
5-Day Low
Lowest price the stock has reached over the last five
days (not including today)
20-Day Low
Lowest price the stock has reached over the last 20
days (not including today)
1 Month Low
Lowest price the stock has reached over the last month
(not including today)
YTD Low
Lowest price the stock has reached over the last year
Copyright © Charles Schwab & Co., Inc. 2006. All rights reserved. (0106-5667)
355
StreetSmart Pro User Manual
(not including today)
Gap
Difference between most recent open and close prices
expressed as a point value (Open - Close)
% Gap
Difference between most recent Open and Close prices
expressed as a percentage (100*(Open-Close)/Close)
Change (Close)
Change in the price from the previous day's Close
expressed as a point value (updated at 6 a.m. Eastern
Time)
% Change (Close)
Change in the price from the previous day's Close
expressed as a percentage (i.e. difference between
Close and Current Price, divided by Close) (updated at
6 a.m. Eastern Time)
Change (Open)
Change in the price from the Open expressed as a
point value
% Change (Open)
Change in the price from the Open expressed as a
percentage (i.e. difference between Open and Current
Price, divided by Open)
Trading Range
Shows the trading range for the current day, i.e.
intraday high - intraday low
% Change of Range
from High
Percentage difference between the daily High and the
Current Price as a percentage of the trading range for
the day
% Change of Range
from Low
Percentage difference between the daily Low and the
Current Price as a percentage of the trading range for
the day
Chg from 5-Day Avg Difference between the average close for the last five
Close
days and the Current Price expressed as a point value
% Chg from 5 Day
Avg Close
Difference between the average close for the last five
days and the Current Price expressed as a percentage
(i.e. difference between 5 Day Avg Close and Current
Price divided by 5 Day Avg Close)
Chg from 20-Day
Avg Close
Difference between the average close for the last 20
days and the Current Price expressed as a point value
% Chg from 20 Day
Avg Close
Difference between the average close for the last 20
days and the Current Price expressed as a percentage
(i.e. difference between 20 Day Avg Close and Current
Price divided by 20 Day Avg Close)
Chg from 1 Month
Avg Close
Difference between the average close for the last
month and the Current Price expressed as a point
value
% Chg from 1
Month Avg Close
Difference between the average close for the last
month and the Current Price expressed as a
percentage (i.e. difference between 1 Month Avg Close
and Current Price divided by 1 Month Avg Close)
Chg from 6 Month
Difference between the average close for the last 6
356
Copyright © Charles Schwab & Co., Inc. 2006. All rights reserved. (0106-5667)
Stock Screener
Avg Close
months and the Current Price expressed as a point
value
% Chg from 6
Month Avg Close
Difference between the average close for the last 6
months and the Current Price expressed as a
percentage (i.e. difference between 6 Month Avg Close
and Current Price divided by 6 Month Avg Close)
Chg from YTD Avg
Close
Difference between the average close for the last year
and the Current Price expressed as a point value
% Chg from YTD
Avg Close
Difference between the average close for the last year
and the Current Price expressed as a percentage (i.e.
difference between YTD Avg Close and Current Price
divided by YTD Avg Close)
Chg from Beg of
Month Open
Difference between the beginning of the month open
price and the Current Price expressed as a point value
Chg from Beg of
Year Open
Difference between the beginning of the year open
price and the Current Price expressed as a point value
Avg Volume - 5 Day
Average of the volume over the last five days
Avg Volume - 20
Day
Average of the volume over the last 20 days
Avg Volume - 1
Month
Average of the volume over the last month
Avg Volume - 6
Month
Average of the volume over the last six months
Avg Volume - YTD
Average of the volume over the last year
% Volume Over
Yesterday's Vol
Difference between current Volume and yesterday's
volume expressed as a percentage (i.e. difference
between Volume and Yesterday's Volume, divided by
Yesterday's Volume)
% Volume Over 5
Day Avg Vol
Difference between current Volume and the average
volume for the last five days, expressed as a
percentage (i.e. difference between Volume and 5 Day
Avg Vol, divided by Yesterday's Volume)
% Volume over 20
Day Avg Vol
Difference between current Volume and the average
volume for the last 20 days, expressed as a
percentage (i.e. difference between Volume and 20
Day Avg Vol, divided by Yesterday's Volume)
% Volume over 1
Month Avg Vol
Difference between current Volume and the average
volume for the last month, expressed as a percentage
(i.e. difference between Volume and 1 Month Avg Vol,
divided by Yesterday's Volume)
% Volume over 6
Month Avg Vol
Difference between current Volume and the average
volume for the last 6 months, expressed as a
percentage (i.e. difference between Volume and 6
Month Avg Vol, divided by Yesterday's Volume)
% Volume over YTD
Difference between current Volume and the average
Copyright © Charles Schwab & Co., Inc. 2006. All rights reserved. (0106-5667)
357
StreetSmart Pro User Manual
Avg Vol
volume for the last year, expressed as a percentage
(i.e. difference between Volume and YTD Avg Vol,
divided by Yesterday's Volume)
10 Day SMA (Simple Average of the last 10 days' close values (including
Moving Average)
today). If the market hasn't closed yet, it uses the
current price for today's close.
15 Day SMA
Average of the last 15 days' close values (including
today). If the market hasn't closed yet, it uses the
current price for today's close.
20 Day SMA
Average of the last 20 days' close values (including
today). If the market hasn't closed yet, it uses the
current price for today's close.
50 Day SMA
Average of the last 50 days' close values (including
today). If the market hasn't closed yet, it uses the
current price for today's close.
60 Day SMA
Average of the last 60 days' close values (including
today). If the market hasn't closed yet, it uses the
current price for today's close.
100 Day SMA
Average of the last 100 days' close values (including
today). If the market hasn't closed yet, it uses the
current price for today's close.
120 Day SMA
Average of the last 120 days' close values (including
today). If the market hasn't closed yet, it uses the
current price for today's close.
200 Day SMA
Average of the last 200 days' close values (including
today). If the market hasn't closed yet, it uses the
current price for today's close.
15 Day EMA
(Exponential
Moving Average)
While similar to the SMA above, the exponential
moving average uses a "smoothing factor" to give
more weight to recent prices, while still allowing all
data in the window to influence the average.
20 Day EMA
While similar to the SMA above, the exponential
moving average uses a "smoothing factor" to give
more weight to recent prices, while still allowing all
data in the window to influence the average.
50 Day EMA
While similar to the SMA above, the exponential
moving average uses a "smoothing factor" to give
more weight to recent prices, while still allowing all
data in the window to influence the average.
60 Day EMA
While similar to the SMA above, the exponential
moving average uses a "smoothing factor" to give
more weight to recent prices, while still allowing all
data in the window to influence the average.
100 Day EMA
While similar to the SMA above, the exponential
moving average uses a "smoothing factor" to give
more weight to recent prices, while still allowing all
358
Copyright © Charles Schwab & Co., Inc. 2006. All rights reserved. (0106-5667)
Stock Screener
data in the window to influence the average.
120 Day EMA
While similar to the SMA above, the exponential
moving average uses a "smoothing factor" to give
more weight to recent prices, while still allowing all
data in the window to influence the average.
Rate of Chg
Change in price between the current price and the
close 6 days ago, divided by the price 6 days ago
10 Day RSI
Relative Strength Index indicates the degree of
positive and negative movement by the stock on a
scale of 0 (weakest) to 100 (strongest). Determined by
figuring the ratio of the average up closes for the last 9
days (using today's Current Price for the 10th day)
divided by the sum of the average up closes and the
average down closes for the same period. This ratio is
multiplied by 100.
10 Day RSI from
Close
Relative Strength Index indicates the degree of
positive and negative movement by the stock on a
scale of 0 (weakest) to 100 (strongest). Determined by
figuring the ratio of the average up closes for the last
10 days (not including today if prior to close) divided
by the sum of the average up closes and the average
down closes for the same period. This ratio is
multiplied by 100.
30 Day RSI
Relative Strength Index indicates the degree of
positive and negative movement by the stock on a
scale of 0 (weakest) to 100 (strongest). Determined by
figuring the ratio of the average up closes for the last
29 days (using today's Current Price for the 30th day)
divided by the sum of the average up closes and the
average down closes for the same period. This ratio is
multiplied by 100.
30 Day RSI from
Close
Relative Strength Index indicates the degree of
positive and negative movement by the stock on a
scale of 0 (weakest) to 100 (strongest). Determined by
figuring the ratio of the average up closes for the last
30 days (not including today if prior to close) divided
by the sum of the average up closes and the average
down closes for the same period. This ratio is
multiplied by 100.
50 Day RSI
Relative Strength Index indicates the degree of
positive and negative movement by the stock on a
scale of 0 (weakest) to 100 (strongest). Determined by
figuring the ratio of the average up closes for the last
49 days (using today's Current Price for the 50th day)
divided by the sum of the average up closes and the
average down closes for the same period. This ratio is
multiplied by 100.
50 Day RSI from
Close
Relative Strength Index indicates the degree of
positive and negative movement by the stock on a
Copyright © Charles Schwab & Co., Inc. 2006. All rights reserved. (0106-5667)
359
StreetSmart Pro User Manual
scale of 0 (weakest) to 100 (strongest). Determined by
figuring the ratio of the average up closes for the last
50 days (not including today if prior to close) divided
by the sum of the average up closes and the average
down closes for the same period. This ratio is
multiplied by 100.
%K
Along with %D, is part of the stochastic indicator.
Shows the price level of a stock in relation to its price
range over a given period
%D
Along with %K, is part of the stochastic indicator.
Shows the degree of smoothing, or moving average
period, of %K
% D Slow
Similar in principle to %D above, except tends to show
less market "noise" due by increasing the number of
periods used in the calculation
Bollinger Bands
(Top/Middle/
Bottom)
The center is a simple moving average. The top and
bottom lines are placed n-standard deviations above
and below the centerline. Since standard deviations
are a measure of volatility, the bands widen during
volatile price action and contract when the trading
range tightens.
MACD
Trend-following momentum indicator that uses three
exponential moving averages: a short or fast average,
a long or slow average and an exponential average of
their difference, the last being used as a signal or
trigger line.
MACD Signal
Typically used in conjunction with the MACD indicator
above.
20 Day Momentum
Measures the amount that a security's price has
changed over the last 20 days. If today hasn't closed
yet, it uses the current price for today's close.
20 Day Momentum
from Close
Measures the amount that a security's price has
changed over the last 20 closes.
40 Day Momentum
Measures the amount that a security's price has
changed over the last 40 days. If today hasn't closed
yet, it uses the current price for today's close.
40 Day Momentum
from Close
Measures the amount that a security's price has
changed over the last 40 closes.
60 Day Momentum
Measures the amount that a security's price has
changed over the last 60 days. If today hasn't closed
yet, it uses the current price for today's close.
60 Day Momentum
from Close
Measures the amount that a security's price has
changed over the last 60 closes.
Money Flow
Money Flow keeps a running total of the money
flowing into and out of a security. The direction of the
Money Flow line is the important component to
360
Copyright © Charles Schwab & Co., Inc. 2006. All rights reserved. (0106-5667)
Stock Screener
watch, not the actual dollar amount. This indicator
can be used to confirm underlying strength or
weakness of a price trend.
Money Flow Percent Money Flow Percent is also called Chaikin Money Flow.
It normalizes the Money Flow calculation above by
dividing by the cumulative volume for the period.
Williams %R
Measures the percentage to which a stock is
overbought or oversold based on the position of the
current period's close to the range of prices over a
time period
14 Day DM(+DI) –
Positive
The basic Directional Movement trading system
involves comparing the 14-day +DX ("Directional
Indicator") and the 14-day -DX. This can be done by
plotting the two indicators on top of each other or by
subtracting the +DX from the -DX. The study indicates
buying when the +DX rises above the -DX and selling
when the +DI falls below the -DX.
14 Day DM(-DI) –
Negative
The basic Directional Movement trading system
involves comparing the 14-day +DX ("Directional
Indicator") and the 14-day -DX. This can be done by
plotting the two indicators on top of each other or by
subtracting the +DX from the -DX. The study indicates
buying when the +DI rises above the -DX and selling
when the +DI falls below the -DX.
14 Day Directional
Movement (DX)
The Directional Movement study indicates the strength
of a trend, independent of whether that trend is up or
down. The study combines several components: +DX
measures upward moves, -DI measures downward
moves, DX combines +DX and -DX, and ADX is a
smoothed version of DX.
14 Day Average
DM(ADX)
Assesses the strength of current trends in a stock’s
movement, as well as helping point out when a market
may be changing from trending to non-trending and
vice versa. ADX is calculated by taking a modified
moving average of DX.
PE Ratio
Price/Earnings Ratio measures how expensive a stock
is (i.e., the cost an investor in a stock must pay per
point of current annual earnings)
EPS Ratio
Earnings per Share shows net income divided by the
number of shares of a company participating in the
profits. This gives a good indication of the earnings
ability of a company.
Dividend
Taxable payment declared by a company's board of
directors and given to its shareholders out of the
company's current or retained earnings
Market Cap
Market value of all of a company's outstanding shares
PS Ratio
Price-to-Sales Ratio shows a stock's capitalization
Copyright © Charles Schwab & Co., Inc. 2006. All rights reserved. (0106-5667)
361
StreetSmart Pro User Manual
divided by its sales over the previous 12 months
Earnings
Revenues minus cost of sales, operating expenses, and
taxes, over a given period of time
Net Income
Gross sales minus taxes, interest, depreciation, and
other expenses
Revenue
Total dollar amount collected for goods and services
provided
DPS Ratio
Dividends per Share shows how much shareholders
were paid in dividends per the number of shares
issued.
Shares Outstanding
Shows number of shares of a corporation which have
been issued
% Recommend Buy
Percentage of Buy recommendations from analysts
covering the issue
% Recommend
Buy-Hold
Percentage of Buy-Hold recommendations from
analysts covering the issue
% Recommend
Hold
Percentage of Hold recommendations from analysts
covering the issue
% Recommend
Hold-Sell
Percentage of Hold-Sell recommendations from
analysts covering the issue
% Recommend Sell
Percentage of Sell recommendations from analysts
covering the issue
Num of
Recommendations
Total number of recommendations from analysts
covering the issue
Recommendation
Avg (1.0=Buy,
5.0=Sell)
Average of recommendations from analysts covering
the issue
Beta Value
Indicates the volatility of a stock's price, with dividends
reinvested, relative to the overall market. The S&P
500 stock price index is used as a benchmark for the
"overall market." A beta greater than 1.0 indicates
higher volatility relative to the overall market.
P/E Ratio (Latest
Actual)
Ratio derived by dividing closing stock price by most
recent actual fiscal year earnings per share. Negative
P/E ratios, or those greater than 99, are not
considered meaningful and are not displayed.
P/E Ratio
(Estimated)
Ratio derived by dividing closing stock price by latest
consensus estimate. Negative P/E ratios, or those
greater than 99, are not considered meaningful, and
are not displayed.
Relative P/E Ratio
Company's Trailing Twelve Month (TTM) P/E ratio
relative to (divided by) the TTM P/E ratio of the S&P
500
% 5 Yr Projected
Growth Rate
Compounded earnings growth rate projected for the
next five years based on the last actual reported
362
Copyright © Charles Schwab & Co., Inc. 2006. All rights reserved. (0106-5667)
Stock Screener
annual earnings and estimated consensus growth rates
as provided by I/B/E/S
% Margin
Net income for the latest reported full fiscal year
(including discontinued operations, but before
adjustments for dividends or extraordinary items)
divided by net sales and other operating revenues for
the latest full fiscal year.
Sales Per Employee
Sales for the latest fiscal year divided by the number
of employees, expressed as dollars per employee.
Employees is defined as the number of full time or full
time equivalent employees.
Long Term
Debt/Equity
Total long term debt for the most recent fiscal year
divided by total equity for the same period.
% Return on Equity
Net income including discontinued operations but
before extraordinary items, expressed as a % of
common shareholders’ equity for the most recent fiscal
year. Generally used as a measure of management
effectiveness.
% Return on Asset
Net income including discontinued operations but
before extraordinary items, expressed as a % of total
assets for the most recent fiscal year. Used in industry
analysis and as a measure of asset-use efficiency.
% Yield
Indicated annual dividend rate per common share
divided by the latest stock price, expressed in
percentage terms.
% Total Return
(YTD0)
Rate of return representing the price appreciation of a
stock with cash dividends reinvested on the pay date
from the beginning of the current fiscal year to the
most recent full week of the fiscal year.
% Total Return
(YTD1)
Rate of return representing the price appreciation of a
stock with cash dividends reinvested on the pay date
for the period covering the most recent fiscal year.
% Total Return
(YTD2)
Rate of return representing the price appreciation of a
stock with cash dividends reinvested on the pay date
for the period covering the most recent 2 fiscal years.
% Total Return
(YTD3)
Rate of return representing the price appreciation of a
stock with cash dividends reinvested on the pay date
for the period covering the most recent 3 fiscal years.
% Total Return
(YTD4)
Rate of return representing the price appreciation of a
stock with cash dividends reinvested on the pay date
for the period covering the most recent 4 fiscal years.
% Total Return
(YTD5)
Rate of return representing the price appreciation of a
stock with cash dividends reinvested on the pay date
for the period covering the most recent 5 fiscal years.
% Total Return (3
Mon)
Rate of return representing the price appreciation of a
stock with cash dividends reinvested on the pay date
Copyright © Charles Schwab & Co., Inc. 2006. All rights reserved. (0106-5667)
363
StreetSmart Pro User Manual
for the period covering the most recent fiscal quarter.
% Total Return (6
Mon)
Rate of return representing the price appreciation of a
stock with cash dividends reinvested on the pay date
for the period covering the most recent 2 fiscal
quarters.
% Total Return (9
Mon)
Rate of return representing the price appreciation of a
stock with cash dividends reinvested on the pay date
for the period covering the most recent 3 fiscal
quarters.
% Dividend Payout
Ratio
Indicates the percentage of annual earnings paid out in
dividends. Calculated by dividing the indicated annual
dividend rate by per-share earnings. (Indicated
dividend divided by 12mo EPS)
% Held by
Institutions
Percentage of outstanding shares held by institutional
investors
Relative Strength
Measures each stock's price performance compared to
all other companies in the S&P universe on a rolling
13-week basis.
Stock Exchange
Shows the exchange (NYSE, NASDAQ, etc.) on which
the stock trades
S&P Stars
S&P’s fundamental analysis and evaluation of the
short-term (six- to 12-month) appreciation potential of
stocks. Based on a ranking system of one to five
stars, S&P Star Rankings are available for about 1,000
select stocks. A definition of the rankings are as
follows:
S&P Earning &
Dividend Ranking
364
•
5: BUY -- Expected to be among the best
performers over the next 12 months and rise in
price
•
4: ACCUMULATE -- Expected to be an aboveaverage performer
•
3: HOLD -- Expected to be an average
performer
•
2: AVOID -- Likely to be a below-average
performer
•
1: SELL -- Expected to be a well-below average
performer and fall in price
Measures the historical growth and stability of a
company’s earnings and dividends for the past 10
years. The Ranking System has various grades:
•
A+: Highest;
•
A: High;
•
A–: Above Average;
•
B+: Average;
•
B: Below Average;
Copyright © Charles Schwab & Co., Inc. 2006. All rights reserved. (0106-5667)
Stock Screener
•
B–: Lower;
•
C: Lowest;
•
D: In Reorganization; and,
•
NR: No Ranking. ! NOTE: An NR designation
(no ranking) is given to common stocks with
insufficient historical data or because the stock
is not amenable to the ranking process. As a
matter of policy, Standard & Poor’s does not
rank the stock of foreign companies, investment
companies, and certain finance-oriented
companies.
So as not to be biased by future expectations, the
rankings are based on past events only. The S&P
Ranking System does not use earnings and dividend
estimates. An S&P ranking is not a recommendation to
buy or sell the stock of a company. S&P common stock
rankings should not be confused with debt quality
ratings.
In S&P 500
Indicates whether the stock is part of the Standard and
Poor's 500 Index
In S&P Mid Cap 400
Indicates whether the stock is part of the Standard and
Poor's Midcap 400 Index
In S&P Small Cap
600
Indicates whether the stock is part of the Standard and
Poor's SmallCap 600 Index
GICS Sector
Shows the general industry classification of the
company (Healthcare, Financial, Technology,
Transportation, etc.)
GICS Industry
A specific category describing the company's business
activity (Computer Peripherals, Chemical
Manufacturing, Broadcasting, Hotels & Motels, etc.)
GICS Subindustry
A subcategory within the company's Industry
classification that further specifies the company's
primary business activity
Copyright © Charles Schwab & Co., Inc. 2006. All rights reserved. (0106-5667)
365
REFERENCE
367
StreetSmart Pro User Manual
Glossary
This glossary contains definitions specifically related to listed options. Options
carry a high level of risk and are not suitable for all investors. Certain requirements
must be met to trade options through Schwab. Multiple leg options strategies will
involve multiple commissions. With long options, investors may lose 100% of funds
invested. Spread trading must be done in a margin account. Please read the
Options Disclosure Document titled "Characteristics and Risks of Standardized
Options" before considering any option transaction. Call your local Schwab office or
write Charles Schwab & Co., Inc. 101 Montgomery Street, San Francisco, CA
94104 for a current copy. Charles Schwab & Co.,Inc. is a SIPC member.
Please contact a tax advisor for the tax implications involved in the options
strategies referenced.
A|B|C|D|E|F|G|H|I|J|K|L|M|N|O|P|Q|R|S|T|U|V|W|
X|Y|Z
Above the Market
A limit order to buy or sell a security for a specified price that is higher than the
current market price. A sell order may be placed above the market in an attempt to
sell at higher prices. However, if the market does not reach these prices, the order
will go unfilled.
Above the Money
For straddles and collars, strike prices of the call and the put are above the current
price of the underlying security.
Advance-Decline (AD) Line
The Advance-Decline (AD) line is the cumulative total for the difference between
the number of advancing stocks and the number of declining stocks in a given
market. The AD line for the New York Stock Exchange (NYSE) is the most widely
used measure of market breadth. If there are more advances than declines, the AD
is a positive number; if there are more declines, the AD number is negative. That
daily number is added to the cumulative AD line. The AD line gives us information
on whether the majority of stocks are following the trend of the commonly followed
stock indices.
All Money
In reference to Advanced Options, all pairings for the specified strike range,
excluding leaps.
All or None (AON)
An All or None (AON) order directs the broker to attempt to fill the entire amount of
an order or none of it during the time limit specified. AON orders do not require
immediate execution, and are only applicable to limit orders.
American Depository Receipt
ADRs are securities issued by commercial banks that represent the shares of a
foreign company. Generally speaking, a foreign company will deposit a certain
amount of shares with a US commercial bank. The bank will then issue a security
based on a specific number of shares. ADRs trade just like domestic stocks on
various US stock exchanges, however investors are subject to additional risks,
368
Copyright © Charles Schwab & Co., Inc. 2006. All rights reserved. (0106-5667)
Reference
including but not limited to currency fluctuation. Their performance usually parallels
that of the parent company on its domestic exchange. ADRs offer international
companies greater exposure and investors the chance to invest in well-known
foreign companies.
Arbitrage
The simultaneous buying and selling of the same or closely related securities, in
different markets to take advantage of price disparities. Arbitrage attempts to
realize a profit with minimal to no risk, but generally transaction fees and market
inefficiencies will substantially minimize profitability for the retail investor.
Around the Money
For strangles and collars, strike prices of the call and put lie on opposite sides of
the current price of the underlying security.
Ask
The ask price is the displayed price at which a market maker or specialist offers to
sell a stock.
At the Money
An option is at-the-money if the strike price of the option equals the market price
of the underlying security.
A|B|C|D|E|F|G|H|I|J|K|L|M|N|O|P|Q|R|S|T|U|V|W|
X|Y|Z
Bar Chart
In a bar chart, each time period is represented by a vertical bar that represents the
range between the high and low prices. A bar chart displays more information than
a line chart, which only shows the closing price for each period. Some variations on
the standard bar chart are the following: HL (only the high and low price for each
time period), HLC (the high, low, and close), and OHLC (open, high, low, and
close).
Bear Trap
A bear trap occurs when prices break below a significant level and generate a sell
signal (q.v.), but then reverse course and negate the sell signal, thus trapping the
bears that acted on the signal with losses.
Below the Market
A limit order to buy or sell a security for a specific price that is lower than the
current market price. Buy orders may be placed below the bid in an attempt to
purchase at lower prices. However, if the market does not reach these prices, the
order will go unfilled.
Below the Money
For straddles and collars, strike prices of the call and the put are below the current
price of the underlying security.
Beta
Beta is a measure of the security's systematic or market risk. The level of the beta
indicates the degree of correlation between a security and a market benchmark,
usually the S&P 500. The market is the benchmark and has a beta of 1. A beta
greater than 1 is more volatile than the overall market, while a beta less than 1
Copyright © Charles Schwab & Co., Inc. 2006. All rights reserved. (0106-5667)
369
StreetSmart Pro User Manual
indicates that the security's price is more stable than the market (in general and
over a long time period).
Bid
The bid price is the displayed price at which a market maker or specialist offers to
buy a stock.
Black Scholes Option Pricing Model
A model used to forecast the price of an option.
Blue Chip
A common stock of an established company that has a long record of earnings,
dividends, stability and high credit quality.
Bollinger Bands
Developed by John Bollinger, Bollinger Bands are indicators that allow for a
comparison of volatility and relative price levels over a period time. This indicator
consists of three bands designed to encompass the majority of a security's price
action:
1. An upper band
2. A lower band
3. A moving average
The time period used for the moving average can vary, but John Bollinger
recommends 10 days for short term trading, 20 days for intermediate trading, and
50 days for long term trading. The upper and lower bands are plotted as standard
deviation levels -- typically two standard deviations---- above and below the
moving average. Since standard deviation is a measure of volatility, the bands are
self-adjusting. They typically widen during volatile markets and contract during
calmer markets.
The basic interpretation of Bollinger Bands suggests that prices tend to stay within
the upper- and lower-bands. The distinctive characteristic of Bollinger Bands is that
the spacing between the bands varies based on the volatility of the prices. During
periods of extreme price changes (or high volatility), the bands tend to widen to
become more forgiving. During periods of stagnant pricing (or low volatility), the
bands tend to narrow to contain prices. When prices break through a band, this
may indicate that the move is strong enough to continue further.
Boxed Position
Where the security is held in the account both as a long and a short position. These
positions can be of equal or unequal quantities (i.e. full or partial box).
Bull Trap
A bull trap occurs when prices break above a significant level and generate a buy
signal, but suddenly reverse course and negate the buy signal, thus trapping the
bulls that acted on the signal with losses.
Buy
Purchase of a security.
Buy Signal
A buy signal is a condition that suggests a time to buy a stock. The signal will vary
depending on the type of technical indicator used, or it may be based on a nontechnical event, such as a change in an analyst recommendations or the release of
positive news. Note: It's unwise to base buy or sell decisions on just one indicator.
370
Copyright © Charles Schwab & Co., Inc. 2006. All rights reserved. (0106-5667)
Reference
Buy Stop
A buy stop is a buy order usually placed above the current price, requiring that a
security would have to trade at or above a set level before the buy order would be
activated. For example, an order could be entered at 35.5 for a security trading just
below resistance at 35. By placing a buy stop order just above resistance, the
trader prefers to wait for that security to break resistance before going long. This
type of order can also be used as a stop loss for a short position. Please note that
there is no guarantee that execution will be at or near your stop price.
Buy to Close
You "close" a short option position when you buy it back.
Buy to Open
You "open" a long position when you buy a new option.
Buying Power
This is the maximum dollar value of marginable securities that you can buy in your
margin account without depositing additional equity. Buying power is calculated at
the close of business each day and may fluctuate throughout the day.
A|B|C|D|E|F|G|H|I|J|K|L|M|N|O|P|Q|R|S|T|U|V|W|
X|Y|Z
Call Option
An option contract that gives the holder the right, but not the obligation, to buy
100 shares of the underlying security at a fixed price before a specified expiration
date. Call buyers hope the price of the underlying security will rise. Call sellers hope
the price will stay the same or go down.
Candlestick Chart
A candlestick chart is similar to a bar chart. The major difference is the graphical
depiction of each period in a "candlestick." Each candlestick is formed using the
open, high, low, and close of a specific time period. The period can be anything
from a minute to a month. The color of the candlestick is determined by the
relationship between the open and close. If the close is higher than the open, a
white (or green) real body is formed. If the close is lower than the open, a black (or
red) real body is formed. If the close and open are the same, it will be a cross. The
thin lines above and below the real bodies represent the high and the low for the
period and are referred to as shadows. The high for the period is the upper shadow
and the low is the lower shadow. It is these shadows, which look like wicks on a
candle, that give rise to the term "candlestick."
Capital Gain
The difference in value between what you originally paid for an investment and the
price at which you sold, assuming the investment gained in value.
Cash Account
This type of brokerage account requires that you pay for trades in full by the
settlement date.
Cash Secured Equity Put (CSEP)
A CSEP consists of any number of short uncovered put options written at a strike
price lower than the stock's price, and where the investor must maintain cash or
Copyright © Charles Schwab & Co., Inc. 2006. All rights reserved. (0106-5667)
371
StreetSmart Pro User Manual
cash equivalents in his account equal to the total amount of the potential
assignment in the event the put expires in the money, or is exercised by the owner
of the put.
Channel
A channel refers to the area on a price chart between two parallel trend lines that
connect the highs and the lows of a prevailing trend.
Charting
The set of techniques used in technical analysis in which charts are used to plot
price movements, volume, and other indicators.
Close
The price at which a security closed for trading on a given day.
Common Stock
Common stock is "ownership" of a corporation. An owner of a company's common
stock is considered to have an equity position in the corporate structure of that
company.
Confirmation
Confirmation is a subsequent signal that validates a position stance. Traders and
investors sometimes look for more than one signal or require validation before
acting. For example: confirmation of a trend change may entail an advance past
the previous reaction high. For an indicator such as MACD, confirmation of a
divergence may be a subsequent moving average crossover. (Not to be confused
with a trade confirmation, which verifies that a trade order has been executed.)
Congestion Area
At a minimum, a series of trading days in which there is no or little progress in
price.
Correction
After an advance, a decline that does not penetrate the low from which the advance
began is known as a correction. A correction, also referred to as a retracement,
usually retraces 1/3 to 2/3 of the previous advance.
Crossed Market
When the bid is higher than the lowest current offer or vice versa.
Crossover
A crossover is a place on a graph where two lines intersect. Depending on what
each line represents, a crossover may indicate a buy or sell signal. One common
method of interpreting a moving average is to compare its relationship to the price
itself. Changes in a market's price trend are not necessarily identified by a reversal
in the direction of the moving average line, but by the price line crossing through
the moving average line. It may be considered bearish when price crosses below a
moving average, and bullish when price crosses above it. Multiple moving average
crossovers (or "double crossovers") can also be employed through the use of two
moving average lines -- one of a shorter time span and the other of a longer time
span. It may be considered bearish when the shorter moving average crosses
below the longer moving average, and bullish when the shorter crosses above the
longer. This technique of using two moving averages together typically lags the
market a bit more than a single moving average.
Cup and Handle
372
Copyright © Charles Schwab & Co., Inc. 2006. All rights reserved. (0106-5667)
Reference
A pattern on a bar chart. The pattern can be as short as several weeks and as long
as a year. The cup is in the shape of a 'U', and the handle has a slight downward
drift.
Cyclical Stocks
Cyclical stocks are shares of companies with businesses that are highly sensitive to
economic performance. Cyclical stocks tend to perform well under certain economic
conditions and suffer during others.
A|B|C|D|E|F|G|H|I|J|K|L|M|N|O|P|Q|R|S|T|U|V|W|
X|Y|Z
Daily Range
The difference between the high and low during one trading day.
Day Order
An order condition that causes your order to be canceled at the end of the current
day's trading if the order has not been executed. All Market Orders are
automatically Day orders. Orders are generally considered to be day orders unless
otherwise specified.
Day Trading
Day trading is a style of trading where positions are both initiated and closed before
the end of the trading day. Compare this to position trading, where stocks or
securities may be held for longer periods.
Derivative Instrument
A financial instrument or security whose value is based in part upon another
security. For example, a stock option is a derivative instrument because its market
value is based in part upon the market value of the underlying stock.
Dilution
Effect on earnings per share and book value per share from any increase in shares
outstanding.
Direct Access
Schwab's integrated set of trading tools designed to support direct access trading.
StreetSmart Pro Direct Access provides Level II information into a trading interface
that gives you control over the routing, targeting, and timing of your order. This
platform is for experienced traders who are comfortable learning to use advanced
trading technology to trade NASDAQ securities.
Direct Access Trading
A trading method in which traders have control over the routing and targeting of
their orders. Direct access enables eligible clients to route orders for execution to
the market centers of their choice. Depending on the brokerage firm, clients may
be allowed to direct orders to a variety of ECNs, market makers, and exchanges. In
direct access trading, there are no intermediaries who can safeguard against poor
trading decisions or serve as buffers between traders and sudden changes in
market conditions.
Discretion
Copyright © Charles Schwab & Co., Inc. 2006. All rights reserved. (0106-5667)
373
StreetSmart Pro User Manual
Allows you to have a displayed price and a discretionary price. You can place the
order at the price you’d like to receive with a discretion amount for the
maximum/minimum amount you’re willing to pay. Available for limit orders only.
EXAMPLE A limit order to buy with a displayed price of 50 and a discretionary price
of 50.25 is presented as:
Price = 50
Discretion = 0.25
Divergence
Divergence means that different technical indicators or indices are failing to confirm
each other. This can be viewed as a warning signal that the prevailing trend may be
about to reverse.
Dividend Amount
Value of last quarterly cash dividend or the number of shares an investor receives
for each share owned in a stock dividend.
Dividends Reinvestment
The application of cash dividends from an equity security to purchase more shares
of the security.
Do Not Reduce (DNR)
Instructs the broker not to reduce the limit price by the amount of the cash
dividend when a stock goes ex-dividend and the market price is reduced by the
amount of the dividend. You can specify DNR on limit orders to buy, stop orders to
sell, or on stop-limit orders to sell.
Double Tops and Bottoms
Generally considered to be reversal patterns, double tops or bottoms show as two
prominent peaks or troughs on the price chart. The first peak or valley is typically
formed on relatively high trade volume, and the second on relatively low volume.
The reversal is considered complete when the middle peak (in the case of a double
bottom) or trough (in the case of a double peak) is broken.
Dow Jones Industrial Average (DJIA)
Published by Dow Jones & Co, the Dow Jones Industrial Average (DJIA) is a priceweighted average of 30 blue-chip stocks. Because it is price weighted, stocks with
the highest prices will have the most influence and those with the lowest, the least
influence. The DJIA is calculated by adding the closing prices of the 30 stocks, and
then dividing by a number that takes into account splits, large dividends,
substitutions and mergers. The component stocks of the DJIA have changed over
the years to reflect the composition of the U.S. economy.
Dual Listed Stocks
Stocks listed on the New York Stock Exchange that are eligible for trading via
SuperMontage, a routing venue normally only available to NASDAQ stocks, in
addition to the NYSE and some ECNs.
A|B|C|D|E|F|G|H|I|J|K|L|M|N|O|P|Q|R|S|T|U|V|W|
X|Y|Z
Earnings Per Share Date
Date of the last earnings announcement.
374
Copyright © Charles Schwab & Co., Inc. 2006. All rights reserved. (0106-5667)
Reference
Electronic Communication Network (ECN)
An Electronic Communication Network (ECN) is a computerized trading system that
facilitates trading between two parties without a market maker or specialist as an
intermediary. If an ECN cannot match an order, it usually either sends the order to
another ECN or market maker or posts the order to the order book until a matching
order is found. ECNs are identified in the software as follows: [INET] NASDAQ
[EDGA] EdgeTrade [BTRD] Bloomberg [BRUT] NASDAQ [ARCA] NYSE Arca
[ONTD] OnTrade
Electronic Funds Transfer
Transferring funds between accounts and firms electronically.
Elliot Wave Theory
Originally published by Ralph Nelson Elliot in 1939, Elliot Wave Theory is a pattern
recognition theory that is based on repetitive wave patterns and the Fibonacci
number sequence. An ideal Elliott wave pattern holds that a five wave advance is
followed by a three wave decline to form a complete cycle.
Ex-Dividend Date
Date a stock or cash dividend is reflected in the price of the security (if you buy a
stock on the ex-dividend date, you are not entitled to the dividend); for stock
dividends, this is the trading day after the distribution is made.
Excercise Price (or Strike Price)
See Strike Price.
Expiration
The date an option contract becomes void. All holders of options must indicate their
desire to exercise by this date.
Fed Call
Also known as Regulation T or Reg T Call. This type of call occurs when establishing
a margin position. Investors must deposit initial margin (typically 50%) of the cost
of the trade per current Federal Reserve requirements.
Fibonacci Fan Lines
Fibonacci Fan lines are based on the Fibonacci number series and combine two
additional analytical concepts--trend line and percentage retracement. Fibonacci
Fan lines are typically drawn at 38%, 50%, and 62% angles from prominent price
peak and troughs. Theoretically, these fan lines may then provide support during
subsequent downward corrections, and resistance during subsequent upward
advances.
Fibonacci Retracements
Fibonacci Retracements are based on the Fibonacci number series and represent
price movements in the opposite direction of the previous trend. Retracements can
be calculated by drawing a trendline between a prominent price peak and trough,
then forming horizontal lines at the 38%, 50%, and 62% levels of retracement
from the prior price move. Theoretically, as prices retrace, the retracement levels
may act as support or resistance.
Fill or Kill (FOK)
A Fill or Kill (FOK) order instructs the broker to immediately fill an order in its
entirety or to cancel it. FOK instructions are only applicable to limit orders.
Freeriding
Copyright © Charles Schwab & Co., Inc. 2006. All rights reserved. (0106-5667)
375
StreetSmart Pro User Manual
This trading violation is the result of buying a security in your Cash Account and
then selling the same security without making separate payment on the full
purchase price by Settlement Date. This situation is called freeriding because
basically it is unauthorized borrowing to pay for a trade.
Fundamental Analysis
Fundamental analysis is the study of economic, industry, and company conditions
in an effort to determine the value of a company's stock. Fundamental analysis
typically focuses on key statistics in a company's financial statements to determine
if the stock price is correctly valued.
A|B|C|D|E|F|G|H|I|J|K|L|M|N|O|P|Q|R|S|T|U|V|W|
X|Y|Z
Gaps
Gaps form when opening price movements create a blank spot on the chart. Gaps
may be especially significant when accompanied by an increase in volume. An up
gap forms when a security opens above the previous period's high, remains above
the previous high for the entire period and closes above it. Up gaps can form on
daily, weekly or monthly charts and are generally considered bullish. A down gap
forms when a security opens below the previous period's low, remains below the
previous low for the entire period and closes below it. Down gaps can form on daily,
weekly or monthly charts and are generally considered bearish.
Good Til Canceled (GTC)
Instructs the broker to keep an order open until it is either executed or expires. At
Schwab, GTC orders remain open for 60 calendar days unless filled or you request
that it be canceled before that time.
Halted Securities
Occasionally, trading on a given security may be suspended due to a variety of
conditions, including news and corporate actions. If the security you are attempting
to trade has been halted, you can place an order but it will not be eligible for
execution or in force until the trading halt is lifted. If you have an open order for a
security that subsequently is halted, your order will be eligible for execution after
the halt is has been lifted. Please be aware that when the security resumes trading
it may be at a price significantly above or below the most recent trade price.
Head and Shoulders
The Head and Shoulders pattern is one of the best known of the reversal patterns.
At a market top, three prominent peaks are formed with the middle peak (or head)
slightly higher than the two other peaks (shoulders). When the trend line (neckline)
connecting the two intervening troughs is broken, the pattern is complete. A
bottom pattern is a mirror image of a top and is called an Inverse Head and
Shoulders.
Immediate or Cancel (IOC)
Requires the broker to immediately fill as much of the order as possible and then
cancel any remaining portion. (It may not be available in all market conditions.)
Unlike All or None (AON) or Fill or Kill (FOK) instructions, IOC orders may result in a
partial execution. Immediate or Cancel can be entered with either market or limit
orders.
Implied Volatility
376
Copyright © Charles Schwab & Co., Inc. 2006. All rights reserved. (0106-5667)
Reference
Implied volatility is a key variable in most option pricing models, including the
Black-Scholes Option Pricing Model. Other variables usually include security price,
strike price, risk-free rate of return, and days to expiration. If all other variables
are equal, the security with the highest volatility will generally have the highest
option prices.
In the Money
For a call option to be in-the-money, an option's strike price must be below the
market price of the underlying security. For a put option, in-the-money is when the
strike price is above the market price of the underlying security.
Indicator
An indicator is a value, usually derived from a stock's price or volume, that an
investor can use to try to anticipate future price movements. Indicators are divided
into two groups: trend following (or lagging) and momentum (or leading). Lagging
indicators tell you what prices are doing now, or in the recent past, so are useful
when stocks are trending. A moving average is an example of a lagging indicator.
Leading indicators are designed to anticipate future price action and many come in
the form of oscillators. RSI is an example of a momentum indicator.
Inside Day
An Inside Day represents a day in which the total range of price is within the
previous day's price range.
Inside Market
The highest bid and lowest ask prices among all competing market makers in a
NASDAQ security.
Invisible (INV)
An order that is deemed "Invisible" or "Subscriber only" will not display on the ISLD
order book. These orders will be matched, if possible, but an invisible order has less
priority than other orders. If an order with a restriction is entered before an
unrestricted order at the same price; the unrestricted order will execute first.
Invisible and Subscriber Only orders do not comply with the Display Alternative as
described in the SEC Order Handling Rules. They are bad for price discovery.
A|B|C|D|E|F|G|H|I|J|K|L|M|N|O|P|Q|R|S|T|U|V|W|
X|Y|Z
Last Split Date
The last date on which the shares of a security were increased or decreased by
splitting.
Last Trade
The price at which the last trade was executed; after market close, this is the
closing price.
Last Trade Date and Time
The date and time the security was last traded.
Level I
A quote for a security that displays the current best Bid and Ask prices, volume,
close price from the previous trading day, open price, high and low price for the
Copyright © Charles Schwab & Co., Inc. 2006. All rights reserved. (0106-5667)
377
StreetSmart Pro User Manual
day, and perhaps the ratio of shares or market participants at the inside Bid and
Ask.
Level II
Level II is a display of both Level I quotes and bid and ask quotes from all quoting
market participants (market makers and ECNs) at lower and higher prices than the
best bid and ask.
Level III
Consists of Level II Service plus the ability to enter quotations, direct/execute
orders, and send information; this service is restricted to NASD member firms that
function as registered Market Makers in either NASDAQ, exchange-listed, or OTC
Bulletin Board securities.
Limit Order
An order to buy or sell a security at a specific price. As opposed to a market order,
limit orders might not be filled quickly or at all if the market moves away from the
specified price. A limit order guarantees price, but not execution.
Line Chart
The line chart is a price chart that simply connects the closing prices for a given
market over a specified period of time, resulting in a curving line on the chart.
Liquidity
The ability of a stock to be readily bought or sold without causing significant price
fluctuations. Generally, the greater the number of buyers and sellers of a particular
stock, the more liquid the stock.
Locking the Market
Market condition in which there are identical bid and ask prices for a stock.
Look-back Period
The look-back period is the number of periods (minutes, days, weeks, months)
used to calculate an indicator. For example, a 14-day RSI would have a look-back
period of 14 days.
A|B|C|D|E|F|G|H|I|J|K|L|M|N|O|P|Q|R|S|T|U|V|W|
X|Y|Z
Maintenance Call
A "call" for additional funds or acceptable collateral to be immediately deposited
into your margin account. This type of margin call is generated when the equity in a
margin account does not meet an established minimum requirement. This can be
caused by fluctuations in market prices or your additional use of margin.
Margin Account
This type of brokerage account allows you to borrow funds, using your own
marginable securities as collateral. The borrowed funds may be used for the
purchase of more securities.
Margin Balance
The net open balance in your margin account. If negative, this is the amount owed
to the brokerage firm. If positive, the balance is available to earn interest.
Margin Call
378
Copyright © Charles Schwab & Co., Inc. 2006. All rights reserved. (0106-5667)
Reference
This term refers to both maintenance calls and "Regulation T" calls (also called Reg
T or Fed calls). An investor who receives a margin call is required to deposit
additional funds or securities in a margin account either because the equity in the
account does not meet an established minimum equity requirement (maintenance
call) or because additional securities have been purchased or sold short.
Margin Interest
Margin interest is charged daily based on your margin balance.
Marginable
A security that may be used as collateral in a margin account. Most listed securities
trading at over $5 per share are marginable, as are most fixed income securities,
OTC stocks, and open ended mutual funds (30-days after they have been fully paid
for). To find out if a specific stock is marginable, please contact a Schwab
representative.
Market Capitalization
Market Capitalization, or market cap, is the total market value of a company
(number of shares outstanding multiplied by the price of the stock). For example, a
company with 1 million shares outstanding and a stock price of $10 would have a
market capitalization of $10 million.
Market Indicators
A variety of indices and other data that indicates the overall direction and strength
of the market.
Market Maker
Market makers are the dealers in the NASDAQ market. They provide liquidity to the
market by trading for their customers or for their own accounts, and are committed
to buy and sell shares in the stock in which they make a market. Market makers
display their buying and selling interest in the Level II quotes.
Market Order
An order to buy or sell a security at the prevailing market price. Sometimes
referred to as "at the market." A market order guarantees execution, but not price.
Market Peg
Pegs the order price to the ask if buying or to the bid if selling, meaning the order
price will automatically adjust as the bid or ask moves until the order executes or
the stock trades beyond your limit price. Orders may be adjusted a penny up or
down to avoid locking the market.
EXAMPLE
•
XYZ is currently quoted at 20 bid x 20.05 ask.
•
A Market Peg order to buy XYZ with a limit of 20.10, will be submitted at
20.05.
•
If the quote changes to 20.05 bid x 20.10 ask, the order price would change
to 20.10.
•
If the order is not executed, it will not update beyond the limit price and will
remain posted at 20.10.
Max Floor
Specifies the reserve size for the order. Must be a round lot equal to or less than
the order quantity. Reserve size has no time priority in Level II. Only the displayed
portion of the order will have time priority.
Copyright © Charles Schwab & Co., Inc. 2006. All rights reserved. (0106-5667)
379
StreetSmart Pro User Manual
EXAMPLE You enter a bid with 5,000 as the total quantity, but 1,000 as the Max
Floor value. Your order will display as 1,000 shares, but if yours is the only bid
when an offer arrives for 10,000 shares at your price, your entire 5,000 shares will
execute.
However, if 3 other bids for 3,000 shares each were behind you at the same price,
only your displayed 1,000 would execute, along with 9,000 shares from the other
three bids.
Minimum Acceptable Quantity (MAQ)
Instructs the broker to fill a minimum share amount of an order.
Minimum Quantity
Instructions to buy or sell a specified number of shares at a limit price, with the
condition that the first fill must be for a minimum number of shares.
Momentum
Momentum is an overbought/oversold indicator that measures the velocity of price
changes for a set period of time. Momentum is measured by continually calculating
price differences between the most recent price and the price n-periods ago, then
plotting these differences around a centerline. If the latest price is greater than
the first price, a positive value is plotted above the centerline. If the latest price is
below the first price, a negative value is plotted below the centerline. The greater
the change in prices, the greater the change in Momentum.
If prices are rising and the momentum line is above the centerline and rising, an up
trend may be accelerating. When the Momentum line drops below the centerline, a
near-term downtrend may be in effect. One popular time period used for
Momentum is the 10-day, however any time period can be employed. A shorter
time period produces a more sensitive line with more pronounced oscillations
(extremes), while a longer period results in a smoother line with less volatile
swings.
Money Flow & Money Flow Percentage
Developed by Marc Chaikin, Money Flow is one of several indicators available to
measure the flow of money in and out of a particular security. The Money Flow
indicator is derived from the daily read of the Accumulation/Distribution Line. The
basic premise behind the Accumulation Distribution Line is that the degree of
buying or selling pressure can be determined by the location of the close relative to
the high and low for the corresponding period ("closing location value").
The closing location value multiplied by volume forms the Accumulation/Distribution
Value for each period. Money Flow Percent is calculated by dividing the sum of the
daily Accumulation/Distribution values over a specified time period by the sum of
the Volume over the corresponding period.
Generally, accumulation or buying pressure is present when prices close in the
upper half of the day's range, and distribution or selling pressure is evident when
prices close in the lower half of the day's range. If prices consistently close in the
upper half of their daily high/low range on increased volume, then the indicator will
be positive and display above the zero line; this indicates that the market may be
strong.
Conversely, if prices consistently close in the lower half of their daily high/low
range on increased volume, the indicator will be negative and display below the
zero line; this indicates that the market may be weak.
380
Copyright © Charles Schwab & Co., Inc. 2006. All rights reserved. (0106-5667)
Reference
It should be noted that because the change from close to close is not considered in
the calculation, a security can close lower and still exhibit signs of accumulation, or
close higher and still exhibit signs of distribution.
Moving Averages
Moving averages are one of the more versatile and widely used of all technical
indicators. A moving average shows the average value of a security's price over a
specified period of time.
To get the average to "move," a new item of price data is added while at the same
time the oldest item is removed. By using an average of prices, moving averages
are able to smooth a data series and make it easier to identify any underlying
trend.
Essentially a trend-following indicator, the moving average works best in markets
that are trending -- as opposed to markets in trading ranges. They are used to
identify and confirm trends, as well as identify support and resistance areas.
It's also important to note that shorter-term averages are typically more sensitive
to individual price fluctuations, while longer-term averages are less sensitive.
Moving Averages include: Simple Moving Average (SMA) - The simple moving
average is the most widely used moving average and is constructed by simply
totaling a set of price data and dividing the sum by the number of observations.
SMAs give equal weight to each price data input. Exponential Moving Average
(EMA) - The exponential moving average is similar to the SMA, only it uses a
"smoothing factor" to give more weight to recent prices while at the same time
allowing all price data to influence the average. By putting more weight on recent
price data, the EMA reduces the time lag and reacts more quickly to recent price
changes.
Moving Average Convergence/Divergence (MACD)
The Moving Average Convergence/Divergence is a trend following momentum
indicator that shows the relationship between two moving averages. The MACD line
is calculated by taking the difference between a longer-period and shorter-period
moving average (typically 26-day and 12-day respectively). It is the interaction of
these two moving averages that gives the indicator its name, as over time the two
are constantly converging and diverging. A signal line is also used, which is
typically the 9-period moving average of the MACD line. Exponential moving
averages are typically used for both the MACD and Signal calculations because they
tend to respond more quickly to changes in price.
Moving Average Convergence/Divergence Histogram (MACD Histogram)
A variation of the MACD that plots the difference between the signal line and MACD
line. Changes in the spread between these two lines may be spotted faster using
the histogram display, potentially leading to earlier trading signals.
Multiplier
The premium is multiplied by the multiplier multiplied by the number of contracts to
determine the actual cost of an option purchase. The multiplier is 100 in the case
of standardized options for both equity and index options; however, stock splits can
change the multiplier. The multiplier is the number of shares that an equity option
will convert to if exercised.
A|B|C|D|E|F|G|H|I|J|K|L|M|N|O|P|Q|R|S|T|U|V|W|
X|Y|Z
Copyright © Charles Schwab & Co., Inc. 2006. All rights reserved. (0106-5667)
381
StreetSmart Pro User Manual
NASDAQ
Formerly known as the National Association of Securities Dealers Automated
Quotations system, designed to facilitate over-the-counter stock trading. The
NASDAQ is now an exchange and is no longer an acronym.
NASDAQ Composite Index
The NASDAQ Composite Index is a market capitalization-weighted index of over
5000 stocks. Because it is weighted by market capitalization, large companies such
as Microsoft, Intel, WorldCom, Sun Microsystems, Dell Computer and Oracle
dominate the index. With such large portion of the index dominated by technology
stocks, the NASDAQ Composite is more a barometer for the technology sector than
the broader market.
NASDAQ National Market (NNM)
Consists of More than 3,900 companies that are the larger and generally more
actively-traded NASDAQ securities.
National Best Bid or Offer (NBBO)
NBBO represents the bid and ask price that will display in Level I.
Negative Divergence
When two or more indicators, indexes, or averages, fail to show confirming trends.
Net Change
The amount and direction of a security's price change since its previous close.
Odd Lot
An amount of stock consisting of less than 100 shares.
Offer
See 'Ask'
On Balance Volume (OBV)
Introduced by Joe Granville in 1963, On Balance Volume (OBV) is a momentum
indicator that relates volume to price change. On Balance Volume shows if volume
is flowing into or out of a security. When the security closes higher than the
previous close, all of the day's volume is considered "up" volume. When the
security closes lower than the previous close, all of the day's volume is considered
"down" volume.
Open
The price at which a security opened for trading on a given day.
Option
A contract that gives the buyer the right, but not the obligation, to buy or sell a
particular asset (the underlying security) at a fixed price for a specific period of
time. This contract also obligates the seller to meet the delivery terms if the buyer
exercises the contract right. The owner of call option has the right to purchase the
underlying asset at a specific price, and this right lasts until a specific date. The
owner of a put option has the right to sell the underlying asset at a specific price,
and this right lasts until a specific date. Clients may also take specialized positions,
such as spreads, straddles, and/or combinations, depending on the level of trading
for which they are approved.
Out of the Money
382
Copyright © Charles Schwab & Co., Inc. 2006. All rights reserved. (0106-5667)
Reference
A call is out of the money when an option’s strike price is higher than the market
price of the underlying security. A put is out of the money when the strike price is
below the market price of the underlying security.
Outed
A term used by traders to confirm that an order was canceled by the Market Maker
or Exchange.
Over-the-Counter (OTC)
Over-the-Counter refers to stocks not traded on registered exchanges. Many OTC
stocks are traded through NASDAQ, OTCBB (Bulletin Board), or the Pink Sheets.
Overbought
Overbought is a technical condition described as such by various technical
indicators that occurs when prices are considered too high and may be susceptible
to a decline. Overbought conditions can be classified by analyzing the chart pattern
or with indicators such as the Stochastic Oscillator and Relative Strength Index
(RSI). A security is sometimes considered overbought when the Stochastic
Oscillator exceeds 80 and when the Relative Strength Index (RSI) exceeds 70. It is
important to keep in mind that overbought is not necessarily the same as being
bearish. It merely infers that the stock may have risen too far too fast and might
be due for a pullback.
Oversold
Oversold is a technical condition described as such by various indicators when
prices are considered too low and may be ripe for a rally. Oversold conditions can
be classified by analyzing the chart pattern or with indicators such as the Stochastic
Oscillator and Relative Strength Index (RSI). A security is sometimes considered
oversold when the Stochastic dips below 20 and when the Relative Strength Index
(RSI) declines below 30. It is important to keep in mind that oversold is not
necessarily the same as being bullish. It merely infers that the security may have
fallen too far too fast and may be due for a reaction rally.
A|B|C|D|E|F|G|H|I|J|K|L|M|N|O|P|Q|R|S|T|U|V|W|
X|Y|Z
Pay Date
The date the shares from a split or dividend are paid to the shareholders.
Percent Retracement
The amount that price retreats following a high can be measured using a technique
referred to as Percent Retracement. This measures the percentage that prices
"retrace" from the high to the low. For example, if a stock moves from a low of 50
to a high of 100 and then retraces to 75, the move from 100 to 75 (25 points)
retraced 50% of the original move from 50 to 100. Measuring the percent
retracement can be helpful when determining the price levels at which prices will
reverse and continue upward.
Position
Holdings in an account or portfolio.
Position Trading
Copyright © Charles Schwab & Co., Inc. 2006. All rights reserved. (0106-5667)
383
StreetSmart Pro User Manual
Position trading means holding open positions for an extended period of time.
Contrast this with day trading, where a trader buys, then sells before the market
closes that day.
Preferred Stocks
A class of stock that pays dividends at a specified rate and has preference over
common stock in the payment of dividends and the liquidation of assets. Preferred
stockholders may have different or no voting rights.
Premium
The total price of an option’s intrinsic value plus time value. Often (erroneously),
this word is used to mean the same as time value.
Price
See ask price, bid price, and last trade.
Price/Earnings Ratio
The price/earnings ratio (P/E ratio) is figured by dividing the price of a stock by the
company's earnings per share.
Primary Peg
Pegs the order price to the bid if buying or the ask if selling OTC securities, or the
best exchange bid/ask for Listed securities. The order price will automatically adjust
as the bid or ask moves until the order executes or the stock trades beyond your
limit price.
EXAMPLE
•
XYZ is currently quoting at 20 bid x 20.05 ask.
•
A Primary Peg order to buy XYZ with a limit of 20.05, will be submitted at 20.
•
If the quote changes to 20.05 bid x 20.10 ask, the order price would change
to 20.05.
•
If the order is not executed, it will not update beyond the limit price and will
remain posted at 20.05.
Proxy
A proxy is a security or index whose correlation with another security or index is so
strong that it is used as a substitute for the other.
Put Option
An option contract that gives the holder the right but not the obligation to sell a
number of shares of the underlying security at a specified price until the option's
expiration date. Put buyers hope the price of the underlying security will fall. Puts
may also be purchased to protect an investment in case the price of the underlying
security goes down. Put sellers hope the price will stay the same or go up.
Put/Call Ratio
Based on CBOE (Chicago Board Options Exchange) statistics, the Put/Call Ratio
equals the total number of puts divided by the total number of calls. All stock and
index options traded on the CBOE are included in the calculation. Typically, there
are more calls traded than puts, so the ratio is usually below 1. When more puts
are traded than calls, the ratio will exceed 1. As an indicator, the Put/Call Ratio
may be used to measure market sentiment.
Quantity
The number of shares you want to buy, sell, or sell short.
384
Copyright © Charles Schwab & Co., Inc. 2006. All rights reserved. (0106-5667)
Reference
A|B|C|D|E|F|G|H|I|J|K|L|M|N|O|P|Q|R|S|T|U|V|W|
X|Y|Z
Rate of Change
The Rate of Change (percent) is a momentum oscillator that measures the percent
change in price from one period to the next. The Rate of Change is plotted as an
oscillator that fluctuates above and below a zero line.
Reaction
A temporary price reversal within the prevailing trend.
Regulation T Call
Also called a Fed Call, this is the amount an investor must deposit if buying on
margin or selling short, as required by the Federal Reserve Board's Regulation T.
Current Federal Reserve requirements are 50% of the cost of the trade.
Relative Strength
A comparison of an individual stock's performance to that of a market index. Most
times the S&P 500 or the Dow Jones Industrial Average are used for comparison
purposes. A rising line indicates that the stock is doing better than the market. A
declining line indicates that the stock is not doing as well as the market.
Relative Strength Index (RSI)
Developed by J. Welles Wilder in 1978, the Relative Strength Index is one of the
more popular momentum indicators. Its name, Relative Strength Index, is slightly
misleading, as it does not compare the relative strength of two securities, but
rather the internal strength of a single security.
The RSI is a price-following oscillator that ranges between 0 and 100. Wilder
argues that the RSI usually tops above 70 and bottoms below 30, and that these
tops and bottoms usually form before the underlying price changes direction. When
Wilder introduced the RSI, he recommended using a 14-day RSI.
Since then, the 9-day and 25-day RSIs have also gained popularity. The fewer days
used to calculate the RSI, the more volatile the indicator. One popular method of
analyzing the RSI is to look for a divergence in which the security's price is making
a new high, but the RSI is failing to surpass its previous high. This divergence may
be interpreted as an impending reversal. If the RSI then turns down and falls below
its most recent trough, it is said to have completed a "failure swing." The failure
swing is considered a confirmation of an impending reversal.
Resistance and Support
Support is defined as an area on the price chart below the market where buying
interest appears sufficiently strong to overcome selling pressure.
Resistance is the opposite of support and represents an area on the price chart
above the market where selling pressure appears sufficiently strong to overcome
buying pressure. Generally, support levels are suggested by previous lows, while
resistance levels are suggested by previous highs.
Support and resistance areas may be viewed as areas in price movements where
buying and selling interest is equal. The longer the time span that prices trade in
these areas, the more significant these areas may become.
Two other possible indications of significance include:
Copyright © Charles Schwab & Co., Inc. 2006. All rights reserved. (0106-5667)
385
StreetSmart Pro User Manual
-Heavy volume within a support or resistance area.
-Recent trade activity within a support or resistance area.
Whenever a support or resistance level is penetrated by a significant amount, the
two can reverse roles and become the opposite. In other words, if price trades
significantly through a prior resistance level, this level can become a future support
level. If price trades significantly through a prior support level, this level can
become future a resistance level.
Reversal Pattern
A reversal pattern implies that the previous trend will be reversed when the pattern
is complete. For example, after an advance, a reversal pattern marks a change in
trend from up trend to down trend.
Rights
Rights allow existing shareholders of a corporation to subscribe to shares of a new
issue of common stock before that stock is offered to the public. A right usually has
a life of 2 to 4 weeks, is transferable, and entitles the holder to buy the new
common stock below the Public Offering Price. Rights are often granted to protect
existing shareholders from the effects of dilution.
Rounding Tops and Bottoms
Generally considered to be reversal patterns, rounding tops and bottoms are areas
on the price chart that indicate smooth curvature of prices, rather than distinct
peaks or troughs. A rounding top displays as a convex shape, sometimes called an
"inverted bowl," that can precede a new down trend. A rounding bottom displays as
a concave shape, often called a "bowl" or "saucer," that can precede a new up
trend. There are currently no measuring formulas associated with these patterns.
A|B|C|D|E|F|G|H|I|J|K|L|M|N|O|P|Q|R|S|T|U|V|W|
X|Y|Z
Sector
A sector is a group of companies that generate revenue in similar ways, and tend to
rise and fall at the same time of the economic cycle. Sector investors watch for
strength or weakness in the various sectors, before making investment decisions.
The relationship between sector strength or weakness, and the business cycle, is
called Sector Rotation.
Security Type
The type of security such as stock, bond or mutual fund.
Sell
Indicates you already own a security and wish to transfer ownership in exchange
for cash.
Sell Signal
A sell signal is a condition that indicates a good time to sell a stock. The exact
circumstances of the signal will be determined by the indicator that an analyst is
using. Note: It's unwise to base buy or sell decisions on just one indicator.
Sell to Close
A long option position is closed when it is sold. See Option.
Sell to Open
386
Copyright © Charles Schwab & Co., Inc. 2006. All rights reserved. (0106-5667)
Reference
A short position opened when a new option is sold. See Option.
Settlement Date
The business day by which you must pay for securities purchased or deliver
securities sold.
Short Interest
The number of shares that have been sold short and not yet repurchased.
Short Sell
Selling a stock not owned in the hope that the price will go down. The seller must
indicate that the sale is a short sale when the order is entered. This can only be
done in a margin account. If available, the stock may be borrowed from a
brokerage firm for delivery to the buyer and must be bought back at a future date.
The firm reserves the right to call the security back at any time. Short sales require
the equity be deposited in a margin account. Short selling is an advanced trading
strategy involving potentially unlimited risks, and must be done in a margin
account. Margin trading increases your level of market risk. For more information
please refer to your account agreement and the Margin Risk Disclosure Statement.
! NOTE: Short sale orders can be placed as either day or GTC orders; however,
GTC orders can expose you to substantial risk. Although the stock may be borrowed
on the day the order is entered, it may not be available for loan on the day the
order is filled. An immediate buy-in may result for your account.
Short Sell-Exempt
A customer service representative may enter Short Sell-Exempt orders on your
behalf in certain limited circumstances. The most common instance when this may
occur is when liquidating the underlying security where the position is held as either
an equity right, warrant, or convertible. In these circumstances, the securities are
not in an acceptable form for delivery on settlement date. Note that you must file
an exercise for the right, warrant or convertible before your order to liquidate the
underlying security can be marked as Short Sell-Exempt. This action acknowledges
that the intent is to sell a position instead of short a stock and is therefore exempt
from the up-tick rule. Please see Up-Tick rule for more information.
Size
Size represents the number of shares immediately available to buy (bid) or sell
(ask). For example, a bid of 54 with a size of 500 would indicate an order to buy
500 shares at 54. By the same token, an ask of 55 with a size of 1000 would
indicate an order to sell 1000 shares at 55.
SmartEx
SmartEx is a trade execution technology that combines the best of intelligent order
routing (IOR) with market maker liquidity enhancements. SmartEx is designed to
deliver trade executions that are as good as, if not better than, what you would
expect to receive using IOR alone.
Special Conditions
Special conditions may be applied to an order, such as All or None (AON) or Do Not
Reduce (DNR).
Specialist
An individual, corporation, partnership, or group of firms on a listed exchange floor
that is responsible for a given exchange-traded security. The specialist stands
Copyright © Charles Schwab & Co., Inc. 2006. All rights reserved. (0106-5667)
387
StreetSmart Pro User Manual
ready to buy and sell shares to maintain an orderly market. A Market Maker serves
a similar purpose for an OTC security.
Spread
The difference between the bid and the ask. Generally speaking, the more liquid
(trading volume) a stock is, the smaller its bid/ask spread will be. Less liquid stocks
(those with very light volume) usually have larger spreads.
Standard and Poors 500 Index (S & P 500)
The Standard and Poors 500 Index (or S & P 500) lists the 500 largest large-cap
stocks, that is, stocks from large companies in various industries.
Stochastic Oscillator
Stochastics compare where a security's price closed relative to its price range over
a given time period. The indicator consists of two lines representing the position of
the market on a percentile basis, with zero at the bottom of the n-day range and
100 at the top of the range. The main, faster line is called %K, while the second
line, called %D, is simply a moving average of %K. A stochastic value of 50
indicates that the last closing price is at the midpoint of the trading range for the
specified period. Readings above 75% may indicate that the security is overbought,
while readings below 25% could suggest it is oversold. It is important to note that
it is not unusual for Stochastics to remain in an overbought/oversold condition for a
long time period as the security's price continues to climb/fall.
Generally, a bullish interpretation may be suggested when the %K line crosses
above the %D line while in oversold territory, and a bearish interpretation may be
suggested when the %K line crosses below the %D line while in overbought
territory.
Stock Dividends
A dividend paid in stock rather than cash.
Stop Limit Order
An order that becomes a limit order once the security trades at or through the
designated stop price. A stop limit order instructs a broker to buy or sell at a
specific price or better, but only after a given stop price has been reached or
passed. It is a combination of a stop order and a limit order, as such, execution is
not guaranteed even if the stop price is reached.
Stop Order
A market order that is only activated when a print or quote that is at or through the
stop price. For equity sell-stop orders, the order is activated when the bid is at or
below the stop price. For equity buy-stop orders, the order is activated when the
offer is at or above the stop price. For options sell-stop orders, the order is
activated when the offer is at or below the stop price. For option buy-stop orders,
the order is activated when the bid is at or above the stop price.
Once the order is activated, you are guaranteed execution, but there is no
guarantee of the execution price. Execution may occur either above, at or below
your stop price.
Strike Price (or Exercise Price)
The price at which the owner of an option can purchase (call) or sell (put) the
underlying security.
Subscriber
388
Copyright © Charles Schwab & Co., Inc. 2006. All rights reserved. (0106-5667)
Reference
Subscriber Only orders are identical to normal orders, except that they are not
included for display in the ISLD quote on NASDAQ. They are visible to anyone with
access to the Island book and have the same execution priority as unrestricted
orders. Invisible and Subscriber Only orders do not comply with the Display
Alternative as described in the SEC Order Handling Rules.
SuperMontageSM
SuperMontageSM is NASDAQ's fully integrated order display and execution system.
SuperMontage was designed to help reduce market fragmentation, provide best
execution, expand the number of choices to Market Participants, and better handle
the growth of the market. It is also a voluntary open-access system that is
intended to increase transparency for investors and market participants by
displaying market participants' trading interests below a single price level. The
order routing and execution segment of SuperMontage replaced SuperSOES and
SOESSM orders.
Support
See "Resistance".
A|B|C|D|E|F|G|H|I|J|K|L|M|N|O|P|Q|R|S|T|U|V|W|
X|Y|Z
Technical Analysis
The study of market action. It is the representation, usually in graphic form, of the
actual history of trading (price changes, volume of transactions, etc.) in a certain
stock or index and then deducing from that pictured history the present position
and possible future trend.
Tick
The tick refers to each individual move from one trade to another in a stock. An up
tick means the price moved up from the last trade execution, while a down tick
means it moved down. If there is no change from the last trade, the tick is
considered neutral.
Time and Sales
Time and Sales reflect the trades occurring in the market by displaying each trade's
price, size (number of shares), and time that the trade was reported.
Time Conditions
The following time limits may be applied to Stop, Limit, or Stop Limit orders: Day
Only, Good Until Canceled, Fill or Kill, Immediate or Cancel.
Trailing Stop
Trailing Stop is a stop order request set at a price level that is above (for short
positions) or below (for long positions) the current price that adjusts as the price
fluctuates. For a long position, a trailing stop would be set below the current price
and rise as the price advances. Should the price decline and reach the trailing stop,
then a stop order would be triggered and the position closed. As long as the price
remains above the trailing stop, the position is held.
Trend
Trend refers to the direction of prices over time. Rising peaks and troughs
constitute an up trend, while falling peaks and troughs constitute a down trend.
Copyright © Charles Schwab & Co., Inc. 2006. All rights reserved. (0106-5667)
389
StreetSmart Pro User Manual
Trends are generally classified as major (longer than a year), intermediate (one to
six months), or minor (less than a month).
Trend Line
Trend lines are created by joining significant highs and lows on a price chart. An up
trend line connects a series of higher lows, while a down trend line connects a
series of lower highs. An internal trend line can also be drawn to best approximate
the majority of relative highs or relative lows without any special considerations
given to extreme price points.
Triangles
Triangle patterns are sideways patterns in which price fluctuates within converging
trend lines. The three types of triangles are the symmetrical, the ascending, and
the descending. A symmetrical triangle occurs when prices are making both lowerhighs and higher-lows. An ascending triangle occurs when there are higher-lows (as
with a symmetrical triangle), but the highs are occurring at the same price level
due to resistance. The odds favor an upside breakout from an ascending triangle. A
descending triangle occurs when there are lower-highs (as with a symmetrical
triangle), but the lows are occurring at the same price level due to support. The
odds favor a downside breakout from a descending triangle. Prices often breakout
rapidly from a triangle, and the breakout can be confirmed when accompanied by
an increase in volume.
A|B|C|D|E|F|G|H|I|J|K|L|M|N|O|P|Q|R|S|T|U|V|W|
X|Y|Z
Up-Tick Rule
The up-tick rule requires that selling short any exchange-listed equity may only be
done when the last reported sale price is higher than the previous reported sale
executed at a different price (previous sales at the same price do not count).
NASDAQ stocks, when executed on NASDAQ, may only be sold short when the
current bid price is higher than a previous bid. When a NASDAQ stock trades on an
exchange there is no up-tick rule applicable unless that exchange implements the
up-tick rule for NASDAQ stocks. There is no up-tick rule for OTC Bulletin Board and
Pink Sheet stocks. When an order is entitled to an exemption from the up-tick rule,
that order can be placed as a sell short exempt order—there are limited instances
where the rules permit the exemption. Please see Short Sell Exempt for more
information.
Volatility
Volatility is a measurement of change in price over a given period. It is usually
expressed as a percentage and computed as the annualized standard deviation of
the percentage change in daily price.
Volume
Volume is the number of shares traded in a security over a period of time. On a
chart, volume is usually represented as a histogram (vertical bars) below the price
chart.
Warrants
A type of security usually issued together with a bond or preferred stock that allows
the holder to buy a proportionate amount of common stock at a fixed price (usually
above the market price at the time of issuance) for a period of years or to
390
Copyright © Charles Schwab & Co., Inc. 2006. All rights reserved. (0106-5667)
Reference
perpetuity. Warrants are transferable and trade on the major exchanges. They are
also known as Subscription Warrants.
Whipsaw
A whipsaw occurs when a buy or sell signal is reversed in a short time. Volatile
markets and sensitive indicators can cause whipsaws. For example, a whipsaw
would occur if a position trader initiates a long position on a bullish MACD crossover
and has to close it the next day because of a bearish moving average crossover.
Williams %R
The Williams' %R is a momentum indicator that measures overbought/oversold
levels. The interpretation of Williams' %R is very similar to that of the %K
Stochastic Oscillator. Readings in the 80-100 range indicate that a security is
overbought, while readings in the 0-20 range indicate oversold.
Copyright © Charles Schwab & Co., Inc. 2006. All rights reserved. (0106-5667)
391
StreetSmart Pro User Manual
StreetSmart Pro Training
Educate yourself on the features and benefits of StreetSmart Pro by taking the
following tutorials.
•
Quick Start Guide - Learn about StreetSmart Pro’s key features in less than
10 minutes. This course offers a general overview of StreetSmart Pro and will
help you quickly acclimate to the trading platform.
•
Trading Window - Learn to submit direct access trades, read Level II and
Time & Sales displays, and utilize the software settings available in
StreetSmart Pro.
•
Multi-Leg Options - Learn the types of advanced option strategies available
in StreetSmart Pro and how to trade them.
•
Account Detail - Learn to actively manage your account by tracking your
orders, position status, balances, and transaction history.
•
Charts - Learn to create charts that meet your needs by adding overlays,
technical analysis studies, and trend lines.
•
Watch List - Learn to create customized Watch Lists with access to
streaming market quotes and news.
•
Alerts and Conditional Commands - Learn to create and submit Alerts
and Conditional Orders to help protect existing positions and to find new
trading opportunities.
•
Stock Screener - Learn to find possible trading opportunities with the Stock
Screener, a powerful platform-based screening and signal generating tool.
•
Sectors Tool - Learn to locate the top performing Sector, Industry, or SubIndustry over any one of many time periods to start the Top-Down review for
investment opportunities.
•
Strategy Tester - Learn how to use historical market data and technical
analysis to help you make future trading decisions.
•
Strategy Matrix™ - See how to use the Strategy Matrix to monitor technical
strategies for individual securities or indexes.
•
Strategy Ticker® - Learn to use the Strategy Ticker to continuously scan
the entire market for securities and indexes that meet pre-defined technical
analysis parameters.
392
Copyright © Charles Schwab & Co., Inc. 2006. All rights reserved. (0106-5667)
Reference
Navigating Online Help
Answers to your questions about StreetSmart Pro® are at your fingertips. Here’s a
brief guide to navigating Online Help before you Get Started:
NEW FEATURES
The most recent changes to the software.
TRAINING
Logon to Schwab.com and click the My Home tab and then the My Benefits
subtab for information on StreetSmart Pro training.
CONTENTS TAB
If your question relates to a specific window or function of the software:
1. Click on the corresponding chapter in the left-hand navigation panel.
2. Doing so will display another tier of chapters or topics directly below them.
Click the one that best describes the type of information you’re looking for.
FULL-TEXT SEARCH
If you are looking for information on a specific subject, you may perform a search
of the help contents by entering the search word or phrase in the upper left corner
Search field. StreetSmart Pro help uses a natural language search engine to help
you find the information you need more quickly.
GLOSSARY, INDEX, ETC.
These features are located in the Reference tab on the right side of the Help
window. There, you’ll find:
•
Glossary
•
IDs - includes Market Participant IDs.
•
Comprehensive FAQ’s (Frequently Asked Questions)
•
Printable User Manuals
•
User Agreements
•
Link to Customer Education on Schwab.com
ABOUT THIS USER MANUAL
This Educational Guide and its content (including price and volume data, screen
samples, and queries) are for informational and educational purposes only.
Although it may provide general information relating to trading or investment
approaches, you should not construe anything in the guide as legal, tax, and
investment, financial or other advice. Nothing contained in the guide constitutes a
solicitation, recommendation, promotion, endorsement, or offer by Schwab of any
particular security, transaction, or investment strategy.
Schwab makes no recommendations or endorsements with respect to any of the
strategies, chart patterns, or indicators referenced; nor does Schwab recommend
the use of technical analysis as a sole means of investment research. At Schwab,
we recommend that investors define their goals, risk tolerance, time horizon, and
Copyright © Charles Schwab & Co., Inc. 2006. All rights reserved. (0106-5667)
393
StreetSmart Pro User Manual
investment objectives in addition to researching possible investment choices
through multiple channels. Use of technical analysis may result in increased
frequency of trading and, therefore, significantly higher transaction costs than a
fundamental approach. CyberTrader, an affiliate of Charles Schwab & Co., Inc.,
provides technical services for StreetSmart Pro, a Schwab product. StreetSmart Pro
is a registered trademark of Charles Schwab & Co., Inc. Schwab StreetSmart Pro is
a pending trademark of Charles Schwab & Co., Inc.
Options carry a high level of risk and are not suitable for all investors. Certain
requirements must be met to trade options through Schwab. Please read the
Options Disclosure Document titled "Characteristics and Risks of Standardized
Options" before considering any option transaction. Call your local Schwab office or
write Charles Schwab & Co., Inc. 101 Montgomery Street, San Francisco CA 94104
for a current copy. Access to Electronic Services and your account may be limited
or unavailable during periods of peak demand, market volatility, systems upgrades
or maintenance, or for other reasons.
2006© Charles Schwab & Co., Inc. All rights reserved. Member SIPC. (070410579)
394
Copyright © Charles Schwab & Co., Inc. 2006. All rights reserved. (0106-5667)
Reference
Identifiers
MARKET MAKER, ECN, AND EXCHANGE IDS
Refer to The NASDAQ Trader Symbol Directory, which provides access to All Issues
(NASDAQ and Other Exchanges), Mutual Funds, and Market Participants. All
information is as of the current trading day. However, please refer to the Daily List
for final verification of daily changes or additions.
Copyright © Charles Schwab & Co., Inc. 2006. All rights reserved. (0106-5667)
395
StreetSmart Pro User Manual
FAQs
GETTING STARTED FAQS
What are the minimum system requirements to run StreetSmart Pro®?
StreetSmart Pro is designed to work on Windows 95, 98, ME, NT, XP and 2000
systems with 128 MB RAM and 40 MB of available space on the hard drive. To
check your RAM:
1. Click the Start button, then Settings > Control Panel.
2. In this window, double-click System. This will launch a dialog box displaying
your installed RAM.
StreetSmart Pro also requires a connection to the Internet with at least a 56K
modem. Cable or DSL connection is recommended.
When I try to connect to StreetSmart Pro with Microsoft Internet Explorer,
I get the error message "Cannot connect to CyberTrader." What should I
do?
1. Check to be sure your version of Internet Explorer is equipped with 128-bit
encryption. You can verify this by opening your browser and clicking on
Help > About Internet Explorer.
2. Under the version number, you will see Cipher Strength. If it does not read
128-bit, click the link Update Information. This will take you to the
Microsoft website where you can download the latest version.
3. Once you have 128-bit encryption, try connecting to StreetSmart Pro again.
If you continue to get the same error message after you have confirmed that your
version of Internet Explorer has 128-bit encryption, repeat the process and reboot
your computer. If that still does not work, contact your Schwab Active Trader team
and ask to be connected to Technical Support.
Sometimes I see trade restrictions in effect and trade restrictions lifted.
What is that and why does it hinder my ability to place orders in my
account?
You may see a note in your Messages Window stating the following, "trade
restrictions in effect" and then later a Message Window note stating, "trade
restrictions lifted". Trade restrictions occur when the balances, positions, and
transactions (B,P,&T) that are sent from Schwab do not reach and post to
StreetSmart Pro. As such, the program cannot verify what the BP&T for the account
currently is, so trading gets restricted. This message has nothing to do with
restrictions or issues at the account level.
As this does inhibit trading, you can always logoff and then logon again. This
normally will correct the problem and allow for you to be able to do trading. If this
is not successful, contact your Schwab Active Trader team.
I got my StreetSmart Pro software from a friend. How do I get set up?
StreetSmart Pro is offered at no charge to a select group of non-professional
Schwab Active Trader clients, based upon trading frequency. If you did not receive
396
Copyright © Charles Schwab & Co., Inc. 2006. All rights reserved. (0106-5667)
Reference
an email or phone invitation to use StreetSmart Pro, please contact your Schwab
Active Trader team for assistance.
I qualify for StreetSmart Pro but don’t have the link to download it.
The StreetSmart Pro download link is located on the Schwab Signature Services
Research website at the StreetSmart Pro Center on Schwab.com. If you cannot find
the link, contact your Schwab Active Trader team for help.
How do I trade with StreetSmart Pro?
Simply open the Trading window and use the Order Entry Panel to place your order.
For more information about placing an order in the Trading Window, see About the
Trading Window.
You may also link to schwab.com for trading: Open a web browser to connect to
schwab.com for trading.
I have a Macintosh. Can I use StreetSmart Pro?
No. Currently, there are no plans to create a Macintosh version of StreetSmart Pro.
However, Mac users can access streaming quotes and news with Schwab’s
StreetSmart.com web-based platform.
STREETSMART PRO® WINDOWS FAQ
I do not see any articles in the News window. What’s wrong?
If you cannot see any news in the News window, it’s possible that there isn’t any
news for the symbol you are currently viewing since you logged on. To see if any
news is out for today, you can right-click in the display window and select Query.
Input the symbol you want to query and select the Last 24 Hours radio button,
and click OK.
It may also be possible that you are using the same color for your background and
font. To adjust your colors:
1. Click on the News window Settings > Colors.
2. Choose the colors for the background and fonts.
3. To change the colors, click on the color wheels on the right side of the page
and select contrasting font and background colors.
4. If this does not resolve the problem, please contact your Schwab Active
Trader team.
How can I move the windows around individually and customize the
layout?
You can move the windows within StreetSmart Pro by clicking on the window you
want to move. Place the cursor on the highlighted title bar, left-click and hold the
mouse down, then drag the window to the new location and release the mouse.
You can also then resize the window by placing your cursor on any corner of the
window, left-click and hold the mouse down, then move your mouse until the
window fits where you want it to be displayed and release the mouse.
Copyright © Charles Schwab & Co., Inc. 2006. All rights reserved. (0106-5667)
397
StreetSmart Pro User Manual
I use several monitors. How can I move the StreetSmart Pro windows to
display on different monitors?
Follow the instructions for enabling free-floating windows.
Once this feature is enabled, you can move different components of StreetSmart
Pro onto different monitors.
I minimized one of the StreetSmart Pro windows and now I can’t see it.
How do I get it back?
From the Main Menu, select Tools > Find Active Tool.
This will show all the active windows.
Click on the window you are looking for and it will be displayed on top of the
window that it was hidden behind.
I cannot see the Tabs on my windows, how do I add them?
From the menu of Charts, Watch Lists, Top 10 or High/Low, Tabs > Enable.
This will show two or more tabs in the active windows.
From the Tabs menu you can also Insert new tabs or Edit existing tabs.
LEVEL II QUOTES FAQ
Why don’t I have any streaming data in the Level II panel?
Market Makers and ECNs are only shown when you are viewing a NASDAQ security.
These will not be shown when you are viewing a Listed security unless you are
using the Direct ECN quotes. All StreetSmart Pro® users can use the Direct ECN
quotes, but not all StreetSmart Pro users are eligible for Level II quotes. For more
information on eligibility for Level II, please contact your Schwab Active Trader
team.
To access the Direct ECN quotes, go to Settings > General > L2 Data tab and
select from the available ECNs. Direct INET and ARCA quotes are normally available
for any NASDAQ or Listed security.
TRADING WINDOW FAQ
What is the Level II showing me in the Trading window?
The streaming boxes display Level II data, representing the number of shares
available at a specific price for a specific Market Maker, ECN or exchange.
From left to right:
•
The first box indicates the bid prices and associated available shares
currently available for the specified security. Full share amounts are
displayed.
•
The middle box indicates the ask prices and associated available shares
currently available for the specified security.
•
The last box, Time & Sales, is a running log of the trades executed for the
specified security. This shows Time and Sales of the trade as it is reported to
NASDAQ and not the actual time that the MM traded the stock (90 second
reporting rule).
398
Copyright © Charles Schwab & Co., Inc. 2006. All rights reserved. (0106-5667)
Reference
To learn more about NASDAQ Level II quotes, see the Streetsmart Pro® Trading
Window Platform course available by clicking on the Education Weblink icon .
How do I view Options in the Trading window?
1. Enter the underlying stock symbol in the Symbol field and press Enter.
2. Choose the Options tab in the Trading window.
3. You can choose to view only calls or puts for the nearest month. You can
also select a specific month for any options’ cycle.
What does the Ratio represent in the Trading window?
The left side of the ratio represents the number of shares currently reflecting a bid
price at the inside bid.
The right side of the ratio displays the number of shares currently reflecting an ask
price at the inside ask.
Can I change the way the ratio is displayed?
You can change this ratio to represent the number of Market Makers available at
the inside bid/ask prices. Simply:
1. Click on the Trading window.
2. Choose Settings > General > L1 Data tab.
3. In the General window, uncheck the Compute Ratio From Quantities box.
4. Click OK.
How do I get the symbol I entered in the Trading window to reflect in the
Charts and News windows?
StreetSmart Pro® software can link Charts and News to the Trading window. To
use this feature:
1. Click Settings > Links. This will open the links menu.
2. Choose which windows you want to be linked to the Trading window you are
using.
3. Clicking on the name will highlight the selection as a new link to the Trading
window.
4. To remove a link, clicking on the highlighted name will deactivate the link.
The Order Entry panel has disappeared from my Trading window. What
happened?
You can open and close the Order Entry panel of the Trading window by clicking the
arrow under Last (Trade Price).
Will clicking an action button automatically submit my order?
You willl receive an Order Verification to review before submitting your order if you
have left the Order Verification setting checked (located under Settings >
Copyright © Charles Schwab & Co., Inc. 2006. All rights reserved. (0106-5667)
399
StreetSmart Pro User Manual
General > Orders). If you uncheck this box, which is not recommended, your
orders will be submitted without any chance to review.
For SmartEx orders, if you checked the Spec Cond checkbox, a pop-up window will
open allowing you to designate additional order qualifiers before you verify or
submit your order.
Is there a faster way to submit SmartEx Day Market and Day Limit orders?
Yes. You can submit Day Market and Day Limit orders directly from the Trading
window by not checking the Spec Cond checkbox. Spec Cond is not an alternative
when submitting Direct Access orders.
Why do I see Direct Access routes for some equities but not others?
Schwab’s Direct Access trading offer applies to Listed, NASDAQ, and OTC equities
only. In addition you have the choice to route to any of Schwab’s three daily
sessions (Pre Market, SmartEx, and After Hours.)
Why do I not see any Level II information?
Check to make sure that your settings are correct to receive Level II quotes. Go to
the Trading window and click on Settings > General. If you have been qualified
for Level II access, you should be able to click on the MM/Exchange Best
checkbox. If that check box is grayed out, please contact your Streetsmart Pro
representative.
What are the rules for trading options at Schwab?
To start trading options at Schwab, you'll need to complete an Option Trading
Application. Based on a review of the application and your requested strategies,
Schwab will approve your account to trade at one of the following four levels:
Level 0: Allows you to write covered calls and buy protective puts.
Level 1: Allows you to write covered calls, buy calls and puts.
Level 2: Allows you to write covered calls, buy calls and puts, and create spreads,
long straddles, and long combinations.
Level 3: Allows you to buy and sell covered and uncovered calls and puts, and
create spreads and straddles.
If you are currently approved for options trading and decide that you would like to
apply to upgrade your option trading level, please complete a new Option Trading
Application. Schwab will evaluate your application and send a confirmation of the
option trading strategy approved for your account.
! NOTE: Schwab Keogh and Custodian Accounts are only eligible for Level 0 option
trading and cannot be upgraded to a higher level of option trading.
Can I trade Cash Secured Equity Puts (CSEPs) on StreetSmart Pro?
You can if your account meets certain requirements:
•
400
If you have a Level 1, 2, or 3 option approved margin account or a Level 1
option approved IRA or cash account, AND
Copyright © Charles Schwab & Co., Inc. 2006. All rights reserved. (0106-5667)
Reference
•
If you have sufficient cash in your account to cover the position.
Cash types that can be used to secure the put:
•
Schwab Value Advantage Funds
•
Cash Deposits
•
Schwab Bank Deposits
•
Schwab Money Market Funds
Options carry a high level of risk and are not suitable for all investors. Certain
requirements must be met to trade options through Schwab. Please read the
Options Disclosure Document titled "Characteristics and Risks of Standardized
Options" before considering any option transaction. Call your local Schwab office or
write Charles Schwab & Co., Inc. 101 Montgomery Street, San Francisco, CA
94104 for a current copy.
CHARTS FAQ
How many charts can I see at once?
StreetSmart Pro® allows six charts to be viewed at once.
How do I compare a stock chart against another symbol or Index?
In the Chart window menu bar:
1. Go to Settings > General.
2. The General window provides an Overlay Symbol option, which allows one
stock or Index symbol to be entered.
3. Enter the symbol and click OK.
4. The chart will now compare your original stock to the symbol you just
entered.
5. This symbol will continue to be reflected on all stock charts generated in this
Chart window until you manually remove the symbol by going to Settings >
General, deleting the symbol in the Overlay Symbol field, and clicking OK.
How do I change the symbol in the Chart window?
1. Click on the chart and type a new symbol.
2. Then press Enter to display the new chart.
Or you can link the Chart window to the Trading window by going to Settings >
Links in the Trading window. See the Trading window section for more information.
How do I change the Chart variables?
Go to the Chart window Menu and choose Settings > General.
This will allow the chart to be set with the different types of charting styles and
time frames.
How can I see all of the information regarding my studies in the Info
window?
Copyright © Charles Schwab & Co., Inc. 2006. All rights reserved. (0106-5667)
401
StreetSmart Pro User Manual
1. Go to the Chart window Menu and choose View > Info Window to have
the window displayed on your screen.
2. Drag your mouse to the Info window until you get to the bottom edge of the
window and your mouse cursor changes to a double-headed arrow.
3. Drag the bottom edge of the Info window down to enlarge it. This will
enlarge the window and allow you to see all of the indications of the studies
that you are following.
ACCOUNT DETAIL FAQ
BALANCES
How do I view the latest marked-to-market balances in my account?
Balances will update when you first logon and then every 15 minutes or 30 seconds
after a transaction, whichever comes first. If you have a Margin account, you can
find the time of your last update by going to the Balances tab and clicking on the
Detail button located near your Margin Buying Power.
How accurate are the Balances displayed on the Balances tab?
Balances are updated in real-time to reflect both security and cash transactions and
intra-day price movements. Consequently, the cash and security balances and the
derived figures (such as buying power and margin equity) should all be an accurate
snapshot of your account at the time that the data is refreshed.
Your positions are updated on a tick-by-tick basis during market hours. It is very
possible that the current values in your Balances tab may not match the Positions
tab, as the Balances tab is static and the Positions tab is dynamic.
Why are my Balances different on StreetSmart Pro® software than on
other Schwab electronic channels?
All Schwab electronic channels are in the process of being converted to using
marked to market balances and positions. Before this conversion process is
complete, it is possible that StreetSmart Pro software will be using this real-time
valuation method while other channels are using methods based on security prices
from the close of the previous business day.
Additionally, the StreetSmart Pro quote feed is different than feeds used by other
electronic channels such as Velocity therefore you may see slight variances based
on both the quotes themselves as well as the timing of the balance update.
POSITIONS
What is meant by "open positions"?
Securities that hold in your account are "open positions." Once you sell a position
that you are long or buy back a position that you are short, that position is
considered closed. This page only displays your open positions.
How are "Market Value" and "Prices" determined?
402
Copyright © Charles Schwab & Co., Inc. 2006. All rights reserved. (0106-5667)
Reference
Market Values and Prices displayed are real-time and derived from the real-time
quotes for the securities in your account.
How is the Cost determined?
Adding and subtracting the fills received for your positions determines the total
cost. The cost is calculated by multiplying the number of shares and the execution
price for each fill. Commissions, Fees and other events such as dividend payments
and other corporate actions are not included in this calculation.
As shares/contracts are added to a position the new cost is based on an average
share/contract price. Liquidations of shares do not impact the average share price.
This method of calculation is the same as for a Mutual Fund and does not consider
lot accounting which allows for the management of positions based on FIFO or LIFO
accounting rules.
What does the asterisk (*) next to the cost figure mean?
An asterisk indicates that the cost displayed is probably incorrect. When summing
the executions for your position if the ending position amount differs from the
position received from the position database it will be marked with an asterisk.
Please be aware that fill events that occurred prior to January 2004 will not be
included in the calculation of the cost for your position.
How is the P&L calculated?
The Cost amount is compared to the Market Value and the difference is the profit or
loss on your position.
TRANSACTIONS
Can I Control the Volume of Transactions sent to me when I Update?
Yes. The 30-day setting is a default value. Simply click in the Days field and change
the number to the number of days to want to see. You can set the value anywhere
in the range of 1 to 30 days. The higher the value, the more days of transaction
data you will receive and the longer it takes for that information to be transmitted.
Can I build up transaction history over a period of time in Streetsmart Pro
?
No. Unlike transaction data found on other Schwab channels, data is not stored on
your Streetsmart Pro desktop. If you want to retain transaction data spanning
periods greater that the last 30 days, you must export this data for use with an
external application, such as MS Excel.
Alternatively, if you need to look further back than the 90-day maximum limit of
the StreetSmart Pro software, the quickest way is to go to schwab.com or contact
your Schwab Active Trader Broker.
STOCK SCREENER FAQ
How can I save my personal Queries?
Copyright © Charles Schwab & Co., Inc. 2006. All rights reserved. (0106-5667)
403
StreetSmart Pro User Manual
Streetsmart Pro® software will automatically save any personal queries that you
create. To return to a query that you have created go to User Queries and you will
see your queries listed in the drop-down. This query will automatically be saved
when you logoff, but not to a file. As a result, File > Clear the Query File will
cause the personal query to be lost, if not saved to a file. .
To save a Query to a file, see Creating and Saving Queries.
The queries that I am creating are not producing the results that I am
expecting. What am I doing wrong?
In addition to knowing what the filter variables mean, you must also understand
how to use them properly to get the output you desire. One way of doing this is to
screen for a stock that meets your criteria, find the values of the filters you are
using and then use that information to refine your query.
For more information about creating user queries, use the Education Weblink
from the StreetSmart Pro toolbar to access the Stock Screener Platform Course.
Where can I find out what filter variables comprise a built-in query?
Whether the query you are interested in is Built-In or one of you created, you can
view the filter variables by selecting the query and then going to View > Query
Description.
Can I use an existing query as a starting point for a new user query?
Yes, select the query that you would like to use as your starting point. Then go to
User Queries > Edit Query.
! NOTE: You must rename your new query to save it.
WATCH LIST FAQ
How do I create a watch list?
Click on the Watch List icon
list and create a new one:
in the Toolbar. If you want to delete a current watch
1. From the Watch List window, Click the File > Clear Watch List.
2. This will empty the current list.
3. Now you can add symbols one at a time by right-clicking in the Watch List
window and selecting Add Symbol.
4. You can set up the entire list at once by clicking on Settings > Symbol
List. This allows you to add or remove symbols from the list.
5. You can also use the Insert key on your keyboard to open a pop-up box and
add symbols or the Delete key for removing symbols.
6. When you have finished, click OK.
7. You can save your Watch List by clicking File > Save Watch List As, then
selecting a Watch List Name.
How do I customize my Watch Lists?
To customize the column headings in your Watch Lists:
404
Copyright © Charles Schwab & Co., Inc. 2006. All rights reserved. (0106-5667)
Reference
1. Right-click on the column you want to change.
2. From the pull-down menu, select the new value of the by clicking on the
name.
3. To adjust the number of columns and headings all at once, click on Settings
> Columns.
For a detailed description of each column, see Watch Lists.
How do I add a symbol to my Watch List?
To add a symbol:
•
Right-click in the Watch List window and select Add Symbol,
•
Press the Insert key on your keyboard, OR
•
From the Watch List window click on Settings > Symbol List.
How do I look up symbols for my Watch List?
To perform a symbol lookup:
•
From the Main Menu, click Tools > Symbol Lookup.
•
Or click the Symbol Lookup icon
in the Toolbar.
How many symbols can I put in a Watch List?
Each Watch List can display up to 100 symbols, and you can create as many Watch
Lists as you like. You are only limited to the amount of disk space on your
computer.
How do I retrieve a Watch List?
1. Go to the menu bar in the Watch List window and choose File > Load
Watch List.
2. Double-click on your preferred Watch List or choose the Open button to
display the Watch List.
How do I enter options in a Watch List?
1. Go to the Watch List window.
2. Click Settings > Symbols List.
3. Enter a period ( . ) followed by the option symbol, for example .INQFF, or
enter the option symbol and ".o" as in INQFF.o.
4. Click OK.
How do I enter an Index in a Watch List?
1. Go to the Watch List window.
2. Click Settings > Symbols List.
3. Enter a $ followed by the Index symbol. See Index Symbols.
4. Click OK.
Copyright © Charles Schwab & Co., Inc. 2006. All rights reserved. (0106-5667)
405
StreetSmart Pro User Manual
5. The option symbol will appear in the Watch List window.
How can I tell if I entered a bad symbol?
If the text in the window reads "Requesting Information for [stock/Index/option
symbol]" and does not update or you see "Symbol - ?" in the title bar of the
window, you have entered a bad symbol.
To find the correct symbol:
.
1. Go to the StreetSmart Pro Toolbar and click the Symbol Lookup icon
2. Enter the symbol or as much company information as you have.
3. Click OK.
How do I enter a Preferred or a Stock Class symbol using StreetSmart Pro?
When you are entering a symbol into Trading window, the text will always display
in uppercase. For Preferred stocks, you use a Shift+P when entering in the
symbol will denote that you are requesting a quote for a Preferred stock. For
example: PCGpA
For a Stock Class quote, you use a (/) to indicate you are requesting a specific class
of stock. For example: TAP/A is for Travelers Class A stock and TAP/B is for
Travelers Class B stock. NOTE: Not all Stock Class stocks use the (/) indicator.
For example: VIA is Viacom Class A, but VIA/B is Viacom Class B.
For best results, use the Symbol Lookup from the StreetSmart Pro Toolbar
.
How do I set up Watch List Groups?
To establish a new group highlight the line in the watch list where you would like
the group to be. Using the right click menu select Insert Group. A line will be
inserted in the watch list and the cursor will appear allowing you to type in the
name for your Group.
Adding symbols to a group can be done via two methods.
•
Inserting a symbol to a Group one at a time: Highlight the Group name and
using the right-click menu select Add Symbol to Group.
•
Inserting several symbols to a Group at one time: Go to Settings >
Symbol List. Fill in the Symbol field, click on the name of the group you
wish to add it to, and click Add Symbol to Group.
! NOTE:
To add symbols into the main Watch List use the Insert Symbol menu
choice.
TOP TEN FAQ
How can I see Top Ten information for NASDAQ equities too?
Clicking on the Top Ten icon in the toolbar will launch information for NYSE stocks.
Clicking a second time will launch information for NASDAQ stocks.
Why is the Top Ten window empty?
406
Copyright © Charles Schwab & Co., Inc. 2006. All rights reserved. (0106-5667)
Reference
This could be happening for the following reasons:
The connection to the server could be down. You can try to reconnect using the
Reconnect To Servers function located in the main StreetSmart Pro® toolbar
under Help. If that is not successful, logoff and back on.
If you are logged in during the Extended Hours Trading sessions, the window could
be empty.
How can I reduce the amount of space that the Top Ten windows occupy in
the display window?
The Top Ten windows can be formatted in a variety of different ways using data
you select. These settings are located in the Settings > General window.
•
Determine if you need to see information for both the NASDAQ and NYSE
markets.
•
Determine if you are really interested in gainers, decliners and volume or if
a subset of this information is what you find most useful.
•
Determine if you need to see all three data columns.
•
See if formatting horizontally works better in you existing layout.
HIGHS & LOWS FAQ
Why is the window always empty when I first login or open the window?
This could be happening for the following reasons:
•
This window populates in a similar manner to the Time & Sales panel in the
Level II montage and does not display any historic data. As new highs and
lows are reached the window begin to populate.
•
Because this data stream does not include historic data, if you log in outside
of market hours it could remain empty.
•
Go to Settings > General to make sure that you have selected the data
you are interested in viewing.
Why do I hear about stocks hitting new High-Lows but do not see them
display?
Check the filter settings in Settings > Filters and change if necessary.
Copyright © Charles Schwab & Co., Inc. 2006. All rights reserved. (0106-5667)
407
StreetSmart Pro User Manual
Printable User Manuals
PRINTABLE USER MANUALS
Download a printable version of the Online Help by clicking the link below. You will
need the latest version of Adobe Acrobat Reader to view this PDF formatted
document.
Printable User Manuals
•
Full Manual
•
Getting Started
•
Toolbar Icons
•
Trading
•
Account Detail & Alerts
•
Charting
•
Strategy Testing Tools
•
Market Data Tools
•
News & Messages
•
Stock Screener
•
Reference
Quick Start Guide
ABOUT THE USER MANUAL
This Educational Guide and its content (including price and volume data, screen
samples, and queries) are for informational and educational purposes only.
Although it may provide general information relating to trading or investment
approaches, you should not construe anything in the guide as legal, tax, and
investment, financial or other advice. Nothing contained in the guide constitutes a
solicitation, recommendation, promotion, endorsement, or offer by Schwab of any
particular security, transaction, or investment strategy.
Schwab makes no recommendations or endorsements with respect to any of the
strategies, chart patterns, or indicators referenced; nor does Schwab recommend
the use of technical analysis as a sole means of investment research.
At Schwab, we recommend that investors define their goals, risk tolerance, time
horizon, and investment objectives in addition to researching possible investment
choices through multiple channels. Use of technical analysis may result in increased
frequency of trading and, therefore, significantly higher transaction costs than a
fundamental approach.
CyberTrader, an affiliate of Charles Schwab & Co., Inc., provides technical services
for StreetSmart Pro, a Schwab product. StreetSmart Pro is a registered trademark
of Charles Schwab & Co., Inc. Schwab StreetSmart Pro is a pending trademark of
Charles Schwab & Co., Inc.
Access to Electronic Services and your account may be limited or unavailable during
periods of peak demand, market volatility, systems upgrades or maintenance, or
for other reasons.
408
Copyright © Charles Schwab & Co., Inc. 2006. All rights reserved. (0106-5667)
Reference
Agreements
Your Agreements With Schwab & Other Useful Information
•
CyberTrader®, an affiliate of Charles Schwab & Co., Inc., provides technical
services for StreetSmart Pro®, a Schwab product.
•
Charles Schwab & Co., Inc. (member SIPC) and CyberTrader, Inc. (member
SIPC/NASD) are independent subsidiaries of The Charles Schwab
Corporation.
•
StreetSmart Pro® is offered at no charge to a select group of nonprofessional Schwab Active Trader* clients who meet certain eligibility
requirements based on trading frequency. This offer may be subject to
additional restrictions and may be changed at any time.
•
The speed and performance of streaming functionality may vary depending
on your modem speed, ISP connection and the number of securities you
maintain on your Watch Lists. You need a Pentium 266 MHz or better
processor, 128 MB RAM or more and a 56k or better modem, DSL or cable
modem to receive the best possible experience of streaming quotes and
news on StreetSmart Pro.
StreetSmart Pro provides advanced market information for your desktop and allows
you to place orders. It also allows you to connect and place trades through
schwab.com. This User Manual explains how to use StreetSmart Pro’s trading
capabilities and provides instructions on how StreetSmart Pro can be used with
schwab.com. This manual is designed to give you easy-to-use, step-by-step
instructions for using StreetSmart Pro.
•
Access to Level II data requires meeting certain eligibility requirements
based on trading frequency. For additional information, please contact your
Schwab Active Trader Team.
•
The market data used in this manual is for illustrative and educational
purposes only, and is not intended to reflect actual trading behavior or other
characteristics of any securities or company.
•
This manual was developed for use with StreetSmart Pro and should not be
used for other trading software or channels.
•
You will receive an announcement about updates to the StreetSmart Pro
software and User Manual the first time you Log Off StreetSmart Pro after
the enhancements and upgrades become available. You may also receive
updates through other methods, including electronic notification or emails.
•
Please remember that the real-time market data available through
StreetSmart Pro may come from different sources than the real-time market
data sources for Velocity, schwab.com, or other Schwab websites. This may
result in slight differences in quotes and other information, especially in fastmoving markets.
Your use of each version of StreetSmart Pro is governed by your
agreements with Schwab, including:
•
The End User License Agreement for StreetSmart Pro software that you must
agree to as part of the software download process
•
Your account agreements, including the Electronic Services Agreement
Copyright © Charles Schwab & Co., Inc. 2006. All rights reserved. (0106-5667)
409
StreetSmart Pro User Manual
•
Any disclosures associated with the market data and trade order routing and
functionality incorporated in or related to the use of the software, including
the Direct Access Disclosure and Agreement
The following information is not intended to replace your careful review
and acceptance of the agreements and disclosures outlined above:
•
Before using StreetSmart Pro, you should carefully read all disclosures and
instructions that Schwab provides for a complete understanding of
StreetSmart Pro’s capabilities.
•
If you have a question about the StreetSmart Pro software that cannot be
answered by the Help file or User Manual, contact your Schwab Active Trader
Broker before taking any action.
•
Since StreetSmart Pro depends on third-party data feeds, lines, and systems,
the accuracy and timeliness of market data cannot be guaranteed.
•
If data feeds, servers, and communication lines fail, Schwab is not
responsible for these third-party components.
•
Alert your Schwab Active Trader Broker about any problems you encounter in
using StreetSmart Pro, so we can help resolve them.
•
Schwab will continue to upgrade the StreetSmart Pro software and User
Manual periodically. It is your responsibility to stay up-to-date with the most
recent versions by downloading upgrades and enhancements when notified
by Schwab.
•
In using this software, you are acknowledging that you understand and
accept the risks involved in online trading.
•
By making StreetSmart Pro available to you, Schwab is not recommending,
promoting or endorsing any particular investment, market data, or trading
strategies.
410
Copyright © Charles Schwab & Co., Inc. 2006. All rights reserved. (0106-5667)
Reference
Link to Customer Education
Click on the Education Weblink icon
educational material including:
in the toolbar to access all of Schwab's
•
Using StreetSmart Pro®
•
Market Education
•
Direct Access Trading
•
Printable User Manuals
•
Trader's Education On-Line Courses
•
Introduction to Stock Screener
Copyright © Charles Schwab & Co., Inc. 2006. All rights reserved. (0106-5667)
411
StreetSmart Pro User Manual
CSUK and Hong Kong Customers
Eligibility for and Use of StreetSmart Pro® Software and Other Related
Products
•
CyberTrader®, an affiliate of Charles Schwab & Co., Inc., provides technical
services for StreetSmart Pro, a Schwab product.
•
Charles Schwab & Co., Inc. (member SIPC) and CyberTrader, Inc. (member
SIPC/NASD) are independent subsidiaries of The Charles Schwab
Corporation.
•
StreetSmart Pro is offered at no charge to a select group of non-professional
Charles Schwab Hong Kong and customers referred by Charles Schwab UK
who meet certain eligibility requirements based on trading frequency. This
offer may be subject to additional restrictions and may be changed at any
time.
•
To learn more about specific eligibility standards for use of StreetSmart Pro
by customers of Charles Schwab Hong Kong and customers referred by
Charles Schwab UK, please contact your customer service representative.
•
For customers in Asia, UK, and Switzerland accessing StreetSmart Pro via
DSL, ISDN or cable modem is strongly recommended in order to receive
optimal speed and performance of streaming market data functionality
•
Certain products and services described in this Online Help guide may not be
available to customers of Charles Schwab Hong Kong and customers referred
by Charles Schwab UK, including but not limited to:
o
Access to schwab.com
o
Velocity Trading software
o
Schwab Platinum service and Schwab Platinum representatives
o
Direct Access trading via StreetSmart Pro
o
E-Mail Alerts and Trade Confirmations
Your use of each version of StreetSmart Pro is governed by your
agreements with Schwab, including:
•
The “End User License Agreement” and “StreetSmart Pro Disclosure and
Agreement” that you must agree to as part of the software download process
•
Your account agreements, including the “Electronic Services Agreement”
•
Any disclosures associated with the market data and trade order routing and
functionality incorporated in or related to the use of the software
•
Any laws or regulations in force in your country of residence pertaining to the
download and use of encrypted software.
412
Copyright © Charles Schwab & Co., Inc. 2006. All rights reserved. (0106-5667)