1
Customization Manual
Copyright © 2008-2010, Better Days Enterprises, LLC.
722 Alta Vista
Rapid City, SD 57701
Revision: May 2, 2011
Version: 1.85
CleverQ® Customization User Manual
Table of Contents
Introduction ......................................................................................................................... 5
Navigator............................................................................................................................. 5
Preferences .......................................................................................................................... 6
Security ............................................................................................................................... 6
Departments ........................................................................................................................ 6
Allocations Define Departments ..................................................................................... 6
Define Departments ........................................................................................................ 6
Allocations ...................................................................................................................... 7
User Defined Allocations ................................................................................................ 8
Data Extraction ................................................................................................................... 9
Data Sources/Extractor Definitions ................................................................................ 9
QuickBooks® ............................................................................................................. 9
Excel Worksheets...................................................................................................... 10
Database .................................................................................................................... 10
Data Package ............................................................................................................. 10
Extracted Data ............................................................................................................... 10
Viewing Data ............................................................................................................ 11
Editing Data .............................................................................................................. 13
Purge Extracted Data ................................................................................................ 13
Analytical and Calculation Engine (ACE) ........................................................................ 14
ACE Definitions................................................................................................................ 14
Parameters ..................................................................................................................... 14
Creating Parameters .................................................................................................. 15
Calculation Options .............................................................................................. 15
Parameter Formulas .............................................................................................. 16
Parameters ......................................................................................................... 19
Math Functions ................................................................................................. 21
Other Functions ................................................................................................. 21
Aggregate Functions ......................................................................................... 21
Forecasting Functions ....................................................................................... 22
Formulas on Formulas .......................................................................................... 22
Testing Parameters ................................................................................................ 22
Editing Parameters .................................................................................................... 23
Parameters with Errors .............................................................................................. 24
Deleting Parameters .................................................................................................. 24
Special Parameters .................................................................................................... 25
Key Parameters ..................................................................................................... 25
ROA Parameters ................................................................................................... 25
Indicators....................................................................................................................... 27
Key Indicators ........................................................................................................... 27
Creating Indicators .................................................................................................... 27
Indicator Name...................................................................................................... 28
Indicator Formula.................................................................................................. 28
Parameters ......................................................................................................... 28
Page 2
CleverQ® Customization User Manual
Math Functions ................................................................................................. 29
Other Functions ................................................................................................. 29
Aggregate Functions ......................................................................................... 29
Forecasting Functions ....................................................................................... 31
Ranges ................................................................................................................... 31
Range Colors ..................................................................................................... 31
Range Icons ....................................................................................................... 33
Range Advice/Tips............................................................................................ 33
Desired Range ....................................................................................................... 34
Benchmark ............................................................................................................ 34
Formatting ............................................................................................................. 35
Categories ............................................................................................................. 35
Formulas on Formulas .......................................................................................... 35
Calculate and Testing ............................................................................................ 36
Editing Indicators ...................................................................................................... 36
Where Used ............................................................................................................... 37
Deleting Indicators .................................................................................................... 37
Copying Indicators .................................................................................................... 38
Seasonal Trends ............................................................................................................ 38
Calculating Seasonal Trends ..................................................................................... 39
Default Year Weighting ........................................................................................ 39
Custom Year Weighting ....................................................................................... 39
Calculating ............................................................................................................ 39
Manually Editing Seasonal Trends ........................................................................... 39
Visualization Definitions .................................................................................................. 44
Gauges........................................................................................................................... 44
Gauge Types ............................................................................................................. 44
Creating Gauges ........................................................................................................ 44
Print Gauge Detail..................................................................................................... 51
Where Used ............................................................................................................... 51
Viewing Gauges ........................................................................................................ 52
Editing Gauges .......................................................................................................... 52
Deleting Gauges ........................................................................................................ 53
Data Views ................................................................................................................ 54
Dashboards/Scorecards ................................................................................................. 60
Reports Manager ............................................................................................................... 61
Object Relationships ......................................................................................................... 62
Exporting........................................................................................................................... 68
Importing........................................................................................................................... 72
Testing and Debugging ..................................................................................................... 73
Data Cache .................................................................................................................... 73
Debug Mode.................................................................................................................. 75
Appendix A – Built In Functions ...................................................................................... 77
Special Functions .......................................................................................................... 77
getdata Function ........................................................................................................ 77
numdays Function ..................................................................................................... 78
Page 3
CleverQ® Customization User Manual
prev Function ............................................................................................................ 78
prevY Function ......................................................................................................... 79
Change Function ....................................................................................................... 79
Forecasting Functions ................................................................................................... 79
Forecast Function ...................................................................................................... 79
Trend Function .......................................................................................................... 83
Mavg Function .......................................................................................................... 83
Math Functions ............................................................................................................. 84
abs Function .................................................................................................................. 84
exp Function.............................................................................................................. 84
int Function ............................................................................................................... 84
log Function .............................................................................................................. 84
round Function .......................................................................................................... 84
sgn Function .............................................................................................................. 84
sqr Function .............................................................................................................. 85
Copyright © 2008-2010, CleverQ
Patent Pending
Designed for use with QuickBooks®
QuickBooks® is a trade mark and service mark of Intuit Inc., registered in the United
States and other countries.
Microsoft Excel® and Microsoft Access® are trademarks and service marks of
Microsoft., registered in the United States and other countries.
CleverQ® is a trade mark and service mark of CleverQ and Better Days Enterprises,
LLC.
Page 4
CleverQ® Customization User Manual
Introduction
This document is to be used for the power user who will work with the data, setup
parameters and indicators, and configure gauges. It is required that the user have already
read the Introduction and Setup Manual as well as the General User Manual.
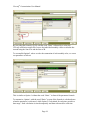
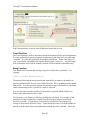
Navigator
All of the actions that can be performed from the pull-down menus can also be accessed
through a very user friendly interface called the “Navigator”. This form is available by
selecting the pull-down menu “Setup – Navigator”. You will then get the following
form.
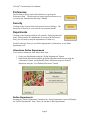
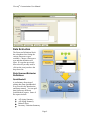
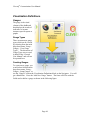
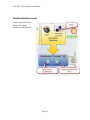
The Navigator not only provides buttons that can be used to open various forms, but it
also contains a diagram that illustrates the flow of data from the “data/reports” on the left
to the “Visualization Processor” and “Report Manager” on the right.
The icons represents different functions and hovering over them will give you a clue as to
what they will do. Clicking on an icon will perform that function or open up a form.
The following sections will describe each of the blocks in the Navigator diagram.
Page 5
CleverQ® Customization User Manual
Preferences
The Preferences block can be clicked directly to open up the
Preferences form. The discussion of setting up the preferences was
covered in the “Introduction and Setup” Manual.
Security
Clicking on the Security block will open the Security Manger. The
discussion of Security is covered in its own separate manual.
Departments
Clicking on the Department block will open the “Setup Departments”
menu. Based on how the departments are setup on the Preferences
form, you will need to setup the departments a certain way.
On the Preferences form you can define departments by Allocations, or not define
department at all.
Allocations Define Departments
If you choose Allocations, then follow these steps.
1. Create your departments using the “Define Departments” button
2. Either define allocations using the predefined department allocations using the
“Allocations” button, and optionally define allocations using user defined
allocations using the “User Defined Allocations” button.
Define Departments
Pressing the “Define Departments” button on the “Setup Departments” menu will display
the “Define Departments” form. Here you can add or delete departments.
Page 6
CleverQ® Customization User Manual
Allocations
Pressing the “Allocations” button on the “Setup Departments” menu will display the
“Department Allocations” form. Here you enter values from company financial reports
that represent the contributions from various departments.
Page 7
CleverQ® Customization User Manual
The blue numbers on the form are calculated and are available as parameters for
calculation of indicators. If gauges are setup for departments, then the “Avg % Alloc”
factor is used to calculate the value for the gauge.
The Column Type dropdown will show you a list of departments.
User Defined Allocations
Pressing the “User Defined Allocations” button on the “Setup Departments” menu will
display the “Department Allocations – User Defined” form. Here you enter values from
company financial reports that represent the contributions from various departments.
The percentages are available to be used as a source of data for parameter definition.
Page 8
CleverQ® Customization User Manual
Data Extraction
The Extractor Definitions block
has a dropdown box listing the
various data source types
available. Choose a data source
type and that definition will
open. If a type has previously
been selected you only need to
click on the icon just above the
drop down list.
Data Sources/Extractor
Definitions
QuickBooks®
A preliminary discussion of
getting data from QuickBooks®
was covered in the Introduction
and Setup manual. You can pull
data from many different
QuickBooks® reports. Some of
the reports include:
A/P Aging Summary
A/R Aging Summary
Balance Sheet
Inventory Valuation Summary
Page 9
CleverQ® Customization User Manual
Inventory Stock Status by Item
Payroll Summary
Open Sales Orders by Item
Open Sales Orders by Rep
Open Sales Orders by Item and Rep
Profit & Loss
Profit & Loss Budget Overview
Sales by Item Summary
Sales by Rep Summary
Sales by Item by Rep Summary
Sales by Customer Summary
Time by Name
Refer to the “Extractors Manual for details of how to setup and load data from
QuickBooks®.
Excel Worksheets
Refer to the “Extractors Manual for details of how to setup and load data from Microsoft
Excel. After the data is loaded, the format of the data is similar to QuickBooks® but the
report names are based on what the user has determined.
There is also a second interface that can be used with Excel. This is called the Data
Package eXcel Extractor (DPXE) and using the Data Package interface rather than the
Excel interface.
Database
Refer to the “Extractors Manual for details of how to setup and load data from Microsoft
Access or any ODBC data source. After the data is loaded, the format of the data is
similar to QuickBooks® but the report names are based on what the user has determined.
Data Package
Refer to the “Data Package Creator” Manual for details of how to use the Data Package
Creator to enter data and load it into the CleverQ software. This is also the interface to
use with the Data Package eXcel Extractor (DPXE).
Extracted Data
The extracted data is stored in part of the Data Cache
called “Extracted Data”. You can perform three
functions from the Navigator on this extracted data:
1. View
2. Manual Edit
3. Purge
Page 10
CleverQ® Customization User Manual
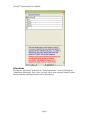
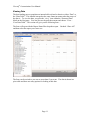
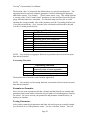
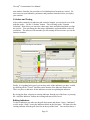
Viewing Data
The data loading process populates an internal table referred to herein as either “Data” or
the “Data Table”. This internal storage has the same format no matter what the source of
the data is. To view the data, you press the “view” icon within the “Extracted Data”
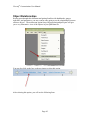
block on the Navigator. You can also use the pull-down menu and choose “View –
View Data Table”. This action will give you the following form….
The form will open with the Report Name filter dropdown open. Uncheck “Show All”
and then select the report you want to see.
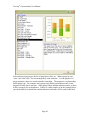
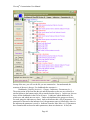
The form can be resized to you can see more data if you want. The data is shown in a
pivot table and there are many options for looking at this data.
Page 11
CleverQ® Customization User Manual
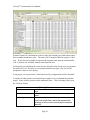
You can filter, sort, rearrange, expand and collapse, group, print, and export the data.
Refer to the section later in this document titled “Viewing Extracted Data Using the
PivotGrid“.
The following figure shows you a typical QuickBooks® report and how the elements of
the report get loaded into the data table.
Page 12
CleverQ® Customization User Manual
Having a good understanding of the structure of the data after it is loaded from the
various data sources is the key to creating the parameters that will be made available.
Normally you would not use this form to view the data, but it is very valuable when you
are creating parameters and indicators so you can check your formulas.
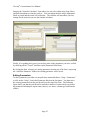
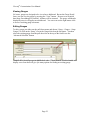
Editing Data
On the Navigator screen, you will find an icon in the Extracted Data block called Manual
Edit. Clicking on this icon will display the following form.
With this form you can enter new data manually, edit existing data, and maintain
templates for entering data. This is the identical form that is part of the Data Package
Creator used to enter data manually separate from the Dashboard software. Refer to the
manual “CleverQ™ - Data Package Creator” available from the Windows Start – All
Programs – CleverQ™ menu.
Purge Extracted Data
At some time, you may want to clear all the extracted data out especially if you have been
testing and developing your visualizations. The Purge icon in the Extracted Data block
on the Navigator can be used for that.
Page 13
CleverQ® Customization User Manual
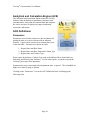
Analytical and Calculation Engine (ACE)
The Analytical and Calculation Engine within the CleverQ
Software takes definitions of parameters, indicators, and
seasonal trends, along with the extracted data and computes
the values necessary to display on gauges, dashboards,
scorecards, and reports.
ACE Definitions
Parameters
Parameters as used in this software are the mechanism for
getting the data so it can be referenced in an indicator
formula. It puts a label or name on an element that exists
in the data table. Parameters are based on either:
1 – Report Name and Row Name
2 – Report Name and Row Name and Column Type
3 – Report Name and Column Type
Some reports do not have a Column Type such as the Balance Sheet, Profit and Loss
Statement, and Sales by Rep Summary. For the other reports, you need to specify the
Column Type as part of the parameter.
Parameters do not get associated with a department, date, or period. This is handled at a
higher level when a gauge is defined.
Clicking on the “Parameters” icon in the ACE Definitions block will bring up the
following form:
Page 14
CleverQ® Customization User Manual
The form is blank initially and you either need to select an existing parameter from the
drop down list on the top of the form, or press the “Add New Parameter” button. The
previous figure shows the form after pressing the “Add New Parameter” button.
Creating Parameters
To create a new parameter, press the “Add New Parameter” button on the “Parameter
Detail” form. You must enter a name for the parameter and then either a reference to a
Report Name – Row Name – Column Type or a formula created from other parameters.
The Parameter Name must have some meaning since it will be referenced in other places
in the software. If you initially leave the Name field blank and select a Report Name,
Row Name, and Column Type, the name field will automatically fill in using the
abbreviation for the Report Name, Row Name, and if selected the Column Type
separated with an “!”. You can use this name or type over it and rename it.
If you want to create a parameter from other parameters rather than from a report source,
then leave the Report Name, Row Name, and Column Type blank and enter your
formula.
Calculation Options
Two options exist on this form which will also affect how the parameter is calculated.
The first is “Null to Zero”. When a parameter is calculated and no value exists usually
because the underlying extracted data is not available, the parameter value is a null or no
value. This is different than saying the calculation returns a zero value which could be a
real result. When a parameter is null, any other parameters or indicators that depend on
Page 15
CleverQ® Customization User Manual
the null parameter will also be null, and any gauges will show a warning usually saying
there is insufficient data to display the gauge. If you check off “Null to Zero”, the null
result is returned as a zero and the dependent objects will calculate and display without
any warnings.
The second option is “No Filters”. There may be filters defined for various elements in
the system and sometimes you might want to calculate a percentage where the numerator
is a filtered value, but the denominator isn’t. If you create an parameter with no filters,
then that parameter could be used as the denominator.
Parameter Formulas
The parameter formula can be as simple or as complex as you want. Formulas are based
on other parameters and are referenced by the parameter name enclosed in brackets “[ ]”.
Formulas can also contain functions. Functions include simple math functions, other
functions, aggregate functions, special functions, and forecasting functions.
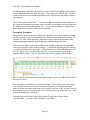
There are some things you need to consider when creating a parameter formula and the
best way to explain it will be with an example. Consider the following Excel worksheet
containing some data in the green cells. There are two rows of data labeled Row A and
Row B. There is one year of monthly data also. Cell N4 contains the sum of all 12
months of Row A data. Cell N5 contains the sum of all 12 months of Row B data.
Row 7 contains a calculation for the individual monthly sum of A and B with the total of
the sums in cell N7.
Row 8 contains a calculation for A/B for each month. This is where it gets interesting.
Cell N8 wants to be the total of the calculation A/B, but do we total each individual
month or do the calculation of the Sum of A divided by the Sum of B? In some cases you
may want to do it one way and in other cases, you may want to do it the other way. Here
is how you handle this in CleverQ....
Assuming the green cells have been loaded into CleverQ with a Report Name =
“Example-Data”. We first create a parameter A as follows:
Page 16
CleverQ® Customization User Manual
Note when we hit the calculate button and select Last Year (2008), the total comes up
that matches cell N4 in the worksheet. Creating a parameter B is similar. You can also
create a parameter to match the cell N7 as shown in the next figure.
To accomplish Option 1, where we take the Sum of A and divide it by the Sum of B (Cell
G12 in the example worksheet) you would create a parameter as follows:
Page 17
CleverQ® Customization User Manual
By preceding the formula [A]/[B] with the word “Ratio” followed by a colon, the
CleverQ calculation engine does not use the individual monthly values to calculate but
instead using the Sum of A and the Sum of B.
To accomplish Option 2, where we take the summation of each monthly value, we create
our parameter as follows:
This is similar to Option 1 without the word “Ratio:” in front of the parameter formula.
To summarize, Option 1 with the word “Ratio:” as part of the formula is calculated once
when the parameter is referenced, while Option 2 is calculated for each time period in a
date range. Each calculation is stored temporarily and then referenced for each time
Page 18
CleverQ® Customization User Manual
period a parameter is referenced. Option 2 actually creates new data to be stored to be
used by other parameters.
Care must be taken when using aggregate functions with parameter formulas. For
example, if you used the formula “[A,Last]/[B,Last]”, you would get the same value as if
you used [A]/[B]. But if you preceded the formula with “Ratio:” like this
You would get the result as shown in cell M8 in the worksheet which is the calculation
for the last month in the date range.
Obviously, it makes sense to test your parameter formulas out and make sure you use the
correct option.
Parameters
If you know the parameter you want to include, you can just type it in. You can also
paste a parameter into a formula by selecting a parameter from a list that is opened when
you press the “...” button. On the form that opens, you first select a Parameter Source,
and then select the parameter. A Parameter Source is either a formula or the report name
the parameter is based on.
Page 19
CleverQ® Customization User Manual
To paste a parameter from the list you can do one of two things after you highlight the
parameter:
1 – Press the “Copy Parameter to Clipboard” and then when you go back to the indicator
detail form and paste it into the formula where you want it.
2 – Press the “Paste Parameter at End of Last Selection” and the parameter will go at the
end of the formula on the indicator detail form.
If you need a parameter you have not create yet, you can create a parameter based on a
report on the fly by pressing the “Add New Parameter” button on the Select Parameter
form. In this case you the Parameter Select form will change it contents and you can
then select a parameter source, row name, and optional column type. Then press either
the “Copy Parameter to Clipboard” or “Paste Parameter at End of Last Selection” buttons
and the new parameter will be available. It will automatically be created so it can be
used again. It will automatically be named with an abbreviation for the parameter
source, followed by a !, then the row name. If a column type is included, another ! is
added and the column type is added. See the following figure for an example. If a user
chooses to create a parameter on the fly and a parameter already exists for the selection, a
new parameter will not be created and the existing parameter name will be used.
Page 20
CleverQ® Customization User Manual
becomes the parameter [SbIS!Total 200-Used Marine!Amount]
Math Functions
You can use the standard math functions:
+
addition
subtraction
*
multiplication
/
division
^
raise to a power
Other Functions
There are a number of functions you can use in the formulas. These are covered in
Appendix A.
Aggregate Functions
For parameters, you have the added feature of including what is called “Aggregate
Functions”. These allow you to specify additional ways of using the parameters. The
Aggregate functions include: Sum, Avg, Min, Max, Stdev, Var, First, Last, and Count.
Page 21
CleverQ® Customization User Manual
The function “Sum” is assumed as the default unless you specify something else. The
aggregate function is placed within the parameter’s brackets following the parameter
name and a comma. For example… [Total Current Assets, Avg] This would calculate
to average of the “Total Current Assets” parameter over the time period specified by the
gauge when the indicator is calculated. So if the data range was last year, it would
calculate the average monthly value of the parameter over the 12 month period last year.
If you did not include the “,Avg”, then the value calculated would instead be the sum
over the 12 month period last year.
Sum
Avg
Min
Max
Stdev
Var
First
Last
Count
Aggregate Functions
Total over time period
Average over time period
Minimum value over time period
Maximum value over time period
Standard Deviation over time period
Variance over time period
Value in first period
Value in last period
Number of values within time period
NOTE: You can only use aggregate functions on parameters that are based on report
data and not formulas.
Forecasting Functions
Forecast
Trend
Mavg
Forecasting Functions
Predicts a value based on history and
seasonal trends or linear regression
Return the seasonal trend fraction
Calculates the moving average
The details of these functions can be found in Appendix A
NOTE: You can only use forecasting functions on parameters that are based on report
data and not formulas.
Formulas on Formulas
Since you can create a parameter that has a formula and that formula can contain other
parameters that in turn can have formulas, the precedence of calculating these formulas
are critical. Be sure to test out your parameters and parameter formulas before you
deploy your solution.
Testing Parameters
After you have named your parameter and either selected a report or created a formula,
you can check to see if the parameter works. Use the “Calculate” button. This will
Page 22
CleverQ® Customization User Manual
bring up the “Formula Calculator” form where you can select a data range, dept, filters,
and period and then see what the result is. You can change the date range, department,
filters or period and the result will recalculate. The software will remember your last
settings for the next time you use the formula calculator.
Finally, if everything looks good, you can keep track of the parameters you have verified
by checking off the “Tested” checkbox on the Parameter Detail form.
By closing the form, selecting an existing parameter from the top of the form, or pressing
the “Add New Parameter” button, the existing parameter will be saved.
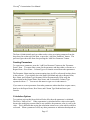
Editing Parameters
To edit a parameter you either use the pull-down menu and choose “Setup – Parameters”
or click on the “Setup” icon in the Parameters block on the Navigator. You then select
the existing parameter from the pull down list on the top of the form. The following
figure shows you that this pull down list includes a number of items to help you choose
the parameter including the report name (Source), row name, column type, and formula
(Other).
Page 23
CleverQ® Customization User Manual
You can limit the list of parameters in the drop down list by selecting a parameter source
first on the top of the form.
After choosing the parameter, it will be displayed on the form. You can edit any aspect
of it. If you rename it and it is used by other parameters or indicators, you will be
warned, and prompted to change the name in those formulas. You can see where a
parameter is used by pressing the “Where Used” button on the bottom of the form.
To undo your edits, press the Esc key.
By closing the form, selecting another existing parameter from the top of the form, or
pressing the “Add New Parameter” button, the changes to the edited parameter will be
saved.
Parameters with Errors
In the Parameter Source dropdown list is a choice “ERRORS”. If any errors exist with a
parameter definition, you will see the parameter name and the source of the error on the
Select Existing Parameter drop down list.
Deleting Parameters
To delete a parameter you either use the pull-down menu and choose “Setup –
Parameters” or click on the “Setup” icon in the Parameters block on the Navigator. You
then select the existing parameter from the pull down list on the top of the form.
Pressing the “Delete Parameter” button will delete the parameter. You will be prompted
to delete the parameter and if it is used by some other object, you will be prompted to be
sure you want to delete all related objects. This can include other parameters that use
this parameter in its formula, any indicators, and any gauges that depend on the
parameter.
Page 24
CleverQ® Customization User Manual
Special Parameters
Key Parameters
A key parameter is defined as a parameter that is used in a key indicator formula. You
can manually set a parameter as a key parameter by checking off the Key Parameter
Checkbox on the Parameter Detail form.
This flag can also automatically be checked from the Relationships form which will be
covered in a later section of this manual.
When security is on, editing of the Key Parameters are limited to those users in the “Key
Ratio Editor”.
NOTE: It is highly recommended that you do not change Key Ratios or Key
Parameters since these have been defined as industry standards and if you use the
Subscription Service, you will be able to compare your data with industry
benchmarks and get advice specific to these indicators.
ROA Parameters
When creating a parameter based on the report “Sales by Item Summary” and you choose
the column type “ROA”, you will be prompted to automatically create a set of parameters
for the selected row name.
Page 25
CleverQ® Customization User Manual
If you select “Yes”, the parameters for Amount, COGS, Asset Value, Margin, Turnover,
ROA, and Days Inventory will be created if they do not already exist. If the data sources
for these parameters are not available, you will also be prompted whether you want to
create the parameters or not. Doing so will produce errors if you do not load the
necessary data. In addition to the “Sales by Item Summary” report, you need the
“Inventory Valuation Summary” report.
The parameters that get created will be listed in the message box.
The parameters “Amount” and “COGS” come directly from the report “Sales by Item
Summary”. The parameter “Asset Value” comes directly from the report “Inventory
Valuation Summary”. The remaining parameters are formulas based on these three
parameters:
Margin = ([Amount]-[COGS])/[Amount]
Turnover = [COGS]/[Asset Value,Avg]/Numdays()*365
ROA = [Turnover]*[Margin]
Days Inventory = [Asset Value,Last]*numdays()/[Amount]
Page 26
CleverQ® Customization User Manual
These four formulas are preceded by “Ratio:” (refer to the previous discussion regarding
parameter formulas, indicators, and whole numbers).
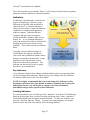
Indicators
An indicator is fundamentally created for the
purpose of displaying a value on a gauge.
Indicators are typically what are known as
“financial ratios” or “financial indicators”.
These ratios are used to evaluate the financial
condition of a company and departments
within a company. Indicators fall into
categories and some typical categories
include: profitablity, liquidity, debt, activity,
market, etc. A very common indicator or
ratio is the current ratio which is calculated by
dividing the current assets by the current
liabilities. These values come from a Balance
Sheet.
Using this software and this example of
Current Ratio, the software will take the
values from the QuickBooks® Balance Sheet
that gets extracted into the data table, assign
parameters to the data and then create a
indicator based on these parameters. The
indicator can then be used to drive a gauge
that show’s up on a dashboard.
Key Indicators
A key indicator is defined as an industry standard indicator and it is recommended that
you do not change these indicators. When security is on, editing of the Key Indicators
are limited to those users in the “Key Ratio Editor”.
NOTE: It is highly recommended that you do not change Key Indicators or Key
Parameters since these have been defined as industry standards and if you use the
Subscription Service, you will be able to compare your data with industry
benchmarks and get advice specific to these indicators.
Creating Indicators
To create an indicator, you will either press the “Indicators” icon on the ACE Definitions
block on the Navigator form, or choose from the pull-down menu “Setup – Indicators”.
The Indicator Detail form will appear and will be blank. To add a new indicator, you
press the “Add New Indicator” button. To choose an existing indicator, use the pull
down list on the top of the form labeled “Select Existing Indicator”.
Page 27
CleverQ® Customization User Manual
The following figure shows this form with the existing indicator “Current Ratio”
selected.
There is a lot of information on this form about the indicator. The absolute minimum
that must be entered is the Indicator Name and the Indicator Formula. Everything else is
optional.
Indicator Name
The name of the indicator should be something that makes sense and would typically be
something that is familiar.
Indicator Formula
The indicator formula can be as simple or as complex as you want. Formulas are based
on parameters and are referenced by the parameter name enclosed in brackets “[ ]”.
Parameters
If you know the parameter you want to include, you can just type it in. You can also
paste a parameter into a formula by selecting a parameter from a list that is opened when
you press the “...” button. On the form that opens, you first select a Parameter Source,
and then select the parameter. A Parameter Source is either a formula or the report name
the parameter is based on.
To paste a parameter from the list you can do one of two things after you highlight the
parameter:
Page 28
CleverQ® Customization User Manual
1 – Press the “Copy Parameter to Clipboard” and then when you go back to the indicator
detail form and paste it into the formula where you want it.
2 – Press the “Paste Parameter at End of Last Selection” and the parameter will go at the
end of the formula on the indicator detail form.
If you need a parameter you have not create yet, you can create a parameter based on a
report on the fly by pressing the “Add New Parameter” button on the Select Parameter
form. In this case you the Parameter Select form will change it contents and you can
then select a parameter source, row name, and optional column type. Then press either
the “Copy Parameter to Clipboard” or “Paste Parameter at End of Last Selection” buttons
and the new parameter will be available. It will automatically be created so it can be
used again. It will automatically be named with an abbreviation for the parameter
source, followed by a !, then the row name. If a column type is included, another ! is
added and the column type is added. If a user chooses to create a parameter on the fly
and a parameter already exists for the selection, a new parameter will not be created and
the existing parameter name will be used.
Math Functions
You can use the standard math functions:
+
addition
subtraction
*
multiplication
/
division
^
raise to a power
Other Functions
There are a number of functions you can use in the formulas. These are covered in
Appendix A.
Aggregate Functions
For indicators, you have the added feature of including what is called “Aggregate
Functions”. These allow you to specify additional ways of using the parameters. The
Aggregate functions include: Sum, Avg, Min, Max, Stdev, Var, First, Last, and Count.
The function “Sum” is assumed as the default unless you specify something else. The
aggregate function is placed within the parameter’s brackets following the parameter
name and a comma. For example… [Total Current Assets, Avg] This would calculate
to average of the “Total Current Assets” parameter over the time period specified by the
gauge when the indicator is calculated. So if the data range was last year, it would
calculate the average monthly value of the parameter over the 12 month period last year.
If you did not include the “,Avg”, then the value calculated would instead be the sum
over the 12 month period last year.
Sum
Indicator Aggregate Functions
Total over time period
Page 29
CleverQ® Customization User Manual
Avg
Min
Max
Stdev
Var
First
Last
Count
Average over time period
Minimum value over time period
Maximum value over time period
Standard Deviation over time period
Variance over time period
Value in first period
Value in last period
Number of values within time period
NOTE: You can only use aggregate functions on parameters that are based on report
data and not formulas.
Page 30
CleverQ® Customization User Manual
Forecasting Functions
Forecast
Trend
Mavg
Forecasting Functions
Predicts a value based on history and
seasonal trends or linear regression
Return the seasonal trend fraction
Calculates the moving average
The details of these functions can be found in Appendix A
NOTE: You can only use forecasting functions on indicators that are based on
parameters that are based on report data and not formulas.
Ranges
Many of the gauges are setup to display different colors and tips depending where the
value falls within a set of ranges. Three ranges are available and for each range there is
a lower and upper threshold. In the example in the next figure, the lowest range is red
and has the range from 0 to 1.1. The middle range is yellow and has the range from 1.1
to 2. The highest range is green and has the range of 2 to 10. Many gauges will display
the works “Out of Range” if a value falls outside these three ranges. When a value falls
within a range that has advice or a tip, that tip will be made available to the user.
The range values can be parameters or formulas as well. Use the “...” button adjacent to
the range value to choose a parameter. All the functions that can be used as well. The
functions are evaluated on the gauge and are sensitive to the date range and department
selected as well.
Range Colors
There are two ways to choose colors. You can actually click on the color itself and you
will then get a color chooser dialog.
Page 31
CleverQ® Customization User Manual
And if that is not enough colors, you can define custom colors and get even more to
choose from.
The other way to choose a color is to use the Color Scheme drop down list just located
below the bottom range advice. With one selection, all three ranges are colored.
Page 32
CleverQ® Customization User Manual
Range Icons
Each of the three ranges can have an icon. These are usually one of the following:
You can assign these to each range and they will show up in various reports within the
program. You can actually have any icon that can be found in the WingDings font
collection. Use the Windows Character Map accessory to copy the icon and then paste it
onto the control on this form. A typical use for the icons is to assign a frown to a range
which is not desirable. Then, with the report manager, you can filter based on this icon.
Range Advice/Tips
For each of the three ranges, you can enter text appropriate for the when a value falls
within that range. Normally the text is simply displayed as you enter it. But, these tips
Page 33
CleverQ® Customization User Manual
or advice can be formatted in HTML to give them more formatting options as well as the
ability to include one or more links to other reference material.
To teach you the basics of HTML is beyond the scope of this manual, so it is
recommended that you either get a book on the subject or visit anyone of the numerous
sources of information on the web.
Since including a link to another website may be a common task, particularly if you want
to direct the user to more information, the format to use is shown here:
<A HREF="xxxxxx">yyyyyy</A>
In place of the xxxxxx’s enter the actual URL address like
http://www.yourdomain.com
In place of the yyyyyy’s enter the text you want to display when the tip is displayed.
This text will be underlined and will be what the user sees on the screen rather than the
actual link. If you want to display the actual link, make yyyyyy the same as xxxxxx.
There are some buttons on the right side of the tips that can make editing the tips easier.
In all cases, select the tip or advise to edit.
Desired Range
You can enter a desired minimum and maximum value for a desired range. The values
can also be a formula.
Benchmark
You can enter a benchmark value for the indicator. This will display on most of the
gauges. You can enter a value or a formula. If you use the aggregate function average
in conjunction with the same parameters used for the indicator formula, you would be
able to see on a gauge how the indicator value compares with the average of all the data.
Page 34
CleverQ® Customization User Manual
Formatting
There are times when you want to format the result of an indicator and have it displayed
on a gauge a certain way. Three options exist for formatting: Units, # Decimals, and
Mult.
The Units can be set for #, %, or $. The # Decimals is set to an integer from 0 to 6. The
Mult can be set to H, K, or M. (H = hundreds, K = thousands, and M = millions).
Without formatting you might see a value on a gauge that looks like 54,234,000.50.
With a format of $, 0, and M, the result would look like $54M which is a lot easier to
read.
Categories
To make it easier to be organized with the indicators, you can assign each indicator to
one or more categories. Use the “Categories” button to open the “Set Categories for
Indicator” dialog box.
There is no limit to the number of categories you can set for an indicator. You can use
the pull down list to choose an existing category or just type in a new category. To
remove a category from an indicator, press the delete button to the right of the category.
Formulas on Formulas
Since you can create an indicator that depends on one or more parameters, and those
parameters could have a formula and that formula can contain other parameters that in
Page 35
CleverQ® Customization User Manual
turn can have formulas, the precedence of calculating these formulas are critical. Be
sure to test out your indicators, parameters and parameter formulas before you deploy
your solution.
Calculate and Testing
After you have named your indicator and created a formula, you can check to see if the
indicator works. Use the “Calculate” button. This will bring up the “Formula
Calculator” form where you can select a data range, dept, and period and then see what
the result is. You can change the date range, department, or period and the result will
recalculate. The software will remember you last settings for the next time you use the
formula calculator.
Finally, if everything looks good, you can keep track of the indicators you have verified
by checking off the “Tested” checkbox on the bottom of the Indicator Detail form.
There is a place to add notes for the indicator to assist in explaining the indicator.
By closing the form, selecting an existing indicator from the top of the form, or pressing
the “Add New Indicator” button, the existing indicator will be saved.
Editing Indicators
To edit an indicator you either use the pull-down menu and choose “Setup – Indicators”
or click on the “Setup” icon in the Indicators block on the Navigator. You then select the
existing indicator from the pull down list on the top of the form. You can also choose a
Page 36
CleverQ® Customization User Manual
category first, before you select an existing indicator. The following figure shows you
that this pull down list organizes the list by category and then indicator sorted
alphabetically in that way. If an indicator belongs to more than one category, it will
show up for each category. If may show up more than once, but it is the same indicator.
If you start typing the indicator name the list will start based on what you type. Press the
F4 key to open up the list if you have not clicked on the down arrow of the control.
After choosing the indicator, it will be displayed on the form. You can edit any aspect of
it. If you rename it and it is used by a gauge, it will be changed automatically in that
gauge definition. By closing the form, selecting another existing indicator from the top of
the form, or pressing the “Add New Indicator” button, the changes to the edited indicator
will be saved.
To undo your edits, press the Esc key.
Where Used
You can see where an indicator is used by pressing the “Where Used” button on the
bottom of the form.
Deleting Indicators
To delete an indicator, select the indicator first by using the drop down list on the top of
the form. Then if the indicator is not used by a gauge, you can delete it by pressing the
“Delete Indicator” button. If it is used, by a gauge, you will need to remove it from the
Page 37
CleverQ® Customization User Manual
gauge first. Use the “Where Used” button to find out what gauges the indicator is used
on.
Copying Indicators
First using the Indicator Detail form, select the indicator you want to copy. Then on the
bottom of the Indicator Detail form is a button labeled “Copy Indicator”. Press this
button and the current indicator will be copied completely and the new name will be the
original indicator name followed by “(Copy)”. You can then edit this indicator and
change the name.
Seasonal Trends
On the Navigator screen, you will find an icon labeled “Seasonal Trends” in
the ACE Definitions block. Clicking on this icon will display the following
form.
With this form you can calculate and store the seasonal trends for any of the data sources
listed. This will include some QuickBooks® reports as well as all the Excel, Database,
and External (Data Package) data sources you have specified.
Page 38
CleverQ® Customization User Manual
Calculating Seasonal Trends
Default Year Weighting
You should have at least 2 prior fiscal years of monthly data for this seasonal trend
function to work properly, but this is not necessary. The standard calculation uses a
weight of 1 for the first year and second year. You can change the weight for each year
independently. Enter a zero if you do not want to use a year. Another common choice is
to have the last fiscal year have more influence than the prior year. In this case, choose
a Year 1 Weight of “1” and a Year 2 Weight of “2”. This will give the second year twice
as much influence as the prior year. You can actually enter any number even though the
dropdowns only give you a choice of 0, 1, or 2. If you want to have different weights for
different data sources, calculate the seasonal trends independently.
Custom Year Weighting
If you want to use a different yearly weight than the default or want to use more than 2
years, you can enter the weights for each data source independently. This is done in the
yellow box labeled “Yearly Weights”. You enter the weights as numeric values for each
year separated by commas. For example, if the current year is 2009 and you want to use
the past 4 years of data to calculate the seasonal trends with more weights on the more
recent years, you could enter “4, 3, 2, 1”. That would give 2008 a weight of 4, 2007 a
weight of 3, 2006 a weight of 2, and 2005 a weight of 1. Essentially 2008 would have 4
times the effect than 2005. You can enter from 1 to 5 years.
Calculating
Check off on the left side of the form the data you want to calculate the seasonal trends
for, then press the “Calculate Seasonal Trends” button. For each selected data source,
you will see a progress bar to show the status of the calculations. This could take quite
some time. Since your prior fiscal years don’t change very often (yearly), you only need
to do this yearly or when you have added a new data source.
The results will be a new report that you can select in the parameters. The reports start
with the words “Seasonal Trend” and are followed by the abbreviation for the data
source. For example, “Seasonal Trend PL” for the Profit & Loss report. The data is
stored as the current fiscal year on a monthly basis but will be accessed for any time
period you specify. The data value is a decimal and if you add all 12 months you will
get a total of “1”. These values are used in the trend and forecast functions covered in
other sections of this manual.
Manually Editing Seasonal Trends
You can view and manually edit the seasonal trends that you calculated by pressing the
“Manual Edit” button. This will display the following form.
Page 39
CleverQ® Customization User Manual
You first must select the Report Name and optionally Department. It is not necessary to
choose a row name or column type at this point, although you can if you want to work
with a smaller list of values. You will also need to make any filter selections. After
making your selections press the “Refresh” button. You will then see a list of values
representing the seasonal trends.
Page 40
CleverQ® Customization User Manual
Seasonal Trends are calculated for each row name and column type within a data source.
Each calendar month has a value. The total of all 12 months should be equal to 1.00 or
zero. If any data was available to calculate the seasonal trend, then the total should be
1.00. If no data was available, then the total should be zero.
At this point you can change the value for any cell on the form, but be sure you maintain
the total to be 1.00. If you try to save when a total does not equal 1.00, you will be
prompted to cancel or save anyway.
At any point, you can press the Cancel button and any changes made will be discarded.
A number of other options exist on this form to make it easy to maintain the seasonal
trends. Some of these options include additional filters. After selecting a filter, press
the “Refresh” button.
Filtering Options
Total <> 1
List all records where the total does not equal
one
Total <> 0
List all records where the total does not equal
zero
Show High Variances Enter a variance, and show all records where a
least one month has a value that exceeds the
average of all non-zero records by the variance
amount.
Page 41
CleverQ® Customization User Manual
The “Show High Variance” option is useful to find records where values are significantly
different than the current averages. This allows you to focus any corrections you want to
make on specific records that may be out of the ordinary. The current average is shown
in green on the bottom of the form and is the average of all non-zero records for the
selected Report, Dept, and Column type. After clicking on the checkbox, you will be
prompted for a variance. Enter a number and then press the “Refresh” button. In the
example below, a variance of “2” was entered. You can always see the variance value
entered if you hover the mouse over the “Show High Variance” checkbox.
The circled entries above exceed the average for that month by more than the variance
amount entered of “2”.
There are some other useful functions on this form that make it easy to make corrections.
The “F3 Copy” button can be used to copy the 12 values for the currently selected record
to a clipboard. Then choose another record and press the “F4 Paste” button to paste the
values on the clipboard to the selected record. You can also use the function keys “F3”
and “F4” respectively to accomplish the same functionality.
The “Copy Current Avg to Zero Records” button will take the current average values
displayed in green on the bottom of the form and fill in all zero records. This is useful to
give the records which did not have any history when the seasonal trends were calculated
and set the trend to the averages of all the non-zero records.
The “Copy Current Avg to Displayed Records” is another handy way to fix records. If
you use the previous figure as an example where the records displayed all have a high
Page 42
CleverQ® Customization User Manual
variance. By pressing this button, they can all be fixed in one step again using the current
averages.
You can continue to make changes to other reports and other departments before saving
with the “Save” button. The Save button will save all changes made since the form was
first opened. Pressing the “Cancel” button will lose all changes made since the form was
first opened.
NOTE: If a trend is referenced for a parameter where seasonal trends where not
calculated, the trend value for that parameter will be computed on the fly.
Page 43
CleverQ® Customization User Manual
Visualization Definitions
Gauges
The gauge is the visual
element of the dashboard
that displays the results of
indicators or in some
instances special reports or
graphs.
Gauge Types
There are numerous gauge
types which can be viewed
by selecting from the main
drop down menu “Setup –
Gauges – View Gauge
Types”. The discussion of
Gauge Types was covered
in detail in the “General
User Manual” and will not
be repeated here.
Creating Gauges
To create a new gauge, you
would select from the main
drop down menu “Setup Gauges – Setup Gauges” or
use the “Gauges” icon on the Visualization Definitions block on the Navigator. You will
get a blank form. Press the “Add New Gauge” button. The form will fill in with the
fields used to define a gauge as shown in the following figure.
Page 44
CleverQ® Customization User Manual
The required fields that must be filled in include the Gauge Name, Gauge Type, and any
Gauge Properties.
The Gauge Name can be anything you want. Choosing a gauge type is done by using the
drop down list or pressing the “Select Gauge Type” button. That will bring up a form
that will allow you to choose interactively the type.
Page 45
CleverQ® Customization User Manual
After selecting a gauge type, the list of properties will be set. When a property says
“ratio”, the word “ratio” is used synonymously with “Indicator”. For the purposes of
gauge properties, these two words mean the same thing. The properties vary depending
on the gauge type. For example, some gauges only display one indicator/ratio, so the
property list only shows one item. Other gauges show multiple indicators/ratios, so there
will be a property for each indicator. If there is a label property as in the example below,
you can actually leave that blank, and the indicator/ratio name will be used for the label.
Page 46
CleverQ® Customization User Manual
If the property is a ratio/indicator, you can use the drop down list to the right of the
property name to select a ratio/indicator. For labels and some other properties, the pull
down list will be blank. If the property is a ratio/indicator, there is a small button with a
magnifying glass all the way to the right. Press this button to bring up the Indicator
Detail form to see the information associated with the indicator. You can actually edit
the indicator from here as well.
If the property is “Contents”, as is the case with the “Data Query” gauge, you can use an
existing data view or create a new data view to be used for that gauge. If you have not
selected an existing data view, pressing the
button will open the form to allow you to
add a new data view.
Page 47
CleverQ® Customization User Manual
Refer to the section Data Views for information about creating or editing the User Data
Views. System Data Views cannot be edited.
If the property is “Data Drilldown”, as is the case with the most single indicator, nonchart gauges, you can optionally use a Data View drilldown rather than the default line
chart drilldown. The advantage to this option is you could drilldown not only to the
underlining data behind a gauge, but you could open up an external program and view a
data record which was used as part of the data source. You can use an existing data view
or create a new data view for the data drilldown. If you have not selected an existing
data view, pressing the
button will open the form to allow you to add a new data view.
Page 48
CleverQ® Customization User Manual
Refer to the section Data Views for information about creating or editing the User Data
Views. System Data Views cannot be edited.
The Initial Date Range should be set but is optional. If you do not set this date range and
the dashboard the gauge is used on does not have a data range, then all the data will be
used to calculate the result. The Initial Date Range is used when the dashboard does not
have a date range. But, you can lock the data range by checking off “Lock Date Range”.
In this case, the gauge will always have this data range, independent of what data range
the dashboard is set to.
Gauges will pull data either from Monthly, Daily, Annual, Quarterly, Weekly, or Current
Data. After you select an Initial Date Range, the appropriate data type will be chosen.
You can override this if you want. You can also select “Auto”. In this case the program
will adjust the data type based on the selected range automatically. For auto mode, the
selection of monthly or daily is done based on the same lookup list that automatically sets
Monthly and Daily. If a custom date range is selected, then the preference for how many
days of QuickBooks® Daily Data is loaded determines if daily or monthly data is used.
Based on the data type, the date used in retrieving a value is as shown in the following
table:
Annually
Data Types and Dates Used
Last day of last month of fiscal year
Page 49
CleverQ® Customization User Manual
Quarterly
Monthly
Weekly
Daily
Current or Latest
Last day of last month of fiscal quarter
Last day of month
Saturday
Last date data loaded
You can also add notes about this gauge for reference in the field on the right side of the
form.
In addition to the standard drilldowns provided which include standard, previous period,
ranges, and details, you can add your own custom drilldowns using the “Additional
Drilldowns” tab.
There is no limit to the number of additional drilldowns and you can drilldown to a
dashboard, gauge, report, file, or webpage. This provides tremendous capabilities to
have a master dashboard, with each gauge summarizing something, and then being able
to drilldown to another dashboard. This process could be nested without limitations.
Saving your new gauge is either done by pressing the “Close” button or choosing an
existing gauge from the top drop down list.
Page 50
CleverQ® Customization User Manual
Print Gauge Detail
There is a printable report available for each gauge. To get this report, you must select
an existing gauge from the pull down menu on the Gauge Detail form. Then press the
“Print” button on the bottom of the form. This will give you a report similar to the
following. It includes a graphical view of the gauge, all the information about the gauge
and also all the information about the indicator(s) used by the gauge. The text is blue
represents calculated values based on the default settings for the gauge.
Where Used
You can determine where a gauge is used, by pressing the “Where Used” button on the
bottom of the Gauge Detail form. A popup message box will be displayed listing the
dashboards where the gauge is used. “Dashboard 0” entries are for saved dashboards not
currently set to be displayed.
Page 51
CleverQ® Customization User Manual
Viewing Gauges
Of course, gauges are designed to be viewed on a dashboard. But on the Gauge Detail
form, you can view the gauge by pressing the “View” button. Be sure to set an initial
date range first although if you don’t, all dates will be assumed. The gauge will then be
displayed just as it will appear on a dashboard. You can even use the right-mouse click
to access a working gauge sub-menu.
Editing Gauges
To edit a gauge you either use the pull-down menu and choose “Setup – Gauges – Setup
Gauges” or click on the “Setup” icon in the Gauges block on the Navigator. You then
select the existing gauge from the pull down list on the top of the form or use the
“Advanced Selection” button.
The pull down lists all gauges in alphabetical order. The Advanced Selection button will
display a new form that will give you many options for finding an existing gauge.
Page 52
CleverQ® Customization User Manual
You can edit any aspect of the gauge and if you rename it, the change will automatically
be applied to any dashboards using that gauge.
Saving your edited data is either done by pressing the “Close” button or choosing another
gauge from the top drop down list.
Deleting Gauges
To delete a gauge you either use the pull-down menu and choose “Setup – Gauges –
Setup Gauges” or click on the “Setup” icon in the Gauges block on the Navigator. You
then select the existing gauge from the pull down list on the top of the form you want to
delete. Then press the “Delete Gauge” button. If the gauge is used on a dashboard you
will not be able to delete it. You must remove if from all dashboards before you can
delete it. Use the “Where Used” button to locate the dashboards that reference the
gauge.
Page 53
CleverQ® Customization User Manual
Data Views
Data Views is a mechanism to primarily display textual data either on a gauge or as part
of a drilldown from a gauge. The “Data Query” gauge has a property called “Contents”
that will allow you to define and set a data view. The single indicator non-chart gauges
have a property called “Data Drilldown” that provides an optional drilldown from the
standard line chart to view data. In either case, you add or edit a data view by pressing
the
button on the Gauge Detail form.
A blank Data View form is shown in the next figure.
Page 54
CleverQ® Customization User Manual
Data Views are based on pulling data from the report data which is where all data is
stored after it gets loaded from the data sources. The report data is structured with the
following fields that are accessible with data views:
ReportName
RowName
ColumnDate
ColumnType
DataValue
DataType
The fields ColumnDate, and DataType are not part of a data view definition since they
are filtered by the gauge itself.
You must supply a Data View Name to be used when you attach it to a gauge property.
You must also define which Report Name you will be using for the data. After you select
a report, the available row names and column types will be listed on the right of the setup
form. These are for reference only.
Normally a Data View will contain from 1 to 3 columns. The columns are defined on
the setup form with the first column being text and either coming from the row names or
the column types. You would normally enter a heading for column 1 based on the
specific data. The second column is optional and is used to display the date. You must
enter a heading for this to appear. The third column is numeric value and to display this
column you must enter a heading. You can optionally enter a format from the dropdown
list of enter your own using the symbols below.
Symbol
Description
Page 55
CleverQ® Customization User Manual
Symbol
Description
. (period)
Decimal separator. Separators are set by double-clicking Regional
Settings in Windows Control Panel.
, (comma)
Thousand separator.
0
Digit placeholder. Display a digit or 0.
#
Digit placeholder. Display a digit or nothing.
$
Display the literal character "$".
%
Percentage. The value is multiplied by 100 and a percent sign is
appended.
E– or e–
Scientific notation with a minus sign (–) next to negative
exponents and nothing next to positive exponents. This symbol
must be used with other symbols, as in 0.00E–00 or 0.00E00.
E+ or e+
Scientific notation with a minus sign next to negative exponents
and a plus sign (+) next to positive exponents. This symbol must
be used with other symbols, as in 0.00E+00.
The data can be sorted by one of the columns either in ascending or descending order.
Filters can be applied to the DataValue, RowName, and ColumnType fields.
The filter operator can be selected from the appropriate dropdown list, and for data values
you might want to filter for positive, negative, zero, or nonzero values or some other
criteria. Leaving the filter operator and filter box blank will cause no filtering to occur.
Filtering for RowName or ColumnType includes selecting a filter operator and one or
more appropriate entries. Each entry must be enclosed by single quotes and if you use
the operator “In List”, each entry in the list must be enclosed by single quotes and then
each entry separated by commas. To make it easy, double clicking on either the
reference list for row names or column types will copy that entry into the appropriate
filter box.
Page 56
CleverQ® Customization User Manual
And finally there is one last option that would provide the ability to show all fields for the
data drilldown.
You can preview the data using the “Preview Data” button on the bottom of the form
which will cause the result of the data view to show up on a new form in a list format.
By selecting a single record, and pressing the “View Details” button, you can drilldown
into another program to see that specific data. This requires a custom program to be
Page 57
CleverQ® Customization User Manual
written and installed to make that interface link work. If that has not been setup you will
get a popup message like that shown in the following figure.
You have the option of changing the view from a list view to a pivot table. In this case
you will need to drop the fields into the row, column, detail, or filter drop areas.
Page 58
CleverQ® Customization User Manual
You can also Preview, Print or Export the data to Excel.
Page 59
CleverQ® Customization User Manual
Dashboards/Scorecards
Refer to the General User
Manual for a detail
discussion of Dashboards.
Page 60
CleverQ® Customization User Manual
Reports Manager
The discussion of the Report Manager is covered in the General User Manual and Report
Manager User Manual.
Page 61
CleverQ® Customization User Manual
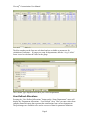
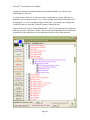
Object Relationships
Having gone through this document and getting familiar with dashboards, gauges,
indicators, and parameters, you may want at some point to see the relationships between
all these objects. The main menu option Setup-Object Relationships/Export will give
you a very informative view of the objects in your QBD data file.
You can also click on the box on the navigator to select this option.
After selecting this option, you will see the following form.
Page 62
CleverQ® Customization User Manual
This form is blank when it is opened but you can make quite a few different selections to
see a tree or outline view of the object from different perspectives.
The buttons on the left with colored labels represent objects and is used to build the tree.
The tree is actually upside down, and these buttons determine the root of the tree. For
example, if you press the “Dashboards” button, wait several seconds to several minutes
for the tree to be built, then press the “Expand All” button you will see something similar
to the following...
Page 63
CleverQ® Customization User Manual
On top of the tree, you will see the file you are connected to. Just underneath, the
structure of the tree is shown. For dashboards the structure is....
Dashboards {UserID} (Active #) – Gauges – Indicators – Parameters (in ...)
The main section of the form has the tree and the branches on the tree are colored in a
similar fashion to the buttons on the left to match what the object is. In this case, the tree
shows all the dashboards in the file for all users. It indicates which dashboard is for
which user, and which ones are active. Under each dashboard, the gauges are shown.
For each gauge the indicators are listed. And each indicator has a list of parameters. For
parameters referenced at the indicator level, the parameter name is followed by where in
the indicator the parameter is used (i.e. Indicator Formula, Max, Min, etc). If parameters
have formulas that are based on other parameters, those are shown too. In fact, the
Page 64
CleverQ® Customization User Manual
nesting of parameters and their formulas are not limited and the tree will show the
relationships to all levels.
A unique feature of the tree is when you select a branch that is a gauge, indicator, or
parameter, you can then press the “View” button and the detail form for that object will
be displayed. You can even edit the object at this point. If you make any changes that
could affect the tree, press the “Refresh” button to rebuild the tree.
Objects at the root level are listed alphabetically. So if you are interested in a particular
indicator, press the “Indicators” button, and you will get an alphabetical list of indicators.
Expand any of the indicators to see the parameters that are used by that indicator.
Page 65
CleverQ® Customization User Manual
If you choose Key Indicators, only indicators marked as a key indicator will be displayed.
This also provides a way to see those parameters that are used by Key Indicators. A
special button is enabled in this mode labeled “Set Key Parameters”. Pressing this
button will flag all selected parameters as Key Parameters. Refer to the earlier sections
on Key Indicators and Key Parameters for more information about them.
Now let’s say you want to turn the tree around and instead of seeing the parameters that
are used by the indicator, you want to see the gauges and dashboards that use the
indicator. Press the “Bottom Up” button and click on “Indicators”.
Page 66
CleverQ® Customization User Manual
In this view, you see the indicators in red and if you expand an indicator, the gauges that
use that indicator are shown as well as the dashboards that use those gauges.
Page 67
CleverQ® Customization User Manual
Exporting
Exporting of parameters, indicators, and gauges to another QBD file is available from the
same form that displays the object relationships discussed in the previous section. Some
additional buttons are available to facilitate the export process.
Note: The export process will only work in the “Top Down” mode.
You have the option to show the other QBD file and its objects prior to exporting if you
want to. If you do, press the “Show Other QBD File” button. If not, simply display the
objects in this file any way you want to. For example, if you want to export all objects
associated with a dashboard, view the relationships for dashboards and then check off the
dashboard you want to export. Checking off a parent object, will automatically check off
all children or objects beneath it. You can then manual uncheck any objects you don’t
want to export.
Page 68
CleverQ® Customization User Manual
If you want to see the objects in another file at the same time, press the “Show Other
QBD File” button. Select the file you want. Then a second window will appear just like
the first, but without some of the buttons.
Page 69
CleverQ® Customization User Manual
After you have checked off the objects you want to export. Press the “Export” button.
Even though you may have checked off dashboards, they will not be exported. Only
gauges, indicators, and parameters are exported. If an object by the same name already
exists, you will be prompted to overwrite it. You may see this message as soon as you
export if the same object is checked more than once on the tree. This is because you
have already exported it.
When a message appears similar to this one....
Press Yes to overwrite it, No to not export it, or Cancel to cancel the rest of the export
process.
If you say Yes, you will also be prompted to overwrite all parameters....
Select Yes to not be prompted anymore. Press No to be asked for each parameter.
You will see similar prompts for indicators and gauges.
Page 70
CleverQ® Customization User Manual
At the end of the export, you will get a message that the export is complete.
Page 71
CleverQ® Customization User Manual
Importing
The process of importing objects is simpler. To import you select the “Import Object”
selection on the Setup menu.
You can also click on the Import box on the Navigator to start the Import process.
You will then be prompted for a QBD file to import from. Select the file and all gauges,
indicators, and parameters will be imported. If an object with the same name exists, the
object will be imported and a number will be appended to it. After the import, you will
see a message saying the import is complete and it will list the number of each type of
object imported.
Page 72
CleverQ® Customization User Manual
Testing and Debugging
As part of the process of creating dashboards and scorecards and defining parameters,
indicators, and gauges, you must spend time testing what you have done. In fact, this
process is no different than designing software, except instead of working with a
computer programming language, you are instead working with higher level objects.
Issues can be the result of definition, formula, or data errors. To assist in debugging
errors or just performing validation, some features of the CleverQ software make this
process a bit easier. Aside from the obvious functionality in the software where you can
view results on a gauge, dashboard, scorecard, the Calculate button found on the
parameter and indicator forms can be useful. There are also two other areas/functions
that can be used for error checking: the Cache and Debug mode.
Data Cache
The Data Cache consists of three parts:
Extracted Data
Formulas
Calculated Data
The Extracted Data part has been previously covered in an earlier section.
The Formulas part of the Data Cache is a repository of all the formulas used for the
visualizations. Since so many calculations can occur, and to maintain good performance,
the results of the calculations are stored so they are quickly available when needed.
Whenever a calculation is required by the VP, the Cache is checked first to see if the
Page 73
CleverQ® Customization User Manual
result has already been calculated. If it has, then the stored result is used. If not, then the
ACE will make the calculation and the result stored in the cache and also sent to the VP.
So formulas required can be determined on the fly when a gauge is to be displayed, or
you can actually scan all dashboards and gauges, and determine the formulas needed
along with conditions for the formula. The conditions include: Date Range,
Department, Filters, and Data Type. To scan and save the formulas ahead of time, press
the “Populate” icon on the Formulas block on the Navigator. Occasionally you will want
to clear all the formulas especially if you have made changes to the ACE Definitions and
Visualization Definitions. To clear the formulas, press the “Clear” icon in the Formulas
block on the Navigator.
To view the formulas, as well as any results if they have been pre-calculated, press the
“View” icon on the “Calculated Data” block on the Navigator. The cache can also be
viewed by going to the menu item Help – About, and then choosing “System
Information”. Pressing this button will display the cache contents which include
Formula, Date Range, Filters, Data Type, Value, Time Stamp, and Execution Time
(seconds).
You can force a calculation of all the formulas not already calculated in the Data Cache
by pressing the “Recalc” icon in the “Calculated Data” block on the Navigator. This
action can take a long time depending on the number of formula entries, so the user can
set a time limit on the calculations.
It should be noted that whenever data is extracted, or ACE definitions are changed, the
formula results are purged in the Calculated Data. You can manually force a purge of the
Page 74
CleverQ® Customization User Manual
calculated results by pressing the “Purge” icon in the “Calculated Data” block on the
Navigator.
Viewing the cache may be useful for troubleshooting the calculations.
Debug Mode
Seeing even more detail than the Cache is available in the “Debug Mode”. On the
System Information screen, there is a checkbox labeled “Debug Mode”. To start the
debug mode, click on this checkbox. This causes the Cache and Error tables to be
cleared. Now, do something that will require calculations like displaying a gauge or
dashboard, etc. After that action is complete, come back to the “System Information”
form and click on the label “Debug Mode” (leave the checkbox as is). You will now see
a table containing the following: GaugeName, Parameter, Formula, DataRange,
DataType, Value, ErrorDescription, and DeptName.
Several entries may exist for one formula, since in the debug mode, each parameter in the
formula is displayed on a separate row so you can see how the calculation occurred for
each element of the formula. The column formula contains two parts separated by a
vertical line “|”. The first part is the formula and the second part is are the values plugged
into the formula. The result is shown in the Value column.
To stop the “Debug Mode”, remove the check in the checkbox by clicking. “Debug
Mode” will stay in effect until you close the program also. It is reset whenever the
Page 75
CleverQ® Customization User Manual
program first starts up. There is additional overhead when using this mode so
calculations will take a little longer.
Page 76
CleverQ® Customization User Manual
Appendix A – Built In Functions
Functions are predefined formulas that use arguments to calculate simple or complex
values.
Functions have a name followed by parenthesis. The arguments used in the functions are
enclosed in parenthesis separated by commas if there is more than one. For example:
round(123.456,1)
Functions can also be nested. In this case the result of one function is used as an
argument for another function.
round(abs(123.456),1)
Functions can be broken up into categories. These categories include the following:
Special Functions
Math Functions
Logical Functions
Financial Functions
There are other functions available but were chosen not be included here since they most
likely would not apply to a business application like this.
Note: Information about some of these functions come from the Microsoft Developer
Network (MSDN) and documentation for Visual Basic for Applications. You may want to
refer to these sources for additional information and examples.
Special Functions
getdata Function
This function will return the value from the data table just like you specified a parameter
but without manually creating the parameter.
GetData(ReportName,RowName,ColumnType)
For example: GetData(“Profit & Loss”,”Gross Profit”)
Required for this function are ReportName and RowName. You must enclose the items
with double quotes.
The function can also include a function and operands just like you would specify with a
parameter name.
Page 77
CleverQ® Customization User Manual
GetData(ReportName,RowName,ColumnType,Funct,Operand1,Operand2)
For example:
GetData(“Profit & Loss”,”Gross Profit”,””,”Forecast”,”T”,”12”)
Note there is a place holder for ColumnType with double quotes.
The function will actually create a new parameter based on this function if it previously
did not exist. The notes section for the parameter will indicate that is was automatically
created and when.
numdays Function
This function will return the number of days for the current indicator or parameter being
calculated.
numdays()
prev Function
The “Prev” function will return the value for the previous period based on the data type
and is used in conjunction with any of the aggregate functions. The word “Prev” can be
place before or after the aggregate function and can have spaces or not. Some examples
are shown below. The Aggregate functions include: Sum, Avg, Min, Max, Stdev, Var,
First, Last, and Count. The function “Sum” is assumed as the default unless you specify
something else.
Assume the formula, [Total Current Assets] is used for an indicator. This formula would
calculate to sum of the “Total Current Assets” parameter over the time period specified.
Assume we have the date range of “Last Month” and the current month is May. It would
return the value for April.
Now add “prev” to the formula: [Total Current Assets, prev]. This formula would
calculate to sum of the “Total Current Assets” parameter over the previous time period
specified. Assume we have the date range of “Last Month” and the current month is
May. It would return the value for the month previous to Last Month or in this case
March.
Here is another example:
[Total Current Assets, Last] with a date range of Last Year, for annual data, and the
current year is 2010, and the fiscal year begins in January. This would return the value
for the last month of last year or December 2009. Add the word “prev” to the formula
like this: [Total Current Assets, Last Prev] or [Total Current Assets, Prev Last], and the
value returned is for December 2008. If the data type was monthly, the value returned
would be November 2009.
If no previous value is available, the value returned is null or zero.
Page 78
CleverQ® Customization User Manual
prevY Function
The “PrevY” function works similar to the “Prev” function except it ignores the data type
and always goes to the previous year.
Change Function
If you create a formula, [Total Current Assets]- [Total Current Assets, prev], the result
would be the difference between the current time period and the previous time period.
You can specify this formula easier by using the “change” function. For this example,
the new formula would simply be [Total Current Assets, change]. If no previous value is
available, the current value is returned.
Forecasting Functions
The forecasting functions have a different format than the other functions and are similar
to the aggregate function format. These functions are used within the [] brackets that
define a parameter. The function is placed within the parameter’s brackets following the
parameter name and a comma. For example… [Total Current Assets,Forecast]. There
may also be additional operators after the function name separated by commas.
Forecast Function
The forecast function is used to calculate or predict a value for a specific parameter using
regression or curve fitting formulas. The function can be used in conjunction with the
seasonal trend values previously calculated for the parameter. The function is based on
one of four types of equations:
Forecast Function Regression Formulas
Linear
y = mx + b
Power Curve
y = cx
Exponential Curve
y = fe
y = h ln(x) + j
Logarithmic Curve
d
gx
Which of these methods is determined by the operand following the function name. The
following examples shows you would use the function for the parameter “Gross Profit”:
[Gross
[Gross
[Gross
[Gross
Profit,Forecast,L] for Linear
Profit,Forecast,P] for Power Curve
Profit,Forecast,E] for Exponential Curve
Profit,Forecast,LN] for Logarithmic Curve
If you enter a “B” as the operand, the Dashboard software will find the “Best fit” and will
automatically decide which of the 4 formulas to use. This is done by doing the calculation
for all four methods and then using the highest of the R-squared values for to determine
the best fit. The mathematics of this function is beyond the scope of this user manual, but
Page 79
CleverQ® Customization User Manual
you can learn more about this from various sources including Microsoft Excel Help. This
function is identical to adding trendlines to a chart or using the Microsoft functions
Trend, Forecast, Slope, Intercept, and RSQ.
[Gross Profit,Forecast,B] for Best Fit
or
[Gross Profit,Forecast] for Best Fit
If the “L”, “P”, “E”, “LN”, or “B” is omitted, the forecast function will default to “B”.
To also factor in the seasonal trend with the forecast, you would precede the “L”, “P”,
“E”, “LN”, or “B” with the letter “T”. For example...
[Gross Profit,Forecast,TL] for Seasonal Trend with Linear
[Gross Profit,Forecast,TE] for Seasonal Trend with Exponential
[Gross Profit,Forecast,TP] for Seasonal Trend with Power Curve
[Gross Profit,Forecast,TLN] for Seasonal Trend with Logarithmic
[Gross Profit,Forecast,TB] for Seasonal Trend with Best fit
Forecasts have to depend on history and you specify the number of months of history
starting with the prior month from the current date by entering another operand with the
forecast function. You can enter any number of months. For example....
[Gross Profit,Forecast,L,6] will calculate a linear trend using the last 6
months of actual data
[Gross Profit,Forecast,TB,12] will calculate a best fit seasonal trend
forecast using the last 12 months of actual data.
Page 80
CleverQ® Customization User Manual
If the number of months of history is left blank, then the value can be specified in one of
the gauges that is commonly used to display forecasts. That gauge is the “Line Chart – 2
Lines”. A property called “# Months History for Forecasts” is available and you can
enter a number here. This is only used if a underlying formula used in the gauge has a
forecast function without the number of months of history specified.
Here is an example....
The previous figure shows the special gauge with the property that allows the number of
Page 81
CleverQ™ Customization Manual
months to be used. It references a indicator using the forecast function, but leaving out
the number of months of history following the TB operand. Note: Using the gauge
property “Specifying the # Months History for Forecasts” is only available for this one
gauge and will have slower performance than including the extra operand with the
function. (The calculated values cache is cleared when this property is used). The next
figure shows the standard drilldown for the gauge as defined in the previous figure. It
uses the other special properties for the 2-line gauge which displays additional periods of
data in the past and future.
One further option exists with the number of months of history. If neither the formula
has the value, nor the gauge does not contain the value, then the system wide preference
value is used as entered on the preferences form.
Page 82
CleverQ™ Customization Manual
And if that preference is not set, then all historical actual data is used.
Trend Function
The Trend function is used to return the seasonal trend amount for the selected parameter.
It is only applicable for parameters based on data sources that have had a seasonal trend
calculated. It is also only applicable for monthly calculations. When a date range of 1
year is used for the calculation, this function should return a value of 1. Any date range
will work and the sum of all the monthly fractions will be returned for that data range.
Mavg Function
This function will calculate the moving average for an indicator or parameter. For
example…
[Total Current Assets,mavg,3]
The number following the mavg function and separated by a comma is the number of
previous periods that the average value will be based on. This is in addition to the current
time period. So in the previous example, the moving average will actually be calculated
on the current and previous 3 periods or a total of 4 periods.
You can also enter a negative number for the number of periods which will then use
future values rather than previous values.
The function is very sensitive to the time period being calculated. For example, if the
parameter is being calculated for a month, then the moving average is based on the
previous X months. If a parameter is calculated on a daily basis, then the moving
average is based on the previous X days. Some inaccuracies may exist if the number of
periods is small and the time period spans non-working days like weekends. But if the
Page 83
CleverQ™ Customization Manual
calculated date range is a week, then the previous X weeks will be used. Date ranges can
be anything. For example, you could be working with a 15 day period. Then the
moving average will be based on 45 days if you enter 2. 2 + the current period is 3
periods and a period is 15 days, so 3 * 15 is 45 days.
Math Functions
abs Function
The absolute value function simply removes the sign from a number always returning a
positive value.
abs(159.2) = 159.2
abs(-159.2) = 159.2
exp Function
The exponential function returns a value specifying e (the base of natural logarithms)
raised to a power.
exp(5) = 148.41
int Function
This function returns the integer portion of a number.
int(123.456) = 123
log Function
This function returns the natural logarithm of a number.
log(2) = 0.69
You can calculate base-n logarithms for any number x by dividing the natural logarithm
of x by the natural logarithm of n as follows:
log(x) / log(n)
round Function
This function returns a value rounded to the specified number of decimal places.
round(123.456,1)
sgn Function
This function returns a value indicating the sign of a number
sgn(-22) = -1
Page 84
CleverQ™ Customization Manual
Argument
Returns
Greater than
zero
1
Equal to zero
0
Less than zero
-1
sqr Function
This function returns the square root of a number.
sqr(4) = 2
Page 85