1
Homogeneity testing of climate data and homogenization for RClimDex
homogenization for RClimDex
Markus Donat
Climate Change Research Centre
University of New South Wales
f
Sydney, Australia
Homogeneity Testing / Homogenisation
Background:
The aim of climate data homogenisation is to adjust observations, if necessary, so that all variations in the data series are caused by real changes in the climate, and not due to changes in the way the data have been recorded.
td t h
i th
th d t h
b
d d
Aim:
To test data series for homogeneity
To test data series for homogeneity.
This procedure will involve testing daily/monthly temperature data series without the use of a homogeneous reference series, the most common scenario for
the use of a homogeneous reference series, the most common scenario for stations in the North African/Arab region. Instructions for homogeneity testing with a reference series can be found in the RHtest User Manual.
Homogeneity Testing / Homogenisation
Software:
Daily/monthly temperature data is homogenised with “RHtestV3”. This is an R
application written by Xiaolan Wang and Yang Feng (Environment Canada). It i l d f
includes functions to detect potential discontinuities in a candidate (or base) i
d
i l di
i ii i
did
( b )
climate series. The software is available at http://cccma.seos.uvic.ca/ETCCDMI/software.shtml.
Metadata:
If available completed station history sheets will assist in assessing whether any
If available, completed station history sheets will assist in assessing whether any of the detected breakpoints could be due to changes in the way the data have been measured.
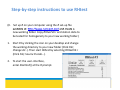
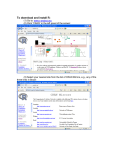
Step‐by‐step instructions to use RHtest
(0. Set up R on your computer using the R set‐up file available at http //www r project org/ and create a available at: http://www.r‐project.org/
and create a
new working folder. Copy RHtestV3.r and station data to be tested for homogeneity to your new working folder.)
1.
Start R by clicking the icon on your desktop and change the working directory to your new folder (Click File; Change dir..). Then start RHtest
g
)
by selecting RHtestV3.r
y
g
(Click File; Source R code…).
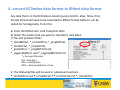
2.
To start the user‐interface, enter StartGUI() at the R prompt. 4. convert RClimdex data format to RHtest data format
Any data that is in the RClimdex 6‐column (years,months, days, Tmax, Tmin, Any
data that is in the RClimdex 6‐column (years months days Tmax Tmin
Precip) format will need to be converted to RHtest format before it can be tested for homogeneity. To do this:
a) From the RHTest GUI, click Transform Data b) Select the station that you want to transform, click Open.
c) This will produce 9 files ‐
*_tmaxMLY.txt, *_tminMLY.txt, *_prcpMLY.txt, *_tminDLY.txt, *_tmaxDLY.txt, *_prcpDLY.txt, *_prcpMLY1mm.txt, *_LogprcpMLY.txt, and *_LogprcpMLY1mm.txt
* = the input file name DLY – daily data
MLY = monthly data
MLY monthly data
MLY1 = daily precipitation ≥ 1mm
d. The following files will be used in subsequent sections ‐
*
*_tminMLY.txt and *_tmaxMLY.txt / *_tminDLY.txt and *_tmaxDLY.txt
*
/*
*
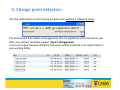
5. Change point detection
click the FindU button to start testing the data series without a reference series. The function will then detect all changepoints that are significant at the 5% level in your data, even without metadata support (Type‐1 changepoints). A series of output files describing the test results will be produced in an output folder in your working folder:
5. Change point detection
The <filename>_U.pdf file shows the tested data series with identified breakpoints overlaid
f
_ p f
p
The <filename>_1Cs.txt file lists all changepoints that are significant at the 5% level even without metadata support (Type‐1 changepoints)
without metadata support (Type‐1 changepoints). 6. Edit change point file for known changes
add (using Notepad) any known changepoints to the <filename>_mCs.txt
dd ( i N t d)
k
h
i t t th <fil
> C t t file by fil b
considering station history (metadata) information. (“type‐0 changepoints”: changepoints that can only be significant if supported by metadata).
In this example, metadata records for Nadi are relatively complete and it is known that the station underwent site moves in: June 1965, May 1971, December 1985 and April 1998.
‐> edited <filename>_mCs.txt file:
7 changepoints in Series /
/srv/ccrc/data05/z3401061/Pacific/emacs/RHTest/nadi_tmax.txt /
/d t 05/ 3401061/P ifi /
/RHT t/ di t
t t 0 Yes 19650601 (1.0000‐1.0000) 0.950 32.2282 ( 28.0852‐
0 Yes 19710501 (1.0000‐1.0000) 0.950 54.9394 ( 36.2768‐
0 Yes 19851201 (1.0000‐1.0000) 0.950 63.8630 ( 33.8336‐
0 Yes
19980401
1 Yes 20090106 (1.0000‐1.0000) 0.950 82.2340 ( 35.7255‐
1 Yes 20100112 (1.0000‐1.0000) 0.950 261.0596 ( 28.7500‐
1 Yes 20101010 (1.0000‐1.0000) 0.950 106.7205 ( 28.1094‐
29.6976)
38.6015)
35.9421)
38.0014)
30.4086)
29.7238)
(7. test for “type‐0” change points)
(can be skipped if station history is complete or no station history available)
click FindUD
li k Fi dUD button b tt
(this does not need to be done in this example as the dates of all known site moves have already been added to the <filename>_mCs.txt file.)
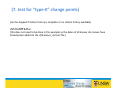
8. re‐asses the significance and magnitude of all change points
Changing the number of changepoints will affect the significance of all changepoints. S li k th St Si button to re‐assess the significance and magnitude of the new So click the StepSize
b tt t
th i ifi
d
it d f th
changepoints. Click OK to proceed.
9. Determine which change points are significant
examine results in the file <filename> fCs txt
examine results in the file <filename>_fCs.txt
7 changepoints in Series /srv/ccrc/data05/z3401061/Pacific/emacs/RHTest/nadi_tmax.txt 0 Yes 19650601 ( 1.0000‐
1.0000) 0.950 51.5468 ( 32.3474‐
34.3050)
0 YifD 19710501 ( 1.0000‐
1.0000) 0.950 18.2208 ( 36.1032‐
38.3996)
0 YifD 19851201 ( 1.0000‐
1.0000) 0.950 36.0256 ( 38.4693‐
40.9792)
0 No 19980401 ( 0.8809‐
0.9066) 0.950 ‐3.9025 ( 36.9877‐
39.3639)
1 Yes 20090106 ( 1.0000‐
1.0000) 0.950 94.3808 ( 32.8130‐
34.8125)
1 Yes 20100112 ( 1.0000‐
1.0000) 0.950 257.7519 ( 29.1818‐
30.8537)
1 Yes 20101010 ( 1.0000‐
1.0000) 0.950 105.4842 ( 28.5294‐
30.1567)
Remove any changepoints found to be not statistically significant from <filename>_mCs.txt
Deleting any changepoints will affect the significance of the remaining changepoints. So click the StepSize button again to reassess their significance and magnitude.
6 changepoints in Series /srv/ccrc/data05/z3401061/Pacific/emacs/RHTest/nadi_tmax.txt 0 Yes 19650601 ( 1.0000‐
1.0000) 0.950 45.1182 ( 32.3767‐
34.3359)
0 Yes 19710501 ( 1.0000‐
1.0000) 0.950 63.9958 ( 36.1375‐
38.4354)
0 YifD 19851201 ( 1.0000‐
1.0000) 0.950 22.0735 ( 42.4176‐
45.2812)
1 Yes 20090106 ( 1.0000‐
1.0000) 0.950 75.0505 ( 37.3992‐
39.8107)
1 Yes 20100112 ( 1.0000‐
1.0000) 0.950 260.0614 ( 29.2067‐
30.8804)
1 Yes 20101010 ( 1.0000‐
1 Yes 20101010 ( 1.0000
1.0000) 0.950 104.5662 ( 28.5538‐
1.0000) 0.950 104.5662 ( 28.5538
30.1826)
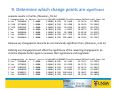
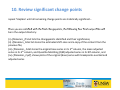
10. Review significant change points
repeat ‘StepSize’ until all remaining change points are statistically significant…
Once you are satisfied with the final changepoints, the following four final output files will O
i fi d i h h fi l h
i
h f ll i f
fi l
fil
ill
be in the output directory:
() f
(i) <filename>
_ffCs.txt lists the changepoints identified and their significance;
g p
g
;
(ii) <filename>_Fstat.txt stores the estimated shift‐sizes and a copy of the content from the previous file;
(iii) <filename>_F.dat stores the original base series in its 3rd column, the mean adjusted series in its 5th column, and Quantile‐Matching (QM) adjusted series in its 9th column, and
series in its 5
col mn and Q antile Matching (QM) adj sted series in its 9th col mn and
(iv) <filename>_F.pdf, shows plots of the original (base) series with breakpoints overlaid and adjusted series
10. Review significant change points
Station
C
Country
t
Name
Fiji
Nadi
WMO
No.
Variable
tested
Max Temp
Detected
CP
CPs
yyyymm
19641112
19650909
19651025
19721225
19880517
19881016
20090106
20100112
20101010
Final CPs Reasons
yyyymm
for CPs
B
Base
ttrend
d
19650601
19710501
19851201
20090106
20100112
20101010
-0.00048°C / 0.00024°C/
decade
decade
Site move
Site move
Site move
?
?
?
Adjusted
j
trend
Discussion
‐ Do any of the calculated trend values differ substantially between raw and adjusted series for the stations you tested? ‐ RHtestV3
RHt tV3 can also be used for detecting discontinuities in base series that is l b
d f d t ti di
ti iti i b
i th t i
compared to reference series. What could be used as a reference series in your country?
‐ What factors might prevent a homogeneity test from detecting an What factors might prevent a homogeneity test from detecting an
inhomogeneity?
‐ What factors might make a homogeneity test detect an inhomogeneity that does not really exist?
does not really exist?
Quickguide
‐
‐
‐
‐
‐
‐
source('RHtestsV3.r')
StartGUI()
TransformData
Fi dU
FindU
(FindUD)
Stepsize (repeat until all changepoints significant)
Now hands on…
1. Run Quality Control in RClimDex
Run Quality Control in RClimDex
2. Test homogeneity of data, using RHTest
!! K
!! Keep a copy of your data in a safe place !!
f
d
i
f l
!!
[Recommendation: create a [Recommendation:
create a ‘work’
work directory, copy your data directory copy your data
files there, and only work on this copy]