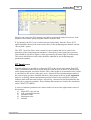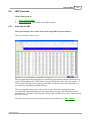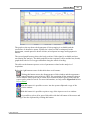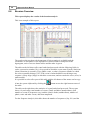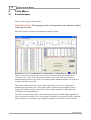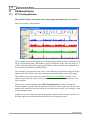
1
HypnoLab
User Manual
© 2006 SWS Soft
HypnoLab User Manual
© 2006 SWS Soft
All rights reserved. No parts of this work may be reproduced in any form or by any means - graphic, electronic, or
mechanical, including photocopying, recording, taping, or information storage and retrieval systems - without the written
permission of the publisher.
Products that are referred to in this document may be either trademarks and/or registered trademarks of the respective
owners. The publisher and the author make no claim to these trademarks.
While every precaution has been taken in the preparation of this document, the publisher and the author assume no
responsibility for errors or omissions, or for damages resulting from the use of information contained in this document or
from the use of programs and source code that may accompany it. In no event shall the publisher and the author be
liable for any loss of profit or any other commercial damage caused or alleged to have been caused directly or indirectly
by this document.
Printed: gennaio 2006 in Italy.
Publisher
SWS Soft
Managing Editor
Raffaele Ferri
Contents
I
Table of Contents
Part I Introduction
4
1 License Agreement
................................................................................................................................... 4
...................................................................................................................................
4
2 System Components
and Requirements
...................................................................................................................................
5
3 Installing the
Software
................................................................................................................................... 5
4 Getting Started
7
Part II General
1 Start-Up ................................................................................................................................... 7
2 Main Page................................................................................................................................... 8
11
3 Channel ...................................................................................................................................
Settings Dialog
4 Manual Sleep
Scoring
...................................................................................................................................
11
................................................................................................................................... 12
5 Marking Events
13
6 Selected ...................................................................................................................................
Signal Area Analysis
Mapping
......................................................................................................................................................... 14
..................................................................................................................................................
14
Signal Amplitude
mapping
Power Spectrum
mapping
..................................................................................................................................................
16
Movie Maker
.................................................................................................................................................. 18
Recording a...........................................................................................................................................
movie
20
......................................................................................................................................................... 22
Pattern Detection
Part III File Menu
23
1 Open REC/EDF
................................................................................................................................... 23
................................................................................................................................... 23
2 Close REC/EDF
................................................................................................................................... 23
3 Load Scoring
4 Save Scoring
................................................................................................................................... 24
................................................................................................................................... 24
5 Export Events
6 Edit Events
................................................................................................................................... 25
................................................................................................................................... 26
7 Export Signals
8 Edit REC/EDF
File
...................................................................................................................................
27
29
9 Save File...................................................................................................................................
Settings
...................................................................................................................................
29
10 Import File
Settings
11 Open Report
Editor
...................................................................................................................................
29
...................................................................................................................................
30
12 Set Report
Editor
13 Copy Page
to Clipboard
...................................................................................................................................
30
................................................................................................................................... 30
14 Print Signals
15 Printer Setup
................................................................................................................................... 31
16 Exit
© 2006 SWS Soft
................................................................................................................................... 31
II
HypnoLab User Manual
17 Shotcuts...................................................................................................................................
to the Last 4 Files
32
33
Part IV Settings Menu
1 File Header
................................................................................................................................... 33
33
2 Function...................................................................................................................................
Key Settings
3 Edit Event
Labels
...................................................................................................................................
34
35
Part V Options Menu
1 Snap to seconds
................................................................................................................................... 35
................................................................................................................................... 35
2 Scroll speed
36
Part VI View Menu
1 Window Lenght
................................................................................................................................... 36
2 Show/Hide
Channels
...................................................................................................................................
36
...................................................................................................................................
37
3 Active Epoch
Background Color
38
Part VII Analysis Menu
1 FFT
................................................................................................................................... 38
...................................................................................................................................
38
2 Compressed
Spectral Array
3 HRV
................................................................................................................................... 40
4 PTT
................................................................................................................................... 42
...................................................................................................................................
44
5 Sleep Scoring
Assistant
Sleep Staging
......................................................................................................................................................... 45
CAP Detection
......................................................................................................................................................... 45
ASDA Arousals
......................................................................................................................................................... 46
6 Limb Movement
...................................................................................................................................
Detection
47
...................................................................................................................................
49
7 Frequency
Event Detection
...................................................................................................................................
50
8 Apnea/Hypopnea
Detection
51
9 Average ...................................................................................................................................
Events
...................................................................................................................................
52
10 Eye Movement
Detection
53
Part VIII Reports Menu
1 Sleep Macrostructure
................................................................................................................................... 53
2 Cyclic Alternating
Pattern
...................................................................................................................................
54
................................................................................................................................... 58
3 PLM Overview
................................................................................................................................... 60
4 FFT Overview
View Current
.........................................................................................................................................................
FFT
60
Load from File
......................................................................................................................................................... 62
5 HRV Overview
................................................................................................................................... 63
View Current
.........................................................................................................................................................
HRV
63
Load from File
......................................................................................................................................................... 64
6 PTT Overview
................................................................................................................................... 64
View Current
.........................................................................................................................................................
PTT
65
© 2006 SWS Soft
Contents
III
Load from File
......................................................................................................................................................... 66
7 Apnea Overview
................................................................................................................................... 66
8 Bruxism ...................................................................................................................................
Overview
68
...................................................................................................................................
69
9 Eye Movement
Report
Part IX Tools Menu
72
1 Event Analysis
................................................................................................................................... 72
75
2 Average ...................................................................................................................................
File Analysis
3 Movie Player
................................................................................................................................... 77
Part X ? Menu
78
1 Help on HypnoLab
................................................................................................................................... 78
2 Key S/N ................................................................................................................................... 78
3 About HypnoLab
................................................................................................................................... 79
Part XI Additional Items
80
1 FFT Floating
...................................................................................................................................
Window
80
...................................................................................................................................
81
2 CAP Floating
Window
3 Report Editor
................................................................................................................................... 81
© 2006 SWS Soft
4
1
1.1
HypnoLab User Manual
Introduction
License Agreement
HypnoLab (including the hardware key, CD, diskettes or other magnetic media, and
documentation) are subject to the terms listed below.
1. You may not copy or reproduce all or any part of the Product.
2. You may make archival copies of the software files.
3. No license is granted to the Licensee to sell, license, distribute, market or otherwise
dispose of any software files or other component of the Product.
4. The Product and the media on which the software files are provided are substantially
free from significant defects in materials and workmanship under normal use for a
period of twelve (12) months from the date of delivery of the Product to you. In the
event of a claim under this warranty, the Product will be repaired or replaced free of
charge.
Warranty claims must be made in writing during the warranty period and within seven (7)
days of the observation of the defect. Please contact us ([email protected]) for further
details.
Important notice: All attempts have been made to make the information in this document
complete and accurate. The software developer is not responsible for any direct or indirect
damages or loss of business resulting from inaccuracies or omissions. The specifications
contained in this document are subject to change without notice.
1.2
System Components and Requirements
Thank you for your purchase of HypnoLab
HypnoLab is a complete and reliable tool for the analysis of sleep polygraphic recordings.
It reads files stored in EDF© format and performs all the most common computations
needed in clinical and research analysis of sleep.
System Components
The system consists of three components:
•
•
The hardware key, a programmable memory device providing the responses required
to unlock the software. There are two types of keys, depending on the computer port
available (25-pin printer port or USB port). Without this key HypnoLab does not run;
please take care of the key as you will need to buy the whole system package again in
case of loss or damage.
The program installation CD with all the files you need to install and run HypnoLab;
also this guide, in electronic format is included in the CD (you will need Adobe
Acrobat Reader© v. 5.0 or above to read it; Adobe Acrobat Reader© is available, free
© 2006 SWS Soft
Introduction
•
5
of charge, on the internet http://www.adobe.com/acrobat).
This guide.
System Requirements
HypnoLab runs under Windows 98, 2000, NT, Me and XP. No particular RAM size is
required; it occupies approximately 20 Mb of disk space (software and documentation)
and a screen resolution of at least 1280x1024 pixel is recommended; however, also lower
screen resolutions can be used. Please note that some automatic analysis routines may
require long computation time in order to be performed on long night sleep recordings
with computers using microprocessors with a low clock frequency.
1.3
Installing the Software
A Windows-based installation program is provided to facilitate installation of the
HypnoLab software on your hard disk. The installer creates all required directories and
copies the files required.
Note: Contents and installation procedures may change. Refer to the README.TXT file
for up-to-date information.
Running the Installer
•
•
•
•
1.4
Insert the CD into the CD-ROM drive. If auto run is enabled, the system will
automatically position you at the Welcome screen; otherwise, execute InstallHL.EXE.
To install the software, click on Install HypnoLab and follow the directions on the
screen. You will be prompted for a destination path for the files.
Please make sure to install the hardware key driver for your system before running
HypnoLab. Click on Install Key Driver to launch the appropriate driver, depending
on your operating system and hardware platform.
Please make sure to insert the hardware key into the correct port; one of two types of
keys can be obtained, depending on the computer port available (25-pin printer port or
USB port). .
Getting Started
Before using HypnoLab, it is necessary to have the files containing sleep recordings,
stored in EDF© format, installed on a re-writeable storage media, such as a hard disk.
EDF© files (with the extensions .EDF or .REC) are never modified by HypnoLab which
stores all the results of the various analyses in additional files, usually with the same name
of the file containing the recording but with a different extension. However, in most cases,
© 2006 SWS Soft
6
HypnoLab User Manual
the name of these files can be set by the user.
For this reason, it is important that each EDF© file is placed in a separate folder; the folder
will contain all the files connected with the recording. As an example, it is suggested to
create a main folder named "EDF" in which to create individual recording folders.
HypnoLab does not handle this process which needs to be carried out with the system
tools such as Explorer.exe. The figure shows an example.
After the creation of these folders, it is possible to save some recordings and to open them
with HypnoLab. See "Open REC/EDF" for details on how to open an EDF© file.
© 2006 SWS Soft
General
2
General
2.1
Start-Up
7
When you run HypnoLab, the main window is open showing the start-up image which
disappears after 5 seconds.
© 2006 SWS Soft
8
2.2
HypnoLab User Manual
Main Page
The main page of HypnoLab comprises 3 main areas: a top horizontal area whit the
various menus and a series of controls which become active when an EDF file is loaded, a
large middle area where the signals will be displayed and a bottom row of additional
controls; also these controls become active when a file is loaded. Finally, at the very
bottom of this window a status bar reports, from left to right, the patient name, recording
date, recording start time, recording duration, epoch start time, and scoring file loaded (or
"No Scoring").
Stage scoring buttons:
These buttons are used to assign a sleep stage to the current epoch of sleep; its number is
indicated in the "epoch label"
at the left bottom corner.
Print signals button (see "Print Signals").
Load scoring button (see "Load Scoring").
Save scoring button (see "Save Scoring").
Selected signal area analysis button (see "Selected Signal Area Analysis").
© 2006 SWS Soft
General
9
Sliding epoch labels:
These labels indicate, in the middle, the stage assigned to the current epoch and that
assigned to the 4 epochs preceding and following it. It is possible to click on any of these
labels to go to the corresponding epoch.
Epoch jump tool:
This tool allows the user to jump to the epoch specified in the small text box. Type an
epoch number in the small text box, then click the GoTo button.
Hypnogram tool:
This picture shows the hypnogram of the recording, if available, in a standard way
(multilevel histogram with wakefulness in thick green and REM sleep in thick red lines).
It is possible to place the mouse cursor on any point of this picture and a small window
indicates the corresponding epoch number and starting time. Clicking in this area it is
possible to see the corresponding epoch in the main signal area.
Signal label area:
This area contains the labels of the signals displayed. It is possible to change the order of
the signals simply by clicking one of these labels, holding the mouse button down and
dragging the label in the desired place; at the end, it is necessary to release the mouse
button and the label will be shifted to the desired place, together with its corresponding
channel, and all the other labels and channels will be rearranged accordingly.
After right clicking one these labels, a window is displayed, with all the channels settings
set by the program with which the recording file was created. This is a read-only window;
an example is reported below.
© 2006 SWS Soft
10
HypnoLab User Manual
Event browse tool:
This tool allows the user to jump the next or previous event with a given label in the
recording. First, an event should be chosen from those present in the recording and listed
in the dropdown list on the left, then the events with such a label can be browsed by
means of the left and right arrows.
Epoch slider and Epoch alignment buttons:
With HypnoLab, there are always 90 s available for inspection (see "Window Length").
They are all displayed in the main page window only with the last option of this list, in the
other cases, it is possible to shift the epoch backward and foreward by means of the
"Epoch Slider" tool.
The 3 buttons below the slider allow the quick alignement of the 90 s period on the left,
center or right.
© 2006 SWS Soft
General
2.3
11
Channel Settings Dialog
This dialog appears after right-clicking a signal trace and allows to choose all the desired
parameters for that channel.
When all parameters are set as desired, click Apply to apply them or Save. Click Multiple
Channels to apply the same parameters to more than one channel.
2.4
Manual Sleep Scoring
To score manually sleep stages
1
2
3
4
© 2006 SWS Soft
Open a sleep recording (see "Open REC/EDF").
Make sure that the HypnoLab main page is the active window (if you are not sure,
just click on any black part of the top bar).
Select View | Window lenght | 30 s.
Type one of the following digits from the keyboard:
6 = Wakefulness
1 = Sleep stage 1
2 = Sleep stage 2
3 = Sleep stage 3
4 = Sleep stage 4
12
HypnoLab User Manual
5 = Sleep stage 5
7 = Movement time
0 = Undefined
5
After one of these digits has been typed, the main page scrolls automatically one
page forward. in this way it is possible to score a sleep recording by typing only the stage
digits.
6
It is possible to assign a sleep stage to the current epoch by clicking one of the
buttons in the left top corner of the main page; however, this does not cause the
window to scroll automatically.
7
It is always better to save the scoring sometimes during this process; in any case,
when all epochs have been scored, it is necessary to save the scoring (see "Save
Scoring")
Note: see "Sleep Staging" for automatic sleep stage scoring.
2.5
Marking Events
To mark a segment of a signal as an event
1
Place the mouse cursor at the beginning of an event, push and hold down the
mouse left button and drag the mouse until the end of the event. The area is marked with a
green background as in this example.
2
When a signal segment is marked, an event can be assigned to it by means of one
of the function keys (F1-F12). After typing the function key, a bar at the bottom of the
signal trace and a label on the top indicate the presence of a marked event. It is needed
that the function keys have an event label assigned to them, before marking events
(see "Function Key Settings").
3
If an existing event is clicked, the background of the corresponding signal segment
becomes green and, if no function key is typed, the event is deleted from the list of
events. On the contrary, typing a function key will cause the assignement of the
corresponding event to the selected signal segment.
© 2006 SWS Soft
General
2.6
13
Selected Signal Area Analysis
To perform a series of analyses (power spectrum, amplitude and/or power spectrum
mapping, pattern detection) on a signal segment
1
Place the mouse cursor at the beginning of a signal segment of interest, push and
hold down the mouse left button and drag the mouse until the end of the event. The area is
marked with a green background as in this example.
2
3
4
© 2006 SWS Soft
Click
from the horizontal tool bar on the top of the signal area..
If an existing event is clicked, the background of the corresponding signal segment
becomes green.
This dialog box is displayed.
14
HypnoLab User Manual
This window shows, on the top (with a yellow background), the selected signal segment.
Left clicking on this window causes the appearance of a vertical line in the signal
window and of the numerical value of the signal in the "Cursor" text area below it.
The signal can be rectified by clicking the relative option box and its amplification
can be changed by using the "Sensitivity" arrows (up and down); it is possible to
return to the initial status by clicking the Reset button. The label with pale blue
background on the right show the amplitude value of the horizontal cursor and can be
moved up and down by clicking and dragging it or by using the "Shift" arrows (up
and down).
The "Epoch length" area allows the user to change the extent of the signal segment
selected by typing directly the desired values (note that all time values are relative to
the current epoch start time).
The bottom graph, with a green background, shows the power spectrum of the segment
selected (up to a frequency = sampling rate/4). The vertical scale is set automatically.
Left clicking on this window causes the appearance of a vertical line in the spectrum
window and of the numerical value of the spectrum in the "Cursor" text area below it.
The power spectrum values can be loaded into the clipboard by clicking the Copy
FFT button. Afterwards, it is possible to paste these values to any other windows
program.
Additional analyses are available by clicking the Mapping and the Pattern Detection
buttons.
2.6.1
Mapping
This option provides 3 different mapping tools:
1
2
3
2.6.1.1
Signal Amplitude mapping
Power Spectrum mapping
Movie Maker
Signal Amplitude mapping
This option provides a tool to draw color maps of the amplitude of the EEG signals
on the scalp.
This dialog box is displayed.
© 2006 SWS Soft
General
15
This window shows, on the top (with a yellow background), the selected signal segment.
Left clicking on this window causes the appearance of a vertical line in the signal
window and of the numerical value of the signal in the "Cursor" text area below it.
The signal amplification can be changed by using the "Sensitivity" arrows (up and
down). The "Global Field Power" option box is not yet active.
Before a map can be drawn, it is necessary to "Set Available Electrodes" in the relative
area. When this window is loaded, HypnoLab searches for electrodes and places them
in their position if their label contains a reliable reference to the 10-20 International
System; however, the user should check carefully that all electrodes are in the correct
scalp location and that they are all different. HypnoLab uses a minimum of 8 and up
to 21 electrodes to draw maps; however, reliable maps require at least 16 or more
electrodes available. In this area, if the same electrode has been set in two different
scalp locations, the map are not drawn and the user must correct it. It is possible to
save (Save Set button) and load (Load Set button) different sets of electrodes; this
saves time and the manual placement of them in the correct location is only needed
one time.
Clicking the label of any of these electrodes, the corresponding signal is displayed in the
signal window above.
When all parameters are correct, it is possible to click on any point of the signal window
© 2006 SWS Soft
16
HypnoLab User Manual
and a map is drawn in the 3 right bottom panels. It is possible to change the values of
the color scale by typing directly over the high and low values. In this case, the map is
redrawn automatically with the new scale.
If the "Centroid" option box is selected, two small concentric circles are shown on the
map on the top showing the location of the centroid and its coordinates are also
reported on the left.
To load a map previously saved with HypnoLab, click
To save a map, click
.
.
To clip the bitmap of the map and place it in the clipboard, click
If Microsoft Excel© is installed on the computer click
values in several sheets.
2.6.1.2
.
to open it with all map point
Power Spectrum mapping
This option provides a tool to draw color maps of the EEG power on the scalp.
This dialog box is displayed.
This window shows, on the top (with a green background), the power spectrum of selected
© 2006 SWS Soft
General
17
signal segment. Left clicking on this window causes the appearance of a vertical line
in the signal window and of the numerical value of the corresponding frequency and
power spectrum in the "Cursor" text area below it. The signal amplification can be
changed by using the "Sensitivity" arrows (up and down).
To save the power spectra of all signals selected (see below), click
below this
window. An ASCII file is created with a ".mft" extension; this is an example showing
the format of the ASCII file created by this command:
Before a map can be drawn, it is necessary to "Set Available Electrodes" in the relative
area. When this window is loaded, HypnoLab searches for electrodes and places them
in their position if their label contains a reliable reference to the 10-20 International
System; however, the user should check carefully that all electrodes are in the correct
scalp location and that they are all different. HypnoLab uses a minimum of 8 and up
to 21 electrodes to draw maps; however, reliable maps require at least 16 or more
electrodes available. In this area, if the same electrode has been set in two different
scalp locations, the map are not drawn and the user must correct it. It is possible to
save (Save Set button) and load (Load Set button) different sets of electrodes; this
saves time and the manual placement of them in the correct location is only needed
one time.
Clicking the label of any of these electrodes, the corresponding spectrum is displayed in
the power spectrum window above.
When all parameters are correct, it is possible to draw a map of a single frequency
(indicated by the vertical line in the power spectrum window) or of a frequency band
© 2006 SWS Soft
18
HypnoLab User Manual
(options in the right top area of this window); in the second case, it is necessary to
type the desired low and high cut frequencies. Clicking the button Map a map is
drawn in the 3 right bottom panels. It is possible to change the values of the color
scale by typing directly over the high and low values. In this case, the map is redrawn
automatically with the new scale.
If the "Centroid" option box is selected, two small concentric circles are shown on the
map on the top showing the location of the centroid and its coordinates are also
reported on the left.
To load a map previously saved with HypnoLab, click
To save a map, click
.
.
To clip the bitmap of the map and place it in the clipboard, click
If Microsoft Excel© is installed on the computer click
values in several sheets..
2.6.1.3
.
to open it with all map point
Movie Maker
This option provides a tool to record a movie with color maps of the EEG signal
amplitude or power on the scalp.
This dialog box is displayed.
© 2006 SWS Soft
General
19
First it is necessary to choose the desired option between "Signal amplitude map" and
"Power spectrum map". clicking one of these two options causes the activation and
deactivation of the appropriate set of parameters needed.
If "Signal amplitude map" is selected, the following parameters should be set:
Movie Start time: The desired start time should be typed taking into account that
time zero corresponds to 30 s before the start of the current epoch. This operation can
be carried out on a maximum of 90 s (from 30 s preceding the start to 30 s after the
end of the current epoch); thus start and stop (see below) times should be set
accordingly. By default the start and stop times of the selected signal segment are
reported in these fields when this window is opened.
Movie Stop time: See above.
Frames/second (1-30): This is the speed at which the movie will be played during
reproduction (min 1, max 30). As an example, if this is set at 4 and "Move step" (see
below) is 0.250 s, the movie will reproduce in real time.
Move step: This is the interval between consecutive maps (frames) of the movie.
If "Power spectrum map" is selected, the following parameters should be set:
Movie Start time: The desired start time should be typed taking into account that
time zero corresponds to 30 s before the start of the current epoch. This operation can
be carried out on a maximum of 90 s (from 30 s preceding the start to 30 s after the
end of the current epoch); thus start and stop (see below) times should be set
accordingly. By default the start and stop times of the selected signal segment are
reported in these fields when this window is opened.
Movie Stop time: See above.
© 2006 SWS Soft
20
HypnoLab User Manual
Frames/second (1-30): This is the speed at which the movie will be played during
reproduction (min 1, max 30). As an example, if this is set at 4 and "Move step" (see
below) is 0.250 s, the movie will reproduce in real time.
Move step: This is the interval between consecutive maps (frames) of the movie.
Window length: This is the length of the segment on which power spectra are
calculated, starting at each step.
Low cut frequency: Low limit of the desired frequency range.
High cut frequency: High limit of the desired frequency range.
Before maps can be drawn and a movie recorded, it is necessary to "Set Available
Electrodes" in the relative area. When this window is loaded, HypnoLab searches for
electrodes and places them in their position if their label contains a reliable reference
to the 10-20 International System; however, the user should check carefully that all
electrodes are in the correct scalp location and that they are all different. HypnoLab
uses a minimum of 8 and up to 21 electrodes to draw maps; however, reliable maps
require at least 16 or more electrodes available. In this area, if the same electrode has
been set in two different scalp locations, the map are not drawn and the user must
correct it. It is possible to save (Save Set button) and load (Load Set button)
different sets of electrodes; this saves time and the manual placement of them in the
correct location is only needed one time.
When all parameters are correct, it is possible to record a movie clicking the button Go in
the "Record Movie" area. This button causes the disappearance of this window and
the appearance of the "Recording" window.
If the "Centroid" option box is selected, two small concentric circles are shown on the
map on the top showing the location of the centroid and its coordinates are also
reported on the left.
To load a map previously saved with HypnoLab, click
To save a map, click
.
.
To clip the bitmap of the map and place it in the clipboard, click
If Microsoft Excel© is installed on the computer click
values in several sheets..
.
to open it with all map point
2.6.1.3.1 Recording a movie
This window shows the movie with color maps of the EEG signal amplitude or power
on the scalp being recorded, frame by frame.
This dialog box is displayed.
© 2006 SWS Soft
General
21
The left part of this window shows all the signals in the recording (10 s); the segment with
yellow background shows the segment from which the power spectrum is computed (if a
signal amplitude map is being recorded, only a thick vertical line is displayed). On the
right, the color map is shown. Before the recording is started, it is possible to change the
color scale min and max values, typing them directly in their relative text boxes (with a
yellow background).
At this point it is possible to record the movie by clicking the button Play. The signals on
the left start scrolling and the map changes accordingly. When the desired time range has
been covered, the Save File dialog box is displayed. Type the filename (a ".avi" file
extension will be automatically appended); finally, the following dialog box will allow to
chose the desired video codec. If you are not familial with this, just choose the parameters
shown in this example.
At the end the user is informed that the AVI file has been created. This file can be played
with any video player or with the HypnoLab built-in "Movie Player".
© 2006 SWS Soft
22
2.6.2
HypnoLab User Manual
Pattern Detection
This option provides a tool to detect automatically EEG segments using the selected
segment as a template.
This dialog box is displayed.
It is necessary to choose one of the labels available in the dropdown list; the events
detected (a K-complex in this example) will be marked with this label.
The field "Threshold" should contain a number between 0 and 1. High values (>0.9) are
recommended for a reliable detection of events with the same morphology of the template.
The detection is carried out by means of the calculation of the correlation coefficient
between the template and the EEG signal under analysis; the template is shifted, point-bypoint, along the EEG signal and the instantaneous correlation coefficient is calculated.
Events are detected when the threshold indicated above is reached.
It is also possible to perform this detection on a fixed range of epochs by specifying the
start and stop epochs. If events with the same label are already present in that ange, it is
advised to select the option "Delete existing events".
Finally, it is possible to select the sleep stages during which the detection will be
performed.
When all parameters are set as desired, click Detect to start the detection process.
Important notes:
• the detection accuracy is critically dependent on the template chosen and on the level
of the threshold.
• if it is desired to detect events characterized by a well-defined frequency range, a
range of durations, and a minimum amplitude, it is better to use the "Frequency
Event Detection" routine of HypnoLab.
© 2006 SWS Soft
File Menu
3
File Menu
3.1
Open REC/EDF
23
To open an .edf or .rec file in HypnoLab
1
Select File | Open REC/EDF.
The Open File dialog box is displayed.
2
Browse your disk and select the desired file.
3
Click Open.
4
If one or more scorings are available in the same directory where this EDF file is
stored a new Open File dialog box is displayed with a list of available files (.sco), you can
select and open one of them or cancel.
Note: When you open a file for the first time and no settings are available for such a file,
all channels will appear with a low amplitude. You need to set all parameters for each
channel in order to visualize them in the desired way (see "Channel Settings Dialog").
3.2
Close REC/EDF
To close an .edf or .rec file in HypnoLab
1
Select File | Close REC/EDF.
The current recording is closed and HypnoLab is ready for the analysis of a new
EDF recording.
Before the recording is actually closed, a confirmation dialog appears. Clicking No, the
file is not closed; on the contrary, after clicking Yes, another dialog box appears for
storing the current file settings or not.
3.3
Load Scoring
To load an already saved scoring file, for the current recording
1
Select File | Load Scoring.
The Open File dialog box is displayed.
2
Browse your disk and select the desired file.
© 2006 SWS Soft
24
HypnoLab User Manual
3
Click Open.
This function is also accessible by clicking
the signal area.
3.4
from the horizontal tool bar on the top of
Save Scoring
To save a scoring file for the current recording
1
Select File | Save Scoring.
The Save File dialog box is displayed.
2
Type the filename (a ".sco" file extension will be automatically appended).
3
Click Save.
If you are trying to save a file with the same name of an existing file, a dialog box is
displayed for the confirmation.
This function is also accessible by clicking
the signal area.
3.5
from the horizontal tool bar on the top of
Export Events
To export events to an ASCII file
1
Select File | Export Events.
This dialog box is displayed.
2
All event types to export should be passed from the left list to the right list by
© 2006 SWS Soft
File Menu
25
selecting each of them and clicking the Add button; it is possible to add all events by
clicking the Add All button or to remove one event type from the export list on the right
by selecting it and clicking the Remove button.
3
4
It is possible to export sleep stages and events, stages only or events only by
selecting the appropriate option.
Click Add All (an ASCII file is created with a ".evt" extension).
This is an example showing the format of the ASCII file created by this routine:
HYPNOLAB Event Export
Patient: Xxxxxx Xxxxxxx
Recording: XXXX
Date: xx.xx.xx
Events included:
Wake
MT
S1
S2
S3
S4
REM
UN
LM-R
LM-L
Time [hh:mm:ss.xxx]
22:16:44.000
Wake
22:17:14.000
Wake
22:17:44.000
Wake
22:18:14.000
Wake
22:18:44.000
Wake
22:19:14.000
Wake
22:19:44.000
S1
22:19:50.336
LM-L
22:20:14.000
S1
22:20:16.734
LM-L
22:20:38.125
LM-L
22:20:44.000
S1
22:20:54.039
LM-L
......
3.6
Event
30
30
30
30
30
30
30
2.461
30
4.227
3.094
30
1.570
Duration(s)
Edit Events
To edit events present in the current recording
1
© 2006 SWS Soft
Select File | Edit Events.
This dialog box is displayed.
26
HypnoLab User Manual
2
After choosing an event type from the list on the left, all events of the same type
present in the recording can be deleted by clicking the Delete button or renamed by
clicking the Rename button (the new event name - max 5 characters - should be typed in
the relative text box, before renaming).
3
4
3.7
The "Select Epochs" area contains two text boxes in which it is possible to specify
a range of epochs in which the action (deletion or renaming) will take place. The
default values include the whole recording.
Click Done when finished.
Export Signals
To export signal values to an ASCII file
1
Select File | Export Signals.
This dialog box is displayed.
© 2006 SWS Soft
File Menu
27
2
Select all channels to export (the "Select All Channels" box allows to select all
signals with a single click).
3
It is possible to export only one or multiple epochs by choosing the one of the
options in the "Select Epochs to Export" area. HypnoLab checks instantaneously if
Start and Stop epochs values typed in the relative text boxes are compatible with the
current recording and corrects them, if needed, by setting them to the default values
(first and last epoch).
4
The "ASCII File Format" area allows the user to choose among multiplexed or
channel blocks formats. The multiplexed format is only possible if all channels to
export have the same sampling rate and if it is selected, HypnoLab activates only
channels with the same sampling rate. Clicking the "No Header" box causes the
storage of a file containing only numeric values.
5
Click Export (an ASCII file is created with a ".asc" extension).
This is an example showing the format of the ASCII file created by this routine
(multiplexed format, with header):
©SWS Soft - Hypnolab
Sampling Rate: 128 Hz
F3/A2
C3/A2
-0.400
-5.400
-1.300
-3.000
-0.400
6.500
8.000
12.100
12.400
13.900
13.400
.....
3.8
O1/A2
6.300
-17.900
6.500
-5.500
1.600
8.000
7.600
11.800
10.300
13.800
14.100
0.700
-3.500
-9.000
-13.500
-12.100
-8.600
-3.800
3.600
9.600
14.900
15.900
Edit REC/EDF File
This option allows to edit a REC/EDF file and create a new REC/EDF file. The new
file can have a different number of channels, each channel can be referenced to another
channel (with the same sampling rate) and each channel can be pre-filtered and renamed.
1
© 2006 SWS Soft
Select File | Edit REC/EDF File.
This dialog box is displayed.
28
HypnoLab User Manual
2
Select the first channel to include in the new file from the list on the left. All the
channels in the "Refer to Channel" area with the same sampling rate will become active
and, by default, the same channel is automatically selected in this area. In this way, no
referencing will be performed by HypnoLab. On the contrary, if it is desired to rereference this channel to another, select the desired channel in the "Refer to Channel"
area; in this way, HypnoLab will store the difference (Channel1-Channel2) between these
two channels.
3
The "Prefiltering (Hz)" area reports, automatically the current filter settings of the
selected channel. It is possible to change these settings only before adding the channel
to the export list on the right. The exported signal will be pre-filtered and the resulting
values will be stored in the output file.
4
Click the Add to List button to add the channel to the export list.
5
Repeat steps 2, 3, and 4 until the export list is complete, as desired.
6
It is possible to rename the channels in the export list by selecting one of them
from the list. It will appear in the text box above the list, type over this name and push
the "Enter" key to assign the new name to the channel.
7
The "Select Epochs to include" area allows to include only a subset of epochs in
the new file (the default values include the whole recording).
8
Click Edit and Save when finished. The Save File dialog box is displayed. Type
the new file name (a ".rec" file extension will be automatically appended). Note that a file
© 2006 SWS Soft
File Menu
29
name different from that of the current recording should be type; HypnoLab does not
allow to modify original recordings.
9
3.9
Click Save.
Save File Settings
To save all the settings of the current recording.
1
Select File | Save File Settings
A file is automatically saved with the same name of the current recording but with a ".set"
extension, in the same folder containing the REC/EDF file. If it already exists, the user is
asked to confirm its substitution.
3.10
Import File Settings
To import all the settings of the current recording from another recording.
1
Select File | Import File Settings.
The Open File dialog box is displayed.
2
Browse your disk and select the desired file from a folder containing a recording
with the same channel number and types (and in the same order) of the current recording.
3
Click Open.
If the file selected is not compatible (different number of channels, etc.) an error message
is displayed and the settings are not loaded.
3.11
Open Report Editor
To open an external program used to type the report.
1
Select File | Open Report Editor.
The external program defined by means of the "Set Report Editor" is opened in a new
window. If this has never been set before, HypnoLab asks if it is desired to set it (see "Set
© 2006 SWS Soft
30
HypnoLab User Manual
Report Editor")
3.12
Set Report Editor
To set an external program used to type the report.
3.13
1
Select File | Set Report Editor.
The Open File dialog box is displayed.
2
Browse your disk and select the desired program (.exe file).
3
Click Open.
Copy Page to Clipboard
To create a high-definition image of signals in the clipboard.
1
Select File | Copy Page to Clipboard.
Wit this option, HypnoLab creates a high-definition bitmap of the current epoch (30 s),
utilizing the current channel settings, in the clipboard. After clicking this option, it is
possible to paste the image in another program to edit it and use it for arranging figures,
slides, etc.
3.14
Print Signals
To print signals
1
Select File | Print Signals.
This dialog box is displayed.
© 2006 SWS Soft
File Menu
31
2
The desired printer can be chosen from the list of the printers installed, together
with the paper orientation.
3
The "Select Pages" area contains two text boxes in which it is possible to specify a
range of epochs to print. The thickness of the traces can be set from 1 to 3 points; it is
possible also to choose if the events present in the current scoring should be printed or
not.
4
Click Print or Cancel when finished.
This function is also accessible by clicking
the signal area.
3.15
from the horizontal tool bar on the top of
Printer Setup
To change the current printer settings
1
3.16
Select File | Printer Setup.
The Printer Setup dialog box is displayed.
Exit
To exit HypnoLab
© 2006 SWS Soft
32
HypnoLab User Manual
1
Select File | Exit.
The current recording is closed and HypnoLab is closed (the user is requested to
confirm quitting HypnoLab).
3.17
Shotcuts to the Last 4 Files
The last 4 items of the File menu are shortcuts for the last 4 recordings opened by
HypnoLab. Clicking one of them causes the opening of the relative recording.
© 2006 SWS Soft
Settings Menu
4
Settings Menu
4.1
File Header
33
To display the content of the REC/EDF file header
1
Select Settings | File Header.
This dialog box is displayed.
This is a read-only window showing the file settings set by the program with which the
recording file was created.
4.2
Function Key Settings
To assign event labels to the different function keys (F1-F12)
1
Select Settings | Function Key Settings.
This dialog box is displayed.
2
Click on one label on the left (F1-F12), the label turns yellow.
© 2006 SWS Soft
34
HypnoLab User Manual
3
Select the event label to assign to the function key from one of the 5 lists on the
right. The event is assigned to the selected function key.
4
Repeat steps 2 and 3 until all desired events are assigned to a function key.
5
Click Apply or Cancel when finished.
This operation is needed before events can be manually marked on any signal (see
"Marking Events"). All the settings contained in this dialog box are saved in the file
settings (see "Save File Settings" and "Import File Settings") and are loaded
together with the other settings when the corresponding REC/EDF file is opened by
HypnoLab (see "Open REC/EDF").
4.3
Edit Event Labels
To edit the labels of events
1
Select Settings | Edit Event Labels | Arousal Events
or ... PLM Events
or ... Apnea Events
or ... Sleep Events
or ... User Events
This dialog box is displayed. (Sleep Events in this example).
2
Click on one label in the list to Remove it.
3
Type a new event label in the text box above the list, the click the Add button.
4
Click Apply or Cancel when finished.
© 2006 SWS Soft
Options Menu
5
Options Menu
5.1
Snap to seconds
35
To mark signal segments with a length equal to an integer number of seconds.
Place the mouse cursor at the beginning of a signal segment of interest, push and hold
down the mouse left button and drag the mouse until the end of the event. The area is
marked with a green background as in this example, with length equal to 1 or more
seconds, with 1-second steps; no intermediate length values are allowed.
5.2
Scroll speed
To select the scroll speed when the "FF" or "RW" commands are clicked from the
main program page.
It is possible to select the following scroll speeds:
2 pages/s
1 page/s
1 page/2 s
1 page/3 s
1 page/4 s
1 page/5 s
Important note: the highest speeds might not be possible, depending on the
characteristics of your computer.
© 2006 SWS Soft
36
HypnoLab User Manual
6
View Menu
6.1
Window Lenght
To select the length of the window in the main page.
It is possible to select the following window lengths:
10 s
15 s
20 s
30 s
60 s
90 s
With HypnoLab, there are always 90 s available for inspection. They are all displayed in
the main page window only with the last option of this list, in the other cases, it is possible
to shift the epoch backward and forward by means of the "Epoch Slider" tool (see "Main
Page").
The active or current epoch is shown with a differently colored backgroud (yellow by
default) which can be set by the user (see "Active Epoch Background Color")
6.2
Show/Hide Channels
To select the channels to be show or hidden.
The user can choose to hide some channels available in the recording and to show only a
subset of them. This option can also be useful for speeding up the scrolling during
operations which do not require the contemporary visualization of all channels.
This dialog box is displayed.
© 2006 SWS Soft
View Menu
37
Choose the desired channels, then click the Apply button.
6.3
Active Epoch Background Color
To select the color of the active (current) epoch background.
The active or current epoch is shown with a differently colored background (yellow by
default) which can be set by the user.
This dialog box is displayed.
Choose the desired color, then click the OK button.
© 2006 SWS Soft
38
HypnoLab User Manual
7
Analysis Menu
7.1
FFT
This option provides a tool to perform an epoch-by-epoch power spectral analysis
(Fast Fourier Transform) of a given channel, for the whole recording period.
Typically, this is performed on EEG channels.
This dialog box is displayed.
The user can choose the channel on which to perform the analysis from the dropdown list
on the right and up to 10 different spectral bands. Also the color of each band graph can
be chosen by clicking the small colored squares. The analysis begins clicking the Start
button.
Note: The power of each band is calculated for each sleep epoch as the average of fifteen
2-second mini-epochs (for a total of 30 s).
When the analysis is complete, HypnoLab automatically displays the "FFT Overview".
7.2
Compressed Spectral Array
This option provides a tool to perform a power spectral analysis (Fast Fourier
Transform) of a given channel, for a desired recording period.
This window is displayed.
© 2006 SWS Soft
Analysis Menu
39
The user can choose the channel on which to perform the analysis from the dropdown list
on the right. Also the starting and end time for the analysis should be specified on the left
("CSA Settings" area).
.
The length of the epoch for the FFT analysis must be specified in the "Moving Window
Settings" area, with values in the range 1-30 s. In the same area, the value of the move
step must also be indicated (max 30 s).
Finally, even if HypnoLab computes all possible frequencies, depending on the epoch
length and sampling rate, the user can choose the frequency range to display in the graph
("Select Frequency Band" area).
The analysis begins clicking the Compute CSA button. at the end the results are drawn in
the graph area at the top. The first epoch is drawn in the left bottom corner while the last
epoch is drawn in the right top corner. After the CSA has been drawn at the end of the
analysis, the user can change the scale of the graph by typing the new value directly on
the scale maximum value in the graph.
The bottom right corner contains 2 buttons:
Whit this button it is possible to save the results of the CSA analysis. This option
creates an ASCII file with the ".csa" extension.
This button copies into the clipboard a copy of the image of the CSA window.
© 2006 SWS Soft
40
7.3
HypnoLab User Manual
HRV
This option provides a tool to perform a spectral analysis (Fast Fourier Transform)
of the heart rate variability (HRV).
This window is displayed.
The user can choose the ECG channel on which to perform the analysis from the
dropdown list on the right.
.
If, my mistake, the ECG was recorded with inverted polarity, then the "Invert Data"
option should be checked.
The user can also choose to analyze a single period of 256 s starting at the beginning of
the current sleep epoch ("5 min" option) or the whole recording ("All" option).
Single period analysis (256 s or "5 min")
When this option is checked, after clicking the Start button, HypnoLab computes a series
of parameters related to HRV, after an automatic detection of the peak of R wave in the
ECG channel utilizing a simple threshold plus first and second derivative algorithm.
If the ECG has been sampled at a rate lower than 200 Hz, a bias in the estimation of the Rwave fiducial point might occur (Task Force of the European Society of Cardiology and
the North American Society of Pacing and Electrophysiology Heart rate variability.
Standards of measurements, physiological interpretation and clinical use. Circulation
1996;93:1043–1065) with a consequent alteration of the spectrum. In this case,
HypnoLab performs automatically a parabolic interpolation to refine its evaluation
(Bianchi et al. Time-variant power spectrum analysis for the detection of transient
episodes in HRV signal. IEEE Trans Biomed Eng 1993;40:136–144; Merri et al.
© 2006 SWS Soft
Analysis Menu
41
Sampling frequency of the electrocardiogram for the spectral analysis of heart rate
variability. IEEE Trans Biomed Eng 1990;37:99–106).
The R–R intervals occurring in the first 256 s of the period starting at the beginning of the
current sleep epoch are utilized for the computation of R–R intervals at discrete evenlyspaced time points (at each second), by means of linear interpolation from the adjacent
measured intervals..
First of all, HypnoLab calculates a series of time-domain measures:
(a) mean R–R-value, SDNN (SD of all R–R intervals);
(b) RMSSD (the square root of the mean of the sum of the squares of differences between
adjacent R–R intervals);
(c) NN50 (number of pairs of adjacent R–R intervals differing by more than 50 ms in the
entire epoch);
(d) pNN50 (percentage of NN50 among the total R–R intervals).
The interpolated R–R interval tachogram is also processed by means of a fast Fourier
transform (FFT) algorithm and the following spectral parameters are obtained:
(a) VLF (power in very low frequency range, <0.04 Hz);
(b) LF (power in low-frequency range, 0.04–0.15 Hz);
(c) HF (power in high-frequency range, 0.15–0.4 Hz);
(d) total power (VLF + LF + HF);
(e) LF% (LF power in normalized units: LF/(total power – VLF) × 100);
(f) HF% (HF power in normalized units: HF/(total power – VLF) × 100);
(g) LF/HF (ratio LF/HF);
(h) VLF peak (frequency of highest peak in the VLF range);
(i) LF peak (frequency of highest peak in the LF range);
(j) HF peak (frequency of highest peak in the HF range).
All these parameters are listed in the text area in the left bottom corner of this window
and are automatically loaded into the system clipboard; the user can paste them into
another data-rocessing program, if desired. The top graph shows the interpolated R–R
interval tachogram. just below, on the right, the power spectrum is shown, with the
indication of the limits of the 3 main spectral bands (VLF, LF, and HF).
On the left, the Poincarré plot of all pairs of subsequent intervals is shown.
Note: If the quality of the ECG tracing is poor, HypnoLab might make mistakes in the
automatic detection of R waves. In this case, it is posible to try to correct the detection by
increasing or decreasing the "Sensitivity" (from -0.5 to +0.5) and clicking the Start button
again. If errors continue to occur, it is possible to carry out a manual correction by
clicking the Correct button. This causes the opening of a new window like the following
example.
© 2006 SWS Soft
42
HypnoLab User Manual
This window contains 3 graphs with a detailed representation of the ECG tracing in the
period under analysis; each graph contains 100 s of tracing and it is possible to add or
delete R-wave detection marks by clicking with the mouse. There is a slider for each of he
3 graphs in order to explore them.
When the correction is complete, it is possible to go back to the HRV analysis clicking the
Done button. In this case the corrected tachogram will be displayed along with the
corrected analysis results (which are also loaded into the system clipboard). Alternatively,
button to load the time of occurrence of each R wave and
it is possible to click the
the corresponding HR into the system clipboard. Note that, in this case, the Cancel button
should be used to close this window; otherwise, the content of the system clipboard will
be substituted by the results of the HRV analysis.
Whole recording analysis ("All")
When this option is checked, after clicking the Start button, HypnoLab computes the
same series of parameters related to HRV seen above on all possible 256-second periods
available in the recording, starting 5 min after each other.
When the analysis is complete, HypnoLab automatically displays the "HRV Overview".
7.4
PTT
This option provides a tool to perform the analysis of the Pulse Transit Time (PTT).
For this analysis it is necessary to have two channels, one with the ECG recording, for the
detection of R waves, and another with the plethysmogram obtained from the pulse
oxymeter.
This window is displayed.
© 2006 SWS Soft
Analysis Menu
43
The user can choose the ECG channel on which to perform the analysis from one of the
dropdown lists and the plethysmogram channel from the other.
If, my mistake, the ECG was recorded with inverted polarity, then the "Invert ECG"
option should be checked; the same can be done for the plethysmogram channel with the
"Invert pleth." option.
The "PTT Correction Time" area is useful in cases in which the device used for the
generation of the plethysmogram introduces a fixed delay in this signal; the correction
value should be typed as a negative value (preceded by the minus sign) in milliseconds.
The correct information on this value should be obtained by the plethysmograph
production company.
PTT Epoch button
With this button it is possible to evaluate the PTT in the current sleep epoch. Each PTT
value is calculated as the time between the peak of the R wave in the ECG and the point
on the plethysmogram waveform which is 50% of the height of its maximum value, which
is considered as the arrival of the pulse wave. All pairs R wave/plethysmogram pulse in
the current sleep epoch are included and their values drawn in the top graph; HypnoLab
also tries to identify minima and maxima possibly related to the respiratory cycle and
indicates them with blue and red lines, respectively, connected by an horizontal line and
marked by a progressive number. These minima and maxima are used for the calculation
on the "delta" PTT (DPTT).
A series of statistical parameters are shown in the text area in the right bottom corner of
this window:
a)
Mean PTT value (in ms)
b) S.D. (standard deviation)
c)
Minimum value
d) Maximum value
e)
Median
© 2006 SWS Soft
44
HypnoLab User Manual
f)
g)
h)
i)
j)
k)
l)
m)
n)
25th centile
75th centile
Number of R waves detected
Number of pulses detected
Number of R wave/pulse pairs detected
Mean Delta PTT (in ms)
Mean Delta PTT (as a percentage of the mean PTT value)
Maximum Delta PTT (in ms)
Maximum Delta PTT (as a percentage of the mean PTT value)
After the PTT has been drawn, the user can change the scale of the graph by typing the
new values directly on the scale maximum and minimum values at the left of the graph.
PTT All button
With this button it is possible to evaluate the same PTT parameters listed above for each
epoch of the recording.
When the analysis is complete, HypnoLab automatically displays the "PTT Overview"
and creates, automatically, a new ASCII file with the ".pta" extension reporting all times
at which a PTT was calculated (in seconds, taking the recording starting time as zero) and
the all PTT values computed in the whole recording.
Add PTT Channel button
With this button it is possible to evaluate the PTT along the whole recording and to add a
new channel containing the waveform of the PTT signal. At the end of the analysis, the
Save File dialog box is displayed and the user must specify a file name different from that
of the recording under analysis. HypnoLab never modifies an existing EDF recording but
creates a new one. The new file contains all the channels and settings of the recording
under analysis and an additional channel containing the PTT values. The new channel has
a sampling rate equal to that of the ECG or plethysmogram channel, whichever is higher.
7.5
Sleep Scoring Assistant
Choose this option to perform an automatic:
1
2
3
Sleep Staging
CAP Detection
ASDA Arousals Detection
© 2006 SWS Soft
Analysis Menu
7.5.1
45
Sleep Staging
This option provides a tool to perform an automatic staging of sleep.
When this option is selected, the following window appears.
The user must first select the channel containing the EEG, the EMG, and the EOGs
(however, HypnoLab accepts also only one EOG channel) to be analyzed from the
dropdown lists; for the EOG, it is important to set a threshold for the detection of eye
movements, a typical value is 70 µV (the user should pay attention to the units of the
channel as they can be mV or even V, depending on the recording system used; please
refer to the "Signal label area" in the "Main Page" help).
By default, the first epoch is set as the lights off epoch and the last as the lights on epoch
but these settings can be changed by the user.
At this point the analysis can be started and HypnoLab uses its built-in templates for the
detection of the different sleep stages; however, it is recommended to provide HypnoLab
the recording specific stage templates by typing in the column of text boxes on the left the
number of each stage template epoch in the recording. This takes only a few minutes but
improves significantly the accuracy of the detection.
The "Sleep Macrostructure Overview" window shows up automatically at the end of the
automatic staging, with the results of the analysis.
7.5.2
CAP Detection
This option provides a tool to perform an automatic detection of the Cyclic
Alternating Pattern (CAP) from one EEG channel.
When this option is selected, the following window appears. The user must first select the
© 2006 SWS Soft
46
HypnoLab User Manual
channel containing the EEG to be analyzed from the dropdown list; when one channel is
selected, the Start button becomes active and the analysis can be started.
The automatic detection is performed through the evaluation of the amplitude of two
frequency bands; the low-frequency bands defines the main component of A1 CAP
subtypes while the high-frequency band defines the main component of A3 CAP subtypes.
Both frequency components are expect to characterize A2 CAP subtypes. For these
frequency bands, the user must indicate low and high cutoff frequency, and amplitude
threshold. The initial values proposed by HypnoLab can be used but, often, an adjustment
is needed in order to take into account the individual EEG characteristics. Sleep spindles
need to be excluded and their frequency band (center frequency and bandwidth) must also
be indicated. This method has been validated and the details of the detection process have
been published in Ferri R, Bruni O, Miano S, Smerieri A, Spruyt K, Terzano MG. Interrater reliability of sleep Cyclic Alternating Pattern (CAP) scoring and validation of a new
computer-assisted CAP scoring method. Clinical Neurophysiology 2005;116:696-707.
The set of parameters used can be saved by clicking the Save Set button and retrieved by
clicking the Load Set button.
During the detection process, the whole recording is scanned and the state of advancement
of the analysis is monitored by means of a progress bar on the bottom of the window. CAP
subtypes detected are marked as "A1", "A2", and "A3" events.
The "Cyclic Alternating Pattern Overview" window shows up automatically at the end
of the detection, with the results of the analysis.
7.5.3
ASDA Arousals
This option provides a tool to perform an automatic detection of the ASDA arousals
from one EEG channel.
When this option is selected, the following window appears.
© 2006 SWS Soft
Analysis Menu
47
The user must first select the channel containing the EEG to be analyzed from the
dropdown list, together with the channel containing the EMG; when both channels are
selected, the Start button becomes active and the analysis can be started.
The automatic detection is performed through the evaluation of the amplitude of an EEG
frequency band, defined by the user (HypnoLab provides a default range). For the EMG
channel, only the threshold must be indicated. Sleep spindles need to be excluded and
their frequency band (center frequency and bandwidth) must also be indicated.
The rules for the definition of arousals have been defined. American Sleep Disorders
Association. Arousals: scoring rules and examples. A preliminary report from the sleep
disorders atlas task force of the American sleep disorders association. Sleep
1992;15:174–84.
During the detection process, the whole recording is scanned and the state of advancement
of the analysis is monitored by means of a progress bar on the bottom of the window.
Arousal events detected are marked as "AReeg" events.
The "Event Analysis" window can be used for the analysis of these events.
7.6
Limb Movement Detection
This option performs an automatic detection of leg movements (LMs) recorded by
surface EMG from both tibialis anterior muscles.
When this option is selected from the Analysis menu, the following window appears. It
contains two sets of parameters which can be changed by the user.
© 2006 SWS Soft
48
HypnoLab User Manual
In the page "Detection Parameters" we must first select the channels containing the left
and right EMG from the dropdown lists; when at least one channel is selected, the Detect
button becomes active and the analysis can be started.
The automatic detection is performed by means of two threshold values which can be
changed by the user, for each side: the first is needed for the identification of the starting
point of the candidate LM, the second represents the value to which the average value of
the rectified EMG signal must return to for at least 0.5 second, in order to detect the end
of each candidate LM. Only candidates with a duration in the range indicated by the user
are marked as "LM-R" (right LM) or "LM-L" (left LM) events. This method has been
validated and the details of the detection process have been published in Ferri R, Zucconi
M, Manconi M, Bruni O, Miano S, Plazzi G, Ferini-Strambi L. Computer-assisted
detection of nocturnal leg motor activity in patients with Restless Legs Syndrome and
Periodic Leg Movements during sleep. Sleep 2005;28:998-1004.
The minimum and maximum LM durations and the parameters shown in the "PLM
Sequence Scoring" rectangle are passed on to the "PLM Overview" window which shows
up automatically at the end of the detection. In this area we can specify the minimum
number of LMs needed to define a periodic LM (PLM) sequence [Min PLM/sequence
(no.)], the minimum interval, in seconds, between consecutive PLMs [Min LM interval in
seq. (s)], the maximum interval, in seconds, between consecutive PLMs [Max LM interval
in seq. (s)], and the maximum interval, in seconds, between right and left LMs, in order to
be considered as a single LM [Max R/L interval (s)]. If the "Score PLM during Wake"
option box is checked, then also LMs occurring during wakefulness will be included in the
analysis.
The second set of parameters is shown if the tag "Advanced" is clicked. In this window it
is possible to choose the filter characteristics for each LM channel, separately, and the
sleep stages during which to perform the detection.
© 2006 SWS Soft
Analysis Menu
49
During the detection process, the whole recording is scanned and the state of advancement
of the analysis is monitored by means of a progress bar on the bottom of the window.
7.7
Frequency Event Detection
This option performs an automatic detection of any event which can be described in
terms of duration, amplitude and frequency.
When this option is selected from the Analysis menu, the following window appears. It
contains a set of parameters which can be changed by the user.
In the left upper part of this window, the user should choose the set of parameters
correlated with the desired range of duration, minimum amplitude and frequency band of
the events to detect. The parameters shown in this example are typical for the detection of
sleep spindles in the EEG.
Moreover, the user can choose a subset of epochs on which to perform the analysis, the
channel from the dropdown list and the label to assign to the events detected. Finally, the
user can choose to delete all the events of the same type already existing in the current
recording ("Delete existing events" option) and the sleep stages during which to perform
© 2006 SWS Soft
50
HypnoLab User Manual
the analysis ("Score Events during:" options).
The analysis can be started by clicking the Detect button.
If the label "BRUX" has been chosen, at the end of the detection process the "Bruxism
overview" window shows up automatically.
All other events which do not have a specific Overview Window in HypnoLab, after their
detection (manual or automatic), can be analyzed by means of the "Event Analysis"
window.
7.8
Apnea/Hypopnea Detection
This option performs an automatic detection of respiratory events.
When this option is selected from the Analysis menu, the following window appears. It
contains a set of parameters which can be changed by the user.
The user must choose the set of channels containing the signals needed for the analysis of
respiration during sleep from the dropdown lists (airflow, chest wall and abdominal
movements, oxymetry, and body position). For the body position channel, it necessary to
indicate the range of values expected for each position; the correct information about these
value should be obtained by the position transducer production company. The set of these
parameters can be saved by clicking the Store button and retrieved by clicking the Load
button.
Moreover, the user can edit a series of parameters related to the characteristics of
respiratory events to detect, in the right part of this window.
The analysis can be started by clicking the Detect button. The following events are
detected: obstructive apnea ("APobs"), central apnea ("APcen"), mixed apnea ("APmix"),
hypopnea ("Hypo"), and oxygen desaturation ("Desat").
At the end of the detection process the "Apnea Overview" window shows up
© 2006 SWS Soft
Analysis Menu
51
automatically.
7.9
Average Events
This option averages different epochs of a given set of channels synchronously with
the desired events and saves a new single-epoch EDF file.
When this option is selected from the Analysis menu, the following window appears. It
contains a set of parameters which can be changed by the user.
The user must choose the set of channels to average from the "Select Channels to
Average" area (to set all channels, click the "Select all channels" option).
The user must also indicate the starting time of the average epoch, with the zero at the
beginning of the events chosen by means of the dropdown list (max -30 s), the length of
the epoch to average (1-30 s), the sleep epoch from which to start the analysis and the end
epoch. Also the sleep stages during which to perform the analysis ("Average events
during:" options) can be selected.
This analysis is currently available also in the time domain and the frequency domain
option is not active.
The analysis can be started by clicking the Average button.
At the end of the averaging, the Save File dialog box is displayed. Type the new file name
(a ".ave" file extension will be automatically appended) and the EDF file will be saved.
This file can be subsequently analyzed by means of the "Average File Analysis" tool of
HypnoLab.
© 2006 SWS Soft
52
7.10
HypnoLab User Manual
Eye Movement Detection
This option performs an automatic detection of eye movements detected by means of
electrodes (2 channels).
When this option is selected from the Analysis menu, the following window appears. It
contains a set of parameters which can be changed by the user.
In the right upper part of this window, the user must choose the EOG channels from the
dropdown lists and the amplitude threshold for their detection; also the amplitude units
should be indicated (the user should pay attention to the units of these channels as they
can be mV or even V, depending on the recording system used; please refer to the "Signal
label area" in the "Main Page" help). Finally, the user can choose to delete all the events
of the same type already existing in the current recording ("Delete existing events"
option), the sleep epoch from which to start the analysis and the end epoch, and the sleep
stages during which to perform the analysis ("Score Events during:" options).
Note: this analysis works properly if EOG channels are recorded following the classical
rules described in: Rechtschaffen A, Kales A. A manual of standardized
terminology,techniques and scoring system of sleep stages of human subjects. Washington
Public Health Service. US Government Printing Office, 1968.
The analysis can be started by clicking the Start button. All events detected are marked
with the label "EM" on the channel selected in the EOG1 dropdown list.
At the end of the detection process the "Eye Movement Report" window shows up
automatically.
© 2006 SWS Soft
Reports Menu
8
Reports Menu
8.1
Sleep Macrostructure
53
This report displays a series of parameters obtained from the analysis of sleep stages
The top graph shows the hypnogram in a standard representation with the following sleep
stages, in descending order: Wakefulness (green), REM sleep (red), and sleep stages 1, 2,
3 and 4 (black thin line). Movement epochs (MT) are shown as blue short segments at a
level between Wakefulness and REM sleep.
Sleep Scoring Table
This table contains the following parameters:
TIB: time in bed, in minutes
SPT: sleep period time, from sleep onset to sleep end, in minutes
TST: total sleep time, SPT-wakefulness after sleep onset, in minutes
SOL: sleep onset latency, from recording start to sleep onset, in minutes
FRL: first REM latency, from sleep onset to the occurrence of the first REM period,
in minutes
Stage shifts/h: number of sleep stage shifts after sleep onset per hour
Awakenings/h: number of awakenings after sleep onset per hour
Movements/h: number of sleep epochs classified as MT after sleep onset per hour
Sleep efficiency%: TST/TIBx100
No. of REM periods: number of REM periods
WASO: wakefulness after sleep onset, minutes and percentage of SPT
S1, S2, S3, S4, SWS, REM, Undet.: sleep stages 1, 2, 3, 4, 3+4 (SWS), REM, and
Undetermined sleep after sleep onset, minutes and percentage of SPT and of TST
© 2006 SWS Soft
54
HypnoLab User Manual
On the bottom of this table there are 6 buttons:
Clicking this button causes the disappearance of the Sleep Macrostructure
Overview window and the appearance of the Sleep Macrostructure report which is a
RTF file containing all the parameters shown in this window. This report can be edited
and a comment can be typed. At the end, the report can be printed or saved. For more
information, see help on the HypnoLab built-in Report Editor.
This button copies into the system clipboard a copy of the image of the Sleep
Macrostructure Overview window.
This button copies into the clipboard all the values shown in the table, in a single
line, separated by tabs; in this way, these values can be easily passed on to a statistics
program.
This button copies into the clipboard the labels of all the values shown in the
table, in a single line, separated by tabs; in this way, these labels can be easily passed on
to a statistics program.
This button copies into the clipboard the text shown in the table.
With this button it is possible to print a copy of the Sleep Macrostructure
Overview window.
Finally, the different stages are draw as a colored pie chart in the right bottom corner of
this window.
8.2
Cyclic Alternating Pattern
This report displays a series of parameters obtained from the different Cyclic
Alternating Pattern (CAP) components analysis
The top graph shows the hypnogram in a standard representation with the following sleep
stages, in descending order: Wakefulness (green), REM sleep (red), and sleep stages 1, 2,
3 and 4 (black thin line). Movement epochs (MT) are shown as blue short segments at a
level between Wakefulness and REM sleep. Each CAP subtype is plotted as a short red
(A1), green (A2), or blue (A3) line overimposed to the hypnogram.
Time Distribution Histogram of CAP
The second graph shows the distribution histogram of the number of CAP-A1 subtypes
per 5-minute epoch, throughout the entire recording (white columns); also the number of
the CAP A2+A3 subtypes is shown in the same epochs (black columns). The scale of this
graph is shown on the left.
© 2006 SWS Soft
Reports Menu
55
CAP Analysis Table
The bottom half of this window is occupied by the Table reporting the results of the CAP
analysis of the current recording. A series of measures is listed which describe all
important parameters of CAP:
• Total number of A (phases): during the whole recording and for each NREM sleep
stage
• CAP Rate (time in min): CAP rate is defined as the percentage of time of NREM sleep
(and of each stage) occupied by CAP sequences (see below for the definition of CAP
sequences); also the CAP time is shown between brackets
• Total number of A1: during the whole recording (also the percentage of the total is
shown between brackets) and for each NREM sleep stage (together with their rate/hour
between brackets)
• Total number of A2: values shown as above
• Total number of A3: values shown as above
• A mean duration: total CAP-A phase mean duration, during the whole recording and
for each NREM sleep stage, in seconds
• A1 mean duration: values shown as above for CAP-A1 phase subtype; the last value of
this line represents the number of CAP-A1 phases/hour of NREM sleep (A1 index)
• A2 mean duration: values shown as above, for CAP-A2 phase subtype
• A3 mean duration: values shown as above, for CAP-A3 phase subtype
• B mean duration: values shown as above, for CAP-B phase
• B mean duration after: mean duration of CAP-B phases following each CAP-A phase
subtype
© 2006 SWS Soft
56
HypnoLab User Manual
• Cycle mean duration: values shown as above, for the entire CAP-A+B complex (cycle)
• Isolated A phases: number of total CAP-A phases not in sequences, followed by the
number (and percentage) of each CAP-A phase subtype not in sequences
• Sequences closed by: a sequence is formed by a series of CAP-A phases 2-60 seconds
apart from each other; the sequence starts with the onset of its first CAP-A phase and
stops at the beginning of its last CAP-A phase; in this line the number of sequences
stopped (closed) by each CAP-A phase subtype is shown
• Sequence mean duration: in seconds
• Number of sequences
• Cycles/sequence: average number of CAP cycles per sequence
• A phases in sequence: percentage of total CAP-A phases in sequences
• A Ratio Index: A newly proposed index monitoring the ratio between A1 and A2-+A3
CAP phase subtypes. A Ratio Index is calculated as follows:
If A1>(A2+A3) then
A ratio=A1/A total*(A2+A3) per minute
Else if A1<(A2+A3) then
A ratio=-(A2+A3)/A total*A1 per minute
Else
A1=(A2+A3) then A ratio=0
End if
On the right of this table there are 7 buttons:
Clicking this button causes the disappearance of the Cyclic Alternating Pattern
Overview window and the appearance of the CAP Floating Window.
Clicking this button causes the disappearance of the Cyclic Alternating Pattern
Overview window and the appearance of the Cyclic Alternating Pattern report which is
a RTF file containing all the parameters shown in the Cyclic Alternating Pattern
Overview window. This report can be edited and a comment can be typed. At the end,
the report can be printed or saved. For more information, see help on the HypnoLab
built-in Report Editor.
This button copies into the system clipboard a copy of the image of the Cyclic
Alternating Pattern Overview window.
This button copies into the clipboard all the values shown in the table on the left,
in a single line, separated by tabs; in this way, these values can be easily passed on to a
statistics program.
This button copies into the clipboard the labels of all the values shown in the table
on the left, in a single line, separated by tabs; in this way, these labels can be easily
passed on to a statistics program.
This button copies into the clipboard the text shown in the table.
© 2006 SWS Soft
Reports Menu
57
With this button it is possible to print a copy of the Cyclic Alternating Pattern
Overview window.
Below the right bottom corner of the table there are two buttons:
Quit to close the Cyclic Alternating Pattern Overview window.
Events to substitute the CAP Analysis table with the Events table.
Events Table
This table lists all CAP events in the recording; the following fields are reported for each
CAP event (A1, A2, or A3):
consecutive number
• No.
• Epoch
sleep epoch in which the event starts
• Start
start time
• Duration
in seconds
• Sequence sequence number to which the event eventually belongs ("0-iso" if the
event is isolated and does not belong to any sequence)
• Stage
sleep stage in which the event starts
© 2006 SWS Soft
58
HypnoLab User Manual
On the right of this table there are 2 buttons:
With this button it is possible to print a copy of the Cyclic Alternating Pattern
Overview window.
It is possible to select all or part of this table with the left button of the mouse and to
copy it into the clipboard by clicking this button.
8.3
PLM Overview
This report displays a series of parameters obtained from the analysis of leg
movements
This window shows the results of the computation of a series of parameters pertaining to
leg movements (LMs) recorded by surface EMG from both tibialis anterior muscles. Only
events marked as LM-R (right LM) or LM-L (left LM) are loaded and processed. The
graph on the top shows the hypnogram (if sleep staging is available) and each LM is
plotted as a short red (right LM) or blue (left LM) line overimposed to the hypnogram.
The table on the left shows all events loaded and processed with the following fields, in
order: consecutive number (No.), sleep epoch in which the event starts (Epoch), Start time
(Start), Duration (in seconds), Type (LM-R or LM-L), Sequence number to which the LM
eventually belongs ("iso" if the LM is isolated and does not belong to any PLM sequence,
"B" if the event is the second of a bilateral LM, and "NS" if the event has not been
scored), Sleep stage (Stage) in which the event starts, area under the curve (Area, in
units/second), Interval1 (in seconds, onset-to-onset interval from the previous scored LM),
Interval2 (in seconds, offset-to-onset interval from the previous scored LM). It is possible
to select all or part of this table with the left button of the mouse and to copy it into the
clipboard by clicking the
button next to the right bottom corner of the table.
© 2006 SWS Soft
Reports Menu
59
The parameters shown in the "PLM Sequence Scoring" rectangle specify the minimum
number of LMs needed to define a periodic LM (PLM) sequence [Min PLM/sequence
(no.)], the minimum interval, in seconds, between consecutive PLMs [Min LM interval in
seq. (s)], the maximum interval, in seconds, between consecutive PLMs [Max LM interval
in seq. (s)], and the maximum interval, in seconds, between right and left LMs, in order to
be considered as a single LM [Max R/L interval (s)].
Also the minimum and maximum duration of LMs to be included in the analysis are
specified and can be changed, [Min LM duration (s) ] and [Max LM duration (s) ].
If the "Score PLM during Wake" option box is checked, then also LMs occurring during
wakefulness will be included in the analysis.
It is possible to change all these parameters; however, it is needed to click the Rescore
button in order to recalculate all the results with the new parameters.
The table on the right shows the statistics of LMs loaded and processed. The top part
shows, for each stage, for NREM sleep and the total sleep period, total number of LMs
(Total) and Index (number/hour), total number of LMs in PLM sequences (seq.) and the
relative Index (number/hour), total number of isolated LMs (Isol.) and the relative Index
(number/hour), number of left, right and bilateral LMs.
For the Sequence Analysis, this table shows the number of PLM sequences (Seq. No.) and
the average number of LMs/sequence (Ev./Seq.), the mean Interval (in seconds) between
PLM sequences and SD (standard deviation), the mean PLM sequence Duration (in
seconds) and SD (standard deviation), and the mean Interval between PLMs (in seconds)
and SD (standard deviation).
The lowest part of this table shows the measurements pertaining to the area under the
curve and LM duration, for the right and left LMs and for those included into PLM
sequences or isolated. On the right bottom corner, the Periodicity Index is shown (number
of sequences of 3 intervals ≥10≤90 s/ total number of intervals).
Below the right bottom corner of this table there are 4 buttons:
Clicking this button causes the disappearance of the PLM Overview window and
the appearance of the PLM report which is a RTF file containing all the parameters
shown in the PLM Overview window. This report can be edited and a comment can be
typed. At the end, the report can be printed or saved. For more information, see help on
the HypnoLab built-in Report Editor.
This button copies into the clipboard a copy of the image of the hypnogram shown
above.
With this button it is possible to print a copy of PLM Overview window.
It is possible to select all or part of this table with the left button of the mouse and
© 2006 SWS Soft
60
HypnoLab User Manual
to copy it into the clipboard by clicking this button.
The left bottom part of the PLM Overview window shows some additional graphs and
results which can be seen clicking the relative tabs:
• Interval 1: histogram of Interval1 values from the table above the graph. Right clicking
this graph loads its values into the clipboard.
• Interval 2: histogram of Interval2 values from the table above the graph. Right clicking
this graph loads its values into the clipboard.
• Duration: histogram of Duration values from the table above the graph. Right clicking
this graph loads its values into the clipboard.
• Area: histogram of Area values from the table above the graph. Right clicking this
graph loads its values into the clipboard.
• Markov: results of the Markovian analysis of Interval1 values from the table above the
graph.
• Time distribution: histogram of the number of PLM (blue bars) or isolated LMs (grey
bars) per hour of sleep; also the cumulative curve is shown in the background.
8.4
FFT Overview
Choose this option to:
1
2
8.4.1
View Current FFT
Load from File a previously saved FFT analysis
View Current FFT
This report displays the results of the whole-night one-channel spectral analysis
This is an example of this report.
© 2006 SWS Soft
Reports Menu
61
The top graph shows the hypnogram in a standard representation with the following sleep
stages, in descending order: Wakefulness (green), REM sleep (red), and sleep stages 1, 2,
3 and 4 (black thin line). Movement epochs (MT) are shown as blue short segments at a
level between Wakefulness and REM sleep.
The remaining 10 graphs show the course of the different spectral bands along the whole
night. On the left, a label reports the main band parameters and the scale of the graph. The
user can change the scale with the up/down arrow tools on the right of each graph. Also
the type of graph can be changed from filled to outlined (and vice versa) by means of a
coloured small switch at the left of each graph.
The bottom right corner contains a series of buttons:
This button copies into the clipboard a copy of the image of the FFT Overview
window.
Clicking this button causes the disappearance of the FFT Overview window and
the appearance of the FFT Floating Window.
With this button it is possible to print a copy of the FFT Overview window.
Whit this button it is possible to save the results of the FFT analysis (they can be
loaded by means of the Load from File utility). This option creates an ASCII file with
the ".fft" extension.
The Graph/Table button switches from the graphs to the table of results (and vice versa),
as in the example below.
© 2006 SWS Soft
62
HypnoLab User Manual
This table reports all the results, epoch-by-epoch, and can be pasted (as a whole or only in
part) in the system clipboard; for this it is necessary to select the desired part (or the entire
table by clicking its left upper corner - the "Epoch" cell) and then to click the
in the right bottom corner of this window.
8.4.2
button
Load from File
To load an already saved FFT file, for the current recording
1
Select Reports Menu | FFT Overview | Load from File.
The Open File dialog box is displayed.
2
Browse your disk and select the desired file.
3
Click Open.
At this point, HypnoLab automatically displays the "FFT Overview".
© 2006 SWS Soft
Reports Menu
8.5
63
HRV Overview
Choose this option to:
1
2
8.5.1
View Current HRV
Load from File a previously saved HRV analysis
View Current HRV
This report displays the results of the whole-night HRV spectral analysis
This is an example of this report.
The top graph shows the hypnogram in a standard representation with the following sleep
stages, in descending order: Wakefulness (green), REM sleep (red), and sleep stages 1, 2,
3 and 4 (black thin line). Movement epochs (MT) are shown as blue short segments at a
level between Wakefulness and REM sleep.
The second graph from top shows the epoch average R-R interval along the whole
recording while the third graph from top shows the percentage of the HF band (in blue)
and that of the LF band (in red) along the whole night, calculated for each 5-minute period
(first 256 s used).
The table on the bottom reports all the parameters described in the "HRV analysis
© 2006 SWS Soft
64
HypnoLab User Manual
window" calculated for each 5-minute period. The last column reports the sleep stage
most represented in the 5-minute period, if no single sleep stage is present for more than
50% of the period, HypnoLab uses the label "Undefined" in this table.
The bottom right corner contains a series of buttons:
This button copies into the clipboard a copy of the image of the HRV Overview
window.
With this button it is possible to print a copy of the HRV Overview window.
Whit this button it is possible to save the results of the HRV analysis (they can be
loaded by means of the Load from File utility). This option creates an ASCII file with
the ".hrv" extension.
This table can be pasted (as a whole or only in part) in the system clipboard; for this it is
necessary to select the desired part (or the entire table by clicking its left upper corner the "Epoch" cell) and then to click the
window.
8.5.2
button in the right bottom corner of this
Load from File
To load an already saved HRV file, for the current recording
1
Select Reports Menu | HRV Overview | Load from File.
The Open File dialog box is displayed.
2
Browse your disk and select the desired file.
3
Click Open.
At this point, HypnoLab automatically displays the "HRV Overview".
8.6
PTT Overview
Choose this option to:
1
2
View Current PTT
Load from File a previously saved PTT analysis
© 2006 SWS Soft
Reports Menu
8.6.1
65
View Current PTT
This report displays the results of the whole-night PTT analysis
This is an example of this report.
The top graph shows the hypnogram in a standard representation with the following sleep
stages, in descending order: Wakefulness (green), REM sleep (red), and sleep stages 1, 2,
3 and 4 (black thin line). Movement epochs (MT) are shown as blue short segments at a
level between Wakefulness and REM sleep.
The second graph from top shows the epoch average PTT value along the whole
recording.
The columns of the table on the bottom report all the parameters described in the "PTT
analysis window" calculated for each sleep epoch. The last column reports the sleep
stage.
The bottom right corner contains a series of buttons:
This button copies into the clipboard a copy of the image of the PTT Overview
window.
With this button it is possible to print a copy of the PTT Overview window.
Whit this button it is possible to save the results of the PTT analysis (they can be
loaded by means of the Load from File utility). This option creates an ASCII file with
the ".ptt" extension.
© 2006 SWS Soft
66
HypnoLab User Manual
This table can be pasted (as a whole or only in part) in the system clipboard; for this it is
necessary to select the desired part (or the entire table by clicking its left upper corner the "Epoch" cell) and then to click the
window.
8.6.2
button in the right bottom corner of this
Load from File
To load an already saved PTT file, for the current recording
1
Select Reports Menu | PTT Overview | Load from File.
The Open File dialog box is displayed.
2
Browse your disk and select the desired file.
3
Click Open.
At this point, HypnoLab automatically displays the "PTT Overview".
8.7
Apnea Overview
This report displays the results of the apnea/hypopnea analysis
This is an example of this report.
© 2006 SWS Soft
Reports Menu
67
The graph on the top shows the hypnogram (if sleep staging is available) and the
occurrence of obstructive apnea is plotted as a short red line overimposed to the
hypnogram, central apnea are drawn in blue, mixed apnea in orange and hypopnea in
brown.
The second graph from top shows the body position, if this signal is available and was
used during the analysis. The third graph shows the respiratory effort and the last (fourth)
graph shows the level of oxygen saturation along the whole recording.
The table on the bottom reports a series of parameters related to the analysis of
respiration.
Below the right bottom corner of this table there are 4 buttons:
Clicking this button causes the disappearance of this window and the appearance
of the Apnea/Hypopnea report which is a RTF file containing all the parameters shown
in this window. This report can be edited and a comment can be typed. At the end, the
report can be printed or saved. For more information, see help on the HypnoLab built-in
Report Editor.
With this button it is possible to store into the system clipboard a copy of the
image of this window.
With this button it is possible to print a copy of the Apnea overview window.
It is possible to select all or part of this table with the left button of the mouse and
to copy it into the clipboard by clicking this button.
© 2006 SWS Soft
68
8.8
HypnoLab User Manual
Bruxism Overview
This report displays the results of the bruxism analysis
This is an example of this report.
The graph on the top shows the hypnogram (if sleep staging is available) and the
occurrence of each phasic event is plotted as a short red line overimposed to the
hypnogram, tonic evens are drawn in blue and the other in green.
The table on the left shows all events loaded and processed with the following fields, in
order: consecutive number (No.), sleep epoch in which the event starts (Epoch), Start time
(Start), Duration (in seconds), Type (phasic, tonic, or other), Sequence number to which
the event eventually belongs ("iso" if the event is isolated and does not belong to any
sequence), Sleep stage (Stage) in which the event starts, and area under the curve (Area, in
units/second).
It is possible to select all or part of this table with the left button of the mouse and to copy
it into the system clipboard by clicking the
the table.
button next to the right bottom corner of
The table on the right shows the statistics of events loaded and processed. The top part
shows, for each stage, total number of events (Total) and Index (number/hour), total
number of events in sequences (seq.) and the relative Index (number/hour), number of
phasic, tonic and other events, and mean amplitude.
For the Sequence Analysis, this table shows the number of sequences (Seq. No.) and the
© 2006 SWS Soft
Reports Menu
69
average number of events/sequence (Ev./Seq.), the mean Interval (in seconds) between
sequences and SD (standard deviation), the mean sequence Duration (in seconds) and SD
(standard deviation), and the mean Interval between events in sequences (in seconds) and
SD (standard deviation).
The lowest part of this table shows the measurements pertaining to the area under the
curve for phasic, tonic and other events, subdivided into those included into sequences or
isolated.
The user can change the minimum and maximum duration of phasic events (in seconds),
the maximum duration o phasic events (in seconds), the minimum number of phasic
events in a sequence and their maximum interval (in seconds); these new values are
utilized for the calculation of the parameters when the Rescore button is clicked.
Below the right bottom corner of this table there are 4 buttons:
Clicking this button causes the disappearance of this window and the appearance
of the Bruxism report which is a RTF file containing all the parameters shown in this
window. This report can be edited and a comment can be typed. At the end, the report
can be printed or saved. For more information, see help on the HypnoLab built-in
Report Editor.
With this button it is possible to store into the system clipboard a copy of the
image of this window.
With this button it is possible to print a copy of the Bruxism overview window.
It is possible to select all or part of this table with the left button of the mouse and
to copy it into the clipboard by clicking this button.
8.9
Eye Movement Report
This report displays the results of the eye movement analysis
This is an example of this report.
© 2006 SWS Soft
70
HypnoLab User Manual
The graph on the top shows the hypnogram (if sleep staging is available) and the
occurrence of each event is plotted as a short blue line overimposed to the hypnogram.
The table on the left shows all events loaded and processed with the following fields, in
order: consecutive number (No.), sleep epoch in which the event starts (Epoch), Start time
(Start), Amplitude (in channel units), Sequence number to which the event eventually
belongs ("iso" if the event is isolated and does not belong to any sequence), and Sleep
stage (Stage) in which the event starts.
It is possible to select all or part of this table with the left button of the mouse and to copy
it into the system clipboard by clicking the
the table.
button next to the right bottom corner of
The table on the right shows the statistics of events loaded and processed. The top part
shows, for each stage, total number of events (Total) and Index (number/hour), total
number of events in sequences (seq.) and the relative Index (number/hour), total number
of isolated events (Isol.) and the relative Index (number/hour), mean interval between
events, and mean amplitude.
The user can change the maximum interval between events (in seconds) and the minimum
number of events in a sequence; these new values are utilized for the calculation of the
parameters when the Rescore button is clicked.
Below the right bottom corner of this table there are 4 buttons:
Clicking this button causes the disappearance of the Eye Movement Report
window and the appearance of the Eye Movement report which is a RTF file containing
all the parameters shown in this window. This report can be edited and a comment can
be typed. At the end, the report can be printed or saved. For more information, see help
on the HypnoLab built-in Report Editor.
© 2006 SWS Soft
Reports Menu
71
With this button it is possible to store into the system clipboard a copy of the
image of this window.
With this button it is possible to print a copy of the Eye Movement Report
window.
It is possible to select all or part of this table with the left button of the mouse and
to copy it into the clipboard by clicking this button.
© 2006 SWS Soft
72
HypnoLab User Manual
9
Tools Menu
9.1
Event Analysis
There are two pages in this window.
Single Event Page - This option provides a tool to perform some statistical analysis
of one type of events.
When this option is selected, the following window appears.
The user must first select the type of events to be analyzed from the dropdown list
"Choose Event" in the "Event Sequence Scoring" area; in the same area, also the
maximum interval between events (in seconds) and the minimum number of events in a
sequence should be specified.
Then, this window shows the results of the computation of a series of parameters
pertaining to the chosen event. The graph on the top shows the hypnogram (if sleep
staging is available) and the occurrence of each event is plotted as a short blue line
overimposed to the hypnogram.
The table on the left shows all events loaded and processed with the following fields, in
order: consecutive number (No.), sleep epoch in which the event starts (Epoch), Start time
(Start), Duration (in seconds), Type, Sequence number to which the event eventually
© 2006 SWS Soft
Tools Menu
73
belongs ("iso" if the event is isolated and does not belong to any sequence), and Sleep
stage (Stage) in which the event starts.
It is possible to select all or part of this table with the left button of the mouse and to copy
it into the system clipboard by clicking the
the table.
button next to the right bottom corner of
The table on the right shows the statistics of events loaded and processed. The top part
shows, for each stage, for NREM sleep and the total sleep period, total number of events
(Total) and Index (number/hour), total number of events in sequences (seq.) and the
relative Index (number/hour), total number of isolated events (Isol.) and the relative Index
(number/hour), mean duration, and mean inter-event interval.
For the "Sequence Analysis", this table shows the number of event sequences (Seq. No.)
and the average number of events/sequence (Ev./Seq.), the mean Interval (in seconds)
between event sequences and SD (standard deviation), the mean event sequence Duration
(in seconds) and SD (standard deviation), and the mean Interval between events (in
seconds) and SD (standard deviation).
It is possible to delete all events of that type present in the recording by clicking the
Delete Events button.
Below the right bottom corner of this table there are 3 buttons:
Clicking this button causes the disappearance of the Event Analysis window and
the appearance of the Event Analysis report which is a RTF file containing all the
parameters shown in this window. This report can be edited and a comment can be
typed. At the end, the report can be printed or saved. For more information, see help on
the HypnoLab built-in Report Editor.
With this button it is possible to print a copy of the Event Analysis window.
It is possible to select all or part of this table with the left button of the mouse and
to copy it into the clipboard by clicking this button.
Finally, in the right bottom corner, the
copy of the image of this window.
button copies into the system clipboard a
Association Analysis Page - This option provides a tool to perform some
statistical analysis of the association between two types of events.
When this option is selected, the following window appears.
© 2006 SWS Soft
74
HypnoLab User Manual
The user must first select the type of events to be analyzed for association from the
dropdown lists "Choose Event Type 1" and "Choose Event Type 2" in the "Association
Scoring" area; in the same area, also the minimum and maximum intervals between events
(in seconds) should be specified.
At this point, it is possible to proceed by clicking the Score Association button. Then,
this window shows the results of the computation of a series of parameters pertaining to
the time association of the chosen events. The graph on the top shows the hypnogram (if
sleep staging is available) and each event type is plotted as a short blue (event type 1) or
red (event type 2) line overimposed to the hypnogram.
The table on the left shows all events loaded and processed with the following fields, in
order: consecutive number (No.), sleep epoch in which the event starts (Epoch), Start time
(Start), Duration (in seconds), Type, "ass" if the event is associated with the preceding or
following event ("iso" if the event is isolated, i.e. not associated), and Sleep stage (Stage)
in which the event starts.
It is possible to select all or part of this table with the left button of the mouse and to copy
it into the system clipboard by clicking the
the table.
button next to the right bottom corner of
The table on the right shows the statistics of events loaded and processed. The top part
shows, for each sleep stage and the total sleep period, total number of type 1 events (Tot1) number of isolated type 1 events (Iso-1), percentage and number of type 1 events
associated with type 2 events (Ass-% and Ass-n), number of isolated type 2 events (Iso-2),
total number of type 2 events (Tot-2), and the mean interval between associated events.
© 2006 SWS Soft
Tools Menu
75
Below the right bottom corner of this table there are 3 buttons:
Clicking this button causes the disappearance of the Event Analysis window and
the appearance of the Event Analysis report which is a RTF file containing all the
parameters shown in this window. This report can be edited and a comment can be
typed. At the end, the report can be printed or saved. For more information, see help on
the HypnoLab built-in Report Editor.
With this button it is possible to print a copy of the Event Analysis window.
It is possible to select all or part of this table with the left button of the mouse and
to copy it into the clipboard by clicking this button.
Finally, in the right bottom corner, the
copy of the image of this window.
9.2
button copies into the system clipboard a
Average File Analysis
This option provides a tool to evaluate and measure waveforms stored in an average
file (.ave).
When this option is selected, the following window appears.
The user must first open an .ave file recorded with HypnoLab (see "Average Events")
© 2006 SWS Soft
76
HypnoLab User Manual
1
2
3
Select File | Open. The Open File dialog box is displayed.
Browse your disk and select the desired file.
Click Open.
Note: the .ave files contain only one epoch, representing the average of many epochs.
The file is displayed in a window similar to the main signal area; however, there is a
limited number of operation possible:
These buttons are used to increase or decrease the amplitude of all channels.
This button inverts the polarity of all channels.
With this button it is possible to print a copy of the Average File Analysis window.
With this button it is possible to store into the system clipboard a copy of the
image of this window.
The user can click on any point of the channel window and draw a line to another point of
the same channel. This causes the appearance of a line with start and stop points. If they
are in the desired positions, the user can click the Add to List button and HypnoLab
reports in the list on the right the latency (from the beginning of the epoch) and the
amplitude of both points; in addition, the difference in latency and amplitude between
these points is reported. The blue line with "start" and "stop" points is substituted by a red
line and the starting point is indicated with a letter followed by the digit "1" while the stop
point is indicated by the same letter and the digit "2".
This can be repeated up to 18 times.
It is possible to select all or part of this table with the left button of the mouse and to copy
it into the clipboard by clicking this button
situated below it.
The content of the table can be deleted by clicking the Clear List button.
The user can open an additional .ave file recorded with HypnoLab (see "Average
Events") with the same set of channels, for comparison.
1
2
3
Select File | Compare Files. The Open File dialog box is displayed.
Browse your disk and select the desired file.
Click Open.
This new file is drawn over the existing waveforms.
© 2006 SWS Soft
Tools Menu
9.3
77
Movie Player
To open an .avi file in HypnoLab
1
Select Tools | Open Movie Player.
The following dialog box is displayed in the right bottom corner of the main
program window.
2
Clicking
the desired file.
, the Open File dialog box is displayed. Browse your disk and select
3
To rewind to the beginning of movie file.
4
To go to the end of the movie file.
5
Play.
6
Pause.
7
Previous frame.
8
Next frame.
9
Stop.
10
© 2006 SWS Soft
Click the Close button to close the HypnoLab built-in movie player.
78
10
HypnoLab User Manual
? Menu
Enter topic text here.
10.1
Help on HypnoLab
This option opens the on-line help on HypnoLab.
10.2
Key S/N
This option opens the HypnoLab hardware key information window.
The hardware key is a programmable memory device providing the responses required to
© 2006 SWS Soft
? Menu
79
unlock the software. Without this key HypnoLab does not run; please take care of the key
as you will need to buy the whole system package again in case of loss or damage.
10.3
About HypnoLab
This option opens the About HypnoLab information window.
The System info... button opens the Windows System Information utility.
© 2006 SWS Soft
80
HypnoLab User Manual
11
Additional Items
11.1
FFT Floating Window
This window displays the results of the whole-night one-channel spectral analysis
This is an example of this window.
The top graph shows the hypnogram in a standard representation with the following sleep
stages, in descending order: Wakefulness (green), REM sleep (red), and sleep stages 1, 2,
3 and 4 (black thin line). Movement epochs (MT) are shown as blue short segments at a
level between Wakefulness and REM sleep.
The remaining 10 graphs show the course of the different spectral bands along the whole
night. On the left, a label reports the main band parameters and the scale of the graph.
This window can be accessed only from the FFT Overview Window and has a very
similar aspect but much smaller; all the graphs are drawn with the last parameters set in
such a window.
The user can resize the height of the FFT Floating Window in order to include the
desired number of graphs; only the hypnogram is always shown, at the top. The user can
displace this window in any point on the screen and it can be useful, as an example, when
scoring manually sleep.
Finally, the user can click any point of the graphs contained in this window; in this case,
the main signal area will automatically display the corresponding epoch.
© 2006 SWS Soft
Additional Items
11.2
81
CAP Floating Window
This window displays the occurrence of the Cyclic Alternating Pattern (CAP)
components.
This is an example of this window.
The top graph shows the hypnogram in a standard representation with the following sleep
stages, in descending order: Wakefulness (green), REM sleep (red), and sleep stages 1, 2,
3 and 4 (black thin line). Movement epochs (MT) are shown as blue short segments at a
level between Wakefulness and REM sleep. Each CAP subtype is plotted as a short red
(A1), green (A2), or blue (A3) line overimposed to the hypnogram.
The second graph shows the distribution histogram of the number of CAP-A1 subtypes
per 5-minute epoch, throughout the entire recording (white columns); also the number of
the CAP A2+A3 subtypes is shown in the same epochs (black columns). The scale of this
graph is shown on the left.
This window can be accessed only from the "Cyclic Alternating Pattern Overview"
window and basically shows, in a much smaller size, the top 2 graphs of such a window.
The user can not resize the CAP Floating Window; however, this window can be
displaced in any point on the screen.
Finally, the user can click any point of the graphs contained in this window; in this case,
the main signal area will automatically display the corresponding epoch.
11.3
Report Editor
This utility allows the user to edit some reports containing the results of different
analyses carried out by HypnoLab
The HypnoLab built-in Report Editor is shown in the following figure.
© 2006 SWS Soft
82
HypnoLab User Manual
This editor opens files in rich text format (.RTF) which are stored in the folder
"...\Program Files\SWS Soft\Hypnolab\RTF-models". These files contain a template of
different reports, referring to different analyses carried out by HypnoLab and contain
specific "words" which are automatically substituted by the corresponding numeric values
at opening. These models can be edit in order to include, as an example, the user specific
stationary etc. It is also possible to organize data in a different order. However, it is
recommended that this operation be carried out by an expert and that a copy of the
original files is saved elsewhere before modifying them.
The tool bar on the top offers all the most common tools for modifying text. The bottom
right corner contains a series of buttons:
With this button it is possible to print a copy of the report.
Use this button to load a previously saved report (.rtf).
Use this button to save the report.
© 2006 SWS Soft