1
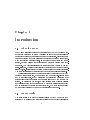
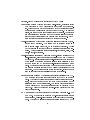
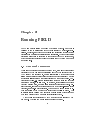
FIELD User Reference Manual
Steven P. Reiss
Brown University
Department of Computer Science
Box 1910 Providence, RI 02912
(401)-863-7641 [email protected]
September 17, 1991
Abstract
FIELD (Friendly Integrated Environment for Learning and Development) is an integrated programming environment for UNIX. It is based
on a simple but powerful integration mechanism that allows a wide variety
of tools to interact to assist the user in constructing and debuging UNIX
programs. The tools include editors, debuggers, cross-referencing, proling, conguration management, data structure display, call-graph display,
and informative viewers. This document describes how to use FIELD, both
for casual users and for sophisticated users who want to tailor it to their
specications.
Chapter 1
Introduction
1.1 What is FIELD
FIELD is an integrated programming environment for UNIX programming.
It has been developed at Brown University as part of an ongoing research
project into programming environments and workstations. Its development
has been directed for three uses: as the principal programming environment for teaching undergraduates, as a programming environment for research, and as a testbed for developing new tools for programming environments. The rst use requires that the environment be easy to use and
\user-friendly". The second requires that the environment handle moderatesized (100,000-line) systems that span multiple les in multiple directories.
The third requires that the environment be exible and easily extensible.
These goals are achieved by oering a rich set of tools based on the UNIX
programming environment, by providing a common graphics-oriented front
end to all these tools, and by developing an integration mechanism that
allows these tools to cooperate and makes it easy to add new tools to the
system. In developing the tools, we used existing tools wherever possible
and integrated them into our framework by providing a reasonable front end
and an interface to the rest of the environment. The front ends are based
on the current version of the Brown Workstation Environment.
1.2 FIELD Tools
The tools chosen to be part of the initial version of FIELD come both from
existing UNIX tools and from software developed at Brown for other research
1
projects. Below we describe the current set of FIELD tools:
Annotation Editor This is a complete mouse-oriented, extensible editor
with knowledge of C and Pascal syntax for program and other editing. It is augmented with an annotation window that allows arbitrary
annotations to be associated with each line of the le. The user can
create, remove and query annotations through the editor. Annotations
are the integration mechanism that FIELD uses to relate the program
source to all other aspects of the programming environment. FIELD
allows multiple annotation editors to be active at one time.
Cross-Referencer This program collects a relational database of information about a system. The system can be specied either as a
set of source les, a binary le, or as a directory hierarchy. Access
to the database is provided through a relational calculus query language. Current relations include references, denitions, calls, functions, macros, and scopes.
Cross-Reference Interface This oers a menu-oriented interface to the
cross-referencer, allowing most simple queries to be made by lling in
a dialog box. It also integrates the cross-referencer into the remainder
of the system by allowing the user to select a listed reference to look
at in an editor and by handling cross-reference queries from other
tools. Editors can use this facility to provide commands based on
the program contents such as nd and display the declaration of this
procedure. The debugger can use this to provide high-level commands
such as set breakpoints at all assignments to this variable.
Data Structure Display The data structure display facilities of the GARDEN environment ] have been incorporated into FIELD as a pair of
tools. The rst tool displays an arbitrary user data structure graphically, allowing the user to pan and zoom over the display and to
selectively show more or less detail. The second tool allows users to
quickly describe how the data structure should be displayed by the
rst tool. These two tools allow natural-looking displays of complex
user data structures.
DDT Debugger This is an interface to the system debugger (e.g. dbx
on a Sun). It provides an extended dbx-like user interface as well
as an internal, message-based interface for other tools in the environment. The use of a separate debugger interface allows FIELD to be
2
more easily ported to other systems, to provide a consistent debugger language across systems, and to allow new commands to be more
easily incorporated into the debugger. The use of a message interface
allows dierent, machine-independent debugging languages to be incorporated into the system at a later date. Multiple DDT debuggers
can be run on separate user processes simultaneously using FIELD.
Debugger Interface This is a graphical, button-oriented front end to the
DDT debugger. It allows new buttons to be easily created and used.
It provides a full transcript of the debugging session. Program input
and output can be displayed here or in a separate window.
Flowview This is a tool that displays a hierarchical call graph, allowing
the user to interactively select the areas of interest and to setup the
display accordingly. It interacts with the rest of the system to allow the
owgraph to be used to identify routines and to highlight execution.
Make Interface This is a menu-oriented interface to the UNIX make pro-
gram. ] By building it on top of make, it is possible to oer many
of the extensions that exist in dierent versions of make as well as
incorporating tools such as automatic dependency analysis. This interface is responsible for performing compilations when requested and
for informing editors of errors.
Proler Interface This is a graphical interface to a slightly extended ver-
sion of the Berkeley UNIX gprof command. ] The extensions to gprof
include making it interactive and providing timing information about
les and lines as well as about functions. The graphical interface allows the user to selectively view the large amount of information that
the proler normally produces.
Viewer This is a general facility that allows viewing dierent aspects of
a system. Currently, viewers exist for the run-time stack, for variables and expressions being traced, and for debugger events such as
breakpoints.
1.3 An Example
An example view of the FIELD environment is shown in gure 1. The
window in the upper left is the control panel. It contains icons (currently
3
Figure 1.1: A view of the FIELD environment.
4
old English letters) for the various views and windows that can be dened.
Below this is the debugger interface window. The bulk of this window is
a transcript of the debugging session. Below this transcript are buttons
for debugger commands. Underneath the debugger interface window is an
annotation editor displaying the source le. There are three annotations
displayed for the one line of text, an arrow indicating the currently executing
line, eyeglasses representing the current debugger focus, and a stop sign
indicating a breakpoint. The window in the upper right of the display
shows a view of the program's data structure. The sample program here
does tree insertion, and the tree is displayed in its current state. The dark
triangles represent empty subtrees. Below this on the left is a stack viewer.
This displays the current function and line being executed as well as the
contents of the local variables at this point. The window next to this is a
cross-reference viewer. It is displaying the result of a query asking for all
calls to the function insert tree. Finally, the window at the bottom right is
the make interface. This is currently displaying information about building
the system being run.
5
Chapter 2
Running FIELD
FIELD is a exible system composed of a variety of tools. Each tool is
designed to run in a separate window that is created by a higher-level interface. Moreover, each tool communicates and interacts with all the other
tools running on a single workstation as a single user. This modular design
provides a great deal of exibility in conguring the FIELD environment,
with the actual conguration for each run determined by the command name
and arguments.
2.1 Command Parameters
There are two principal means for running FIELD, as a set of independent
tools each of which has its own process and each of which is invoked from a
UNIX shell by the programmer, or as a single system with a control panel
listing all the available tools where the programmer invokes tools by making
appropriate selections from the icons displayed on the control panel. Combinations of these, i.e. using a single system for some tools and invoking
others from a shell, will also work. In addition, it is possible to congure
(through programming, not as a user) various combinations of tools. Several tool pairs, such as the debugger along with a debugger-sensitive editor
(dbgview), are built-in congurations. The command meadow is used to invoke the version of FIELD used with introductory courses at Brown. This
is a single system version with simplied options chosen throughtout and
with some default window management strategies built in.
All of these congurations of FIELD are invoked as standard UNIX
commands. The valid commands are summarized in table 1.
6
Command
aedit
annotddt
annotedit
annotview
build
dbg
dbgview
display
disptype
eld
owview
fprof
transcript
typeedit
userio
viewevent
viewstack
viewtrace
xref
xrefview
Description
Simple editor without annotations
Debugger-sensitive annotation editor
Standard annotation editor
Sensitive annotation editor
Make interface
Debugger interface
dbg and annotddt in a single tool
Data structure display
Data structure display with a type editor
Full environment with a control panel
Call graph display
Proling interface
Make transcript viewer
Type editor for data structure display
Window for program input and output
Breakpoint viewer
Run time stack viewer
Traced variable viewer
Cross reference interface
Cross reference interface with an editor
Table 2.1: Summary of commands
7
Option
-help
-THREADS
-window
-demo
-to le
-from le
-stack size
-prior priority
-DEBUG
Meaning
Provide short summary of options
Use lightweight processes
Run in a single window (full screen)
Run in a single window (user-denable)
Save transcript of run in given le
Use previously saved transcript
Set stack size for threads
Set priority for threads
Create a msg.trace debugging le
Table 2.2: FIELD-specic options
The command format is
command options] name altname]]
where the name and the alternate name are interpreted accorting to the
command and where the options are either FIELD-specic or X11-related.
The FIELD-specic options are shown in table 2. The X11-related options
are shown in table 3.
When invoking one of the FIELD editors, aedit, annotddt, annotedit, or
annotview, the name is interpreted as the le to edit. When invoking one
of the debugger tools, dbg or dbgview the name is the system to debug and
the alternate name is the core le to debug with. The second name here
is optional. For the system-oriented tools, build, owview, fprof, xref and
xrefview, the name is the system to work with. For the data structure display
tools display and disptype the name is the name of the data structure to
display. For the data structure type editor, the name is the name of the type
to edit. Finally, for general tools including userio, viewevent, viewstack, and
viewtrace, the name is ignored. For the complete system command eld, if
the rst name is a source le then an initial annotation editor tool is opened
on that source le. Otherwise, if one or two names are given they are
interpreted as a system and core le name and an initial debugger interface
and debugger-sensitive annotation editor are started. This is summarized
in table 4.
8
Option
-background color
-bd color
-bg color
-display name
-fg color
-fn font
-font font
-foreground color
-geometry specication
+query
-rv
-synchronous
Meaning
Background color
Border color
Background color
Set display to run on
Foreground color
Default font
Default font
Foreground color
Specify default geometry
Don't query user for position
Run in reverse video
Run X11 in debugging mode
Table 2.3: X11-specic options
2.2 Resource Files
FIELD allows users to tailor the environment to suit their needs. This
is generally done through a combination of environment variables, an X11
database le, and AUXD les. AUXD is a Brown Workstation Environment
package that provides hierarchical resource management. Many of the packages of FIELD use an AUXD le to describe their default behavior. While
standard les exist for each package, users are free to redene these for their
own purposes. The environment variables use by FIELD are summarized
in table 5. The X11 resource database can contain any of the X11-related
options dened in table 3. Separate denitions for each tool are dened as
toolname*option: value
Denitions with a toolname of eld will apply to all tools unless otherwise
overriden if the full environment is run. The denition of the various AUXD
les is given in the appropriate chapter of this manual for the various tools.
9
Command
aedit
annotddt
annotedit
annotview
build
dbg
dbgview
display
disptype
eld
Name
File to edit
File to edit
File to edit
File to edit
System to make
System to debug
System to debug
Variable to display
Variable to display
Source le to edit
System to debug
owview System to display
fprof
System to prole
transcript System to make
typeedit Type to edit
userio
|
viewevent |
viewstack |
viewtrace |
xref
System to cross-reference
xrefview System to cross-reference
Alternate Name
|
|
|
|
|
Core image
Core image
|
|
|
Core image
|
|
|
|
|
|
|
|
|
|
Table 2.4: Use of name arguments by command
10
Variable
ANNOT AUXD
ANNOT EDIT
ARCH
BUILD RULES
DBG AUXD
DDT INIT
DDT DEBUG
FIELD DIR
FIELDRC
HOME
PRO
SHELL
Contents Default
lename
string
annotedit
name
lename
lename
lename
lename
lename
lename
lename
name
/bin/csh
Function
Annotation editor AUXD le
Default annotation editor
Architecture name (i.e. sun4)
Default make denitions
Debugger interface AUXD le
Initial debugger commands
Produce ddt.trace if set
Directory containing FIELD
X11 resource le
User's home directory
Directory containing FIELD
User's preferred shell
Table 2.5: Environment variables used by FIELD
11
Chapter 3
Control Panel
The normal way of running the FIELD environment is to run the full environment with a control panel and then to select the desired tools. This is
the command eld. When FIELD is run in this manner, it uses the WIND
window manager from the Brown Workstation Environment. This causes
all windows to be surrounded by a title bar and set of buttons. These can
be used to control the placement of the window in conjunction with the
underlying X11 window manager. They can also be used in place of an X11
window manager.
The control panel window allows users to select the FIELD tools they
want to view. An example control panel is shown in gure 2. This window
consists of several parts. The top and bottom line represent the window
manager aspect (WIND) and can be used to control the placement of the
window in conjunction with the underlying X11 window manager. The
second line at the top represents a pull-down menu. Finally the large central
portion contains icons representing the dierent available tools. These are
all described below.
The upper-left hand corner of the window contains a move icon. This
region can be used to reposition the window on the display. It is activated by
pushing down any mouse button in the region, dragging to establish the new
position, and then releasing the mouse button. A skeleton of the window
(i.e. a rectangle representing its border), will be drawn during the dragging
process to show the resultant location. Moving a window has the side eect
of raising it to the top of the viewing stack. A tap of any mouse button in
this region (i.e. a quick down/up without moving the mouse) will cause the
window to be raised to the top without being moved.
12
Figure 3.1: Sample Control Panel.
The other three corners of the window contain a size icon. The corresponding regions can be used to resize the window, changing the position of
the selected corner while holding the position of the directly opposite corner
xed. These are activated by clicking down in the appropriate region, dragging the mouse until the window is sized appropriately, and then releasing
the mouse button. Any mouse button can be used. A window skeleton is
again drawn during the dragging process to show the resultant size. If the
window is resized too small, then the resize command is ignored. Resizing
a window has the side eect of raising it to the top of the viewing stack. A
tap of any mouse button in a size region will cause the window to be raised
to the top without being resized.
The central area at the top of the window is the title bar. It contains the
window name and will dier from tool to tool. Tapping the mouse in this
area will raise the window clicking the mouse and dragging it will move the
window. The region at the bottom between the two size icons contains other
window buttons. The button labeled Remove is used to remove the window.
If it is clicked on with a normal mouse button, the window is made iconic,
with the icon being placed on the control panel. If it is clicked on with a
shifted mouse button, then the window is completely removed. The button
labeled Push in this region lowers the window to the botton of thefvisibility
13
stack. Finally, clicking in the region between these two buttons is equivalent
to popping the window.
The middle of the control panel window contains icons both for new tools
and for tools that have been iconied. Clicking on a generic icon here will
initiate a request for a new window for the corresponding tool. With most
window managers, this will result in the user being asked to locate and size
the new window. Once the window has been created, the tool will be run
within it. If a window is made iconic using its Remove button, then its icon
will be placed in this panel with the title of the window as the underlying
text. Clicking on such an icon will cause the window to be made visible in
its previous location at its previous size.
In addition to this panel area, the control panel contains two pull-down
menus, labeled Commands and UNIX respectively. The commands menu
contains ve buttons: Help, Mouse Help, Refresh, Directory, and Quit. The
Help button causes a help window to be created. Such a window will also be
created automatically if none exists and the user asks for help using the help
key. The Mouse Help button creates a mouse help window. This window
will dynamically display the function of the mouse buttons depending on the
current locator position. The Refresh button executes an xrefresh command
in background, causing all the windows on the display to be refreshed. The
Directory command causes a dialog box to be popped up to allow the user to
view or change the current working directory. Note that the current working
directory is the same for all eld tools, changing it in any one tool (such
as here) will change it for all tools currently talking to the same message
server. Finally, the Quit command will cause FIELD to exit.
14
Chapter 4
DBG: Debugger Interface
Here we describe the debugger, etc.
15