1
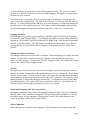
the stack display will automatically update itself.
Click on the viewstack icon from the Control Panel. A window similar to the one shown in
Figure~\ref{viewstack1} should appear.
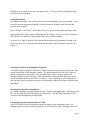
Set a breakpoint at the first line of the function main.
Choose run from the debugger buttons to execute until the first breakpoint.
The stack viewer should have been updated and the new view should look like
Figure{viewstack2}. Each function call entry on the stack is offset by a number representing
the stack level. The highest number appears at the top of the screen and represents the current
procedure that is executing. Each stack entry also includes the parameters to the function in
parenthesis and the line number and source file that the function is defined in followed by a list
of the values of any local variables.
Choose step from the debugger buttons and an entry in the stack should be produced for the
function call to create\_new\_item. The stack will continue to be automatically updated as the
program runs.
Mention that individual tools can be used.
io.e flowview counter.
Page 19
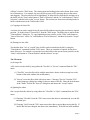
Click the middle mouse button in the lower tile to highlight it. Choose Pointer from the Edit
menu and then click on the word next in the column to the right of the display. The window
should now look like Figure{finished_edit}.
Save the new display for the linked list by choosing Save from the File menu. To make the
display window reflect the new display method, choose Update from the Display menu of the
list\_head display. The resulting linked list should look something like Figure
~\ref{final_var_disp}.
For efficiency reasons, the display graphics do not update themselves automatically, but you can
add update annotations at lines of code where the variable changes. To do this, open annotedit
session on sorter.c. Set the annnotation type to UPDATE. Click the left mouse button in the
annotation column to the left of line 30 of sorter.c. Choose continue from the debugger buttons
and enter values when the program prompts you. The graphics display should update itself
automatically after the new value is added to the list.
Appendix B:
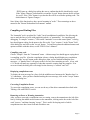
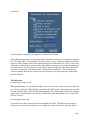
Choose the Help button from the Commands menu of the Control Panel.
Figure{help_window_top_level} shows the help window that should be
displayed.
The HELP Information tool of FIELD provides online documentation for the user.
The two paneled windows beneath the title HELP Information contain a list of
the topics which online help documentation is available for. The small window
below the topics displays the name of the help information that is being currently
displayed. The scrolling window below that is the actual help information.
Click on control from the topics list to see the help for the Control Panel.
The help information for the Control Panel is divided into topics.
Each of these help topics represents a FIELD tool.
For other help information windows, the topics describe the menu buttons or other
features that are available.
Choose dbg from the topics list to see a description of what the debugging tool does.
Choose \verb|^^|control from the topics list to get back to the control panel help
window.
Choose \verb|^^|field from the topics list to return to the field help window.
Displaying Program Stack with viewstack
The program stack represents the function calls that a program has made. As the program runs
Page 18
representing count yello. If the item is redefined in the child, the children will color their lines
in blue. For example, if the parent class has a virtual function called hello which is redefined by
the children, the children will color their lines blue when the parents line is selected. This may
seem a bit confusing, so one should definitely load up a program more complex than counter
and play around with these characterisitcs until they are well understood.
Once you understand what the various colors mean, one can use cbrowse to get a detailed view
of the class structure of large programs, and one can frequently use it to track down errors made
when coding class structures.
go over how colors are used in parents of selected items.
see meadow stuff for desciption of this.
Displaying Data Structures with typeedit and display
FIELD can graphically display the values of variables. This is especially helpful for viewing
high level data structures, such as linked lists and trees.
Displaying a Variable with the display Tool
Open a debugging session on sorter and add a few values to the list. Press the Stop debugger
button while the program is waiting for input to discontinue execution. Choose display from the
control panel. A dialog box will appear asking for the name of the variable to display. Enter
list\_head in the Variable field. A picture similar to the one in Figure~\ref{default_layout}.
This is called the default display.
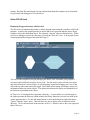
Changing How a Variable is Displayed with the typeedit Tool
Click on the typeedit icon. A dialog box should prompt for the type to be edited. In the Type
field, enter struct list\_item\_t * and choose the accept
button. A window similar to the one in Figure{default_dis} should appear.
Choose Default from the Top menu to see how the default view is displayed.
Choose Clear from the file menu to erase the default display and start a customized one.
Make the new display a tiled object, by choosing Tiled from the Top menu. This tells the editor
that the C type can be represented as a rectangle divided into several different subregions called
tiles.
Press down on the mouse in the upper left corner of the large rectangular white region and drag
it to make a tile the width of that region. Make another tile like it directly below. The resulting
view should look like Figure{empty_tiled}.
Click the middle mouse button in the upper tile to highlight it. Choose box from the Edit menu
and then click on the word value in the column to the right of the display.
Page 17
Trace Display: Select this option if you would like flowview to
animate the execution of your program.
Tracing Values of Variables with viewtrace
The viewtrace tool allows the user to monitor the values of a variable. Each time the variable is
changed, and program execution stops, the viewtrace display is updated.
Open a debugger session on sorter.
Click on the viewtrace icon on the control panel.
Choose the Options button from the View menu. A dialog box should ask for the name of the
variable to trace. Enter change_ in the Variable field of the dialog box and click on the accept
button. Ignore the error message.
Choose Run from the debugger buttons. Each time you stop execution, in a method of the
ChangeCounter object, the value of change_ will be displayed. You can trace many variables,
from different objects, all at the same time.
Displaying Object Strucure with the Class Browser
The class browser provides the user with a detailed diagram of the program’s object design.
Click on the cbrowse icon in the control panel. Now move the mouse around until it is over the
box representing the ChangeCounter class. (As in Flowview, the name of the object the mouse
is currently over will appear in the lower right hand corner of the cbrowse window) You are
now looking at a detailed representation of the only class of our example, the ChangeCounter
class.
Cbrowse displays all the objects used in your program, and shows you how they are related. It
also provides the user with a detailed graphical image of the individual classes themselves.
Each line in the box representing the "ChangeCounter" class contains the name of either a
member function or of an instance variable. The variables are listed at the top of the box, and
are demarcated by the triangle pointing to the left on the side of the box. Functions are marked
by a triangle pointing to the right. The triangle is solid if the member is private, clear if it is
public, and shaded if it is protected.
If you click on any line with the right mouse button, cbrowse will use colors to show how that
item is defined throughout the class structure. The item selected will be marked green. If is an
item that is inherited by other objects, the line representing that same item in all the related
classes will be colored as well. In all children classes, lines will be colored yello if the child
does not modify that item. For example, if the parent class has an integer count, and you select
the line representing count in cbrowse, all the children will color in the line they have
Page 16
some attributes of all the functions in your program. Clicking on any box in flowview with the
middle mouse button will bring up a box containing information on that function. The box will
tell you where the function is defined, how many functions call it, and how many functions it
calls.
Clicking with the right mouse button on any box will bring up a list of all the functions
represented by that box. The left mouse button compacts the view.
Floview will also animate the execution of your program. Click run in the debugger. The box
representing main.C in the flowview display will turn red. As the program executes, flowview
will display, in red, the function currently being executed.
The following is an abbreviated list of some of the menu options available with flowview:
The Node menu:
Ignore: Will remove the selected object from the call graph.
Expand: Will expand the view of the selected objects. Basically, it
will show a more detailed break-down of the calls made by that
object by moving one level ahead in the object heirarchy. For
example, expanding the view of a directory will display the
connections between the files in that directory. Expanding a file
will display the functions in that file.
Compact: Will compress the view of the selected objects. It will undo
the actions of Expand.
Show Info: Will have the same effect as clicking the middle mouse button on a selected
object. A dialog box containing a brief description of the nature of the object will be
presented to the user.
The Display menu:
Options: Allows the user to select how objects are displayed in
Floview. For example, selecting the "Expand size to show text"
option will get flowview to expand the size of any selected object to
make its name legible. See the Uswer’s Manual for a more detailed
explanation of the various options.
The Flow menu:
Info Window: This option brings up an external information window.
When any object is selected, the calls made by and to that function
are listed by line number. This can be very useful when
documenting code.
Restart: This option will re-load the call graph. This option is a
handy safety net if you get lost in a large call graph.
Page 15
The remaining diamond ought to contain the name of the directory from which field is running.
Double-clicking (for the rest of this section, keep in mind that one only needs to click once if an
object is already selected) on this icon will bring up a diagram of how the files in that directory
are linked together. You are "expanding" your view of that directory. One can also "expand" an
object by choosing "Expand" from the "Node" menu.
In flowview, elipses represent files. Floview is now providing you with a diagram of how the
C++ files in your directory are connected. In this case, our program is simple, and only two
files are involved. Now double-click on the counter.C circle to bring up an "expanded" diagram
of that file. Double click on the elipse representing main.C to expand that file as well. Floview
will show a diagram like the one in Figure 6. Boxes, in flowview, represent individual
functions. Rather than simply displaying the fact that main.C contains a call to a function in
counter.C, flowview is now displaying all the functions in counter.C. At this point, you have a
complete diagram of how your program executes. main.C calls five functions in the file
counter.C.
Flowview is a very powerful, and helpful tool. Spend some time using the mouse to navigate
around flowview, until you fully understand the effects of your actions, and what the various
shapes represent.
If the text within the shapes is hard to read, simply move the mouse over any one you are
interested in. Then name of what that shape represents will appear in the lower-right hand
corner of the flowview window.
Now open the annotddt editor (or the annotview editor) and bring up the main.C file. If you
click once, with the left mouse button, on any of the boxes, in flowview, that represent a
function in the program counter, the editors will automatically move the cursor to the beginning
of that function. When dealing with large programs that involve many files and hundreds of
functions, this option can prove to be a major timesaver.
One can also save time when documenting code by using flowview as a quick reference on
Page 14
prompt. Read the dbx manual page for more information about the complete set of commands
or type help in the debugger to see a partial list.
Other FIELD tools
Displaying Program Structure with flowview
The flow tool will automatically produce a directed graph representing the procedure calls in the
program. A node in the graph represents an object and an arc represents that the source object
contains a call to the destination object. The currently ’selected’ object is shaded in blue. While
you have a debugger session open for sorter, click on the "flowview" icon. A flow graph for the
counter program should appear and look like Figure 5.
You can use this diagram to navigate through your source code, to animate your program’s
execution, and to study the structure of your code. The left mouse button will select an object,
and when clicked on a selected object, it will alternately expand and compact your view of the
calls made by and to that node in the graph. The middle mouse button will display some basic
information about any selected object. The right mouse button will display an expanded list of
the functions represented by the object.
In "flowview," a heaxagonal box represents a directory. In your initial view, the hexagon on
the right represents the directory which includes the library functions (cin and cout) used in the
sample program above. Use the left mouse button to select the diamond on right, and choose
"ignore" from the "node" menu. This tells flowview not to display calls to functions in that
directory. We are not interested in the structure of the C++ libraries, and we have just expressed
that to flowview.
Page 13
cause the debugger to execute the next line of the program and stop. The arrow showing the
position of execution will move down one line and the debugger will display a message noting
the next line to be executed.
If the line of code is a function call, as it is in our example, the debugger will stop at the first
line of code in the called function. The editor with "counter.c" in it will also move the cursor to
that line. To avoid jumping into that function, as we must do now to avoid jumping through all
the code for the "cout" operator, press the "Next" button. Rather than stopping at the next line
of code, the debugger will stop at the next line of code that is within the current function.
Stopping Execution
If the debugger is executing a program and you would like to halt it but there is no breakpoint
set, press the "Stop" debugger button. The debugger will display a message telling what line it
stopped on. This feature is useful for breaking out of infinite loops. One can then step through
the code to find the problem. The "Kill" button will end the current execution cycle entirely,
meaning that the user would not be able to continue to step through code once it has been
pressed.
Printing the values of Variables
The debugger allows you to see the value of variables. While the debugger is stopped select the
name of a variable in the current procedure by using the mouse to highlite it in one of the
editors, or in the debugger. Now press the "Print It" debugger button. This will print the current
value of the variable in the debugger window.
Tracing
Placing a trace at a line in the source will cause the debugger to print out a message each time
that line is reached. In annotedit, set the annotation type to trace by selecting the "Trace" button
from the "Select" menu. To place a trace at a line 7 of the program, press the left mouse button
in the annotation column to the left of the source code at line 7 of main.c. Now press the "Run"
debugger button. Each time the debugger executes line 7, it will print a message saying that it
has reached that line. This can be useful if you would like to check to see how often a line of
code is executed without stopping exectution every time it is reached.
Removing Breakpoints and Trace Annotations
Debugging annotations can be removed by setting the annotation type to the type of annotation
that you want to remove and then clicking the left mouse button on the annotation, or clicking
the middle mouse over the annotation, clicking on the "remove" box in the dialog box that
comes up, and then clicking on the "accept" button.
Other Commands
Other commands are available for the debugger. These commands can be entered at the ddt
Page 12
through the next section to see how each option works. If you are familiar with them already,
you may want to skip ahead.
Setting Breakpoints
A breakpoint represents a line in the source file where the debugger will stop executing. It can
be used to stop the program periodically so that the status of variables can be checked and
problem areas isolated.
Open "counter.c" and "main.c" in the editor you prefer, if you do not already have them open.
Make sure that the "break" option is highlighted in the "Select" menu of your editor. (Please see
the FIELD User’s Manual for information on the other available options)
Go to line 6 of "main.c" and press the left mouse button down in the annotation column to the
left of the source file. A stop sign annotation should be placed in the annotation column. See
Figure 4.
Starting Execution from Beginning of Program
To begin running the program continuously from the begining of the program click on the "Run"
button at the bottom of the debugger window. The program should now ask you to enter the
number of quarters in your pocket. Type an integer followed by a carriage return in the
debugger window below the prompt. After entering the value the program should run until it
hits the breakpoint that was set at line 6 of "main.c." There should be an arrow annotation at
this line in the source editor and a message in the debugger window saying that it stopped at the
breakpoint.
Starting Execution after a Breakpoint
To continue running the program again press the "Continue" debugger button. The program will
now ask you about the rest of the change in your pockets. Clicking "Run" again will re-start
execution from the beginning of the program.
Executing Programs one Instruction at a Time
After "Run" has been pressed and the program has stopped at the breakpoint at line 6, the
debugger can now begin execution one line at a time. Pressing the "Step" debugger button will
Page 11
Making the Final Running Version
Once you have gotten all your files to compile successfully, you are ready to try to link them all
together. To do so, choose "MakeDefault" from the "Command" menu. Errors will be reported
as they were when compiling. Your code has successfully linked when the "Result of Make"
box signals that the "make was finished."
The debugger
Now that your code has been compiled and linked, it is time to try to execute it. For this, we
will use the FIELD debugger. The FIELD debugger is very similar to dbx on the Suns. It has a
window where commands can be entered with the keyboard, buttons that can be clicked on for
controlling the debugger, and graphical breakpoint annotations that can be set in the annotedit,
annotddt, or annotview editors. It is very easy to add new buttons for commands that the user
uses frequently.
To open the debugger, click on the "dbg" icon on the control panel. A dialog box and window
should appear asking for the name of the program to debug. Type "counter" in the "Debug"
field and click on the "accept" button. The debugger should start up and look like Figure 3.
Executing Programs in the Debugger.
The debugger has several different program execution modes. Some of the major options can be
used by selecting one of the buttons that are on the bottom of the debugger window. Work
Page 10
FIELD puts up a dialog box asking the user to confirm that the file should not be saved.
If the "Ignore Changes" radio button is set and the "accept" button chosen, the file will not
be saved. If the "Save" button is set, then the file will be saved before quitting aedit. The
default button is "Ignore Changes."
Note: Many of the function keys have special meaning in "aedit." These meanings are documented in the "Brown Workstation Environment" manual.
Compiling and Linking Files
The "annotedit" tool is an editor like "aedit," but it has additional capabilities, like allowing the
user to mark the lines of a file with graphical symbols, or "annotations," for compiling and
debugging. To compile "counter.c," click on the "annotedit" icon on the control panel. A dialog
box should appear asking for the name to the file to edit. Type "counter.c" in the "Name" field
of the dialog box and click on the "accept" button. To learn more about the addtional menus and
options available with this editor, see the "FIELD User’s Manual."
Compiling your code
Choose "compile" from the "Commands" menu. A thin message bar should appear saying that it
is compiling your file. After the compilation is done, a dialog should display any compilation
errors. Click the "accept" button on the dialog box when you are finished reading the error
messages. A "thumbs down" will appear to the left of any line containing an error. A box with
a "w" inside will mark any segments of code that warrant a warning from the compiler. If no
errors are found, the dialog box will simply list the directory it "entered" and "left."
Displaying compilation errors
To display the error message for a line, click the middle mouse button on the "thumbs down" or
"w" annotation. After you have finished reading the error message, click on the "accept" button
of the error dialog box.
Correcting Compilation Errors
To correct the compilation errors, you can use the any of the editor commands described in the
"Editing a file with FIELD" section.
Removing an Error or Warning Annotation
After you have corrected a compilation error or warning, remove the annotation to the left of the
line by clicking the middle mouse button on the annotation, clicking on the box to the left of the
word "remove," and then choosing "accept." This is useful for keeping track of which
compilation errors have been fixed and which have not.
Page 9
icDelete" from the "Edit" menu. The starting point and ending point can be chosen from a number of alternatives. For example, the user can select some text by pressing down on the mouse
and dragging. The selected text will be highlighted. To delete the text from the file and place it in
the buffer, set the "from" radio button to "Start of Selection" and the "to" radio button to "End of
Selection," and then click on the "accept" button. The text has now been removed and placed in a
buffer with the name in the "buffer-name" field.
(c) Copying text from a file
A section of text can be copied from a file into a buffer without removing the text from its original
position. To do this choose "GenericPick" from the "Edit" menu. The dialog box is similar to the
"GenericDelete" dialog box. To copy highlited text into a buffer, set the "from" radio button to
"Start of Selection," set the "to" radio button to "End of Selection," and then click on the "accept"
button.
(d) Pasting text into a file
Text that has been "cut" or "copied" into a buffer can be inserted into the file by using the
"GenericInsert" command from the "Edit" menu. There are a number of options for the placement of the text. For example, to insert the text in the buffer at the current cursor position, set the
"where" radio button to "Current Postion" and then choose "accept."
The File menu:
(a) Saving a file
A file can be saved to disk by using either the "Savefile" or "Saveas" command from the "File"
menu.
(1) "SaveFile" saves the file to disk with the name that is shown in the message box at the
bottom of the aedit window (the middle name).
(2) "Saveas" writes the file to disk with a new name. Choosing "SaveAs" from the "File"
menu brings up a dialog box asking for the new name of the file. Enter the desired name
in the "Name" field of the "SaveAs" dialog box and choose the "accept" button.
(b) Quitting the editor
One can quit from the editors by using either the "CloseFile" or "Quit" command from the "File"
menu.
(1) Choosing "Closefile" from the "File" menu causes the editor to automatically save the file
and then quit.
(2) Choosing "Quit" from the "File" menu causes the editor to quit without saving the file. If
the file has not been changed, the editor exits immediately. If the file has been modified,
Page 8
cursor keys.
(c) Searching for a string in a file using the "GenericSearch" button
Often while programming, it is helpful to be able to find all occurrences of a string in the program
text. To do this choose "GenericSearch" from the "Move" menu. Type the string that you want to
search for in the "Pattern" field of the resulting dialog box and then click on "accept." The cursor
will be moved to the first occurrence of the string after the current cursor position. Scrolling will
occur if necessary. To insure that all occurrences are found, including the ones before the cursor,
select the "wrap-search" radio button in the "GenericSearch" dialog box. This will cause the
search to continue from the top of the file if no occurrences of the given string are found before
the end of the file.
The Edit menu:
(a) Replacing a string in a file
When programming, it is convenient to replace all occurrences of a certain string with a different
one. To do so, select the "ReplceString" option from the "Edit" menu. Enter the pattern to search
for in the "Pattern" field. Enter the replacement pattern in the "replacement" field. If one wants to
replace only a certain number of occurrences of the string, enter that number in the "count" field.
Click on "Accept."
(b) Cutting text from a file
A section of text can be removed from a file and held in a buffer. The buffer text can then be
placed in a new position by pasting the text. Cutting text can be acheived by selecting "Gener-
Page 7
{
double pennies;
cout << "How many pennies are in your pockets: ";
cin >> pennies;
pennies *= .01;
change_ += pennies;
cout << "You have $" << pennies << " in pennies. This leaves you with";
cout << " a total of $" << change_ << "." << endl;
return change_;
}
The Move Menu:
The following options, represented by buttons in the "Move" menu, can be used to quickly move
the cursor through a file.
(a) Scrolling with the "Scroll" button
You can move forward and backward in a file by pressing the mouse on the up arrow of the
scroll bar to move up or the down arrow to move down. Selecting the "Scroll" option from the
"Move" menu will also scroll down one line. To move greater distances, hold down and drag
the white box on top of the grey area of the scroll bar between the arrows. Move the white box
up to scroll backwards and down to move forwards.
(b) Moving the cursor with the "GenericMove" button
The cursor can be moved by clicking the mouse in the desired location or by choosing the
"GenericMove" command from the "Move" menu. This will bring up a dialog box, like the one
in Figure 2. It asks for the point to start moving from and the number of lines and characters to
move. For example, to go to the beginning of the 5th line of the file, choose "Start of File" as
the basis and set "delta_lines" to 5 and "delta_chars" to 0. This will move the cursor five lines
and zero characters beyond the start of the file. This option is particularly helpful when the user
wants to move to a specific line in a large file. The cursor can also be moved by using the arrow
Page 6
#include "counter.H"
#include <iostream.h>
ChangeCounter::ChangeCounter()
{
change_ = 0;
}
double
ChangeCounter::quarters()
{
cout << "How many quarters are in your pockets: ";
cin >> change_;
change_ *= .25;
cout << "You have $" << change_ << " in quarters." << endl;
return change_;
}
doubel
ChangeCounter::dimes()
{
double dimes;
cout << "How many dimes are in your pockets: ";
cin >> dimes;
dimes *= .1;
change_ += dimes;
cout << "You have $" << dimes << " in dimes. This leaves you with";
cout << " a total of $" << change_ << "." << endl;
return change_;
}
double
ChangeCounter::nickles()
{
double nickles;
cout << "How many nickles are in your pockets: ";
cin >> nickles;
nickles *= .05;
change += nickles;
cout << "You have $" << nickles << " in nickles. This leaves you with";
cout << " a total of $" << change_ << "." << endl;
return change_;
}
double
ChangeCounter::pennies()
Page 5
Adding text
Adding text in the field editor is simple. Just type the letters from the keyboard. When you
want to go to a new line simply press the return key.
Notice that when you hit return after typing main(), the cursor is indented on the next line. This
is the "auto-indenting" feature of the FIELD editor. It helps the user format code quickly and
easily by automatically indenting the start of a new line to a position that helps define distinct
code blocks. The rest of this section describes how to perform a number of editing functions.
Please experiment with these functions as you use "aedit" to create the following C++ program:
Note: If you get an error stating that a file is "readonly," you can use the F8 key to toggle out of
the "readonly" mode.
Note: If you hit the return key when the cursor is not at the end of the file, you will notice that
blank lines are not added to the file. Putting the editor in "Open" mode will make it so that the
return key adds a blank line to the text. To do this, press the "control" key and then the "o"
character. Now the return key will cause blank lines to be added to the file.
Type in file main.C:
#include "counter.h"
main()
{
ChangeCounter* counter = new ChangeCounter();
double total = counter -> quarters();
total = counter -> dimes();
total = counter -> nickles();
total = counter -> pennies();
return 0;
}
Type in file counter.H:
class ChangeCounter
{
private:
double change_;
public:
ChangeCounter();
double quarters();
double dimes();
double nickles();
double pennies();
};
Type in file counter.C:
Page 4
and "EditingManyFiles." If "Auto Compile" is set to "True," a compile will automatically start
whenever a file is saved. "EditingManyFiles" will temporarily disable the automatic compile so
that the user can edit multiple files before the next compile. To toggle between "True" and
"False," just click on the appropriate red square.
Reload Resources: This allows you to change the resources for any FIELD tool, and to
have those changes reflected the next time that tool is selected from the control panel. This
allows the user to quickly test configuration changes.
Environment: This option allows the user to set any environment variable for all FIELD
tools, inlcuding both those currently active, and those later used.
Quit: This button allows the user to quit FIELD. It will close all windows brought up
through the control panel, but will not effect any field tools that have been run independently.
Be careful, as FIELD will close the editors even if the files being worked on have been altered
since the last save.
(b) the UNIX menu:
Shell: This will bring up a new Unix shell, which can be used to execute any shell
command. For example, one could type "pwd" to find out what the current directory is.
Memory Info: Does nothing at this time.
(c) the Windows menu:
Pop All: This option will bring all currently running FIELD tools to the foreground.
Close All: This option will close all currently running FIELD tools. Again, all the editors
will be closed, even if changes have been made since the last save.
Editing a File with FIELD
FIELD provides the user with four different editing tools. This tutorial will discuss the basic
features that all the editors share. For a more detailed description of the special features of each
individual editor, see the User’s Manual.
Using the Aedit tool
The "aedit" tool is a simple editor with none of the special annotation features shared by the
other three editors. This editor should be used when the user wants to create new files or modify
old ones without using the other tools provided by FIELD. Please refer to the User’s Manual for
more information on how the other editors can relate to the various FIELD tools. The following
discussion details how to perform simple text editing operations, such as Cut and Paste.
To start "aedit," click on the "aedit" icon in the control panel (the icon with the old English
"E"). A dialog will prompt you for the name of the file to edit. In the "File Name" field, type
"counter.c" and click on the "accept" button (for now, ignore the "System" field). The current
contents of the file are displayed. Since "counter.c" is a new file, the window should be empty.
Page 3
shell.
(d) Enter the new directory by typing "cd field."
Getting into the FIELD environment
To start FIELD, simply type "field" in a shell. The Control Panel window like the one in Figure
1 will be placed on the screen.
The Control Panel Window
The FIELD Control Panel gives you access to all the tools available in the environment. Each
tool is represented by a lettered icon and can be opened by clicking on that icon. Online FIELD
help, a UNIX shell, and some other options can be accessed from the menu bar. The following
is a brief description of the various options available from the menu bar.
(a) the Commands menu:
Help: This button brings up a help screen, which can be used to get a brief explanation of
what the various tools are capable of. See Appendix B for more on this.
Mouse Help: This option allows the user to check what the mouse buttons do in different
windows. For example, if the user moves the mouse into the Help window, the functions of the
mouse in that window will be displayed in the Mouse Help window.
Refresh: Executes an XRefresh on all windows.
Directory: This option allows the user to set the working directory for all the FIELD tools
currently running. This can save the user time if it becomes necessary to access lots of files in a
directory different from the one that field was originally started from.
Policy Variables: This brings up a simple dialog box with two options, "Auto Compile"
Page 2
FIELD Tutorial
FIELD is a programming environment which integrates and provides graphical user interfaces
for several tools in the UNIX environment. It is designed to be used by students in computer
science classes as well as programmers participating in advanced research projects. The
graphical user interface is easy to understand, as well as configurable, making it flexible enough
for both beginning and advanced users. This tutorial will give the programmer an introduction
to some of the tools supported by FIELD, and will demonstrate how to use those tools to
develop software effectively by providing a step by step guided tour through the writing and
debugging of a simple program.
Prerequisites
It would be helpful if the user of this FIELD tutorial had a basic knowledge of the X window
system and the UNIX environment including the following:
(a) how to create windows
(b) how to use the mouse and keyboard as input devices in X
(c) how to use various graphical user-interface objects such as
pull-down menus, dialog boxes, scroll bars, icons
(d) how to write basic programs in C++ (not required)
(e) how to manage programs with make, to set up a Makefile
Preparing for the Tutorial
You will need to do the following things before you begin this tutorial:
(a) Login to a Sun workstation.
(b) Add the directory "/pro/bin/field" to the path variable in your ".cshrc" file. To do this edit
the file called ".cshrc" with any editor. On the line that says "set path=()," check to see if the
directory "/pro/bin/field" appears between the open parenthesis. If it does not, add the directory
"pro/bin/field" just before the closing right parenthesis. If you have modified the .cshrc file,
type "source .cshrc" in all shells. This will tell the system that you have made changes to this
file.
(c) Make a directory called "field" in your home directory by executing "mkdir field" from the
Page 1