1
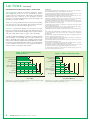
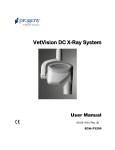
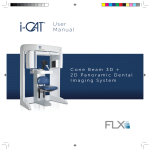
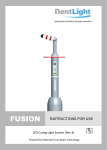
I N
T H I S
I S S U E
Introducing the ADA PPR:
Designed for You with Your Practice In Mind
Carbide Burs
Lab Notes
2
Practitioner Input
3
Buyer’s Summary
Table
3
Posterior Composite
Lab Notes
4-6
Practitioner Input
7
Buyer’s Summary
Table
7
Panel Discussion
8
Digital Radiography
Systems
Primer
Lab Notes
9
10 - 13
Practitioner Input
12
Buyer’s Summary
Table
14
Buyer’s Checklist
15
The Back Page
16
Editor: David C. Sarrett,
DMD, MS
Welcome to the new ADA Professional Product
Review (PPR)! We know you have other sources of
product information and limited time to access them
all. So what do we offer the busy practitioner?
Information that is scientifically sound, unbiased, and
clinically relevant.
How do we plan to make sure that PPR is your source
for professional product reviews? We earn your trust!
Our evaluations are based on just what you yourself
would look to, only on a far larger scale. We talk to
your colleagues (hundreds at a time), test products in
the ADA laboratories, and bring together the top
experts who teach, research, or lecture in areas like
restorative dentistry, endodontics, and infection control.
We promise to put the needs of you, our readers, first by
compiling information from the best available sources.
With that goal in mind, we maintain contact with the
manufacturers of the products we evaluate. For example,
we routinely allow technical staff from companies to
review our testing protocols, and for equipment that
involves a learning curve, like the digital radiograph
systems reviewed in this issue, we invite technicians
to assist us with product set-up and training. In
addition, we share with manufacturers data specific
to their product prior to publication as part of our
review process. We believe this affords us an opportunity
to identify any possible anomalies in product
performance before providing you with a review. For
a full description of our guidance on manufacturer
relations, visit “www.ada.org/goto/ppr”.
We designed this newsletter specifically for ADA
members. Four times a year, as a member benefit,
you will receive a newsletter packaged with your issue
of the Journal of the American Dental Association.
Through December, we will be introducing the PPR
to the dental community, sending issues to more than
150,000 people and institutions including practitioners,
manufacturers, libraries, and dental schools. In 2007,
the PPR will be available to nonmembers only on a
subscription basis.
Please look over this and future issues of PPR so you
can see for yourself why PPR is your source for product
information. And let us know what you think, by
dropping me a line at “[email protected]”.
Dr. Sarrett is a professor of Dentistry, and Associate Vice President for
Health Sciences—Academic Affairs, Virginia Commonwealth
University, Richmond, VA. He can be reached at “[email protected]”.
Bringing Digital Radiography
Into Your Office
Over the last decade, the technology behind digital
radiography systems has evolved, making incorporation
of these systems into most dental offices feasible. This
report offers some basic technological information as
well as a review of some popular systems.
In digital radiography, there are three types of detectors
that take the place of conventional film: charge-coupled
device (CCD), complementary-metal-oxide-semiconductor (CMOS), and photo-stimulable phosphor
(PSP). We evaluated CCD and CMOS-based systems
ISSN 1930-8736
David C. Sarrett, DMD, MS
Editor, Professional Product Review
for this review. Systems that use these types of solidstate detectors are called “direct.” When these sensors
receive energy from the x-ray beam, the CCD or
CMOS chip sends a signal to the computer and an
image appears on the monitor within seconds.
Systems that use PSP sensors (or “plates”) are called
“indirect.” When these plates are irradiated, a latent
image is stored on them. The plate is then scanned
and the scanner transmits the image to the computer.
For comparative information on CCD, CMOS, and
PSP technologies, visit “www.ada.org/goto/ppr”.
BluWhite (FG 557)
Kerr Corp.
800-537-7123
www.kerrdental.com
Carbide Burs
We reviewed eight brands of straight, fissure carbide burs (557) : BluWhite (Kerr Corp.), Brasseler (Brasseler USA),
Henry Schein (Sullivan-Schein), Midwest (Dentsply Professional), Miltex (Miltex, Inc.), NTI (Axis Dental Corp.), SS
White (SS White Burs, Inc.), and Tri Hawk (Tri Hawk Corp.). In addition to laboratory testing, we collected input
from 407 dentists about these products.
Brasseler (557 FG)
Brasseler USA
800-841-4522
www.brasselerusa.com
Henry Schein (FG 557)
Sullivan-Schein
800-372-4346
www.sullivanschein.com
Lab Notes
Midwest (FG557)
Dentsply Professional
800-989-8826
www.professional.dentsply.com
We purchased burs of each brand for testing in the ADA laboratories to determine run-out, permanent set, corrosion
resistance, cutting rate, and loss of cutting rate. In developing some of our tests and determining whether products
passed or failed, we referred to the standards published by the American National Standards Institute and the ADA.1
A full description of our test methods can be found on the ADA’s web site at “www.ada.org/goto/ppr”.
Miltex (DFG557)
Miltex, Inc.
866-854-8300
www.miltex.com
NTI (H557-FG)
Axis Dental Corp.
800-355-5063
www.axisdental.com
BASIC TESTS
CUTTING RATE
Our Basic Tests challenge products against a performance
standard, which products can either pass or fail. The
Basic Tests for carbide burs were Dimensions, Run-Out,
Permanent Set, and Corrosion Resistance.1 All of the
brands we tested passed these tests. Here’s how these tests
relate to clinical performance:
Clinical Significance: Indicates how much material a
bur will remove within a given time and how that value
might decrease with use.
Results: Tri Hawk and NTI burs had significantly better
cutting rate than the others. Among the multi-use burs,
only NTI showed no statistically significant loss of
cutting rate between the first and second cuts, having
been autoclaved between cuts. The mean Cutting Rate
results, along with the Loss of Cutting Rate for multi-use
burs, are shown in the Figures 1 and 2.
• The diameter of 557 burs should be 1.0 (±0.08) mm at
the working end.1 We confirmed these measurements by
checking the Dimensions.
SS White (FG-557)
SS White Burs, Inc.
800-535-2877
www.sswhiteburs.com
• Run-Out gives you a sense of cutting accuracy, indicating
whether the bur will make a cut that is the same as the
bur’s diameter.
Tri Hawk (FG 557)
Tri Hawk Corp.
866-Tri-Hawk (874-4295)
www.trihawk.com
Comments: For this test, we cut blocks of a machinable
glass ceramic (Macor, Corning Inc.) under standardized
load, air pressure, and water flow rate conditions.
Admittedly, Macor is not tooth enamel and the results you
would get through clinical use would not be the same as
those obtained when cutting Macor; however, it often is
used in laboratory testing to collect comparative data
because it has similar physical properties to tooth enamel.
• Permanent Set tests the bur’s ability to resist permanent
deformation or fracture and provides an indication of the
bur’s durability.
• Corrosion Resistance demonstrates the bur’s resistance
to corrosion after steam autoclave sterilization. For infection
control, burs should be heat sterilized between patients.2
Tri Hawk is the only bur we tested that is supplied sterile;
the others should be processed before use.
REFERENCES
1. American National Standard/American Dental Association
Specification No. 23—1982, Dental Excavating Burs. Chicago: American
Dental Association.
2. Centers for Disease Control and Prevention. Guidelines for Infection
Control in Dental Health-Care Settings—2003. MMWR 2003;52(no.
RR-17):20, 22-23.
Figure 2. Mean (±SD) Cutting Rate and
Loss of Cutting Rate for Multi-Use Burs.*
Figure 1. Mean (±SD) Cutting Rate
for Single-Use Burs.*‡
1st Cut
2nd Cut
Henry Schein
Miltex
Brasseler
Midwest
SS White
BluWhite
Tri Hawk
NTI‡
0
100
200
300
400
Rate (mg/min)†
500
600
700
* Mean based on n = 10
† Measured in milligrams of machinable glass ceramic (Macor, Corning Inc.) cut per minute.
‡ All of these products performed differently based on statistical analysis
(one-way ANOVA, p < 0.05).
2
ADA Professional Product Review VOL . 1 | I S S U E 1
0
100
200
300
400
500
Rate (mg/min)†
600
* Mean based on n = 10 specimens. Vertical black bar designates products that
performed equally for Cut 1 based on statistical analysis (one-way ANOVA, p >
0.05).
† Measured in milligrams of machinable glass ceramic (Macor, Corning Inc.) cut
per minute.
‡ NTI performed equally well between Cuts 1 and 2 based on statistical analysis
(one-way ANOVA, p > 0.05).
700
Practitioner Input
concentricity, and whether the shank was compatible with their
handpieces. The pie charts give an overall sense of how often the
brands rated Excellent, Very Good, Good, Fair, Poor, or
Unacceptable. For a precise breakdown of how respondents rated
each feature, visit “www.ada.org/goto/ppr”. Pay special attention to
the number of respondents. Ratings are more reliable when they are
based on the opinions of more respondents.
Via a web-based survey, we collected input from 407 dentists about
their experiences with the products we tested in the lab. Of note, dentists
reported having experienced instances when the bur had fractured during
use for each brand. This is a good reminder to take precautions, like using
high-volume evacuation and protective eyewear, when working with burs.
On the survey, respondents were asked to rate their impressions of up
to two brands of carbide burs based on corrosion resistance, durability,
BluWhite (n=5)
Brasseler (n=114)
Henry Schein (n=36)
Midwest (n=205)
Miltex (n=2)
NTI (n=14)
SS White (n=173)
Tri Hawk (n=10)
Excellent
Very Good
Good
Fair
Poor
Unacceptable
Table 1. Buyer’s Summary for Tested Carbide Burs.
Product
(No. of Practitioner
Input Respondents)
Practitioner Input†
Laboratory Performance*
Price/
Bur‡
Supplied
Sterile§
11
$1.59
No
0
0
$1.99
No
22
48
8
$1.19
Yes
0
67
22
11
$1.23¶
No
82
36
31
27
6
$1.49
No
Pass
79
22
40
25
13
$1.09
No
NTI
(n = 14)
Pass
100
13
50
22
15
$1.40
No
SS White
(n = 173)
Pass
84
26
37
25
12
$1.33
No
Basic Lab Tests
Lab Score for
Other Tests (%)
Excellent
%
Very Good
%
Good
%
OtherII
%
Midwest
(n = 205)
Pass
79
29
35
25
Miltex
(n = 2)
Pass
50
38
62
Tri Hawk
(n = 10)
Pass
100
22
BluWhite
(n = 5)
Pass
84
Brasseler
(n = 114)
Pass
Henry Schein
(n = 36)
Single Use
Multi-Use
* Basic Lab Tests are Dimension, Run-Out, Permanent Set and Corrosion Resistance. Other Lab Tests: For
single-use burs, this score is based on cutting rate for one cut; for multi-use burs a percentage score was
calculated for the first and second cuts with the final score reflecting the average of those two. The best
performer earned 100 percent and the others earned a percentage based on how they compared to the best.
† Via a web-based survey, 407 dentists had the option of rating the performance of up to two brands.
Indicates percentage of time a rating was selected for a product. Ratings are more reliable for products
that have more respondents.
‡ MSRP as of February 2006 based on a purchase of 100 burs unless otherwise noted. Retail prices may vary.
§ For infection control, burs should be heat sterilized before use.2 Thus, burs that are not supplied sterile
should be processed before first use.
II Other: Sum of Fair, Poor, and Unacceptable ratings.
¶ MSRP as of Feb. 2006 based on a purchase of 10 burs.
ADA Professional Product Review VOL . 1 | I S S U E 1
3
Aelite LS Posterior
Bisco
800-247-3368
www.bisco.com
Posterior Composite Resins
Esthet-X
DENTSPLY Caulk
800-LD-Caulk
www.caulk.com
For testing, we purchased eight brands of composite resins (Shade A3) marketed for use in posterior teeth: Aelite LS
Posterior, Esthet-X, Filtek Supreme Plus Universal Restorative, Gradia Direct Posterior, GrandiO, Heliomolar HB,
Herculite XRV, and Venus (Table 1). In addition to laboratory testing, we collected input from 413 dentists about their
experiences with these products and hosted an Expert Panel discussion on the general topic of posterior composites (p8).
Filtek Supreme Plus
Universal Restorative
3M ESPE
800-634-2249
www.3m.com/espe
Table 1. Filler Characteristics of Featured Products.
Product
Filler
Gradia Direct Posterior
GC America
800-323-7063
www.gcamerica.com
Particle
Size
Aelite LS Posterior
Silica, strontium glass
0.05-4 μm
74
Esthet-X
Barium-fluoro-aluminum-boro-silicate glass
10-20 nm
0.02-2.5 μm
60
GrandiO
VOCO
888-658-2584
www.voco.com
Filtek Supreme Plus
Universal Restorative
Zirconia silica with cluster agglomerates
20-75 nm
0.6-1.4 μm
59.5
Gradia Direct Posterior
Fluoro-alumino-silicate glass, organic filler
0.016-16 μm
65
GrandiO
Silica glass
20-60 nm
0.7-1 μm
71.4
Heliomolar HB
Silica, yttrium fluoride and copolymers
0.04-0.2 μm
46
Herculite XRV
Barium-alumino-boro-silicate glass, colloidal silica
0.6 μm (avg.)
59
Venus
Silicone dioxide, barium-aluminum-boron-fluoride silica glass
0.01-0.04 μm
0.7-2.0 μm
61
Heliomolar HB
Ivoclar-Vivadent
800-533-6825
www.ivoclar.com
Herculite XRV
Kerr Corp.
800-537-7123
www.kerrdental.com
Venus
Heraeus Kulzer
800-431-1785
www.heraeus-kulzer.com
Volume
Fraction (%)
Lab Notes
We tested each brand in the ADA labs to document water sorption and solubility, shade matching to the manufacturer’s shade guide, color stability
after water storage, polishability, depth of cure, flexural strength and modulus, radiopacity, maximum shrinkage stress, and rate of stress development.
In developing some of our tests and determining whether products passed or failed, we referred to the standards published by the International
Organization for Standardization and those from the American National Standards Institute and the ADA.1,2 We used the Optilux 501 curing light
when preparing our test specimens. You can find a full description of the methods we used at “www.ada.org/goto/ppr”.
BASIC TESTS
Our Basic Tests challenge products against a performance standard, which
products can either pass or fail. The Basic Tests for posterior composites
were the Water Sorption and Solubility, Shade Matching, Color Stability,
and Polishability Tests.1,2 All of these brands passed these tests. Here’s
how the tests relate to the clinical performance of posterior composites:
• Water Sorption and Solubility relate to the material’s long-term mechanical
stability in an aqueous environment. Water sorption measures how
Figure 1. Mean (±SD) Depth of Cure Values.*†
Aelite LS Posterior
much water will be absorbed by these materials that may lead them to
expand once placed in the oral cavity; solubility shows how much material
will leach out of the composite in an aqueous environment. We conducted
these tests after storing the specimens in water (37°C) for 30 days.
• Shade Matching verifies the color match between the cured composite and
the manufacturer’s recommended shade guide for that product.
• Color Stability is a screening test that checks whether the color of the
material initially will remain stable in a moist environment. We assessed
color stability after storing the specimens in water (37°C) for 30 days.
• Polishability demonstrates the ability to attain maximum surface gloss
with a polishing system (we used the Soflex system, 3M ESPE).
Depth of Cure (DOC)
Heliomolar HB
Clinical Significance: Identifies the DOC achieved according to
the manufacturer’s recommended curing time and offers guidance on the
maximum increment-thickness that can be cured under similar conditions.
Darker shades, lower light intensity, and increased distance between the light
tip and the composite will decrease the maximum DOC.
Esthet-X
Venus
Gradia Direct
Posterior
Filtek Supreme Plus
Universal Restorative
GrandiO
Results: We tested three specimens of each brand and report the mean
DOC in Figure 1.
Herculite XRV
0
0.5
1.0
1.5
2.0
2.5
3.0
3.5
Cure Depth (mm)
* Mean values based on n=3 specimens. Vertical black bars designate products that performed
equally based on statistical analysis (one-way ANOVA, p > 0.05).
† We used the manufacturer recommended cure time for these products. For Herculite XRV, the
recommended curing time was twice that of the other composites (40 vs. 20 seconds).
4
ADA Professional Product Review VOL . 1 | I S S U E 1
4.0
Comments: Herculite XRV showed the greatest DOC, but the recommended
cure time was twice that of the other products (40 vs. 20 seconds). Aelite LS
Posterior and Heliomolar HB both had DOC < 2 mm, the manufacturers’
recommended increment thickness. Our results suggest that, when using
either of these products, you may want to work with a smaller incremental
thickness than those recommended by their manufacturers.
Curing Lights: Curing lights will affect DOC. In our tests, we repeatedly
confirmed that the curing light was functioning at 300 mW/cm2,
according to the ANSI/ADA specification for curing lights.3 During the
Expert Panel discussion (p 8), the importance of properly functioning
curing lights was emphasized.
“Often, the curing lights being used clinically are underpowered, leaving
the composite under-cured,” said panelist Dr. Edward J. Swift Jr., professor
and chair of Operative Dentistry, University of North Carolina School of
Dentistry.
Dr. Swift based his comment on a number of studies documenting the
intensity of curing lights being used in clinical practices.4-10 These
studies found that one-third to one-half of curing lights in dental
offices were functioning at inadequate levels to cure the composite
beyond the surface.
Different light meters yield varying values for intensity. To ensure
adequate intensity, you may wish to purchase a light meter and obtain
a baseline reading with a new bulb. You can then periodically check
the intensity of your curing light against that value. Bulbs can lose
their intensity and curing ability long before failing completely.
Figure 3. Mean (±SD) Flexural Modulus.*
Heliomolar HB
Gradia Direct
Posterior
Venus
Esthet-X
Filtek Supreme Plus
Universal Restorative
Herculite XRV
Aelite LS Posterior
GrandiO
0
2
4
6
8
10 12
Modulus (GPa)
14
16
18
* Mean based on n = 5 specimens. Vertical black bars designate products that performed equally based on statistical analysis (one-way ANOVA, p > 0.05).
FLEXURAL STRENGTH & FLEXURAL MODULUS
RADIOPACITY
Clinical Significance: Represents the composite’s ability to initially
withstand occlusal stress and flex under load, but does not predict resistance
to wear or fatigue.
Clinical Significance: Shows how identifiable the composite will be
on a radiograph
Results: We tested five specimens of each brand, and report the mean
results in Figures 2 and 3.
Comments: Heliomolar HB and Gradia Direct Posterior had lower
strengths and stiffness compared with the other brands. By contrast, the
stiffness of GrandiO was significantly higher than any of the other
brands. The ISO requires that posterior, light-cured materials have a
minimum flexural strength of 80 MPa.1 There is no established minimum
value for flexural modulus.
Results: At 1 mm, dentin and enamel have radiopacities of 1.5 mm Al
and 2.25 mm Al, respectively.11 All of the brands, except Gradia Direct
Posterior and Aelite LS Posterior, were more radiopaque than dentin.
Only Heliomolar HB and Esthet-X were more radiopaque than enamel.
We tested three, 1-mm–thick specimens of each product, and report the
mean radiopacity in Figure 4.
Comments: Products that have radiopacities at or below the levels of
surrounding tooth structure could make it more difficult to diagnose
secondary caries on a radiograph. Research shows that the best diagnostic
radiopacity for detecting voids and secondary caries is equal to or slightly
greater than that of enamel.12-14
Figure 2. Mean (±SD) Flexural Strength.*
Figure 4. Mean (±SD) Radiopacity.*
Human Dentin†
Human Enamel†
Heliomolar HB
Gradia Direct Posterior
Aelite LS Posterior
Gradia Direct
Posterior
Herculite XRV
Venus
Filtek Supreme Plus
Universal Restorative
GrandiO
Esthet-X
Heliomolar HB
Esthet-X
Filtek Supreme Plus
Universal Restorative
Venus
Aelite LS Posterior
GrandiO
Herculite XRV
0
20
40
60
80
100
120 140
160
180
Strength (MPa)
* Mean based on n = 5 specimens. Vertical black bars designate products that performed equally
based on statistical analysis (one-way ANOVA, p > 0.05).
0
0.5
1.0
1.5
2.0
2.5
3.0
3.5
mm of Aluminum
* Mean based on n = 3 specimens. Vertical black bars designate products that performed equally
based on statistical analysis (one-way ANOVA, p > 0.05).
† Radiopacities for human dentin and enamel are from Attar et al.11
ADA Professional Product Review VOL . 1 | I S S U E 1
5
Lab Notes
continued
POLYMERIZATION SHRINKAGE STRESS & STRESS RATE
REFERENCES
1. International Organization for Standardization. ISO No. 4049—2000, Dentistry—
Polymer-Based Filling, Restorative and Luting Materials. Geneva: ISO.
2. American National Standard/American Dental Association Specification No. 27—1997,
Resin-Based Filling Materials. Chicago: American Dental Association.
3. American National Standard/American Dental Association Specification No. 48—2004,
Visible Light-Curing Units. Chicago: American Dental Association.
4. El-Mowafy O, El-Badrawy W, Lewis DW, et al. Efficacy of halogen photopolymerization
units in private dental offices in Toronto. J Can Dent Assoc 2005;71(8):587.
5. El-Mowafy O, El-Badrawy W, Lewis DW, et al. Intensity of quartz-tungsten-halogen lightcuring units used in private practice in Toronto. J Am Dent Assoc 2005;136(6):766-73.
Erratum in: J Am Dent Assoc 2005;136(8):1086.
6. Miyazaki M, Hattori T, Ichiishi Y, et al. Evaluation of curing units used in private dental
offices. Oper Dent 1998;23(2):50-4.
7. Pilo R, Oelgiesser D, Cardash HS. A survey of output intensity and potential for depth of
cure among light-curing units in clinical use. J Dent 1999;27(3):235-41.
8. Martin FE. A survey of the efficiency of visible light curing units. J Dent 1998;26(3):23943.
9. Santos GC Jr, Santos MJ, El-Mowafy O, El-Badrawy W. Intensity of quartz-tungsten-halogen light polymerization units used in dental offices in Brazil. Int J Prosthodont
2005;18(5):434-5.
10. Barghi N, Berry T, Hatton C. Evaluating intensity output of curing lights in private dental offices. J Am Dent Assoc 1994;125(7):992-6.
11. Attar N, Tam LE, McComb D. Flow, strength, stiffness and radiopacity of flowable resin
composites. J Can Dent Assoc 2003;69(8):516-21.
12. Goshima T, Goshima Y. The optimum level of radiopacity in posterior composite resins.
Dentomaxillofac Radiol 1989;18(1):19-21.
13. Curtis PM Jr, von Fraunhofer JA, Farman AG. The radiographic density of composite
restorative resins. Oral Surg Oral Med Oral Pathol 1990;70(2):226-30.
14. Goshima T, Goshima Y. Radiographic detection of recurrent carious lesions associated
with composite restorations. Oral Surg Oral Med Oral Pathol 1990;70(2):236-9.
15. Sarrett DC. Clinical challenges and the relevance of materials testing for posterior composite restorations. Dent Mater 2005;21(1):9-20.
Clinical Significance: Indicates the amount of shrinkage for one hour
after polymerization and the rate of stress development the adhesive
would be subjected to during this time. Theoretically, a lower maximum
shrinkage stress and a slower rate of stress development would be
advantageous to maintain marginal integrity, prevent microleakage, and
may limit post-operative sensitivity.
Results: In our testing, Gradia Direct Posterior had the lowest shrinkage
stress and a slow rate of stress development. We tested five specimens for
each brand, and report the mean results in Figures 5 and 6.
Comments: Polymerization shrinkage was discussed by our Expert
Panel (p 8). Generally, the participants agreed that although it has been
suggested that a connection between shrinkage and post-operative sensitivity
exists, there is little clinical evidence to support a direct relationship.
“I would say polymerization shrinkage most likely has a very high correlation
with microleakage, some relationship with post-operative sensitivity and
almost no relationship with secondary caries,” concluded panelist Dr. David
Sarrett, professor of Dentistry,Virginia Commonwealth University. Dr. Sarrett
also is editor of the ADA Professional Product Review and recently published
a review on clinical concerns related to posterior composite restorations as
well as the relevance of lab testing for these materials.15
Figure 5. Mean (±SD) Polymerization
Shrinkage Stress.*
Figure 6. Mean (± SD) Stress Rate.*
Gradia Direct Posterior
Aelite LS Posterior
Gradia Direct
Posterior
Heliomolar HB
Heliomolar HB
Aelite LS Posterior
GrandiO
Filtek Supreme Plus
Universal Restorative
Venus
Venus
Esthet-X
Esthet-X
Filtek Supreme Plus
Universal Restorative
GrandiO
Herculite XRV
Herculite XRV
0
0.5
1.0
1.5
2.0
Stress (MPa)
2.5
3.0
3.5
* Mean based on n = 5 specimens. Vertical black bars designate products that performed equally
based on statistical analysis (one-way ANOVA, p > 0.05).
6
ADA Professional Product Review VOL . 1 | I S S U E 1
0
2
4
6
8
Stress Rate (MPa/min)
10
12
* Mean based on n = 5 specimens. Vertical black bars designate products that performed equally based on statistical analysis (one-way ANOVA, p > 0.05)
Practitioner Input
The pie charts give an overall sense of how often the systems rated
Excellent, Very Good, Good, Fair, Poor, or Unacceptable. For a precise
breakdown of how respondents rated each feature, visit
“www.ada.org/goto/ppr”. Pay special attention to the number of
respondents; ratings are more reliable when they are based on the opinions
of more respondents.
Through a web-based survey, we collected input from 413 dentists about
the posterior composites they use.
Respondents were asked to rate the performance of composites for quality
of directions, ease of dispensing and placement, stickiness (i.e.,
“whether the material stuck to placement instruments”), shade match,
polishability, and the quality and accuracy of the provided shade guide.
Aelite LS Posterior (n=3)
Esthet-X (n=92)
Filtek Supreme Plus
Universal Restorative (n=114)
Gradia Direct Posterior (n=22)
GrandiO (n=12)
Heliomolar HB (n=70)
Herculite XRV (n=80)
Venus (n=20)
Excellent
Very Good
Good
Fair
Poor
Unacceptable
Table 2. Buyer’s Summary for Tested Posterior Composites.
Product (Indication)
[No. of Practitioner
Input Respondents]
Laboratory Performance*
Practitioner Input†
Basic Lab
Tests
RadiopacityII
Mean (±SD)
mmAl
Lab Score for
Other Tests
(%)
Excellent
%
Very Good
%
Good
%
Other**
%
Price/
Syringe‡
(weight)
Shelf
Life§
(years)
Aelite LS Posterior
(Posterior) [n = 3]
Pass
1.04 (±0.08)
72
0
29
52
19
$48 (4 g)
3
Esthet-X
(Universal) [n = 92]
Pass
2.40 (±0.12)
66
17
45
32
6
$57 (3 g)
3
Filtek Supreme Plus
Universal Restorative
(Universal) [n = 114]
Pass
2.10 (±0.10)
70
20
48
26
6
$82 (4 g)
3
Gradia Direct Posterior
(Posterior) [n = 22]
Pass
1.32 (±0.14)
74
24
41
25
10
$46 (4.7 g)
2
GrandiO
(Universal) [n = 12]
Pass
2.18 (±0.08)
71
16
44
31
9
$55 (4 g)
2.5
Heliomolar HB
(Posterior) [n = 70]
Pass
2.76 (±0.45)
74
11
42
36
11
$49 (3 g)
3
Herculite XRV
(Universal) [n = 80]
Pass
1.87 (±0.04)
67
13
39
38
10
$80 (5 g)
3
Venus
(Universal) [n = 20]
Pass
1.97 (±0.25)
68
16
52
28
4
$67 (4 g)
3
* Basic Lab Tests are Water Sorption and Solubility, Shade Matching, Color Stability, and Polishability. Lab score is an average calculated for each product based on its performance for depth of cure, flexural strength,
polymerization shrinkage, and stress rate. For each test, the best performer earned 100 percent and the others earned a percentage based on how their performance compared to the best.
† Via a web-based survey, 413 dentists had the option of rating up to two of these products. Indicates percentage of time a rating was selected for a product. Ratings are more reliable for products that have more respondents.
‡ MSRP as of March 2006. Retail prices may vary.
§ According to manufacturer.
II Mean levels based on n = 5 specimens. At 1 mm, dentin and enamel have radiopacities of 1.5 mm Al and 2.25 mm Al, respectively.11
** Other: Sum of Fair, Poor, and Unacceptable.
ADA Professional Product Review VOL . 1 | I S S U E 1
7
Dentists, Educators Discuss Posterior Composites
Moderator
Thomas J. Hilton, DMD, MS
Alumni Centennial Professor in Operative Dentistry
Department of Restorative Dentistry
Oregon Health & Science University School of Dentistry
Participants:
Jack Ferracane, PhD
Chairman, Department of Restorative Dentistry
Director, Division of Biomaterials and Biomechanics
Oregon Health & Science University School of Dentistry
David C. Sarrett, DMD, MS
Professor of Dentistry
Associate Vice President for
Health Sciences - Academic Affairs
Virginia Commonwealth University School of Dentistry
Editor, ADA Professional Product Review
William Liebenberg, BSC, BDS
Private Practice, Author, Lecturer
Vancouver, British Columbia
Edward J. Swift Jr., DMD, MS
Professor and Chair, Operative Dentistry
University of North Carolina School of Dentistry
Hilton: What are the current conditions and indications for posterior
composites? Are we at the point where we consider composite to be an
amalgam replacement?
Ferracane: We don’t know whether we will see the same level of
performance in larger composite restorations as we do with amalgam.
Most likely, [dentists are using] composites as amalgam replacements
in all situations except whole cuspal coverage.
Sarrett: In my experience, the patient is the most important factor.
There are some patients for whom very large composite restorations will
work quite well, even in second molar areas. It is also operator dependent
because composite is not as forgiving as amalgam.
Swift: It also depends on the ability to achieve isolation. Composites rely
much more heavily on good isolation than amalgam.
Hilton: Can posterior composites be used to repair a tooth that has a
crack or an incomplete fracture? In particular, can you do an intracoronal
restoration and rely on the adhesion between the tooth and the restorative
material to hold up for the long haul, or do we need to go to cuspal
coverage and more traditional restorations?
Ferracane: There is evidence in the literature1,2 that the bonding interface
probably does deteriorate with time. This may not be a problem for a
Class III or V restoration, but I think you’d be hard pressed to say that the
restoration would hold up as well as cuspal coverage if the whole tooth is
dependent on that bonding.
Swift: I view a bonded intracoronal restoration in a cracked tooth as
temporary. I worry about the long-term durability of that bonded interface,
and I think that a bonded intracoronal restoration of this type only
restores the tooth to maybe half of its normal strength. I feel that the
extracoronal restoration is still the way to go over the long haul.
Sarrett: I’ll only add that if you have a patient who’s not likely to follow
through with a crown restoration, then the bonded restoration is the
better option.
Hilton: Also, Wahl3 published some evidence that the incidence of cusp
fracture adjacent to posterior composite restorations was essentially the
same as those adjacent to amalgam. This would seem to indicate that the
adhesion between the composite and tooth does not demonstrate longterm durability.
reports4-6
Ferracane: There are
in which people have shown pretty
reasonable results with composite crowns and inlays/onlays.
Hilton: Is there more secondary caries associated with posterior composites
than with other restorative materials?
8
ADA Professional Product Review VOL . 1 | I S S U E 1
Swift: In my clinical experience, you do see more secondary caries
associated with resin restorations, and it tends to be more extensive.
Liebenberg: I think that a lot of the secondary caries is actually more
residual caries. When the adhesive or cavity preparation is promulgated,
everyone is really concerned about limiting access, small cavity form, and
I think decay can be left behind.
Sarrett: Misdiagnosis also can be a problem. When you have a dark
amalgam next to light-colored enamel, you don’t see the defect in the
same way as when you have tooth color on either side of the interface,
and you see something dark. Just because the interface is dark does not
mean there is secondary caries. Some dentists associate microleakage and
staining with caries and will replace a restoration because they think the
tooth has secondary caries. In reality, it likely needs nothing more than
slight repair for staining.
Hilton: What are your thoughts on repair versus replacement? Is there
a viable way of maintaining these restorations?
Liebenberg: These restorations don’t usually fail where margins are easily
accessible. They fail interproximally, where there is dentin, and if you’re
removing an interproximal portion you might as well replace the whole thing.
Hilton: I think you all bring up a good point about the most common
location for recurrent caries. Mjor7 published practice-based research
that showed that most secondary caries occurs in the gingival margins of
restorations—regardless of whether it’s Class II, III, IV, V—that’s where
it’s most likely to occur, which makes it more difficult to repair effectively.
Swift: But if you do have an occlusal restoration that’s severely worn or
there’s a chip or marginal staining, they’re relatively easy to repair and
resurface.
Hilton: Would you feel more reluctant to place composite in a patient
with poor oral hygiene?
Swift: If the person’s oral hygiene level is not [good], I’m reluctant to go with
posterior composites. I worry about recurrent caries and the subsequent
[restorative] longevity in that sort of a patient.
For the complete transcript of the panel discussion, visit
“www.ada.org/goto/ppr”.
REFERERENCES
1. Hashimoto M, Ohno H, Kaga M, Endo K, Sano H, Oguchi H. In vivo degradation of resin-dentin
bonds in humans over 1 to 3 years. J Dent Res 2000;79(6):1385-91.
2. Koshiro K, Inoue S, Tanaka T, Koase K, Fujita M, Hashimoto M, Sano H. In vivo degradation of resindentin bonds produced by a self-etch vs. a total-etch adhesive system. Eur J Oral Sci 2004;112(4):368-75.
3. Wahl MJ, Schmitt MM, Overton DA, Gordon MK. Prevalence of cusp fractures in teeth restored with
amalgam and with resin-based composite. J Am Dent Assoc 2004;135(8):1127-32; quiz 1164-5.
4. Clinical Research Associates. Filled polymer crowns—1 and 2 year status reports. CRA Newsletter
1998;22(10):1-3.
5. Clinical Research Associates. Posterior full crowns, 2001. Part 2. CRA Newsletter 2001;25(7):1-3.
6. van Dijken JW. Direct resin composite inlays/onlays: an 11 year follow-up. J Dent 2000;28(5):299-306.
7. Mjor IA. Clinical diagnosis of recurrent caries. J Am Dent Assoc 2005;136(10):1426-33.
Digital Radiography Systems
A Primer on Digital Radiography
Purchasing Considerations
Photo courtesy of the ADA Tripartite Grassroots Initiative.
When researching digital radiography systems, consider the existing set-up
in your office, including the x-ray generator, computer equipment, and
practice management software. You also should consider whether you’ll
want to e-mail digital radiographs to third-party payers or for consultation.
If so, you’ll want to look for DICOM-compliant systems. Finally, try out a
few systems, both during trade shows and by arranging for in-office
demonstrations. During these hands-on sessions, you can get a feel for
each system’s sensor and software.
Below, we’ve outlined these and some other factors that might influence your
purchasing decision. We also put together a Buyer’s Checklist worksheet that
you can use when talking to vendors about different systems (p 15).
Sensors. Beyond the three types of sensors, there are a number of other
sensor-related features that could influence your purchase decision, such
as sensor size and shape. Some manufacturers offer sensors in more
than one size, allowing for more versatility in placement, for example,
when working with patients who have small mouths. Some offer a “cut
corner” design to improve comfort. In addition, you’ll want to note the
size of the active area of the sensor—the area that will actually record
image information during irradiation. Some manufacturers mark this
active area on the sensor to help during placement. Sensor positioning systems
also can be purchased to help with placement. You might want to ask
the sales representative which positioners can be used with their sensors.
During your hands-on sessions, you and your staff should work with
placing the sensor to get an idea of your comfort level. In addition, you each
should take turns playing the role of the patient to see how the sensor will
feel to them. You might also ask about the estimated turnaround time for
replacing a sensor in case of damage. Incidentally, you should have a
back-up option for taking radiographs in case you are unable to use
the digital system for some reason. Some dentists we spoke with have a
quick developer or use both CCD or CMOS and PSP systems.
Software Features. The systems come with software that offers options
in image storage, auditing, or enhancement. Often, you are able to
adjust the contrast, brightness, magnify, or highlight an area of interest.
In addition, many systems allow you to mark the image with features
like comments and notes. When looking at systems, consider the most
often used presentations in your office. Do you typically see patients at
risk for periodontal disease, caries, or endodontic treatment? Some systems
can be set to optimize these types of views.
X-Ray Generators. In general, intraoral digital sensors are more sensitive
and require a lower dosage and shorter exposure times than film-based
radiography. Confirm that your existing generator can be used at these
settings. In addition, digital sensors work best with a small focal spot, and
resolution will be improved with the object at a large distance from
the source. Thus, a 16-inch collimator would probably provide better
resolution than 8-inch collimators. The latest trend in x-ray sources for
dental radiography is the “DC generator,” which uses a very highfrequency alternating current that allows for a shorter exposure time.
Ask your sales representative if you would need to upgrade for better
image quality.
Computer Equipment. Ask vendors about the computer requirements
necessary for optimal performance with their systems. You will need to
confirm the following minimum requirements: processor, system memory
(RAM), hard disk space, operating system, and video card. Also, investigate
how the radiography system will connect with your existing equipment
(e.g., USB). A demonstration will help ensure that you have the correct
ports available and will identify any pitfalls associated with moving sensors
from one operatory to another. You’ll need to have access to a monitor
for every room in which you want to view radiographs: operatories, your
office, consultation rooms. Talk to the system representative about the
monitor resolution needed to allow optimal viewing of the radiographs.
If you want to use one sensor in multiple operatories confirm with the
sales representative whether additional cabling and networking will be
needed and get a cost estimate.
Practice Management and Other Imaging Software. If you already
have a practice management software system in place, confirm that the
imaging software for your digital radiography system will work with
your existing software. To enable the two pieces of software to “talk” to
each other, they will be either “integrated” or “bridged.” Ask the sales
representative to demonstrate how radiographs made with their system
will be stored and accessed in concert with a patient file. To protect the
privacy of your patients, set up a mock patient file to use for the
demonstration. You also might consider talking to the technical support
people who maintain your practice management software. Sometimes
other imaging software stored on your computer, like that used with
intraoral cameras, may interfere with the new software you plan to purchase.
Again, ensure that this is not the case by actually using the two together
in your office in the presence of the company representative.
DICOM Compliance. The Digital Imaging and Communications in
Medicine (DICOM) standard was established to facilitate the exchange
of digital diagnostic images made with various radiographic systems.
The ADA has developed a technical report based on the broader
DICOM standard that is specific to the needs of dentistry.1 Most digital
systems sold today are stand-alone systems and do not necessarily interface
with each other. This means that a digital radiograph taken with one
system might not be readable by another system unless both are
DICOM compliant. By using DICOM-compliant equipment, you
improve your ability to read digital radiographs that may be sent to you and
the likelihood that others will be able to access images you send to them.
Continued on p 14
ADA Professional Product Review VOL . 1 | I S S U E 1
9
Solid-State Digital
Radiography Systems
We evaluated seven solid state, digital radiography systems: CDR, Dexis
(see Note), DIXI 3, ImageRAYi, RVG 6000, VisualiX eHD, and Sigma.
For our product evaluation, we asked a group of dentists to view images
made in the ADA laboratory. Based on their subjective assessment of the
images, we collected data on overall image quality and their ability to
detect defects in a machined aluminum test block (i.e., perceptibility).
In the laboratory, we assessed spatial resolution of the systems based on
line pair values (See What Line Pair Values Do (and Don't) Mean, p 13).
Contrast, which the dentist evaluators gauged with the Perceptibility
Test, and spatial resolution, which we measured in the laboratory, are
components of overall image quality. We also collected input from 161
dentists who use these products.
Lab Notes
For testing, the manufacturers loaned us three sensors along with the imaging software for each system. To ensure that we were using the equipment
properly, manufacturer representatives came to the ADA, set up the systems, and demonstrated the proper use of the sensors and software.
After the demonstrations, we loaded each brand’s software onto separate, identical workstations. All of the workstations were connected to one monitor,
which was used to view the images. Each workstation surpassed the minimum system requirements as stated by the digital radiography manufacturers.
For all tests, we used the SDX x-ray generator (Schick Technologies, Inc.), operating at 65 kilovolts (peak) and 5 milliamperes, with a focal spot of 0.7
millimeters and a radiation source-to-object (focal-spot-to-sensor) distance of 16 inches.
Once the individual workstations were set up, test images were made with all three sensors. Then, a dentist and scientist trained to use each system viewed
the radiographs and determined that each set of sensors provided equivalent image quality. From that point forward, we used one sensor for each system.
Each of these systems comes with software that can be used to enhance the image, depending on your preferences and needs. The software is critical
to obtaining an optimal diagnostic radiograph; in practice, you would use it to adjust features like contrast and image sharpness. Your preferences can even
be established and programmed at the time of installation based on your individual needs. However, use of software is very personal—the best diagnostic
image for one person might need additional adjustment for another viewer. To control for these individual preferences, we used factory default settings for
acquiring images and did not make any further adjustments or manipulations to the images.
We were trained to use different preset capture modes for ImageRAYi (high contrast and high resolution) and DIXI 3 (normal and enhanced), and
different image display modes for the RVG 6000 (endo and perio). When making the radiographs for the dentist-evaluator tests, we used the “high
contrast” setting for the ImageRAYi system and the “normal” setting for DIXI 3. For the RVG 6000 system, we saved images using the “endo” imagedisplay setting. We chose to use these settings because they provided better contrast, which could influence the dentist-evaluator tests.
Note:
Originally, the DEXIS (Dexis LLC) system was included in our evaluation. Although DEXIS was given the opportunity to comment on the
evaluation protocol and DEXIS representatives initially assisted in set-up and training for use of their system, DEXIS believes that the images evaluated
were not acquired based on appropriate settings of the DEXIS imaging software. The company declined to send a technician to demonstrate the claimed
shortcomings of the images obtained by ADA or to provide ADA with images it had taken with the same sensors for quality control purposes. Because
PPR’s fundamental guiding principle is to provide its readers with scientifically sound information that is representative of our readers’ expected real-life
experience with evaluated products, we have omitted the data on the DEXIS system from this report. We will provide readers with additional
information on the DEXIS system and the digital radiography systems that were covered in this report if and when it becomes available.
CDR
Schick Technologies, Inc.
(718) 937-5765
www.schicktech.com
10
ADA Professional Product Review VOL . 1 | I S S U E 1
DIXI 3
Planmeca
(630) 529-2300
www.planmeca.com
ImageRAYi
Dentrix Dental Systems, Inc.
800-DENTRIX (336-8749)
www.dentrix.com
Dentist Evaluators
The dentists who assessed images made with the systems included
19 clinicians, 14 of whom routinely view radiographs on film.
Images evaluated by this group were made in the ADA laboratories
and supplied to the group as 8-bit TIFF files. During viewing,
ambient light was standardized, and evaluators were asked to maintain a line of vision that was perpendicular to the image. We also
instructed evaluators to use no magnification when viewing the
radiographs. Evaluators viewed full-screen images on the same
monitor, with each sitting the same distance from the monitor.
For a detailed description of our test methods, visit
“www.ada.org/goto/ppr”.
Perceptibility Test
Clinical Significance: Demonstrates the ability of the system to
reproduce defects on an aluminum test block simulating incipient
and moderate dental caries.
Basic Methods: Using a test method described in the literature,1
we machined grooves into an aluminum block dividing it into 15
squares (5 mm x 5 mm). We then randomly picked 10 squares in
which to drill 2-mm–diameter holes of varying depths from 0.1 to
1.5 mm, simulating various stages of dental caries, and left five
squares with no holes. Using each system, we made radiographs of
the block and saved the images as TIFF files (Figure).
The dentist evaluators viewed these radiographs and were asked to
record any radiolucencies that they saw on the image. In scoring
their observations, we calculated percentages for accuracy, sensitivity,
and specificity. “Accuracy” is the number of correct decisions divided
by the total number of possible decisions. “Sensitivity” is the number
of correctly identified radiolucencies divided by the actual number of
holes in the block. “Specificity” is the number of correctly identified
squares with no radiolucencies divided by the actual number of
squares in the block that had no holes.
Results: Dentists had the best success with images from the RVG
6000 (Endo) and the ImageRAYi (High Contrast). They were better
able to correctly identify defects and were less likely to mistakenly
spot defects where there were none when viewing images made with
these systems. See Table 1.
Comments: We rated the perceptibility of these systems in terms of
accuracy, sensitivity, and specificity for identifying defects on the
radiograph. The accuracy score gives you an overall sense of the system’s
ability to correctly depict healthy and unhealthy hard tissue. Higher
scores in the sensitivity column suggest systems that should be better
able to depict actual defects rather than artifacts. Those systems that
scored well in specificity should be less likely to depict intact
structures as having radiolucencies.
RVG 6000
Kodak Dental Systems
(800) 944-6365
www.kodak.com
Figure. Radiograph of machined aluminum block developed for
perceptibility test.
Table 1. Accuracy, Sensitivity, and
Specificity of Evaluated Systems.*
Product
(Setting‡)
Accuracy
(%)
Sensitivity
(%)
Specificity
(%)
Average (±SD)
Average (±SD)
Average (±SD)
CDR
92.3 (± 2.5)
88.9 (± 3.2)
98.9 (± 4.6)
DIXI 3 (Normal)
86.3 (± 4.7)
80.0 (± 5.8)
98.9 (± 4.6)
ImageRAYi (High
Contrast)
93.7 (± 4.7)
91.1 (± 6.6)
98.9 (± 4.6)
RVG 6000 (Endo)
94.0 (± 2.1)
91.1 (± 3.2)
100.0 (± 0.0)
Sigma
88.6 (± 3.3)
82.9 (± 4.9)
100.0 (± 0.0)
VisualiX eHD
86.0 (± 7.7)
81.1 (± 8.1)
95.8 (± 8.4)
* Images were viewed by 19 evaluators for all systems except Sigma. The Sigma images were
not saved to the original CD and had to be submitted separately for evaluation. Seven dentists from the original group evaluated the Sigma images.
† Some systems offer more than one factory-set image capture or image display modes,
which result in differences in contrast and resolution.
Sigma
Instrumentarium Dental, Inc.
(800) 558-6120
www.Instrumentariumdental.com
VisualiX eHD
GENDEX Dental Systems
(888) 275-5286
www.gendex.com
ADA Professional Product Review VOL . 1 | I S S U E 1
11
Image Quality Test
Clinical Significance: Compares the ability of different systems to
depict normal dental structures as evaluated by dentist evaluators.
Basic Methods: Using each system, we made images of a wax-covered
mandible at increasing doses. Two dentists then viewed all the images.
For each system, they chose a series of four images, made at consecutive
doses, that provided acceptable diagnostic quality (limited noise, adequate
contrast, etc.). Those sets were then saved as TIFF files and sent to the
dentist evaluators.
Results: The dentists ranked CDR as having the highest image quality.
Table 2 shows how the dentist evaluators ranked all of the systems.
Table 2. Systems as Ranked by Dentist
Evaluators According to Image Quality.
Mode Score*
Average Score†
6 (Highest)
6.37
ImageRAYi (High Contrast)
5
5.11
RVG 6000 (Endo)
4
4.79
VisualiX eHD
3
4.47
Sigma‡
2
4.05
1 (Lowest)
2.32
Product Setting
CDR
DIXI 3 (Normal)
The dentist evaluators viewed each set of four images and selected one
image for each system that he or she judged as offering the highest diagnostic
quality. Diagnostic quality was defined by their ability to identify the
dentino-enamel junction, periodontal ligament space, pulp chambers, and
root canals. Once they had selected a “highest quality” for each system, we
asked them to go back and rank those images from 6 to 1, with 6 being the
preferred choice. A trained investigator supervised the evaluation and
collection of data.
Comments: The image quality achievable in practice with the use of
software may be different than that seen by our dentist evaluators;
however, the test conditions were standardized for our evaluation to
offer comparative information.
REFERENCES
1. Golubow NA, Farman AG, von Fraunhofer JA, Kelly MS. Direct digital radiography for
the detection of defects in a standard aluminium test object through composite resin restorative materials. Dentomaxillofac Radiol 1994;23(2):91-6.
* Ranking is based on mode score as collected from 19 dentists for all systems except Sigma.
† Based on n = 19 dentists for all systems except Sigma, which is based on n = 7 dentists.
‡ The Sigma images were not saved to the original CD and had to be submitted separately
for evaluation. Seven dentists from the original group evaluated the Sigma images.
Practitioner Input
Via a web-based survey, we collected input from 161 dentists about the
digital radiography systems they use.
Respondents were asked to rate the performance of their digital radiography
systems for ease of set-up or installation, usefulness of the instructions or
user manual, quality of training provided, image quality as compared to
film, the range of sensor sizes available, allowance for infection control,
CDR (n=91)
and ability to transmit images. The pie charts give an overall sense of
how often the systems rated Excellent, Very Good, Good, Fair, Poor, or
Unacceptable. For a precise breakdown of how respondents rated
each feature, visit “www.ada.org/goto/ppr”. Pay special attention to the
number of respondents; ratings are more reliable when they are based on the
opinions of more respondents.
DIXI 3 (n=11)
ImageRAYi (n=15)
Sigma (n=1)
VisualiX eHD (n=8)
RVG 6000 (n=35)
Excellent
12
ADA Professional Product Review VOL . 1 | I S S U E 1
Very Good
Good
Fair
Poor
Unacceptable
What Line Pair Values Do (And Don’t) Mean
Line pair values are a means of quantifying spatial resolution of a system.
New products entering the market should at least achieve the technical
performance of what is already available. In this light, testing for line pairs
ensures maintenance of quality for new products. In addition, increased
resolution becomes an important feature when you magnify images, as is
possible with most digital imaging software.
have their limitations. Theoretical line pair values are calculated based
on pixel sizes and sensor dimensions. For these values, reducing the
size of the pixel would yield a higher line-pair-per-millimeter value,
which suggests better resolution. However, in practice smaller pixel
sizes are associated with greater noise in the image (“noise” is nondiagnostic information that appears on the radiograph).
Beyond these points, the usefulness of line pair values to a clinician
purchasing a digital radiography system is limited. First, resolution is only
one attribute of image quality. The overall quality of a radiograph also will
be defined by the amount of noise in the image and the contrast of darkness
and lightness. All three factors work together to create a basic image, which
can then be modified and adjusted according to your preferences with
software enhancements.
In measuring, the results are specific to your methods: a change in one
variable, such as the type of object used or the source-to-object distance,
can change the line-pair measurement. Thus, you can not compare line
pair values between two systems unless they were determined using
identical test methods. In addition, the clinical usefulness of line pair
testing is further limited because of differences between the objects
being imaged. Line pair testing relies on use of a phantom—a device
that often is made of a very thin sheet of lead or some other metal. By
contrast, you will be imaging human tissue.
Second, line pairs can be determined in two ways: by calculating a
theoretical value or by direct measurement (as we did). Both methods
Putting Line Pair Values in Perspective
We measured line pairs because they typically are reported in evaluations and promotional information for digital radiography systems. However,
we wanted to discuss this test separately from the others because the usefulness of line pair values in selecting a system is debatable. Often, the
value can be mistaken as an indication of the overall image quality you can expect to get with a system. We wanted to explain, and demonstrate,
that this is not the case.
ADA Testing
For these systems, we documented line-pair resolution in two ways. We
made images of a lead line pair phantom using each system. Working
independently, four examiners looked at these images, under identical
viewing conditions. The examiners recorded the maximum number of
line pairs per millimeter they could view. During viewing, they were
blinded to the identity of the system.
RESULTS: In both the CFR curve and visual assessments, images
made with the RVG 6000 in the “perio” mode had the highest spatial
resolution. Results are presented in Table 3.
COMMENTS: Our testing evaluated each system under identical conditions,
which allows you to use our data to compare the systems. We should note
that there was no direct correlation between how the systems compared
to one another in these tests and how the dentist evaluators rated them in
overall image quality (See Table 2).
The second method used the same images to plot a Contrast Frequency
Response Curve (CFR), which portrays the level of contrast at different
line pairs per millimeter. For a more detailed description of our testing
methods, go to “www.ada.org/goto/ppr”.
Conclusion
Lack of a simple, direct relationship between resolution and final diagnostic
image quality indicates that purchasing decisions should not be based solely
on line pair values. In practice, image quality will depend on the quality of
the sensor you’re using, your computer and associated hardware, the monitor,
x-ray generator features (cone length, focal spot size, voltage, and current
settings), sensor positioning, angulation, and ultimately the software filters.
Table 3. Line Pair Resolution for Tested Digital Radiography Sensors.
Product (Setting*)
Exposure
Time
(sec)
Resolution (lp/mm)
Based on
CFR
curves†‡
Average§
Range§
Based on Visual Examination
CDR
0.18
9
9.6
8 - 10
DIXI 3 (Normal)
0.40
8
6.6
6-7
DIXI 3 (Enhanced)
0.40
12
12.6
12 - 14
ImageRAYi (High Contrast)
0.20
9
7.4
6 – 9.5
ImageRAYi (High Resolution)
0.20
10
10.6
9 - 14
RVG 6000 (Endo)
0.18
12
10.8
9 - 12
RVG 6000 (Perio)
0.36
18
18
16 - 20
Sigma
0.22
12
7.4
7-8
VisualiX eHD
0.25
12
11.6
10 – 12.5
* Some manufacturers trained us to use different image capture or display modes. For those products, we conducted this test at each mode.
† Recorded as the resolution at which the contrast is greater than 5% of maximum value.
‡ Contrast Frequency Response Curve is a plot of image contrast vs. image frequency (resolution) and is used to portray the level of contrast at different line pairs per millimeter.
For more information, see the testing protocol at “www/ada.org/goto/ppr”.
§ Average and range of visible line pairs per millimeter as recorded by four independent examiners, working under identical conditions and blinded to the identity of the system
when viewing images.
ADA Professional Product Review VOL . 1 | I S S U E 1
13
Table 4. Buyer’s Summary for Tested Digital Radiography Systems.
Product
(No. of Practitioner
Input Respondents)
CDR
(n = 91)
DIXI 3
(n = 11)
Practitioner Input*
Excellent
%
24
Very Good
%
38
Good
%
27
Package Price†
(sensor size included
with purchase)
OtherII
%
$8,137 (Size 0 sensor)
0: 31x22
(24x18)
$10,587 (Size 1 sensor)
1: 37x24
(30x20)
$11,814 (Size 2 sensor)
2: 43x30
(36x25.6)
$11,759 (Size 1 sensor)
1: 23.1x40.8
(10.5x35)
$13,657 (Size 2 sensor)
2: 29.6x42.8
(26x37)
$11,685 (Size 1 sensor)
1: 39.5x25
(30.10x20.07)
$12,685 (Size 2 sensor)
2: 42.5x30.5
(36.08x25.6)
$12,685 (Size 2BW sensor)
2BW: 42.5x32.5
(36.08x27.5)
$12,745 (Size 1 sensor)
1: 40x27
(30x22)
$13,480 (Size 2 sensor)
2: 45x32
(36x27)
$10,480 (Size 1 sensor)
1: 24x36
(20x32)
$11,920 (Size 2 sensor)
2: 30x40
(26x34)
$9,500 (Size 1 sensor)
1: 37.5x25.5x7
(31x21)
$10,300 (Size 2 sensor)
2: 40.5x33x7
(34x27)
12
29
40
21
9
29
38
23
11
ImageRAYi
(n = 15)
RVG 6000
(n = 35)
Sigma
(n = 1)
30
0
VisualiX eHD
(n = 8)
9
27
14
40
28
57
36
Sensor Size‡:
Dimensions
(active area)
mm
14
29
15
Warranty§
2 years
2 years
2 years
3 years
2 years
2 years
* Via a web-based survey, 161 dentists had the option of rating the performance of up to two brands. Indicates percentage of time a rating was selected for a product. Ratings are more reliable for
products that have more respondents.
† MSRP as of April 2006. Retail prices may vary. Packages include one sensor, software, and training.
‡ Manufacturers identify their sensors using a system that corresponds to conventional film numbering.
§ Extensions may be available. Check with manufacturer.
II Other: Sum of Fair, Poor, and Unacceptable ratings.
A Primer on Purchasing Considerations
Training. Incorporating a new system into your office will require that you
and the dental team learn a variety of new skills, including positioning the
sensors to get the image you want while keeping your patients comfortable,
using the software, and basic troubleshooting when you run into problems.
You and your staff should be prepared for a learning curve. To help prepare
for the transition, anyone who will be using the new technology should be
encouraged to take courses and try out equipment at trade shows. When
evaluating systems, ask whether training sessions will be included with your
purchase, and find out whether that training will be given on-site with a
14
ADA Professional Product Review VOL . 1 | I S S U E 1
continued
trainer, or via web-based or video modules. If the training is offered on-site,
will the trainer have a clinical background? Also, ask how many hours are
included in the training and how much it would cost to schedule additional
training sessions. The work hours for their technical support staff, number of
staff available to answer questions, policies for repair, and availability of
loaner sensors also are useful questions to ask.
REFERENCE
1. American Dental Association. Technical Report No. 1023: Implementation Requirements for
DICOM in Dentistry. Chicago: 2004.
BUYER’S CHECKLIST: DIGITAL RADIOGRAPHY SYSTEMS
Copy and complete for each Digital Radiography System you consider buying.
Model & Manufacturer: ___________________________________________________________________________________________
Sensor Features
Technology: ______________________________________
Sizes Available: ___________________________________________
Sensor Dimensions (mm): ___________________________
Wireless Options: _________________________________________
Active Area Dimensions (mm): _______________________
Infection Control: _________________________________________
Positioning System: __________________________________
Software Features
Single/Series Images: _______________________________
Storage File Format Options: _________________________________
Ability to Track Changes: ____________________________
DICOM Compliant: _______________________________________
Available Image Enhancement Tools: ___________________________________________________________________________________
Safeguard Against Accidental Image Deletion: ____________________________________________________________________________
Compatible With Your Practice Management Software: _____________________________________________________________________
Company Features
Warranty: _______________________________________________________________
# of Staff in Tech Support: _____________
Sensor Loaner/Repair Availability (Cost): ______________________________________
Years in Business: ____________________
Minimum System Requirements
Processor: ___________________________
RAM: ___________________________
Hard Disk: _____________________________
Operating System: ______________________________________
Video Card: _____________________________________________
Interface: _____________________________________________
Monitor: ________________________________________________
Suggested X-Ray Requirements
Voltage: _____________________ KVp Current: ______________________ mA
Focal Spot: ___________________________
Exposure Time Options: ____________________________________________________________________________________________
Training
# of Hours Included With Purchase: ___________________________________ Cost for Additional Training: $_______________________
On-Site: _________________________ Web-Based: ________________________ Video/DVD/CD-ROM: _______________________
Technical Support
By Phone (hours available): ______________________________________ On-Site (fee): $______________________________________
Pricing
Training Costs (Hardware/Software) $__________________________ Overall Package Cost $____________________________________
(1 Sensor + Software + Training)
Sensor Cost $_________________________
Software Cost $_________________________
Additional Workstation License Cost $_________________________
ADA Professional Product Review VOL . 1 | I S S U E 1
15
The Back Page a quick summary
Carbide Burs
The Editor’s Bottom Line
Overall, the burs performed equally well in the laboratory with the
exception of cutting rate, where NTI and Tri Hawk performed best.
Among the multi-use burs, NTI also showed limited loss of cutting
efficiency after one cut-and-autoclave cycle. Surveyed dentists were
satisfied with the burs they were using.
The primary differences among the brands of 557 burs evaluated
are cutting rates and price. Tri Hawk burs have the highest
cutting rate and at $1.19 each are 25 to 67 percent less expensive
than the other two brands of single-use burs. NTI multi-use
burs have a similar cutting rate to Tri Hawk and will cost $0.70
per use assuming two uses prior to disposal.
The Editor’s Bottom Line
Posterior Composites
All the tested materials passed the basic laboratory tests, and
our practitioner survey showed equal satisfaction with their
product’s clinical handling. The main differences among the
materials were in radiopacity and depth of cure. Heliomolar
HB and Esthet-X were significantly more radiopaque than the
other materials and more radiopaque than enamel. Herculite
XRV, GrandiO and Filtek Supreme Plus had significantly
greater depth of cure.
In the lab, the posterior composites performed equally well for
shade and color stability, water sorption and solubility, and
polishability. Distinguishing performances between brands
were evident for depth of cure, radiopacity, flexural strength,
polymerization shrinkage stress and stress rate. From the clinical
perspective, survey respondents who use these products were
equally satisfied with all of the brands.
Digital Radiography
Systems
In testing these systems, we opted to use default settings for image capture
and viewing in an effort to control the influence of personal preferences on
our results. In practice, software has a major influence on the clinical
success of digital radiography. Use our results to see how the systems
compared to one another in a controlled setting, but try them out for
yourself to see how you like the equipment and software. Then, base
your ultimate purchase decision on what fits with your existing office set
up (See Primer, p9), some of the features listed in Table 4 (p14), and your
comfort level with the system’s software.
The Editor’s Bottom Line
No single laboratory test or dentist evaluation will answer the
question of "Which system should I buy?" Before purchasing a
digital radiography system, it is critical to prioritize the goals
you wish to achieve by adding this technology to your practice.
Once you've established your goals, match them with our
evaluation results, and see a demonstration of two or three systems
likely to help you meet those goals. Before making a final
decision to purchase, ask for an in-office trial demonstration.
ADA.org Offers More Product Information
The ADA’s Web site now hosts a special section for the Professional Product Review at “www.ada.org/goto/ppr”. Our online space offers background on
the program and features extra information to supplement our product reviews. We also will have a Letters to the Editor section so you can share your
views and see what others have to say.
Here’s what you’ll find online to supplement this issue:
• The complete transcript of our Expert Panel discussion on posterior composite resins;
• Interviews with three dentists about their digital radiography systems and experiences;
• Comparative information about sensors for digital radiography systems (CCD, CMOS, and PSP); and
• Detailed descriptions of the methods used to test the reviewed products.
Neither the ADA nor any of its subsidiaries has any financial interest in the products evaluated in this publication. In some cases, the ADA may accept the loan of high
cost items for evaluation. Any loaned item is returned to the manufacturer/supplier when the evaluation is complete. The ADA requires all contributors and consultants
to this publication to abide by its policy on conflicts of interest. This publication is not a substitute for the dentist's own judgment about a particular product or service.
Although the ADA tries to be current, information may become outdated. In no event shall American Dental Association or its officers, employees, agents or consultants
be liable for any damages of any kind or nature, including, without limitation, direct, indirect, special, consequential or incidental damages or loss of profits arising from,
or in connection with, the use of or reliance upon any information in this publication, regardless of whether it has been advised of the possibility of such damages.
Reference to any product shall not be deemed an endorsement of that product. The information contained in this publication is intended solely for ADA members and
other subscribers and may not be used in advertising or for any other commercial purpose in any form or media, including on the Internet, in press releases or in
newsletters, except for reprints obtained directly from PPR. For reprints, contact (312) 440-3528.
16
ADA Professional Product Review VOL . 1 | I S S U E 1
©2006 American Dental Association. All rights reserved.