1
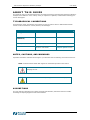
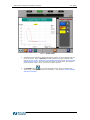
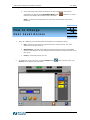
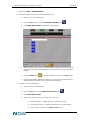
70X i
COLD FLOW PROPERTIES
LABORATORY ANALYZER
USER GUIDE
70Xi Cold Flow Properties Laboratory Analyzer
User Guide
N OT I C E O F P R O P R I E TA RY I N F O R M AT I O N
AND COPYRIGHT
Copyright © 2010 Phase Technology. All rights reserved. No part of this publication, or any software
included with it, may be reproduced, stored in a retrieval system, or transmitted in any form or by any
means, including photocopying, electronic, mechanical, recording or otherwise, without the prior written
permission of this copyright holder, Phase Technology.
The following document contains proprietary information of Phase Technology. These contents are
confidential and any disclosure to persons other than the officers, employees, agents or sub-contractors of
the owner or licensee of this manual, without the prior consent of Phase Technology, is strictly prohibited.
Phase Technology
11168 Hammersmith Gate
Richmond, BC, Canada V7A 5H8
Phone: 604-241-9568
Fax: 604-241-9569
www.phase-technology.com
Customer Service & Support:
[email protected]
2
70Xi Cold Flow Properties Laboratory Analyzer
User Guide
TA B L E O F C O N T E N T S
Section 1:
How to Connect and Power On the Analyzer
5
Section 2:
How to Prepare Test Samples
7
Section 3:
How to Run Tests Using Pre-defined Favorites
8
Section 4:
How to Change Test Settings
8
Section 5:
How to Create and Modify Favorites
10
Section 6:
How to View Test Results
10
Section 7:
How to View Phase Plots
11
Section 8:
How to Use QC Chart Limits, Sample Specifications,
and Trending of Test Results
11
Section 9:
How to Change User Level Access
15
Section 10:
How to Shut Down and Restart the Analyzer
17
Section 11:
How to Use the Analyzer’s Connectivity Features
17
Appendix A. How to Use DrySac
22
Appendix B. How to Pipette a Sample
23
Appendix C. Cleaning & Routine Maintenance
25
Appendix D. FAQ: Calibration, Recertification and Maintenance
28
Appendix E. Understanding & Using Phase Plots
30
Appendix F. Customer Service & Support
33
Appendix G. Warranty
34
3
70Xi Cold Flow Properties Laboratory Analyzer
User Guide
ABOUT THIS GUIDE
This guide will help you become familiar with your Phase Technology 70Xi Cold Flow Properties Laboratory
Analyzer and its features. In the unlikely event you experience a problem, contact Phase Technology for
service and support.
TYPOGRAPHICAL CONVENTIONS
Throughout this guide, the following conventions are used to make it easier to differentiate between
names of various windows or screens, buttons, and messages:
Convention
Meaning
Example
Bold upper & lower case
Screen or window name
Control Panel
BOLD ALL UPPER CASE
(CAPITALS)
Buttons on the touch screen
RUN
“Text in parenthesis”
Message displayed on screen
“Run Count = xxx”
Text in bold blue italics
Refers to another chapter or
section in User Guide
please refer to the
Analyzer Options section
NOTES, CAUTIONS, AND WARNINGS
Important information and alerts are brought to your attention with the following conventions and icons:
NOTE: Indicates further details that support the information provided in the section.
CAUTION! Indicates situations that require attention to prevent
damaging the unit.
WARNING! Indicates necessary safety precautions to avoid injury.
ASSUMPTIONS
This user manual is designed to be used by chemists and laboratory technicians who have a basic
knowledge of sampling equipment and instrumentation.
4
70Xi Cold Flow Properties Laboratory Analyzer
User Guide
How to Connect and Power On
the Analyzer
1
1.
The analyzer should be set up on a flat, vibration-free surface in a well-ventilated location.
2.
On the back of the analyzer, remove the red caps that cover the “PURGE IN” and “PURGE OUT”
fittings. These caps should be kept with the shipping box and related packing materials.
3.
Attach the dryer bottle assembly to the back panel by fitting the two mounting bracket holes over
the two mounting screws.
4.
Separate the quick-connect fittings on the dryer bottle. Press the latch on the female fitting and
pull them apart.
5.
Attach the quick-connect fittings to the “PURGE IN” and “PURGE OUT” fittings on the back of the
analyzer. A “click” sound confirms that the fittings have snapped into place.
6.
Open the chamber lid and remove the cardboard protector and the DrySac. Close and lock the lid
tightly.
7.
Connect the power cable to the back of the 70Xi Analyzer. Plug the power cable into a grounded
AC outlet that is a dedicated circuit. Use a power surge protector, equipped with a line filter, if
your power source is unstable or noisy.
8.
To power up the analyzer, press the round button at the bottom right hand side at the front of
the analyzer.
9.
The analyzer will perform a set of self tests to verify that each of the main components of the
analyzer, including the optics system and cooling system, are operating correctly. If a problem is
detected, the self tests will stop and a message will be displayed at the bottom of the screen.
If any component fails the self tests, press the INTELLINOSTICS button
information and troubleshooting steps.
for further
If Pour Point function is available, the message, “Remove sample then press Continue” will be
displayed at the end of the self tests. If the sample cup is empty, press CONTINUE to proceed,
otherwise remove the sample with a cotton swab, then press CONTINUE. The analyzer will
perform an auto-purge function as a final step of the self-tests.
10. After the self-tests are completed, the analyzer shows the Home screen (Fig. 1). The analyzer
returns to this screen whenever the HOME button
is pressed.
5
70Xi Cold Flow Properties Laboratory Analyzer
User Guide
Figure 1: Home screen
a.
The Sample Cup temperature, Optics light Signal, and Run Count are displayed at the
top of the screen. A set of Favorites buttons is listed on the right hand side (See
sections 3. How to Run Tests Using Pre-defined Favorites and 5. How to Create
and Modify Favorites). The main area in the middle is initially blank, but displays a
phase plot when a test is done, or if a previous plot is opened
b.
The ACCESS button
on the lower left hand corner is used for changing user
access levels, resetting the analyzer, and shutdown. (See section 9. How to Change
User Access Levels).
6
70Xi Cold Flow Properties Laboratory Analyzer
How to Prepare Test Samples
User Guide
2
1.
Phase Technology recommends filtering and drying test samples so that they are bright and clear
in appearance and free of excessive moisture before testing. Refer to APPENDIX A: How to Use
DrySac for more details on drying the sample.
2.
Using the supplied Gilson pipette, dispense 150µL into the sample cup. Refer to APPENDIX B:
How to Pipette a Sample.
3.
If testing non-viscous samples such as jet fuels and diesels, rinse the cup twice with the sample
to be tested, and then load a third 150 μL aliquot for testing.
4.
If testing viscous samples such as lubricants and base oils, remove as much sample as possible
using a cotton swab, and then dip a clean cotton swab into solvent (such as heptane) for a few
seconds to clean the sample cup, and do this repeatedly as needed. Then load 150 μL of the
sample to be tested. After loading the sample, close and lock the lid.
CAUTION! Do not use ketones such as acetone or methyl ethyl ketone.
These solvents can damage the analyzer.
CAUTION! Use only swabs with plastic or paper stems to clean the
sample cup. The use of swabs with wooden or bamboo stems will damage
the mirrored surface of the sample cup. For optimal protection against
scratching, use cotton swabs supplied only by Phase Technology.
5.
If testing jet fuel, the sample needs to be dried appropriately. Make certain to filter all unclear jet
fuel samples. When testing clear samples such as finished jet fuel or kerosene or any wet filtered
samples, follow the procedure in reference APPENDIX A: How to Prepare Samples with
DrySac.
6.
There is an indicator light on the test chamber lid. When the light is red, the test chamber is
cold, and the chamber lid must not be opened. When the indicator light is green, it is safe to
open the lid
CAUTION! Never open the test chamber lid when the lid indicator LED is
red. Only open the lid when the LED is green.
7
70Xi Cold Flow Properties Laboratory Analyzer
User Guide
3
How to Run Tests Using
Pre-defined Favorites
1.
To start a run using a predefined test setting, press and hold (for one second) one of the favorite
buttons (see section 5. How to Create and Modify Favorites).
2.
During the test, the LED on the test chamber lid will be red, indicating that the chamber is
running, and the lid should not be opened.
a.
The STOP TEST button
b.
After the run has finished, the REPEAT TEST button
the same settings.
will abort a test that is in progress.
will rerun the test using
How to Change Test Settings
1.
4
The analyzer’s current test settings, such as the Sample ID, Run Mode, and Sample Type,
Temperature unit, etc. can be viewed or modified from the Settings window (Fig. 2). The
Settings window can be opened by tapping a favorite or pressing the arrow button
beside the Favorites window.
2.
Changing the analyzer settings requires permission to be enabled by the administrator (see
section 9.How to Change User Access Levels).
8
70Xi Cold Flow Properties Laboratory Analyzer
User Guide
Figure 2: Settings
The prefix “QC-“ is reserved for the names of QC samples. (see section 8. How to Use QC Chart and
Limits, Sample Specifications and Trending of Test Results). Press SET AS QC button (next to the
sample ID box)
to the sample.
to assign the current sample to be a QC standard. The prefix “QC-“ will be added
NOTE: samples designed with “QC” status are automatically compared to established control limits after a
test. A message alerting users to QC failure will appear on screen should this occur.
3.
Press the RUN button
4.
Press the ADD TO FAVORITES button
to save the current settings as a new favorite. The
existing Sample ID will become the name of the new favorite.
5.
Press the HOME button
6.
The Settings window can also be closed by a horizontal swiping motion on the touch screen,
moving across the bottom of the window.
to start a test run using the current settings
to close the Settings window and return to the Home screen.
9
70Xi Cold Flow Properties Laboratory Analyzer
User Guide
How to Create
and Modify Favorites
1.
2.
5
Creating and modifying existing favorites require permission to be enabled by the administrator
(see section 9. How to Change User Access Levels).
To create a new favorite, open the Settings window, either by pressing an existing favorite or
on the thin bar to the left of the Favorite list. In the Settings
pressing the arrow button
window, make any desired changes to the settings.
3.
to save the current settings into a new favorite.
Press the ADD TO FAVORITES button
The Sample ID will be the name of the new favorite.
4.
The order in which favorite buttons appear in the list may be rearranged by dragging and
dropping any button upwards or downwards.
5.
To delete a favorite, drag and drop the favorite button onto the TRASH icon
at the lower
right of the favorites window. (The Trash icon is displayed only while dragging a favorite).
How to View Test Results
1.
6
The 70Xi analyzer has the ability to multitask, so previous results and phase plots may be viewed
even while the analyzer is running a current test.
The RESULTS HISTORY button
displays a table of previous test results.
2.
The table of results may be sorted by any one of the columns by pressing the desired heading
(Test #, Date/Time, sample ID, Run Mode, Sample Type, Result). Repeated presses will toggle
between ascending or descending sorting order. It is also possible to search or filter for a specific
type of result by using the Search window to the left of the table of results.
3.
If there is a note attached to a test result, it will be indicated by a note icon
the icon to read the note.
4.
To view the corresponding phase plot of a result, press the desired row in the table of results.
(see section 7. How to Review Phase Plots for more information on phase plots.)
5.
Press the HOME button
. Press and hold
to return to the Home screen.
10
70Xi Cold Flow Properties Laboratory Analyzer
How to View Phase Plots
User Guide
7
When the 70Xi analyzer completes a test run, a phase plot is displayed on screen with the final test result.
(See figure 1: Home Screen)
The phase plot is a graph with the temperature on the horizontal axis and the optics (scattered light)
signal on the vertical axis. When the sample is completely liquid, the optics signal maintains a low and
flat baseline level, but the presence of wax crystals causes a rise in the signal.
A pour point plot shows a sequence of vertical bars that indicate the amount of movement in the sample
when it is perturbed at progressively colder temperatures.
1.
To zoom in on part of the phase plot, use the touch screen to drag and paint a rectangle over the
area of interest and release.
The ZOOM OUT button
rescales the phase plot to show the entire graph on the screen.
2.
The OVERLAY button
comparison purposes.
3.
To annotate the phase plot with a note, press the NOTE icon
, at the upper right of the
screen, and type in the desired text. Such notes can serve as useful and customized reminder of
the specific result. A note icon will accompany the line of result.
4.
The °CÙ°F button
Celsius and Fahrenheit.
5.
is available for Pour or Pour & Cloud point tests. It switches the
The SWITCH PLOT button
view between the light signal graph and the sample movement graph.
allows two or more phase plots to be overlaid on the screen for
switches the temperature scale of the phase plot between degree
How to Use QC Chart Limits,
Sample Specifications and
Trending of Test Results
1.
8
QC Samples and Control Limits
a.
All QC samples are identified with the “QC-“ prefix in the sample ID. Press SET AS QC
in the Settings window (see section 4. How to Change Test Settings) to assign the
current sample as a QC standard (i.e. analyzer will automatically add the “QC-“ prefix to
the current sample ID).
11
70Xi Cold Flow Properties Laboratory Analyzer
User Guide
b.
In order to enter (or auto-calculate) control limits, there must be an existing Favorite for
the QC sample. Refer to section 5. How to Create and Modify Favorites for more
information.
c.
Only administrators are allowed to enter or modify QC control limits (see section 9.
How to Change User Level Access).
d.
To assign control limits, press ANALYZER OPTIONS
screen.
e.
On the Analyzer Options screen, press QC CONTROL LIMITS. The following window
appears.
f.
Select the QC sample in the list box that you wish to enter or modify the control limits.
g.
Select the Temperature Unit (°C or °F) at the top of the window.
h.
Enter the Upper Limit, Lower Limit and/or Centerline values for the corresponding run
modes.
i.
QC upper and lower control limits (UCL, LCL) can also be automatically calculated by the
analyzer following ASTM D6299 methodology if there are a minimum of 20 valid data
points. The analyzer also allows the user to manually identify and exclude outliers before
calculating the control limits.
j.
Press the HOME button
k.
Whenever the test result of a QC sample exceeds the control limits, a pop-up window
will appear with the message “The last QC test exceeded the control limit
requirements!.” This pop-up window will appear each subsequent time the analyzer
starts a non-QC test under the same run mode that has failed the previous QC test, until
one of the following rectifying conditions are met:
1)
button from the Home
to save the control limits and return to the Home screen.
Re-run another QC test that meets the control limits
12
70Xi Cold Flow Properties Laboratory Analyzer
2)
l.
User Guide
Have an Administrator acknowledge the error message by pressing OK on the
pop-up window
Failed QC tests are flagged in the Results History screen with a
icon. QC tests
performed without any control limits are flagged in the Results History screen with a
icon.
2.
Specification Limits for Non-QC Samples
a.
Upper and lower limits can also be assigned to sample not designated for QC purposes.
Such limits may be internal production specification and hence useful for monitoring.
Alerts are accordingly generated by the analyzer in case these limits are exceeded.
b.
In order to enter sample specifications, there must also be an existing Favorite for the
sample. Refer to section 5. How to create and modify Favorites for more
information.
c.
Only administrators are allowed to enter or modify sample specifications (see section 9.
How to Change User Level Access).
d.
To assign specification limits, press ANALYZER OPTIONS
e.
On the Analyzer Options screen, press SAMPLE SPECIFICATIONS
f.
Select the sample in the list box that you wish to enter or modify the specification limits.
g.
Select the Temperature Unit (°C or °F) at the top of the window.
h.
Enter the Maximum Specification, Minimum Specification and/or Expected Value for the
corresponding run modes.
from the Home screen.
13
70Xi Cold Flow Properties Laboratory Analyzer
i.
Press the HOME button
screen.
j.
Whenever a sample test result exceeds the specifications, a pop-up window will appear
with the message “The last test exceeded the sample specifications!” Tests that
exceeded the sample specification limits are flagged in the Results History screen with
a
3.
User Guide
to save the sample specifications and return to the Home
icon.
Control Charts and Trend Graphs
a.
Trend graphs (i.e. time vs. test results graph) can be constructed for both QC and nonQC samples. Such a plot illustrates the test results of a particular sample (of a specific
sample ID) over time, and can serve as a trending plot.
b.
To generate a control chart (for a QC sample) or a trend graph, press RESULTS
HISTORY
from the Home screen.
c.
From the Results History screen, press the TREND GRAPH button
Graph panel appears.
d.
Select the sample in the list box, or enter the desired sample ID to generate the control
chart or trend graph for that sample.
e.
Once the control chart or trend graph is generated, the phase plot for any result on the
chart or graph can be opened simply by touching the data point on the graph.
f.
The QC Control Limits and Sample Specifications button
accesses those
screens directly from the trend graph screen (for administrators only)
. The Trend
14
70Xi Cold Flow Properties Laboratory Analyzer
g.
User Guide
In the case of QC control chart, the analyzer can also calculate the control limits
automatically by pressing the CALCULATE LIMITS button
instructions to identify outliers before actual calculation.
. Follow the on-screen
NOTE: a minimum of 20 data points are required for the automatic control limits
calculation.
9
How to Change
User Level Access
1.
2.
There are 3 different user levels that allow varying degree of configuration control:
a.
User: lowest level that may have restricted access to certain features. This is the
default user level upon power up
b.
Administrator: level that can be password protected and has access to all available
features. Administrators can also configure access permissions of certain features for the
User group
c.
Factory: reserved for factory use only
To change the current user level, press the ACCESS button
“Access” screen appears (see Fig. below)
at the lower left corner. The
15
70Xi Cold Flow Properties Laboratory Analyzer
User Guide
3.
Select either USER or ADMINISTRATOR
4.
To setup or modify the password at the Administrator level:
5.
a.
Switch user level to Administrator
b.
From the Home screen, press the ANALYZER OPTIONS button
c.
Press USER LEVEL ACCESS. The following screen appears.
d.
Enter a password of your choice for the Administrator Password. This step should be
performed by an authorized administrator. The screen also allows other permission
settings.
e.
Press the HOME button
f.
Once the administrator password has been set up, the analyzer will prompt for the
password each time the user level is switched to Administrator
.
to save the settings and return to the Home screen
To modify User group permissions:
a.
Switch user level to Administrator
b.
From the Home screen, press ANALYZER OPTIONS button
c.
Press USER LEVEL ACCESS
d.
Select either “Allow” or “Deny” for access at the User level:
1)
Favorites Changes – adding, deleting or organizing favorites
2)
Test Settings Changes – modify test settings for any of the Favorites
3)
Function Tests – access to the Function Tests screen
16
70Xi Cold Flow Properties Laboratory Analyzer
4)
e.
User Guide
USB File Transfer – data file transfers between analyzer and USB ports ( e.g.
flash memory devices)
Press the HOME button
to save the settings and return to the Home screen
10
How to Shut Down and
Restart the Analyzer
NOTE: it is very important to follow the steps below to either shut down or restart the analyzer properly.
Hard shut downs such as unplugging the power cord while the analyzer is powered on may cause data
corruptions and/or permanent damage to the analyzer.
1.
To shut down the analyzer, press the ACCESS button
and then press the SHUT DOWN
button
2.
To restart analyzer, press the ACCESS button
and then press the RESTART button
2
How to Use the Analyzer’s
Connectivity Features
1.
11
Data Download via USB
a.
To download data from the analyzer to a USB memory stick, simply insert the USB
memory stick to the front USB port (beside the power button). The USB Download
screen will automatically appear (see figure on next page).
17
70Xi Cold Flow Properties Laboratory Analyzer
b.
User Guide
There are 5 different types of data files that can be downloaded from the analyzer to the
USB memory stick:
1)
DIAGNOSTIC FILES FOR CUSTOMER SERVICE
This option downloads all necessary files for Phase Technology’s Customer
Service department to review and perform further data analysis for
troubleshooting
2)
SUMMARY OF ALL TEST RESULTS (.CSV)
This option downloads a summary of all test results to a CSV file (Results.csv).
Spreadsheet programs like MS® Excel can be used to display the data and do
further analysis
3)
DETAIL PHASE PLOT DATA OF INDIVIDUAL TESTS (.DAT)
This option will open another window for user to select individual tests and
phase plot data. Phase plot data files can be opened and viewed on an external
PC with Phase’s LTB program.
4)
BACKUP SOFTWARE
Before upgrading to newer software, it is recommended to use this option to
backup the existing software onto a secondary (USB) memory device
5)
FACTORY USE ONLY
Reserved for factory use only
c.
Transfer file location: All files will be downloaded to the PHASE_70Xi/[Analyzer Serial
Number] (e.g. PHASE_70Xi/201030001) folder on the USB memory stick
18
70Xi Cold Flow Properties Laboratory Analyzer
d.
You can also import a supported document (.doc, .pdf, .ppt and .pps) into the analyzer
by pressing IMPORT USER DOCUMENTS. The analyzer will automatically search for
and list all supported documents in the root directory of the USB memory stick. Simply
select the desired document to upload and enter a document title. Once uploaded, you
can find and view any imported documents by pressing the ANALYZER OPTIONS
button
e.
2.
User Guide
on the Home screen, and then pressing IMPORTED DOCUMENTS.
When all file transfers are completed, simply remove USB memory stick from the USB
port to close the USB Download screen
LIMS (optional)
a.
LIMS connection is through either the RS232 “Serial Port B” analyzer or the Ethernet
port, both located at the back of the analyzer.
b.
For serial connection to PC, set the following:
Baud rate: 38400
Data: 8 bit
parity: none
Stop: 1 bit
Flow control: none
c.
To setup the location of the results file for LIMS through the Ethernet port:
1)
Switch user level to Administrator (see section 9. How to Set User Level
Access)
2)
From the Home screen, press ANALYZER OPTIONS button
3)
Press SETUP
4)
On the Setup screen, press CHANGE beside the Ethernet LIMS Filename field
5)
You may be prompted to enter a user name, password and domain name to
access your lab’s internal network
19
70Xi Cold Flow Properties Laboratory Analyzer
User Guide
NOTE: make sure the “Save Credentials” check box is selected (i.e. has check
mark). After pressing OK, analyzer will ask whether to save the credentials.
Selecting “Yes” will eliminate the need to enter the user name and password
each time the network location is accessed.
6)
Once connected to your lab’s internal network, a list of computers on the
network will appear. Simply select the destination computer and folder name
where the results file (PhaseResults.csv) should be placed
7)
Press the HOME button
screen
8)
An icon at the top right corner of the analyzer screen will indicate whether the
connection to the Ethernet location is successful:
to save the settings and return to the Home
- Connection is successful
- No connection
d.
e.
3.
To setup automatic LIMS output after each test:
1)
Switch user level to Administrator (see section 9. How to Set User Level
Access)
2)
From the Home screen, press ANALYZER OPTIONS button
3)
Press SETUP
4)
On the Setup screen, select either OFF or ON for Automatic LIMS Output
5)
Press the HOME button
screen
to save the settings and return to the Home
To test LIMS:
1)
From the Home screen, press ANALYZER OPTIONS button
2)
On the Analyzer Options screen, press LIMS TEST. A default result string
will be sent to the RS232 port and Ethernet LIMS location
Printer (optional)
a.
Either a PCL-compatible printer or a compatible label printer can be connected to one of
the two USB ports at the back of the analyzer
NOTE: most HP printers are PCL-compatible
b.
To setup the printer model (either PCL Laser, PCL Inkjet or label printer):
1)
Switch user level to Administrator (see section 9. How to Set User Level
Access)
2)
From the Home screen, press the ANALYZER OPTIONS button
20
70Xi Cold Flow Properties Laboratory Analyzer
c.
d.
4.
User Guide
3)
Press SETUP
4)
On the Setup screen, select the appropriate setting for Printer Model
5)
Press the HOME button
screen
to save the settings and return to the Home
To setup automatic printing after each test:
1)
Switch user level to Administrator (see section 9. How to Set User Level
Access)
2)
From the Home screen, press ANALYZER OPTIONS button
3)
Press SETUP
4)
On the Setup screen, select either OFF or ON for Automatic Printing
5)
Press the HOME button
screen
to save the settings and return to the Home
To test the printer
1)
From the Home screen, press ANALYZER OPTIONS button
2)
On the Analyzer Options screen, press PRINTER TEST. A default result will
be printed
Barcode Scanner (optional)
a.
The barcode scanner can be connected to one of the two USB ports at the back of the
analyzer
b.
To scan a barcode as the sample ID, simply press SCAN BARCODE beside the Sample
ID filed in the Settings window (see section 4. How to Change Test Settings), then
scan the barcode with the scanner
21
70Xi Cold Flow Properties Laboratory Analyzer
User Guide
Appendix A. How to Use Drysac
What Is DrySac?
DrySac is a small pre-packaged desiccant which can be used to remove water from hydrocarbon jet fuel
samples prior to testing.
Laboratory tests have shown that using a desiccant is an effective way to remove moisture without
introducing bias. Drysac does not remove hydrocarbon components, and has no effect on the hydrocarbon
feeezing point.
DrySac can minimize the effects of moisture and improve the quality of test results in some samples,
especially in situations where atmospheric conditions may introduce water into the system. In certain
samples, using Drysac improves repeatability.
How and When to Use DrySac
When testing jet fuels, it is recommended that samples be dried prior to beginning the test run. To treat
the sample, place a fresh DrySac in an empty, clean vial. Fill the vial with enough sample to completely
cover the DrySac (between 5 - 10 mL). Put the cap on the vial and swirl the contents a few times. Let the
DrySac sample dry for a few minutes. Sample is now ready to be pipetted into the chamber.
DrySac can also be placed in sample vials to keep reference samples moisture free. Replace DrySacs with
fresh ones on a weekly or bi-weekly basis, depending on how frequently the sample vials are opened and
exposed to air.
When your Phase Technology analyzer is not being used for an extended period of time, DrySac should be
placed directly in the instrument’s test chamber. In some climates, moisture can collect in the purge
system overnight. This may result in wetness in the system when the next
Ordering information:
DrySacs (canister of 600)
DRP-06C
22
70Xi Cold Flow Properties Laboratory Analyzer
User Guide
Appendix B.
How to Pipette a Sample
When pipetting always use a fresh, clean pipette tip and make sure that the tip and piston fit together
tight. Always replace the pipette tip and piston after each use to avoid contaminating your next sample.
Plunger
Disposable
pipette tip and piston
Shaft
Pipette
1.
Pipette tip
Piston
Press-fit a clean pipette tip onto the pipette and make sure that it fits tightly. Ensure that there is
no gap between the tip and the shoulder of the pipette body.
a.
Press the plunger to the second stop (see step a in the diagram below). A stainless steel
clamp will protrude out from the bottom of the pipette shaft.
b.
With the plunger still pressed and the clamp open, insert the new piston fully into the clamp
(see step b below). Insert the end of the piston all the way into the clamp so that the
piston’s shoulder (step a) rests against the clamp. Step (c) shows a properly inserted piston.
c.
Release the plunger back to the rest position. The piston should retract into the pipette shaft
(as shown in step c below).
d.
Press and fit the new pipette tip over the piston (as shown in step d below). The pipette tip
should ‘snap’ into position. The pipette is now ready for use.
23
70Xi Cold Flow Properties Laboratory Analyzer
User Guide
NOTE: To ensure reliability of test results, use tips supplied by Phase Technology. Don’t
substitute pipettes with alternate brand tips.
2.
Open the 70X Analyzer’s test chamber lid.
3.
Check if the sample cup is clean. If not, do the following:
a.
If the sample in the cup is non-viscous (e.g. jet fuel or diesel), remove and dry with a clean
cotton swab; gently swab around the inside of the sample cup to speed up the drying.
b.
If the sample is viscous (e.g. base oil or finished lubricant), remove it and dry with a clean
cotton swab; then soak a new cotton swab with solvent (e.g. heptane) and gently swab
around the inside of the sample cup surface. The cup may have to be cleaned with solvent a
few times.
NOTE: To avoid scratching the cup surface do not scrub the sample cup.
4.
5.
Fill the automatic pipette with the sample:
a.
Gently press the plunger down to the first stop.
b.
Immerse the pipette tip into the sample and slowly release the plunger, drawing the sample
into the pipette tip.
c.
Make sure there are no air bubbles visible in the tip.
d.
Slowly withdraw the pipette tip from the fluid.
e.
Wipe off any excess fluid from the outside with a suitable, lint-free tissue. Be careful not to
touch the tip orifice.
Dispense the sample into the sample cup of the analyzer:
a.
b.
If the test sample is non-viscous (e.g. jet fuel or diesel):
i.
Position the pipette tip above the sample cup inside the test chamber. Dispense the
sample by pressing the plunger down to the first stop. With the plunger depressed,
touch the pipette tip to the surface of the sample in order to remove any residual
droplets.
ii.
Repeat Step 3-5, twice (i.e. rinse the cup with the test sample and then dispense
the final aliquot into the cup).
iii.
If any bubbles are present in the final aliquot in the sample cup, burst them with
the pipette tip or replace the sample entirely.
If the test sample is viscous (e.g. base oil or finished lubricant):
i.
Position the pipette tip above the sample cup inside the test chamber. Dispense the
sample by pressing the plunger down to the first stop. Keep the pipette tip above
the liquid sample surface during the discharge.
ii.
If any bubbles are present in the sample, burst them with the pipette tip or replace
the sample entirely.
6.
Close the chamber lid GENTLY and lock it firmly by moving the lock lever to the left.
7.
To remove the existing piston:
a.
Press the plunger to the second stop
b.
The pipette piston and tip should both eject themselves from the pipette shaft
Ordering information:
Phase Technology piston-driven pipette
PPP-150M
Disposable pipette replacement tips
PTIP-150M5 (quantity 1000)
PTIP-150M10 (quantity 2000)
24
70Xi Cold Flow Properties Laboratory Analyzer
User Guide
Appendix C. Cleaning and Routine
Maintenance
Cleaning the Sample Cup
If testing non-viscous samples (jet fuels & diesels) – rinse cup twice with the sample to be tested. Then
load a third 150 μL of the sample to be tested into the pipette and proceed with testing procedure.
If testing viscous samples (lubes & residual fuel oils)
1.
Remove as much sample as possible using a cotton swab
2.
Dip a clean cotton swab into heptane, then gently wipe to clean the sample cup. Repeat as
needed.
7.
Load 150 μL of the sample to be tested into the pipette and proceed with testing procedure.
CAUTION! Do not use toluene or ketones (such as acetone or methyl
ethyl ketone). These solvents can cause permanent damage to the
analyzer. Such damage is not covered under warranty or service plans.
CAUTION! Use only swabs with plastic or paper stems to clean the
sample cup. The use of swabs with wooden or bamboo stems will damage
the mirrored surface of the sample cup. For optimal protection against
scratching, use cotton swabs supplied only by Phase Technology.
Cleaning Beneath the Chamber Lid
The surfaces between the lid and test chamber should be kept clean a free of dust and contaminants at all
times.
1.
Use a soft tissue and rubbing alcohol to gently wipe the surfaces
2.
Remove dust by gently blowing with compressed air
3.
Avoid scratching the mirror surface of the sample cup
A dirty lens will affect the sensitivity of the instrument and the validity of test results. If needed, clean the
lens
1.
Use a clean cotton swab soaked with rubbing alcohol to gently wipe the lens surface
2.
Dry the lens by either gently blowing dry compressed air onto it or wiping with several dry cotton
swabs. Make sure there is no lint left on the lens after drying.
Cleaning the LED Touch Screen and External Surfaces of the Analyzer
The screen protector shields the touch screen surface from dirt and spills while maintaining the screen’s
responsiveness and functionality. The screen protector film should be replaced every 6 months.
Clean the analyzer’s LED touch screen using a soft, lint-free cloth and lens cleaner solution containing a
mixture of alcohol and water. Gently wipe down the screen until any visible fingerprints, smudges, dust or
other signs of contaminants are gone.
Clean the external surface of the analyzer with a soft, damp cloth.
25
70Xi Cold Flow Properties Laboratory Analyzer
User Guide
Routine Maintenance Schedule:
Every 300 Test Runs (or more frequently if necessary)
•
Replace Desiccant
Every 6 months:
•
Replace Screen Protector
Replace 12 months:
•
Replace Dryer Bottle O-ring
•
Replace Lid O-Ring
How to Replace the Desiccant:
1.
Turn off power to analyzer.
2.
Disconnect dryer bottle from back of analyzer by pressing the spring plates of both quick-connect
fittings and pulling them to separate.
3.
Keep the dryer bottle vertical (upright). Push the lock clip of the desiccant cup protector
downward and turn it to the left to separate the metal cover from the assembly.
4.
Pull the desiccant cup downward to separate the bowl from the top housing.
5.
Discard the old, used desiccant.
6.
Remove old dryer bottle o-ring and replace it with a new one. Be sure that the o-ring track is
clean and void of any broken desiccant debris. You only need to replace the dryer bottler o-ring
on an annual basis.
7.
Get new pack of desiccant, cut across corner to open.
8.
Cover the down pipe using a piece of adhesive tape or a finger.
26
70Xi Cold Flow Properties Laboratory Analyzer
9.
User Guide
Refill bottle with new desiccant. Do not fill past 1/2" (1-2 cm) from the top of the bowl. Use the
“fill to this line” mark on the bottle to use as a guide when filling with desiccant. Lightly tap the
bowl to settle the desiccant.
10. Re-fit the desiccant cup onto the top housing by pushing the bottle all the way into the housing.
Keep the bottle in upright position.
11. Replace the desiccant cup protector and connect it to the top housing. Lock the desiccant cup
protector in place by turning it clockwise until a ‘click’ is heard.
12. Re-connect the dryer bottle to the analyzer. Push the connectors towards the analyzer until a
'click' is heard.
Important Considerations When Replacing the Desiccant:
Replace the desiccant in the dryer bottle after every 300 test runs. Higher humidity in your lab means
more frequent replacement may be required.
Avoid exposing the desiccant to the atmosphere for any length of time. It absorbs moisture quickly, and
exposure means more frequent replacement.
Always use a fresh package of desiccant.
Never try to recharge desiccant. Dust created by this process will circulate through the purge system and
will damage vital components and void the warranty.
Join the dryer bottle connection ends together if the dryer bottle is not connected to the analyzer. This
prevents inadvertent moisture absorption.
When reassembling the dryer bottle, ensure that all o-rings are in place, all connections are properly
seated in the analyzer connectors, and that all seals are air (and thus moisture) tight.
Keep the lid of your analyzer closed and latched when not in use to prevent humid air from entering the
purge system through the chamber inlets.
CAUTION! Use desiccant provided by Phase Technology only. Use of
other desiccant or recharging desiccant will VOID WARRANTY.
Ordering information:
Dryer Desiccant (5-pack)
DRD-605P
Dryer Desiccant (10-pack)
DRD-610P
Dryer Bottle O-ring Replacement Kit
P/N: 101-02-6745
Screen Protector for touch screen
PFILM-70Xi
Cotton Swabs
COTSWAB (10 packs of 400 per pack)
27
70Xi Cold Flow Properties Laboratory Analyzer
User Guide
Appendix D.
FAQ: Calibration, Recertification
and Preventive Maintenance
What is Calibration?
Calibration is the act of comparing a test instrument’s performance to a known standard. For Phase
Technology analyzers, a set of ASTM standard reference samples are used in the calibration process
because of their widely tested and known precision. For individual labs, intracompany QA crosscheck
samples may be included in calibration.
What is a Calibration Certificate?
A calibration certificate is documented proof that your Phase Technology analyzer is measuring pour, cloud
or freeze point according to the manufacturer’s specifications. The certificate specifies the allowable
deviation from the average measurement over a range of standard results.
Every new Phase Technology analyzer is shipped with a Certificate of Calibration which details the specific
customer, serial number, test methods and precision (repeatability and reproducibility), date of
calibration, and date for next recertification.
Why is having a Calibration Certificate important?
A calibration certificate is proof of traceability. Traceability is the unbroken chain of comparisons between
a test instrument and defined international standards, all having stated uncertainties.
Phase Technology analyzers are calibrated during the manufacturing process and are traceable to ASTM
standards. ASTM standards are well recognized and have been quantified in accepted round robin tests.
What are the benefits of maintaining current, calibrated equipment?
Maintaining an up-to-date calibration certificate for your Phase Technology analyzer provides necessary
documentation that gives you:
• proof of calibration for quality audits
• traceability to respected ASTM standards
• documentation to satisfy your ISO-9000 or N.I.S.T. laboratory accreditation requirements
• verification and assurance that your analyzer meets required measurement specifications
How often does my analyzer’s calibration need to be certified?
Phase Technology calibration certificates are valid for one year. They should be renewed by Phase
Technology on an annual basis.
What is Phase Technology’s recommendation for analyzer preventive maintenance?
To keep your analyzer running at peak performance, Phase Technology recommends a regularly scheduled
preventive maintenance and operation inspection performed by one of our technicians.
Regularly scheduled preventive maintenance is a proactive, preventive way for you to safeguard against
unexpected down-time and associated costs while ensuring optimum instrument performance and
maximizing your lab and production up-time.
28
70Xi Cold Flow Properties Laboratory Analyzer
User Guide
Is Phase Technology preventive or scheduled maintenance service the same as general, routine
maintenance?
No, routine maintenance consists of procedures that are a part of good laboratory practices. These include
cleaning the test chamber, sample cup and optic lens. Replacing desiccant and performing certain
diagnostic tests are also part of routine maintenance.
Phase Technology preventive maintenance service goes beyond regular cleaning and consumables
replacement with performance checks and inspection of internal components to prevent potential
problems before they develop.
What are the benefits of having on-site or service center preventive maintenance?
Preventive maintenance ensures that your analyzer is running optimally and helps identify possible
problems before they cause bottlenecks in workflow:
• assurance that results are consistent and repeatable
• increased production yields
• reduced test errors and analyzer stoppage
How often should a scheduled preventive maintenance be performed?
Phase Technology recommends On-Site Preventive Maintenance or Service Center Scheduled Maintenance
be performed annually. For labs with heavier analyzer use, a more frequent interval may be beneficial.
29
70Xi Cold Flow Properties Laboratory Analyzer
User Guide
Appendix E. Understanding and
Using Phase Plots
A phase plot is a graph with the temperature on the horizontal axis and the optics (scattered light) signal
(for freeze point or cloud point) or movement index (for pour point) on the vertical axis.
For freeze and cloud point tests, phase plots depict the optics signal maintaining a low and flat baseline
level when the sample is completely liquid. The presence of wax crystals causes a rise in the signal.
A pour point plot shows a sequence of vertical bars that indicate the relative amount of movement in the
sample when it is perturbed at progressively colder temperatures.
Phase plots are very useful for interpreting and verifying test results, understanding the cold temperature
characteristics of test samples, and diagnosing problems.
The 70Xi analyzer can overlay one or more phase plots by using the OVERLAY GRAPHS button. For
example, overlaying a failed Quality Control (QC) test run on top of a previous good QC phase plot will
immediately show if and how the wax crystal behavior is different between the two tests.
One of the most common causes for a failed test is sample contamination; sample contamination can be
easily identified by observing a dragging “tail” on the phase plot when compared through overlay with a
known good test run.
Cloud Point
Cloud point is the temperature at which the smallest cluster of hydrocarbon (wax) crystals can be
observed when a sample is cooled under conditions prescribed by the ASTM D5773 test method.
Phase Technology’s 70Xi analyzer performs a cloud point test in two stages. First, the sample is cooled at
a fast rate as the optics system looks for crystal formation and signal rise. On a cloud point phase plot,
this can be seen as the blue line moves from left to right. As the crystals form, the baseline rises. The
turning point where the signal rises is called the approximate cloud point.
Next, the analyzer warms the sample until all the crystals disappear. The red portion of the phase plot
shows the warming stage; the plot returns to blue baseline. The analyzer re-tests the sample, cooling the
sample more slowly. The green portion of the phase plot shows the re-cooling.
30
70Xi Cold Flow Properties Laboratory Analyzer
User Guide
As soon as the signal rises sufficiently, the analyzer displays the cloud point and completes the test by
warming the sample back to room temperature.
Freeze Point
Freeze point is the temperature at which solid hydrocarbon (wax) crystals disappear when the
temperature of a sample rises after having been previously cooled and allowed to form under conditions
prescribed by the ASTM D5972 test method.
During a freeze point test, Phase Technology’s 70Xi analyzer cools the sample relatively quickly until wax
crystals begin to form. On a freeze point phase plot, this can be seen as the blue line moves from left to
right. As the crystals form, the baseline rises.
After a sufficient number of crystals are present, the sample is warmed until they all disappear. This
warming phase is shown in green on the phase plot. Freeze point can be seen where the green curve
returns to a flat blue baseline, then stabilizing during the warming stage.
Pour Point
Pour point is the lowest temperature at which movement can still be observed as a sample is cooled and
perturbed under conditions prescribed by the ASTM D5949 test method.
31
70Xi Cold Flow Properties Laboratory Analyzer
User Guide
In a pour point test, the sample starts off in a wax-free liquid state, and is then cooled. As it cools, it
becomes more viscous as wax crystals begin to form. Pour point is the minimum temperature at which the
liquid still flows before gelling or becoming sufficiently viscous and immobile under the test conditions.
The 70Xi Analyzer detects the pour point by shooting a calculated pulse of compressed gas onto the
sample surface. This creates disturbances in the sample. The 70Xi Analyzer’s optical sensors take a
sequence of pictures to detect this movement. Absence of movement indicates that the pour point has
been reached.
The phase plot shows temperature on the horizontal axis and signal on the vertical axis. The signal is an
indication of the amount of movement experienced by the sample.
As the sample is cooled, green bars show the magnitude of movement (read from right to left). Pour point
is determined at the lowest level of temperature at which the sample still shows some movement.
The green movement bars are plotted at the selected resolution, but typically every 3°C (or 5°F) . Users
can choose a resolution as small as 0.1°C if they wish.
32
70Xi Cold Flow Properties Laboratory Analyzer
User Guide
Appendix F. Customer Service
We're committed to ensuring that our customers get optimum performance and continued value from their
Phase Technology 70Xi analyzer.
That's why our customer service & support goal is to minimize downtime and maximize productivity. We
promise to do everything we can to resolve problems in the best and quickest way possible to always keep
our customers up and running.
Our Pledge to You:
•
FAST Response: Phase Technology responds to customers within 24 hours* after notification of
problem. No delays, no waiting for answers.
•
BEST Solution: Working directly with Phase Technology gives customers complete access to the
scientists who design and build the analyzer. No one knows our analyzers better than we do.
•
FREE Technical Support: Our customer service team is available to answer any questions. We
provide troubleshooting and helpful operating tips.
•
Shipping Help: If a repair at our service center is necessary, we work with customers to
complete any necessary shipping documents. This speeds up delivery and clearance through
customs.
•
Warranty Protection: Opening a Phase Technology analyzer without authorization voids the
warranty. Only trained Phase Technology service technicians are properly equipped to make
repairs to our analyzers.
How it Works: Phase Technology Customer Service Process
1.
Customer sends email to: “[email protected]” to report a problem. Phase
Technology Customer Service responds directly to the customer within one business day.* Phase
Technology works with customer to troubleshoot and determine solution to problem.
2.
If repair is necessary, Phase Technology issues a Returned Materials Authorization (RMA) number
to customer and assists in preparation of shipping documents.
3.
For customers that need a service rental unit during the repair period, Phase Technology makes
necessary arrangements.
4.
Phase Technology provides a service estimate for customer approval. Phase Technology
performs necessary repairs, recalibrates the analyzer (if required), and conducts a final check
before shipping back to customer.
* Phase Technology Customer Service hours: Monday – Friday, 8:00 AM – 5:00 PM (Pacific Time Zone)
TO CONTACT CUSTOMER SERVICE & SUPPORT:
Send email to customer service: [email protected]
Please include the serial number of your analyzer, as well as a detailed description of the
reason for your inquiry
33
70Xi Cold Flow Properties Laboratory Analyzer
User Guide
Appendix G. Warranty
WARRANTY TERMS AND CONDITIONS
Any product (hereinafter referred to as Product) manufactured by Phase Technology (hereinafter referred
to as Company) is sold to the purchaser (herein after referred to as Customer) on the following basis and
none other. All implied warranties of merchantability and of fitness for a particular purpose are hereby
expressly excluded.
1.
Products are warranted against defects in material and workmanship for a period of one year
(Warranty Period) from the date of purchase.
2.
Phase Technology will, without charge, at its option, replace or repair Products that fail as a
result of defective materials or workmanship within the Warranty Period.
3.
None of the obligations assigned to Phase Technology by this paragraph shall apply to any
Products which have been repaired, altered or modified at the instance of Customer, unless
Customer has disclosed the nature and full extent to any proposed repair, alteration or
modification to Phase Technology in writing before it has been effected, and obtained an
undertaking from Phase Technology that any outstanding warranty obligations in respect of such
Products will continue to apply to such Products despite such repair or alteration. Phase
Technology retains an unfettered discretion to grant or refuse any such undertaking.
4.
None of the obligations of Phase Technology in this Warranty shall apply to any Products which
have been subjected to misuse, neglect, accident, or (without restricting the generality of the
foregoing) any extreme environmental condition or improper handling.
5.
If defective Products are returned to Phase Technology, the costs of such return will be borne by
the customer, and those of delivering the repaired or replacement Products to the customer will
be borne by Phase Technology.
The Company's sole liability hereunder shall be to repair or replace any product, which proves to be
defective. In no event shall the Company be liable for any special incidental, consequential, indirect or
other similar damages arising from failure of its Products.
LIMITATION OF REMEDIES
Neither Phase Technology nor the Customer will be liable to the other for any special, incidental,
consequential, indirect or other similar damages arising from breach of warranty, indemnification’s, breach
of contract, negligence, strict liability or any other kind of civil liability. The Company's total liability in
connection with this agreement shall in no event exceed the amount paid or payable by the Customer in
respect to the product that is the cause of such liability on the part of the company.
OBLIGATION OF THE CUSTOMER
The Customer agrees, as a condition of purchase of a product from Phase Technology, not to reproduce
any part of the Product. The Customer also agrees not to make unauthorized use of the proprietary
information that belongs to Phase Technology.
COMPLIANCE
NOTE: This equipment has been tested and found to comply with the limits for a Class A digital device,
pursuant to part 15 of the FCC Rules. These limits are designed to provide reasonable protection against
harmful interference when the equipment is operated in a commercial environment. This equipment
generates uses and can radiate radio frequency energy. If this instrument is not installed and used in
accordance with the instruction manual, it may cause harmful interference to radio communications.
Operation of this equipment in a residential area is likely to cause harmful interference in which case the
user will be required to correct the interference at the user’s own expense.
34