1
Quick Start Guide
Quick Start
This guide will help you learn basic navigation of the Web Performance Load Tester interface as well as the
steps to record, replay and analyze the performance of a your website.
1.
2.
3.
4.
5.
6.
7.
8.
9.
Installation
Getting Help
Updating the Software
Navigating the User Interface
Record a testcase
Inspecting a testcase
Replay a testcase
Analyze the performance changes
Run a Load Test
Installation
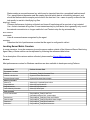
Supported Platforms
Web Performance Load Tester is supported and tested on Windows 2000, Windows XP and Vista. It should
also work on most other modern Windows versions.
note: Installation of the Load Engine is supported on Windows, Linux and Solaris. Installation of the Server Agent is supported on Windows and Linux.
Installation Notes
l
l
l
For Linux stand-alone installations, do not install the application at the top level directory (at "/"). There
is a known issue with the install application when this directory is used.
For any installation, ensure that the directory the application is being installed in is not a read-only
directory to the users of the application. The application will not start properly when this occurs.
For stand-alone installations, do not install Web Performance Load Tester and Web Performance
Load Engine in the same directory.
Installation steps
1.
2.
3.
4.
Download the software from http://webperformanceinc.com/download
On Windows, run the installer and follow the wizard
On Linux/Unix with a GUI, run the installer and follow the wizard
On Linux/Unix from a console, run the installer with the "-i console" option.
Load Engine and Server Agent Installation
Load Engine installation instructions
Server Agent installation instructions
Getting Help
Integrated help system
This page is part of the Quick Start Guide within the integrated help system. There are four books in the help
system:
l
l
l
l
Quick Start Guide - use this for a demonstration of the most commonly used features
Tutorials - task-specific guides for accomplishing a specific goal
FAQs - contains questions frequently asked by users and other topics not addressed by the other
books
Reference Manual - contains detailed information about various program elements and technical topics
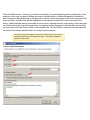
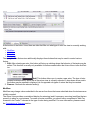
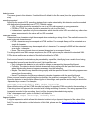
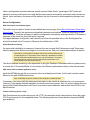
The integrated help system is accessed from the Help Contents item in the Help menu.
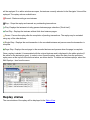
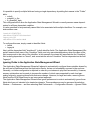
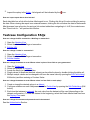
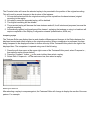
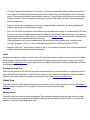
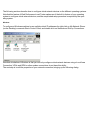
Help shortcuts
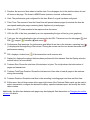
Help system shortcuts are accessible from most
areas of the program: Click on or near the component of interest and press the F1 key.
1. A help window will open that describes the
basic purpose of the component and links to
the user manual for more detailed information on related topics.
2. After clicking one of the manual links, the
pages can be difficult to read in a small window. Pressing the Maximize button will
enlarge the help window. It can be restored
to the original size using the Restore button.
The manual page can be opened in the external help window using the Show in External
Window button (see below).
3. Alternatively, the links may be opened in the
external help window (which includes the
table of contents and search functions) by
using the Open in Help Contents item from
the pop-up menu.
Bookmarks
Help topics can be book-marked for quick reference in the future using the Bookmark button at the top of the
help window. Links or tabs at the bottom of the help window displays a list of saved bookmarks.
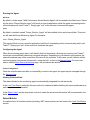
Getting more help
If you cannot find answers in the online help resources, more help is available through our issue tracking
system.
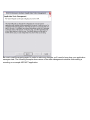
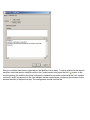
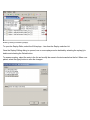
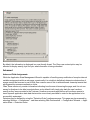
Reporting issues
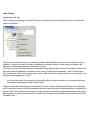
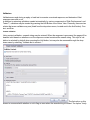
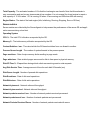
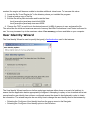
You may also report bugs and request enhancements using the integrated support request form. The Support Request Form is available from the Support Request item on the Help menu.
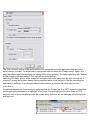
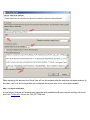
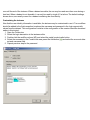
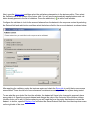
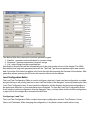
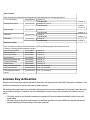
Filling in the form
Enter your e-mail address, and choose either the Open new request or Attach files to existing request
options. For new requests, please fill in a short summary, description and select a category. Additional information related to the request can be sent by selecting the appropriate items (e.g. testcases or loadtest
results).
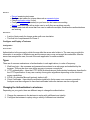
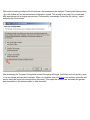
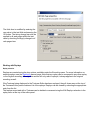
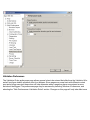
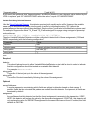
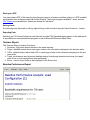
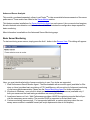
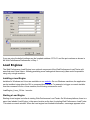
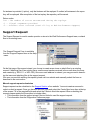
Updating the software
Updating to the latest patch for your version
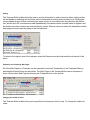
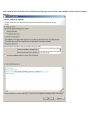
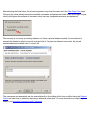
Updates to the Web Performance software can be easily obtained via the integrated update system.
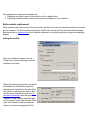
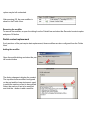
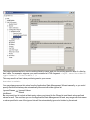
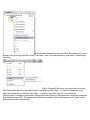
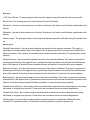
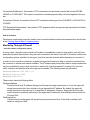
1. Open the Install/Update wizard from
the menu: Help -> Software Updates ->
Find and Install…
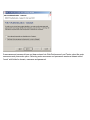
2. Select the "Search for updates..."
option and the Finish button.
3. Follow the wizard to complete the
installation.
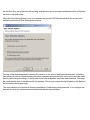
You may be prompted to restart the
application after updating. This is not
always necessary, but is the recommended action.
For detailed information on downloading patch updates and upgrades, see the Managing software updates
reference page.
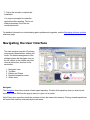
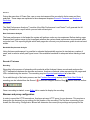
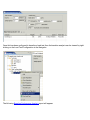
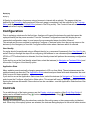
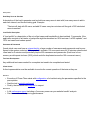
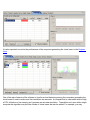
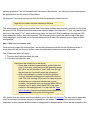
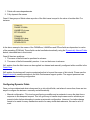
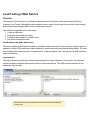
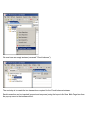
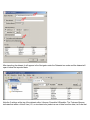
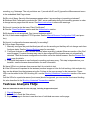
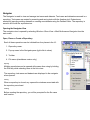
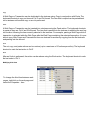
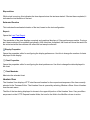
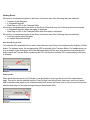
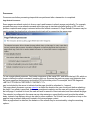
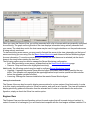
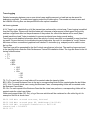
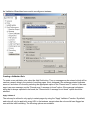
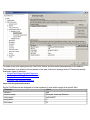
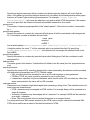
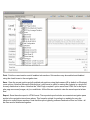
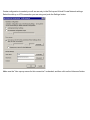
Navigating the User Interface
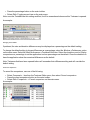
The main window consists of 3 primary
components. Menu/toolbar, editors and
views. The default arrangement of the
interface places the Navigator view on
the left, editors in the middle and other
views at the bottom, as show in the
screenshot.
1.
2.
3.
4.
5.
Navigator view
Toolbars
Editors and Charts
Detailed inspection views
Status view
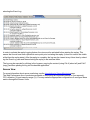
Navigator
The Navigator shows the contents of each open repository. Double-click repository items (or select a testcase and choose Edit from the pop-up menu) to open it in an editor.
Note: Every open repository loads the contents of each test cases into memory. Closing unused repositories
will reduce the memory consumed by the test cases.
Toolbars
The toolbars provide shortcuts to the most common operations in the Navigator and Editor.
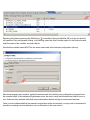
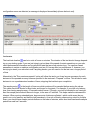
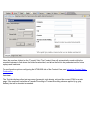
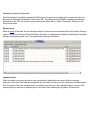
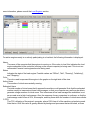
Editors and Charts
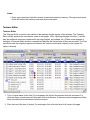
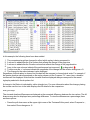
The Testcase Editor displays the recorded testcase as a tree of pages and URLs. The testcase can be
sorted by the size and duration columns to quickly find the slowest pages and URLs in the testcase. An icon
at the beginning of each row differentiates web pages from text files, images, forwards and errors. Secure
transactions (SSL) are indicated by a lock icon at the beginning of the URL column. The editor can also display the performance differences between two replays of a testcase.
The Dataset Editor displays and edits the data and settings for a Dataset.
The Performance Trend chart shows the changes in page size and duration over multiple replays of a testcase. It is opened from either the Navigator pop-up menu or the drop-down menu in the editor.
Detailed inspection views
l
l
l
l
l
l
l
Content view renders the content of web pages, images and other resources when they are selected in
the editor.
Headers view displays the HTTP request and response headers for the page/URL selected in the
editor.
Errors view lists any errors encountered during the recording or replay of a testcase
Replay view indicates the status of the replay in progress.
Fields view displays the HTTP fields that can be associated with modifiers.
Validators view displays size and content validators applied to a Web Page or Transaction in a Testcase.
Servers view displays CPU and memory usage metrics for the specified machines.
Status View
The Status View displays the status of long-running operations, such as recording, replaying testcases and
opening repositories.
General GUI features
Editors vs. Views
Editors (including reports) are always located in the center of the Load Tester window. Views can be
arranged around the edges of the Load Tester window. Once the size of a view has been set, it will try to
maintain that size as the Load Tester window is resized. The editors will receive whatever space is left over.
Resizing
Any of the panes in the Load Tester window can be resized and the new sizes will be remembered when
you restart Load Tester.
Rearranging
Any view can be reordered within the tab group or moved to other place in the window by dragging the tab
for that view. The entire tab group can be moved using the Move->Tab Group menu item from the tab's popup menu.
Detaching floating windows
Any view can be detached to a separate floating window using the Detached menu item from the tab's popup menu. Editors cannot be detached.
Minimizing and Maximizing
Each editor and view can be minimized or maximized within the Load Tester window using the minimize/maximize buttons at the top right corner of each view. The editors and views can also be minimized
and maximized by double-clicking the tab for the editor/view.
Viewing multiple editors
By default all editors appear in the same area of the Load Tester window. To view multiple editors side-byside, drag the tab for the editor towards the desired edge. Restore the arrangement by dragging one editor
tab onto another editor.
Create a Recording
To create your first website recording, follow these steps:
1. Press the Record
button.
2. Follow the wizard steps to auto-detect the network settings and select a browser to use for recording.
3. Enter a name for the testcase, select a repository and a network speed (optional).
4. When the browser is launched, visit your website. As you browse the website, Analyzer will record the
pages and URLs retrieved from the server.
5. Press the Stop
button to end the recording and close the browser.
You may now review and inspect the contents of the recording in the Editor. The other views (Headers, Content, Errors, etc.) will updated to show additional information about the pages and URLs you select in the
recording.
Notes:
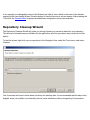
The configuration wizard can be reopened at any time using the Recording Configuration Wizard menu item
on the Recording menu.
Inspecting a Testcase
A recorded testcase is represented in the Testcase Editor by a tree of web pages and URLs. Expanding the
web pages reveals the URLs that make up the web page.
When a web page or URL is selected in the Testcase Editor, some views display details about the selected
item. Web pages are displayed in an embedded browser in the Content View. Images and other text
resources are displayed in text and image viewers, while other resources are displayed in the raw viewer.
The Headers View displays the HTTP headers while the Errors View lists any errors encountered during the
recording.
Tutorials Index
Record and Analyze a Testcase
The Baseline Analysis tutorial (phase one) is the first step in any performance analysis. This tutorial
describes how to configure Analyzer to use your browser to record your website. Then you see how to
analyze the baseline performance of the testcase to answers questions such as:
1. How big are my web pages?
2. How long do my pages take to load?
3. Does my website meet our performance goals?
4. How does my website perform for users with limited bandwidth (e.g. dial-up or cable modems)?
5. How much bandwidth do my testcases consume?
Configure and Replay a Testcase
There are two reasons to replay a testcase:
1. Determine if the baseline performance has changed since the testcase was recorded
2. Prepare the testcase for use in a load test
The Test Configuration tutorial (phase two) describes the automatic and advanced options available for configuring a testcase to handle common needs such as:
1. Using different usernames and passwords each time a testcase is replayed
2. Handling dynamic URL parameters
3. Making each replay enter different information in the web page forms
4. Validating the content of the pages returned by the server
It then describes how to replay the testcase and inspect the results.
Load Testing
Load Testing usually consists of these steps:
1. Analyze baseline performance
2. Create and validate a load test configuration
3. Run load tests
4. Analyze load test results
Step 1 is covered by the Record and Analyze a Testcase tutorial.
Step 2 is covered by the Configure and Replay a Testcase tutorial and the Configure a Load Test section of
this tutorial.
Steps 3 and 4 are the primary focus of the Large Scale Tests tutorial.
Web Services
Testing a Web Service presents a step-by-step example of testing a simple web service.
Advanced Configuration
The Advanced Configuration Guide demonstrates several techniques and product features for configuring
testcases for web applications that use complicated session-tracking techniques or dynamic field naming
conventions.
Replay a Testcase
Replaying a testcase creates a virtual user which simulates a real person using a browser to interact with a
website following the same steps as the original recording.
To replay the testcase, open the testcase in the Editor and press the Play button. A wizard appears,
requesting information required to configure the testcase for replay. For simple testcases that do not require
a user to log in to view content, using the same user as recording and allowing the application to automatically configure Session Tracking and Application State Management should allow the replay to run successfully. Once "Finish" is selected on the wizard, the editor clears the pages and URLs replayed appear in
the editor (similar to the recording process) as the replay proceeds. The replay is added to the Replay selection list, at the top of the editor.
The Replay View appears, displaying the current status of the replay.
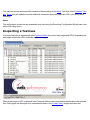
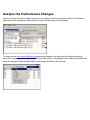
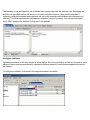
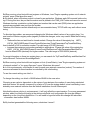
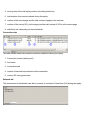
Analyze the Performance Changes
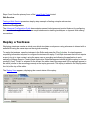
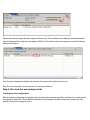
As soon a replay has been initiated, it appears in the replay selection list, as shown below. The testcase
editor reflects the performance measurements of the selected replay for the testcase.
To easily see the performance differences between two replays (or a replay and the original recording),
select the Compare to... menu item in the Testcase Editor menu. The testcase editor adds new columns that
show the changes in the size and duration of each page and URL in the testcase.
To display the changes in performance of web pages over more than two replays, open the Testcase Report
. For example, selecting the Open Report item from the Testcase Editor menu. Then navigate to the Trend
section of the report.
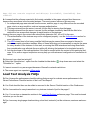
Run a Load Test
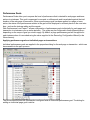
The first step is to create a Load Configuration. Select the testcase in the Navigator and, from the pop-up
menu, choose New Load Configuration:
Fill in the Load Configuration options as desired:
Once the configuration is acceptable, press the Start ( ) button. The Load Test overview screen will appear
while the load test runs:
When the test is complete, press the Report... button to open the Load Test Report:
You may also use the Errors View and Metrics View to get more detailed results of the load test.
Tutorials
Introduction to Load Testing
Introduction To Load Testing
Web site load testing refers to subjecting a web server to a ramping number of simulated users. The resulting analysis can measure your server’s existing capacity, and is an integral part of improving the performance of any web-based application.
The purpose of the tutorials is to describe the Web Performance, Inc. load testing methodology so that our
customers will understand how to systematically test their websites using our software, but it is also applicable to other performance testing situations. The questions that are typically answered with load testing
include:
l
l
l
l
l
l
How Many Users Can Your Web Site Handle?
Which Web Pages Are Slow?
Does My Site Crash Under Load?
How Many Hits/Sec Can My Web Site Serve?
What's My Site's Bandwidth Requirements?
What's My Site's Baseline Performance?
There are three phases to the testing, which roughly correspond to:
1. Baseline Analysis
2. Test Development/Verification
3. Full Scale Performance Testing
Each phase of the testing process has its own prerequisites and deliverables. The Web Performance Load
Tester™ is designed to facilitate this testing process by separating the different parts of performance testing
into different tasks, and by automatically generating the reports needed to both analyze the performance and
communicate that information to others.
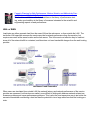
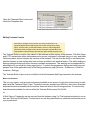
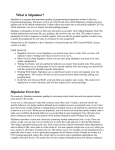
Virtual Users
The virtual users emulate a browser in every way; the web server can not tell the difference between a real
user hitting the web site and a software-generated virtual user. Your web pages are grouped into transactions called test cases so you can get measurements that have meaning for your business. The illustration
below shows how each virtual user can execute a totally different business case, creating a realistic load on
your web site.
Another term to know is "user identity" which describes a particular user with their own username, password, etc. A test case could have millions of user identities, but only have one hundred of these active at any
given time. The software license describes the number of simultaneous virtual users, which are different
from how many user identities exist. From a technical point of view, when you have, for example 100 active
virtual users, it is really describing the level of concurrency; 100 users are active at one time. The user identities, though, will be swapped out as needed to maintain 100 concurrent test cases. From the point of view
of a virtual user, when a test case finishes, it repeats that test case using a new user identity.
How many simultaneous virtual users you need to simulate depends on a number of factors, starting with
how you express your web site's capabilities. Please refer to the hardware requirements for more information.
One thing to keep in mind that performance testing starts with testing your individual back-end machines.
Most large web sites scale by adding web servers and application servers. Setting up a large multiple server
performance test takes significantly more time and resources than setting up a single server test. For that
reason, you may want to start testing with a small number of virtual users on an individual test server.
For detailed background information about doing performance tests on a web server check out our mini
book reviews, or call for more information.
Recommended Reading
While Web Performance Load TesterTM makes it as easy as possible to do web performance testing, testing and tuning involve a lot more than simply using a tool. For detailed background information about planning, documenting, and tuning as well as performing tests we recommend the following books:
Professional Web Site Optimization by Scott Ware, Michael Tracy, Louis Slothouber, Robert Barker
Although this book was published in 1998 it still holds up as the best introduction
to web performance tuning. It covers a wide range of topics, and covers everything you need to know to get started load testing. The age of the book means it
doesn't cover some new topics, but surprisingly enough most of the book is still
relevant. If you are new to load testing and don't know where to start you should
purchase this book first.
Web Performance Tuning by Patrick Killelea
Published in 1998, this book is one of the best for web performance testing, covering the technical basics for everything you need to know in order to really
understand performance tuning. It includes such required information as definitions of various performance metrics, and what those should be in the real
world, and moves along through networks, hardware, and operating systems. It
goes to great pains to cover a variety of systems, including Windows, Linux, Macintosh, and a variety of web servers.
ColdFusion MX: The Complete Reference by Jeffry Houser
Although this book is specifically about ColdFusion, it does have a chapter on
performance, and gives details how to both monitor and test the performance of a
ColdFusion server. The basics of performance testing with Web Performance
Load Tester are presented in context, showing how and why it should be used in
a professional setting. We've gotten good customer feedback on this book.
The Web Testing Handbook by Steven Splaine and Stefan P. Jaskiel
This book is about web testing in general, not just performance testing, and is a
must have for the professional testing engineer. Chapters 7 and 8, on performance and scalability give a very good introduction to the subject, and include
a great sample performance testing plan.
Testing Applications on the Web
Test Planning for Internet-Based Systems by Hung Q. Nguyen
As its title would suggest, this book is all about test planning for all types of internet based systems. Its chapters on performance testing give a lot of details about
planning a performance test and analyzing the results, including examples. If you
really are interested in doing a complete and thorough performance test, this
book is required reading.
Capacity Planning for Web Performance : Metrics, Models, and Methods by Daniel A Menasce, Virgilio A. F. Almeida
This book is a collection of technical articles on the theory of performance testing, and a good addition to the library of someone interested in the scientific and
engineering aspects of web performance.
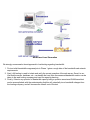
LAN vs. WAN
Load tests can either generate load from the same LAN as the web server, or from outside the LAN. The
inside-the-LAN approach removes the service provider’s network performance from the equation, but
requires resources at the same location as the web server. This is the most cost effective way to load test
since all of the network traffic is contained, and thus does not incur bandwidth charges from the web hosting
provider.
LAN-based Load Generation
When users are simulated from outside LAN, the network latency and network performance of the service
provider are measured, but that also can make it more difficult to distinguish between network-related performance problems and server performance problems. This is also the most expensive way to test since the
excessive bandwidth used during a load test has the potential to incur large extra fees from the hosting provider.
WAN-based Load Generation
We strongly recommend a tiered approach to load testing regarding bandwidth:
1. First an initial bandwidth usage analysis in Phase 1 gives a rough idea of the bandwidth and network
requirements.
2. Next, LAN testing is used to isolate and verify the correct operation of the web server. Once it is verified that the server, database, etc., can handle the load, then the measured bandwidth metrics can be
taken to the web hosting company and used for capacity planning.
3. Finally, if there’s any question of bandwidth capacity being a question an external WAN-based test
can be accomplished, with the understanding that this will potentially incur bandwidth charges from
the hosting company, and will increase the overall cost of the test.
Load Testing Process
Phase One - Baseline Analysis
Phase One Testing Procedure
Baseline Analysis
The preliminary analysis consists of recording one or more representative test cases to better understand
the application and scope of the testing. The end goal is to get a picture of the “baseline” performance,
which is the fastest the performance can be under any circumstances. Because recording is easy to do, the
costs of performing this analysis are comparatively low.
Prerequisites:
The following items must be provided in order to complete Phase 1:
Al definition of acceptable performance
Al description of at least one representative test case
Access
l
to the web-application with non-critical data
Access
l
to someone who understands how the application works.
Performance Criteria
There’s no point in doing a performance test if you don’t know what to do with the results. Its best to decide
on performance goals for your website right at the beginning before going through the time and expense of a
test. There are no easy answers to this question, since the goals vary by application. Studies show that the
percentage of people who give up on a website and go somewhere else go up as the performance
decreases, but there’s no industry standard for where to draw the line. The performance goals can be
expressed as:
X percentage of web pages should load in N seconds,
with no more than Y percent errors.
If you’re still stumped you can start with a goal of having web pages load in between two and four seconds
for normal operation, although you might try staring out your watch for seconds to see how truly long a
period that can be when you’re waiting for a web page. Of course, it’s possible for most pages on a site to
load quickly, while a couple of pages require longer periods of time, which is why there’s a percentage qualifier. A good place to start for error percentages would be 1%. Our own published research shows that web
servers will start rejecting connections while performance is still in the acceptable range, and that’s part of
normal operation.
Execution:
During the execution of Phase One, one or more test cases will be recorded in the browser and then
analyzed. These steps are explained in the subsequent chapters Record A Testcase and Analyze A
Recording.
Deliverables:
The Web Performance Analyzer™ module of the Web Performance Load Tester™ will generate the following information in a report which you can both edit and print.
Base Performance Analysis
The base performance is the fastest the system will perform under any circumstances. Before starting a performance test it makes sense to first investigate whether the system meets performance requirements while
not under load. This report highlights which web pages do not meet your performance goals at various bandwidths.
Bandwidth Requirements Analysis
Using the base performance it is possible to estimate the bandwidth required to simulate any number of
users, and is used as a ball-park figure to see if the available bandwidth is adequate before starting a load
test.
Record A Testcase
Recording
Recording is the process of interacting with a website while Analyzer listens, records and analyzes the
HTTP transactions between the browser and server. Analyzer constructs a tree representing the pages and
URLs visited during the session. The recording may be inspected and replayed at a later time.
For a walk-through of the basic process, see the Create a Recording section of the Quick Start Guide. A
recording can be initiated from the Record ( ) button and stopped with the Stop ( ) button from the toolbar:
Once a recording is started, a new Editor tab is created to display the recording.
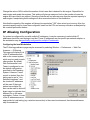
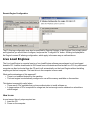
Browser and proxy configuration
In order to record the HTTP transactions, Analyzer acts as a HTTP proxy for your browser. This requires a
change the the browser's proxy settings for the duration of the recording. The first time a recording is performed, the Recording Configuration Wizard will determine the correct proxy settings and prompt for the
preferred browser for recording. To repeat this process, wizard can be restarted using the Recording->Recording Configuration Wizard menu item.
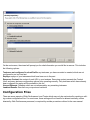
The preferred Browser and Proxy settings may be configured automatically in the Preferences editor. For
details on configuration settings, see the Browser Settings and Proxy Settings pages.
Status display
While recording, the Status View will display the vital details about the recording status:
Recording SSL
How it works
When browsing SSL sites your browser encrypts the information sent to the server where it is decrypted. Normally, if a proxy is used by the browser, the proxy does not encrypt/decrypt the transactions - it simply
passes the encrypted information through. In order for Analyzer to record the transactions, the internal recording proxy works differently - it decrypts/encrypts the transactions.
To make this work, Analyzer generates a "fake" certificate and presents it to the browser as the certificate for
the server. In normal situations, this is considered a security hazard -- so when the browser detects this situation, it will display a warning message stating that it cannot verify the identity of the server. This is a good
thing! If it didn't, then other programs might do what Analyzer does in order to steal your personal information.
To proceed with recording, you can simply accept the certificate and continue with the recording. This will
not adversely affect Analyzer's ability to record your session, but it might produce recordings with response
times that are significantly longer than a normal user would see (because of the time it takes you to dismiss
the warning dialog). If a site uses multiple servers (such as most large banking and e-commerce sites), the
security warning may be displayed multiple times.
How to suppress the warning messages
Analyzer generates an internal root certificate that is used to sign all of the "fake" server certificates. This
root certificate may be imported into your browser as a "trusted root certificate authority". This will allow your
browser to automatically accept the certificates that are presented by Analyzer without displaying a warning
message. Note that the internally generated root certificate is unique to your computer - this ensures that the
certificate could not be used in a server-spoofing security breach (unless the attacker had already gained
access to your computer and stolen the certificate).
To suppress the warning messages, two steps are required:
1. Export the root certificate
2. Import the root certificate into your browser
Exporting the root certificate
The root certificate may be exported in two different formats: CER or PEM. Most browsers will accept the
CER format, so try it first.
1.
2.
3.
4.
5.
Start a recording
When the Welcome Page appears, click the test your SSL configuration link
Click the appropriate link to download the certificate in either CER or PEM format
Save the certificate somewhere you can remember (e.g. your desktop)
Follow the instructions for your browser on importing the certificate. We have included instructions for
a few of the most popular browsers below. If your browser is not listed here, check the documentation
for your browser.
note: the CER and PEM certificate files may be copied directly from the following folder (where <user> is your windows username) if
the download links do not work:
C:\Documents and Settings\<user>\.webperformance
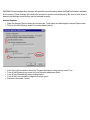
Internet Explorer 6.0
1.
2.
3.
4.
5.
6.
7.
8.
Select Tools->Internet Options from the IE menu
Select the Content tab
Push the Certificates button
Select the Trusted Root Certificate Authorities tab
Push the Import... button to start the Certificate Import wizard
Push the Next button
Push the Browse... button and locate the certificate file where you saved it
Then follow the Wizard to completion
After installing the certificate, you will see it listed under the name Web Performance. The certificate will
expire in 10 years.
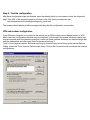
Firefox 1.5
1.
2.
3.
4.
5.
Select Tools->Options from the Firefox menu
Select the Advanced icon
Select the Security tab
Push the View Certificates button
Select the Authorities tab
6. Push the Import button and locate the certificate file where you saved it
7. Select the "Trust this CA to identify web sites" option
8. Push the OK button
After installing the certificate, you will see it listed under the name Web Performance. The certificate will
expire in 10 years.
Bandwidth Simulation
During recording or replays, Analyzer can simulate bandwidth-limited networks to demonstrate the effect of
slower connections.
note: the simulation only limits the incoming responses from the server (i.e. requested pages, images, downloads, etc.).
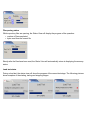
Recording
Before beginning a recording, the simulated bandwidth can be selected from the list. To turn off bandwidth
simulation, choose the unlimited option, which will deactivate the internal limiters.
Replay
To replay a testcase using bandwidth simulation, open the Replay view and select the bandwidth from the
list. The simulated bandwidth may be changed at any time during the replay.
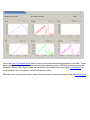
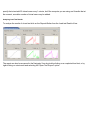
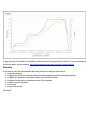
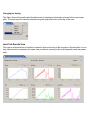
After replaying with bandwidth limiting activated, the timing shown in the testcase editor will reflect the
effects of the simulated bandwidth limitations. The effects can also be viewed on the Performance Trend
chart, which might look something like this, depending on which network limits have been tested.
Analyze A Recording
Performance Goals
Performance can be judged by setting Performance Goals that are automatically evaluated by Analyzer to
give a quick visual assessment of the performance of a website.
Evaluating Performance Goals
When a testcase is displayed in the Editor, the applicable performance goals will be evaluated for each
page and URL. Items that do not meet the performance goals are indicated with an
icon. Hovering the
cursor over the icon will display a tooltip summarizing the failed goals.
Setting Performance Goals
For instructions on configuring Performance Goals, see the Performance Goals settings page.
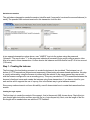
Baseline Analysis
Once a testcase is recorded then baseline analysis can be performed by creating a Load Configuration.
The purpose of the configuration is to specify the basic parameters of the load which will be used to generate the analysis, i.e. number of users, bandwidth of the users, etc.
To start a Baseline Analysis right-click on the test case and select New Load Configuration.
A new Load Configuration window will appear as shown below. This can be configured using the information in the Load Test Configuration Editor section of the Reference Manual.
Once this has been configured to describe a load test, then the baseline analysis can be viewed by rightclicking on the Load Test Configuration in the Navigator:
The following Baseline Performance Analysis report will appear:
The Summary gives an overall summary of the report's findings, the Bandwidth report gives estimated
values for the minimum and maximum bandwidth connection needed by the hosting company to support the
specified number of users, and the goals shows how many of the web pages will be estimated to meet or fail
the performance goals. Of course these are just estimates and an actual load test will need to be run to get
definitive answers.
Phase Two - Test Configuration
Phase Two Testing Procedure
Customize & Verify Test Cases
The goal of Phase Two is to make sure that simulation will be accurate, and that all aspects of the
test meet the requirements, including network availability. This phase takes the most amount of time
because it is here that the details of how the back-end works must be worked out. While Phase One relied
strictly on recordings for analysis, in Phase Two the Web Performance Analyzer™ module will simulate a
user with accurate data substitution, which puts extra requirements on the testing process. To make sure
the virtual users are accurate the tester can actually watch the pages as they are sent to the web server, and
visually confirm that everything is working correctly.
Prerequisites:
l
l
l
A small number of accounts, usually between 10 and 20.
A representative of the application/operations team to monitor the correct operation of the tests
Test cases must be configured for multiple logins and unique data.
Execution:
l
l
l
l
l
l
Record remaining test cases
Configure test cases for unique data such as separate logins
Check application state if used
Configure validation (if needed) so you know the test cases are working
Replay each test case with a single user to verify they are working correctly
Repeat each test with more than one user to make sure multiple, simultaneous authentications
are working
Deliverables:
l
l
A suite of tests ready for a larger-scale multi-user simulation
The final list of requirements for Phase 3.
Configure and Replay a Testcase
Configuration
Authentication
Authentication is the process by which the user tells the server who he/she is. The user may provide this
information in a number of different ways and the server may or may not accept the credentials. After the
server has accepted the user, the rest of the web application is made available.
Types
There are 4 common mechanisms of authentication in web applications, in order of frequency:
1. Web-form login - the username and password are entered on a web page and submitted by the
browser. This may be done over either secure or insecure connections.
2. HTTP authentication - Uses the HTTP WWW-Authenticate and Authorization headers as described in
the HTTP specification. It may use a variety of encryption algorithms depending on the client and
server capabilities.
3. NTLM - An obsolete Microsoft protocol similar to #2.
4. Client Certificates - Uses identity certificates installed in the browser over a secure connection.
Analyzer must be configured to use client certificates before the testcase can be configured.
Changing the Authentication in a testcase
Depending on your goals, there are different ways to change the authentication:
1. Change the username in the testcase to replay with a different user identity.
2. Configure the testcase to replay using a variety of different user identities.
Change the user in the testcase
Web-form login: you can change the values of the username and password fields in the recording. See the
Customizing a Testcase section.
HTTP or NTLM: It is recommended that you re-record the testcase with the desired user identity. It is possible to change the credentials specified in the HTTP headers by manual editing, but should only be
attempted by experts.
Client Certificate: Change the Recording Certificate in the Client Certificates preference page and set the
playback mode to Same as Recording Certificate.
Replay with multiple user identities
Run the User Identity Wizard to configure the users. This can be invoked in any of three ways:
1. Pop-up menu in the Navigator
2. Configure->User Identity option in the Edit menu
3. User Identity option from the Configuration button on the toolbar
Application State Management
Modern web-based applications are getting more and more complex, which makes testing those applications very difficult. The web server or client-side javascript can generate unique hidden variables or separate URL paths for each user. Sessions can be specified not just through cookies, but hidden in the web
page itself. Values from previous forms can be compressed, encoded, and stored inside variables with
names like "__VIEWSTATE". Sometimes even the names of form variables changes from one user to
another. Note that Application State Management does not deal with data that the user would enter in
form fields or any other type of user-entered data. Application State Management is about all of the other
complex variables changing behind the scenes. To change the input entered by the user in a form, see the
section on Customizing a Testcase.
With a scripting-based load tester you'd have to find each dynamic variable and where it is used, and configure it by hand, if it is supported at all. A typical application could have hundreds of dynamic variables,
which means developing the test case can take days even if you understand the scripting language. With
WPT the Application State Management wizard automatically finds and configures each dynamic variable
for you. It locates where the variable is first used, and configures a parser to extract that value at runtime,
and then detects where the value is used, and configures data replacement so that each virtual user gets its
own unique runtime value.
Starting the Application State Manager
The Application State will normally be automatically configured by the Testcase Configuration wizard before
a replay can be attempted. To run the wizard again at a later time, select the testcase in the Navigator (or
open the testcase in the Testcase Editor) and select the Configure->Application State option from the popup menu or toolbar.
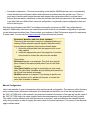
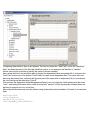
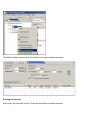
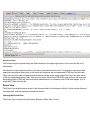
Configuring Application State
Be sure to read the warning again! In order to make any changes you'll need to know how your application
manages state. The following example shows some of the state management variables from making a
recording on a sample ASP.NET application:
The variable "id" has been selected, and the values and where those values were used shows in the table
below it. There are three options for dealing with how the dynamically changing names and values are handled. The next options deal with how often the value changes. If the value is set once, and then simply
reused, the option will be set to "Extract Once". If, though, the value changes frequently, say on every page,
you'll want to parse a new value every time it appears, or the "Extract Always" option. Lastly, if the field
should not be managed dynamically, then you may select the "Never Extract" option, and whatever happened in the recording will happen at playback.
Why would you want to change the defaults? While the detection algorithms in Web Performance Load
Tester are smart, there is always the possibility that a variable had the same value on every page in a recording, but that might have simply been a coincidence. With another simulated user the values might have to
change on every page.
Troubleshooting
The best way to determine if your application's getting the right values is to check your application state or
database. For example, if you run a test case that supposed to purchase a product, check your database to
see if there's a record of the purchase. If this shows there's a problem, the next step is to check your own
application's error logs for trouble.
Once a problem has been verified, the next step is to walk through the pages in the replay, looking for error
messages from the server. It may be useful later to configure validators (from the Validators View) to flag the
same errors again during further replays. If the error on the first error page in the replay suggests that the
cause of the error was not user entered data, but a hidden variable normally handled internally by the user's
web browser, then you may use the Fields View to track down any variables on that page that do not have
modifiers to update them automatically (if applicable). Once you have located a variable that is not being
handled automatically, and confirmed how the application automatically updates that variable, you may consult the Advanced Application State section of the manual to give the Application State Management Wizard
enough knowledge to correctly update your scheme.
Customizing a Testcase
Replaying a testcase as recorded is useful in many scenarios, but it has its limitations. In many situations, it
is desirable for the Virtual Users (VUs) to perform slight variations in order to more accurately judge the performance of an application. For instance, the VU might sign onto the system using different username/password combinations. Or the VU might use different words when performing a search.
The process of configuring a testcase to submit slightly different information is referred to as Customizing the
testcase.
Customization basics
The process usually consists of:
1. Provide some data to be substituted for data recorded in the testcase.
2. Configure modifiers to modify the original data with the new data.
3. Modifications to the testcase content.
Step 1 is accomplished by importing or creating data in a Dataset. The data may also be edited later. These
topics are addressed separately.
Step 2 will be the focus of this section.
Step 3 is accomplished using the testcase editor. See the section on editing testcase content for details.
What to customize?
In a typical web application, there are a number of ways that application data flows between the browser
and server. The most common are:
1. Cookies
2. HTTP headers
3. Query parameters (and other URL elements such as path segments)
4. Form fields
5. File uploads
6. Multipart related content, or raw content blocks
Cookies
Cookies rarely need any customization because the testcases are automatically configured to handle
cookies the same way that the browser would. The happens without any intervention from the user and as a
result, there is little customization provided in the GUI.
Note that the automatic configuration supports cookies that are set by the server and received/returned by
the browser via the HTTP headers. If the cookies are set or modified using Javascript (or any other clientside scripting mechanism), the testcase may need special configuration. Please contact support for more
information.
HTTP headers
HTTP headers also rarely need customization by the user. However, support is provided for some simple
customizations. See the Headers View for instruction on configuring modifiers on HTTP headers.
Query parameters
A query parameter is a part of the URL submitted in the HTTP start-line. In this example:
http://finance.yahoo.com/q?s=ibm
s=ibm is a query parameter. The parameter has a name (s) and a value (ibm).
A modifier may be configured for a query parameter in two ways:
1. Edit the request line in the Headers View
2. Edit the appropriate row in the Fields View
Form Fields
This is the most commonly-customized item in a testcase. This is how, for example, a testcase might be customized to submit different keywords in the search function of a website.
A form field is part of the HTML in a web page that allows a user to enter data into the page and submit it
back to the server. There are a number of variations on this theme, including hidden fields that are not editable by the server (they are usually pre-populated by the server when the page is sent). All the fields submitted to the server may be viewed and edited from the Fields View.
File Upload Fields
A file upload field is part of an HTTP POST where the application is sending a file to the server. These fields
can be modified for data replacement using the Fields View. For more detailed information on setting up
data replacement, see File Uploads.
Multipart related content, or raw content blocks
When the HTTP request contains the content-type multipart/related or post a single raw block of data, the
part can be modified for data replacement using the Fields View. For more detailed information on setting up
data replacement, see Part/Post Content.
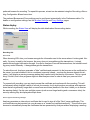
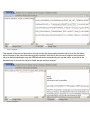
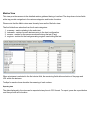
Datasets
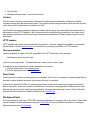
In Web Performance products, a collection of data that is used to dynamically change the actions of a testcase is known as a Dataset. A dataset is a collection of tabular data, similar to a spreadsheet. After creating
a dataset, it can be used to customize the testcase.
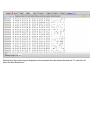
In this example picture of the Dataset Editor, the dataset contains two fields (columns), Username and Password. It also has many rows, each of which contains values for the Username and Password fields.
Creating a dataset
Datasets may be created empty or imported from an external file. They may then be edited manually (cell by
cell) or entire rows may be filled by selecting the column (press the column header) and then the Fill... button.
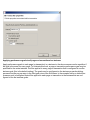
Create a new dataset
In the Navigator view, the pop-up menu which appears from any existing dataset or the Datasets folders in
each repository contains a New Dataset item. Selecting this menu item will open the New Dataset dialog:
Enter a name in the name field and then press the Add button. You may then type each field name, separated by the <return> key to define the fields in the dataset. After pressing the OK button, the dataset will be
created with one row of sample data and the Dataset Editor will be opened. Values for each field can be
entered within the Dataset Editor.
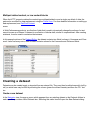
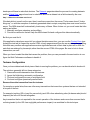
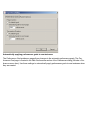
Import a dataset from an external file
A dataset can be created using existing data in CSV or text format. From the Navigator view, select the
Import item from the pop-up menu on any dataset or the Datasets folder. Selecting this menu item will open
the Import Dataset dialog:
1. Choose the file to import
2. The file may be imported into either a new or existing dataset
3. Choose the field separators. For CSV files, choose comma. This
example uses tab characters between each field.
4. By default, the import process will automatically remove any
leading and trailing white-space from each entry. This feature may
be disabled when needed.
5. If the first row of the imported file contains the names of the
fields, enable the "Use first row..." option. The import process will
create a dataset with matching field names. If not, field names will
be generated. They can be edited later in the Dataset Editor.
6. If your file contains characters that are escaped, you may select
this option to parse them as escaped characters. This is useful if
you must import values which span multiple lines. Simply ensure
that in your file, each row in the dataset appears on it's own line,
and that line breaks within individual values are replaced with the
characters "\r\n" (or an appropriate new line sequence for your
application server). Once imported with the "Parse escaped characters" option, tooltips over each dataset value will display the complete value with line breaks.
7. As the import options are selected, the Preview section will display what the first 10 rows of the dataset would contain if the current settings were used.
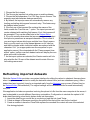
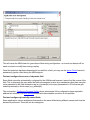
Refreshing imported datasets
While the Dataset Editor provides a convenient interface for editing the values in a dataset, there are times
when it may be more convenient to modify the data with external tools (such as a database query). After a
dataset has been imported, it may be re-imported easily from the Navigator pop-up menu (Reload item) or
the Dataset Editor (Reload button). The original settings will be remembered and re-used automatically.
File Uploads
If the application includes an operation involving the upload of a file from the users computer to the server, it
may be desirable to provide different files during a simulation. Configuration to simulate the upload of different data files during a load test is broken down into three steps:
1. Import the data files you would like to use during a load test into Load Tester.
2. Create a dataset of filenames specifying the specific files that will be used for the load test.
3. Create a modifier to have the Virtual User replace the recorded file content with one of the selected
files during playback.
Importing files
A predefined set of files must be imported into Load Tester through the File Uploads preferences page. This
page may be accessed from the menu: Window » Preferences&help; » Web Performance » File Uploads .
Once on the File Upload page, you may select the "Add file(s)" button to select files for Load Tester to keep
available for use during a load test. Each file will be copied into a private location from which they may be
synchronized with any remote load engines in use prior to a load test. If a file is changed after adding it, the
"Add file(s)" button may be used to replace the copy used for load testing with the updated copy.
Creating a Dataset
The simplest way to create a dataset is from the same File Uploads preferences page described above. By
selecting the "Generate Dataset" button, Load Tester will offer to create a dataset of all the files currently
available using the repository and names specified.
Alternatively, if the intended load profile consists of different test cases where some files may be used in one
test case and not another, then it may be necessary to customize a dataset to specify the subset of files that
should be used. Please see Create a new dataset for more information.
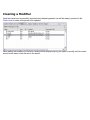
Creating a Modifier
Once files have been successfully imported and a dataset prepared, we will be ready to proceed to the
Fields View to locate a file upload to be updated.
When editing the modifier of a file field, a dialog will be displayed giving the option to modify the file content,
as well as the name of the file sent to the server.
The "File Contents" section of the screen allows us to replace the actual file data that will be sent to the
server during a load test. The default way to replace the data is to select the "Dataset value:" option, and
select the dataset and field containing the names of files to be uploaded. The option specifying that "Dataset
or User Variable indicates name of file to upload" should be checked.
Lastly, the File Name section of the screen can be used to adjust the name of the file sent to the server, if
required. This may be the same dataset field as specified above if just the name of the file (excluding the
path name) is sufficient, or an alternate dataset field containing a complete file name may be used.
Content Modifiers
Configuring replacement of part content is performed from the Fields View. If an HTTP request contains the
content-type multipart/related, it is displayed in the Fields View with type part. For other styles of HTTP
requests, such as those that post a single raw content block, that block will be displayed in the Fields View
with type post.
The replacement configurations allowed are:
1. Replacing the entire content of the part from a file or dataset field.
2. Replacing multiple smaller sections of the part from datasets or user variables.
Entire content replacement
When replacing the entire content during a load test, the files to be used for data replacement can be specified in a dataset. The files must be imported into Load Tester through the File Uploads preference page.
See the section on uploading files for a detailed explanation on using the preference page and creating a
dataset.
Adding the modifier
Once your dataset is created, use the
Fields View to open the dialog to edit the
modifiers for the part:
Select the Dataset value button, and select
the Dataset and field which contain the
replacement information for this part. If the
new values for each part are each in their
own file, and configured through the File
Uploads Preferences, then the option
"Dataset or User Variable indicates name
of file to upload" should be checked. Otherwise, if the Dataset contains exactly the
values to be used during playback, this
option may be left unchecked.
After pressing OK, the new modifier is
shown in the Fields View:
Removing the modifier
To remove the modifier, re-open the dialog from the FieldsView and select the Recorded contents option
and press OK button.
Partial content replacement
If only sections of the part require data replacement, those modifiers are also configured from the Fields
View.
Adding the modifier
Open the modifer dialog and select the partial content button
The dialog changes to display the content.
The top area shows modifiers configured
on the part and the lower text area is used
to select the sections of text to be modified.
Select the section of text to be modified
and click the + button to add a modifier.
A new dialog is displayed where the dataset or user variable to use for the replacement must be specified. Make the
selections on this dialog and press the OK
button to create the modifier.
The modifier is now shown on the original
dialog. Additional modifiers can be specified by repeating the previous step. Once
all desired modifiers have been configured, press the OK button to add the
modifiers to the testcase.
Removing a modifier
To remove a modifier, re-open the dialog
from the FieldsView. Selecting the modifier
to be removed in the list at the top of the
dialog and select the - button. Press the
OK button to make the change to the testcase.
Replaying
Replaying
A Replay is a simulation of a person using a browser to interact with a website. The pages visited are
defined by the Recording being replayed. After each page is completed it will be selected in the Testcase
Editor and displayed in the Content View (unless in Fast Play mode). The Content View will automatically
be activate when a replay is started.
Configuration
Prior to replaying a testcase for the first time, Analyzer will inspect the testcase for parts that cannot be
replayed exactly as they were recorded. Then the Testcase Configuration wizard will display the recommended configuration steps. In most cases, the recommended steps should be followed.
This wizard can be re-run anytime by selecting Configure->Testcase option from the pop-up menu on the
testcase (in the Navigator) or from the Configure toolbar button when a testcase editor is selected.
User Identity
If a replay should be performed using a different identity (e.g. username & password), the User Identity wizard will lead you through the steps for re-configuring the testcase to use usernames/passwords from a list. If
NTLM or HTTP authentication is detected, the User Identity wizard will perform the necessary configuration
steps.
If you wish to re-run the User Identity wizard later, select the testcase (in Navigator or Testcase Editor) and
choose the Configure->User Identity option.
Application State
Many websites use dynamically-changing parameters in URLs or form fields. These testcases cannot be
replayed exactly as recorded. The Application State wizard analyzes these fields and determines the most
likely sources for these variables.
If you wish to re-run the Application State wizard later, select the testcase (in Navigator or Testcase Editor)
and choose the Configure->Application State option. This wizard will lead you through the steps for re-configuring the testcase as needed. Some choices can be overridden - see the Application State section of the
user manual.
Controls
For a walk-through of the basic process, see the Replay a testcase section of the Quick Start Guide. A
replay can be initiated from the Play ( ) button and stopped with the Stop ( ) button from the toolbar:
Replays are performed using the selections under the Recording menu or the corresponding toolbar buttons. When any of the replay options are selected, the testcase being displayed in the active editor window
will be replayed. If no editor windows are open, the testcase currently selected in the Navigator View will be
replayed. The replay actions available are:
Record - Starts recording a new testcase
Stop - Stops the replay and cancels any outstanding transactions.
Play- Replays the testcase including pauses between page selections ("think time").
Fast Play - Replays the testcase without think time between pages.
Pause - Pauses the replay after the completion of pending transactions. The replay may be restarted
using any of the other buttons.
Single Step - Replays the next transaction in the recorded testcase and pauses once the transaction is
complete.
Page Step - Replays the next page in the recorded testcase and pauses when the page is complete.
Once a replay is started, it is associated with the original testcase and is displayed in the editor window (if
the editor for the testcase is open). In order to view a specific replay, select the entry from the pull-down
replay menu at the top-left of the editor window, as shown below. To delete and rename replays, select the
Edit Replays... item from the menu.
Replay status
The current status of the replay will be displayed in the Status View.
More detailed information about a replay is available in the Replay View.
A detailed log of the replay is available in the Event Log view.
Phase Three - Large Scale Tests
Phase Three Testing Procedure
Phase 3: Full Scale Load Testing
A full-scale load test consists of generating an increasing number of virtual users while measuring both
client and server-side metrics. The result is a set of metrics that can be used to estimate the capacity of the
system under test, and point the way to look for performance improvements. This stage can be repeated as
necessary as changes are made to the system under test.
One area of interest is performance enhancement and code tweaking. While our performance testing consultants can suggest places to look for improvement, however, individual systems require the appropriate
domain experts. For example, an Oracle DBA would be required to tweak the performance of stored procedures, while a .NET performance expert would be required to profile and modify .NET code.
Prerequisites
How Many Users to Simulate
A description of the load to generate must include how many users to start with, how many users to add in
each time interval, and the end testing goal. Example:
“The test will start with 50 users, and add 25 users every two minutes until the goal of 500 simulated
users is reached”.
Load Profile Description
A “load profile” is a description of the mix of test cases and bandwidths to be simulated. For example, if the
application consists of two tasks, a load profile might be described as “40% test case 1 at DSL speeds”, and
“60% test case2 and modem speed”.
Usernames & Passwords
If each virtual user must have a unique identity, a large number of usernames and passwords must be configured in the system under test. For example, to maintain 100 concurrent users for 30 minutes when the test
case lasts for 5 minutes could potentially require 600 usernames and passwords. (Each level of concurrency would repeat six times (30/5), which would be duplicated across the 100 concurrent users.)
Test Case Development
Any additional test cases needed for a complete test need to be completed and tested.
Client Access
A client representative must be available to monitor the correct operation of the tests as they run.
Execution
l
l
l
Execution of Phase Three starts with configuration of a load test using the parameters specified in the
prerequisites.
Next the test is actually performed
Finally, the test results are analyzed in a report
Deliverables
l
l
A full performance report including a “how many users can your website handle” analysis.
Recommendations for improving performance.
Load Testing
Configuring a Load Test
The first step in configuring a load test is to select a test case, and use the right-click menu to select New
Load Configuration:
The goal of a performance test is to determine a relationship between the number of virtual users and performance. In order to do that, you'll want to describe a ramping number of virtual users and observe the
changes in performance relative to the number of users.
This section of the GUI allows the user to describe the performance test in terms of the starting number of virtual users and how frequently to add new virtual users. A typical value is between 1 and 50 virtual users.
The "increase by" value is how many virtual users to add in a period, usually between 1 and 5 minutes. Typically this value ranges from 1 to 50.
It is best to start with a low number of users and verify the correct operation of your server before performing tests with larger number of virtual users.
The test configuration below shows a test that will run for 4 minutes, starting with 50 users, and increasing
by 50 users every minute. While the estimated maximum users that can be simulated by this configuration is
shown as 200, the number of virtual users you can simulate is limited by the speed and memory of the playback machine, so that the actual number of virtual users generated is potentially lower than the value in the
"potential" field.
Test Length
Duration can be specified in units of hours, minutes, or days. The duration of the test should change depending on your testing goals. If you are just trying to get an idea of the speed of certain operations on your site,
useful performance information can be gained for tests that are a few minutes long. You can then tweak
parameters in scripts or machine configuration and see if it has an effect on performance. If, however, you
are trying to stress your web site to see if anything breaks, you'll want to run the test over a longer period of
time.
Alternatively, it is also possible to have a test stop after repeating a fixed number of times. This approach
allows the test to continue running for as long as the server requires, until the test has been attempted at
least as many times as specified in the limit (or until the test is stopped by the user).
Multiple Test Cases
More than one test case can be run simultaneously by adding them to the table. To add a test case to the
table select the test case with the pulldown box and then click on the plus "+" sign. The distribution of test
cases is determined by the "Weight" column. For example, if you were going to simulate 100 virtual users,
and wanted 20% of the load to be from test case 1, and 80% of the load from test case 2, you would put a
weight of "20" for test case 1, and a weight of "80" for test case 2.
Network Simulation
The "Speed" parameter describes the network bandwidth of each virtual user in the simulation. No matter
what network configuration was used to record a test case, this setting controls the simulated network connection. For example, if the "Speed" parameter is set to 128 Kbps, that means the peak data transfer by
each individual simulated user will not exceed 131,072 bits per second. (128 x 1024). This implies that if
you recorded a business case over a local LAN, playing that business case back at modem speeds will take
much longer. The implications of the effects of bandwidth can be studied by running a Baseline Performance Report.
Sample Period
The sample period is the length of time over which metrics will be sampled before saving the values. For
example, if the sample period is 15 seconds, the Metrics views showing the results of a test will have values
every 15 seconds. This value should be shorter for short tests, and longer for long tests. For example, if your
test only lasts an hour, then having samples every 10 seconds makes sense. If, though, your test is intended
to run overnight, then the sample period should be much longer, in the area of 5 minutes. This helps make
the data easier to interpret. When running extended tests, Web Performance Load Tester™ will collect large
amounts of data - which could cause the program to run out of memory and halt the test prematurely. As a
rule of thumb: when running a test for multiple hours, you should have sample periods that are on the order
of minutes, while short tests can handle sample periods as small as 5 seconds.
For more information, please consult the section for the Load Test Configuration Editor.
Running a Load Test
To run a load test start from the Load Test Configuration Editor and click on the Run Button. The following
view will appear:
This is the Load Test Results View, and will show you the test metrics being generated in real time. These
metrics can be confirmed by simultaneously running a separate monitor on the web server(s) such as the
Windows Perfmon utility. Keep in mind that the metrics from multiple web servers and Load Engines are
being combined for you to give an overall performance picture.
While the test is running you'll want to monitor the performance of your web servers using the Servers View:
It is also important to monitor the performance of the computers generating the virtual users in the Engines
View:
One of the major features of the software is it performs load balancing among the computers generating the
virtual users in order to make sure the simulations are accurate. A computer that is overloaded with too high
a CPU utilization or low memory can't generate an accurate simulation. Toward this end, even with a single
computer the algorithm may limit the number of virtual users that can be added. For example, you may
specify that a test add 50 virtual users every 1 minute, but if the computer you are using can't handle that at
the moment, a smaller number of virtual users may be added.
Analyzing Load Test Results
To analyze the results of a load test click on the Reports Button from the Load test Results View:
The report can also be accessed in the Navigator View by double-clicking on a completed load test, or by
right-clicking on a test result and selecting the "Open Test Report" option.
The Load Test Report view will be displayed:
The contents of the report are designed to be self-explanatory - they include text surrounding the graphs and
charts to explain their meanings.
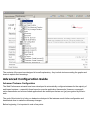
Advanced Configuration Guide
Advanced Testcase Configuration
The Web Performance wizards have been developed to automatically configure testcases for the majority of
web-based systems -- especially those based on popular application frameworks. However, some application frameworks and custom-coded applications use techniques that are not (yet) recognized by the wizards.
The goal of this tutorial is to help you determine what part of the testcase needs further configuration and
demonstrate how to make the necessary changes.
Before beginning, it is important to note a few points:
l
l
l
Determining exactly which part of the testcase is not yet configured correctly may require detailed
knowledge of the application -- it is a good idea to get the application developers involved.
If a working testcase is not achieved at the end of this tutorial, please contact Web Performance support for further assistance.
When you achieve a working testcase, please consider submitting it to Web Performance support with
a description of the configuration changes required to get it working. This will help us improve our automatic configuration wizards.
Overview
This process usually involves 3 steps:
1. Find the exact cause of the problem
2. Analyze what needs to be different in the underlying HTTP transactions to fix the problem
3. Make the necessary configuration changes in the testcase
The next three sections of the tutorial will describe these three steps in more detail and give some hints on
how to accomplish them.
The remaining sections are examples of solving some specific problems with various combinations of the
techniques described.
Finding the problem
When searching for the source of the configuration problem, you should start by using the Replay feature,
rather than running a load test. When performing a replay, the software will save all the content received
from the server (much like a recording), allowing you to review the content of each page and inspect the
details of each HTTP transaction. This will be critical in identifying the problem.
There are cases where replays work but load tests do not. When a load test with only 2-3 simultaneous
users fails, the cause almost always falls into one of these categories:
1. User identity or authentication - multiple simulated users are attempting to use the application using
the same identity and the application does not support this.
2. Shared user data - the simulated users are attempting to operate on the same data. Either the operation is blocked by the application or the actions of one simulated user makes the actions of another
simulated user erroneous or impossible.
When a load test succeeds with a small number of simultaneous users but fails when more users are running - the problem is almost always the application and/or the server. Don't be surprised - that's the point of
load testing, right?
Finding the problem in a replay
In order to get the testcase configured correctly, you must identify the first transaction in the testcase where
some symptom of the problem is displayed. This will frequently be a web page that:
l causes a validation or extraction error in the Web Performance software
l displays the wrong content
l display an error message
l response has a different status code
l fails to return a valid response
Sometimes the test will run normally and indicate no errors but the testcases are not producing the desired
results - e.g. a testcase that simulates purchasing an item does not generate any record of the purchase in
the system.
Examples of the above situations:
Errors generated
When a replay cannot be completed successfully, the Replay View will indicate how far the replay progressed before errors were encountered:
Checking the Errors View will usually provide more information about the problem:
Different Status Code Returned
Automatic validation is performed on the status code of each transaction and in most cases it is expected to
be an exact match to the recording. There are some exceptions that the logic will allow automatically. When
a problem is detected, it will appear in the Errors View:
Fails to Return a Valid Response
On occasion the error will be so serious that the server completely fails to return any response and closes
the connection. Most of the time, this is caused by server overload, but occasionally it is caused by server
application errors when unexpected inputs (due to a incorrect testcase configuration) are received by the
server.
Wrong Content Displayed
Inspect each page of the replay in the Content View to determine if the page appears to be correct. Each
page will generally be a close (if not exact) match to the page from the original recording. Does the page
look like the result of a different operation? For example - the login page is returned when another page is
expected.
Error Message Displayed
In this example, the server returned a page indicating that the request could not be completed:
Analyzing the required changes
This step will frequently require a more thorough understanding of the application then you may have
needed before this point. It is often most expedient to enlist the help of an application developer at this point
in the process.
The goal of this phase is to determine:
1. Where is the incorrect data?
2. What is the correct data to send?
3. Where does that data come from?
Step 1 - Where is the incorrect data?
More specifically - which part(s) of which transaction(s) does not contain the correct values?
You must start by identifying the transaction that is not configured correctly. More specifically, which HTTP
request is not sending the correct data? In many cases, this will be the same transaction that displays the
problem symptoms. If not, the transaction will be earlier in the testcase - you will have to track backwards in
the application to find the source of the problem.
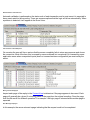
For example, if you have seen an error from the Web Performance software like this:
Page did not contain required variable(s): #xname
The related page is the first place that the Web Performance software has detected a problem, so this is the
first place to look. Did this transaction receive the expected page in the response? If "yes", why was the variable not in the page? If "no", why was the correct page not returned? Was something in the request (URL
query parameter, cookie, form field) incorrect? The answers to these questions, with the help of the application developer, should lead you to discover what piece(s) of data in the request(s) are in need of further
configuration.
Step 2 - What is the correct data to send?
Once we have located the incorrect data - we can then determine what the correct values should be. In
some cases this will be obvious. In other cases, the application developer may be able to help.
One of these two cases will apply:
1. The user would have provided this data
2. The server provides this data
There are a few exceptions to the above:
l Some data is randomly generated by scripts within the
page. In this case, since the server will generally accept
any value, we will consider it "user" data, even though
the end-user did not actually enter this information.
l With some testcases, you may find that the problem
occurs in transactions that are not required for the testcase. The click-tracking URLs found on many large portal websites or e-commerce websites are a good
example - the testcase does not required these URLs to
succeed - and in many cases these URLs are undesirable for the testing process. You can use the Transaction Blocking features to eliminate these transactions
from your testcase during the recording phase.
If #1 applies, then the values must be provided by you in the form of a Dataset. This data may be generated
(such as random or sequential values) or imported into the dataset. The appropriate values is entirely
dependent on your testcase and the details of the application implementation. Either the test designer or the
developer will have to make that decision. The Datasets page describes the process for creating datasets
and the Fields View page shows how to substitute data from a dataset into a field entered by the user.
Step 3 - Where does that data come from?
If the data did not come from the user, then it must have come from the server. The browser doesn't "make
things up", so with the exception of randomly generated data in scripts, everything else must come from the
server. The ASM wizard will automatically locate many of these. When it does not, you must locate that information and either:
1. Manually configure extractors and modifiers
2. Provide a custom rule that will help the ASM wizard find and configure this data automatically.
But first you must find it.
If the application developer cannot tell you where the data comes from, you can use the Content View (particularly the text tab) to inspect the source HTML of each page returned from the server during the recording.
Note that many modern web applications receive significant amounts of their data in plain-text or XML formats that are retrieved by Javascript, rather than the source HTML of the pages. Be sure to look in those
transactions, as well!
When you have located the data that causes the problem, then you can proceed to the next section to configure the Web Performance software to handle it.
Testcase Configuration
Once you have determined which piece of data is causing the problem, you can decide what to do about it.
The solutions generally fall into these categories:
1. Remove the entire transaction from the testcase
2. Ignore the field during automatic configuration
3. Find and configure the source of a dynamic field
4. Find and configure dynamically-named fields
Remove the entire transaction from the testcase
For complex or portal sites, there are often many transactions that come from systems that are not intended
to be part of the test.
For example: tracking URLs (used for user activity) and URLs from advertising sites (for banner ads) should
frequently be left out of the test altogether.
Any transaction that is not required for the correct operation of the testcase and comes from a server that is
not being tested (or the URL has negligible performance impact) is a candidate for this technique.
Note: The term transaction in these documents always refer to
a single HTTP transaction, which corresponds to a single
request/response between a web browser and a web server. It
should not be confused with any concept of a transaction in
the web application, such as making a purchase on an e-commerce site.
Once you have located the URLs or servers to be ignored, they can be removed from the testcase manually
by deleting the undesired transactions. Be sure to run the configuration wizards again (especially the ASM
wizard) to update the testcase configuration. Failure to do this can cause errors during replay. You may also
use the Blocking preference page to block these transactions from being recorded and then re-record the
testcase. Note that during the recording process, these transactions will still pass between the browser and
server - they will simply be left out of the testcase.
Ignore the field during automatic configuration
Some fields are detected by the ASM logic as dynamic when they are not. Frequently there are fields that
could change in various parts of the application, but not for the particular testcase being simulated. This
causes extra work for the load testing tool and potentially misleading errors during a test if the fields do not
appear in the page during a replay or load test.
The ASM wizard can be instructed to ignore these fields:
1. Run the ASM wizard
2. On the wizard page titled Configure fields for dynamic handling in test case, select each field to be
ignored and select the Never Extract option for each field.
3. Complete the wizard
This will cause the ASM wizard to ignore these fields during configuration - as a result no attempt will be
made to extract or modify them during a replay.
Once this technique has been determined to be useful for a field, you may use the Ignore Fields feature to
permanently ignore a field during the ASM analysis.
Find and configure the source of a dynamic field
Some fields cannot be automatically configured by the ASM wizard because it cannot find the source of the
field. This is frequently the case when the fields are assigned a value by a mechanism other than using the
value parameter in the field declaration tag (e.g. javascript) or for query parameters in URLs that are generated dynamically in the browser (e.g. javascript).
The next section, Configuring Dynamic Fields, shows an example of the configuration steps required to
address this situation. The Web Service tutorial also demonstrates a solution to this problem.
Find and configure dynamically-named fields
Some applications use an architecture that results in the same fields having different names each time the
testcase is performed. These fall into two categories:
1. Fields with name dependencies
2. Fully-dynamic file names
Case #1 has groups of fields where a portion of the field name is equal to the value of another field. For
instance:
ITEM=123
FNAME123=Bob
LNAME123=Jones
ZIP123=44095
ITEM=456
FNAME456=Jane
LNAME456=Smith
ZIP456=76012
In the above example, the names of the FNAMExxx, LNAMExxx and ZIPxxx fields are dependent on value
of the preceding ITEM field. These fields can be handled automatically using the Dynamically Named Fields
feature, described later in this tutorial.
Case #2 has two variations:
1. The name of the field can be predicted in advance
2. The name of the field essentially random - it can not be known in advance
If #1 applies, then the field name can be supplied in a dataset and manually configured with a modifier in the
Fields View.
If #2 applies, the testcase will require customization that is beyond the scope of this tutorial. Please use the
Support wizard to send the testcase to the Web Performance support system. The support personnel can
help you arrive at a working configuration.
Configuring Dynamic Fields
Once you have determined what values need to go into which fields, and where it comes from, there are two
ways to configure the testcase - manually and automatically.
l
Manual configuration - This involves configuring a modifier and an extractor to move the data from a
response to a subsequent request. This is a good way to handle simple cases and to validate a proposed solution before attempting to create an automatic configuration. However, if a similar change
needs to be made for many transactions and/or for many similar data elements, this can be a lot of
work.
l
Automatic configuration - This involves creating a rule that the ASM Wizard can use to automatically
locate the data and configure modifiers and extractors as needed when the wizard is run. This is a
good way to handle cases where the same data needs to be extracted/modified in multiple transactions (such as session identifiers) or there are multiple fields that are expressed in the same manner.
It can be a little more difficult then a manual configuration, but generally saves configuration time and
effort in the long run.
Note that some situations can ONLY be configured manually and some can ONLY be configured automatically. Additionally, there are some cases where neither manual nor automatic configuration is possible
via the techniques described here. Please submit your testcase to Web Performance support for assistance
in these cases. You can use the Support wizard to help automate the process.
Extractors, Modifiers and User State Variables
There are a few important concepts to understand before proceeding. When a request requires dynamic data that comes
from a previous response, there are two discrete steps:
1. extract the relevant data from the response into a user
state variable
2. modify the appropriate part of the request as it is written
to the server to contain the value from the variable
Terminology:
Extractors operate on a response. They look for a specific
piece of data in the response and place it into a User State
Variable.
User State Variable is simply a named place to store some
data. The User State Variables are (by default) reset each time
the Virtual User restarts a testcase.
Modifiers operate on a request. They change a specific section of a request, as it is written to the server, to contain the
value from a variable or dataset.
Manual Configuration
Here is an example of a pair of transactions that require manual configuration. The response of the first transaction contains some information that needs to be extracted and saved for use in the second transaction the TAG_ACTION field. In this example, the javascript included in the source of the page will set the value of
the TAG_ACTION field to the value supplied as the second parameter to the javascript setField() method.
This value could be different each time the response is received - and must therefore be extracted dynamically during a replay in order to supply the correct value for the next transaction. The source of the response
page is shown below:
figure 1: transaction 1
The request of the second transaction should contain the dynamically extracted value (from the first transaction) instead of the value that was originally recorded. Note that if the value was supplied as the default
value in the field declaration tag, the ASM wizard would automatically pick up that value, since that is the
standard way to provide the value for fields that are not user entered.
figure 2: transaction 2
Step 1 - Configure the Extractor
In order to reliably extract information from a response, we must be able to tell the extractor how to locate the
data to be extracted. In this example it is easy, since the session identifier is surrounded by javascript:setField('TAG_ACTION', ' and ');.
1. Open the Actors view (Extractors tab) and select the transaction containing the data to be extracted
(which must be in the response)
2. Press the Add Extractor... button ( )
3. Complete the Prefix and Suffix fields
4. Enter the name of the user variable to store the session identifier in (e.g. action)
5. Verify that the correct value is shown in the Value selected for extraction field
When these items are complete, the dialog should look like the picture below. When it does, you can press
the OK button to save the new extractor.
When replaying this testcase, the Virtual User will run this extractor after the response has been received. In
this case, it will look for the target data (as configured above) and store it into a user state variable.
Step 2 - Configure the Modifier
In most cases, Analyzer will automatically parse the fields submitted with each request and they will be visible in the Fields view. Here is the TAG_ACTION field:
Selecting the field and pressing the Edit button ( ) or double-clicking the Modifier (M?) column for the field
will open the Field configuration dialog. In this dialog, select the User Variable option for the field value and
enter the name of the variable, as shown below.
Note that the variable name MUST be the same name used in the extractor configuration (above).
After these changes are complete, replay the testcase and verify that the new configuration changes have
the intended effect. If the testcase still generates errors, be sure to verify that this particular field is now correct - there are often multiple fields that need customization before arriving at a successful testcase.
Once you have determined that the manual configuration works as intended, you may wish to automate the
process by creating a custom detection rule, as described in the next section.
Automatic Configuration
The above example can be configured automatically in two ways:
1. Single-field configuration - automatically configure this EXACT case, i.e. the TAG_ACTION field
2. Multiple-field configuration - automatically configure any field that matches this usage pattern
In both cases, you must create a detection rule. This rule describes how ASM should locate the value assignment for a given field name. More information on the configuration options for detection rules is available in
the Custom ASM Configuration section.
Both configurations are performed in the Detection Rules preference page. Go to Window->Preferences>Web Performance->Application State->Detection Rules.
Single-field Automatic configuration
Add a detection rule with the parameters as shown below:
These parameters will create a rule that looks for matching values between provided the prefix and suffix in
web pages and attempt to match that value with the value of the named field (TAG_ACTION). Any places in
the testcase where a match is found, the ASM wizard will automatically configure the extractor and modifier
as demonstrated above.
Press the Test selected Rule(s) button to validate the configuration. Note that this step verifies that the configuration is valid but not necessarily correct. In other words, it checks that the combination of parameters provided is allowed and the parameter names are spelled correctly, but cannot verify that the rule will have the
intended result.
Accept the changes (OK button) and run the ASM wizard on the testcase by selecting the Configure->Application State item from the pop-up menu in the Navigator. Verify that the fields have been detected by the
wizard as required.
Multiple-field Automatic configuration
Using this method, you will create a detection rule that will apply to fields with different names but share the
same declaration format. For example, it would recognize the field value declarations for FIELD1 and
FIELD2 in these lines:
javascript:setField('FIELD1', 'value1');
javascript:setField('FIELD2', 'value2');
Add a detection rule with the parameters as shown below:
These parameters will create a rule that is very similar to the rule created in the previous step. The primary
difference is that instead of only employing this rule for a specific field name, it will apply the rule for any field
for which it cannot find a match using the default rules. In addition, the name of the field will be dynamically
inserted into the detection prefix and suffix so that the detection parameters can be specific as possible to
avoid false positives. The field name will be substituted into the prefix and/or suffix in place of the {0} character sequence. Any places in the testcase where a match is found, the ASM wizard will automatically configure the extractor and modifier as demonstrated above.
Unlike a single field configuration, the single quote character is reserved as an escape sequence. To force
the detector to match a brace (such as { ), the brace may be surrounded by single quotes. If the detector
should match a single quote, then the quote should be doubled.
Press the Test selected Rule(s) button to validate the configuration. Note that this step verifies that the configuration is valid but not necessarily correct. In other words, it checks that the combination of parameters provided is allowed and the parameter names are spelled correctly, but cannot verify that the rule have the
intended result.
Accept the changes (OK button) and run the ASM wizard on the testcase by selecting the Configure->Application State item from the pop-up menu in the Navigator. Verify that the fields have been detected by the
wizard as required.
Dynamically Named Fields
Occasionally your testcase will include variables that not only have changing values during playback, but
also change in name as well.
Consider the case where two variables are posted to your application server:
serialno=1234
color1234=blue
In this case, you may specify that the variable color1234 should be renamed, using a name derived from the
variable serialno each time the test is played back. In order to configure your testcase, you must configure
the "Dynamically Named Fields" preferences how to detect this behavior in your application. This option
may be configured through a preference page, accessed by selecting Window→Preferences… and then
selecting Web Performance→Configuration Wizards→Application State→Dynamically Named Fields.
Configuring these fields is done in two phases. The first is to select the "Add Field" next to the "Identifiers"
table, and enter the name of the field that identifies a value. In our example, the identifier is "serialno",
whose value will be used later to identify the name of the next variable.
Next, select the field in the Identifiers table to display the dependant fields associated with it, and press the
"Add Field" button next to the bottom "Fields" table to create a new dependant field. The name of the variable may be entered here, replacing the dynamic part of the name with an ampersand (&). In our example,
the color field would be entered as "color&".
The next time the Application State Management Wizard is run on a testcase, fields starting with the name
"color", and ending their name with a value from the field "serialno" will be dynamically renamed when the
testcase is replayed or run in a load test.
More elaborate testcases can also be defined using dynamically named variables. Consider if our case had
been:
serialno=1234
color1234=blue
weight1234_in_lbs=5
1234_assembly_date=20051201
It is possible to specify multiple fields as having a single dependency by adding their names to the "Fields"
table:
l color&
l weight&_in_lbs
l &_assembly_date
This configuration will allow the Application State Management Wizard to correctly assume name dependencies for all three dependent variables.
It is also permitted for a dynamically named field to be associated with multiple identifiers. For example, consider another case:
itemid=123456789
checkbox123456789=checked
legacyid=123
checkbox123=unchecked
To configure this case, simply create to identifier fields:
l itemid
l legacyid
Next, add the dependant field "checkbox&" to both identifier fields. The Application State Management Wizard will examine both uses of the "checkbox" fields, and only associate dependency when the name of the
field corresponds to the value of the identifier. In this example, the wizard will associate the first "checkbox"
field as being dependant on "itemid", and associate the second "checkbox" field as dependant on the field
"legacyid".
Ignoring Fields in the Application State Management Wizard
The Application State Management Wizard will attempt to automatically configure those variables shared by
the end user's Web Browser and the Application Server, but are not immediately exposed to the end user.
Generally, no further configuration is required in order for your testcase to play back successfully. However,
an easy optimization can be made to increase the number of virtual users supported by each load generating engine by removing those fields that never change. However, for large test cases, removing those
fields from the ASM Wizard may be an inconvenient approach.
The Application State Management Wizard offers ignore preferences in order to automatically ignore those
fields which are not intended to be treated as dynamic. These preferences may be accessed by selecting
Window → Preferences… and then selecting Web Performance → Configuration Wizards → Ignored Fields.
This page contains two lists, one for omitting fields by name, and one for omitting specific uses of a field by
their value. For example, suppose your case contained a H TML fragment: <input name="btnSubmit"
type="Submit" value="submit" />
This may result in a fixed value post being sent to your server:
btnSubmit=submit
You may always remove this value from the Application State Management Wizard manually, or you could
specify that this field always be automatically removed with either ignore list
Ignored Names
Ignored Values
OR
submit
btnSubmit
Be very careful not to include a blank entry unless you intend for the Wizard to treat blank values as fixed
values as well. The next time you run the Application State Management Wizard, any usage with their name
or value specified in one of the ignore lists will be automatically ignored or hidden by the wizard.
Load Testing a Web Service
Overview
The purpose of this tutorial is to illustrate the steps required to load-test a web service using Web Performance Load Tester. Although the demonstration service used in this tutorial is very simple, the concepts
presented are directly applicable to more complicated services.
This tutorial is organized into 4 main steps:
1. Create the testcase
2. Configure the testcase for replay
3. Configure the testcase for multiple users
4. Run test and analyze results
Introduction to the Bank web service
The service tested in this tutorial provides an interface to bank accounts. A similar service might be used, for
example, to allow ATM machines in bank branches to access accounts in the central bank system. The operations used in this tutorial are login and get-balance. These operations use a simple pseudo-XML format for
ease of readability.
Login transaction
The login transaction sends the username and password in a login operation. If successful, the response
contains a session identifier that must be used for future transactions. The XML sent and received in this
transaction look like this:
Note that the above screenshot shows the content as viewed in Analyzer's
Content view.
Get-balance transaction
The get-balance transaction sends the session identifier and, if successful, receives the account balance (in
cents). The pseudo-XML sent and received in this transaction look like this:
In two example transactions show above, user "JAMES" logs into the system using the password
"nkbmmfn". The result value "1" in the response indicates a successful login and provides a session identifier to be used in future transactions. He then checks his balance and finds that he has $7.49 in his account
(749 cents).
Step 1 - Creating the testcase
The first step in the load-testing process is to create the testcase to be simulated. The testcase is a collection of HTTP transactions (requests and responses). When testing a browser-based application, this step
is usually achieved by using the browser to interact with the website in the same manner any user would with the browser configured to use a recording proxy. This proxy records the HTTP transactions between the
browser (client) and server and creates the testcase using these transactions. If you have a client for your
web service and it supports the use of a proxy, this is the fastest way to get a testcase created.
Since many web services do not have this ability, we will demonstrate how to create the transactions from
scratch.
Creating the login request
The first step is to create the content of the request - that is the pseudo-XML shown above. Paste this into
your favorite plain-text editor and then save the file (e.g. login-request.txt). Next, note the length of the file this length will be needed when we add the HTTP headers.
Step 2 involves putting the HTTP start-line and headers into the request. Below on the left are the start-line
and headers used for this example request - the required headers may be different depending on the requirements of your service.
Note that each part of the request headers will need modification as required by your service:
1. In the start-line, the path of the service will be different (/demo/bank)
2. The host should be changed to the hostname for the server your service resides on
3. The content-type could be different (text/xml is common)
4. The content-length must be changed to match the content you created for this request
The text file used to create the request shown above contains this:
POST /demo/bank HTTP/1.1
Host: www.webperformanceinc.com
Content-Type: text/xml
Content-Length: 111
<request>
<operation>login</operation>
<username>JAMES</username>
<password>nkbmmfn</password>
</request>
The other request and responses are created in a similar manner.
Once you have the 4 files created (a request and response for each of the 2 transactions), we can create the
testcase.
In the Navigator, select the Create Empty Testcase item from the pop-up menu on the Testcases node to
create a blank testcase where the transactions can be placed:
We now have an empty testcase (renamed "Check balance"):
The next step is to create the two transactions required for the Check balance testcase.
Each transaction can be imported (request and response) using the Import->As New Web Page item from
the pop-up menu in the testcase editor:
Note that Analyzer groups transactions together in pages within a testcase.
For a web service, there are no pages, so Analyzer will simply treat then as
one-transaction pages. In complex services that issue several groups of
transactions that are logically grouped and related, it can be useful to group
the transactions together within a single page. Analyzer will calculate separate metrics for each transaction and for each page, which can be useful
when analyzing load test results.
The request and response files are selected in this dialog:
After importing both transactions, our testcase looks like this:
Step 1 is now complete.
Note that the duration of the imported transactions is 0. Since
these transactions have not yet been analyzed with a live
server, the duration metrics cannot be determined. After a successful replay has been completed, consider promoting the
replay to the base recording: Select the Promote button on the
Replay Properties dialog - accessible from the replay dropdown at the top of the testcase editor.
Step 2 - Configuring session-tracking
Before we can execute this testcase in the current form, we have to handle the session-tracking used by the
service. We could replay the transactions exactly as we created them, but the service would fail on the second transaction, because the replay would send the session identifier that we put in the transaction. Since
this session identifier has probably expired since we obtained it, the get-balance request needs to send the
new session-identifier from the login response.
Note that some services use cookies for session-tracking, much like a
browser. If this applies to your service and you can record it using the recording proxy or you have imported real transactions captured in some other way,
the cookie headers might be in place and will be handled automatically by
Analyzer. In this case, this step may not be necessary.
Two steps are required to handle session-tracking for this testcase:
1. Extract the session identifier from the login response
2. Modify the session identifier sent in the get-balance request
To do this, activate the Actors view and select the login transaction in the testcase editor. The Actors view
will initially appear as below (empty).
Press the Add Extractor... button ( ) to add a new extractor - the resulting dialog allows configuration of the
extractor. In this case, we want to extract the session identifier which is located between the <sessionid>
and </sessionid> tags (delimiters) in the response. As these values are entered in the Prefix anchor and Suffix anchor fields, the delimiters will be highlighted in the response content field in the lower third of the
dialog. If either delimiter cannot be located, an error will be indicated at the top of the dialog. If both the prefix
and suffix anchors are found, the target value for extraction will be displayed in the field at the bottom. Next
we enter sessionid in the Extract value in user variable field. This will create a variable in the user state that
will contain the session identifier when it is located by this extractor.
Note that if the delimiters appear several times and the first instance does not
contain the desired value, the Repitition number... field may be changed to
select the correct value.
After pressing the OK button, the Actors view will show the Extractor like this:
Once the session id has been extracted from the login response, it should be dynamically replaced in the
get-balance request. This is accomplished by adding a modifier in the Fields view. Open the Fields view
and then select the get-balance transaction in the testcase editor (2nd transaction). The fields in the request
will be displayed as below.
Since the request content in a web service can be any format, Analyzer presents it as a single post field.
Double-clicking the Modifier column (M?) will open a dialog for adding a modifier. Since we only need to
replace a small part of the request content, select the Partial content radio button. The dialog will now
appear like this:
Since no modifiers have been configured yet, the Modifiers list is empty. To add a modifier for the session
identifier, select the session identifier value in the Content section and press the Add ( ) button. In the
resulting dialog, the modifier should be configured to replace the recorded content with the User variable
sessionid - which corresponds to the User variable that we created when configuring the extractor for the
session identifier in the previous step. The configuration should look like this:
After pressing the OK button, the modifier will be added to the list:
With session-tracking configured for the testcase, the testcase may be replayed. Pressing the Replay button
( ) in the toolbar will invoke the testcase configuration wizard. This wizard is very useful for complicated
web applications but for simple web services it is frequently unnecessary. Select the Do nothing... option
and press the Finish button.
After dismissing the Testcase Configuration wizard, the replay will begin. It will likely end very quickly, since
it is a very simple and very short testcase. When it is complete, open the Errors view and then select the testcase to verify that no errors occurred during the replay. Then open the content view and select the get-balance transaction in the testcase editor to view the result:
Checking the value of the session identifier we can see that it is different from the original transactions we
created - indicating that Analyzer was able to successfully extract the session identifier from the previous
response and modify this request to send the correct session identifier. Also note that the balance returned
is correct (we'll come back to this later in the tutorial). If you replay this testcase again, you should see a different session identifier with the same balance returned each time.
At this point we can declare success step 2 of this tutorial - we have configured the web service testcase so
that it can be successfully replayed.
Note that since the Bank demo service does not use true XML, the XML
viewers may not always format the content properly. In the screenshot
above, the plain-text viewer has been selected for both the request and
response content. Additionally, the tabs have been locked to prevent the view
from switching back to the XML viewer each time a transaction is selected.
Step 3 - Configure the testcase for multiple users
The key difference between the simple replay completed in the last step and a load test is volume. A load
test is simply a lot of replays, all happening at the same time. We could perform a load test with the testcase
right now, if we wanted. But it would not be a very accurate simulation of the expected use-case of the system since the same person is not likely to be checking their balance simultaneously from multiple locations
over and over again. Instead we would like the load tests to simulate many different users checking their balance.
Creating test data
The first step in simulating multiple users is to create the list of users. For this tutorial, we will assume that
the system is already populated with accounts and we have the list of user names, passwords and current
account balances available to us.
Example users file:
username, password, balance
JAMES, nkbmmfn, 749
JOHN, ohgixm, 2913
ROBERT, qelslrjnja, 83801
MICHAEL, qfpqjxc, 2074
WILLIAM, nfbwhfh, 614
DAVID, hhjvksgue, 8365
RICHARD, rkipbo, 153
The next step is to import this data into Analyzer™. This is done from the Dataset node in the Navigator.
Select the Import... item from the pop-up menu and complete the import dialog:
After importing the dataset, it will appear in the Navigator under the Datasets tree node and the dataset will
open to show the imported data:
Note the 3 settings at the top of the dataset editor: Lifespan, Resuable & Sharable. The Testcase lifespan
indicates that when a Virtual User (VU, or simulated user) selects a row of data from this data, it will use that
row until the end of the testcase. When a dataset resuable, the row may be used more than once during a
load test. When a dataset is not sharable, it can only be used by single VU at a time. The default settings,
shown above, are usually correct for a dataset containing the user identity.
Customizing the testcase
Now that the user identity information is available, the testcase may be customized to use it. Two modifiers
should be added to the first transaction to replace the username and password in the login request with
values from the dataset. This configuration is similar to the configuration of the session-identifier described
earlier in this tutorial:
1. Open the Fields view
2. Select the login transaction in the testcase editor
3. Double-click the modifier column (M?) and select the partial content radio button
4. Select the username in the Content text area, press the Add button ( ) and select the accounts dataset and username field.
5. Repeat previous step for the password
The testcase is now configured to use a different user identity each time the testcase runs. Replaying the
testcase, as described earlier, will allow you to easily verify this behavior. Each time the testcase is
replayed, a different username and password are sent in the requests and a different account balance is
returned. The following shows the get-balance transaction from the 3rd replay. You can see that the balance, 83801 matches the balance for that user in the dataset.
Configure validation
Validating the results in this way is easy for a few replays, but is not practical for a load test. It would be more
efficient to have Analyzer automatically validate the balance returned in each testcase against the value in
the dataset.
To configure a validator, first return to the original testcase in the editor:
Next, open the Actors view and then select the get-balance transaction in the testcase editor. Then select
the Validators tab at the bottom of the Actors view. You will see the automatically-applied status-code validator already present in the list of validators. Press the add button ( ) to add a new validator.
Configure the validator to look for the account balance from the dataset in the response content by selecting
the Dataset field and radio button and then select the balance field in the accounts dataset, as shown below:
After applying the validator, replay the testcase again and check the Errors tab to verify that no errors were
encountered. There should be no errors because our dataset accurately reflects the system being tested.
To see what the error looks like from the validator, the dataset will have to be changed to purposely have
wrong data in it. Open the accounts dataset and change the value of the first entry in the balance column
(double-click a cell to edit it). Before replaying, we will need the force the replay mechanism to reload the
dataset - to do this, open the Replay view and select the Reset Dataset State item from the drop-down menu
on the right side of the view:
Replay the testcase again and then open the Errors view. The validation error displayed indicates that the
account balance that I entered in the dataset (749X) could not be found in the response content for the getbalance transaction:
Don't forget to change the dataset value back to the correct value before moving on!
Step 3 is now complete - we can move on to running a load test.
Step 4 - Run load test and analyze results
Creating the load configuration
After recording, configuring and verifying each testcase, the next step towards a load test is to create a load
configuration. Select the Check Balance testcase in the Navigator and then select the Create Load Configuration item from the pop-up menu:
The default settings, shown below, should be fine for demonstration purposes.
Running the load test
At this point, the hard work is done! Push the start button to start the load test.
The test will add 5 VUs each minute - if you are using a demo license, it will stop at 10 VUs for the last minute of the test. When the test is complete, the results screen will look something like this:
Analyzing the Results
The test results screen picture above, provides some basic metrics for monitoring the progress and state of
the test - most notably the number of Users, Hits/Sec and Errors. For a more detailed analysis open the test
report: press the Report... button on the results screen. In the first section of the report, you will see overall
metrics presented on charts such as the one pictured below. This chart shows that the total Hits/sec scaled
linearly as the number of users increased. This is a key measure of server performance and this test did very
well!
A large amount of information is available in the test report at varying levels of detail. For a good example of
a load test report, see the website: http://www.webperformanceinc.com/load_testing/reports/
Summary
In this tutorial we have demonstrated the basic process for testing a web service:
1. create the testcase
2. configure the testcase to handle session-tracking mechanism and test using the replayer
3. configure the testcase to simulate multiple user identities and test
4. configure the testcase to validate the result of the testcase
5. create a load configuration
6. run the test
7. analyze the results
Good luck!
Videos
Please see the complete list of videos on our web site.
FAQs
General FAQs
Q: How do I report a bug?
A: You can access our support-tracking system directly or submit an issue directly from our product using
the Support Request form from the Help menu. See the section on Getting Help for more information.
Q: When will you support other OSes besides Windows?
A: We hope to provide support for Linux, Solaris and OSX shortly after the 3.0 release. To help us decide
which platform to support first, please vote for your favorite platform in our issue-tracking system.
Q: Analyzer created a repository for me automatically - where did it go?
A: By default, repositories are stored in the Workspace. If you cannot find it there, try re-opening Analyzer
and hover the mouse over the repository in the Navigator - the tooltip will show the complete path of the
repository file.
Q: I want to change where Analyzer stores my files and settings?
A: The files (by default) and settings are stored in the workspace. The Workspace section of the reference
manual describes configuration of the workspace location.
Recording FAQs
Q: I cannot record - what next?
A: Follow our Recording Troubleshooting Guide
Q: Why do I need to record some pages for Analyzer to analyze my website? Why can't it just scan my site
and test all the pages?
A: Analyzer is designed for complex transactional websites that have strict performance goals and are likely
to experience performance problems due to architectural, database or business-logic problems. Scanning a
website for all the pages is impractical in these cases.
Our initial product surveys indicated that analyzing a website in the "spider" manner has little demand - but
we are happy to be proven wrong! If you have this need, please tell us! You may vote for the feature request
in our issue-tracking system (see the support section of our website and search for "scan website").
Q: When I record with Netscape (or Mozilla, Firefox etc), the pages do not look right (or might even have
errors) in the Web Page tab of the Content viewer.
A: The embedded browser uses the default browser for the platform - on the Windows platform, the default
browser is IE. Therefore, if your site returns content that is optimized for different browsers, the content displayed by the embedded browser (IE) will be the content that was optimized for the browser used during
recording, e.g. Netscape. The only solutions are: 1) record with IE, and 2) ignore the differences and errors
in the embedded Web Page viewer.
Q: Why do all these Security Alert messages appear when I am recording or inspecting a testcase?
A: Because Web Performance products use "fake" server certificates during the recording process in order
to decrypt secure pages from the server. See these instructions to silence the warnings.
Q: How do I record a site that uses Client Certificates?
A: See the Client Certificates section and the Authentication section.
Q: My browser is not recognized. Can I record testcases with it?
A: Yes, if the browser supports HTTP/S proxies. See the Manual Browser Configuration FAQ (next question).
Q: How do I configure the browser manually for recording?
A: Follow these three steps:
1. Manually configure the ports that Analyzer will use for recording so that they will not change each time
Analyzer starts. See the General Settings page for more help.
2. Configure Analyzer to start a custom browser when recording is started (Browsers section of the Preferences page). A custom browser may need to be configured if the browser was not automatically
detected. Then the browser configuration should be set as the default browser. See the Browser Settings page for details.
3. Configure the browser to use Analyzer's recording ports as a proxy. This step is dependent on your
browser - see the browser documentation for more information.
Q: I have URLs in my testcase from a server that I do not wish to test.
A: If the URLs are not important to the testcase (such as images or links for link tracking, click analysis etc),
they can be deleted from the testcase using the Cut item in the pop-up menu for the transaction. These
URLs can be added to the URL blocking list - see the Blocking Undesired Transactions section of the manual.
If all the URLs for a particular server (host name) should be ignored, you can use the Host name blocking
list, also described in the Blocking Undesired Transactions section.
Testcase Analysis FAQs
How can I determine the total size of a web page, including images and scripts?
1. Record the pages
2. In the Editor, check the Size column.
3. Expand the page in the tree to see the sizes of individual resources on the page
How can I examine the HTTP headers my server is returning?
1. Record some pages from your server
2. Open the Headers view
3. Select the page or URL of interest in the Editor
How can I see the cookies my browser is sending to a web server?
The cookies are sent between browser and server in the Cookie and Set-Cookie headers. See the Headers
HowTo.
How can I determine if my web pages are getting faster or slower?
Follow these steps in the Quick Start Guide:
1. Create a recording
2. Replay a testcase
3. Analyze the Performance Changes
How can I find the slowest pages on my website?
1. Record the pages of your website
2. In the Editor, click the Duration column to sort the recording by page duration
How can I find errors on my website?
1. Record the pages of your website
2. Open the Error view
How fast will my web pages be over a modem?
There are two ways to answer this. If you have not already created a recording of the pages of interest:
1. Start a new Recording
2. On the Start Recording dialog, selected the desired modem/network speed.
3. Inspect the web page durations in the Editor
If you already have a recording of the pages, you can replay it with a specific network speed this way:
1. Record the pages of your website
2. Open the Replay View and set the Bandwidth Limit to the desired modem speed
3. Replay the testcase
4. Inspect the web page durations in the Editor ...or...
5. Open a Performance Trend chart for the testcase to see the difference in speed of each page plotted
on a chart
How can I find parts of my website that do not match my performance goals?
1. Record the pages of your website
2. Configure one or more performance goals
3. Inspect the replay in the Editor - failed goals will be indicated by the
icon.
How can I export report data to other formats?
Each data table has a link at the bottom titled export to csv. Clicking this link will invoke a dialog for saving
the data. When viewing the report in an external browser, clicking the link will show the data in the browser.
Most browsers have a function for saving a link content rather than navigating to it. In IE, the context menu
item "Save Link As..." will perform this function.
Testcase Configuration FAQs
How can I change the URL recorded for a Web Page or transaction?
1. Open the Headers View
2. Select the desired Web Page or transaction
3. Edit the URL
How can I change a header in a transaction?
1. Open the Headers View
2. Select the desired Web Page or transaction
3. Edit the Header
How can I change the testcase to send different values in place of form fields or query parameters?
1.
2.
3.
4.
5.
Open the Fields View
Select the testcase in Navigator
Locate the field(s) in the Fields View
Single values (or duplicate identical values) can be edited in-place by double-clicking the table cell
Multiple unique values can be changed to all have the same value by opening the Edit Field dialog (
Edit button) and then entering a Constant Value.
How can I change the testcase to send different values in a form field on each replay?
1. Create or import the desired values in a dataset
2. Configure modifiers on each field/parameter in the Fields View by opening the Edit Field dialog (Edit
button)
3. Each time the testcase is replayed, the next value from the dataset will be used (depending on the
dataset configuration). To reset the dataset to the beginning, select the Reset dataset state item from
the Replay View menu.
How can I change the username and password used in the testcase?
See the Authentication Section.
How can I create custom transactions or testcases without recording them?
Each transaction may be imported one at a time from an existing file.
How can I repeat part of a testcase?
Open the testcase properties dialog (Properties... item from the pop-up menu on the testcase in the Navigator). You can select the start-point and end-point for looping within the testcase. When the Virtual User
runs the testcase, it will start from the beginning and proceed to the configured end-point (Run-To Page).
Then it will restart at the start-point (Restart-At Page) and continue. When the load test is stopped, it will then
run to the end of the testcase.
Replay FAQs
Q: How can I replay a testcase?
A: See Replaying section.
Q: How can I ensure my testcase was replayed correctly?
A: Manually, the pages can be inspected to see if the testcase replayed correctly. Select the replay in the
Testcase Editor and then select the page to be inspected. The page will appear in the Content View.
To automate this procedure, validators can be applied to each page to check the testcase in a automated
fashion
1. Open the Validators View
2. Select the page to check in the Testcase Editor
3. In the Validators View, apply settings for size and/or content validation.
4. Replay the testcase
5. Open the Errors View - an error should appear in the table for any failed validators
Q: When I replay my recording, the value of some of the cookies are different. Why didn't Analyzer replay
exactly what I recorded?
A: Analyzer is much more than a simple HTTP recorder/replayer. It simulates a real browser interacting with
your server. This means that if the server sends new cookies, Analyzer will use them, just like a real browser
does. As a result, Analyzer is compatible with sophisticated websites that require a user login and track session state using cookies.
Q: I want to change the username and password used in my testcase
A: See the Authentication section
Q: How do I replay with different users each time the testcase runs?
A: See the Authentication section
Q: How can I see which values are being used from a dataset during a replay?
A: The Replay View contains a tab that shows the current state of the datasets during a replay.
1.
2.
3.
4.
Open the Replay View
Select the Datasets tab
Replay the testcase.
If the testcase has very short think times between pages It may be helpful to step through the testcase
one page at a time using the page-step button (see the Toolbar for the replay button descriptions)
5. The Datasets tab will indicate which datasets are in use by the Virtual User and what the values are
for each field in that dataset row.
Q: How can I replay every testcase in a repository
A: Select the Advanced Replay... option from the Replay toolbar button ( ) drop-down menu and select the
"All testcases..." option.
Q: How can I replay testcases at night?
A: Select the Advanced Replay... option from the Replay toolbar button ( ) drop-down menu and select the
"Schedule for..." option.
Q: How can I run replays in an automated process?
A: See the Command Line Tools section
Q: How is the browser cache simulated during a replay?
A: The simple answer is: it will replay the same transactions that are in the recording. If the browser had the
resource cached during the recording, the replay will simulate the same behavior. The default configuration
will clear the browsers cache and cookies before recording, thus simulating a new user to the site.
If you wish to simulate a user returning to your site after one or more previous visits, you should:
1. Turn off cache and cookie clearing for the selected browser
2. Start the browser and perform the initial visit to pre-load the browser cache.
3. Record the testcase
4. Reset the cache/cookie browser settings, if applicable
Note that depending on the browser settings and cache behavior, a resource that is re-used between pages
may still be requested multiple times. When the browser is expecting to use the cached version, it will make
a request with an if-modified-since header. If the resource has not changed, the server will respond with a
304 status (Not Modified). Javascript/AJAX frameworks may issue multiple requests for resources, completely ignoring the browsers cache.
Some testcases may require more advanced handling of the if-modified-since dates. To turn on dynamic
handling of these headers, go to the testcase properties (Edit > Properties) and select the option on the
Restart Options tab. Note that this is only required if last-modified dates of resources are expected to change
between the time the testcase is recorded and replayed.
Load Testing FAQs
Q: During a load test, I see many of these errors: "Unable to establish a connection to the server" What does
this mean?
A: It means that the Virtual User failed to connect to the target server when initiating a request for a URL. If it
happens with only a single user running then it could be a network or DNS problem. If the error does not
occur at the beginning of a test but becomes more frequent as the test progresses, then the problem is
frequently caused by a server configuration mistake. Check the server configuration settings for the maximum number of concurrent connections. This number should be at least double the maximum number of Virtual Users being simulated during the test.
Q: During a load test, I am seeing errors that indicate a 302 status code was received from the server when it
was expecting a 200 (or some other code). Is this a problem?
A: The 302 status code indicates a redirect (forward) to another URL. When this is not expected during a
load test, the most common cause is a session-tracking or authentication problem. When most servers
detect an invalid session or invalid authentication, the will frequently return a redirect to the application's
login screen. If you have not already run the Testcase Configuration Wizard (which normally runs automatically), you should run it from the Navigator view using the pop-up menu for the testcase in question.
If you have run the wizard and still encounter this error, you must determine what kind of session-tracking
and authentication is being used by the application. If possible, it would also be helpful to find the exact
cause of the condition that is causing the application to return the unexpected 302 - checking the server logs
or discussing the problem with the application developers may help determine the cause. When you have
this information, you may submit a support request (Help->Support Request) and send the test results to our
support system.
Q: After a load test, Load Tester displays the message "Missing samples from engines." What does this
mean?
A: When using remote engines during a load test, there may be times when the load engine is not able to
promptly communicate with the controller. This can be caused by the engine approaching it's CPU, memory
or network bandwidth capacities or by network congestion between the engine and the controller. In this
case, the engine is usually able to continue performing in the load test, but the summary graphs may show
subtle "dips" where data from a specific engine is unavailable.
Q: How can I see more detailed metrics from my load test results?
A: Activating the Metrics view and selecting the test results will display the detailed metrics for the test. Navigation within the view allows display of summary, testcase, server, engine, page and URL metrics. The
detailed metrics may also be exported from the Export item in Navigator pop-up menu for the selected test
results.
Q: When running a load test with load engines on Windows, I see "Engine operating system out of network
sockets" errors. What does this mean?
A: By default, when a Windows socket is closed by an application, Windows waits 240 seconds before closing it. During this time, the port that the socket used is placed in the TIME_WAIT state and cannot be reused.
Windows also has a restriction on the highest port number that can be used (5000) when an application
requests any available user port from the system.
Therefore, the Windows socket defaults may not accommodate heavy TCP/IP traffic very well without some
tuning.
To alleviate the problem, we recommend changing the Windows default values of two registry keys. You
must use the Windows registry editor (regedit) to make the changes, so be very careful. Make the following
changes:
l
Reduce the time-out wait time for closed sockets. Change the value of the registry key HKEY_
LOCAL_MACHINE\System\CurrectControlSet\services\Tcpip\Parameters\TcpTimedWaitDelay
from its default of 240 to a smaller number. The valid range it 30-300 (decimal).
l Increase the maximum port number available to applications. Change the value of the registry key
HKEY_LOCAL_MACHINE\System\CurrentControlSet\Services\Tcpip\Parameters\MaxUserPort
from its default 5000 (decimal) to a higher number. The valid range is 5000-65534 (decimal).
For more information on these two registry keys, you can search for TcpTimedWaitDelay and MaxUserPort
on the Microsoft Technet and Knowledge Base.
Q: When running a load test with load engines on Unix (Linux/Solaris), I see "Engine operating system out
of network sockets" or "too many files open" errors. What does this mean?
A: In Unix environments, a file handle is used for each open network connection (socket). The number of
resources allocated for these handles is controlled by the ulimit setting.
To see the current setting, run ulimit -n
To change the setting, run ulimit -n NNNN where NNNN is the new value.
Choosing a new value is dependent on the nature of your testcase, the number of users being simulated
and other factors. We usually increase it by a factor of 10 over the system default, since load testing is considerably more network intensive than the default installation of most OSes expect.
Note that the above solution is not permanent - it will only affect the current session. For a more permanent
solution, add a line like the following to the /etc/security/limits.conf configuration file (may be different
depending on the Linux/Unix distribution. You will need to logout/in before this change will take effect.
<username> hard nofiles NNNN
Q: My load test generated the following errors, what does it mean?
Page did not contain required variable(s): #variable1, #variable8, #variable23
A: It means that the software expected to find certain variables in the pages returned from the server because they were there in the recorded testcase. The most common causes of this error are:
1. An unexpected page was returned from the server, and this page is very different from the recorded
page, due to an error condition, such as improper authentication.
2. The page returned from the server is correct, but the field is missing from that page.
3. The page returned from the server is correct, but the software incorrectly identified the field to be
retrieved or has a name that changes for each iteration of the testcase.
Viewing the error page in the content view should help determine if #1, #2 or #3 is the case:
1. The authentication of the testcase may not be configured properly - see the Authentication section for
more information.
2. The ASM wizard tries to find every possible field that may be passed from one page to the next in
order to accurately simulate a testcase. Many of these fields may not be necessary or may be the same
for every iteration of the testcase. In this case, re-running the ASM wizard and removing those fields
from consideration may alleviate the error while still allowing the testcase to be simulated correctly.
3. Ask the developer of the web-application if this field is needed within the context of this particular testcase. If it is, enter a support request so we may help you with advanced configuration to handle this situation.
Q: How can I run a load test at night?
A: Select the Schedule test... option from the Loadtest toolbar button ( ) drop-down menu and select the
"Schedule for..." option.
Q: I cannot connect to my server agent because of firewall or network restrictions.
A: The server agent can operate in offline mode
Load Test Analysis FAQs
Q: Can I change the performance checklist settings that are used to evaluate server performance in the
Server Performance Checklist section of the Load Test Report?
A: Yes. Each checklist item can be edited or removed in the Server Checklist section of the Preferences.
Q: Can I see metrics for every transaction in my testcase instead of just for the pages?
A: Yes. You can turn on transaction metrics in the Load Test Settings preference page. This must be turned
on before you run the test.
Q: Can I see every single page duration during a load test, instead of just the minimum, maximum and average?
A: Yes. You can turn on detailed page durations in the Load Test Settings preference page. This must be
turned on before you run the test. You will then see a Detailed Page Durations graph in the report (in the
Summary section, each Testcase section and each Web Page section). You can also see the detailed durations in the Metrics view.
Reference Manual
Views
Toolbar buttons
The toolbars provide quick access to frequently-used operations.
Repository
Open an existing repository
Create a new repository
Close the selected repository
Edit
Edit properties for selected item
Rename the selected item
Cut the selected item
Copy the selected item
Paste the selected item
Record & Replay
Start a new recording (use the drop-down menu to access advanced recording options)
Stop a recording, replay or load test
Start replaying a testcase (use the drop-down menu to access advanced replay options)
Start replaying a testcase, without pausing for page think times
Pause the replay
Replay the next URL and pause
Replay to the end of the next/current page and pause
Start a load test
Editor
Compare the replays of a recording
Show differences in comparison as a percentage
Expand all pages in the testcase tree
Collapse all pages in the testcase tree
Sort the testcase
Open the testcase report
Run testcase configuration wizards
Navigator
The Navigator is used to view and manage test cases and datasets. Test cases and datasets are saved in a
repository. Test cases are created by executing and saving tests with the Analyzer tool. Datasets are
created by importing existing datasets or creating new datasets using the Dataset Editor. The repository is
saved in a file with the .wpt extension.
Opening the Navigator View
The navigator view is opened by selecting Window->Show View-> Web Performance Navigator from the
main menu.
Open, Close or Create a Repository
Each of these operations can be initiated from four places in the UI:
1. Repository menu.
2. Pop-up menu in the Navigator pane (right click to show)
3. Toolbar
4. File menu (standalone version only)
Opening
Multiple repositories can be opened at the same time using by holding
the Shift key while selecting items in the list or tree.
The repository, test cases and datasets are displayed in the navigator
when opened.
Closing
When a repository is closed, any open editor windows associated with
the repository are closed.
Creating
Before creating the repository, you will be prompted for the file name
and location.
Recently Used Repositories
A shortcut to opening the recently used repositories is provided in the Repository->Recently Used and the
pop-up menu in the Navigator.
Cut, Copy, Paste or Rename a Test Case
After selecting a Test Case in the Navigator, it can be cut, copied, or renamed. The paste capability is activated once a cut or copy has occurred. These actions are available in the following locations:
1. Repository menu
2. Pop-up menu in the Navigator pane (right click to show)
3. Toolbar
Cut
Any open editor window(s) associated with the Test Case are closed and the Test Case is removed from the
list of Test Cases in the Repository.
Copy
Copy is used along with Paste to create a copy of the selected Test Case in the specified Repository.
Paste
Used in conjunction with Copy or Cut, Paste creates a new copy of the last cut/copied item in the Repository
selected in the Navigator View.
Rename
A new name must be entered. Duplicate Test Case names within a Repository are not allowed.
Cut, Copy, Paste or Rename a Dataset
After selecting a dataset in the Navigator, it can be cut, copied, or renamed. The paste capability is activated
once a cut or copy has occurred. These actions are available in the following locations:
1. Repository menu
2. Pop-up menu in the Navigator pane (right click to show)
3. Toolbar
Cut
Any open editor window(s) associated with the Dataset are closed and the Dataset is removed from the list
of Datasets in the Repository.
Copy
Copy is used along with Paste to create a copy of the selected Dataset in the specified Repository.
Paste
Used in conjunction with Copy or Cut, Paste creates a new copy of the last cut/copied item in the Repository
selected in the Navigator View.
Rename
A new name must be entered. Duplicate Dataset names within a Repository are not allowed.
Other Pop-up Menu items
Additional items on the Navigator's pop-up menu are available based on the item selected in the Navigator
view. These are:
l
l
l
l
l
l
Edit Testcase
Opens a Testcase Editor when a testcase is selected.
Edit Dataset
Opens a Dataset Editor when a dataset is selected.
Import Dataset
Opens the Import Dataset Dialog when a dataset or the Dataset Folder is selected.
Reload Dataset
Opens the Import Dataset Dialog when a dataset is selected.
Create a new Dataset
Opens the New Dataset Dialog when a dataset of the Dataset Folder is selected
Record a new Testcase
Starts recording a new testcase when a testcase or the Testcase Folder is selected.
Notes:
l
Every open repository loads the contents of each test cases into memory. Closing unused repositories will reduce the memory consumed by the test cases.
Testcase Editor
Testcase Editor
The Testcase Editor is used to view details of the testcase and the replays of the testcase. The Testcase
Editor initially presents the test case as a tree of web pages, URLs. Opening the page (click the '+') will display the additional resources requested for the page (images, style sheets, etc.). When a new testcase is
recorded, a Testcase Editor window is opened and displays the transactions as they are recorded. The Testcase Editor can also display comparisons between the viewed content and a replay (or the original if a
replay is viewed).
1. Title: A logical name for the item. For web pages, the title will be extracted from the document. For
other resources, a best-guess will be made, such as a filename. If the same resource appears multiple
times, the titles will be numbered to avoid confusion.
2. Size: the size of the item (in bytes). For web pages, this is the total size of all items in the page.
3. Duration: the amount of time taken to load the item. For web pages, this is the total time taken to load
all items on the page. The format is MM:SS:mmm (minutes, seconds, milliseconds).
4. Goal: The performance goal configured for this item. Blank if no goal has been configured.
5. Think Time: The amount of time the Virtual User will pause between pages (to emulate the time the
user spend reading the page or entering data). Applies only to web pages.
6. Status: the HTTP code received in the response from the server.
7. URL: the URL of the item, preceded by an icon representing the type of item (e.g. text, graphics).
8. Type icon: An icon indicating the type of resource for this URL. There are icons for web pages ( ), text
files ( ), images ( ), forwards ( ) and errors ( ).
9. Performance Goal warnings: If a performance goal failed for an item in the testcase, a warning icon (
) is displayed at the beginning of the column. Placing the mouse over the icon shows the cause of the
performance warning.
10. SSL: displays a locked icon (
) if the transaction is with a secure site.
11. Replay list: displays the replays that have been performed for this testcase. See the Replay selection
section, below, for more details.
12. Testcase Size: Shows the total size of the testcase, in bytes. The tooltip shows the total number of
pages and transactions.
13. Testcase Total Page Duration: Shows the total amount of time take to load all pages in the testcase
during the recording.
14. Testcase Duration: Shows the total time in the recording, including page load time and think time.
15. Editor menu: the pull down menu at the upper right corner of the Testcase Editor panel can be used to
select comparisons, configure the testcase for replay, open the testcase report, and modify the visible
table columns.
Additionally, the think-time between web pages may be displayed. See the section on Changing the visible
columns for details.
Sorting
The Testcase Editor's table allows the user to sort the information in each column by either clicking on the
column header or selecting the sort button on the toolbar and choosing which column to sort. Clicking the
column header a second time or selecting the same column to sort reverses the sort direction. On the first
sort, the title and URL columns are sorted alphabetically, the status column is sorted lowest to highest, and
the duration and size columns are sorted highest to lowest. When a column is sorted, the transactions within
each page are also sorted according to the sort selection.
To return to the original view of the testcase, select the Restore recorded order selection at the end of the
menu.
Expanding and Collapsing Web Pages
All of the Web Pages in a Testcase can be expanded to show all Transactions in the Testcase Editor by
selecting the Expand button on the toolbar. The Web Pages in the Testcase Editor can be collapsed to
show only the main Web Page by selecting the Collapse button on the toolbar.
Changing the visible columns
The Testcase Editor's table allows you to specify the columns you wish to view. To change the visible columns:
Open the Testcase Editor's menu and
select the Properties item.
Editing Testcase Content
Note that any changes to the testcase may cause the automatic configurations applied by the ASM wizard to be invalid, causing errors during
replay. After any edits, run the ASM wizard to ensure a valid configuration.
Also note that any changes to the testcase could make it impossible for the
ASM wizard to correctly analyze the testcase, again resulting in replay errors.
The Testcase Editor is used to view details of the testcase and the replays of the testcase. The Web Pages
and HTTP transactions within the testcase can be moved, duplicated, or deleted using cut, copy, and paste.
Performing these actions changes the structure of the testcase. This can limit the ability to accurately compare the testcase to other replays that have not been modified in an identical fashion. The editor displays a
warning when performing an action that may invalidate comparisons. This warning can be suppressed by
selecting the Do not show this dialog again option. To restore the appearance dialogs that have been suppressed, turn off the applicable entry in the Dialogs preference page (Window > Preferences > Web Performance > Dialogs).
The Testcase Editor is also used to modify the think time between Web Page requests in the testcase.
Menus and Shortcuts
The cut, copy, paste, undo and redo actions are available in two menus. A right-click context menu is available inside the Testcase Editor's View. The actions are also useable from the Edit-> main menu. Standard
keyboard shortcuts are enabled for the actions, these are listed in the following sections. To view the keyboard shortcuts available for actions within the Testcase Editor, press Ctrl+Shift+L.
Cut
A Web Page or Transaction can be removed from the testcase using Cut. The keyboard shortcuts to cut an
item are Ctrl-X and Shift+Delete. The item that is cut can be pasted back into a testcase until another cut or
copy is performed.
Copy
A Web Page or Transaction can be duplicated in the testcase using Copy in conjunction with Paste. The
keyboard shortcuts to copy an item are Ctrl-C and Ctrl+Insert. The item that is copied can be pasted back
into a testcase until another copy or a cut is performed.
Paste
A Web Page or Transaction can be inserted into a testcase using the Paste action. The keyboard shortcuts
to paste an item are Ctrl-V and Shift+Insert. The item that is pasted into the testcase is added at the next logical location following the item currently selected in the testcase. For example, pasting a Web Page while a
transaction is selected adds the Web Page after the Web Page containing the selected transaction. It is possible to copy Web Pages and Transactions from one testcase to another by copying from the first testcase
and pasting into the second.
Undo
The cut, copy, and paste actions can be undone (up to a maximum of 10 actions per editor). The keyboard
shortcut to undo the last action is Ctrl-Z.
Redo
After an Undo is performed, the action can be redone using the Redo action. The keyboard shortcut to redo
the last undo is Ctrl-Y.
Modifying think time
To change the think time between web
pages, right click on the web page and
select the Properties... item.
The think time is modified by entering the
new value in the text field and pressing the
OK button. The timing change can also be
applied to all web pages within the testcase by checking the Apply change to all
web pages item.
Working with Replays
Replay selection
Replays are created using the play options available under the Recording menu. For more information on
creating replays, see the Replaying manual page. Note that any replay can be compared to any other replay
or the original recording. Although this section will only refer to replays, it always applies to the original
recording as well.
If the Testcase being displayed in the Testcase Editor has been replayed, the pull down menu at the top of
the Testcase Editor panel contains a list of the replays. Replays can be viewed by selecting the appropriate
entry from the list.
The replays associated with a Testcase can be deleted or renamed using the Edit Replays selection in the
replay menu at the top of the editor panel.
Renaming, Deleting and Promoting Replays
To open the Replay Editor, select the Edit replays... item from the Replay selection list.
Once the Replay Editing dialog is opened, one or more replays can be deleted by selecting the replay(s) to
delete and selecting the Delete button.
To rename a replay, select the entry in the list and modify the name in the text area below the list. When completed, select the Apply button to save the changes.
The Promote button will cause the selected replay to be promoted to the position of the original recording.
This will result in several changes to the structure of the testcase:
1. All user-defined actors from the original recording will be copied from the base testcase (original
recording) to the replay.
2. All replays, except the promoted replay, will be deleted.
3. The original recording will be deleted.
4. The promoted replay will become the base testcase and will, for all intents and purposes, become the
original recording.
5. Automatically-applied configurations will be cleared - replaying the testcase or using in a load test will
require completion of the Replay Configuration wizards (authentication, ASM, etc).
Comparing replays
The Testcase Editor can display the size and duration differences and changes in the Status between the
displayed content and either a replay or the original recording. When a comparison is performed, the item
being compared to the displayed content is shown at the top of the Testcase Editor panel to the right of the
displayed item. The comparison is opened using one of the following:
1. Press the pull down menu at the upper right corner of the Testcase Editor panel, select Compare to...,
then select a replay (shown below)
2. Press the Compare... button
on the main toolbar, then select a replay.
3. Select Edit->Compare to... on the main menu bar, then select a replay.
for example:
Examining the differences
After selecting a replay to compare against, the Testcase Editor will change to display the results of the comparison. For example:
In this example, the following items have been added:
1. The comparison target has changed to reflect which replay is being compared to.
2. A column is added after the Size column that reflects the change in the page size
3. A column is added after the Duration column that reflects the change in the page duration
4. Icons in the new columns indicate if the performance has improved ( ) or degraded ( ).
5. Tooltips over the +/- columns indicate the magnitude of the change and the relative change as a %.
6. The change for the entire testcase is also displayed
Regardless of which replay is chosen first, the data will be compare in chronological order. For example, if
the greater duration was encountered on the replay chosen via the Compare To... menu item, a duration
increase will be displayed. Note that the size and duration displayed always correspond to the recording/replay selected in the dropdown list.
A change in the Status is indicated by a blue triangle icon. For more information about the change, placing
the mouse over the icon in the table displays the full details for the comparison.
Viewing percentages
The size and duration differences are displayed as the numerical difference between the two values. The differences may also be displayed as a percentage difference. To view the difference as a percentage, there
are three options:
l
Press the pull down menu at the upper right corner of the Testcase Editor panel, select Compare to...,
then select Show changes as %.
Press the percentage button on the main toolbar.
Select Edit->Toggle percent view on the main menu.
Note: once the Testcase has this setting modified, it will be remembered whenever this Testcase is opened.
l
l
for example:
Changing the % default
If preferred, the size and duration differences may be displayed as a percentage as the default setting.
To change the default setting to shows differences as a percentage, select the Window->Preferences option
on the main menu. Select the Web Performance->Testcase Editor item. Select the checkbox next to Display
comparisons as percentage to set the application to show percentages as the default. Clear the checkbox to
have the application show the numerical differences as the default.
Note: Testcases that have been opened before will remember their difference setting and will override the
default setting.
Cancel the comparison
To cancel the comparison, use one of the following:
Select Compare to... item from the Testcase Editor menu, then select Cancel comparison.
l Press the revert comparison button on the main toolbar.
l Select Edit->Compare to...->Cancel comparison on the main menu.
for example:
l
Importing Transactions
Occassionally, there may be a scenario where the normal process of recording a transaction is not appropriate. This sort of case could arise when attempting to test a Web Service, with a client does not support
manual configuration of it's proxy servers. In this event, individual transactions may be created and imported
into Web Performance Load Tester in order to create the desired testcase.
In order to import a transaction, a valid HTTP request and response pair will need to be created. This may
be accomplished either through a network diagnostic utility, or another application capable of creating the
exact transaction content given the testing environment. The file format should be a plain text file, containing
the raw HTTP message, without any further information.
If the imported transactions are intended to be imported into a new
testcase, then you may right-click on the "Testcases" node of an open repository, and select "Create Empty
Testcase…".
With a Testcase Editor open, you may right-click on any
Web Page within the editor and select Import » Into Existing Web Page…, or right-click anywhere in the
editor and select Import » As New Web Page… to create a new Web Page for your transaction.
With the Import Transaction dialog open, simply select the locations of the appropriate request and response
files, and then press "OK". The transactions will then imported into Web Performance Load Tester, for use
during Replays and Load Testing.
Exporting Messages
Web Performance Load Tester is fully capable of also exporting raw transaction data from a Testcase
Recording or Replay. To do this, simply open the recording or replay in a Testcase Editor, and select the
transaction you would like to export data from.
Right
click on the transaction, and select "Export". You may export either the request or the response to a single
file. From there, simply select the location and name for the file, and press "OK". A new file will be created
with the complete message saved.
Dataset Editor
Dataset Configuration
Lifespan
The lifespan of the dataset defines how long the Virtual User will use values from the same row before fetching the next row of values. Note that if a testcase does not use any values from a dataset, no rows will ever
be used.
l Virtual User - No matter how many times the testcase is executed, only one row from the dataset will
be used.
l Testcase - A single row of values will be used for the duration of each testcase.
l Web Page - Each web page that uses values from the dataset will use a different row.
l URL - Each transaction (URL) that uses values from the dataset will use a different row.
l Single Use - Every time a dataset value is used, a different row will be used.
Some examples of the correct settings are described below. Virtual user, testcase and web page are the
most commonly used settings. The lifespan settings that are not mentioned are rarely used. If you are not
sure why you would need it, then you probably don't.
Examples
User Identity
For a dataset containing usernames and passwords, the lifespan should usually be configured as testcase.
If each virtual user should repeat the testcase using the same identity each time, the lifespan should be set
to virtual user. Any other lifespan setting will probably be inappropriate for user identity datasets.
Form fields
For a dataset containing values that a user will enter into fields on a web page form, the lifespan should
could be set to either testcase or web page. If the dataset contains values for more than one page, it should
be set to testcase.
Reusable
If enabled, this setting will allow a Virtual User to start over at the beginning of the dataset when all the rows
have been used. This could mean that a row is used more than once.
Note that if a dataset is not reusable, the load test will encounter errors and terminate when all the rows
have been used.
Sharable
If enabled, this setting would allow multiple Virtual Users to simultaneously use the same row from a Dataset. If a dataset is not reusable, it cannot be sharable.
Note that if a dataset is not sharable, the dataset must have more rows than the number of Virtual Users in
the load test.
Editing a dataset
To edit an entry in a dataset, double-click the cell and start typing. Press <ESC> to cancel the changes and
<RETURN> to move to the next cell.
To add new rows, edit the last cell and press <RETURN>. A new row will be created with sample data - continue filling in new rows by typing new entries and pressing the <RETURN> key. Press the <TAB> key to finish editing the last new entry.
Reloading a dataset
There are two options for reloading a dataset from an external file: automatic and manual.
The Reload button will attempt to automatically re-import a dataset using the settings that were originally
used to import the dataset the first time. If an error occurs, or the dataset was not originally imported, then the
manual method must be used.
The manual reload button (...) beside the Reload button will open the dataset import dialog. If the dataset
was originally imported from a file, those settings will be preset in the dialog. If not, the dialog will have the
settings last used to import a dataset.
Editing dataset fields
The Edit Fields... button will open the Edit Dataset Fields dialog, which is similar to the New Dataset dialog
shown in the Datasets section.
This allows the creation or removal of fields in the dataset. A field may be effectively moved by deleting it
and adding a new field at the end with the same name.
Filling fields with generated data
The Fill... button allows the selected field to be filled with generated values. Select the field to be filled by
pressing the field name (column heading) in the table. Then press the Fill... button to open the Fill Dataset
Field dialog:
The Method field allows selection from three generation types:
1. Random - generate random alphabetic or numeric strings
2. Sequence - generate sequences of numeric strings
3. List - select strings from pre-populated lists
Note that the Quantity field will be automatically set to the total number of rows in the dataset. The Width
field defines how long each generated value will be. The Data Type chooses between alpha and numeric
data. A preview of the data is available in the list at the right after pressing the Generate Values button. After
generating values, pressing the OK button will save the values into the dataset.
Load Configuration Editor
The Load Test Configuration Editor is used to configure a load test. A new load test configuration is created
by right-clicking on an existing load test or the Load Test folder in the Navigator View and selecting the New
Load Test Configuration item. A new load test configuration initially displays the last used configuration or
the application defaults if no load tests have been configured. To open the Load Test Configuration Editor
for an existing load test configuration from the Navigator View, you may either double-click the configuration
or right-click on the configuration and select the Edit item.
Configuring a Load Test
The Load Test Configuration Editor contains three major configuration sections: Test Duration, Virtual
Users, and Testcases. While changing the configuration, if any fields contain invalid entries or any
configuration errors are detected, a message is displayed immediately (shown below in red).
Test Duration
The load test duration
can be in units of hours or minutes. The duration of the test should change depending on your testing goals. If you are just trying to get an idea of the speed of certain operations on your site,
useful performance information can be gained for tests that are a few minutes long. You can then tweak
parameters in scripts or machine configuration and see if it has an effect on performance. If, however, you
are trying to stress your web site to see if anything breaks, you will want to run the test over a longer period
of time.
Alternatively, the "Run maximum repeats" option will allow the test to run for as long as necessary for each
testcase to be repeated as many times as specified in the testcase's "Repeats" column. This allows for each
testcase to run a predetermined number of times, stopping the load test upon completion.
The sample period
is the length of time over which metrics will be sampled before saving the values.
This value should be shorter for short tests, and longer for long tests. For example, if your test only lasts an
hour, then having samples every 10 seconds makes sense. If, though, your test is intended to run overnight,
then the sample period should be much longer, in the area of 5 minutes. This helps make the data easier to
interpret. When running extended tests, large amounts of data are collected - which could cause the program to run out of memory and halt the test prematurely. As a rule of thumb: when running a test for multiple
hours, you should have sample periods that are on the order of minutes, while short tests can handle sample
periods as small as 5 seconds.
Virtual Users
The Load Test Configuration Editor allows you to specify the number of virtual users to simulate at the start
of the test
, and to optionally specify how many virtual users to periodically add to the test
. You may
also (optionally) limit the total number of virtual users
. It is best to start with a low number of users and
verify the correct operation of your server before performing more complicated tests. Also note that the
number of virtual users you can simulate is limited by the speed and memory of the load machine, so that
the actual number of virtual users generated can be lower than the value in the estimated field
.
Testcases
Testcases are added to the load test using the pull-down menu
located above the table listing all testcases in the load test. Select the desired testcase from the menu and click the '+' button to add the testcase
to the load test. To remove a testcase from the load test, select the testcase in the table and click the '-' button.
Once a testcase has been added to the load test, the testcase can be configured by double clicking the
appropriate entry in the table. The settings that can be modified are:
l
l
l
Weight: Determines the number of users allocated to this testcase during the load test. For example, if
you have two business cases set to 2 each, and the performance test starts out with 10 virtual users, 5
users will be assigned to each of the testcases. As the number of virtual users increases, they will be
assigned to the testcases according to the percentages, keeping the correct ratio.
Speed: Used to simulate the browser connecting to the web server over different types of network connections, from a 9.6kbps modem to a 100Mbps LAN. The parameters are in bits per second (and they
include the two stop bits required for Modem communications).
This setting limits the amount of data the simulated user can read or write to or from the server. The
result is a more accurate simulation of expected server load. Accurate simulation of network speed for
each user also results in a more accurate simulation of resource usage on the server - especially open
network connections. For example, if your application generates a 40K graph, the browser might
spend a fraction of a second to read the graph when connecting via a LAN, but could take up to 13 seconds when the browser is connecting over a modem. Having the socket open for 13 seconds instead
of a fraction of a section puts a greater burden on the server - and can significantly influence the resulting performance measurements.
Think Time: There are two choices for this option, none and recorded. When none is chosen, the web
pages in testcases are played back in sequence without waiting between pages. When recorded is
chosen, the web pages are played back at the rate at which they were recorded. For example, if the
user paused for 30 seconds between pages while recording the original testcase, the virtual user will
pause at the same place for 30 seconds before replaying the next web page.
l
l
l
l
VU Start: There are two choices for this option, random and immediate. When random is selected, virtual users do not start playing back at the same time. Instead, they are distributed over a one minute
period. This option simulates a more realistic scenario - in which users start the visit to the web site in
irregular intervals. When immediate is selected, all of the virtual users (for each incremental period)
start simultaneously.
Delay: A virtual user is assigned to play back a single testcase repeatedly. The delay setting is the
number of seconds to delay between repeats.
Host: All of the URLs contained in the testcase can be modified at runtime to a different host. This enables you to run the recorded testcases against different hosts without re-recording them. If you have a
testcase that contains multiple hosts, you should use the Headers View to change hosts (because this
option redirects all requests within the testcase.)
If the application runs on a non-standard port, the port must be specified as well - use the syntax
host:port. Example: 192.168.1.103:81. Standard ports are 80 for HTTP and 443 for HTTPS.
Repeats: When the "Test Duration" section is set to "Run maximum repeats", this column specifies the
number of times a testcase should be attempted.
Limits
By default the starting number of virtual users is 50, and the maximum number of users to add is 50. When
running larger number of virtual users generated by multiple computers these values may be low. In that
case, edit the configuration file system.properties and modify the parameters MaximumStartUsers and MaximumIncrementUsers.
Running the Load Test
The load test cannot be run until the application detects there are no invalid entries or configuration errors.
Once the load test configuration is valid, the Run button on the Load Test Configuration Editor is enabled.
Selecting this button begins running the load test and opens the Load Test Results View.
Status View
The Status View provides detailed information about certain long-running operations, such as Replaying a
testcase. When no operation is in progress, it shows the current memory usage.
Memory status
In default mode, the memory status is displayed. The numbers displayed reflect the heap memory usage which is the space the program has available for creating and manipulating data. It does not include the
memory consumed by the application code.
The
button in the corner runs the garbage collector to recycle memory that is no longer being used. Note
that you are never required to push this button manually - the garbage collector automatically runs when
needed. But some people really like pushing buttons, so we added one!
Record status
While recording, the Status View displays the current state of the recording:
1. number of pages recorded
2. number of URLs recorded
3. total open connections to the server
4. elapsed duration of the recording session
5. total bytes transferred (requests and responses, including HTTP headers)
6. number of network and HTTP errors encountered
7. sending status: active while a request is in progress
8. receiving status: active while a response is in progress
Shortly after a recording ends, the Status View will automatically return to displaying the memory status.
Replay status
During a replay, the Status View displays the current state of the replay:
1. replay status (playing, paused, thinking, stopped)
2. time (total replay time or remaining think time)
3. number of pages completed
4. number of URLs completed
Shortly after a replay ends, the Status View will automatically return to displaying the memory status.
File opening status
While repository files are opening, the Status View will display the progress of the operation:
l number of files completed
l bytes read from the current file
Shortly after the files have been read, the Status View will automatically return to displaying the memory
status.
Load test status
During a load test, the status view will show the progress of the current test stage. The following pictures
show examples of the starting, testing and stopping stages.
Changing the display
The Status View will typically select the best mode for displaying information relevant to the current operation. The mode may be manually selected using the drop-down menu at the top of the view..
Load Test Results View
This view is activated when a load test is started to allow monitoring of the progress of the test while it is running. After the test is completed, the same view provides a summary of the most frequently used test parameters.
Elapsed time
While a test is running, this indicates the time elapsed since the test was started. If the test has completed, it
indicates the total duration of the test.
Estimated Duration
This indicates the estimated duration of the test, based on the test configuration.
Report...
Opens the Load Test Report.
The remainder of the view displays numerical and graphical displays of 6 key performance metrics. During a
test, these metrics will be updated periodically. After a test has completed, the charts will show the results for
the entire test while the numbers will reflect the last sample collected.
Display Properties
Opens the properties editor for configuring the display preferences. Use this to change the number of charts
displayed in the display.
Chart Properties
Opens the properties editor for configuring the chart preferences. Use this to change the data displayed in
the chart.
Chart Maximize
Maximize the selected chart.
Headers View
The Headers View displays HTTP start-line and headers for the request and response of the item currently
selected in the Testcase Editor. The Headers View is opened by selecting Window->Show View->Headers
from the main menu.
The title of the item being displayed is shown in the upper left portion of the Headers View. If any modifiers
are present on the HTTP Request header fields, the icon for the field in the Modifier column is active.
1.
2.
3.
4.
request-line and corresponding Edit button
header name
modifier column - an icon here indicates the header has a modifier configured
header value
Editing the request-line (including URL parameters and path segments)
Pressing the Edit button (1) will open the Edit HTTP Request-line/URL dialog below, which allows editing of
the entire request-line, including the URL path and query parameters.
1. HTTP method - GET and POST are most
commonly used. Be very careful when changing the method - changes might cause errors
when replaying the testcase.
2. HTTP Version
3. Entire URL path and query - Changes here
will be reflected in the tables below immediately.
4. URL path elements - Each path element can
be changed or configured with a modifier by
selecting the element and using the fields at
the bottom of the dialog.
5. Query parameters - Each parameter can be
changed or configured with a modifier by
selecting the element and using the fields
below. To rename a parameter, use the raw
Path and Query field, above.
6. Constant - Change the constant value for the
selected item.
7. Dataset value - Select a dataset and field for
modification during a replay. A value from the
dataset and field will be substituted for the
existing value during the reply.
8. User variable - Similar to the Dataset value,
above. The named value is extracted from the
Virtual User's local variable store. This feature is still under development.
Editing Header Values
Any of the Request or Response header values can be changed by double-clicking in the Value column and
typing the new value. Request headers may also be edited using the modifier configuration (below).
Configuring Modifiers on Headers
Modifiers can be added, changed, or removed from HTTP request headers using the Edit HTTP header
dialog, which is opened by double-clicking on the modifier icon. This dialog is similar to the Edit HTTP
Request-line/URL dialog above - see the description for fields 6-8.
Editing Status-line
The status-line in the HTTP response may also be edited by clicking the Edit button:
Content View
The Content View shows the content (body) of each HTTP message for the selected web page or URL. It
has two sub-viewers for the request and response content. Each viewer has tabs for displaying different
types of content. By default, they will automatically select the best viewer for the content type.
1. Content viewer mode selection buttons - these buttons control the visibility of the request content and
response content viewers.
2. Title - shows the title of the selected web page or transaction
3. Find - performs a search within one of the "Text" tabs
4. Content viewer lock - selecting this option disables the content type auto-selection mechanism. This
allows the user to manually select which viewer to use for the selected content.
5. Hex mode - this button controls the formatting of content in the Raw content viewer. By default, it will
display in hex dump format. The alternate is to dump the content as text formatted in the local character
set.
6. Export buttons - these buttons can be used for export the request or response content.
7. Request viewer - displays the request content formatted for the selected content-type tab.
8. Response viewer - displays the response content formatted for the selected content-type tab
HTML/XML viewer
The HTML/XML viewers display the content in an embedded browser that renders the selected page from
memory, including all images, style sheets, etc from the recording.
In addition, the HTML tab of the Content View can be used to configure submitted form fields. When examining a form, simply click on the form field that should be parameterized for each Virtual User.
Here, the user has clicked on the "Country" field. The Content View will automatically search within the
recorded testcase to find where the field was submitted, and allow the field to be parameterized for future
replays and load tests.
For configuration options configuring the HTML/XML tab of the Content View, see Interactive Content View
Preferences.
Text viewer
The Text tab displays other text resources (javascript, style sheets, etc) and the source HTML for a web
page. If the response had either a Transfer-Encoding or Content-Encoding scheme applied (e.g. gzip,
deflate), the text is decoded as needed.
Image viewer
The image viewer displays common image formats, including PNG, GIF, JPEG, and BMP (on Windows).
Raw viewer
The Raw tab displays the content exactly as it was received from the server. By default, the raw content is
displayed in hex dump format:
Alternatively, the content may be displayed as text rendered from the default character set. To view this, deselect the Hex Mode button.
Exporting Content
The content may be exported using the Export buttons in the upper right corner of the view (see #6 in 1st
screenshot).
Note that the content exported will be in the same format as the active view. For example, exporting a web
page that was gzipped when sent by the server will export as the uncompressed HTML from the text view.
When the raw view is active, the exported content would be in hex dump format if the Hex View was active
or the raw compressed bytes if Hex View was not active. When the HTML/XML view is active, the page can
be saved as plain HTML with links resolved to absolute form, to a directory with HTML and images, or to a
single MHT (Web Archive) file.
Errors View
The Errors View displays errors found in the item selected in the Navigator or Editor. Errors can be obtained
from testcases, testcase replays and load test results.
Opening the Errors View
The Errors View is opened from the menu Window->Show View->Errors.
Viewing Errors
All errors for a testcase are shown in the Errors View when any of the following items are selected:
l Testcase in the Navigator
l a Testcase Editor tab
l Web Page or URL in the Testcase Editor
All errors for a testcase replay are shown in the Errors View when any of the following items are selected:
l a Testcase Editor tab, when the replay is displayed
l Web Page or URL in the Testcase Editor when the replay is displayed
All errors for a load test are shown in the Errors View when any of the following items are selected:
l Load test results in the Navigator
l a Loadtest Results Editor tab
Go to the URL for the error
To locate the URL responsible for an error, select the error in the Errors View and press the Display in Editor
button. For testcase errors, the corresponding URL is selected in the Testcase Editor. For loadtest errors, an
icon is present in the description field if the data associated with the error was recorded, and selecting the
button opens the Testcase Editor containing the URL with the error and the URL corresponding to the error
is selected.
Filtering errors
When there are many errors in a Testcase, it can be helpful to only view the errors for the selected web
page. This option can be enabled from the Filter By Page item in the Errors View menu, and is only available for testcase and replay errors. When activated, this causes the Errors View to only show errors from the
selected web page (or the page corresponding to the selected URL).
Viewing the Transaction Title and URL
The final column in the table contains the URL the error occurred at and placing the mouse over the text in
that column displays the transaction title for that URL. The table can be modified to display the transaction
title and show the URL for mouse over by selecting the Show URL or Show Transaction Title item in the
Errors View menu.
Replay errors
When a replay is selected, the view changes slightly to show errors encountered during the replay. During a
replay, if the Errors View and Testcase Editors are active, it is dynamically updated as each page completes
(except in fast-replay mode - then it is updated when the replay finishes).
Loadtest errors
When a loadtest is running, the errors view is continually updated with any errors that occur during
execution of the test. If the data associated with the error was recorded, an icon is present in the description
field. Presence of the icon indicates that it is possible to go directly to the Testcase Editor to view the URL
corresponding to the error by selecting error in the table, then selecting the Display in Editor button.
Replay View
The replay view allows you to monitor the status of a replay as it is performed. To open the replay view,
select the Window->Show View->Replay selection from the main menu.
For details on performing replays, see the Replaying manual page.
note: By default, the Replay View is placed in the same window pane as the Content View. In order to see
the pages as they complete and view the replay status information at the same time, it may be useful to
move the Replay View to another window pane (see the Navigating the UI section for details).
Replay View Fields
1. name of the replay.
2. current activity: paused, stopped, playing, or thinking
3. title and URL of the current page
4. running time of the total replay duration (including think time)
5. total number of errors encountered during the replay
6. number of the current page and the total number of pages in the testcase
7. number of the current URL (on the page) and the total number of URLs in the current page
8. additional info, depending on the selected tab
Connections tab
This table shows details about each connection established during the replay.
1. Connection number (starting at 0)
2. host name
3. connection state
4. number of transactions performed on the connection
5. current URL being processed
Datasets tab
This shows each of the dataset rows that is currently in use by the Virtual User (VU) during the replay.
In the above example, the Virtual User is using one dataset - Users. The dataset has two fields, password
and username, and the currently selected row has values "123" and "dave" for those fields.
Menu actions
These actions are available from the Replay View menu:
Remember dataset position
When a VU replays a testcase and it has modifiers configured to pull values from a dataset, the position of
the row in the dataset is automatically advanced when the row is returned. This allows a testcase to be
replayed multiple times with different data. This setting is on by default. Turning it off will cause the VU to
start at the beginning of each dataset when the replay begins.
Reset dataset state
This action forces the VU to reset the next position of each dataset to the beginning. Rows currently in use
are not affected.
Fields View
The Fields View displays the form fields, URL query parameters, multipart content, and file uploads (from
form fields) found in the item selected in the Navigator or Testcase Editor. The Fields View can be opened
from the menu Window->Show View->Fields.
1. Name of the field
2. Type - URL query parameter (query), form field (field), POST content (post), multipart (part), or form
field file upload (file). On parent nodes with more than one type of child, mixed will be displayed
3. Number of usages - how many times is this field used
4. Modifier applied? - if a modifier is applied to dynamically change this value during a replay, an icon is
shown here. On parent nodes with children that both have and have no modifier applied, a grey version of the icon is displayed. Double-clicking this column invokes the Field Editor Dialog - the value
can be changed and/or a modifier configured for this field.
5. Values of the field - If a field has multiple values, they are displayed separated by commas (,) and the
tooltip will show multiple lines with one value per line. Note that only unique values are displayed (i.e.
multiples of the same value are only displayed once).
6. Title / URL - Displays the title of the transaction this field is used on, with the URL in a tooltip. This may
be reversed (show URL with title in tooltip) via the view menu (see Show URL, below).
7. Go to transaction button - when a field is selected in the table, press this button to show the related
transaction in the testcase editor.
8. Edit button - use this button when one or more fields are selected to invoke the Field Editor Dialog.
Scope of fields displayed
The fields displayed depends on the item selected:
l All fields in the testcase are displayed if a Testcase is selected (in the Navigator or a Testcase Editor
is selected but nothing is selected within the editor)
l The fields for all transactions in the page are displayed when a Web Page is selected in a Testcase
Editor
l The fields for a single transaction are displayed when a single Transaction is selected in a Testcase
Editor
Go to Transaction
To locate the Transaction containing a field, select the field in the Fields View and press the Display in
Editor button. The corresponding Transaction is then selected in the Testcase Editor.
Editing fields
To change the constant value or configure modifiers on fields, the Field Edit Dialog can be opened by either:
l
l
single field: double clicking on the Modifier column in the Fields View
multiple fields: selecting the fields in the table and pressing the Edit button on the upper right portion of
the Fields View
If multiple fields are selected, they will all be changed by this dialog. If they have different settings when the
dialog is opened, the Constant/Dataset/User buttons will be initially de-selected - one must be chosen
before editing can take place.
For more information on using modifiers to customize a testcase, see the Customizing a Testcase section.
Show URL
Selecting the Show URL option from the Fields View menu will toggle the display of titles / URLs in the last
column of the Fields View. When the URL is being displayed, the hover text for the entries in the URL column displays the transaction title. To revert to viewing the transaction titles in the table, select the Show
Transaction Title option from the Fields View menu.
Actors View
The Actors View displays the list of actors that both control and respond to the content of your testcase during a replay or a load test. The Actors View is opened by selecting Window → Show View → Actors from
the main menu.
At the bottom of the Actors View, there are tabs that filter out what type of actor the view is currently working
with:
l Modifiers
l Validators
l Extractors
l Processors
The top right of the Actors view additionally displays three buttons that may be used to control various
Actors:
1. Edit: After selecting an actor, this button will bring up a dialog where the behavior of that actor may be
edited. This function is usually only available for actors created within the Actors View via the Add button.
2.
Add: This button allows you to create a new actor. The type of actor
created is determined by which tab of the actors view is currently selected. A drop-down arrow next to
the button may be pressed to display a list of supported sub-types of actors that may be created.
3. Remove: Removes the selected actor(s).
Modifiers
Modifiers may change values submitted to the server from those that were submitted when the testcase was
initially recorded.
The Actors View provides a centralized display for reviewing (and if necessary, removing) modifiers that are
currently in place in your testcase. To create or revise modifiers, you should use a component of Web Performance Load Tester™ relevant to the type of value being modified. For more information, please consult
the Customizing a Testcase section.
Validators
Validators are used during a replay or load test to examine a received response, and determine if that
response was valid or not.
In addition to reviewing validators created automatically by various components of Web Performance Load
Tester™, validators may be created by pressing the Add Button of the Actors View. Presently, there are two
criteria that a new validator may use (listed from the drop-down menu, located next to the Add button): Content, and Size.
Content validation
Using content validation, a search string may be entered. When the response is processed, the page will be
deemed valid based on whether or not the response content contained the search string. This style of validation is selected by default when pressing the Add button, but may also be accessed through the dropdown menu by selecting "Validate text in content...".
The first option on this
screen is concerned with whether or not to flag an error when the search string is located. The option "Verify
content is not found" is appropriate when entering an error message. When entering a string of text that is
unique to this particular page, the option "Verify content is found" is appropriate.
The next section determines what this validator will search the response for. Here, a search string may be
entered into the "Constant" field. If it is more appropriate to vary the string being searched for, then it is possible to select the appropriate radio button to obtain this value from the current row of a dataset, or from a
user variable.
Finally, the "Response Content" displays the content of the current response for reference. When a "Constant" search string has been entered and located, it is possible to scroll to that point by clicking on the highlighted block that appears next to the content display.
Tip: It is not necessary to tab back and forth between the Content View and the Actors View. Either view
may be displayed side-by-side with the other by dragging the top tab of the view to the edge of the other
view. This makes it easy to Copy text from the Content View, press the "Add" button of the Actors View, and
Paste the text into the "Constant" field to validate on.
Size validation
It is possible to also validate that the size of a response remains within reasonable bounds by using size validation. This style of validation may be used by selecting "Validate content length..." from the drop-down
menu next to the Add button.
Using this validator, it is possible to verify the size of the response. Simply check the appropriate options,
and enter the corresponding size constraints (measured in bytes). Use "Is no smaller than" to specify a minimum allowable size, and/or "Is no larger than" for a maximum allowable size; or select "Is equal to" to specify a single exact value.
Note: Due to a server's ability to vary the transmitted size of a response (for example: by altering compression scheme or transfer encoding), this option may not be available for some responses.
Extractors
Extractors are able to examine a response and extract information that can be re-used later by a Modifier.
String-delimited Extractors
The Actors View allows you create and edit simple extractors capable of extracting a value into a User Variable. Since the value will likely be changing, an extractor may be specified by using a pair of delimiting
anchors to denote the beginning and end of the value to be extracted.
The first section of this dialog allows the prefix and suffix anchors to be entered. The extractor will search for
these anchors in the response received during playback, and extract the value located between them. The
"Instance number to extract from" can be increased if the extractor should skip and ignore initial occurrences
of the prefix anchor.
Next, the extractor needs to know the name of a user variable to extract the value into. The name of the user
variable is used to identify the value in the user state - such as in a modifier that needs the extracted value
later in the testcase. Please note that variable names starting with a non-alphanumeric character (e.g. '#')
are reserved for use by Web Performance Load Tester™ and may be overwritten by the software as needed.
The field "Assume extracted value is never URL Encoded" controls the context of the extracted value, and
how encoding is performed when a modifier re-submits this value. This capability is available for advanced
users, the default value (unselected) will suffice for most normal cases. If the extracted value appears URL
Encoded, and can potentially contain the characters "+" and/or "%", but no other characters that would be
encoded by a URL Encode process, then this field may be checked to indicate that those characters must
be encoded ("%2B" and "%25", respectively) when the extracted value is re-transferred back up to the HTTP
server.
Finally, the bottom section of this dialog shows the response that was received when this testcase was
recorded. Additionally, a sample value is displayed of what would be extracted, if this extractor processed a
response from the server identical to the response being displayed.
Regular Expression Extractors
For more flexible searches, choose the Regular Expression option in the Extractor type section. Configuration of this extractor is very similar to the String-delimited extractor. The primary difference is that
instead of supplying prefix and suffix strings, a single regular expression is supplied.
Using Multiple match groups
More advanced regular expressions that contain multiple match groups may also be used. In the example
below, two match groups are specified in the regular expression and two variable names are provided in the
user variable field. Note that when multiple match groups are used, the user variable names may not contain
spaces.
Processors
Processors are further processing steps which are performed after a transaction is completed.
Page Refresh Processors
Some pages use refresh controls to force a user's web browser to refresh a page periodically. For example,
progress bars may use a refresh command within the page to simulate a browser polling a URL until the
process completes and a page is returned without the refresh command. A Page Refresh Processor may be
used to extract the duration that a browser should wait until re-requesting the same page.
To use a page refresh processor, first locate a sequence of the same URL, and select the last URL which no
longer contains the refresh command, breaking the loop. Examine the previous pages, and determine how
the server specifies the frequency at which the URL should be polled. For example, the HTML fragment:
<META HTTP-EQUIV="REFRESH" CONTENT="1"/>
may be included by the server to indicate that the page should be refreshed in 1 second.
The page refresh processor uses an extractor to extract the duration the user should wait before refreshing
the page. If no refresh is specified, the loop is considered complete, and the user will continue on through
the next page. If a refresh is found, the user will wait for amount of time instructed, and then refresh the page.
The extractor is configured in the same way as other extractors, except that the result must be the refresh
delay, instead of an arbitrary string to be used by other modifiers. The Virtual User will perform a loop on the
page as long as refresh delays are located in the returned page content.
When a page refresh is detected, the behavior of the refresh may be customized by using the remaining
options:
Extracted value is measured in: configures in which unit the numerical delay should be interpreted
when using a custom extractor.
l Continue downloading resources during refresh delay: if this option is enabled, the virtual user will continue to download remaining transactions in the page (such as images) even after a page refresh has
been requested.
l Reload completed resources on each refresh: if this option is enabled, when virtual user refreshes the
page, all previously downloaded resources on that page will be re-downloaded. Additionally, any
active and incomplete resources will be cancelled when after the page delay expires and the page
must be reloaded.
The default extractor used by the page refresh processor looks for META tags in the format above. If the
URL returns refresh directives in a different format, then the "Use custom refresh time extractor" may be used
to customize the extractor, and allow it to correctly extract the page refresh time.
Once the page refresh processor has been created on the last page in the URL chain, the prior URLs in the
chain will need to be removed. Since the processor will loop over the transaction it has been configured on,
immediately preceding transactions with the same URL (those which contain the refresh directive), will now
be processed by the page refresh processor loop, and those preceding transactions should be removed
from the testcase.
l
Search View
The Search View searches a testcase (or web page or transaction) for a text string. The Headers View is
opened by selecting Window->Show View->Search from the main menu.
In the example below, the results are shown for a search of all parts of web page "Issue Tracker - Issues[1]"
for the text string "as".
1. The title of the item to search (selected in Navigator View or Testcase Editor)
2. Which parts of the item to search
3. The text to search for
4. The search results
Note that all searches are case-sensitive.
Search Parts
The search can be narrowed to certain parts of the transactions, such as URLs or form fields.
Note that some of the parts are overlapping. For example, query parameter fields are part of the URL. Therefore, when searching everything, a match found in a query parameter field will be duplicated by a match in
the URL.
Event Log
The Event Log view provides a detailed log of connection and transaction events during a testcase replay.
The view can be opened from menu by choosing Window->Show View->Other->Web Performance and
selecting the Event Log.
In order to activate the replay logging feature, the view must be activated before starting the replay. This
means that it must have been opened at some point prior to starting the replay (it does not need to be visible
at that time the replay starts). After the replay is complete, the log may be viewed at any future time by selecting the Event Log view and then selecting the replay in the testcase editor.
The log may be exported by clicking in the log area, copying the content (using Ctrl-A (select all) and Ctrl-C
(copy)) and then pasting the log into the desired application.
Servers View
For more information about server monitoring, see the Introduction to Server Monitoring page.
The Web Performance line of products are capable of monitoring two important metrics on your server(s):
CPU utilization (%) and memory usage (%). You may make the appropriate configurations to configure these
metrics through the Servers View.
When you open the Servers View, you will be presented with a list of servers which are presently configured
for monitoring. The graph on the right side of the view displays information being actively observed from
your server. The check box next to the host name may be used to toggle whether or not the particular server
is being actively monitored.
To start monitoring a new server, you may need to first add the server to the view, depending on the type of
server monitoring you are using. See the Basic Server Monitoring and Advanced Server Monitoring pages
for more information. To monitor a server during a load test, be sure the server is selected (via the checkboxes in the view) before starting the load test.
The following options may be used to manage the Server Monitoring configuration.
l Add - Start monitoring a new server, as described on the Basic Server Monitoring page.
l Remove - Stop and remove the highlighted monitor(s)
Additionally, the following controls may be used to configure Server Monitoring Agents.
l Upgrade - Upgrades the remote Server Monitor Agent to the same version being used by the controller. This operation will require that the agent application be quit and re-opened on the controller
before the upgrade can take full effect.
l Licensing - Manage the licenses installed on the remote Server Monitor Agent.
Viewing Previous Results
The Servers View can also be used to display server metrics for a given series of load test results. In order
to do this, simply uncheck the option to Show live metrics, and open a set of results. The view will update to
display previously gathered information from the selected test. In order to switch back to the active configuration, simply re-check the Show live metrics option.
Engines View
The Engines View provides configuration options for each engine that will be used during a load test. In
order to connect to a load engine, you will need a test computer with the load engine software installed. For
more information, please consult the Load Engines section.
For active engines ready to or actively participating in a load test, the following information is displayed:
Name
The name of the computer that the engines is running on. If the value is local, this indicates the load
engine embedded in the controller (running on the current computer) is being used. This is not recommended if remote load engines are also being used.
Status
Indicates the state of the load engine. Possible values are "Offline", "Idle", "Running", "Initializing",
and "Stopping."
Color
The color used to represent this engine in the graphs on the right side of the view.
Active Users
The number of virtual users actually running.
Estimated Users
The total number of virtual users that it appears the machine could generate. Note that the estimated
number usually is inaccurate at lower load averages, so that your computer very well may be able to
generate a larger number of virtual users. This is because at low load averages the estimation is not
as accurate as at a high load average. Also, the response of many computers is nonlinear, so that the
load average could hover at 20%, for example, and stay there while the number of virtual users climbs.
% CPU
The CPU utilization of the engine's computer, where 100% has all of the machine cycles being used.
Note that on UNIX this value is greatly affected by background processes that are blocked, so even
though a process isn't taking up any CPU time, if it is stuck in a disk wait or otherwise hung your load
average will be higher. Use "ps", "top" or other programs to find and stop background processes that
may be increasing the system load so that the full power of the computer is available for the performance test. Note that there is lag in getting the information from the operating system, so the value
will not be exactly the same as the value displayed by other utilities.
% Memory
This measures how much of the memory allocated for internal buffers is actually in use. This number
has no relation to any operating system specific information you might view using an OS utility such as
Windows Task Manager. This value will go up and down during the performance test and could occasionally reach the low or out of memory values. It will slowly creep up towards the 80% mark when
using large numbers of virtual users or when running the performance test for a long period of time.
When the program absolutely has run out of memory you will see this value quickly climb into the 90%
range every 30 seconds or so. When this happens, no more users will be added to the engine to prevent the program from running out of all memory and causing corrupt test results.
Version
The current version of the Load Engine software running on the engine.
Adding Engines
Many times, load engines are automatically detected and displayed in this view when the application is
started, or when the load engine software is started. However, in some circumstances the engine may not be
added automatically, and you will want to explicitly connect to an engine. Alternatively, you may want the
local engine to also participate in the load test, in addition to it's role of collecting metrics and distributing
users. For either of these options you may select the Add Engine button.
In the Add Engine dialog, you may select to add the local engine (only if it is not already selected as an
engine), or select a remote engine. For remote engines, you may enter either the host name or the IP
address for the engine. The port number used for engine communication defaults to 1099, and should only
be changed if the remote engine has been explicitly configured to use another port. Once the OK button is
pressed, Load Tester will attempt to connect to the engine, and verify that the engine is suitable for testing
before adding it.
If you receive an error attempting to add an engine that is known to be running, then it may be necessary to
configure any firewalls and the engine to permit connections with the controller. For more information,
please see Configuring a Load Engine.
Selecting Engines
To select an engine to use during a load test (or to monitor live), select the checkbox next to the engine
name. To disable an engine - un-check. Only those engines which are checked will be used during a load
test. When selected, Load tester will attempt to verify that the engine is available for testing, and enable it if
so.
Engines may also be removed entirely from the engine list by pressing the Remove button. Once an engine
has been removed, it may be added back automatically if it or the controller is restarted.
Upgrading Engines
If the engine is using a different software version, it cannot be enabled. If the software version of the engine
is lower, selecting the engine will enable the Upgrade button. Press it to upgrade the software on the
engine. Once the upgrade process has completed, the remote engine software will need to be restarted in
order for the upgrade to take affect.
Configuring Engines
For engines which support using multiple IP addresses, it is possible to configure which IP addresses the
engine will use during a load test. To do this, select an enabled engine, and press the Configure IPs button.
A dialog will be displayed allowing you to configure the IP Aliasing settings for the engine.
Viewing Historical Metrics
After a test has completed, selecting the test results will display the saved engine metrics from the selected
test. Only the relevant columns will be displayed for historical data - which means none of the columns
which show "live" data will be displayed.
Note that the live data option must be de-selected to view historical results:
Metrics View
This view provides access to the detailed metrics gathered during a load test. The drop-down choice fields
at the top provide navigation to the various categories and levels of metrics.
Please note that the Metrics view was formerly know as the Statistics view.
The first field allows selection from the 4 main categories:
1. summary - metrics relating to the entire test
2. testcases - metrics for each testcase entry in the load configuration
3. servers - metrics for the servers monitored during the test (if any)
4. engines - metrics for the load-generating engines used during the test
When a testcase is selected in the first choice field, the remaining fields allow selection of the page and
URL within the testcase.
Tooltips for each column describe the meaning of each column.
Exporting data
The data displayed in the view can be exported at any time to CSV format. To export, press the export button
and then provide a file location.
Settings
General Settings
Dialogs
This section controls the default behavior some of the most commonly used dialogs.
Testcase Editor
These settings affect the default behavior of the Testcase Editor.
Replay
l
l
l
l
Network errors can automatically be pruned from the testcase by selecting the Remove network errors
before replay item. The replay is not allowed to continue until the network errors are either automatically or manually removed. Turning this setting on allows the application to remove the network
errors without displaying a warning dialog.
Replays containing NTLM or Basic authentication should have the user identitiy configured before
attempting to replay the testcase. In some scenarios, this behavior may need to be overridden. Changing the Allow replay without authentication configured item allows a replay to proceed even if the
authentication is not configured.
The Content View displays the Web Pages as they are completed during a replay, and the View is
made visible in order to show the content. To prevent the Content View from automatically becoming
visible during replay, change the Activate content view during replays item.
By default the Virtual User will wait for a page to complete prior to loading the child resources on the
page. Turning off this setting will cause the Virtual User to start loading child resources as soon as the
start of the response is received.
Browser Settings
The Browser Settings page is located in the Web Performance section of the Preferences dialog (Window>Preferences menu item). The preferred browser is normally chosen in the Recording Configuration Wizard
when the first recording is performed. However, this setting can be customized and unsupported browsers
configured in the Browser Settings page.
Default browser
The default browser is indicated by a mark (*) next to the browser name in the list. To select a different
browser for recording, select the browser in the list and press the Make Default button. This browser will be
configured and launched automatically during the recording process.
Restoring the auto detected browsers
To restore the auto detected browser information or to detect a recently installed browser, press the Auto
Detect button.
Adding a custom browser
To add a browser that is not automatically supported, select the Add button to the right of the list of configurations. Enter a valid name and executable in the lower right portion of the page. To save the new
configuration, select the Apply button.
Note: Automatic configuration of the proxy settings are only provided for the auto-detected browsers. For custom browsers, the proxy configuration must be performed manually prior to recording and the recording ports
must be specified on the Web Performance Preference Page. For more information on configuring a custom
browser, see the Manual Browser Configuration FAQpage.
Modifying an existing browser
To change an existing browser, select the browser in the list. The lower right portion of the page displays the
editable information. Make the changes as needed and select the Apply button. At any time before Apply is
selected, the original information can be restored by selecting the Restore Defaults button.
Cache and Cookies options
By default, the browser's cookies and cache are cleared prior to initiating recording and restored shortly afterwards. If this is not done, the recording would reflect the state of the browser's cache. For example, cached
pages or images might never be requested from the server - which would result in a recording that did not
reflect the true content of a web page.
Deleting a configuration
To delete a configuration, select the configuration in the list and select the Delete button. Note that at least
one browser must be selected as the default browser and it may not be deleted.
Windows Settings
The Windows Preferences Page allows customization of the mechanism used by Load Tester to control
Internet Explorer on Windows machines.
Viewer Rendering Mode
Content View Rendering Mode
Controls how content is delivered to the Content View. Using the "Interactive" mode, form fields within the
Content View may be interactively clicked on for direct configuration of the posted field. Alternatively, the
"Proxified" mode serves content to the Content View through an internal proxy server.
Report Rendering Mode
Controls how content is delivered to the Report View. Using "Direct" mode, the Report Viewer interacts
directly with Internet Explorer. Use the "Servlet" mode to serve report content through an internal HTTP Servlet. Using the servlet mode enables a "Launch" button, allowing the report to be rendered by an external
web browser, but help links will be provided from an online website, instead of from the installed help system.
Advanced APIs
Use of the Advanced APIs will attempt alternative ways of configuring the proxy settings in Internet Explorer.
Use of these may allow you to record if you are unable to record normally. At this time, the Advanced APIs
are not compatible with Internet Explorer 8.
Direct APIs
These settings attempt to configure the proxy settings for the Operating System directly. Enabling or Disabling the direct APIs may be necessary if you are unable to record normally.
Interactive Content Viewer
The Interactive Content Viewer preferences are used to configure the behavior of the Content View, (for
when the Content View Rendering has been set to "Interactive", above).
l
Allow Scripts: Enable or Disables scripting support of content within the Content View. May be used to
disable Javascript or VBScript when inspecting recorded content.
l
l
l
Allow ActiveX: Enable or Disable ActiveX controls within the Content View. May be used to disable
ActiveX controls that cause problems when inspecting recorded content.
Enable "Click to Configure" for input fields: Enables support for editing testcase fields by clicking on
the initial form field in the Content View.
Allow download of missing resources: Permits the Content View to connect to the server live if the
recorded content contains a reference to a URL that is not contained in the recorded testcase.
Client Certificates
The Client Certificates preference page determines what client certificates will be presented to the server
during recording and playback.
Recording
The Recording section
determines which certificate will be presented during the recording process. The
certificate(s) must be imported using the Import button. Certificates are protected by a password, use the
Test Password button to test the password entered for the selected certificate.
Replay
The Replay section
of a testcase.
determines which certificate will be presented by each virtual user during the replay
To configure each virtual user to use a different certificate, they must all be imported into Analyzer. In addition, a dataset must be created containing two fields:
1. filename
2. password
After creating the dataset, configure the Dataset, Client Certificate and Password fields. Use the Test Passwords button to validate the configuration. Depending on the number of certificates, testing the passwords
could take several minutes.
License Key Management
Advanced features of Web Performance products are disabled until a license key has been installed. Evaluation license keys are available from the website - http://webperformance.com
ATTENTION: The license keys are encrypted binary files. Opening them with a text editor, or any program
other than Web Performance products, will likely result in the display of some meaningless garbage. Calling
us to complain will not change that. Please follow the directions for Importing license keys.
Managing license keys
To manage the installed licenses for Web Performance products, Select Preferences from the Window
menu. Then select Web Performance and Licenses in the tree. Selecting an entry in the list displays the
details of the license below.
Importing
License keys for Web Performance products usually arrive as an e-mail attachment. Detach the key and
save it somewhere, such as your desktop. Then select the Import button in the license manager and provide
the location of the key. After validating the license key, it appears in the list.
If the key cannot be imported because it is corrupted, it may be because the e-mail program treated the
attachment as a text file rather than a binary file. Please consult your e-mail program's manual for instructions on detaching the file as a binary file.
Expired license keys
Expired license keys are indicated with (expired) in the license key descriptions. You may safely delete
these license keys with no effect on the program.
Disabled
When a license key is shown as (disabled), it means that another copy of the same license key has been
detected on a computer on the same network. As a result, both have been temporarily disabled. To remedy,
remove the duplicate license key from one of the computers and restart both programs.
Load Test Settings
The Load Test Settings page is located in the Web Performance section of the Preferences dialog (Window>Preferences menu item). The following pictures shows the default settings.
Default Sample Period
Specifies a default value for the frequency at which data metrics snapshots are recorded, in seconds. The
default value will be used when a new load test configuration is created.
Live Chart Samples
Specifies the number of points to plot in each chart while a test is under way. Increasing this value will allow
each chart to show data for a greater length of time, but may increase the amount CPU load required by
each chart as it is animated. This setting has no effect when reviewing data from a previous test.
Record URL metrics
This setting determines whether or not the load test will collect metrics for each URL in your testcase. Disabling this value will greatly reduce the amount of data collected by the load test, while enabling it will provide more detailed information about each individual component within a web page. Page and test level
data are always recorded.
Record Detailed Page Durations
This setting determines whether or not the load test will record the duration of every page during the load
test. Disabling this value will greatly reduce the amount of data collected by the load test, while enabling it
will provide more detailed information about the performance of the pages.
Terminate test immediately when completed
Causes the load test to terminate when the allotted time for the test has finished. Normally, the test will give
each virtual user a chance to complete their testcase, logging them off from the test site (if applicable). Enabling this option will cause all virtual users to cease running regardless of how far along they are in the
page. Note that an active test may be halted in a similar fashion by pressing the red stop button in the Status
View.
Error Recording
Number of Descriptions
This setting limits the number of error description strings that are recorded during a load test (per testcase).
Entering a large number may provide more information about errors when needed and it may also increase
memory usage significantly.
Number of Pages
When an error is encountered during a load test, the web page which triggered the error is saved. This setting limits the number of times an error page will be recorded during a load test (per testcase).
Trace Logging
Detailed messaging between one or more virtual users and the servers in a load test can be saved for
debugging purposes. To enable trace logging, select the Enable option. The number of users to save and
the location of the log files can be specified once the option is enabled.
VU Trace Log formats
A VU Trace Log is a detailed log of all the transactions performed by a virtual user. Trace logging is enabled
from the Play menu. Please note that this feature will consume a large amount of disk space very quickly
and has a significant effect on the performance of the product. As a result the feature will be reset (deactivated) each time Load Tester is restarted, to prevent accidental use during normal testing.
Trace logs provide detailed information about the activity of virtual users that is not needed for most load-testing tasks. It is provided only for troubleshooting and diagnostics. As such it is considered a "rough" feature
that does not have a convenient graphical user interface. A text editor (e.g. notepad) must be used to view
the log files.
The trace logs will be generated for the first 5 virtual users that run in the test. The resulting logs are stored
in the tracelog folder under the Web Performance TrainerTM installation folder. The logs are stored in the following folder structure:
l T0
l T1
l Tn
l BC0
l BC1
l BCn
l VU0
l VU1
l VUn
l R0
l R1
l Rn
T0...Tn: For each test run, a new folder will be created under the tracelog folder.
BC0...BCn: For each Business Case in the test, a corresponding folder will be created under the test folder.
VU0...VUn: For each virtual user running the Business Case, a corresponding folder will be created under
the Business Case folder.
R0...Rn: For each repeat of the Business Case that the virtual user performs, a corresponding folder will be
created under the virtual user folder.
Within each repeat folder (R0...Rn), a log of the user activities will be contained in a file called log.txt. An
example of this file is shown here:
00:01.248 BCS: started testcase, BC=Case1
00:01.248 WPS: started page #0, PAGE=http://dell2:81/
00:01.249 CNI: initiated connection to: dell2:81
connection# = 20102672
00:01.251
CNO: connection opened to: dell2:81
connection# = 20102672
00:01.251 TQS: started request for: /
connection# = 20102672
00:01.253 TQE: completed request for: /
connection# = 20102672
00:01.257 TSS: started response for: /
connection# = 20102672
00:01.265 TSE: completed response for: /
connection# = 20102672
HTTP/1.1 200 OK
00:01.266 CNI: initiated connection to: dell2:81
connection# = 17099451
00:01.267 TQS: started request for: /tomcat.gif
connection# = 20102672
00:01.268 TQE: completed request for: /tomcat.gif
connection# = 20102672
00:01.269 CNO: connection opened to: dell2:81
connection# = 17099451
00:01.269 TQS: started request for: /jakarta-banner.gif
connection# = 17099451
00:01.281 TQE: completed request for: /jakarta-banner.gif
connection# = 17099451
00:01.282 TSS: started response for: /tomcat.gif
connection# = 20102672
00:01.286 TSE: completed response for: /tomcat.gif
connection# = 20102672
HTTP/1.1 200 OK
00:01.314 WPE: completed page #0, PAGE=http://dell2:81/
00:01.314 CNC: closed connection to: dell2:81
connection# = 20102672
00:01.314 CNC: closed connection to: dell2:81
connection# = 17099451
00:01.314 BCE: completed testcase, BC=Case1
Additionally, the full contents of each transaction (both request and
response) are saved in files called T0.txt...Tn.txt. These files contain the
full request and response, including the start-line, headers and content. If
any parts of the request are modified from the original before sending to
the server (e.g. data replacement), the file will reflect these changes
exactly as they were sent to the server. For SSL transactions, the content
will reflect the unencrypted content.
Performance Goals
Performance Goals allow you to express the level of performance that is desired for web pages and transactions in a testcase. This goal is expressed in seconds or milliseconds and is evaluated against the total
duration of the web page or transaction. When a performance goal has been applied to a page or transaction, the status of the performance relative to the goal will be displayed in relevant places in the user interface - such as the testcase editor and the reports.
Web Performance Load Tester™ allows configuration of performance goals individually for each page and
transaction in a testcase or for an entire testcase. . The goals may be configured in three different places depending on the scope of goal you wish to apply. By default, a page performance goal will be applied to
each testcase when it is recorded using the value supplied in the Recording Configuration Wizard (in the
Record menu).
Applying performance goals on individual pages or transactions
Individual performance goals are applied in the properties dialog for the web page or transaction - which can
be accessed via the pop-up menu:
The picture below shows the a transaction configured with an individual performance goal. The dialog for
setting an individual page goal is similar.
Applying performance goals to all pages or transactions in a testcase
Apply performance goals to each page (or transaction) in a testcase in the above manner can be repetitive if
the goal is the same for every page. To eliminate this work, a page or transaction performance goal may be
specified for the entire testcase. It will be applied to every page or transaction that is configured to use the
testcase goal (this is the default setting). The goals may be configured on the testcase properties dialog,
accessed via the pop-up menu in the Navigator view or the Edit menu. In the example below, a default performance goal is configured that will be applied to each page or transaction in the testcase that are configured to use the testcase goals.
Automatically applying performance goals to new testcases
The Performance Goal preference page allows changes to the automatic performance goals. The Performance Goal page is located in the Web Performance section of the Preferences dialog (Window->Preferences menu item). Use these settings to automatically apply performance goals to new testcases when
they are created.
Validation Preferences
The Validation Rules preferences page allows general rules to be entered that affect how the Validation Wizard will configure default validation rules for a testcase. Since pages may come back with different content
as a test is being executed, these rules will help determine when a page may have encountered an error
that should be flagged. The preferences page may be accessed by selecting Window->Preferences, and
selecting the "Web Performance->Validation Rules" section. Changes on this page will only take affect once
the Validation Wizard has been used to reconfigure a testcase.
Creating a Validation Rule
To create a new validation rule, select the Add Rule button. Then, a message may be entered, which will be
used as a search string in the content of resulting pages. Next, designate if the message entered indicates
an error if and when it is found by selecting the appropriate option in the "Record error if" section. If the message is an error message, use the "Record error if: message is found" option. If the message indicates a
string that is always expected to be found, the "Record error if: message is not found" option should be
selected.
Apply Validator if
The rule may be refined to only apply to certain pages by using the "Apply Validator if" section. By default,
each rule will only be applied to every URL in the testcase, except where the rule would have flagged an
error with the initial recording. The following options are available:
URL contains
When this option is selected, a search string may be entered into the text block to constrain the transactions by URL. Only those transactions that have the search string present anywhere in their URL will
be validated against using this rule. For example, in cases where a test might contain multiple host,
and the error message was specific to the host "192.168.10.10", then this field might be set to
"192.168.10.10".
MIME type contains
Selecting this option allows the validation to be constrained to only a certain type of resource, determined by it's MIME type. Only those resources with specified MIME types that contain the search string
will be eligible for this form of validation. For example, to validate only HTML documents, this field
might be set to "text/html" in order to skip validation on images. Likewise, setting this field to "text/xml"
will apply validation only to XML results.
Recorded transaction must satisfy rule
When this option is enabled, this rule is quietly ignored for transactions whose recorded content would
have caused this rule to raise an error. By default, this setting is enabled.
Proxy Settings
The Proxy Settings page is located in the Web Performance section of the Preferences dialog (Window>Preferences menu item). Every attempt to automatically detected the proxy settings is made by the Recording Configuration Wizard when the first recording is performed. If this step fails or an alternate proxy configuration is desired, it can be customized in the Proxy Settings page.
Default proxy
The default proxy is indicated by a mark (*) next to the proxy name in the list. To select a different proxy for
recording, select the proxy in the list and press the Make Default button. This proxy will be automatically configured for the browser when a recording is launched.
Restoring the auto detected proxy settings
To restore the auto detected proxy information or to detect changed proxy settings (for the computer or network), press the Auto Detect button.
Adding a new proxy
To add a new proxy, press the Add button to the right of the list of proxies. Enter a valid name and proxy information in the lower right portion of the page. To save the new proxy, press the Apply button.
To copy an existing proxy setting, select the proxy in the list and press the Copy button. To save the copy,
press the Apply button
Modifying an existing proxy
To change an existing proxy, select the proxy in the list. The lower right portion of the page displays the editable information. Make the changes as needed and press the Apply button. At any time before Apply is
selected, the original information can be restored by press the Restore Defaults button.
Deleting a proxy
To delete a proxy, select the proxy in the list and press the Delete button. Note that at least one proxy setting
must be selected as the default and it may not be deleted. If no proxy should used, select the No Proxy setting.
Recording Settings
Page grouping
During recording, Analyzer uses several algorithms to determine what requests should be grouped into a
page.
l
l
Referrer-analysis uses the Referrer HTTP header in requests (along with content-type and status
codes) to determine which transactions are web pages and which resources should be placed in
which web pages.
Activity-monitoring uses timing to group HTTP transactions into pages/groups. This analysis mode
usually generates more logical groups when an application uses asynchronous methods to generate
HTTP requests (e.g. AJAX-style applications). The activity threshold determines how much inactive
time must elapse before a web page is considered "done". This algorithm also uses referrer-analysis
where appropriate.
Recorder Ports & Browser Launching
Normally, the ports used by the Recorders internal proxy are selected automatically to avoid conflicts. However under some conditions, such as using browsers that cannot be configured automatically (custom
browsers), it may be useful to set the ports manually.
The Manually select recording ports option is used to configure the Recorder to use the same ports every
time it runs. If either of the port fields contains invalid values or unavailable ports, a warning message is displayed and the option cannot be enabled until valid ports are configured. For more information on manual
browser configuration, see the Manual Browser Configuration FAQpage.
The Launch default browser when recording option controls the launching of the default browser when a
new recording is started. Turning it off will cause no browser to be launched when a recording is started.
This can be useful when an already-running browser is to be used for recording.
Blocking Undesired Transactions
During recording, users may occasionally notice URLs to sites that are unaffiliated with the Test Case being
recorded. These URLs can be triggered by automatic update checks within the web browser, or third party
plugins. Alternatively, they might also include hit counters or advertisements that do not affect the actual
behavior of the application being tested. All of these URLs can be manually removed in the Test Case
Editor, but it may be easier to configure Analyzer to simply ignore all transactions occurring with a given host
while testing.
The Transaction Blocking Preferences screen may be accessed by selecting Window → Preferences… and
then selecting Web Performance → Recording → Transaction Blocking. To block all transactions with a
selected server, simply press "Add Host" (next to the "Hosts" section) and enter the name of the server as it
appears in the URL. In order to specify a subdomain, just include a "." in front of the domain name, and all
hosts ending with that domain will be blocked. If only blocking for a specific URL is desired, press the "Add
URL" option (next to the "URLs" section), and enter the full URL of the resource to be blocked.
When finished editing the blocked resources, press "OK" to save the configuration. The rules entered will
take affect in future recordings, and transactions matching the rules provided will be omitted from those
recordings.
Usage Logging
Web Performance products have the ability to track the usage of various features and report those usage
metrics to Web Performance, Inc. via the internet. This feature may be disabled by users with a valid license
key via the Window->Preferences->Web Performance->Usage menu item.
The preference settings page shows the information that is collected so that a user may verify that private or
personally-identifiable information is not submitted. An example of the preference page is show below,
including an example of the information that would be submitted after a short session that included recording
our website and replaying the testcase.
By default, the information is displayed in a user-friendly format. The Show raw content option may be
selected to display exactly, byte for byte, what information is being submitted.
Advanced
Advanced Field Assignments
While the Application State Management Wizard is capable of handling many multitudes of complex internal
variable assignments within a web page, occasionally it is not able to definitively determine what section of
a page caused the browser to post a field. One common case of this is with advanced Javascript events that
are triggered by mouse movements or clicks.
Often, these events only contain information indicating how the user is browsing the page, and it is not necessary for Analyzer to be able to emulate them, as by default it will simply play back the user's actions
exactly as they were recorded in the Testcase. However, some web applications will use these events to
insert dynamic application state data that must be more closely emulated in order for the application to be
successfully automated.
Detectors may be defined by using the "Detection Rules" preferences page. This page may be accessed by
selecting Window → Preferences… and then selecting Web Performance → Configuration Wizards → Application State → Detection Rules.
To create a new rule, simply press the "Add Rule" button, and then enter the parameters for the detector.
The parameters for a detector will vary based on the type of detection strategy desired. There are presently
three basic types of detectors:
l Single Field String Delimited Detectors
l Variable Field String Delimited Detectors
l Regular Expression Detectors
l Dynamic Path Segment Detectors
Single Field String Delimited Detectors
Single Field Detectors are designed to locate segments of code within a page for a specific field.
Parameter
Value
detector
sdd
detector.name
Example Javascript Detector
string.prefix
setField('ID','
string.suffix
');
field.name
ID
Fields
Required
detector
This should always be set to either StringDelimitedDetector or just sdd for short in order to indicate that
this configuration should be treated as a single field detector
For example: detector=sdd
field.name
The name of the field that is being assigned.
string.prefix
The prefix of the text just up to the value of the assignment.
string.suffix
The suffix of the text immediately following the value of the assignment.
Optional
assignment
The confidence that this detector has that the found assignment is accurate to the transaction. If DEFINITE, this detector will replace the value by the discovered assignment. If PARTIAL, this detector will
only replace the value if a DEFINITE assignment for the same field was not found. If omitted, this field
defaults to PARTIAL.
detector.name
The name given to this detector. If omitted this will default to the file name (less the .properties extension).
encoding.required
Specifies the required URL encoding strategy that a value extracted by this detector must be encoded
with before being transmitted over HTTP. Possible values:
l URL: the value should be encoded for use in a URL path segment or query parameter
l FORM or TRUE: the value should be encoded for use in a form field
l !<characters>: specifies only those characters which should not be URL encoded; any other characters encountered in the value will be URL encoded.
unescape.source
Determines how characters might be escaped when extracting a string of text. The available source formats to decode characters are:
l HTML: characters may be escaped as HTML entities. For example & will be extracted as a
single & character
l Javascript: characters may be escaped with a \ character. For example \u002B will be extracted
as a single + character.
l None: The source format does not present characters in an escaped format.
For strings which use XML escape sequences, the HTML option may be selected for standard XML
DTDs whose entities are a subset of the defined entities for HTML.
Each source format to be tested may be preceded by a qualifier, identifying how a match found using
the specified source format should be used. Valid qualifiers are:
l Only: Indicates this detector is only valid for strings un-escaped by the specified format.
l Probably: The detector should decode characters during replay with the specified format, even
when the decoding does not appear necessary from the recording.
l Maybe: The detector may decode during replay with the specified format if decoding appears necessary from the recording.
l Never: The detector should never attempt to decode characters with the specified format.
When a source format is specified without a qualifier, the qualifier is assumed to be "Only". To configure the detector to test multiple different types of decodings, each qualifier and format pair should be
separated by a comma. For example:
unescape.source=Probably HTML, Maybe Javascript
Means that the string will be HTML decoded on replay if it appears HTML encoded in the recording, or
if the string does not appear to be encoded at all during recording. However, if the string appears to be
Javascript encoded in the recording, then it will be Javascript decoded during replay.
If the "unescape.source" option is omitted, it will default to
Maybe HTML, Maybe Javascript, Probably None
fragment.pattern
A regular expression which allows this detector to detect only a dynamic fragment of the value of the
field. For more information on the behavior of this field, please see the Fragmented Value Detectors
section.
Fragmented Value Detectors
Both of the String Delimited Detectors can be made to search for fragmented values (instead of complete
values) by adding the Parameter "fragment.pattern". The value of this field should be a regular expression,
which must match the isolated fragment of the field.
To understand how this works, consider an example field "client" with the value "ca-pub1971486205579989". Now, let us suppose that the HTML document contains a Javascript fragment:
google_ad_client = "pub-1971486205579989";
In this case, only part of the value of the field has been declared in the source of the script. The full value is
determined at a later point in time, by concatenating the prefix "ca-" with the variable value declared. In order
to play back this case, the detector should only detect the dynamic fragment. This may be accomplished in
our example using the following detector configuration:
Parameter
Value
detector
sdd
detector.name
Example Ad Client ID Detector
string.prefix
google_ad_client = "
string.suffix
";
field.name
client
fragment.pattern
pub-\d{10,}
In this case, the additional field "fragment.pattern" allows this detector to use a dynamic value defined by the
HTML to replace "pub-1971486205579989" within the value "ca-pub-1971486205579989".
Variable Field String Delimited Detectors
Like the String Delimited Detector, this detector requires both a prefix and a suffix. However, the variable
name may be substituted anywhere into the prefix or suffix by including the string "{0}" (without the
quotes)wherever the name should be substituted. Single quotes (') must also be entered twice where used.
For example: Suppose the fields TX_ID and TS_ID were assigned in a page using a snippet of javascript
code written as:
setField('TX_ID','1234'); setField('TS_ID','56789');
Then the Variable Delimited Detector could be configured to detect both of these assignments (1234 and
56789, respectively) with the following configuration:
Parameter
Value
detector
vdd
detector.name
Example wildcard Javascript function assignment detector
string.prefix
setField(''{0}'',''
string.suffix
'');
Fields
Required
detector
This should always be set to either VariableDelimitedDetector or just vdd for short in order to indicate
that this configuration should be treated as a variable field detector
For example: detector=vdd
string.prefix
The prefix of the text just up to the value of the assignment.
string.suffix
The suffix of the text immediately following the value of the assignment.
Optional
accept.fieldname
A regular expression constraining which fields are subject to detection based on their names. If
present, fields that do not match this pattern are omitted from this detector. If not present, all fields are
examined by default.
assignment
the confidence that this detector has that the found assignment is accurate to the transaction. If DEFINITE, this detector will replace the value by the discovered assignment. If PARTIAL, this detector will
only replace the value if a DEFINITE assignment for the same field was not found. If omitted, this field
defaults to PARTIAL.
detector.name
The name given to this detector. If omitted this will default to the file name (less the .properties extension).
encoding.required
Specifies the required URL encoding strategy that a value extracted by this detector must be encoded
with before being transmitted over HTTP. Possible values:
l URL: the value should be encoded for use in a URL path segment or query parameter
l FORM or TRUE: the value should be encoded for use in a form field
l !<characters>: specifies only those characters which should not be URL encoded; any other characters encountered in the value will be URL encoded.
unescape.source
Determines how characters might be escaped when extracting a string of text. The available source formats to decode characters are:
l HTML: characters may be escaped as HTML entities. For example & will be extracted as a
single & character
l Javascript: characters may be escaped with a \ character. For example \u002B will be extracted
as a single + character.
l None: The source format does not present characters in an escaped format.
For strings which use XML escape sequences, the HTML option may be selected for standard XML
DTDs whose entities are a subset of the defined entities for HTML.
Each source format to be tested may be preceded by a qualifier, identifying how a match found using
the specified source format should be used. Valid qualifiers are:
l Only: Indicates this detector is only valid for strings un-escaped by the specified format.
l Probably: The detector should decode characters during replay with the specified format, even
when the decoding does not appear necessary from the recording.
l Maybe: The detector may decode during replay with the specified format if decoding appears necessary from the recording.
l Never: The detector should never attempt to decode characters with the specified format.
When a source format is specified without a qualifier, the qualifier is assumed to be "Only". To configure the detector to test multiple different types of decodings, each qualifier and format pair should be
separated by a comma. For example:
unescape.source=Probably HTML, Maybe Javascript
Means that the string will be HTML decoded on replay if it appears HTML encoded in the recording, or
if the string does not appear to be encoded at all during recording. However, if the string appears to be
Javascript encoded in the recording, then it will be Javascript decoded during replay.
If the "unescape.source" option is omitted, it will default to
Maybe HTML, Maybe Javascript, Probably None
fragment.pattern
A regular expression which allows this detector to detect only a dynamic fragment of the value of the
field. For more information on the behavior of this field, please see the Fragmented Value Detectors
section.
Regular Expression Detectors
In addition to string delimited detectors, it is also possible to use a Regular Expression to capture field
values from a page. This form of detection rule provides greater control over the search used to locate the
dynamic value. Additionally, the search pattern can contain multiple capture groups, allowing a single
search to extract values for multiple fields in a single pass.
For example, suppose our testcases present a list of slots, where we generally need to select the first slot
that is open. The server may send some HTML in the form of:
<li><a href="viewSlot.do?slot=1">Slot 1</a>, Status: Closed</li>
<li><a href="viewSlot.do?slot=2">Slot 2</a>, Status: Open</li>
<li><a href="viewSlot.do?slot=3">Slot 3</a>, Status: Open</li>
We create a Regular Expression detector to handle the field "slot" in new testcases where the user should
select the first "Open" slot:
Parameter
Value
detector
RegExAssignmentDetector
detector.name
Example Regular Expression Detector for "Open" slots
search.pattern
<li><a href="viewSlot.do\?slot=(\d+)">Slot \1</a>, Status:
Open</li>
groups.count
1
group1.name.pattern
slot
content_type.pattern
text/html.*
Fields
Required
detector
This should always be set to either RegExAssignmentDetector or just read for short in order to indicate
that this configuration should be treated as a regular expression detectors
For example: detector=read
search.pattern
The regular expression to search for. Values extracted by the expression are represented as capture
groups
Optional
assignment
the confidence that this detector has that the found assignment is accurate to the transaction. If DEFINITE, this detector will replace the value by the discovered assignment. If PARTIAL, this detector will
only replace the value if a DEFINITE assignment for the same field was not found. If omitted, this field
defaults to PARTIAL.
content_type.pattern
Specifies a regular expression which constrains on which pages the detector will look to find the
value. If this pattern is specified, then this detector will only search for field assignments within pages
that have a Content-Type containing this expression. For example: content_type.pattern=text/html.* will cause the detector to only search within HTML documents. If this expression is not specified, the detector will search all available transactions for a match.
groups.count
The number of capture groups specified in the "search.pattern". If this value is omitted, it assumed to
be 1.
groupN.name.pattern
Specify this pattern to constrain by name which fields group N will be considered a valid assignment
for. For example, consider a testcase with two fields:
name value
quantity 1
ctrl$00 1
And a search pattern search.pattern=<input name="ctrl\$\d{2}" value="(\d*)" />
Using this pattern, the value "1" will be extracted, which can match either field. By specifying
group1.name.pattern=ctrl\$\d{2}, this detector will only assign the extracted value to the
field ctrl$00.
groupN.value.pattern
Specify this pattern to constrain by recorded value which fields group N will be considered a valid
assignment for.
detector.name
The name given to this detector. If omitted this will default to the file name (less the .properties extension).
encoding.required
Specifies the required URL encoding strategy that a value extracted by this detector must be encoded
with before being transmitted over HTTP. Possible values:
l URL: the value should be encoded for use in a URL path segment or query parameter
l FORM or TRUE: the value should be encoded for use in a form field
l !<characters>: specifies only those characters which should not be URL encoded; any other characters encountered in the value will be URL encoded.
unescape.source
Determines how characters might be escaped when extracting a string of text. The available source formats to decode characters are:
l HTML: characters may be escaped as HTML entities. For example & will be extracted as a
single & character
l Javascript: characters may be escaped with a \ character. For example \u002B will be extracted
as a single + character.
l None: The source format does not present characters in an escaped format.
For strings which use XML escape sequences, the HTML option may be selected for standard XML
DTDs whose entities are a subset of the defined entities for HTML.
Each source format to be tested may be preceded by a qualifier, identifying how a match found using
the specified source format should be used. Valid qualifiers are:
l Only: Indicates this detector is only valid for strings un-escaped by the specified format.
l Probably: The detector should decode characters during replay with the specified format, even
when the decoding does not appear necessary from the recording.
l Maybe: The detector may decode during replay with the specified format if decoding appears necessary from the recording.
l Never: The detector should never attempt to decode characters with the specified format.
When a source format is specified without a qualifier, the qualifier is assumed to be "Only". To configure the detector to test multiple different types of decodings, each qualifier and format pair should be
separated by a comma. For example:
unescape.source=Probably HTML, Maybe Javascript
Means that the string will be HTML decoded on replay if it appears HTML encoded in the recording, or
if the string does not appear to be encoded at all during recording. However, if the string appears to be
Javascript encoded in the recording, then it will be Javascript decoded during replay.
If the "unescape.source" option is omitted, it will default to
Maybe HTML, Maybe Javascript, Probably None
Note that group 0 implicitly matches the entire pattern. The entire pattern is not considered a valid value for
any field, unless either "group0.name.pattern", or "group0.value.pattern" is specified.
Dynamic Path Segments
Some applications may utilize dynamic components not just in the form of traditional query parameters and
field values, but also the path segments of the individual URLs. For example, a request for the URL http://mysite.com/widgets/14697302/index.html may need to be dynamically replaced for the path segment
14697302 for each virtual user.
Detectors are presently limited to searching for a path segment within the location header of a previous redirect response. For further configuration options, please contact support.
A sample configuration file for this form of URL would look like
Parameter
Value
detector
dpsd
segment.pattern
(\d{6,})
Fields
Required
detector
the type of detector to use. This style of detector may be specified as DynamicPathSegmentDetector
(dpsd for short).
segment.pattern
a regular expression defining the criteria for what path segments are eligible for dynamic replacement.
This detector will first ignore all path segments that do not entirely match this expression. Each
dynamic component within the expression must be within a capturing group to then be eligible for
replacement. In the above example, the pattern (\d{6,}) reads:
Look for a segment containing at least 6 decimal digits, and only decimal digits, and then
replace the entire segment.
To replace just the numeric component within a path segment such as 64315_A, you could use the
expression: (\d{5})(?>_\w)?
Optional
detector.name
the name given to this detector. If omitted this will default to the file name (less the .properties extension).
assignment
the confidence that this detector has that the found assignment is accurate to the transaction. If DEFINITE, this detector will replace this path segment from the first matching redirect it finds, if the redirect
appears to redirect to this URL or a similarly based URL. If omitted, this field will default to PARTIAL.
Configuring your computer for Multiple IP Addresses
This section covers how to configure your computer to generate virtual users from more than one IP address.
This is only needed if your web application makes use of the client's IP addresses, which is quite rare, or if a
piece of hardware such as load balancer uses client IP addresses. The concepts behind networks and
which IP addresses are valid for your network are beyond the scope of the manual. Please consult with
your network administrator before going any further. The following modifications have a high probability
of rendering your computer inoperable if done incorrectly.
Do not use this configuration unless you are sure it is required!
An IP address is intended to identify the source of a computer's network traffic, and is used to route network
packets on a network. By default virtual users will originate from the IP address of the computer running Web
Performance Load Tester, but there are reasons why you may want virtual users to each have their own IP
address. For example, some hardware load balancing devices use the IP address to route packets to different computers.
By default Web Performance Load Tester will use the Operating System to select an available network
address, but at most you might have four network cards, which is not nearly enough to give every virtual user
its own IP address. To get past this limitation the multiple IP address feature uses the ability of your operating system to configure virtual network devices. When it starts, Web Performance Load Tester will create a
list of all real and virtual network devices. During a performance test as each virtual user is created it will be
assigned a new IP address; if there are more users than IP addresses, the virtual users will grab an IP
address from the front of the list.
The use of multiple IP addresses will also work if you have multiple playback engines, but you must configure virtual network devices on each computer separately.
The following sections describe how to configure virtual network devices on the different operating systems.
Note that this feature of Web Performance Load Tester makes use of the built-in feature of your operating
system to configure virtual network devices, and the complicated setup procedure is required by the operating system.
Windows
To configure a Windows machine to use multiple virtual IP addresses for right-click on My Network Places
(on the Desktop) or execute Start->Control Panel, and double click on Network and Dial-up Connections:
Note that a limitation of Windows is that you can only configure virtual network devices using a Local Area
Connection; VPNs and ISDN or other modem connections do not have this ability.
The next step is to edit the properties of your network connection, bringing up the following dialog:
Select Internet Protocol (TCP/IP) and click on the Properties button, which brings up the following dialog:
Note that in order to configure virtual IP addresses your computer must be configured to use fixed IP
addresses; DHCP is not supported. If you are not on control of the IP addresses on your local network you
should work with your network administrator to reserve a block of IP addresses.
The next step is to click on the Advanced button, bringing up this dialog:
The above dialog (Advanced TCP/IP Settings) shows the list of IP addresses for your local computer. To
add virtual network devices click on the Add button, which brings up the TCP/IP Address Dialog:
Enter the IP address and subnet mask of the virtual network device you wish to configure, and this will be
added to the list shown in the Advanced TCP/IP Settings Dialog:
The procedure should be repeated for each virtual IP address/network device that you wish to add.
Linux/UNIX
As with the Windows configuration, choosing valid IP addresses is beyond the scope of this manual, but typically you would want to perform this modification on a computer using private IP addresses in a test lab.
The ifconfig command can be used to dynamically create virtual network device. The following example
shows the creating of a single virtual network device:
[root@bigtoe root]# ifconfig eth0:0 10.1.1.1
[root@bigtoe root]# ifconfig
eth0
Link encap:Ethernet HWaddr 00:A0:C9:5A:DF:F7
inet addr:10.0.0.100 Bcast:10.0.0.255 Mask:255.255.255.0
UP BROADCAST RUNNING MULTICAST MTU:1500 Metric:1
RX packets:454545 errors:0 dropped:0 overruns:0 frame:0
TX packets:311037 errors:0 dropped:0 overruns:0 carrier:0
collisions:0 txqueuelen:100
RX bytes:94017376 (89.6 Mb) TX bytes:31798276 (30.3 Mb)
Interrupt:10 Base address:0xdc00 Memory:ef201000-ef201038
eth0:0 Link encap:Ethernet HWaddr 00:A0:C9:5A:DF:F7
inet addr:10.1.1.1 Bcast:10.1.1.255 Mask:255.255.255.0
UP BROADCAST RUNNING MULTICAST MTU:1500 Metric:1
RX packets:0 errors:0 dropped:0 overruns:0 frame:0
TX packets:0 errors:0 dropped:0 overruns:0 carrier:0
collisions:0 txqueuelen:100
RX bytes:0 (0.0 b) TX bytes:0 (0.0 b)
Interrupt:10 Base address:0xdc00 Memory:ef201000-ef201038
This command would then have to be repeated with different parameters to add more than one virtual
device. To make this permanent on a BSD or SysV style system like RedHat you can modify the
/etc/rc.d/rc.local startup script. For more information please consult the Linux IP Alias mini-HOWTO .
Customizing IP Selections During a Load Test
Once your workstation has been configured with the IP addresses desired, you may also wish to configure
the IP aliasing options of Web Performance Load Tester.
Blocking Undesired Transactions
During recording, users may occasionally notice URLs to sites that are unaffiliated with the Test Case being
recorded. These URLs can be triggered by automatic update checks within the web browser, or third party
plugins. Alternatively, they might also include hit counters or advertisements that do not affect the actual
behavior of the application being tested. All of these URLs can be manually removed in the Test Case
Editor, but it may be easier to configure Analyzer to simply ignore all transactions occurring with a given host
while testing.
The Transaction Blocking Preferences screen may be accessed by selecting Window → Preferences… and
then selecting Web Performance → Recording → Transaction Blocking. To block all transactions with a
selected server, simply press "Add Host" (next to the "Hosts" section) and enter the name of the server as it
appears in the URL. In order to specify a subdomain, just include a "." in front of the domain name, and all
hosts ending with that domain will be blocked. If only blocking for a specific URL is desired, press the "Add
URL" option (next to the "URLs" section), and enter the full URL of the resource to be blocked.
When finished editing the blocked resources, press "OK" to save the configuration. The rules entered will
take affect in future recordings, and transactions matching the rules provided will be omitted from those
recordings.
Advanced Cookie Handling
In most cases, the default cookie handling used by Web Performance products will operate with your server
with practically no manual configuration. If your server sends normal cookies to be relayed back by the
user's web browser, then no further configuration is required. Some applications, however, may depend on
the end user or their web browser to alter cookies before being sent back to the application. For these scenarios some configuration may be required.
In order to over-ride the default cookie handling, a configuration file must be created. To do this, locate the
directory for custom configuration files and create a new file named "cookies.cfg".
Each configuration in this file must start a new line specifying the name of the cookie in the form:
cookie1.name=BROWSERSUPPORT
Here the name of the cookie being sent back to the server is "BROWSERSUPPORT".
The next line of the file should appear as
cookie1.instance=1
The instance field here indicates the first usage of this cookie in your recording where the rule should be
applied. For example, if default handling should be applied for the first usage, and custom handling from
there on, this value could be changed to
cookie1.instance=2
Lastly, we will want to specify what the value of this cookie should be changed to. There are two possible
options:
l To use a fixed value, you may enter the line:
cookie1.setFromConstant=supported
l
Here, the text "supported" could be any fixed string that should be used whenever this cookie is being
sent back to your server during playback.
To use a dynamic value loaded from a dataset, use the lines:
cookie1.setFromDataset=browser-support-cookies
cookie1.setFromField=field1
Here, the value "browser-support-cookies" is the name of a dataset saved in your repository that will
be used by the virtual users, and "field1" is the name of the field within the dataset containing the corresponding values for each cookie.
As many cookies as desired may be added into following lines of this configuration file. To add further
cookies, rule number must be incremented sequentially for each additional cookie in the file. For example,
further cookies rules would start with "cookie2", "cookie3", etc. It is recommended that once this file has
been changed, that Web Performance Load Tester be closed and re-started in order to ensure the changes
take full effect.
Dynamically Named Fields
Occasionally your testcase will include variables that not only have changing values during playback, but
also change in name as well.
Consider the case where two variables are posted to your application server:
serialno=1234
color1234=blue
In this case, you may specify that the variable color1234 should be renamed, using a name derived from the
variable serialno each time the test is played back. In order to configure your testcase, you must configure
the "Dynamically Named Fields" preferences how to detect this behavior in your application. This option
may be configured through a preference page, accessed by selecting Window→Preferences… and then
selecting Web Performance→Configuration Wizards→Application State→Dynamically Named Fields.
Configuring these fields is done in two phases. The first is to select the "Add Field" next to the "Identifiers"
table, and enter the name of the field that identifies a value. In our example, the identifier is "serialno",
whose value will be used later to identify the name of the next variable.
Next, select the field in the Identifiers table to display the dependant fields associated with it, and press the
"Add Field" button next to the bottom "Fields" table to create a new dependant field. The name of the variable may be entered here, replacing the dynamic part of the name with an ampersand (&). In our example,
the color field would be entered as "color&".
The next time the Application State Management Wizard is run on a testcase, fields starting with the name
"color", and ending their name with a value from the field "serialno" will be dynamically renamed when the
testcase is replayed or run in a load test.
More elaborate testcases can also be defined using dynamically named variables. Consider if our case had
been:
serialno=1234
color1234=blue
weight1234_in_lbs=5
1234_assembly_date=20051201
It is possible to specify multiple fields as having a single dependency by adding their names to the "Fields"
table:
l color&
l weight&_in_lbs
l &_assembly_date
This configuration will allow the Application State Management Wizard to correctly assume name dependencies for all three dependent variables.
It is also permitted for a dynamically named field to be associated with multiple identifiers. For example, consider another case:
itemid=123456789
checkbox123456789=checked
legacyid=123
checkbox123=unchecked
To configure this case, simply create to identifier fields:
l itemid
l legacyid
Next, add the dependant field "checkbox&" to both identifier fields. The Application State Management Wizard will examine both uses of the "checkbox" fields, and only associate dependency when the name of the
field corresponds to the value of the identifier. In this example, the wizard will associate the first "checkbox"
field as being dependant on "itemid", and associate the second "checkbox" field as dependant on the field
"legacyid".
Ignoring Fields in the Application State Management Wizard
The Application State Management Wizard will attempt to automatically configure those variables shared by
the end user's Web Browser and the Application Server, but are not immediately exposed to the end user.
Generally, no further configuration is required in order for your testcase to play back successfully. However,
an easy optimization can be made to increase the number of virtual users supported by each load generating engine by removing those fields that never change. However, for large test cases, removing those
fields from the ASM Wizard may be an inconvenient approach.
The Application State Management Wizard offers ignore preferences in order to automatically ignore those
fields which are not intended to be treated as dynamic. These preferences may be accessed by selecting
Window → Preferences… and then selecting Web Performance → Configuration Wizards → Ignored Fields.
This page contains two lists, one for omitting fields by name, and one for omitting specific uses of a field by
their value. For example, suppose your case contained a H TML fragment: <input name="btnSubmit"
type="Submit" value="submit" />
This may result in a fixed value post being sent to your server:
btnSubmit=submit
You may always remove this value from the Application State Management Wizard manually, or you could
specify that this field always be automatically removed with either ignore list
Ignored Names
Ignored Values
OR
submit
btnSubmit
Be very careful not to include a blank entry unless you intend for the Wizard to treat blank values as fixed
values as well. The next time you run the Application State Management Wizard, any usage with their name
or value specified in one of the ignore lists will be automatically ignored or hidden by the wizard.
Charts & Reports
Viewing Reports
There are three types of reports that can be viewed within the application or opened within the application
and sent to an external browser. These reports are:
1. Testcase Report
This report can be viewed by selecting the Testcase in the Navigator View, then right-clicking to view
the menu and selecting the Open Testcase Report menu item. It can also be opened from the Report
item in the Edit menu when a testcase is selected in the Navigator or a testcase editor is active. There
is also a toolbar button for opening a report from the active testcase editor and an item in the pull-down
menu in the upper-right corner of the editor.
2. Baseline Performance Analysis
This report can be viewed for a load configuration or for a single testcase (which creates a matching
load configuration). From a testcase, it can be opened by selecting the Testcase in the Navigator
View, then selecting the Open Baseline Report item from the pop-up menu. This will prompt for information required to create a Load Configuration. From a pre-existing load configuration, the report can
be viewed by selecting the Load configuration in the Navigator View and selecting the Open Baseline
Report item from the pop-up menu.
3. Load Test Results reports
This report can be viewed by either:
l
l
Selecting the Report button from the Load Test Results Editor
Selecting the Load Test Result in the Navigator View, then right-clicking to view the menu and
selecting the Open Test Report menu item.
Printing the Reports
The report may be printed by using the "Print..." button along the top of the report viewer.
Saving as a file
Most browsers also provide a mechanism for saving the page to disk, including all the images. Internet
Explorer also allows saving in the .mht web archive format (based on MIME), which combines the page and
all images into a single file that can be easily distributed to other users.
Saving as a PDF
You may create a PDF of the report by launching the report in a browser and then printing to a PDF-enabled
virtual printer such as that provided with Adobe Acrobat. There other programs available - some, such as
PDF Creator are available free. Search the Internet for "pdf writer".
Saving charts
A chart image may be saved to a file by right-clicking on the chart and using the Save Picture As... feature.
Exporting Data
Selecting the CSV format link below each table will provide CSV-formatted representation of the data which
is importable into most spreadsheet programs, such as Microsoft Office and Open Office.
Testcase Report
The Testcase Report contains 5 sections:
1. Summary - high-level metrics relevant to the entire testcase
2. Pages - detailed metrics about each page, similar to the information displayed in the testcase editor
3. URLs - detailed metrics about each URL in each page, similar to the information displayed in the testcase editor
4. Trend - performance trend plots and detailed metrics for web page durations and sizes (only applicable if one or more replays have been performed)
5. Errors - a list of errors similar to that displayed in the Errors view
Baseline Performance Report
The purpose of the Baseline Performance Report is to examine the performance of system with a single
user in order to determine its performance when not under load. A great deal of the time web-based applications do not meet performance requirements with even a single user because the web page load times
are not objectively measured.
The Analysis Summary gives an overall summary of the report's findings from the two other major sections
which look at Performance Goals and Bandwidth Estimates.
The Bandwidth report gives estimated values for the minimum and maximum bandwidth needed by the hosting company to support the specified number of users. It is a good place to start when planning the bandwidth that will be required to perform the load test, and for capacity planning with the web hosting company.
Of course, once a load test is performed real bandwidth data will be available.
The Goals section shows how many of the web pages will be estimated to meet or fail the performance
goals given the test parameters. Of course these are just estimates and an actual load test will need to be
run to get definitive answers. One of the most common sources of performance problems with web pages is
designing the pages on a LAN with virtual unlimited bandwidth, which leads to large page sizes. When the
pages are then viewed over a WAN, which is bandwidth limited, the pages can be much slower to view.
This report uses the simulated bandwidth described in the Load Test Configuration Editor to estimate the
effects of limited bandwidth on page load times.
Load Test Report
Load Test Report
This is a comprehensive report summarizing the performance of a load test and detailing the performance of
each page in the test. The report consists of many sub-sections which are selectable from the navigation
tree at the top of the report viewer (see picture below). When the report is opened (from either the Navigator
or the Load Test Results view), the Test Summary section will initially be displayed. Re-opening the report
at a later time will return to the most recently viewed section.
Print - Print the current section and all enabled sub-sections. Sub sections may be enabled and disabled
using the check-boxes in the navigation tree.
Save - Save the current section and all enabled sub-sections using the browsers (IE by default on Windows)
save options. Note that Microsofts Web Archive (.mht) format is useful for saving the contents in a single file
for easy distribution to others. Note that the "Web Page, complete" option saves one HTML file for the report
plus page resources (images, etc) in a sub-folder. All the files are needed to view the saved report at a later
time.
Export - Save the entire report in HTML format. The exported report includes a convenient navigation pane
similar to the navigation tree shown above. This format is optimal for posting to a website for easy distribution to multiple team members. Note that this option typically produces hundreds of files in a folder - all
the files must be distributed together.
Launch - Open the current section in the default browser.
Settings - Edit the report and analysis settings for this load test result.
The Server Performance Checklist compares key metrics against industry recommendations to help pinpoint
the cause of performance problems. Detailed descriptions of the metrics and tuning advice are available
from the Server Metrics links, below. See the Server Monitoring link for a feature description and configuration instructions.
Related Topics
l
l
l
Server Metrics
Server Monitoring
Test Analysis FAQs
Server Monitoring
Server Monitoring Introduction
Monitoring the server is a critical part of load testing. The Load TesterTM software automatically measures
the change in user experience in response to load. However, additional information about the activity on the
server is crucial to any diagnosis or tuning of the performance.
The software provides several different options for monitoring the server during a load test. Those methods
fall into two categories:
l Basic monitoring
l Advanced monitoring
Basic Server Monitoring
Basic monitoring provides information about the CPU and memory utilization of the server during the test.
This can be accomplished in four ways:
1. Advanced Server Analysis - an application which may be downloaded to each server to provide basic
monitoring support. Additionally, the agent may be licensed to enable Advanced Server Monitoring.
2. Direct windows monitoring - using the built-in performance measurement APIs, this method can be
used to monitor a Windows server as long as the controller (the main GUI of the Load TesterTM software) is also running on Windows and has the necessary authentication credentials
3. Unix/Java monitoring - on any Java-based application server, our WAR file can be deployed to provide
the monitoring function
4. HTTP and custom script - using a simple format, any script can return the CPU and memory measurements in a plain text that is understood by the Load TesterTM software.
This monitoring option is included with all Load TesterTM licenses.
More information is available on the Basic Server Monitoring page.
Advanced Server Analysis
This module, purchased separately, allows Load TesterTM to take more detailed measurements of the server
performance. These metrics are listed in the Server Metrics section.
This feature requires installation of a Server Monitoring Agent on each server. Like our remote load engines,
this also features auto-detection on the local network, which eliminates the configuration steps required for
basic monitoring.
More information is available on the Advanced Server Monitoring page.
Basic Server Monitoring
To start monitoring a new server, simply press the Add... button in the Servers View. This dialog will appear:
Here, you must decide what style of server monitoring to use. Four styles are supported:
1. Web Performance Server Monitor Agent - The downloadable server monitor agent (available for Windows or Linux) provides basic monitoring of CPU and Memory, with an option for Advanced monitoring
of vital server performance data. Please see the Server Monitoring Agent for further information.
2. Windows to Windows - uses a built-in direct protocol to monitor the remote server (available only if
both your server and the load testing workstation are running Windows).
3. Java-based server on Unix - Web Performance provides a WAR file containing a servlet that will provide the necessary server metrics. The provided WAR is supported on Solaris and Linux.
4. Custom monitoring (server script) - For unsupported platforms, a custom script may return the necessary server metrics in readable format (see script requirements later in this chapter).
Once a configuration has been selected, and the required fields filled in, pressing the "OK" button will
attempt to connect to the server and verify that the server can be successfully monitored under normal conditions. Upon verification, the server will be added to the list of servers for metrics gathering during a load
test.
Server Configuration
Web Performance Server Monitor Agent
This option may be used to connect to an installed and running copy of the Web Performance Server Monitoring Agent. Typically, the agents are automatically detected and enabled. However, depending on network conditions, it may be necessary to add the configuration manually by entering either the IP Address or
hostname of the server on which the agent is running.
If the agent has been configured to use a specific port, then the specified value of the RmiRegistryPort
should be entered in the Port option. Otherwise, the default port is 1099.
Direct Windows monitoring
No server-side installation is necessary. However, the user running Web Performance Load Tester must
have the appropriate Windows privileges to monitor the server. See your network administrator for details.
Note that you must log into the Windows Server from the client machine prior
to beginning the test. The windows Direct monitoring is dependent on the Windows authentication established prior to the start of monitoring. For example,
browsing a network share on the server that requires authentication will
usually establish the required permissions.
The direct windows monitoring is the equivalent of using the Windows Performance Monitor (perfmon.exe)
to monitor the % Committed Bytes In Use counter of the Memory performance object on the remote server.
UNIX server (with Java-based application server)
Install the WPIMonitor.war file in your server in the usual deployment folder. It will install a servlet named
Monitor in the path /WPIMonitor/monitor.
note: the WPIMonitor.war file can be found in the product installation folder.
If necessary, you may modify the deployment descriptor for the servlet as necessary for your environment.
However, if you change the path required to access the monitoring servlet, then you must configure the monitoring within Web Performance Load Tester as a custom script installation and provide the full URL to the
Monitor servlet.
Custom monitoring (server script)
Web Performance can monitor any server via HTTP if a customized script is developed to return the server
CPU% and memory% in the supported format. The following plain text content format is supported (MIME
type text/plain):
version=1
CPU%=nnn
memory%=nnn
After writing and testing your script, enter the URL of the script into the URL field of the configuration dialog.
Advanced Server Analysis
To take advantage of the Advanced Server Analysis, the Web Performance Server Monitoring Agent must
be installed on your server. The agent will collect performance data from your server while a load test is running.
Most configuration of the server monitoring agent is performed through the Web Performance Load Tester
controller. Generally, once the server and controller have been started, an entry for the server will appear in
the Servers View of Web Performance Load Tester.
The Server Monitor agent will collect basic server metrics for Windows and Linux servers with minimal configuration overhead. With the installation of a separate license, the agent is also capable of performing
Advanced Server Monitoring.
Installing the Agent
To install the Server Monitoring Agent, first download a copy of the installer appropriate for the platform of
server from www.webperformance.com. The installer should then be run on each server that will be monitored during the test. A GUI will lead the user through the installation process. To run the installer in a console only mode, add the argument "-i console" when executing it. For example, on Linux, the following
command is used to start the installer on command-line mode:
./ServerAgent_Linux_3.6.bin –i console
Alternatively, if an older version of the agent software has already been installed on a server, then it may be
upgraded by selecting the corresponding entry in the Servers View and using the "Upgrade" function.
Installing the License
To install a license follow these steps:
1. Open Web Performance Load Tester
2. Select the Servers view
3. Select the server where the license should be installed
4. Select the "Licensing..." button
5. Follow the wizard to completed activation and installation of the license key
Note that the procedures for activating, deactivating and moving licenses for the server monitoring agent is
similar to the procedures for Load Tester. Please consult the License Key Activation page for more details.
Running the Agent
Windows
By default, a folder name "Web Performance Server Monitor Agent" will be created in the Start menu. Selecting the option "Server Monitor Agent" will launch a console application while the agent is accepting and/or
communicating with Load Tester™. Simply type "quit" at the console to terminate the agent.
Linux
By default, a shortcut named "Server_Monitor_Agent" will be installed in the user's home folder. This shortcut will start the Server Monitoring Agent. For example:
root> ./Server_Monitor_Agent
The agent will then run as a console application while the it is accepting and/or communicating with Load
Tester™. Simply type "quit" at the console to terminate the agent.
Configuring the Agent
When the monitoring agent starts, it will identify itself on the network, allowing any running Load Tester™
controllers to automatically detect and configure the agent. Depending on your network configuration, the
network broadcast may not be routed from the server to the controller. In this case, you will need to add the
monitoring agent to the server list manually - using the Add... button in the Servers View. For more information, see the Basic Server Monitoring page - the procedures are similar.
Further Configuration
Once the controller has been able to successfully connect to an agent, the agent may be managed through
the Servers View.
Viewing Collected Data
The data collected by the monitoring agent is automatically integrated into the test results.
In the Load Test Report, select the Servers section for charts and tables detailing the server performance as
well as a performance checklist.
In the Metrics View, use the drop-down controls to select the server and the metrics will be presented in the
table.
Server Metrics
A complete list of all load test metrics (including .NET server metrics) can be found in the Load Test Metrics
section.
Note that not all metrics are available on all operating systems.
CPU group
CPU % (Processor Time for all processors) - the percentage of elapsed time that the processor spends
executing non-Idle threads. This metric is the primary indicator of processor activity, and displays the average percentage of busy time observed during the sample interval. This metric is expected to increase proportionally to the load applied to the system.
Context switches/sec - the rate of switches from one thread to another. Thread switches can occur either
inside of a single process or across processes. A thread switch can be caused either by one thread asking
another for information, or by a thread being preempted by another, higher priority thread becoming ready to
run. This metric is expected to increase proportionally to the load applied to the system.
Process Queue Length - the number of processes waiting to be scheduled to run. On windows, a sustained
processor queue of less than 10 threads per processor is normally acceptable, dependent on the workload.
Memory group
% Memory - The percentage of available memory that is in use. Large values of this metric suggest that the
frequency of page swaps to disk will be high. For Windows servers, this is the percentage of virtual memory
currently committed. For Linux servers, this is the percentage of physical memory in use (non free, cached or
buffered).
Cache Memory Allocation - The amount of memory reserved by the Operating System for cache usage.
Decreases in this value can be used as indicators that the Operating System requires memory for other purposes, which might not cause an immediate increase in memory usage.
Cache Memory Allocation Ratio - The percentage of physical memory reserved by the Operating System for
cache usage. Decreases in this value can be used as indicators that the Operating System requires memory
for other purposes, which might not cause an immediate increase in memory usage.
Page reads/sec - the rate at which the disk was read to resolve hard page faults. Hard page faults occur
when a process references a page in virtual memory that is not in working set or elsewhere in physical memory, and must be retrieved from disk. This counter is a primary indicator of the kinds of faults that cause system-wide delays. It includes read operations to satisfy faults in the file system cache (usually requested by
applications) and in non-cached mapped memory files. Large increases in this metric can degrade system
performance. Increasing physical memory can alleviate the problem).
Page Writes/sec - the rate at which pages are written to disk to free up space in physical memory. Pages are
written to disk only if they are changed while in physical memory, so they are likely to hold data, not code.
Large increases in this metric can degrade system performance. Increasing physical memory can alleviate
the problem.
Disk group
% I/O Time Utilized - The percentage of time during the sample interval that the disk was executing I/O.
Service time: The average amount of time required for each I/O transfer.
Reads/sec - the rate of read operations on the disk. A plateau in this metric could indicate a performance bottleneck.
Writes/sec - the rate of write operations on the disk. A plateau in this metric could indicate a performance bottleneck.
Queue Length - The average number of write requests that were queued for the disk during the sample interval.
Network group
Packets Received/sec - the rate at which packets are received on the network interfaces. This metric is
expected to increase proportionally to the applied load. A greater-than-linear increase could indicate less
efficient operation of the network. A less-than-linear increase indicates a limitation of network and/or server
capacity.
Packets Sent/sec - the rate at which packets are sent on the network interfaces. This metric is expected to
increase proportionally to the applied load. A greater-than-linear increase could indicate less efficient operation of the network. A less-than-linear increase indicates a limitation of network and/or server capacity.
Bytes received/sec - the rate at which data is received on the network interfaces. This metric is expected to
increase proportionally to the applied load. A greater-than-linear increase could indicate less efficient operation of the network. A less-than-linear increase indicates a limitation of network and/or server capacity.
Bytes sent/sec - the rate at which data is sent on the network interfaces. This metric is expected to increase
proportionally to the applied load. A greater-than-linear increase could indicate less efficient operation of the
network. A less-than-linear increase indicates a limitation of network and/or server capacity.
Packets Received Errors - the number of inbound packets that contained errors preventing them from being
deliverable to a higher-layer protocol. These errors are considered a serious network degradation.
Packets Sent Errors - the number of outbound packets that contained errors preventing them from being
deliverable to a higher-layer protocol. These errors are considered a serious network degradation.
Collisions/sec - the rate at which outgoing ethernet packets must be re-transmitted. When this metric
exceeds 5% of packets sent/sec, this indicates a network problem or network capacity limit.
Connections Established - the number of TCP connections for which the current state is either ESTABLISHED or CLOSE-WAIT. This metric is expected to increase proportionally to the load applied to the system.
Connection Failures - the number of times TCP connections have gone from SYN-SENT or SYN-RCVD to
CLOSED.
TCP Segments Retransmitted - the number of TCP segments which were previously transmitted, but had to
be retransmitted again.
External Evaluation
Developers or advanced users who need to see sources that these metrics are measured from should refer
to the Locating Server Metric Counters section.
Monitoring Through A Firewall
...and other network configuration options
In many cases, the agent and controller will be able to immediately connect to one another, and will even
automatically detect one another if they are both connected to the same local LAN. This section outlines the
configuration options available for the agent, should an error be received while attempting to connect to it.
In order for the controller to connect to an agent, the agent will need to be able to accept connections from
the controller on at least one network interface. The IP address and port number used to accept connections
may be controlled by using a plain text editor to edit the file "system.properties" (creating it if it does not
exist), located in the directory where the agent was installed. The following lines may be added:
RmiAgentAddress=192.168.1.62
RmiRegistryPort=1099
RmiAgentPort=1100
These values have the following effect:
RmiAgentAddress
Controls which local IP address the agent will accept incoming connections on. If set, the agent will
accept connections from the controller only on the specified IP address. By default, the agent will
accept connections through any of it's available IP addresses. However, setting this field may eliminate connection problems; particularly if the agent has IP addresses from different protocols such as
IPv4 and IPv6.
RmiRegistryPort
Controls which port the agent will accept incoming connections from. If this field is omitted, it will
default to using port 1099.
RmiAgentPort
Controls which port the agent will use to communicate information with the controller once connected.
If this field is omitted, it will default to using any available port.
Additionally, it may be necessary to specify the public IP address from which the agent will be accessed,
especially if that IP address is assigned to a NAT or firewall device other than the server itself. This may be
specified by editing the file "Server Monitor Agent.lax", and adding the option:-Djava.rmi.server.hostname=site.mycompany.com to the end of the "lax.nl.java.option.additional" entry in the file.
For example:
lax.nl.java.option.additional=-Djava.library.path=lib32 -Djava.rmi.server.hostname=site.mycompany.com
If the "lax.nl.java.option.additional" entry does not already exist, it may be added to the end of the .lax file,
along with a blank new line after the entry at the end of the file.
Once all of the settings have been entered and saved into the appropriate files, the agent may be restarted
in order to pick up the correct settings.
Stand-alone operation
Some network environments may restrict the access of a server, making it unavailable for automated control
by Web Performance Load Tester to collect data during a Load Test. In such scenarios, it is still possible to
collect performance data from your server by using the Advanced Server Analysis Agent to collect a log file,
which may be integrated with a load test. Running the Server Agent in this scenario involves the following
steps:
1. Install Web Performance Advanced Server Analysis Agent on your server(s).
2. Install a license for advanced data collection on the agent
3. Begin data collection to a log file on each server
4. Run a load test using Web Performance Load Tester
5. Stop data collection on each server, and move the log files to a location accessible by the Load Tester
workstation
6. Integrate performance logs from each server into the recorded load test results
7. Re-open the load test report to review the newly integrated data
Manually Installing a License on the Agent
Unless otherwise specified, server licenses on the agent will require activation with Web Performance's activation server. Your license can be automatically activated if your server is capable of connecting to Web Performance's server. If your server cannot reach the public internet, or if it requires a proxy configuration that
cannot be automatically detected by the agent, then you will need to perform an offline license activation.
Automatic License Activation
1. Copy the .license file to your server
2. From the Server Agent command line, enter the command
license import <filename>
replacing <filename> with the full file name of the copied .license file. It may be necessary to enclose
the file name in quotes (") if there are spaces in the file's name. The agent will display the text "Please
wait while license XYZ is activated...". Your license will be automatically activated. If the activation
fails, proceed to step #3 of Offline License Activation.
Offline License Activation
1. Copy the .license file to your server
2. From the Server Agent command line, enter the command
license import --activate=false <filename>
replacing <filename> with the full file name of the copied .license file. It may be necessary to enclose
the file name in quotes (") if there are spaces in the file's name.
3. Enter the command
license activate --offline --file <filename.bin> <serial key>
replacing <filename.bin> with the file name to save the activation request to (usually a .bin file). The
<serial key> should be replaced by the serial key of the license, displayed after the license was
imported.
4. Copy the .bin file to a workstation with internet access
5. Using an internet connected workstation, navigate to http://www.webperformanceinc.com/activate/
6. In the "License Key Activation" section, select the activation request file generated by the server agent,
and select "Activate License Key"
7. The server will return a newly activated .license file. Copy this file to your server.
8. From the Server Agent command line, enter the command
license import <filename>
replacing <filename> with the full file name of the copied .license file returned by step #7.
Beginning Manual Data Collection with the Agent
Data collection may be started on the Server Agent by entering the command
start-log --sample-period <period>
replacing <period> with the same sample period set in Load Tester for your test.
The Server Agent will then begin data collection, and display a message indicating the location of the performance log file.
Before beginning data collection and your load test, it is recommended that the following settings be verified:
l The sample period used by the agent should be the same as the sample period set in Load Tester for
the load test.
l The system clock on both the server and Load Tester workstation should have the correct time, date,
and time zone.
Stopping Data Collection
To stop collection of performance data, from the Server Agent command prompt, enter the command
stop-log
Next, note the location of the performance log file, and copy this file to the workstation running Load Tester.
Importing Performance Logs into a Load Test
Once the performance logs have been stopped and moved from the server to the Load Tester workstation,
they may be integrated with a completed load test result. To import server logs, right click on the test results,
and select Import → Advanced Server Analysis Agent Log…
Next, select the .dat file to import
.
Here, press Finish to accept the default merge configuration, or press Next for more options.
On the last page of the wizard, you may update the name of your server, as it will appear in the load test
report.
The "Log file Lead Time" may be adjusted to reflect how far in advance the log file was started prior to the
test. It is recommended that this number be divisible by the sample period, for best correlation with measured load test results. Normally, this value will not need to be modified, unless the system clock for the workstation running Load Tester, or the Server Agent was set incorrectly.
Server Agent Commands
When running the Server Agent, the following commands are supported:
Frequently Used Commands
quit
Terminates the Server Monitoring Agent, making it unavailable for further data collection
License Management
Licenses are normally managed by the Load Tester GUI. However, some license management commands
are supplied for servers which are restricted from being managed by another workstation running Load
Tester on the network.
For more information on License management, see:
l License Activation
l Manually Installing a License on the Server Agent
license list
Lists all installed licenses
license import --activate=[true|false] <filename>
Imports and installs a license file. If --activate is true, then the license will be automatically activated if it
is not already activated
license activate (--file=<filename>) (--offline) <serial key>
Activates an installed license. If --file or --offline is specified, an activation request file will be generated
for offline activation, which may be moved to a workstation with internet access. Otherwise, the license
<serial key> will be activated online.
license deactivate --file=<filename> (--offline) <serial key>
Deactivates an installed license. If --offline is specified, this will create a file, specified by --file, containing the license deactivation request, which may be moved to a workstation with internet access to
complete the deactivation. Otherwise, this file will deactivate the license online, and save the deactivated license file at the location specified by --file, which may then be moved to a new server.
Performance Logging
These commands are used on the agent to create performance logs in parallel with a load test, but when
Load Tester is unable to connect to the agent to coordinate test collection automatically. See Monitoring
Through A Firewall.
start-log --sample-period=<period> (--name=<name>)
Starts creating a new performance log, which may be imported later into a completed load test result.
The --sample-period parameter sets the sample period at which data is collected by teh agent, and
should be the same as the sample period used in the load test. Use --name to specify a name for the
test results, to assist in identifying log files.
stop-log (--force)
Closes a performance log being collected, and turns off monitoring until a new test or log is started.
Use --force to terminate a log even if it was started remotely by load tester; this is generally only used if
the network connection is no longer usable for Load Tester to stop the log automatically.
Other Commands
commands
Lists all command names recognized by the agent
counters
Refreshes the list of performance counters that the agent is configured to collect
Locating Server Metric Counters
In some scenarios, it may be necessary to monitor server metrics outside of the Advanced Server Monitoring
Agent. Many of these metrics can be replicated by following the reference table below.
For a description of the various metrics collected, please see the Server Metrics section.
Windows
Most performance counters for Windows machines are also available to developers using Perfmon.
Counter Name
Processor Counters
CPU %
Context switches/sec
Process Queue Length
Memory Counters
Memory %
Page reads/sec
Page Writes/sec
Cache Memory Allocation
Disk Counters
% I/O Time Utilized
Service time
Queue Length
Reads/sec
Writes/sec
Perfmon Counter Path
\Processor(_Total)\% Processor Time
\System\Context Switches/sec
\System\Processor Queue Length
\Memory\% Commited Bytes In Use
\Memory\Page Reads/sec
\Memory\Page Writes/sec
\Memory\Cache Bytes
\PhysicalDisk(_Total)\% Idle Time
(Calculation taken as 100 - counter value)
\PhysicalDisk(_Total)\Avg. Disk sec/Transfer
\PhysicalDisk(_Total)\Current Disk Queue Length
\PhysicalDisk(_Total)\Disk Reads/sec
\PhysicalDisk(_Total)\Disk Writes/sec
Network Counters
Note: for values coming from a Network Interface, the Server Monitoring Agent will record the sum of all instances, excluding the
local loop-back interface.
Packets Received/sec
\Network Interface(interface name)\Packets Received/sec
Packets Sent/sec
\Network Interface(interface name)\Packets Sent/sec
Bytes received/sec
\Network Interface(interface name)\Bytes Received/sec
Bytes sent/sec
\Network Interface(interface name)\Bytes Sent/sec
Packets Received Errors
\Network Interface(interface name)\Packets Received Errors
Packets Sent Errors
\Network Interface(interface name)\Packets Outbound Errors
Connections Established
\TCP\Connections Established
Connection Failures
\TCP\Connection Failures
TCP Segments Retransmitted
\TCP\Segments Retransmitted/sec
Linux
Performance counters for Linux are calculated by examining the following values, if available. Some
counters may be measured from multiple sources, in which case a source will be selected which appears
applicable to the current kernel.
Counter Name
Processor Counters
CPU %
File
Relevant lines, columns
/proc/stat
Context switches/sec
/proc/stat
Line: cpu
4th numeric column is idle time
Line: ctxt
Process Queue Length
/proc/stat
Line: procs_running
/proc/meminfo
/proc/meminfo
Lines: MemTotal, MemFree, Buffers, Cached
Lines: MemTotal, Cached, SwapCached
/proc/vmstat
/proc/stat
Line: pgmajfault
Line: page, Column: 1
/proc/vmstat
Memory Counters
Memory %
Cache Memory Allocation
Ratio
Major Page Faults
Page ins/sec
Page outs/sec
/proc/stat
Line: page, Column: 2
/proc/vmstat
Line:
pgpgin
Line:
pgpgout
Disk Counters
Note: Counters are measured by summing values from all physical disks, excluding logical disks
% I/O Time Utilized
/proc/partitions
Column: 14
/proc/diskstats
Average Service time
/proc/partitions
Columns: 5, 9, 13, 15
/proc/diskstats
Queue Length
Reads/sec
Writes/sec
/proc/partitions
/proc/partitions
/proc/partitions
Column: 13
/proc/diskstats
Column: 5
/proc/diskstats
Column: 9
/proc/diskstats
Column: 13
Columns:
4, 8, 12, 14
Column: 12
Column: 4
Column: 8
Network Counters
Note: for values coming from a Network Interface, the Server Monitoring Agent will record the sum of all
instances, excluding the local loop-back interface.
Packets Received/sec
/proc/net/dev
Column: 3
Packets Sent/sec
/proc/net/dev
Column: 11
Bytes received/sec
/proc/net/dev
Column: 2
Bytes sent/sec
/proc/net/dev
Column: 10
Packets Received Errors
/proc/net/dev
Column: 4
Packets Sent Errors
/proc/net/dev
Column: 12
Collisions/sec
/proc/net/dev
Column: 15
Connections Established
/proc/net/snmp
Line: Tcp, Column 9
Connection Failures
/proc/net/snmp
Line: Tcp, Column 8
TCP Segments Retrans/proc/net/snmp
Line: Tcp, Column 12
mitted
License Key Activation
Single-user license keys require activation when they are imported into the Web Performance software. This
locks the license key for use by that user on that computer.
We realize that some license key activation schemes can be more cumbersome for licensed users than they
are for software pirates. Therefore, we have attempted to make license key activation as painless as possible:
l First-time users on an Internet-connected computer will be activated automatically without any additional steps.
l Moving a license key from one computer to another requires only one additional step (de-activation)
before installing the license key on the new computer.
l
l
Users on machines that do not have an Internet connection can use a form on our website to activate
the license key - which requires a total of 3 additional steps. We estimate this will take 2 minutes to
complete. Alternatively, you can email the activation request file provided by our software to us and
we'll return an activated license key to you.
Once the license key is activated, the software does not require access to our server for future operation. Among other things, this means that our server could disappear forever and the software will still
function normally.
First-time Activation
When a license key that requires activation is installed for the first time, the wizard will ask you to choose the
activation mode: automatic or manual. If the computer does not have internet access, you will need to
choose the manual mode and follow the instructions, described later, for activating without Internet access.
When automatic mode is selected, the software will contact the Web Performance server and activate the
license key. The software is then ready to use.
Moving the License Key
When a user upgrades to a new computer, the license key will need to be moved as well. Prior to the move,
you should deactivate the license key on the currently-activated computer via the Deactivate... button on the
License Key Management preference page in our software. Then you can install the deactivated license key
on the new computer and repeat the activation process.
Note: When you deactivate a license key, you will be prompted to save the deactivated license key so that it
may be moved and reactivated on another computer. If you have misplaced that key, you may use the original deactivated license key (the key mailed to you after purchase) for activation on the new computer. However, you can NOT skip the deactivation step. If you have already lost all data from the original computer and
cannot retrieve it from a backup, you will need to contact the sales team at Web Performance for a replacement.
Activation and De-activation without Internet Access
If the computer running the software does not have access to the Internet, the activation and deactivation procedures may be performed manually via our website from another computer or via email.
To activate a license key manually, select the manual activation mode in the activation wizard. If a license
key requires activation, the wizard will appear automatically when importing the license key on the License
Key Management preference page. The wizard will give you an activation request file (or deactivation file)
that can be submitted to our website (http://webperformance.com/activate). In return, you will receive a preactivated license key that can be installed on the License Management preference page.
FAQ
Q: What happens if a second user needs to use the software on the same computer?
A: If the second user needs to use the software in addition to the first user, you should purchase an additional license. If the first user no longer needs to user the software, you can move that license key from one
user to another - by following the same procedure as moving the license key from one computer to another.
Q: What happens if I copy the activated license key to another computer?
A: At best, the software will not run. At worst, it may trigger a license revocation - preventing the license key
from working on any computer. You would need to contact support to issue a new license key.
Q: I backed up my entire OS on one computer and restored it to another. Now the software will not run. What
can I do?
A: You need to deactivate/reactivate the license key, as explained above.
Q: Does the activation process contact your server or use the Internet?
A: Yes, it contacts our server to validate that the license key has not already been activated.
Q: Does the software ever contact the server again?
A: Yes, the software will periodically verify that the license key is still valid. It is also contacted when you
deactivate the license.
Q: How does a license key get revoked?
A: When we detect that the license enforcement mechanism has been circumvented, the license key will be
revoked. We will make every attempt to contact you and/or your company to resolve the problem before this
step is taken. We hope we never have to take this step.
Q: I lost my activated license key file. Is there an easy way to reset it so that I can activate it again?
A: No. You will need to contact the sales team for a new license key. The original serial number will be
revoked and a new key must be issued under a new serial number.
Recording SSL
How it works
When browsing SSL sites your browser encrypts the information sent to the server where it is decrypted. Normally, if a proxy is used by the browser, the proxy does not encrypt/decrypt the transactions - it simply
passes the encrypted information through. In order for Analyzer to record the transactions, the internal recording proxy works differently - it decrypts/encrypts the transactions.
To make this work, Analyzer generates a "fake" certificate and presents it to the browser as the certificate for
the server. In normal situations, this is considered a security hazard -- so when the browser detects this situation, it will display a warning message stating that it cannot verify the identity of the server. This is a good
thing! If it didn't, then other programs might do what Analyzer does in order to steal your personal information.
To proceed with recording, you can simply accept the certificate and continue with the recording. This will
not adversely affect Analyzer's ability to record your session, but it might produce recordings with response
times that are significantly longer than a normal user would see (because of the time it takes you to dismiss
the warning dialog). If a site uses multiple servers (such as most large banking and e-commerce sites), the
security warning may be displayed multiple times.
How to suppress the warning messages
Analyzer generates an internal root certificate that is used to sign all of the "fake" server certificates. This
root certificate may be imported into your browser as a "trusted root certificate authority". This will allow your
browser to automatically accept the certificates that are presented by Analyzer without displaying a warning
message. Note that the internally generated root certificate is unique to your computer - this ensures that the
certificate could not be used in a server-spoofing security breach (unless the attacker had already gained
access to your computer and stolen the certificate).
To suppress the warning messages, two steps are required:
1. Export the root certificate
2. Import the root certificate into your browser
Exporting the root certificate
The root certificate may be exported in two different formats: CER or PEM. Most browsers will accept the
CER format, so try it first.
1. Start a recording
2. When the Welcome Page appears, click the test your SSL configuration link
3. Click the appropriate link to download the certificate in either CER or PEM format
4. Save the certificate somewhere you can remember (e.g. your desktop)
5. Follow the instructions for your browser on importing the certificate. We have included instructions for
a few of the most popular browsers below. If your browser is not listed here, check the documentation
for your browser.
note: the CER and PEM certificate files may be copied directly from the following folder (where <user> is your windows username) if
the download links do not work:
C:\Documents and Settings\<user>\.webperformance
Internet Explorer 6.0
1.
2.
3.
4.
5.
6.
7.
8.
Select Tools->Internet Options from the IE menu
Select the Content tab
Push the Certificates button
Select the Trusted Root Certificate Authorities tab
Push the Import... button to start the Certificate Import wizard
Push the Next button
Push the Browse... button and locate the certificate file where you saved it
Then follow the Wizard to completion
After installing the certificate, you will see it listed under the name Web Performance. The certificate will
expire in 10 years.
Firefox 1.5
1.
2.
3.
4.
5.
6.
7.
8.
Select Tools->Options from the Firefox menu
Select the Advanced icon
Select the Security tab
Push the View Certificates button
Select the Authorities tab
Push the Import button and locate the certificate file where you saved it
Select the "Trust this CA to identify web sites" option
Push the OK button
After installing the certificate, you will see it listed under the name Web Performance. The certificate will
expire in 10 years.
Manual Browser Configuration
Do you have a VPN active? If yes, be sure to perform the VPN configuration steps at the end.
Under the most common configurations, Web Performance software will automatically detect and configure
the default browser for your platform (IE on Windows, Firefox on Linux/Unix, Safari on Mac OSX). When it
does not, or the configuration is unusual, it may be necessary to configure the browser manually.
It may be possible to simply adjust the automatically detected browser settings in the Browser Settings and
Proxy Settings preference pages. Additionally, unsupported browsers may be configured using those same
preference pages. If this is not successful, then a fully manual configuration may be necessary. The following steps illustrate the process for IE and Firefox.
Step 1 - Configure recording ports
In order to manually configure the browser, Analyzer's internal recording proxy
must be configured to use fixed port numbers (it normally chooses them automatically).
1. Select the Preferences item from the Window menu
2. Select the Web Performance item in the tree on the left
3. Turn on the Manually select recording ports option
4. If a warning message is displayed beside the port numbers, than the default ports are not available you must enter different port numbers (they are automatically checked for availability)
5. Remember the selected port numbers - they need to be entered in the browser configuration later
6. Press the OK button
Step 2 - Configure the browser
The browser must now be configured to use the selected ports.
Manual configuration instructions are available for these browsers:
l Internet Explorer (6)
l Firefox (1.5) - also applies to Mozilla (1.x) and Netscape (6 and up)
For other browsers, the IE or Firefox instructions can be loosely followed, but deviations will be required
when making the changes to the browser configuration. Consult the browser documentation where required.
WARNING: these configuration changes will prohibit normal browsing when the Web Performance software
is not running. These changes will need to be reversed to resume normal browsing. Be sure to write down or
backup your settings to ensure they can be restored correctly.
Internet Explorer
l
l
l
l
l
l
l
Open the Internet Options dialog by choosing the Tools menu and selecting the Internet Options item
Push on the LAN Settings button to view the screen below
In the Proxy Server section check the "Access the Internet using a proxy server" box
Turn off the Bypass proxy server for local (Intranet) addresses option
Turn off the Automatically detect settings option
Turn off the Use automatic configuration script option
Press the Advanced... button
l
l
l
l
l
l
l
On the Proxy Settings dialog, IE must be provided with the address the analyzer is configured to listen
to, which will be listening for requests.
In the HTTP fields enter "127.0.0.1" for the address and the HTTP port number configured in Step 1 for
the port number
Under certain configurations, you may have to try substituting the machine name "localhost" for the
address "127.0.0.1"
In the Secure fields enter "127.0.0.1" for the address and the SSL port number configured in Step 1 for
the port number
Note that the Secure line may not always be the 2nd line
It is also important to clear any entries in the Do not use proxy server for addresses beginning with:
field - these could prevent the browser from using the recording proxy
press the OK button
The final step in the browser configuration is to configure the HTTP connection for the browser for a proxy
using the Advanced tab of the same Options Dialog. Make sure that the Use HTTP 1.1 through proxy connections option is turned ON.
l
l
Push the OK buttons until you return to the browser
Skip down to Step 3
Firefox
l
l
Select the Options... item from the Tools menu (for Netscape/Mozilla, select the Preferences item from
the Edit menu)
Select the General section icon at the top and Push the Connection Settings... button (for Netscape/Mozilla, select the Proxies item in the Advanced section)
l
l
l
l
l
Select the Manual proxy configuration option
Enter the data as shown in the HTTP proxy and SSL proxy fields, substituting the port numbers from
step 1
Clear the No Proxy for field
De-select the Automatic proxy configuration URL option
Push the OK buttons until you return to the browser
Recommendation - manually switching the proxy configuration can be cumbersome. A Firefox extension
called SwitchProxy makes the process much simpler - we recommend it! It is available from the Firefox
extensions page.
Step 3 - Select proxy server
Finally, if a proxy server is required to access the applications to be recorded, it must be configured in the
Proxy Settings preference page. If you do not know if a proxy is required - ask your network administrator.
When you have the necessary proxy information, use these instructions to add a new proxy configuration
and make it the default setting.
Step 4 - Test the configuration
After these configuration steps are finished, press the refresh button in your browser to retry the diagnostic
page. If the URL of the diagnostic page is no longer in the URL field, you may enter this:
http://webperformance.com/diagnostic/proxy_check.html
The browser should display a Welcome page indicating that the configuration is successful.
VPN and modem configuration
If your Windows computer is connected to the internet via an ISDN modem, phone-based modem or VPN
there is an extra configuration step that must be completed. Unfortunately the normal Windows network settings are ignored when the internet connection is made via these methods and there is a simple change that
must be made before and after using Web Performance Analyzer™.
To tell if your computer requires this extra step bring up Internet Explorer and bring up the Internet Options
Dialog. (select the Tools->Internet Options menu item). Click on the Connections tab to examine the network
configurations:
If extra configuration is needed you will see an entry in the Dial-up and Virtual Private Network settings.
Select the dial-up or VPN connection you are using and push the Settings button:
Make sure the "Use a proxy server for this connection" is checked, and then click on the Advanced button:
If you are using the default settings use the loopback address 127.0.0.1 and the port numbers as shown in
the Web Performance Preferences, in Step 1.
Load Engines
The Web Performance Load Engine is an optional component of the Web Performance Load Tester software that runs Virtual Users - thereby generating more load against the server(s) than would be possible
using only a single machine.
Installing a Load Engine
Installers for Windows and Linux are available on our website. On non-Windows machines, the application
can be installed using either the GUI or command-line interface. For example, to trigger a console installer
from the command line for a Linux machine, the following command is used:
LoadEngine_Linux_3.6.bin -i console
Starting a Load Engine
Starting a load engine is similar to starting Web Performance Load Tester. On Windows platforms, there is a
menu item labeled Load Engine in the same location as the item for starting Web Performance Load Tester.
This starts a console window. When the load engine has finished initialization, a message appears in the
console window reading Load Engine started. Entering quit in the console window stops the load engine
and closes the window.
The load engine is started on Linux and UNIX platforms using the installed shortcut or the startup script:
/usr/local/bin/WebPerformanceLoadTester_N.N/LoadEngine
Configuring a Load Engine
Network and Firewall Considerations
In many cases, the engine and controller will be able to immediately connect to one another, and will even
automatically detect one another if they are both connected to the same local LAN. This section outlines the
configuration options available for the engine, should an error be received while attempting to connect to it.
In order to connect to a Load Engine, the engine will need to be able to accept connections from the controller on at least one network interface. The IP address and port number used to accept connections may be
controlled by using a plain text editor to edit the file "system.properties" (creating it if it does not exist),
located in the directory where the engine was installed. The following lines may be added:
EngineRMIAddress=192.168.1.62
RmiRegistryPort=1099
RmiEnginePort=1100
These values have the following effect:
EngineRMIAddress
Controls which IP address the engine will accept incoming connections from. If set, the engine will
accept connections from the controller only through the specified IP address. By default, the engine
will accept connections through any of it's available IP addresses. However, setting this field may eliminate connection problems; particularly if the engine has IP addresses from different protocols such as
IPv4 and IPv6.
RmiRegistryPort
Controls which port the engine will accept incoming connections from. If this field is omitted, it will
default to using port 1099.
RmiEnginePort
Controls which port the engine will use to communicate information with the controller once connected. If this field is omitted, it will default to using any available port.
Additionally, it may be necessary to specify the public IP address from which the engine will be accessed,
especially if that IP address is assigned to a NAT or firewall device other than the engine itself. This may be
specified by editing the file "Load Engine.lax", and adding the option:-Djava.rmi.server.hostname=site.mycompany.com to the end of the "lax.nl.java.option.additional" entry in the file.
For example:
lax.nl.java.option.additional=-Djava.library.path=lib32 -Djava.rmi.server.hostname=site.mycompany.com
If the "lax.nl.java.option.additional" entry does not already exist, it may be added to the end of the .lax file,
along with a blank new line after the entry at the end of the file.
Once all of the settings have been entered and saved into the appropriate files, the engine may be restarted
in order to pick up the correct settings.
Accessing an Engine behind a Firewall
In order to access an engine behind a firewall, it may be necessary to configure the port settings used by the
engine for accessibility. The RmiRegistryPort and RmiEnginePort should be set, and the firewall should be
configured to allow connections through these ports. For more information on configuring your firewall,
please contact your network administrator.
After configuring the ports and starting the engine, the engine is ready to be added to the controller. The
Engines View may be used to add a remote engine. When prompted, the IP address should be an address
the controller can connect directly to. If your firewall uses a NAT, then this is the IP address of the firewall;
otherwise it is that of the engine itself. The port option should reflect the value of the RmiRegistryPort configured on the engine.
Memory Usage
When a Load Engine is running low on available memory, it will stop adding Virtual Users to the test. To
increase the memory allocation used by the engine, please see the section on Configuring Memory Usage.
Further Configuration
Once the controller has been able to successfully connect to a Load Engine, the engine may be managed
through the Engines View.
Advanced Configuration
Setting user levels
In some cases, it may be desirable to manually determine how many VUs will run on each engine, rather
than allowing automatic distribution. However, since overloading an engine can result in collection of load
test data that may be invalid, it would be unwise to override the distribution completely.
Each remote load engine has a configuration file (system.properties) in the installation folder. in this file,
find/add this line:
EngineUserCapacity=NN
(for the local load engine, see the Configuration Files section for the location of the system.properties file)
Change the value of NN to reflect the number of total users that is desired for this engine. Repeat this for
each engine and restart the engines. This setting will place a maximum limit on the number of users the
engine will report that it can support. Since the controller will not allocate more than the reported capacity to
each engine, manipulating these settings will allow manual selection of the distribution.
Note that the capacity of the engines will always be reported as "100" when a test is not running. Also, the
reported capacity may be lower than configured, based on the CPU and memory utilization as analyzed by
the overload prevention feature.
IP Aliasing Configuration
If a system is configured for use with multiple IP addresses, it may be necessary to select which IP
addresses should be used during a load test. These IP addresses may be specific per network adapter, or
the workstation may be specifically configured for multiple IP addresses.
Configuring the local Workstation
The IP Aliasing preference page may be accessed by selecting Window → Preferences → Web Performance → IPAliasing.
This page will display a list
of the IP addresses available on the current system,
which may be used to reach
other servers. By default,
Web Performance Load
Tester is configured to use
the default configuration,
specified by the Operating
System. However, if more
control is desired, then the
dialog can be set to "Use
Selected Interfaces", and
the checked IP addresses
will be used. If the workstation has multiple IPs,
then can be used to allow different users to originate from
different IPs on the same
workstation. Further, if some
of the IP addresses are not
appropriate for load testing (eg. a wireless connection) in the current environment, then those addresses
may be unselected.
Remote Engine Configuration
The IP Aliasing configuration may also be specified for Remote Engines. In the Engines View, simply select
an Engine that you would like to configure, and press the "Configure IPs" button. A dialog is displayed for
the Engine's current IP aliasing configuration, which apply in the same way as outlined above.
Live Load Engines
The Live Load Engine is a special version of our Load Engine software pre-packaged on a Linux-based
bootable CD. It can be downloaded in ISO format from our website and then written to a CD. Any x86-based
computer can then be booted from the CD and it will automatically run the Load Engine without installing
anything on the host computer. The hard drive in the computer is never used.
What are the advantages of this approach?
l There is no installed footprint on the machine
l The load engine is automatically configured to use all the memory available on the machine
This feature is especially useful when:
l There are no PCs available that you have authorization to install software on
l A large number of PCs is required for a large test, but not enough can be obtained on schedule or
within budget
How to use
In most cases, the only steps required are:
1. Insert the CD
2. Power on the computer
3. Wait for the engine to appear in the Engines View of Load Tester
4. Select the engine and press the "Update" button (if needed)
The engine will start with the default options - use all available memory and use DHCP to obtain a network
address.
Manual configuration
When the manual configuration option is selected, the following items may be customized:
1.
2.
3.
4.
5.
Network Interfaces - the detected network interfaces may be enabled and disabled using
IP Addresses - Set the IP address, instead of getting the address via DHCP
DNS Settings - Set the DNS servers manually, instead of getting the settings via DHCP
Hostname - Assign a hostname to the engine rather than using the automatically generated name
Engine Memory size - Assign the engine memory size instead of using the maximum available memory. This should be used when dynamic file uploads are used in a load test - because this will consume memory outside of the engine and is this information is not available when the maximum
available memory is calculated at boot time.
These configurations are performed using either command-line prompts or text-mode GUI. Several of the
configuration tools are standard Linux tools that use a combination of arrow keys, space and enter keys for
navigation and selection. If you need help using these options, please use the Support Request Form.
Load Test Metrics
Load Tester collects an extensive measurements during a load test. This data is collected in samples. Each
sample has multiple measurements associated with it. Depending on the measurement type, some measurements may not ba applicable during each sample and may therefore appear empty in some displays,
such as the Metrics View. Unless otherwise noted, the value of each measurement in a sample pertains only
to events that completed within that sample period.
Please note that metrics were formerly referred to as statistics.
While the term sample is used for our data storage units, it is important to understand that Load Tester does
not rely on sampled data as some other load-testing products do. Unlike those products, Load Tester measures the response time of every single page and transaction executed. For instance, every web page duration is measured and the page duration metrics reported reflect every page completed during the test.
Test metrics
Test metrics are collected by the Virtual Users as the testcases are executed. The data is collected at four
levels: Test Summary, Testcase, Web Page and Transaction. These levels represent narrowing scopes of
data - for example: web pages may contain many transactions and a testcase may contain many web pages.
In many cases, the higher levels are not simply aggregations of lower levels but measurements tailored specifically for each level.
Attempts - The total number of times the item was attempted during the sample period. This is a summation
of the Success and Failures metrics -- every attempt will result in either a success or failure.
Average Duration - The average duration for the item. For transactions, the measured duration starts when
the first byte of the request is sent and ends when the final byte of the response is received. If a new connection was initiated for the transaction, the connect time is included as well. For pages, the measured duration starts when the first transaction on the page begins and ends when the final transaction completes. For
testcases, the measured duration starts when the first page starts and ends when the final page completes.
Average Page Duration - The average page duration for all pages.
Average Page Wait Time - The average amount of time that users have waiting for a web page to complete.
This counts all users that are actively working on a web page at the end of the sample period. Because
page durations that are used in the min/max/avg page duration measurements are not reported until the
page completes, this measurement can be useful in determining backlog on the server as the performance
degrades.
Average Speed - The average data transfer rate of the item. For testcases, this measurement includes the
total bytes transferred for all web pages and transactions and the total duration of the testcase, including
think time but not repeat delay. For web pages, this includes the bytes transferred for all transactions and the
total duration of the page, not including think time. For transactions, this includes bytes sent and received
(the total of the size of the HTTP request and response messages) and the duration of the transaction.
Average Wait Time - The average amount of time that waiting users have been waiting for the page or URL
to complete. See definition of Waiting Users for more details.
Average TTFB - The average TTFB for the transaction. The Time To First Byte measures the time from the
beginning of the request to the beginning of the response. On large or slow transactions in some systems,
this measurement can be useful to separate the time required for the server to service a request from the
time required to transfer the response over the network.
Bytes/sec - The average rate at which data was sent and received. It represents all bytes sent/received during the sample period.
Completions - The number of times the item was completed during the sample period. For transactions, a
completion indicates that a valid HTTP response was received from the server. This does not imply that the
response was correct - only that a parse-able HTTP message was received. Not every attempt will result in
a completion, but every completion will result in either a success or failure. For testcases and web pages, a
completion indicates that all child elements (web pages and transactions) were attempted. This applies to
Testcases, Web Pages and Transactions.
Detailed Page Durations - This metric holds a list of the time and duration of each page load completed during the sample period. This metric applies only to web pages and is also available at the summary level (for
all pages). Note that the option to collect these metrics is off by default, to conserve memory. It can be enabled in the preferences (Window menu).
Errors - A list of all errors recorded during the test. This is not a numeric value -- it is a list separate from the
computed and observed metrics. Note that multiple errors could occur during the execution of a single transaction.
Failed Pages - The number of pages that failed during the sample period. This is a summation of the Failures metric for all web pages in the test.
Failures - The number of times the item failed during the sample period. A transaction may fail in many
ways - any of which will result in the recording of a failure. Some common examples of failure conditions
are: unable to connect to server, connection closed without receiving response from server, unable to write
request to server (e.g. user variable missing or dataset exhausted), validator failed (unable to find content,
unexpected status code, etc) and extractor unable to locate content. This applies to Testcases, Web Pages
and Transactions. If any transactions failed on a web page, the web page will also be recorded as a failure.
Likewise, any failure on a transaction or web page will result in the recording of a failure for the testcase.
This applies to Testcases, Web Pages and Transactions.
Hits/sec - The number of transactions completed per second. "Transactions/sec" would be more technically
accurate but is not used for two reasons: (1) hits/sec is a standard industry term and (2) the term transaction
is already applied to many other levels of interaction in business applications. Note that a completed transaction implies that there is a complete response received from the server. Therefore, transactions which are
prematurely terminated due (e.g. due to network errors) are not counted as a hit. Transactions which complete successfully but result in an error due to transaction validators are counted as a hit. Thus you can have
errors when hits/sec is zero. This measurement is reported only at the test summary level.
Maximum Duration - The highest duration for the item. See Average Duration for more details.
Maximum Page Duration - The highest page duration. See Average Page Duration for more details.
Maximum TTFB - The highest TTFB for the transaction. See Average TTFB for more details.
Minimum Duration - The lowest duration for the item. See Average Duration for more details.
Minimum Page Duration - The lowest page duration. See Average Page Duration for more details.
Minimum TTFB - The lowest TTFB for the transaction. See Average TTFB for more details.
Pages - The number of pages completed during the sample period. This is a summation of each of the Completions metric for each page in the test. Note that a completion does not imply success - only that the Virtual
User attempted every transaction in the web page.
Pages/sec - The average rate at which pages were completed.
Succeeded Pages - The number of pages that succeeded during the sample period. See the Failures metric for more details.
Successes - The number of times that the item was completed during the sample period without recording
any failures. See the Failures metric for more details. This applies to Testcases, Web Pages and Transactions.
Time - The time at which the sample period ended. This is expressed as an elapsed time since the start of
the test.
Total Pages Failed - The total number of page failures recorded up to the current sample period.
Total Size - The total number of bytes transferred for this item. Includes both request and response. Note
that the bytes transferred includes only the bytes that make up the HTTP transactions. Other bytes transferred at lower protocol levels, such as those required for TCP/IP overhead, are not included.
Users - The number of users currently being simulated. At the test summary level, this is the total number of
users in the test. At the Testcase level, this is the number of users simulating the testcase.
Waiting Users - The number of users working on a page (or URL) at the end of the sample period. Note that
working on refers to the process of requesting and receiving the contents of a page or URL. Users that are
not working on pages or URLs will either be executing think time or the repeat delay.
Load Engine metrics
Load Engine metrics are collected by the load engines in the process of monitoring its own performance.
Time - (see above)
CPU % - The total CPU utilization as reported by the OS.
Memory % - The amount of VM memory that is available. Note that the load testing and/or the load engine,
by default, is configured, by default, to use 200M of RAM. There may be more memory available. If so, see
the Configuring Memory Usage page for configuration instructions.
Users - The number of VUs running in this load engine.
Total Capacity - The estimated number of VUs that the load engine can handle. Note that this estimate is
very conservative and can be very innaccurate at low numbers. It is not unusual for a load engine to report a
total capacity of 15 VUs when 1 VU is running, 80 when 10 are running and 500 when 400 are running.
Engine Status - The state of the load engine (Idle, Initializing, Running, Stopping, Error or Off-line).
Server metrics
Server metrics are collected by the Server Agents to help assess the performance of the server OS and application servers during a load test.
Operating System
CPU % - The total CPU utilization as reported by the OS.
Memory % - The total memory utilization as reported by the OS.
Context Switches / sec - The rate at which the OS kernel switches from one thread to another.
Process Queue Length - The number of system threads in the process queue.
Page reads/sec - Rate of major memory faults resulting in page reads.
Page writes/sec - Rate at which pages are moved to disk to free space in physical memory.
Disk I/O Time % - Elapsed time during which a disk was servicing read or write requests.
Avg Disk Service Time - Average amount of time for each disk I/O transfer (ms)
Disk Queue Length - Number of queued disk operations.
Disk Reads/sec - Rate of disk read operations.
Disk Writes/sec - Rate of disk write operations.
Network bytes sent - Network outbound throughput.
Network bytes received - Network inbound throughput.
Network packets received / sec - Number of network packets received per second.
Network packets sent / sec - Number of network packets sent per second.
Network Packets Received Errors - Number of network packets received with errors.
Network Packets Sent Errors - Number of network packets sent with errors.
Network Collisions - Number of network packet transmission attempts that resulted in a collision.
TCP Connections Established - Number of open TCP connections.
TCP Connection Failures - Number of failed TCP connections.
TCP Segments Retransmitted / sec - Rate of previously transmitted TCP segments being retransmitted.
ASP.NET (Active Server Pages)
ASP.NET Active Sessions - The number of sessions active.
ASP.NET Application Restarts - Number of times the application has been restarted during the sample
period
ASP.NET Cache Entries - Total number of entries within the ASP.NET application cache (both internal and
user added)
ASP.NET Cache Hit Ratio - Ratio of hits from all ASP.NET application cache calls. Note that the Windows
counter calculates this value as a historical average since the last restart, but Load Tester does not.
ASP.NET Cache Hits - Number of hits from all ASP.NET application cache calls.
ASP.NET Cache Misses - Number of misses from all ASP.NET application cache calls.
ASP.NET Cache Turnover Rate - Number of additions and removals to the total ASP.NET application
cache per second.
ASP.NET Compilations - Number of .asax, .ascx, .ashx, .asmx, or .aspx source files dynamically compiled.
ASP.NET Current Requests - The current number of ASP.NET requests, including those that are queued,
currently executing, or waiting to be written to the client. Under the ASP.NET process model, when this
counter exceeds the requestQueueLimit defined in the processModel configuration section, ASP.NET will
begin rejecting requests.
ASP.NET Disconnected Requests - The number of requests that were disconnected due to communication failure.
ASP.NET Errors/sec - Rate of errors occurred.
ASP.NET Last Request Execution Time - The amount of time that it took to execute the most recent
ASP.NET request.
ASP.NET Pipeline Instance count - Number of active ASP.NET application pipeline instances.
ASP.NET Queued Requests - The number of ASP.NET requests waiting to be processed.
ASP.NET Rejected Requests - The number of ASP.NET requests rejected because the request queue
was full.
ASP.NET Request Wait Time - The amount of time the most recent request was waiting in the queue.
ASP.NET Requests Executing - The number of ASP.NET requests currently executing
ASP.NET Requests Not Found - The number of ASP.NET requests for resources that were not found.
ASP.NET Requests Not Authorized - Number of requests failed due to unauthorized access.
ASP.NET Requests Queue Length - The number of ASP.NET requests in the application request queue.
ASP.NET Requests Succeeded - The number of requests that executed successfully during the sample
period.
ASP.NET Requests Timed Out - The number of requests that timed out.
ASP.NET Requests/sec - The number of ASP.NET requests executed per second.
ASP.NET Sessions Timed Out - The number of sessions that have been closed due to their idle time
exceeding the AutoDisconnect parameter for the server. Shows whether the AutoDisconnect setting is helping to conserve resources.
ASP.NET Sessions Abandoned - The number of sessions that have been explicitly abandoned.
ASP.NET Unhandled Execution Errors/sec - Rate of unhandled errors.
.NET CLR (Common Language Runtime)
.NET CLR Class loader Heap Size - The current size (in bytes) of the memory committed by the class
loader across all AppDomains. (Committed memory is the physical memory for which space has been
reserved on the disk paging file.)
.NET CLR Current AppDomains - The current number of AppDomains loaded in this application. AppDomains (application domains) provide a secure and versatile unit of processing that the CLR can use to provide isolation between applications running in the same process.
.NET CLR Current Assemblies - The current number of Assemblies loaded across all AppDomains in this
application. If the Assembly is loaded as domain-neutral from multiple AppDomains then this counter is
incremented once only. Assemblies can be loaded as domain-neutral when their code can be shared by all
AppDomains or they can be loaded as domain-specific when their code is private to the AppDomain.
.NET CLR Exceptions / sec - The number of exceptions thrown per second. These include both .NET
exceptions and unmanaged exceptions that get converted into .NET exceptions e.g. null pointer reference
exception in unmanaged code would get re-thrown in managed code as a .NET System.NullReferenceException; this counter includes both handled and unhandled exceptions. Exceptions
should only occur in rare situations and not in the normal control flow of the program; this counter was
designed as an indicator of potential performance problems due to large (>100/s) rate of exceptions thrown.
.NET CLR Heap Size - The sum of four other counters; Gen 0 Heap Size; Gen 1 Heap Size; Gen 2 Heap
Size and the Large Object Heap Size. This counter indicates the current memory allocated in bytes on the
GC Heaps.
.NET CLR Generation 0 Collections - The number of times the generation 0 objects (youngest; most
recently allocated) are garbage collected during the sample period. Gen 0 GC occurs when the available
memory in generation 0 is not sufficient to satisfy an allocation request. Higher generation GCs include all
lower generation GCs. This counter is explicitly incremented when a higher generation (Gen 1 or Gen 2) GC
occurs.
.NET CLR Generation 1 Collections - The number of times the generation 1 objects are garbage collected.
Higher generation GCs include all lower generation GCs.
.NET CLR Generation 2 Collections - The number of times the generation 2 objects (older) are garbage
collected. The counter is incremented at the end of a Gen 2 GC (also called full GC).
.NET CLR Lock Contention Queue Length - The number of threads in the runtime currently waiting to
acquire a lock.
.NET CLR Lock Contention / sec - Rate at which threads in the runtime attempt to acquire a managed lock
unsuccessfully. Managed locks can be acquired in many ways; by the "lock" statement in C# or by calling
System.Monitor.Enter or by using MethodImplOptions.Synchronized custom attribute.
.NET CLR Lock Contentions - The total number of times threads in the CLR have attempted to acquire a
managed lock unsuccessfully during the sample period. Managed locks can be acquired in many ways; by
the "lock" statement in C# or by calling System.Monitor.Enter or by using MethodImplOptions.Synchronized
custom attribute.
.NET CLR Logical Thread Count - The number of current .NET thread objects in the application. A .NET
thread object is created either by new System.Threading.Thread or when an unmanaged thread enters the
managed environment. This counters maintains the count of both running and stopped threads.
.NET CLR Percent Time in GC - The percentage of elapsed time that was spent in performing a garbage
collection (GC) since the last GC cycle. This counter is usually an indicator of the work done by the Garbage
Collector on behalf of the application to collect and compact memory.
.NET CLR Physical Thread Count - The number of native OS threads created and owned by the CLR to
act as underlying threads for .NET thread objects. This does not include the threads used by the CLR in its
internal operations; it is a subset of the threads in the OS process.
.NET CLR Recognized Thread Count - Displays the number of threads that are currently recognized by
the CLR; they have a corresponding .NET thread object associated with them. These threads are not
created by the CLR; they are created outside the CLR but have since run inside the CLR at least once. Only
unique threads are tracked; threads with same thread ID re-entering the CLR or recreated after thread exit
are not counted twice.
IIS (Internet Information Server)
IIS CGI Requests/sec - The rate CGI requests are received by the Web service.
IIS Connection Attempts/sec - The rate that connections to the Web service are being attempted
IIS Current Connections - Current Connections is the current number of connections established with the
Web service.
IIS File Cache Entries - The number of entries in the File Cache.
IIS File Cache Hits - The number of successful lookups in the file cache.
IIS File Cache Hit % - The ratio of file cache hits to total cache requests. Note that the Windows counter calculates this value as a historical average since the last restart, but Load Tester does not.
IIS File Cache Misses - The number of failed lookups in the file cache.
IIS ISAPI Extension Requests/sec - The rate that ISAPI Extension requests are received by the Web service.
IIS Kernel URI Cache Entries - The number of entries in the Kernel URI Cache.
IIS Kernel URI Cache Hits - The number of successful lookups in the Kernel URI cache.
IIS Kernel URI Cache Hit % - The ratio of Kernel URI cache hits to total cache requests. Note that the Windows counter calculates this value as a historical average since the last restart, but Load Tester does not.
IIS Kernel URI Cache Misses - The number of failed lookups in the Kernel URI cache.
IIS Requests/sec - The rate HTTP requests are received by the web server.
IIS URI Cache Entries - The number of entries in the URI Cache.
IIS URI Cache Hits - The number of successful lookups in the URI cache.
IIS URI Cache Hit % - The ratio of URI cache hits to total cache requests. Note that the Windows counter calculates this value as a historical average since the last restart, but Load Tester does not.
IIS URI Cache Misses - The number of failed lookups in the URI cache.
IIS+App
These statistics represent the combined processes for IIS (inetinfo), ASP.NET (aspnet_wp) and the Application Pool Process (w3wp).
IIS+App Handle Count - The number of handles held by known web server processes.
IIS+App Private Bytes - The current size of committed memory owned by known web server processes.
IIS+App Thread Count - The current number of threads active for known web server processes.
IIS+App Virtual Bytes - The current size of virtual address space for known web server processes.
IIS+App % Processor Time - The percentage of elapsed time that threads from known webserver processes used the processor to execution instructions..
Command Line Tools
Replay a testcase
Testcases in a repository may be replayed from the command line. A command-line interface launcher (cli)
is included in the installation folder (cli.exe on Windows).
Replay command-line format:
usage: cli replay [options] repository
-t testcase to replay
-w workspace location (default is <home>/WebPerformance)
If a testcase is provided (-t option), only that testcase will be replayed. If omitted, all testcases in the repository will be replayed. After completion of the last replay, the repository will be saved.
Return codes:
0-N - The number of errors encountered during the replays.
-1 - Illegal arguments provided
-2 - Software error occurred (send cli.log to Web Performance Support)
Support Request
The Support Request is used to send a question or issue to the Web Performance Support team, or attach
files to an existing issue.
The Support Request Form is available
from the Support Request item on the Help
menu.
On the first page of the support wizard, you choose to create a new issue or attach files to an existing
request. If attaching files to an existing issue, use the exact number received in the e-mail when the issue
was created (e.g. WPA-111 or WPL-222). Once an e-mail address is entered, you may proceed to describing the issue and attaching files to the support request.
If an error occurs while sending the request, please visit our website and manually submit the form as
described in the next section
Manual support request submission
Support request can be submitted on the Support Section of our website. You must create an account in
order to submit a request. Once you have an account, login and select the Create New Issue item at the top
of the screen. Fill in the required fields and select the Create to finish the request. When submitting the
request, please update the Description to include either:
l The information from the support wizard if the tool failed to send the support request.
l The information from the Diagnostics Preference page:
Managing software updates
Retrieving patch updates
For service (patch) updates, the update manager is used to find and install the new software. To view and
install patches available, follow these steps:
1. From the Help menu, select Software Updates...
2. Select the Search for updates...
item and then press Finish
3. If there are service updates available for your software, the results are
displayed (as shown). To install the
update, make sure the version is
checked then follow the wizard instructions.
Note that all file downloads are performed in the background and there is
no status displayed. You may continue to work in the product until the
download has completed and the
update wizard re-appears.
4. Follow the instructions on the next
few wizard pages to complete the
installation.
Configuring Updates to upgrade to new minor versions
By default, the software only downloads patches. This prevents accidental upgrades to a version of the software for which the installed license is not valid. Once this happens, a re-install is required to get back to the
previous version.
It is recommended that this option only be turned on when a minor upgrade is desired and then turned back
off.
A new license is required with minor version upgrades. If you have not requested a new license and wish to
upgrade your software, see our licensing information web page before continuing.
To enable the update manager to also find/install minor upgrades (e.g. 3.0 -> 3.1), follow these steps:
1. Open the preference manager from the menu: Window->Preferences
2. Select the Install/Update
category
3. In the Valid Updates section, select compatible.
Once the update manager has been configured, follow the procedure described under Retrieving patch
updates to view and install minor version updates. After installation of the new software, install the new
license (see License Management for detailed instructions).
Updating from a new Update Site
If you have been instructed to download a new version of the software from a new update site, the update
manager is used to configure the application to use the new site in the search for software changes.
1. From the Eclipse Help menu, select Software
Updates...
2. Select Search for new features to install and
click Next
3. Select New Remote Site...
4. Enter "Web Performance Load Tester" for the
Name and
the new update site for the URL
Select OK
Select Finish
Workspace
The Workspace is the area on your computers disk where Analyzer stores settings, preferences and repositories (by default). The default location for the workspace is a new folder (named WebPerformance) in the
user home folder. On Windows systems, this is usually in "C:\Documents and Settings\<username>".
Changing the workspace location
The workspace can be moved to any location that can be accessed by the program, including network
mounted drives. After moving the workspace, Analyzer will need to know where to find the workspace. In the
installation folder (by default on Windows is "C:\Program Files\Web Performance Load Tester <version>")
there is a subfolder named config. In this folder there is a file named config.ini. Edit this file in a plain-text
editor (e.g. notepad) and look for a line starting with "osgi.instance.area=".
It should look like:
# set the workspace location
osgi.instance.area=@noDefault
#osgi.instance.area=workspace
#[email protected]/WPWorkspaceNN
#osgi.instance.area=C:\\Temp\\WPWorkspace
There are a number of options for this setting.
1. @noDefault - this allows Analyzer to choose automatically - it will use the folder described above by
default.
2. workspace - simply entering a folder name will cause Analyzer to create a subfolder with the chosen
name under Analyzer's installation folder. In this example it would result in "C:\Program Files\WPLoadTesterNN\workspace"
3. @user.home/WPWorkspaceNN - this will cause Analyzer to use a folder inside the user home folder
with the specified name. In this example it would result in "C:\Documents and Settings\<username>\WPWorkspaceNN".
4. The last option is to specify a fully qualified path to the folder where the workspace has been moved
to. Note that on Windows systems, the backslash (\) characters must be doubled since the backslash
is the escape character for this configuration file.
Configuring Memory Usage
If you receive an out of memory error, try the following to reduce memory usage:
l Close unused repositories.
l Delete unneeded testcases from open repositories.
l Close unused editors.
l Delete unneeded replays from testcases.
l Close unused views.
l In the Status View, select the Garbage Collection icon.
l Run the Repository Cleanup Wizard
l Change the Load Test Settings to disable collection of URL Metrics when running a Load Test
l Check your operating system to see if there are any background processes taking up memory.
l Try increasing the memory available to Web Performance Load Tester (See below).
Increasing Memory Usage
Web Performance Load Tester
The default setting for the maximum amount of memory allocated to Web Performance Load Tester is
200MB (the default). The program will encounter errors if this limit is reached. To increase this value, use the
following steps:
1. Locate the file "webperformance.ini" in the directory where you installed the program.
2. Create a backup copy of the file.
3. Edit the file with a plain-text editor and locate the lines:
-Xms200m
-Xmx200m
4. Change the "200" in each line to the desired amount (in MB) of memory to use, and save the file.
The values are the initial and maximum amount of memory that Web Performance Load Tester is allowed to
use. You may increase it up to the maximum value of free memory you have available on your computer.
Load Engine
When running a load test, it may also be necessary to increase the memory allocated by each remote Load
Engine used by the test controller. By default, the engines are configured to use 200 MB. As this limit is
reached, the engine will become unable to simulate additional virtual users. To increase this value:
1. Locate the file "Load Engine.lax" in the directory where you installed the program.
2. Create a backup copy of the file.
3. Edit the file with a plain-text editor and locate the lines:
lax.nl.java.option.java.heap.size.initial=200M
lax.nl.java.option.java.heap.size.max=200M
4. Change the "200" in each line to the desired amount (in MB) of memory to use, and save the file.
The values are the initial and maximum amount of memory that Web Performance Load Tester is allowed to
use. You may increase it up to the maximum value of free memory you have available on your computer.
User Identity Wizard
The User Identity Wizard is used to specify the type(s) of authentication used in the testcase:
The User Identity Wizard must be run before replaying a testcase either alone or as part of a load test, to
ensure that the application data is appropriately configured. Attempting to replay or run a loadtest with a testcase where the user identity has not been configured causes the wizard to be displayed in order to obtain
the information. The wizard may also be run at any time to change the user identity used in the testcase by:
l
l
Selecting the Configure->User Identity item from the pop-up menu in the Navigator
Selecting the Configure->User Identity option in the Edit menu
l
Selecting the User Identity option from the Configuration button on the toolbar
Authentication Using Forms
The most common technique for authentication is to present the user with an HTTP form asking for a username and password. When the user submits the form, a back-end process is queried to authenticate that
username/password combination. This process is captured by Web Performance Load Tester during recording so that you can control the replacement of the original username and password and have each virtual
user login using a different username. The typical form-based login page has a username, password, and
submit button, and is used an example of configuring this type of authentication. To configure Web Form
authentication, select Authentication via a Web Page Form.
Clicking Next brings up the web-form specific section of the wizard:
The next choice is to choose keeping the same username and password for each virtual user (the same
identity used during recording) or giving each virtual user a separate username and password. Choosing the
same identity doesn't actually modify the testcase, and configuration is complete if that is the selected
option.
Choosing a unique identity followed by the Next button shows the next wizard page.
This step is to help Web Performance Load Tester find the location of the login page for your web application. Enter the same username and password used during recording, select Next, and Web Performance
Load Tester finds the exact location and technique for logging into the application.
The next options are to choose an already imported set of usernames and passwords, or to configure the
testcase to use a set of usernames and passwords that are imported later. If usernames and passwords
have not been entered into Web Performance Load Tester, select the enter usernames and passwords
option. Selecting enter usernames and passwords creates a dataset called "users" with a separate field for
username and password.
The usernames and passwords can be entered directly in this dialog at this time, modified using the Dataset
Editor at a later time, or added by importing a dataset at a later time. For more information on importing a
dataset, see Importing Usernames and Passwords.
Manually Configuring Form-based Usernames and Passwords
Although the User Identity Wizard works for almost all cases, sometimes the user needs to manually configure a testcase for web form authorization. The first step is to examine the recorded testcase and find the
fields where the authentication form is submitted. For complex applications, it helps to determine the field
names ahead-of-time, possibly from the application developers.
Select the Fields View and find the fields containing the username and password:
In order to allow each virtual user to use different data for the Username and Password parameters, the user
needs to specify where this data comes from (each field requires this configuration). To edit the Username
parameter, double click on the Modifiers column (shown as M?) in the row containing Username. This opens
a dialog to configure the replacement.
Next, configure the parameter replacement by selecting the Dataset value: option. Then select the Dataset
and Field that were imported/created in previous steps.
Basic Authentication
Basic authentication is described by RFC2617, and was part of the original Mosaic browser. When a user
tries to access a web page controlled by basic authentication, a dialog is presented where the user types in
a username and password. The username and password are then sent from the browser to the web server
in each HTTP request, which is captured by Web Performance Load Tester.
When the User Identity Wizard is run for a testcase that contains basic authentication, the wizard automatically selects the Basic Authentication option. This option is only be checked if basic authentication has
been detected, and the option can be turned off, which leaves the basic authentication HTTP transactions
untouched.
After selecting the Next button, the wizard progresses very much the same as in the Web Page Form case.
Choosing the same identity leaves the recorded usernames and passwords intact, while choosing a unique
identity configures the testcase so that each virtual user has a separate username and password.
The next step is to choose an existing dataset, or to have a special dataset created. If a new dataset is
created, the dataset is called users with a single field id. If a previous dataset users exists, the wizard
created datasets are called users1, users2, etc.
The usernames and passwords can be entered directly in this dialog at this time, modified using the Dataset
Editor at a later time, or added by importing a dataset at a later time. For more information on importing a
dataset, see Importing Usernames and Passwords.
Client Certificates
In corporate environments it is common to use client certificates to control access to a web site. Those who
need to access the web site are given a client certificate, and the web server uses that certificate to identify
the user. There are a variety of different ways to use client certificates:
l
Only users with certificates can access the web site at all
l
The client certificate can be used instead of a username and password
l
The client certificate can be used in conjunction with a username and password
The client certificate support in Web Performance Load Tester is designed to work with any possible configuration. See the Client Certificates manual page for more information.
Windows Authentication (NTLM)
Also known as NTLM, this type of authentication is available when using the Internet Explorer browser from
a Windows computer to connect to the IIS web server. When a user tries to access a protected web page for
the first time, they are presented with a dialog, and asked to give a username and password for a Windows
account on the web server.
When the User Identity Wizard is run for a testcase that contains NTLM authentication, the wizard automatically selects the NTLM Authentication option.
The rest of the wizard sequence is exactly the same as in the case of web form authentication. Selecting
Next allows the user to choose keeping the same username and password for each virtual user (the same
identity used during recording), or giving each virtual user a separate username and password. Choosing
the same identity doesn't actually modify the testcase. Choosing a unique identity followed by the Next button shows the next wizard page.
The next options are to choose an already imported set of usernames and passwords, or to configure the
testcase to use a set of usernames and passwords that are imported later.
If usernames and passwords have not been entered into Web Performance Load Tester, select the enter
usernames and passwords option. Selecting enter usernames and passwords creates a dataset called
"users" with fields for domain, username and password.
The usernames and passwords can be entered directly in this dialog at this time, modified using the Dataset
Editor at a later time, or added by importing a dataset at a later time. For more information on importing a
dataset, see Importing Usernames and Passwords.
Importing Usernames and Passwords
In order for each virtual user to have a username and password, the web application must be configured
with at least as many users that are simulated at one time, and then the usernames and passwords must be
imported into Web Performance Load Tester. This procedure is different on each type of web server and different between applications as well. Please consult your web server documentation for details. There is a
tutorial available for Apache, and Windows available for IIS.
There should be at least as many usernames as the number of virtual users simulated at one time. After the
username/passwords are created in the web application, create a text file containing each username/password pair.
Web Performance Load Tester can import a number of different formats. The default is a CSV file (comma
separated variables) - we recommend entering one username and password on each line, separated by a
comma character (,). If you expect to have commas in your usernames or passwords, you can use another
separator character, such as a tab. You may (optionally) specify names for each column. Here is an example
showing 4 username/password pairs (separated by commas) with titles for the columns. Note that the file
must be saved as a raw text file in order to be imported - word-processing formats (e.g. .doc, .wri) cannot
be imported.
To import this username/password file, select the Import item from the Navigator View's menu when an item
in the Dataset folder is selected. You should see a screen similar to the one shown below. Open the file
selection dialog using the button next to the Import from file field.
In our example, we changed the name of the Dataset (top field) to users which is the name of the dataset
created by the User Identity Wizard. We also elected to use the first row as column names. After pressing the
OK button, the Dataset Editor is opened and additional configuration options are available.
Repository Cleanup Wizard
The Repository Cleanup Wizard will guide you through cleaning up excessive data from your repository.
This allows for reduced memory utilization by the application, and also provides a way to archive old information.
To start the wizard, right click on your repository in the Navigator View, select the Tools menu, and select
Cleanup.
First, the wizard will need to know where to backup the existing data. It is recommended that this step not be
skipped, since it is possible to accidentally remove some information without recognizing it's importance.
On the next screen, the wizard will prompt you for what information you would like to remove. This includes
the following options:
Testcases not configured in a load Profile: any testcases you have recorded or created, which are not
configured to run in a load test
Replays: replays of your testcases which have been run in the past
Response Content: the content of each URL in your testcase. Removing content prevents the Content
View, and many testcase configuration options from operating normally. Only testcases which have already
been configured for replay will be available in this list.
Unused Datasets: Datasets which are not referenced by any remaining testcases
Loadtest Results: Results from your previous load tests
Configuration Files
There are some aspects of Web Performance Load Tester which may only be customized by creating or editing custom configuration files. For most users, these settings will not need to be altered manually, unless
directed by Web Performance personnel, or required by another procedure outlined in the user manual.
Locating Configuration Files
Configuration files are generally stored in your Workspace directory. If a suitable file is not located, a default
may be selected from the application's installation directory.
Type
Default Location
Custom ConC:\Documents and setfiguration Files
tings\<username>\WebPerformance\.metadata\.plugins\com.webperformanceinc.util
Default ConC:\Program Files\Web Performance Load Tester <verfiguration Files
sion>\plugins\com.webperformanceinc.util_<version>\config
Please note that the directory "C:\Program Files\Web Performance Load Tester <version>" will be different if
you selected to install the application at another location.
Tip: When customizing a configuration file manually, it may be useful to check the application's default config file directory. If a file is found with the same name, it can be copied into the custom configuration file directory before editing it. The edited file will take precedence over the default version, which may be safely
maintained (un-edited) as a backup.
Glossary of Terms
Page Duration - The total time to complete all the transactions for a web page. This time starts when a connection for the first transaction is initiated and ends when the response for the final transaction is completed.
The page duration does not include the think time after the page is completed.
Repeat delay - the delay between the time when a VU finishes a testcase and begins the next.
Sample - A set of data collected during a specific time period.
Sample period - the length of time during which a sample was measured.
Testcase - A series of web (HTTP) transactions between a client and one or more servers. A testcase is
usually created by recording the interactions between a browser and the servers. The testcase is represented as a series of pages; each page can contain one or more transactions.
Testcase Elapsed Time - the total time to perform all the pages in the test case and the intervening periods
of think time. This will usually be much larger than the sum of all the Page Durations in the testcase, due to
the addition of the think times.
Think Time - The time delay between the end of one page and the start of the next. The name reflects that
this time delay represents the time the user spends reading, entering data or thinking about the last page
received.
Transaction - A pair of HTTP messages (request and response) between a client (e.g. browse) and a server.
Virtual User - A simulation of a real user using a browser (or other web application) to interact with a server
Troubleshooting Guide
Recording Configuration Troubleshooting Guide
Getting Started
If you are reading this page, then you have attempted to record your website but were unsuccessful. Rest
assured, Analyzer™ is compatible with every network configuration we have encountered. However,
Analyzer™ is not always able to automatically configure the workstation correctly and must occasionally be
configured manually. The remainder of this section will guide you through the process of determining what
settings are correct for your particular network configuration.
Which of the following best describes the problem you are experiencing?
l The Recording Configuration Wizard appears. After entering in the URL of the site to be recorded, the
wizard indicates that it was unsuccessful connecting to the site and requires a manual configuration.
l
A Web Browser is launched, but indicates "Proxy configuration failed" or displays a similar error page.
l
A Web Browser is launched, and displays a message stating that
The Analyzer™ module of the Web Performance Load Tester™ is now successfully recording your test case.
However, when attempting to connect to the desired site, an error message is displayed, or nothing is
displayed.