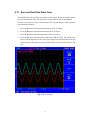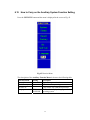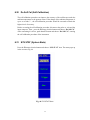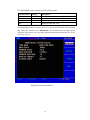
1
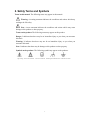
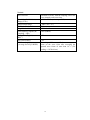
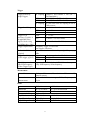
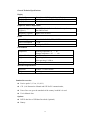
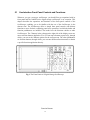
User Manual Portable Colour Digital Storage Oscilloscope 36025D www.aplab.com 1 Portable Colour Digital Storage Oscilloscope Model 36025D 2 WARRANTY Aplab warrants that all products manufactured by Aplab conform to published Aplab specifications and are free from defects in materials and workmanship for a period of one year from the date of despatch when used under normal operating conditions and within the service conditions for which they were furnished. The obligation of Aplab arising from a Warranty claim shall be limited to repairing, or at its option, replacing without charge, any product which in Aplab's sole opinion proves to be defective within the scope of the Warranty. Aplab must be notified in writing of the defect or nonconformity within the Warranty period and the affected product returned to Aplab’s factory or to an authorized service center within (30) days after discovery of such defect or nonconformity. For products warranties requiring return to Aplab, products must be returned to a service facility designated by Aplab. Aplab shall have no responsibility hereunder for any defect or damage caused by improper storage, improper installation, unauthorized modification, neglect, inadequate maintenance, accident or for any product which has been repaired or altered by anyone other than Aplab or its authorized representative and not in accordance with instructions furnished by Aplab. EXCLUSION OF OTHER WARRANTIES The Warranty described above is Buyer’s sole and exclusive remedy and no other warranty, whether written or oral, is expressed or implied. Aplab specifically desclaims the implied warranties of merchantability and fitness for a particular purpose. No statement, representation, agreement, or understanding, oral or written, made by an agent, distributor, representative, or employee of Aplab, which is not contained in the foregoing Warranty will be binding upon Aplab, unless made in writing and executed by an authorized Aplab employee. Under no circumstances shall Aplab be liable for any direct, indirect, special, incidental, or consequential damages, expenses, losses, or delays (including loss of profits) based on contract, tort, or any legal theory. 3 Table of Contents 1. General Safety Requirements............................................................................ 6 2. Safety Terms and Symbols................................................................................. 7 3. General Features of the 36025D Color Digital Storage Oscilloscope............. 8 4. Technical Specifications ..................................................................................... 9 5. Getting Started.................................................................................................. 13 5.1 User Interface Front Panel Controls and Functions ........................................... 14 5.2 General Inspection.............................................................................................. 18 5.3 Function Inspection ............................................................................................ 19 5.4 Probe Compensation ......................................................................................... 21 5.5 Setting the Probe Attenuation Coefficient .......................................................... 22 5.6 Probe Safety........................................................................................................ 23 5.7 Auto-calibration.................................................................................................. 24 5.8 Vertical System................................................................................................... 25 5.9 Horizontal System .............................................................................................. 26 5.10 Trigger System ................................................................................................... 27 6. Operation........................................................................................................... 28 6.1 Vertical System................................................................................................... 29 6.2 MATH Function.................................................................................................. 35 6.3 Application of VERTICAL POSITION and VOLTS/DIV Controls ................ 36 6.4 Horizontal System .............................................................................................. 37 6.5 Main Time Base.................................................................................................. 38 6.6 Window Setting .................................................................................................. 39 6.7 Window Expansion............................................................................................. 40 6.8 Trigger System ................................................................................................... 41 6.9 Trigger Control ................................................................................................... 42 6.10 Edge Trigger ....................................................................................................... 42 6.11 Video Trigger...................................................................................................... 45 6.12 Function Menu.................................................................................................... 48 6.13 Sampling Setup................................................................................................... 48 6.14 Display System................................................................................................... 51 6.15 Persistence .......................................................................................................... 54 4 6.16 XY Format .......................................................................................................... 54 6.17 How to Save and Recall a Wave Form ............................................................... 56 6.18 Save and Recall the Wave Form......................................................................... 57 6.19 How to Carry on the Auxiliary System Function Setting................................... 58 6.20 Do Self Cal (Self-Calibration)............................................................................ 59 6.21 SYS STAT (System State) .................................................................................. 59 6.22 How to Conduct the Automatic Measurement ................................................... 61 6.23 Measure .............................................................................................................. 61 6.24 How to Carry on the Cursor Measurement......................................................... 63 6.25 Cursor Measurement .......................................................................................... 64 6.26 Execution Controls ............................................................................................. 66 6.27 AUTOSET .......................................................................................................... 66 7. Maintenance, Cleaning and Repairing ........................................................... 67 8. Fault Diagnosis.................................................................................................. 68 9. Battery Using Guide ......................................................................................... 69 10. Aplab Sales & Service Centres ........................................................................ 70 5 1. General Safety Requirements & precautions Before Connecting to the Power Mains, please read following safety precautions to avoid any possible body injury and to prevent this product or any other products connected from damage. In order to avoid any contingent danger, this product is only used within the range specified. Only the qualified technicians can carry out the servicing and the maintenance. Prevent the Fire or Body Injury. Use the proper power line. Only use the power cord specially provided for this product or that has been approved to be used. Connect or Disconnect Correctly. When the probe or testing wire is connected to the power lead, please do not connect and disconnect the probe or testing wire freely. Product Grounding. This product is grounded through the power lead grounding conductor. In order to prevent any electric shocking, the grounding conductor must be connected to the ground. Please ensure that this product has been already grounded correctly before any connection with its input or output terminal. Connect the probe correctly. The grounding end of the probe corresponds to the grounding phase. Please don't connect the grounding end to the positive phase. Pay attention to the limiting values of all terminals. In order to prevent any fire or electric shock risks, please pay attention to all the limiting values and marks of this product. Before any connections for this product, please read the user's manual of this product to understand the information about the rated values . Do not make any operations without the instrument cover installed. If the cover or panel has already been removed, please don't operate this product. Use the proper fuse. Only the fuse complying with the specified type and nominal value for this product can be used. Avoid touching any exposed circuit. When the product is on power, please don't touch the uncovered contacts and parts. Please don't make any operations when you have observed an uncertain fault. In case of any damage to this product observed, please contact the qualified maintenance personnel for check up. Operate in a good ventilated atmospheric condition. Please read carefully the detailed installation instructions in the user's manual so that this product can be used correctly. Always operate it in a good ventilated atmosphere. Please do not make any operations in a moist environment. Please do not make any operations in an explosive environment . Keep the products surface clean and dry. 6 2. Safety Terms and Symbols Terms in this manual. The following terms may appear in this manual: Warning. A warning statement indicates the conditions and actions which may endanger the life safety. Note. A note statement indicates the conditions and actions which may cause damage to this product or other property. Terms on the product. The following terms may appear on this product: Danger: It indicates that there may be an immediate injury to you when you encounter this mark. Warning: It indicates that there may not be an immediate injury to you when you encounter this mark. Note: It indicates that there may be damage to this product or other property. Symbols on the products. The following symbol may appear on the products: High Voltage Please refer the Manual. Protective Ground End 7 Grounding End for Measurement Earth End on the Shell 3. General Features of the 36025D Color Digital Storage Oscilloscope The bandwidth of 25MHz for each Channel Record length of 6,000 points for each channel Sampling rates of 100MS/s for each channel Read-out with the cursors Five automatic measurement functions Color liquid crystal display (LCD) of high resolution and high contrast with adjustable back light Storage and Recall of waveforms Automatic setting function, capable of fast setting MATH function for multiple-waveform calculation Detection of the average and peak values of the waveform Digital real-time Sampling oscilloscope; Edge and video triggering function; Built-in RS232 and USB communication ports; User friendly with English language. Built-in Li-ion rechargeable battery charger. Battery Operation. 8 4. Technical Specifications Only if the oscilloscope fulfill the following two conditions at first, can these specification standards be reached. This instrument should run for more than 30 minutes continuously under the specified operating temperature. If the change range of the operating temperature is up to or exceeds 5 , open the system function menu and execute the “Auto-calibration” procedure. All specification standards can be fulfilled, except one(s) marked with the word “Typical”. Sampling ACQU Mode Sampling Rate Sample Peak Detection Average 100 MS/s Input Input Coupling Input Impedance Probe attenuation coefficient Max. Input Voltage DC, AC 1MΩ± 2%, connected with 20pF± 3pF in parallel 1X, 10X, 100X, 1000X 300V, Peak Value Level Sampling Rate Range Waveform interpolation Record Length Scanning Speed Range (S/div ) Accuracy of Sampling Rate and Delay Time Measuring Accuracy of Time Interval ( T) (Full Bandwidth) 10S/s ~ 100MS/s (sinx) /x 5000 sampling points per channel 5ns/div~5s/div, according to the stepping mode of 1- 2.5- 5. ± 100ppm ( for any time interval equal to or greater than 1ms) Single: ± (One Sampling Interval Time +100ppm × Reading +0.6ns) >Averages of 16: ± (One Sampling Interval Time +100ppm× Reading +0.4ns) 9 Vertical A/D Converter Sensitivity (Volt/division) Range (V/div ) Displacement Range Simulative Bandwidth Single Bandwidth Low frequency respond (AC Coupling, - 3dB) Rising Time (Typical, at BNC ) DC Gain Accuracy DC Measuring Accuracy ( Average for ACQU MODE) Resolution of 8 bits, with the sampling carried out in two channels at the same time. 5mV/div- 5V/div (at the input BNC) ± 10div (5mV- 5V ) 25M Full Bandwidth ≥5Hz (at BNC) ≤17.5ns ± 5% The voltage difference ( V) between any two points on the wave form after averaging the captured wave forms of more than 16: ± (5% Reading + 0.05 divisions). 10 Trigger Trigger Sensitivity (Edge Trigger) DC Coupling Internal Channel 1 and Channel 2: 1div (DC ~ Full Bandwidth ) 100mV(DC ~ Full Bandwidth) 500mV(DC ~ Full Bandwidth) It is the same as the DC coupling in case of 50Hz or more. ± 6 divisions from the screen center. EXT EXT/5 Inside ± 600mV ± 3V ± 0.3 div EXT ± (40mV + 6% of Set Value) EXT/5 ± (200mV +6% of Set Value) EXT EXT/5 AC Coupling Trigger Level Range Trigger Level Accuracy (Typical): It is applicable to the signal with the rising and falling time ≥ 20ns Trigger Displacement Set Level to 50% (Typical) Trigger Sensitivity (Video trigger, typical) Signal System and Line/Field Frequency (Video Trigger Type) Preliminary Trigger: 655 divisions Late Trigger: 4 divisions. Operation under the condition of input signal frequency ≥ 50Hz. Internal Peak-to-peak value of 2 divisions EXT 400mV EXT/5 2V Supporting the NTSC, PAL and SECAM broadcast system of any field frequency of line frequency. Measurement Cursor Measurement Automatic Measurement Voltage difference ( V) and time difference ( T) between cursors. Peak-to-Peak Value, Average , RMS , Frequency and Cycle Probe Bandwidth Attenuation Ratio Compensation Range Input Resistance Input Electric Capacity Input Voltage 1X Position DC: up to 4 MHz 1: 1 10pf ~ 35pf 1MΩ± 2% 85pf- 115pf 150 V DC 11 10X Position DC: up to full bandwidth 10: 1 10MΩ± 2% 14.5pf- 17.5pf 300 V DC General Technical Specifications Display Display Type Display Resolution Display Colors 7.8"Color LCD (Liquid Crystal Display) 640 (Horizontal) × 480 (Vertical) Pixels 256 Colors Output for Probe Compensation Output Voltage (Typical ) Frequency (Typical ) About 5V, with the Peak-to-Peak value equal to or greater than 1MΩ of load. Square wave of 1KHz Power Mains Voltage Power Consumption Fuse 100~240 VAC RMS, 50Hz, CAT II < 15W 1A, T grade, 250V Environment Temperature Working temperature: 0 ~ 40 Storage temperature: -20 ~ +60 ≤ 90% Operating: 3,000 m Non-operating: 15,000 m Natural convection Relative Humidity Height Cooling Method Mechanical Specifications Dimension 350mm× 157mm×120mm Weight 1.4 kilogram Standard Accessories: z Passive probe: 2, 1.2 m, 1:1 (10:1) z CD: 1, for Iinstruction. Manual and S/W for PC communication, z Power line: one, up to the standards of the country in which it is used. z User's Manual: One Options: z RS232 data line or USB data line cabels (Optional) z Battery 12 5. Getting Started This chapter deals with the following topics mainly: Introduction to the front panel user interface controls of the Oscilloscope The general inspection The functional inspection Probe Compensation Setting the probe attenuation coefficient The probe safety Auto-calibration The vertical system The horizontal system The trigger system 13 5.1 Use-Interface Front Panel Controls and Functions : Whenever you get a new-type oscilloscope, you should first get acquainted with its front panel and the 36000D series digital storage oscilloscope is no exception. This chapter describes the operations and functions of the front panel controls of the Oscilloscope, enabling you to be familiar with the use of the Oscilloscope in the shortest time. The Oscilloscope offers a simple front panel controls with distinct functions to users for their completing some basic operations, in which the knobs and function pushbuttons are included. The knobs have the functions similar to other Oscilloscopes. The 5 buttons in the column on the right side of the display screen are menu selection buttons (defined as F1 to F5 from top to bottom respectively), through which, you can set the different options for the current menu. The other pushbuttons are function buttons, through which, you can enter different function menus or obtain a specific function application directly. Fig. 1 The Front Panel of a Digital Storage Oscilloscope Function Buttons 14 Fig. 2 Explanatory Drawing for Operations of the Digital Storage Oscilloscope Fig. 3 Illustrative Drawing of Display Interfaces 15 1. The Trigger State indicates the following information: Auto: The oscilloscope is under the Automatic mode and is collecting the waveform under the non-trigger state. Trig' d: The oscilloscope has already detected a trigger signal and is collecting the after-triggering information. Ready: All pre-triggered data have been captured and the oscilloscope has been already ready for accepting a trigger. Scan: The oscilloscope captures and displays the waveform data continuously in the scan mode. Stop: The oscilloscope has already stopped the waveform data acquisition. 2. Waveform Viewing Area. 3. The purple pointer indicates the horizontal trigger position, which can be adjusted by the horizontal position control knob. 4. The reading shows the time deviation between the horizontal trigger position and the screen centre line, which equals 0 in the screen center. 5. This reading shows the time deviation between the horizontal trigger position and the window centre line, which is regarded as 0 in the window center. 6. It indicates the current function menu. 7. It indicates the operation options for the current function menu, which changes with the function menus. 8. The purple pointer shows the trigger level position. 9. The reading shows the trigger level value. 10. The reading shows the trigger source. 11. It shows the selected trigger type: Rising edge triggering Falling edge triggering Video line synchronous triggering Video field synchronous triggering 12. The reading shows the window time base set value. 13. The reading shows the main time base set value. 14. The two yellow dotted lines indicate the size of the viewing expanded window. 15. The icon shows the coupling mode of the CH2 channel. 16 16. “—“ indicates the direct current coupling “ ~” indicates the AC coupling 17. The reading shows the vertical scale factor (the Voltage Division) of the CH2 channel. 18. The icon indicates the coupling mode of the CH1 channel: The icon "–" indicates the direct current coupling The icon "~" indicates the AC coupling 19. The reading indicates the vertical scale factor (the Voltage Division) of the CH1 channel. 20. The information shows the zero point positions of CH1 or CH2 channel. 21. The yellow pointer shows the grounding datum point (zero point position) of the waveform of the CH2 channel. If the pointer is not displayed, it shows that this channel is not opened. 22. The red pointer indicates the grounding datum point (zero point position) of the waveform of the CH1 channel. If the pointer is not displayed, it shows that the channel is not opened. 23. The positions of two purple dotted line cursors measurements. 17 5.2 General Inspection After you get a new Oscilloscope, it is recommended that you should make a check on the instrument according to the following steps: 1. Check whether there is any damage caused by transportation. If it is found that the packaging carton or the foamed plastic protection cushion has suffered serious damage, do not throw it away. First complete tests on the unit for the electrical and mechanical properties and its accessories. 2. Check the Accessories The supplied accessories have been already described in the Appendix B “Accessories” of this Manual. You can check whether there is any loss of accessories with reference to this description. If it is found that there is any accessory lost or damaged, please get in touch with the distributor of APLAB responsible for this service or the APLAB’s local offices. 3. Check the Complete Instrument If it is found that there is damage to the appearance of the instrument, or the instrument can not work normally, or fails in the performance test, please get in touch with the APLAB’s distributor responsible for this business or the APLAB’s local offices. If there is damage to the instrument caused by the transportation, please keep the package intact for retransport. Please inform to the Service/logistics department or the APLAB’s distributor/region responsible for this business. A repairing or replacement of the instrument will be arranged by the APLAB. 18 5.3 Function Inspection Make a fast function check to verify the normal operation of the instrument, as per following steps: 1. Connect the Instrument to the Power and Push down the Power Switch Button. The instrument carries out all self-check items and shows the prompt “Press any Key to Enter the Operating Mode”. Press the “UTILITY” button to get access to the “FUNCTION” menu and push down F2 the menu selection button to call out the function “Recall Factory”. The default attenuation coefficient set value of the probe in the menu is 10X, shown as Fig. 4. Fig. 4 Power on the Instrument 2. Set the Switch in the Oscilloscope Probe as 10X and Connect the Oscilloscope with CH1 Channel. Align the slot in the probe with the plug in the CH1 connector BNC, and then tighten the probe with rotating it to the right side. Connect the probe tip and the ground clamp to the connector of the probe compensator, shown as Fig. 5. 19 Probe comp CH1 Fig. 5 Connection of the Probe 3. Press the AUTOSET Button. The square wave of 1 KHz frequency and 5V peak-peak value will be displayed in several seconds (see Fig. 6). Fig. 6 Autoset Check CH2 by repeating Step 2 and Step 3. 20 5.4 Probe Compensation Whenever you connect the probe with any input channel for the first time, make this adjustment to match the probe with the input channel. The probe which is not compensated /adjusted will result in the measuring error or mistake. For adjusting the probe compensation, please carry out the following steps: 1. Set the attenuation coefficient of the probe in the menu as 10X and that of the switch in the probe as 10X, and connect the oscilloscope probe with the CH1 channel. If a probe hook tip is used, ensure that it keeps in close touch with the probe. Connect the probe tip with the signal connector of the probe compensator and connect the reference wire clamp with the ground wire connector of the probe connector, and then press the button AUTOSET (see Fig. 5). 2. Check the displayed wave forms and adjust by plastic screw driver provided with the probe till a correct compensation is achieved (see Fig. 7 and Fig. 8). Fig. 7 Displayed Wave Forms of the Probe Compensation 3. Repeat the steps mentioned if necessary. Fig. 8 Adjust Probe 21 5.5 Setting the Probe Attenuation Coefficient The probe has several attenuation coefficients, which will influence the vertical scale factor of the oscilloscope. If it is required to change (check) the set value of the probe attenuation coefficient, press the function menu button of the channels used, then push down the selection button corresponding to the probe till the correct set value is shown. This setting will be valid all the time before it is changed again. Note: The attenuation coefficient of the probe in the menu is preset to 10X when the oscilloscope is delivered from the factory. Make sure that the set value of the attenuation switch in the T5100 probe is the same as the menu selection of the probe in the oscilloscope. The set values of the probe switch are 1X and 10X (see Fig. 9). Fig. 9 Attenuation Switch Note: When the attenuation switch is set to 1X, the T5100 probe will limit the bandwidth of the oscilloscope up to 5MHz. If it is needed to use the whole bandwidth of the oscilloscope, the switch must be set to 10X. 22 5.6 Probe Safety The safety guard ring around the probe body protects your finger against the electric shock, shown as Fig. 10. Fig. 10 Finger Guard Warning: In order to avoid suffering from the electric shock, please keep your finger behind the safety guard ring of the probe body during the operation. In order to protect you from suffering from the electric shock during your using the probe, do not touch the metal part of the probe tip when the probe is connected to the power supply. Before making any measurements, please connect the probe to the instrument and connect the ground terminal to the earth. 23 5.7 Auto-calibration The auto-calibration application can make the oscilloscope reach the optimum condition rapidly to obtain the most accurate measurement value. You can carry out this application program at any time, but when the range of variation of the ambient temperature is up to or over 5 degree C , this program must be executed. For the performing of the self-calibration, all probes or wires should be disconnected with the input connector first. Then, press the “UTILITY” button to call out the FUNCTION menu; push down the F3 menu selection button to choose the option “ Do Self Cal”; finally, run the program after confirming that everything is ready now. 24 5.8 Vertical System Please refer to Fig.11, there are a series of buttons and knobs in VERTICAL CONTROLS. The following practices will gradually direct you to get familiar with the using of the vertical setting. Fig. 11 Vertical Control Zone 1. Use the button “VERTICAL POSITION” knob to show the signal in the center of the waveform window. The “VERTICAL POSITION” knob function is to adjust the vertical display position of the signal. Thus, when the “VERTICAL POSITION” knob is rotated, the pointer of the earth datum point of the channel is directed to move up and down following the wave form. Measurement If the channel is under the DC coupling mode, you can rapidly measure the DC component of the signal through the observation of the difference between the wave form and the signal ground. If the channel is under the AC mode, the DC component will be removed by filtration. This mode helps you display the AC component of the signal with a higher sensitivity. 2. Change the vertical setting and observe the consequent state information change. With the information displayed in the status bar at the bottom of the waveform window, you can determine any changes in the channel vertical scale factor. z Rotate the vertical “VOLTS/DIV” knob and change the “Vertical Scale Factor (Voltage Division)”, it can be found that the scale factor of the channel corresponding to the status bar has been changed accordingly. z Press buttons of “CH1 MENU”, “CH2 MENU” and “MATH MENU”, the operation menu, symbols, wave forms and scale factor status information of the corresponding channel will be displayed in the screen. 25 5.9 Horizontal System Please refer to Fig.12, there are a button and two knobs in the “HORIZONTAL CONTROLS”. The following practices will gradually direct you to get familiar with the setting of horizontal time base. Fig. 12 Horizontal Control Zone 1. Use the horizontal “SEC/DIV” knob to change the horizontal time base setting and observe the consequent status information change. Rotate the horizontal “SEC/DIV” knob to change the horizontal time base, and it can be found that the “Horizontal Time Base” display in the status bar changes accordingly. The horizontal scanning speed steps from 5ns up to 5s in the sequence of 1=2.5=5. 2. Use the “HORIZONTAL POSITION” knob to adjust the horizontal position of the signal in the waveform window. The “HORIZONTAL POSITION” knob is used to control the triggering displacement of the signal or for other special applications. If it is applied to triggering the displacement, it can be observed that the wave form moves horizontally with the knob when you rotate the “Horizontal Position” knob. 3. With the “HORIZONTAL MENU” button pushed down, you can set and initiate the Window Expansion. 26 5.10 Trigger System Please refer to Fig.13, there are a knob and four buttons in the “TRIGGER CONTROLS”. The following practices will direct you to get familiar with the setting of the trigger system gradually. Fig. 13 Trigger Control Zone 1. Press the “TRIG MENU” button and call out the trigger menu. With the operations of the 5 menu selection buttons, the trigger setting can be changed. 2. Use the “LEVEL” knob to change the trigger level setting. With the rotation of the “LEVEL” knob, it can found that the trigger indicator in the screen will move up and down with the rotation of the knob. With the movement of the trigger indicator, it can be observed that the trigger level value displayed in the screen changes. 3. Press the button “SET TO% 50” to set the trigger level as the vertical mid point values of the amplitude of the trigger signal. 4. Press the “FORCE TRIG” button to force a trigger signal, which is mainly applied to the “Normal" and "Single” trigger modes. 5. The “TRIG VIEW /SET TO ZERO” button is used to reset the trigger horizontal position. 27 6. Operation Now that you have already become familiar with the initial operations of “VERTICAL CONTROLS”, “HORIZONTAL CONTROLS” and “TRIGGER CONTROLS”, and the functions of the function areas, buttons and knobs in the front panel of the Oscilloscope. Based on familiarisation of the previous Chapter, the user should have now intimate knowledge of the determination of the change of the oscilloscope setting through observing the status bar. If you have not been familiar with the above-mentioned operations and methods yet, we advise you to read the section of “ First time operation” again. This chapter will deal with the following topics mainly: z How to Set the Vertical System z How to Set the Horizontal System z How to Set the Trigger System z How to Carry on the Sampling Setup z How to Set the Display System z How to carry out the Store and Recall Operations z How to Carry on the Auxiliary Function Setting z How to Carry on the Automatic Measurement z How to Carry on the Cursor Measurement z How to Use Executive Buttons It is recommended that you read this chapter carefully to get acquainted the various measurement functions and other operation methods of the Oscilloscope. 28 6.1 Vertical System : The VERTICAL CONTROLS includes three menu buttons such as CH1 MENU, CH2 MENU and MATH MENU, and four knobs such as VERTICAL POSITION , VOLTS/DIV ( one control group for each of the two channels ). Setting of CH1 and CH2 Every channel has an independent vertical menu and each item is set respectively based on the channel. With the “CH1 MENU” or “CH2 MENU” menu button pushed down, the system shows the operation menu of the corresponding channel (see Fig. 14). Fig. 14 Channel Setting Menu 29 The description of the Channel Menu is shown as the following list: following form: Function Menu Coupling Setting AC DC Channel Probe Inverted 1. OFF ON 1X 10X 100X 1000X OFF ON Description Blocks the DC and allows AC components in the input signal. Allows the AC/DC component in the input signal. Closes the perticular measurement channel. Opens the particular measuring channel. Chooses one according to the probe attenuation factor to make the vertical scale reading accurate. The wave form is displayed normally. Initiate the wave form inverted function. Setting Channel Coupling Taking the Channel 1 for example, the measured signal is a square wave signal containing the direct current bias. The operation steps are shown as below: (1). Press the CH1 MENU button and call out the CH1 SETUP menu. (2). Press the F1 menu selection button and select the Coupling item as “AC” to set the channel coupling in AC mode, under which the direct current component in the signal will be blocked. Then, press the F1 menu selection button again and select the Coupling item as “DC”, setting the channel coupling in dc mode, under which both dc and ac components in the signal will be unblocked. The wave forms are shown as Fig. 15 and Fig. 16. 30 Fig. 15 An “AC Coupled” Oscillogram Fig. 16 “DC Coupled” Oscillogram 31 2. Setting the Channel “ON/OFF” Taking the Channel 1 for example, the operation steps are shown as below: (1). Press the CH1 MENU button and call out the CH1 SETUP menu. (2). Press the F2 menu selection button and select the Channel as OFF, with Channel 1 switched off. (3). Press F2 menu selection button again, select the channel as ON, with Channel 1 is switched on. 3. Adjusting the Attenuation Ratio of the Probe In order to match the attenuation coefficient of the probe, it is required to adjust the attenuation ratio coefficient of the probe through the operating menu of the Channel accordingly. If the attenuation coefficient of the probe is 1:1, that of the oscilloscope input channel should also be set to 1X to avoid any errors presented in the displayed scale factor information and the measured data. Take the Channel 1 as an example, the attenuation coefficient of the probe is 1:1, the operation steps is shown as follows: (1). Press the CH1 MENU button, access CH1 SETUP menu. (2). Press the F3 menu selection button and select 1X for the probe. The Figure 17 illustrates the setting and the vertical scale factor when the probe of the attenuation coefficient of 1:1.is used. Fig. 17 Adjusting the Attenuation Ratio of the Probe 32 A List of the Attenuation Coefficients of Probes and the Corresponding Menu Settings. Attenuation Coefficient of the Probe 1:1 10:1 100:1 1000:1 5. Corresponding Menu Setting 1X 10X 100X 1000X Setting of Inverted Wave Form In the wave form inverted, the displayed signal is turned 180 degrees against the phase of the earth potential. Taking the Channel 1 for example, the operation steps are shown as follows: (1). Press the CH1 MENU button and get access to the CH1 SETUP menu. (2). Press the F4 menu selection button and select ON in the Lnverted. The wave form inverted function is initiated. (3). Press the F4 menu selection button again and select OFF for Lnverted item. The function of wave form inverted is closed off. For the screen display, see Fig. 18 and Fig. 19. Fig. 18 Wave Form not Inverted 33 Fig. 19 Wave Form Inverted 34 6.2 MATH Function The Math: function is used to show the results of the addition and subtraction operations between Channel 1 and Channel 2. Taking the additive operation between Channel 1 and Channels 2 for example, the operation steps are as follows: 1. Press the MATH MENU button and call out the WAVE MATH menu. 2. Press the F3 menu selection button and choose CH1+CH2. The green calculated wave form M is displayed in the screen; press the F3 menu selection button again, the wave form M is closed off (see Fig. 20). Fig. 20 Wave Form resulted from CH1 +CH2 Mathematical Manipulation The corresponding FCL (Functional Capabilities List) of the Wave Form Calculation Setting CH1-CH2 CH2-CH1 CH1+CH2 Description Subtract the Channel 2 wave form from the Channel 1 wave form. Subtract the Channel 1 wave form from the Channel 2 wave form. Add the Channel 1 wave form to the Channel 2. 35 6.3 Application of VERTICAL POSITION and VOLTS/DIV Controls 1. The .VERTICAL POSITION knob is used to adjust the vertical positions of the wave forms of all Channels (including those resulted from the mathematical operation). The analytic resolution of this control knob changes with the vertical division. 2. The VOLTS/DIV knob is used to regulate the vertical resolution of the wave forms of all channels (including those obtained from the mathematical manipulation), which can determine the sensitivity of the vertical division with the sequence of 1-2-5. The vertical sensitivity goes up when the knob is rotated clockwise and goes down when the knob is rotated anticlockwise. 3. When the vertical position of the channel wave form is adjusted, the screen shows the information concerning the vertical position at the lower left corner (see Fig.21). Fig. 21 Information about Vertical Position 36 6.4 Horizontal System The HORIZONTAL CONTROLS includes the HORIZONTAL NENU button and such knobs as HORIZONTAL POSITION and SEC/DIV. 1. HORIZONTAL POSITION knob: this knob is used to adjust the horizontal positions of all channels (include those obtained from the mathematical manipulation), the analytic resolution of which changes with the time base. 2. SEC/DIV knob: it is used to set the horizontal scale factor for setting the main time base or the window. 3. HORIZONTAL NENU button: with this button pushed down, the screen shows the operating menu (see Fig. 22). Fig. 22 Time Base Mode Menu The description of the Horizontal Menu is as follows: Function Menu Main Time Base Window Setup Window Expansion Setting Description The setting of the horizontal main time base is used to display the wave form. A window area is defined by two cursors. The defined window area for display is expanded to the full screen. 37 6.5 Main Time Base Press the F1 menu selection button and choose the Main Time Base. In this case, the HORIZONTAL POSITION and SEC/DIV knobs are used to adjust the main window. The display in the screen is shown as Fig. 23. Fig. 23 Main Time Base 38 6.6 Window Setting Press the F2 menu selection button and choose Set Window. The screen will show a window area defined by two cursors. In this case, the HORIZONTAL POSITION and SEC/DIV knobs can be used to adjust the horizontal position and size of this window area (see Fig. 24). Fig. 24 Window Setting 39 6.7 Window Expansion Press the F3 menu selection button and choose Zone Window. As a result, the window area defined by two cursors will be expanded to the full screen size (see Fig. 25). Fig. 25 Zone Window 40 6.8 Trigger System When the oscilloscope begins to collect the data and display the wave form depends on a trigger. Once it is set correctly, the trigger can transfer the unstable display into a meaningful wave form. When beginning to collect data, the oscilloscope will collect adequate data to draw the wave form at the left side of the trigger point at first. It will continuously perform the data acquisition while waiting for the trigger condition. After a trigger is detected, the oscilloscope will continuously collect data enough to draw the wave form at the right side of the trigger point. One knob and four function menu buttons are included in the trigger control zone. LEVEL: Trigger the level control knob and set the signal voltage corresponding to the trigger point. SET TO %50: Set the trigger level as the vertical mid point value of the amplitude of the trigger signal. FORCE TRIG: It is a force trigger button for the generation of a trigger signal, which is mainly used in the “Normal” and "Single” triggering modes. TRIG VIEW: Trigger the resetting of the horizontal position. TRIG MENU: It is a trigger menu button. When it is pressed, an operation menu will be presented in the screen, shown as Fig. 26. Fig. 26 Trigger Mode Menu 41 6.9 Trigger Control There are two trigger modes: Edge Trigger and Video Trigger. Each trigger mode uses different function menu. The switching between two modes can be implemented by pressing the F1 menu selection button. Edge Trigger: It happens when the trigger input passes through a given level along the set direction. Video Trigger: Carry out the field or line video trigger of the standard video signal. The Edge and Video Trigger menus are described respectively as below: 6.10 Edge Trigger Under the Edge Trigger mode, a trigger happens in the trigger threshold value of the input signal edge. When the Edge Trigger is selected, a trigger will occur in the rising or falling edge of the input signal. The Edge Trigger Menu is shown as Fig. 27. Fig. 27 Edge Trigger Menu 42 The Edge Trigger Menu is described as below: Function Menu Slope Setting Rising Falling CH1 CH2 EXT Description Set a trigger on the rising edge of the signal. Set a trigger on the falling edge of the signal. Source Set Channel 1 as the trigger signal of the source. Set Channel 2 as the trigger signal of the source. Set the external trigger channel as the trigger signal of the source. EXT/5 Divide the External Trigger Source by 5 to expand the external trigger level range. Mode Auto Collect the wave form even if there is not trigger condition is detected. Normal Collect the wave form only when the trigger condition is fulfilled. Single Collect a wave form when a trigger is detected then stop sampling. Coupling DC Block the direct current component. AC Unblock all components. HF Rjc Block the high-frequency signal and only unblock the high-frequency component. LF Rjc Block the low-frequency signal and only unblock the low frequency component. Make such settings in Channel 1 as Rising for Slop, Auto for Mode and DC for Coupling. The operation steps are as follows: 1. Press the TRIG MENU button and call out the trigger menu. 2. Press the F1 menu selection button and select Edge for Type. 3. Press the F2 menu selection button and select Rising for Slope. 4. Press the F3 menu selection button and choose CH1 for Source. 5. Press the F4 menu selection button and choose Auto for Mode. 6. Press the F5 menu selection button and choose AC for Coupling. The display in the screen is as Fig. 28. 7. Press the F2 menu selection button again and choose Falling for Slope. For the screen display, see Fig. 29. 43 Fig. 28 Wave Form Triggered on the Rising Edge Fig. 29 Wave Form Triggered on the Falling Edge 44 6.11 Video Trigger After choosing “Video Trigger”, a trigger is possible in field or line of NTSC, PAL or SECAM standard video signal. The operation menu of Video Trigger is shown as Fig. 30. Fig. 30 Video Trigger Menu The description of the Video Trigger menu is shown the following table: Function Menu Polarity Source Setting Normal Inverted CH1 CH2 EXT EXT/5 Sync Line Field Description Applicable to the video signal of low black level. Applicable to the video signal of high black level. Set Channel 1 as the trigger signal of the source. Set Channel 2 as the trigger signal of the source. Set the external input channel as the trigger signal of the source. Divide the external trigger source by 5 and expand the external trigger level range. Set a trigger synchronization in the vide line. Set a trigger synchronization in the video field. 45 The operation steps for setting Channel 1 in Video Trigger Mode are as below: 1. Press the TRIG MENU button and get access to the trigger menu. 2. Press the F1 menu selection button and choose Video for Type. 3. Press the F2 menu selection button and choose Normal for Polarity. 4. Press the F3 menu selection button and choose CHI1 for Source. 5. Press the F4 menu selection button and choose Field for Sync. The screen display is shown as Fig. 31. 6. Press the F4 menu selection button again and choose Line for Slope. The screen display is shown as Fig. 32. 46 Fig. 31 Wave Form Triggered in the Video Field Fig. 32 Wave Form Triggered in the Video Line 47 6.12 Function Menu The function menu control zone includes 6 function menu buttons and 3 immediate-execution buttons: SAVE/REL, MEASURE, ACQUIRE, UTILITY, CURSOR, DISPLAY, AUTOSET, RUN/STOP and HARDCOPY. 6.13 Sampling Setup Press the ACQUIRE button and the menu is displayed in the screen, shown as Fig. 33. Fig. 33 ACQU MODE Menu The description of the Sampling Setup Menu is shown as follows: Function Menu Sampling Peak Detection Average value Averages Setting Description General sampling mode. It is used for the detection of the jamming burr and the possibility of reducing the confusion. It is used to reduce the random and don’t-care noises, with the optional number of averages. 4, 16, 64, Choose the number of averages. 128 48 Change the ACQU Mode settings and observe the consequent variation of the wave form displayed. Fig. 34 Peak Detect mode, under which the burrs on the falling edge of the square wave can be detected and the noise is heavy. 49 Fig. 35 Common ACQU Mode display, in which no burr can be detected. Fig. 36 The displayed wave form after the noise is removed under the Average Mode, in which the average number of 64 is set. 50 6.14 Display System Push down the DISPLAY button and the menu displayed in the screen is shown as Fig. 37. Fig. 37 Display Set Menu The description of the Display Set Menu is shown as follows: Function Menu Type Persist Format Setting Vectors Dots OFF 1sec 2sec 5sec Infinite YT XY Carry Bitmap Vectors Description The space between the adjacent sampling points in the display is filled with the vector form. Only the sampling points are displayed. Set the persistence time for each sampling point. Show the relative relation between the vertical voltage and the horizontal time. Channel 1 is displayed on the horizontal axis and Channel 2 on the vertical axis. The data transmitted in communication are in the bitmap form. The data transmitted in communication are in the vector form. 51 Display Type: With the F1 menu selection button pushed down, you can shift between Vectors and Dots types. The differences between the two display types can be observed through the comparison between Fig. 38 and Fig.39. Fig. 38 Display in the Vector Form 52 Fig. 39 Display in Dots form 53 6.15 Persistence When the Persist function is used, the persistence display effect of the picture tube oscilloscope can be simulated: the reserved original data is displayed in fade color and the new data is in bright color. With the F2 menu selection button, different persistence time can be chosen: 1sec, 2sec, 5sec, Infinite and Closed. When the “Infinite” option is set for Persist time, the measuring points will be stored till the controlling value is changed (see Fig. 40). Fig. 40 Infinite Persistence Display 6.16 XY Format This format is only applicable to Channel 1 and Channel 2. After the XY display format is selected, Channel 1 is displayed in the horizontal axis and Channel 2 in the vertical axis; the oscilloscope is set in the untriggered sample mode: the data are displayed as bright spots and the sampling rate is 1MS/s and can not be changed. The operations of all control knobs are as follows: The Vertical VOLTS/DIV and the Vertical POSITION knobs of Channel 1are used to set the horizontal scale and position. The Vertical VOLTS/DIV and the Vertical POSITION knobs of Channel 2 are used to set the vertical scale and position continuously. 54 The following functions can not work in the XY Format: Reference or digital wave form Cursor Auto Set Time base control Trigger control Operation steps: 1. Press the DISPLAY button and call out the Display Set Menu. 2. Press the F3 menu selection button and choose the form as XY. The display format is changed to be XY mode (see Fig. 41). Fig. 41 XY Display Mode 55 6.17 How to Save and Recall a Wave Form Press the SAVE/REL button, you can save and call out the wave forms in the instrument. The menu displayed in the screen is shown as Fig. 42. Fig. 42 Wave Form Save Menu The description of the Wave Form Save Menu is shown as the following table: Function Menu Source WAVE Setting CH1 CH2 MATH A,B C,D Save CHA OFF ON Description Choose the wave form to be saved. Choose the address in or from which the waveform is saved or can be get access to.. Save the wave form of the source in the selected address. Switch on or off the display of the stored wave form . 56 6.18 Save and Recall the Wave Form The Oscilloscope can store four wave forms, which can be displayed with the current wave form at the same time. The stored wave form called out can not be adjusted. In order to save the wave form of the channel CH1 into the address A, the operation steps should be followed: 1. Press the F1 menu selection button and choose CH1 for Source. 2. Press the F2 menu selection button and choose A for Wave. 3. Press the F3 menu selection button and save the wave form. 4. Press the F4 menu selection button and choose ON for CHA. The stored wave form A will be displayed in the screen. The voltage level and time base level will also be shown at the upper left corner of the display area at the same time (see Fig. 43). Fig. 43 Wave Saving 57 6.19 How to Carry on the Auxiliary System Function Setting Press the UNTILITY button and the menu is displayed in the screen as Fig. 45. Fig. 45 Function Menu The description of the Auxiliary Function Menu is shown as the following table. Function Menu System Status Recall Factory Do Self Cal Language Setting Chinese ENGLISH Description Display the system function menu. Call out the factory settings. Carry out the self-calibration procedure. Choose the display language of the operating system. 58 6.20 Do Self Cal (Self-Calibration) The self-calibration procedure can improve the accuracy of the oscilloscope under the ambient temperature to the greatest extent. If the change of the ambient temperature is up to or exceeds 5 , the self-calibration procedure should be executed to obtain the highest level of accuracy. Before executing the self-calibration procedure, disconnect the probe or wire and the input connector. Then,press the F3 menu selection button and choose “Do Self Cal”. After confirming it is all set, push down F3 button and choose “Do Self Cal”, entering the self-calibration procedure of the instrument. 6.21 SYS STAT (System State) Press the F1 menu selection button and choose “SYS STAT” item. The menu pops up in the screen as Fig. 46. Fig. 46 SYS STAT Menu 59 The “SYS STAT” menu is described as the following table: Function Menu Setting Description Horizontal Show the horizontal parameter of the channel. Vertical Show the vertical parameter of the channel. Trigger Show the parameters of the trigger system. Misc Adjust the Date and Time. After entering into the SYS STAT menu, choose the corresponding function, with the corresponding parameters shown in the screen. If press the F1 menu selection button and choose the function item “Horizontal”, the Horizontal System State will be displayed in the screen. Press any other function button and exit from the SYS STAT menu (see Fig. 47). Fig. 47 Horizontal System State 60 6.22 How to Conduct the Automatic Measurement : With the Measure button pressed down, an automatic measurement can be implemented. There are 5 types of measurements and 4 measurement results can be displayed simultaneously. Press the F1 menu selection button to choose Source or Type menu. You can choose the channel to be measured from the Source menu and choose the measurement Type (Freq, Cycle, Mean, PK–PK, RMS and None). The menu is displayed as Fig. 48. Fig. 48 Measure Menu 6.23 Measure Four automatic measured values can be shown one time at maximum for the wave form of each channel. Only if the wave form channel is in the ON state can the measurement be carried out. No automatic measurement can be made for the saved or the mathematically manipulated wave form, or in the XY or Scan format. Measure the frequency, the peak-to-peak value of the Channel CH1 and the mean, the RMS of the Channel CH2, according the following steps: 61 1. Press the F1 menu selection button and choose Source. 2. Press the F2 menu selection button and choose CH1. 3. Press the F3 menu selection button and choose CH1. 4. Press the F4 menu selection button and choose CH2. 5. Press the F5 menu selection button and choose CH2. 6. Press the F1 menu selection button and choose Type. 7. Press the F2 menu selection button and choose Freq. 8. Press the F3 menu selection button and choose Pk-Pk. 9. Press the F4 menu selection button and choose Mean. 10. Press the F5 menu selection button and choose Cyc RMS. The measured value will be displayed in the reading window automatically (see Fig. 49). Fig. 49 Automatic Measurement 62 6.24 How to Carry on the Cursor Measurement : Press the CURSOR button to display the cursor measurement function menu (CURS MEAS) in the screen, which includes Voltage Measurement and Time Measurement, shown as Fig. 50. Fig. 50 CURS MEAS Menu The description of the cursor measurement menu is shown as the following table: Function Menu Type Setting OFF Voltage Time Source CH1, CH2 Delta Cursor 1 Cursor 2 Description Switch off the cursor measurement. Display the voltage measurement cursor and menu. Show time measures the cursor and menu. Choose the channel generating the wave form to which the cursor measurement will be applied. Read the difference between cursors. Read the position of Cursor 1 (the Time is read with reference to the horizontal trigger position and the Voltage is to the ground point). Read the position of Cursor 1 (the Time is read with reference to the horizontal trigger position and the Voltage is to the ground point). 63 6.25 Cursor Measurement When carrying out the cursor measurement, the position of Cursor 1 can be adjusted with the CURSOR1 (VERTICAL POSITION) knob of Channel 1, and that of Cursor 2 can be adjusted with the CURSOR2 (VERTICAL POSITION) knob of Channel 2. Perform the following operation steps for the voltage cursor measurement of the channel CH1: 1. Press CURSOR and recall the Curs Meas menu. 2. Press the F1 menu selection button to choose Voltage for Type, with two purple dotted lines displayed along the horizontal direction of the screen, which indicating CURSOR1 and CURSOR2. 3. Press the F2 menu selection button and choose CH1 for Source. 4. Adjust the positions of CURSOR1 and CURSOR2 according to the measured wave form, with the absolute value of the voltage amplitude difference between Cursor 1 and Cursor 2 displayed in the increment window. The current position of Cursor1 is displayed in the Cursor1 window and that of Cursor2 is displayed in the Cursor2 window (see Fig. 51). Fig. 51 Wave Form of Voltage Cursor Measurement 64 Carry out the following operation steps for the time cursor measurement of the channel CH1: 1. Press “CURSOR” and recall the CURS MEAS menu. 2. Press the F1 menu selection button and choose Time for Type, with two purple dotted lines displayed along the vertical direction of the screen, which indicating Cursor 1 and Cursor 2. 3. Press the F2 menu selection button and choose CH1 for Source. 4. Adjust the positions of CURSOR1 and CURSOR2 according to the measured wave form, with the cycle and frequency of Cursor1 and Cursor 2 displayed in the increment window. The current position of Cursor1 is displayed in the Cursor1 window and that of Cursor2 is displayed in the Cursor2 window (see Fig. 52). Fig. 52 Wave Form of Cursor Measurement 65 6.26 Execution Controls The execution buttons include AUTOSET, RUN/STOP and HARDCOPY. 6.27 AUTOSET This button is used for the automatic setting of all control values of the instrument to generate the wave form suitable for observation. Press the AUTOSET button and the oscilloscope will perform the fast automatic measurement of the signal. The function items of AUTOSET are shown as the following table: Function Items Acquisition Mode Vertical Coupling Vertical Scale Bandwidth Horizontal Level Horizontal Sale Trigger Type Trigger Source Trigger Coupling Trigger Slope Trigger Level Trigger Mode Display Format Setting Current DC Adjust to the proper division. Full Middle Adjust to the proper division Current Show the minimum number of channels. Current Current Mid-point Setting Auto YT RUN/STOP: Enable or disable the waveform sampling. Notice: Under the Stop state, the vertical division and the horizontal time base of the wave form can be adjusted within a certain range, in other words, the signal can be expanded in the horizontal or vertical direction. When the horizontal time base equal to or is less than 50ms, the horizontal time base can be expanded for 4 divisions downwards. 66 7. Maintenance, Cleaning and Repairing General Maintenance Please don't store or put the instrument in the place where the liquid crystal display will be directly exposed to the sunlight for a long time. Caution: The instrument or probe should not be stained with the spraying agent, liquid and solvent to avoid any damage to it. Cleaning Check the probe and instrument regularly according to their operating state. Clean the external surface of the instrument following the steps shown as below: 1. Please wipe the dust from the instrument and probe surface with a soft cloth. Do not make any scuffing on the transparent LCD protection screen when clean the LCD screen. 2. Clean the instrument with a wet soft cloth not dripping water, during the period of which please pay attention to the disconnection of power. It is recommended to scrub with soft detergent or fresh water. Please don't apply any corrosive chemical cleaning agent to prevent the instrument or probe from damage. Warning: Before power on again for operation, it is required to confirm that the instrument has already been dried completely, avoiding any electrical short circuit or bodily injury resulting form the moisture. 67 8. Fault Diagnosis 1. In the case of that the oscilloscope is still in the black-screen state without any display after the power is switch on, implement the following fault treatment procedure. z z z z Check whether the power connection is connected properly. Check whether the power switch is pushed down to the designated position. Restart the instrument after complete the checks above. If this product still can not work normally, please get in touch with Aplab and we will be under your service. 2. After acquiring the signal, carry out the following operations if the wave form of the signal is not displayed in the screen. z Check whether the probe is properly connected to the signal connecting wire. z Check whether the signal connecting wire is correctly connected to the BNC (namely, the channel connector). z Check whether the probe is properly connected with the object to be measured. z Check whether there is any signal generated from the object to be measured ( the trouble can be shot by the connection of the channel from which there is a signal generated with the channel in fault). z Make the signal acquisition operation again. 3. The measured voltage amplitude value is 10 times greater or smaller than the actual value. Check whether the channel attenuation coefficient conforms with the attenuation ration of the probe used in practical application. 4. There is wave form displayed, but it is not stable. z Check whether the Source item in the TRIG MODE menu is in conformity with the signal channel used in the practical application. z Check on the trigger Type item: The common signal chooses the Edge trigger mode for Type and the video signal the Video. Only if a proper trigger mode is applied, the wave form can be displayed steadily. z Try to change the trigger coupling into the high frequency suppress and the low frequency suppress to smooth the high frequency or low frequency noise triggered by the interference. 5. No Display Responses to the Push-down of RUN/STOP. Check whether Normal or Signal is chosen for Polarity in the TRIG MODE menu and the trigger level exceeds the wave form range. If it is, make the trigger level is centered in the screen or set the trigger mode as Auto. In addition, with the AUTOSET button pressed, the setting above can be completed automatically. 6. After the AVERAGE value sampling is set in the ACQU MODE or the a longer duration is set in the DISP MODE, the display rate is slowed down. It is a normal phenomenon. 68 9. Battery Using Guide: Charging the oscilloscope Batteries The lithium battery maybe not be charged when delivery. Please charge the battery for 12 hours to make sure to connect the power to supply (the oscilloscope should be turned on during charging) to oscilloscope. The battery can supply power for 4 hours after being charged completely. There will have battery power indication show on the top of panel when oscilloscope power supplied by the battery. , , and imply for different power consumption and when the power can only supply for 5 minutes maximum. shows it means Note: To avoid overheat of battery during charging, the environment temperature is not allowed to exceed the permissible value given in technical specification. Replacing the Lithium Battery Unit It is usually not required to replace the battery unit. But when it is required to replace it, only qualified personnel can carry out this operation, and only use the same specification lithium battery. 69 10. APLAB SALES & SERVICE CENTRES WESTERN REGION MUMBAI A.B. BHANAGE - Mobile 9821038368 Deodhar Centre, 424, Marol Maroshi Road, Andheri(East), Mumbai - 400 059. Tel : 022-29201787, 29204642, 29203468 Fax : 29209066 Email : [email protected] PUNE Mr. Vivek Nalawade Flat No.2, 1ST Floor, Above Vidya Sahakari Bank, Plot No. 2, Survey No. 127/2, Next to Hotel Sarjaa, Off ITI Road, Aundh, Pune - 411 007. Tel: 020 - 6523 5061 Email : [email protected] NAGPUR Mr. Bhavesh Deshmukh - Mobile 9850300345 130, Choti Dhantoli, Nagpur 440 012. Telfax : 0712-2523483 Email : [email protected] GOA Mr. Mukesh Dixit (o) 08323291694 (m) 09822856746 F-3, Chaitra Apartments, Church Street, Near Sabnis Park, Porvorim, Bardez, Goa – 403 521. Email : [email protected] AHMEDABAD Mr. Dhairav Sanghani - Mobile 9825334534 814, Sakar V, Behind Natraj Talkies, Ahmedabad 380 009. Telfax : 079-26589475 Email : [email protected] SURAT Mr. Avinash Jiyaviya - Mobile 9825946132 C/o. 167/A, Belgium Square, Near Karur Vysya Bank, Delhi Gate, Ring Road, Surat 395 003. Tel : 0261-2412922 Email : [email protected] 70 INDORE Mr. Rajan Khedekar - Mobile 9826395888 Flat No. 105, Kirti Palace, Plot No. 5-6, Shree Nagar, Indore (MP) 452001. Telfax : 0731-257666 Email : [email protected] RAIPUR Mr. Manish Chauhan - Mobile 9826286525 C/o. Umesh Agarwal, Modern Press, M.G. Road, Raipur 492 001. Email : [email protected] NORTHERN REGION NEW DELHI Mr. R. P. Patil - Mobile 9810124370 882, 3rd Floor, East Park Road (Opp. Ajmal Khan Park), Karol Bagh, New Delhi -110005. Tel : 011-23515183/86, 23627467 Fax : 23634709 Email : [email protected] AGRA Mr. Sanjay Satyadev - Mobile 093191 20128 120, Defence Estate, Gwalior Road, Agra 282001. Tel : 0562-241 1414 Fax : 0562-225797 Email : [email protected] LUCKNOW Mr. Salim Khan - Mobile 9415048807 “Gulmarg Apartment” 5, Jopling Road, Lucknow - 226 001. Tel : 0522-220 5973 Fax : 0522-220 9984 Email : [email protected] CHANDIGARH Mr. Sanjeev Sharma - Mobile 09316005780 1st Floor, SCO372, Sector 37D, Chandigarh - 160 036. Tel : 0172-2692466, 5016466 Fax : 0172-2685100 Email : [email protected] LUDHIANA Mr. Ravinder Kharulia - Mobile 9815646437 66SF, LIG Flat, 256, ACER Scheme, Rishi Nagar, Ludhiana. Tel. : 0161-5575437. Email : [email protected] 71 AMRITSAR Mr. Gopal Khanna - Mobile 9855288592 2080/9-13, Inner Circular Road, Gate Khazana, Amritsar. Email : [email protected] DEHRADUN Mr Shashi Bhushan Singh,M-9319561638 C/o. B. S. Bhandari, 255 – Bank Collony, Ajabpur Kalan, Dehradun. Email : [email protected] JAMMU Mr. Balbir Singh C/o. Mr. Sumit Thapar, House No. 84, Shopping Complex, Bakshi Nagar, Jammu - 180 001. Tel : 0191-2577355 (PP) Email : [email protected] JALLANDHAR Mr Rajender Pal , Mobile-09815113783 JAIPUR Mr. Vivek Sharma - Mobile 09314613834 D-4, Shastri Nagar, Mochiyon ki Chhabil, Jaipur – 302 016. Tel : 0141-2307023 Fax : 0141-2305817 Email : [email protected] EASTERN REGION KOLKATA Mr. Samarjit Mitra - Mobile 9830056798 P-26/1, C.I.T. Road, 1st Floor, Kolkata – 700 014. West Bengal. Tel : 033-22455435, 22848834 Fax : 033-22454294 Email : [email protected] DURGAPUR Mr. J. Chattarjee - Mobile 9434202335 C/o. Sri Asit Bhattacharaya, E-II/42, Cock Oven Colony, Near Gas Co-operative, Durgapur - 2. West Bengal. Email : [email protected] 72 SILIGURI Mr. J. K. De - Mobile 9832079137 C/o. Mr. Bibhuti Bhusan Pal, 2nd Floor, Opp. to Central Bank of India, Hydarpara, Siliguri - 734 406. West Bengal BHUBANESWAR Mr. K. K. Parida - Mobile 9437005901 Plot No. 886, Kandara Pokhari, Lewis Road, Garage Chowk, Bhubaneswar - 751 002. Orissa. Tel : 0674-2342425 Email : [email protected] SAMBALPUR Mr. P. K. Behera - Mobile 0943738717 C/o. Jagadananda Behera, A.T.P.O. Jharua Para, Sambalpur – 768 001, Orissa. Tel : 0663-2400918 Email : [email protected] BERHAMPUR Mr. Monaj Kr. Gouda - Mobile 09437370759 Berhampur Industrial Estate, Near L.I.C. Colony, Berhampur – 760 008, Ganjam, Orissa. Email : [email protected] ROURKELA Mr. S. K. Pradhan - Mobile 09437200557 Q-PW4, ITI Colony, Near Govt. ITI, PO:- Panposh, Rourkela - 769004, Orissa. Email : [email protected] PATNA Mr. R. K. Yadav - Mobile 9431024439 2C/162, G.D. Misra Path, New Patli Putra Colony, Patna 800013. Bihar. Tel : 0612-3094938 Email : [email protected] BHAGALPUR Mr. Chhote Lal - Mobile 9431024440 C/o. Late Shri Shiv Kr. Chaudhury, Rani Chaudrabati Hata, House No. 40, Bhagalpur – 2. Bihar. Email : [email protected] 73 MAZAFFARPUR Mr. Rajesh Kr. Singh - Mobile 9431024441 C/o. Arun Kr. Verma, H/O Dr. Rita Verma (Rahul Homes), Ramraji Road, Maripur, Maripur, Mazaffarpur. Bihar. Email : [email protected] RANCHI Mr. Gopi Krishna G. Choudury - Mobile 09334251516 C/o. Ravi Shankar, Jaiswal Bhavan, Sukla Colony, Hinoo, Ranchi 834 002. Jharkhand. Email : [email protected] GUWAHATI Mr. Rajat Saikia - Mobile 9864024129 R.K. Choudhury Road, Bharalumukh (Near Kidzee School), Guwahati - 781 009. Assam. E-mail : [email protected] SOUTH CENTRAL REGION SECUNDERABAD Mr. N. Rajasekharan - Mobile 9848048349 310-311, Chandralok Complex, 111, Sarojini Devi Road, Secunderabad - 500003. Tel. : 27811012, 27843351, 27720339 Fax : 040-27897788 Email : [email protected], [email protected] VIJAYAWADA Mr. Neelkanth - Mobile 9848049170 Door No. 32-3-2, Kasturibai Pet, Near Gandhi Statue, Vijayawada - 520010. Andhra Pradesh. VISHAKHAPATNAM Mr. Satesh Kumar - Mobile 9849283690 House No 38-30-51, Sai Nagar, Marri Palem, Vishakhapatnam – 530 018, Andhra Pradesh. Email : [email protected] 74 SOUTH EAST CHENNAI Mr. K. M. Shanmugam - Mobile 9444022478 #341, Old No. 212, Narasimha Garden, E V R Periyar Road, Aminjikarai, Chennai 600 029. Tel : 044-26680472, 26680477 Fax : 044-26680473 Email : [email protected] COIMBATORE Mr. R. Senthil Kumar - Mobile 9443032612 No. 130, Chellappa Gounder Layout Rathnapuri, Coimbatore - 641 027. Tel. : 0422-2332612 Fax : 0422-2333407 Email : [email protected] MADURAI Mr. Thiyagarajan - Mobile 9443149991 Mr. A. Sankaranarayanan - Mobile 9443164388 13A, Bharathiyar Second Street, SS Colony, Madurai 625 010. Email : [email protected] TRICHY Mr. M. Sankarasubramanian - Mobile 9443134353 Mr. S. S. Venkatakrishnan - Mobile 9443321812 54, RMS Colony, 5th Street, Karumandapam, Trichy 620 001. Email : [email protected] TIRUNELVELI Mr. Arumuga Ganesan - Mobile 09443443407 174/17, Nellai Lodge Buildings, S. N. High Road, Tirunelveli 627 001. Email : [email protected] SALEM Mr. S. Easwaramoorthy Room No. 105, No.9/321, C1, Anugraha Mansion, L.I.C. Colony, Vasantham Road, Salem - 630 004. OOTY Mr. Ganeshan 6/71A, MEL Hosatty, Nilgiri Post, Melur, Ooty - 643 221. 75 SOUTH WEST BANGALORE Mr. D. Bharadwaj Mobile : 094480 71079 No.68, 1st Temple Road, Mallikarjunapuram, Malleswaram, Bangalore - 560003, Karnataka. Tel. : 080-23463462, 23463465 Fax : 23464128 E-mail : [email protected] MYSORE Mr. Manjunath Hulla - Mobile 9448071403 Mahadeshwara complex No. A-1, 1st Floor, High Tension Road, Mahadehswar Badavane, Post Metagali, Mysore – 570 016, Karnataka. Tel : 0821-2415759 Email : [email protected] MANGALORE Mr. Venkateshwarulu A. - Mobile 9448063462 1-15-1005/4, Ground Floor, Jyothi Complex, Near Boloors Nursing Home, Urva Stores, Mangalore 575 006, Karnataka. Tel : 0824-2451429 Email : [email protected] HUBLI Mr. S. Shivakumar – Mobile 9448073465 #35, 2nd Floor, M.R. Shettar Complex, P.B. Road, Hosur, Hubli 580 021. Karnataka. Tel : 0836-2377343 Email : [email protected] BIJAPUR Mr. Praveen - Mobile 9448479715 C/o, M. B. Gunadal Math Plot No. 53, Opp. BLDE Hospital, Kalyannagar, Bijapur 586 103. Karnataka. THIRUVANANTHAPURAM Mr. Mohandas - Mobile 09447341098 T.C.28/408(2), Vilayil Gardens, Kaithamukku, Thiruvananthapuram 695024, Kerala. Telfax : 0471-2461095 Email : [email protected] 76 KOCHI Mr. K. Kannan - Mobile 9447236244 XL1/583, 2nd Floor, Krishna Nivas Adv,Easwara Iyer Road Kochi - 682 035. Tel : 0484 - 2361623. Email : [email protected] CALICUT Mr. Bijoy Prakash – Mobile 9447368130 Room No. 103, Balaji Cottage, Chalappuram, Calicut – 3. KANNUR Mr. Sajid - Mobile 9447003682 Juki Mens Hostel, Behind Police (AR) Quarters, Railway Goods Shed Road, Kannur – 2. TIRUVALLA Mr. Pratapan S. - Mobile 9847924619 Indo American Building, Vellavoor, Chenganoor P.O., Tiruvalla – 689 121. THRISSUR Mr. Raju Karthikeyan - Mobile 9847010670 Cheriyappilly House, Mellor P.O., Thrissur - 680 311. KOTTAYAM Mr. Anoop Krishnak - Mobile 98478 70030 Kalayil House, Collectorate P.O., Kottayam - 2. HASSAN Mr. Nagaraj M.L. Aplab Ltd, Room No. 2, C.S.M. Building , 2nd Cross, Behind Mathrushree Hospital, Salegame Road, Hassan - 573 201. Mobile No : 99456 50564 77