1
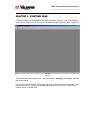
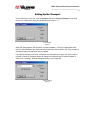
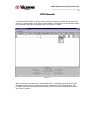
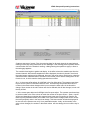
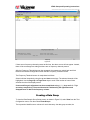
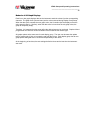
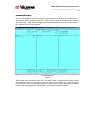
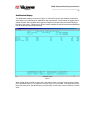
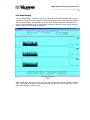
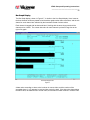
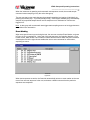
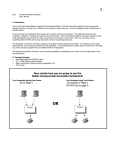
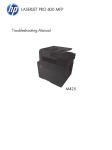
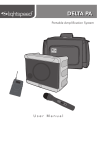
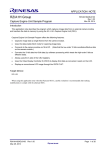
VDAS Setup and Operating Instructions
__________________________________
1
CHAPTER 1. INTRODUCTION .......................................................................................................... 2
GENERAL DESCRIPTION OF SYSTEM ........................................................................................................... 2
The Electronic Unit........................................................................................................................... 3
Computer Requirements .................................................................................................................... 3
The Software..................................................................................................................................... 3
GENERAL METHOD OF OPERATION ............................................................................................................ 4
CHAPTER 2. INSTALLING THE SYSTEM ....................................................................................... 5
INSTALLING THE HARDWARE ..................................................................................................................... 5
Connecting the Cables ...................................................................................................................... 5
INSTALLING THE SOFTWARE ...................................................................................................................... 6
CHAPTER 3. STARTING VDAS ......................................................................................................... 7
SETTING UP THE TRANSPORT ..................................................................................................................... 8
CHECKING THE CHASSIS CONTENTS ........................................................................................................... 9
CHASSIS DIAGNOSTIC .............................................................................................................................. 10
CHANGE IP ADDRESS .............................................................................................................................. 11
REMOTE IN-CIRCUIT PROGRAMMABLE FLASH .......................................................................................... 11
CHAPTER 4. SETTING UP THE TEST INFORMATION FILE..................................................... 14
CREATING A TEST INFORMATION FILE ..................................................................................................... 14
INTERPRETING THE TEST INFORMATION SCREEN ...................................................................................... 17
Saving a File................................................................................................................................... 18
Closing a File ................................................................................................................................. 19
CHAPTER 5. CREATING A TEST CONFIGURATION FILE........................................................ 20
MANUALLY SETTING UP A CONFIGURATION FILE ..................................................................................... 20
Constructing a Formula Entry......................................................................................................... 23
IMPORTING CHANNEL ROWS FROM ANOTHER FILE ................................................................................... 24
Printing a Record of Screen Contents .............................................................................................. 25
DEFAULT CONFIGURATION ...................................................................................................................... 26
SET SLOPE .............................................................................................................................................. 26
STRAIN GAGE AND 100K SHUNT ............................................................................................................. 31
Strain Gage Calibration Screen....................................................................................................... 32
FREQUENCY THRESHOLD......................................................................................................................... 34
CREATING A DATA GROUP ...................................................................................................................... 35
CREATING A DISPLAY GROUP .................................................................................................................. 39
CREATING AN AUTOTEST SEQUENCE........................................................................................................ 41
Viewing an Autotest Screen ............................................................................................................. 42
CHAPTER 6. RUNNING THE TEST................................................................................................. 43
DISPLAYING A SCREEN FOR TEST STARTUP .............................................................................................. 44
INTERPRETING THE TEST STARTUP SCREEN .............................................................................................. 44
DISPLAY APPEARANCE ............................................................................................................................ 46
REAL-TIME DISPLAYS ............................................................................................................................. 46
Screen Content Common to All Displays.......................................................................................... 47
Behavior of All Graph Displays....................................................................................................... 48
Full Display.................................................................................................................................... 49
Condensed Display ......................................................................................................................... 50
Stabilization Display ....................................................................................................................... 51
Large Font Display ......................................................................................................................... 52
Line Graph Display......................................................................................................................... 53
Bar Graph Display.......................................................................................................................... 54
VDAS Setup and Operating Instructions
__________________________________
2
Mixed Line-Graph Display.............................................................................................................. 55
Mixed Bar Graph Display ............................................................................................................... 56
Data Sampling ................................................................................................................................ 56
Event Marking ................................................................................................................................ 57
CHAPTER 1. INTRODUCTION
The Validyne Data Acquisition System (VDAS) selects, processes, displays, and records realtime measurement data from a collection of sensors in accordance with user-customized
configuration files.
The measurement system is comprised of three elements - a hardware chassis of electronic
cards, a computer, and controller software. The controller, running under Windows 98, serves as
the user interface with the measurement system.
This user manual primarily covers operation of the software, the Validyne Data Acquisition
System (VDAS) Controller. Simple procedures for installing and connecting the various
components of the system are covered in Chapter 2.
The VDAS Controller's functions include:
• Delivering data from the electronic card chassis to the user during and after test
sequences
•
Configuring individual tests by data channels and data groups
•
Controlling the execution of tests in designated sequences
• Manipulating the raw data from selected channels into a desired form by formula,
unique to each channel
•
Structuring the real-time display of test results as a selected type of presentation
•
Storing test results in files along with test information header for ready reference
General Description of System
Two of the three major components in the measurement system - the chassis and the software
controller - are products of Validyne Engineering Corporation. The third component is a computer
running Windows 98. This is available commercially and is not included with the VDAS system.
VDAS Setup and Operating Instructions
__________________________________
3
The Electronic Unit
The VDAS 1500 electronic unit (main chassis) supplies data inputs for the Validyne Data
Acquisition Controller. It can provide up to 300 channels of digital data obtained from various
analog measurement devices, such as thermocouples and strain gauges.
This hardware unit consists of one communications module and up to fifteen card modules of
selected types, depending upon the measurements required by the planned test. The unit can be
placed at any convenient location within the test environment.
VDAS 1500
Figure 1.0
Computer Requirements
The desk or laptop computer must be able to support serial communications at 115,200 baud or
bi-directional parallel communications per the IEEE 1284 specifications. It must also provide a
means to add an optional Ethernet interface through either a PCMCIA port or other equivalent
hardware port.
The Software
For ease of learning and operation, the software is menu-driven. Pull down menus permit the
user to control the electronic chassis, configure tests, view data, record test results, etc. quickly
and efficiently.
There are three types of screens: Data Entry, Display, and Help. All of these screens and their
fields can be accessed through pull down menus with the mouse or on the keyboard with specific
keys that govern selection and cursor movement. These keys are described in the Keyboard
Reference shown in Figure 1.2.
VDAS Setup and Operating Instructions
__________________________________
4
Keyboard Entry
Figure 1.2
Help screens, which are accessed through a function key, are in smaller windows so they can
overlay the original screen without obscuring it completely.
General Method of Operation
The Controller software is the user interface to the operating system. This software is used for
both configuration and testing. In fact, the only switch on the VDAS chassis is for power.
Data can be stored onto your computer’s hard drive based on the configuration file that is created
in the controller software. Configuration files can be edited and saved for later use, allowing the
user to create a library of configurations for the various tests that are run.
VDAS Setup and Operating Instructions
__________________________________
5
CHAPTER 2. INSTALLING THE SYSTEM
Before the VDAS system can be used to collect and/or display data, installation of the plug-in
cards, power and communications port cables, and controller software is required.
Installing the Hardware
The electronic chassis must be properly configured with the necessary plug-in cards. Both the
user and the chassis should be properly grounded prior to any handling. The communication
module always occupies the extreme left position in the chassis – slot 0. The remaining cards can
occupy any position within the chassis with each slot corresponding to a discrete set of channels.
Slot 1 corresponds to physical channels 0-19, slot 2 corresponds to physical channels 20-39 etc.
Connecting the Cables
The following connections between the computer and the chassis are required.
Power cable. This is a customer supplied item and supplies power at a nominal 12 VDC to
PS914 at the left of the chassis.
One of the following communication methods is required to operate the system. The type of
method depends upon the length of cable required to go from computer to chassis, and the
amount of data setup in system. Serial communication severely limits the data rate. Ethernet and
ECP do not.
Ethernet Connection. This is a standard RJ-45 cable, which must be connected at the chassis
end to the Ethernet connector on the communication module, and to the RJ-45 network
connection on the computer end.
- or Serial Connection. A standard RS-232 cable is used to connect at the chassis end to the RS232 connector on the communication module and the computer end to the serial connector.
- or Parallel Connection. This is a standard IEEE-1284 cable, which connects to the ECP connector
on the communication module and the parallel connector on the computer. A widely available and
acceptable type is Belkin F3D111-10.
VDAS Setup and Operating Instructions
__________________________________
6
Installing the Software
The VDAS Controller software, which is provided on a CD ROM, is identified on its label as
VDAS.
To install the software onto your computer’s hard disk (the C drive), use the following procedure
while running Windows 98.
1.Insert the CD ROM and follow the instructions which appear on the screen.
or
2.Click on the Start button at the bottom of the screen, and choose Run from the pull up menu.
3. Select the CD ROM drive and select the file SETUP.EXE.
The next step, running the VDAS program, is described in chapter 3.
VDAS Setup and Operating Instructions
__________________________________
7
CHAPTER 3. STARTING VDAS
Following completion of the installation procedure described in Chapter 2, start VDAS by double
clicking on the desktop icon. VDAS will load and present the opening screen, shown in figure 3.0.
Main Menu
Figure 3.0
The first time the VDAS program is run, users should refer to Setting up a Transport, described
later in this chapter.
Power up the chassis, and wait until the green lights are illuminated on each chassis card. Wait
ten more seconds. Verify that the chassis and the computer are connected to each other via
Ethernet, Serial or Parallel cable.
VDAS Setup and Operating Instructions
__________________________________
8
Setting Up the Transport
On the main menu, figure 3.0, click on Transport and select Transport Dialog from the drop
down menu. Observe the dialog box as shown below in figure 3.1.
Select Transport
Figure 3.1
When the dialog appears, the OK button is grayed (disabled). Click on the appropriate radio
button to select transport and VDAS will test that particular communication link. If the transport is
operating properly, the OK button will be enabled.
If an ethernet transport is selected, a dropdown box will appear as in figure 3.2 and you will be
required to select an IP address before the transport is tested and the OK button enabled. In
either case, a message “Selected transport working” will be displayed.
Select IP Address
Figure 3.2
VDAS Setup and Operating Instructions
__________________________________
9
Checking the Chassis Contents
On the main menu, figure 3.0, click Maintenance then select Chassis Information. Observe the
dialog as shown below in figure 3.3.
Chassis Information
Figure 3.3
Note: The dialog will appear as shown only if the transport link to the chassis is working.
To obtain information on each slot in the chassis, click the Get Info button. Any slots not
occupied by cards will be marked as EMPTY SLOT in the left-most column. Any occupied slot
will display the serial number in the leftmost column, the calibration date in the middle column and
the software version number in the rightmost column.
VDAS Setup and Operating Instructions
__________________________________
10
Chassis Diagnostic
On the main menu, figure 3.0, click Maintenance, then choose Diagnostics, or press Control +
Z. Observe the dialog as shown below in figure 3.4.
Chassis Diagnostic
Figure 3.4
Note: The dialog will appear as shown, only if the transport link to the chassis is working.
Click on the Inventory button. Rows of information will appear, one for each card in the chassis
and the Status button will be enabled. Push the Status button and wait approximately thirty
seconds. The rightmost cell of each row will display the word PASSED or FAILED. If a card is
flagged as failing, click in the rightmost cell and a message box will display the detailed status of
that card.
VDAS Setup and Operating Instructions
__________________________________
11
Change IP Address
Click on main menu, figure 3.0, item Maintenance, then choose Programmable LAN Addressing,
or press Control+L. Observe the dialog as shown below in figure 3.5.
LAN Address
Figure 3.5
NOTE: Dialog will not appear as shown unless transport link is working.
Change the data in the edit boxes and click Set Chassis Data. Two dialog boxes will appear. The
first will warn that chassis data will be changed. The second will inform that chassis data has
been changed and you will be instructed to reboot the chassis. Do this by cycling chassis power.
Remote In-Circuit Programmable Flash
This feature is used to update the on-board software of all cards of an operator selected type.
Software updates are supplied by Validyne and must be available at the time this feature is used.
Click on main menu, figure 3.0, item Maintenance, then on Remote In-Circuit Programmable
Flash, or enter Control+R. If this is the first time this feature has been used on this machine, the
following will be displayed.
Password Alert
Figure 3.6
This is a precaution to prevent unauthorized persons from modifying the chassis firmware. Press
OK to load the next dialog.
.
VDAS Setup and Operating Instructions
__________________________________
12
New Password – First Time User
Figure 3.7
Decide on a new password (ten alphanumeric characters or less) and enter it into the top and
bottom fields of the new password dialog. Click OK when you have completed your entry. If this is
not the first time the remote programmable flash feature has been used then a different dialog will
be presented.
Existing Password
Figure 3.8
Should the password have been forgotten or lost it will be necessary to contact VDAS tech
support before proceeding further. In either case, once a password has been entered, the dialog
below will appear.
Remote In-Circuit Programmable Flash
Figure 3.9
Select the card type you want to re-program and press OK. The following warning notice appears
as illustrated in figure 3.10.
VDAS Setup and Operating Instructions
__________________________________
13
Remote In-Circuit Programmable Flash Function Warning
Figure 3.10
Click Yes and another dialog box will appear.
Open Remote Programmable Flash File
Figure 3.11
Select the appropriate file and click Open. Continue by selecting OK through the dialogs which
follow. After the remote flash programming is complete, it will be necessary to cycle chassis
power.
VDAS Setup and Operating Instructions
__________________________________
14
CHAPTER 4. SETTING UP THE TEST INFORMATION FILE
To indentify test results, you may enter descriptive information before initiating a test. This data
will be copied into the test results file at the start of each test.
Test Information Files can be prepared either before or after the other setups required for
configuring the individual tests and their sequences, described in the next chapter.
Creating a Test Information File
From the the Main Menu, Figure 3.0, click on File and select New or enter Ctrl-N. A window
entitled Select File Type will appear.
Test Information File is already chosen as the default, as shown in Figure 4.0. Click OK to
confirm.
Select File Type
Figure 4.0
VDAS Setup and Operating Instructions
__________________________________
15
The Test Information File screen opens as shown in Figure 4.1.
Test Information File
Figure 4.1
Like all of the main data-entry screens, the Test Information File screen is divided into three
sections: top, middle, and bottom.
VDAS Setup and Operating Instructions
__________________________________
16
Press Shift, F1, for a list of Help Topics, as shown in Figure 4.2.
Help Test Information File
Figure 4.2
To return to theTest Information screen, press Esc.
VDAS Setup and Operating Instructions
__________________________________
17
Interpreting the Test Information Screen
A field for the name of the Test Information File is located in parenthesis at the top, left hand
corner of the screen, as illustrated in Figure 4.3, below.
The middle section accepts up to 200 descriptive entries, for a total of 5120 bytes.
The legends in the bottom section of the screen define the operations that can be performed.
Begin data entry by pressing (F2) to add a new row. To move between rows, use the Tab key to
go to the next field, Shift-Tab to access the previous field, or simply click the mouse in the
desired field. As the entries progress into a list, rows can be deleted (F3) or blank rows can be
inserted into the list (F4).
To open an existing file, press F6 or Ctrl-O. To save a new or modified file press (F7) or Ctrl-S.
Print a report of the screen data by using (F8) or Ctrl-P. Press F9 or Alt-X to return to the Main
Menu. Press F1 or Alt-H to access the Help menu. Press Esc to exit from Help.
Test Information Screen
Figure 4.3
Note: You may enter a maximum of 200 rows and 5120 bytes. A message at the bottom of the
data portion of the screen keeps the user advised of the number of entries.
VDAS Setup and Operating Instructions
__________________________________
18
If the need arises, delete a highlighted row with F3, or insert a row before the highlight
with F4.
To print the current data listing, press F8.
Saving a File
When entries are complete, or to save them at any time during entry, press F7.
The current file name will be displayed in the File Name field of the Save As screen as shown in
figure 4.4.
Test Information Save As
Figure 4.4
Click on the Save button or change the name of the file in the File Name field. The suffix is
always VEH, set by default.
Press Esc to cancel this action or to start over.
With the correct directory and file name set in the Save As screen, click the Save button.
When the Save operation is complete, the program will return to the Test Information screen.
VDAS Setup and Operating Instructions
__________________________________
19
Closing a File
When the Test Information File is complete, press F9 to exit, back to the Main Menu.
If the file has not been saved, an overlay warning message box will appear prompting the user to
save changes to the current file as illustrated in Figure 4.5.
Test Information Save Changes
Figure 4.5
To clear this message, either press the No button to abort the changes and exit to the Main
Menu, or continue working by pressing the Cancel button.
To exit the program, select File from the Main Menu, then choose Exit from the pull down menu,
or simply press Alt-X.
VDAS Setup and Operating Instructions
__________________________________
20
CHAPTER 5. CREATING A TEST CONFIGURATION FILE
To open a blank Test Configuration File, begin at the screen shown in Chapter 3, figure 3.0,
select File from the pull down menu and choose New or enter Ctrl-N. The dialog shown in figure
4.1 will appear. Click on Test Configuration File and click OK.
A Test Configuration Menu screen appears, as shown in Figure 5.0.
Test Configuration File
Figure 5.0
There are three options for generating configuration files. These are:
1. Manual
Import
Default
Manually Setting up a Configuration File
To setup the channels, press (F2) and a new data entry field for a channel will appear. For each
new channel entry, press (F2). The screen begins to take on an appearance as shown in Figure
5.4. To enter a block of channels, press Control+F2 and choose the number of channels to add.
VDAS Setup and Operating Instructions
__________________________________
21
Channel Setup Screen
Figure 5.1
The screen is divided into three sections; top, middle, and bottom. This configuration is used
throughout the program.
The top section of this screen identifies columns for each channel entry. The entry includes a
name, a symbolic channel number, its physical channel number, the type of channel, its range, its
precision, an optional scaling formula, a DSP filter bandwidth, a volt range, a volt threshold
percentage, an input frequency range, a pulse count reset interval, and two optional alarm
settings.
The middle section accepts entry of up to 300 channels (rows).
The legends in the bottom section of the screen define the operations that can be performed and
their associated function keys. Here you will find operations to add, delete, insert, import, and sort
channels, as well as file management functions to open, save, print, and close files.
The first column, which is the channel name field, can accommodate a name up to 50 characters
in length. The characters scroll to the left as data is entered into the field, if the name is more than
25 characters in length.
The next two columns, the symbolic and physical channel numbers, provide a way to map
channels. The symbolic channel number (Sym Ch#) allows the user to tag that channel in some
convenient way. The physical channel number (Phy Ch#) is the actual channel location on the
main chassis that provides the data. These two numbers permit the changing of physical
transducer connections without re-sorting through the data list to generate equivalent output data
VDAS Setup and Operating Instructions
__________________________________
22
files. Both numbers can be up to three digits long but must be unique.
The Type column is a toggle field that denotes the transducer type for each channel. There are
many types available, and each has a four-letter representation containing one capital letter. To
select an entry, click on the pick list in that field to pull down a menu of choices and click on the
appropriate choice.
The available input types are listed as follows:
Thermocouple J
Thermocouple K
Thermocouple T
Voltage
Pulse Frequency
Pulse Width
Pulse Count
Duty Cycle
Strain Gage
Computed Channel
A computed channel is a pseudo channel based on the data values of other channels. The
derivation of these values is described by the entry in the Formula column.
The Range is a four-character field, which corresponds to the entry in the Type field. There will be
either a default value or a pick list in the Range field, based on what is entered in the Type field.
The Resolution column is a toggle field that allows selection of a uniform precision for the output
data values on the channel. The choices are indicated in the pull down menu in the field (with
display of # in the field), tenths (#.#), hundredths (#.##), and thousandths (#.###).
The Formula column is for a mathematical formula that is applied to the raw data before the main
chassis delivers it to the controller. A formula can be up to 50 characters long. Such formulas can
achieve several goals, such as scaling a channel value to specific engineering units. It can also
be used to define computed (Comp) channels.
Note: The syntax for a formula is described in detail under the next heading, Constructing a
Formula Entry.
The alarm channels (Alarm 1 and Alarm 2) are for data values with special meaning to the user
and are useful when monitoring critical channels. When the channel data exceeds one or both of
these preset values, the program flags the channel and warns the user. Deleting the text in either
alarm column causes the program to display "none," indicating that no alarm is set.
Begin data entry by adding a row (F2), which contains default data. To move between fields use
Tab (next field) and Shift-Tab (previous field). As the entries progress into a list, rows can be
deleted (F3) or inserted (F4). Rows can be sorted in various ways (F11). Sorting can be done
according to channel name, symbolic channel number, physical channel number, or channel type,
as shown on the channel sort screen. There is also an option to sort in ascending or descending
order.
Data can be imported from another file (F5), see the section “Importing Channel Rows from
Another File”, in this chapter below.
VDAS Setup and Operating Instructions
__________________________________
23
Constructing a Formula Entry
A formula contains constants, operators, channel numbers, and function names. It can have up
to 25 characters.
On non-computed channels (types other than Comp), the formula represents a scaling transform f
(x) specified as a mathematical expression. The raw channel value is given by the special
notation "#". Allowable operators are: (unary) -, +, (binary) -, *, and /. The operators are
evaluated from left to right with no precedence considerations.
For example, a linear scale of f (x) = -3.45x+20 is achieved by entering -3.45*#+20 in the formula
field. Note that 20-3.45*# is not equivalent because 20-3.45 would be evaluated before *#.
On computed channels (type Comp), the formula starts with a 3-letter function name, followed by
a list of symbolic channel numbers separated by commas. The allowed functions are defined in
the following table.
Function
Description
Min
Evaluates each channel in the list and reports the minimum
value*
Evaluates each channel in the list and reports the maximum Up to 5
value*
Evaluates each channel in the list and reports the average
Up to 5
value*
Evaluates the difference between the first and second
channel**
Assumes the first channel in the list is a temperature
channel and the second is a pressure channel. Evaluates
both channels and returns the superheat temperature
based on the formula described below.***
Assumes the first channel in the list is a temperature
channel and the second is a pressure channel. Evaluates
both channels and returns the subcool temperature based
on the formula described below.***
Channels in the list that are open or otherwise in error do not count in this
computation. When all listed channels are open, this channel reports error.
Max
Avg
Dif
Sht
Sct
*
**
***
Number of
channel
parameters
Up to 5
Reports error if either channel is in error.
Reports error if either channel is in error or the calculation results in
overflow.
Formula Values
Figure 5.2
VDAS Setup and Operating Instructions
__________________________________
24
The forumlas for superheat and subcool temperatures are:
sht = Tsat - (T + 459.69)where T is the channel temperature in degrees F and adding 459.69
converts F into Rankine
sct = (T + 459.69) -Tsat
7.1364
Tsat* + (214 +459.69
where P is the pressure in psi
7.1364 - ln ( P + 14.696 )
589.
Note: This equation is valid for R134a refrigerant only. The equation can be altered in the
field by typing the new data into the formula column.
Importing Channel Rows from Another File
(Note: To combine new and imported channels, always begin by importing, then add new lines.)
To import channels, press F5. A message will appear, warning the user that importing channels
destroys the current list.
Choose one of the following:
To cancel Import and return to your current channels, click No
To continue with import click Yes
The Open Channel Import File window appears as shown in Figure 5.3, and displays the files
available from the current drive and directory.
Open Channel Import File
Figure 5.3
VDAS Setup and Operating Instructions
__________________________________
25
To set a different drive or directory, click on the File Up arrow in the Open Channel Import File
window until the appropriate drive or directory is found.
After setting the directory and obtaining a new list of available files, click on the selection desired
and click Open.
The Channel Select screen reappears with the imported columns.
Printing a Record of Screen Contents
To print the current channel listing, press F8.
VDAS Setup and Operating Instructions
__________________________________
26
Default Configuration
Warning: This feature will delete every entry from the current configuration. Every entry will also
be deleted from existing data and display groups.
The default configuration feature is useful in that it places every channel on each card into the
current configuration display. In order for this feature to operate properly, the chassis must be
powered up and the transport link working properly. Choose Edit from the configuration menu,
and then click on Default Configuration. After VDAS has finished adding entries to the current
configuration, it will be necessary to re-configure the data groups and the display groups.
Default Configuration
Figure 5.4
Set Slope
The set slope function will generate a formula having a format of y = mx + b and place that
formula in the formula column. First, select a voltage channel in the configuration screen, select
View from the menu bar, and choose Set Slope, or enter Control + B. If the selected channel is
VDAS Setup and Operating Instructions
__________________________________
27
of type Volt as indicated in column 8, the following dialog will appear.
Set Slope Dialog Box
Figure 5.5
Should the selected channel not be a voltage channel, a warning dialog will appear instead. The
operation of this feature is to record the channel output data at two discrete points. When data at
the second point is recorded, the software calculates m and b in the above equation.
Adjust the low point voltage input to the selected channel and observe channel output in the edit
box captioned Raw Data. Enter the proper y vallue and click on the Set button, which is opposite
the word Low as illustrated in Figure 5.5.
Next, adjust the high point voltage to the selected channel, enter the appropriate y value, and
click on the Set button, which is opposite the word High. Observe the edit boxes marked Scaled
Output, Slope and Offset are now filled with data. Observe also that the cell in the formula column
now contains a formula reflecting the values in the dialog box.
VDAS Setup and Operating Instructions
__________________________________
28
Set Slope
Figure 5.6
Repeating 1 and 2 above can further refine the figures, although it should not be necessary. Click
on OK. The dialog will disappear and the formula will remain.
VDAS Setup and Operating Instructions
__________________________________
29
RTD Channels
The Resistive Thermal Device (RTD) card has sixteen consecutively numbered channels which
operate in a similar fashion to the thermocouple channels. The channel type is selected manually
by the operator using the type dropdown menu. See Figure 5-7 below.
Figure 5-7
When the operator uses the mouse, as described above, to designate a channel as RTD type,
the adjacent Range column will change to contain a dropdown list of RTD probe types. The
Formula column will become blank and the Channel Units column will contain the word Ohms.
See Figure 5- 8 below.
VDAS Setup and Operating Instructions
__________________________________
30
Figure 5-8
The RTD card accepts eight types of temperature probes which can be selected using the drop
down menu in the Range column as shown. The probes types, available from various
manufacturers are:
3 Wire, 0.5 MA
3 Wire, 1.0 MA
3 Wire, 2.5 MA
3 Wire, 5.0 MA
4 Wire, 0.5 MA
4 Wire, 1.0 MA
4 Wire, 2.5 MA
4 Wire, 5.0 MA
The RTD channel output is always in ohms and this is the default Channel Units. However, the
operator can choose to display the probe output directly in degrees using any temperature scale
he chooses, provided he enters the scaling algorithm in the Formula column. For more
information, see the topic “Constructing a Formula Entry” above. This formula itself is often
printed on the probe.
VDAS Setup and Operating Instructions
__________________________________
31
Strain Gage and 100K Shunt
VDAS contains a feature to allow an operator to do pre-test and post-test calibration on strain
gage channels. This feature can be invoked from the configuration screen, the start test dialog
and the test events dialog. Prior to pre-test calibration, metrology lab data must be entered on
the configuration screen as shown below.
Figure 5-9
Metrology lab data for Span+, Span-, Min/Max, BExc, and SLeg must be entered for each strain
channel prior to strain gage calibration. The controller will be unable to calibrate any channel
missing Span+, Span-, or Min/Max data. The meaning of these numbers is as follows:
Span+ is the expected excursion, expressed in engineering units, of the strain gage channel
output, scaled by the formula under the conditions of SLeg+, the 100K shunt in circuit and no
force applied to the strain gage.
Span- is the expected excursion, expressed in engineering units, of the strain gage channel
output, scaled by the formula under the conditions of SLeg-, the 100K shunt in circuit and no
force applied to the strain gage.
Min/Max is the expected full scale excursion, expressed in engineering units, of the strain gage
output with maximum allowable force applied to the strain gage.
BExc is the excitation voltage applied to the strain gage. Possible values are 10 volts, 5 volts and
zero volts. The choice of 10 volts or 5 volts excitation has no effect on the channel output since
this is expressed in millivolts per volt of excitation voltage.
VDAS Setup and Operating Instructions
__________________________________
32
SLeg refers to the leg of the wheatstone bridge to which the 100K shunt is applied. The terms
SLeg+ and SLeg- are arbitrary and bear no reference to polarity.
From the configuration screen, the strain gage screen can be invoked by selecting Bridge
Amplifier from the View menu, or by entering Ctrl+G on the keyboard. See figure 5-8 below.
Figure 5-10
Strain Gage Calibration Screen
The strain gage calibration screen, shown below in Figure 5-9, is a read only screen. i.e. The
operator can not click on any individual cell and type in data. Changes can however be made by
using the keyboard inputs listed at the bottom of the screen. For the calibration feature to be
useful, the chassis must be powered up and the communication link must be working properly.
The keyboard inputs function as follows:
Alt+L changes SLeg+ to SLeg- and vice-versa. This operation determines to which leg of the
wheatstone bridge the 100K shunt will be applied. The default selection is SLeg+ which would be
appropriate if calibration were being carried out in anticipation of a positive going output from the
strain gage.
Alt+B changes BExc between 10V, 5V and 0V.
VDAS Setup and Operating Instructions
__________________________________
33
Figure 5-11
S starts a sequence of events. First, the metrology data for all strain channels is examined and
missing or obviously wrong data cause an error message. If the metrology data is present and the
communication link to the chassis is working, a dialog warning the operator to apply no force to
the strain gage appears.
The controller then begins to gather and display, in the offset column the scaled output from the
selected channel. After several samples have been displayed, the shunt is placed in circuit and
the scaled output continues to be displayed, but now in the value column. At this point, unless the
channel has been calibrated earlier, the offset in the formula is zero and the scaling factor in the
formula is one, in which case the scaling operation has no effect.
Alt +/- is the coarse offset adjust. Alt Left/Right is the fine offset adjust. The operator uses these
keys to set the number in the offset column to zero. As these keys are pressed and held, the
number in the offset column changes which in turn causes the offset value in the formula to
change. Since number in the value column will also be affected, this will also change, but not until
the key is lifted.
+/- is the coarse span adjust and Left/Right is the fine span adjust. The operator uses these keys
to set the number in the value column to match the number in the span column. Span+ or spanwill be used depending on whether the expected strain gage output is positive or negative. As
these keys are pressed and held, the number in the value column changes which in turn causes
the scale (multiplier) value in the formula to change. This latter number will also be displayed in
its own cell so the operator can verify it is a reasonable number. Lastly, as the number in the
value column changes, the number in the offset column will also change, but not until the key is
lifted.
VDAS Setup and Operating Instructions
__________________________________
34
The operator will be obliged to alternately adjust both columns until no further adjustment is
needed.
Up/Down will change the channel selection. If this option is used while the communication link to
the chassis is active, there will be a delay, while the link is shut down.
Ctrl+C is always the exit from the strain gage screen. This brings up the channel configuration
screen.
PreTest and PostTest
The start test dialog and the test events dialog, each contain a pushbutton leading to the strain
gage screen. In the Pre-Test case, strain gage screen invoked from the Start Test dialog,
execution will return to this dialog upon exit from the strain gage screen, after passing through the
channel configuration screen. The test events dialog however, treats the execution path
differently. In this case, exit from the strain gage screen is still via the channel configuration
screen, but exit from this screen does not return to the test events screen.
Frequency Threshold
VDAS contains a feature that adjusts frequency channel signal gain before testing begins. This
feature, called Frequency Threshold Adjustment, can be started by first clicking on menu item
View and then on Frequency Threshold, or by clicking on Control + F, after which the screen
shown in figure 5.7, below will appear. For the frequency threshold feature to be useful, the
chassis must be powered up and the communication link must be working properly.
VDAS Setup and Operating Instructions
__________________________________
35
Frequency
Figure 5.12
If there are no frequency channels present at this time, the above screen will not appear. Instead,
there will be a message box stating that there are no frequency channels present.
After the Frequency Threshold screen has appeared, the operator can switch back and forth
between the Channel Configuration screen and the Frequency Threshold screen.
The Frequency Threshold screen is manipulated as follows:
Select individual channels by using the up and down arrow keys. The selected channel will be
highlighted. Use the Page Up and Page Down keys to scroll if the number of rows of data
exceeds the size of the display screen.
Coarse and fine gain adjustment can be accomplished using (+) / (-) keys and Left / Right
arrow keys respectively. The actual threshold is indicated by the appearance and
disappearance of data in the frequency column.
Creating a Data Group
To view the Data Sample Group Setup screen, as shown in Figure 5.8, select View from the Test
Configuration menu, click then choose Data Groups.
The top section identifies seven columns for each data entry: the data group number, the
VDAS Setup and Operating Instructions
__________________________________
36
channels in that group, the basis for the sample rate (time or channel value), the channel delta,
sample interval, sample count, and start and stop triggers.
The middle section accepts up to 20 data groups, numbered in sequence. When each new line is
added, default data is shown as a positioning aid.
Configuration Data
Figure 5.13
The legends for the data-entry operations are listed at the bottom screen. Click on column 2
(Total Channels) to open a second screen.
VDAS Setup and Operating Instructions
__________________________________
37
This second screen, shown below in Figure 5.10, is for channel selection and is called Data
Group Channel Selection.
Data Group Channel Selection
Figure 5.14
In the left column, highlight the channels you wish to select and click the > button. The selected
channels will appear in the rightmost column. To select all the channels, click on the >> button.
To deselect a channel in the rightmost column, select the channel by highlighting it and click on
the < button. To deselect all the rightmost column channels, click on the << button.
To highlight more than one channel, click on the first channel and drag the mouse down the list.
Note: A channel can be part of more than one data group. This presents no difficulty in the
selection procedure because each group employs its own data group number.
When finished with this data group, the user is returned to the Data Groups Configuration screen
where the entries for the row can be completed.
Columns 3 and 4 work together. The default entry for Sample On is listed as time in seconds. A
channel value change will trigger a sample. Any entry, other than time, in the Sample On column
is interpreted as a channel number, whose delta value will cause a data sample to be taken.
Column 7 can also be set to start data collection when a particular channel reaches a
predetermined value.
VDAS Setup and Operating Instructions
__________________________________
38
The Sample Interval value for a time-based sample must be expressed in hundredths of a
second. No entry (the default zero) indicates a manual sample.
The Sample Count value is the number of samples to be taken before discontinuing testing with
this data group. No entry means indefinite sampling.
The two optional columns labeled Start and Stop Triggers define when the channels in the data
group will automatically start/stop sampling. When the trigger is set to “Manual,” the data group
won’t automatically start/stop sampling. To define a start or stop trigger, click on the button at the
head of the start or stop column respectively. A trigger window displaying a list of available
channels will open, and data values can be set.
VDAS Setup and Operating Instructions
__________________________________
39
Creating a Display Group
To access the first setup screen for the third main category of configuration data, click View then
select the Display Groups option from the Test Configuration menu, or press Ctrl-I. The Display
Groups setup screen, as shown in Figure 5.10, is used to configure the real-time display screens
that will be viewed during the data collection process.
Configuration Display
Figure 5.15
Data entry in this screen is performed in essentially the same manner as in Data Groups. There
are three columns for data entry for each display group: the Group Number, the Display Type,
and the Total Channels.
The middle section accepts up to 20 display groups, each with its own channel list and its own
display type. There are eight display types available.
To select a Display Type, use Tab or mouse click to put the cursor on the column, and click on
the pick list in the Display Type field to display the eight menu choices.
VDAS Setup and Operating Instructions
__________________________________
40
The following table (Figure 5.11) provides a description of the Display Types available.
Type
Full
Condensed
Stabilization
Large Font
Line Graph
Bar Graph
2 Line + Nums
3 Bar + Nums
Description
For viewing each channel's symbolic number, the full 50-character
channel name, the current data value, and the two alarm values
For viewing three columns of channel values, to get as many channels
on the screen as will fit
Displays the last 5 data samples recorded for each channel, to reveal
trends for stabilization test requirements
Displays 10 values with enlarged fonts
Displays each channel's values in line graph format
Displays each channel's values in bar graph format
Displays 2 line graphs with large font numbers
Displays 3 bar graphs with large font numbers
Types of Displays
Figure 5.11
Note: For illustrations of these display types, refer to Chapter 6, Running the Test, under the
heading Interpreting the Real-Time Displays.
To identify the channels for this display group, double click on the Total Channels column. The
Display Group Channel Selection screen will appear with its group number in the title, as shown
in Figure 5.12.
Display Group Channel Selection
Figure 5.16
VDAS Setup and Operating Instructions
__________________________________
41
To make channel selections, click on the desired channel from the list of Available Channels, and
then click > to move the highlighted channel into the Selected Channel list.
For a real-time graph display, click on a selected channel in the rightmost column to
activate the graph fields at the lower right of the dialog. The graph fields are used for
setting limits in the graphical display. Enter values into the fields for Graph Max, Graph
Min, and Threshold and click OK. mple Display Group Setup Screen
Creating an Autotest Sequence
The Test Script Setup Screen is the final setup screen in the configuration file, and is used for
entering the steps in the test sequence (Figure 5.13). To access this screen, choose View, and
then select Autotest Sequence or press Ctrl-A.
Auto Test Sequence
Figure 5.17
This screen has four columns for the step number, start condition, optional time interval limit, and
a message to appear at the beginning of the step.
The middle section can accept up to 20 steps to annotate and possibly limit a test.
Adding a row enters default information, with each row numbered in sequence.
With the cursor in the Start column, the down arrow toggles the entry between Auto (to start
according to the start trigger for the active data sample group) and Immediate (indicating the
sampling should begin immediately).
VDAS Setup and Operating Instructions
__________________________________
42
The optional Interval value limits the time to be spent on this step during test. The default
value is 0. When the interval elapses, the test proceeds with the next step.
The opening message might be a prompt for an inexperienced tester, or an instruction or
reminder to do something. For example, "Go to track, press tab at mile marker 0.0" or "Take data
at each compass point for 5 laps." The message remains until any key is pressed.
Viewing an Autotest Screen
After opening a test configuration file, the four setup screens can be accessed in any order.
However, they should generally be viewed in the order listed because some of the setups require
information from previous screens. In particular, the channels must be selected before data
groups and display groups can be set up.
To save a file at any time, click on menu item File and again on Save.or else enter Control + S.
To rework an existing file, begin with the procedure for opening a file.
VDAS Setup and Operating Instructions
__________________________________
43
CHAPTER 6. RUNNING THE TEST
To begin a test, click on File and choose Start Test from the pull down menu, or press Ctrl-T. A
display window entitled Test Startup Parameters will appear with the latest .tif, .cfg, (input files)
and .dat (output file) files created as the default entries populating the appropriate fields. These
fields are for setting a few run-time options: Sample Tone, Alarm Level, Test Mode, and
Communication Port. The testing, then proceeds, according to the conditions previously set up in
the Test Configuration File, operating under either automatic or manual control as specified.
As testing continues, some events may be deemed worthy of recorded comment by the user.
These events can be marked as they occur for later annotation.
A test can be run any time after its Test Information File and its Test Configuration File have been
defined. Typically, these files may be prepared by individuals other than the tester, and as time
goes on, many tests may be conducted as repeats, using files that have been run before.
For step-by-step instructions, refer to the section titled Procedure for Beginning a Test and the
other procedures later in this chapter.
It is assumed that the user has no previous knowledge of how to set up the necessary files, so
this chapter repeats the information needed to start a test from the "computer turned off"
condition.
VDAS Setup and Operating Instructions
__________________________________
44
Displaying a Screen for Test Startup
To display a Test Startup screen, begin at the Main Menu and click on File to display the pull
down menu. Choose Start Test from the File menu or simply press Ctrl-T.
A Test Startup Parameters screen appears, as shown in Figure 6.0.
Test Startup Screen
Figure 6.0
Interpreting the Test Startup Screen
The middle section has three fields for entry of file names - two for input files (.TIF for test
information and .CFG for test configuration) and one for output test results (.DAT). On first-time
use, these are all blank. With later startups, the names of the input files last used appear in their
fields to facilitate continued testing.
Five fields for setting run time operations appear beneath the file names. Normally, these options
will only be set once, to adjust the parameters to personal preferences. Thereafter, it is just a
matter of entering the file names and running the test.
The first run-time option is Sample Tone, an on-off toggle field that controls a low-pitched beep
that indicates the instrument is taking data. This option is useful for applications with low sample
rates as a reminder that the instrument is still working.
VDAS Setup and Operating Instructions
__________________________________
45
The Alarm Level option is a toggle field that cycles through three settings - Visual, Audible, and
Warning. These settings determine how the instrument reacts to channel values that go beyond
the alarm values that were set in the channel setup screen, as follows:
•
Visual (meaning visual only): Displays visual cues that inform you the channel alarm
values have been exceeded. This function is always active, co-existing with any other level
selected, and is the least distracting of the three.
• Audible: Generates a short, high-pitched beep every time a channel value exceeds either of
its alarm values. The sound augments the visual cues to catch the user’s attention.
• Warning: Generates a long, high-pitched beep the first time a channel value exceeds either
alarm value. The VDAS Controller then pauses the real-time display to place a warning message
on the screen, which the user must be acknowledge to continue testing. This setting is the most
distracting, but it assures that the user is made aware of the threatening condition.
The Test Mode option field is another toggle with three values - Normal, Monitor, and Simulation.
• Normal: The mode most often used. The VDAS Controller automatically provides a data
backup file.
• Monitor: Not yet implemented.
• Simulation: For checking system operation by sampling a default configuration of channels,
without the added complexity of user configuration files.
The Communication Port option governs the mode of communication between the main chassis
and the Controller. The field cycles through three choices - Ethernet LAN, Parallel ECP, and
Serial RS-232.
The last option is a checkbox marked “Generate CSV file automatically”. A CSV file contains
specially formated data which can be shown on a Microsoft Excel spreadsheet. The normal
operation is for the operator to exercise this option after the test is finished. Checking the
checkbox causes automatic CSV file generation.
VDAS Setup and Operating Instructions
__________________________________
46
Display Appearance
The button marked Set Colors brings up the dialog shown in figure 6.1, below. In addition to
setting the colors of the test screens, this dialog also allows the operator to set the font style and
size in each of the non-graphic display screens.
Test Appearance Configuration
Figure 6.1
Real-Time Displays
When a test is started (by clicking OK from the Test Startup Parameters screen shown in Figure
6.1, the Controller loads the two input files into memory and initiates communication with the main
chassis. The Controller and the chassis then validate the data in the Test Configuration File to
ensure that the hardware setup in the chassis is compatible with the channel definitions in the file.
Note: Any mismatch between the test configuration and the hardware causes an error message
followed by a shutdown of the test.
Assuming the setup has been performed correctly, a real-time display screen exhibits one of eight
available display options: Full, Condensed, Stabilization, Large Font, Line Graph, Bar Graph,
Mixed Line Graph (two line graphs plus number), and Mixed Bar Graph (three bar graphs plus
numbers). The display type is determined by the selection made during setup of the display
groups and by the automatic test sequences, as recorded in the Test Configuration File. These
eight types are discussed and illustrated below.
If there are test sequences, the Controller brings up display group 1, which corresponds to test
sequence 1. Otherwise, the Controller brings up the first display group that has member
channels.
VDAS Setup and Operating Instructions
__________________________________
47
When test sequences are present, testing is advanced from one sequence to the next with the
Tab key. When there are no test sequences, the user can switch among the display groups with
Tab and Shift-Tab (for next group and previous group, respectively).
Screen Content Common to All Displays
All eight real-time displays have the same status information in the top section, and the same
control legends at the bottom, as shown in Figure 6.2.
The top of the screen shows the status information, which is the same for every display type. The
current time appears in the top right-hand corner. The three elapsed times are described directly
below:
• Total elapsed time since the user clicked OK from the Test Startup Parameters screen. This
action started the test running by causing the Controller to load the two input files into memory
and to initiate communication with the main chassis.
• Time spent in the current display group. (If there are test sequences, this value is the
equivalent of the time spent on the current test sequence.)
• Time (in seconds) since the last data sample. A data sample whether automatic or manual,
from any data group resets this elapsed time back to zero.
At the top left-hand corner, the screen displays the total number of samples taken. The number of
events marked (recorded) is shown at the middle of the screen. This is information that helps in
gauging progress throughout the test. Two sets of flags are located below the number of samples
taken:
• The upper row of flags indicates which data groups are currently sampling in the automatic
mode.
• The lower row of flags indicates which data groups are being sampled currently.
The bottom section provides instruction on starting or stopping a data group. You may start a
data group by typing the group number, and stop by typing the group number again. To take a
manual sample, use a pickle switch or the Space Bar. Advance to the next display or test
sequence by double-clicking the pickle switch or by pressing the Tab key. F11 enters an
Event Marker, to be discussed later in this chapter. For graph displays, the graph can be sped up
or slowed down with the plus (+) or minus (-) key.
VDAS Setup and Operating Instructions
__________________________________
48
Behavior of All Graph Displays
Each line or bar graph displays data as the instrument reads the values from the corresponding
channels. The graph limits (min and max) are the values entered during Display Group Setup.
When the data value exceeds the max graph value, the Controller clips the display so that the
entire graph is filled in. Similarly, when the data value is lower than the min graph value, the
graph is completely empty.
Therefore, it is important that the setup reflect the desired range to be monitored. Graphs without
programmed min and max values use default values based on the channel type.
All graphs update at the same rate for each display group. The user can decrease the update
rate by pressing the (-) key or increase the rate with the (+) key. Each display group has its own
graph speed setting that can be controlled independently of the others.
At the beginning of each test, the rate settings default to those set the last time the instrument
was used.
VDAS Setup and Operating Instructions
__________________________________
49
Full Display
The middle section of the Full (full-size) Display, as shown in Figure 6.2, provides the most
information about each channel of any of the displays. Each line shows a symbolic channel
number, the full 50-character channel name, the current data value, and the two alarm values.
The data is shown with the precision specified for that channel.
Full Display Screen
Figure 6.2
If a data value exceeds an alarm value, both are shown in reverse video. These two visual cues
constitute the Visual alarm type discussed above. If the data value drops below the alarm value,
the data is again displayed in normal video, but the alarm value stays in reverse video to indicate
that the channel data has at one time exceeded that alarm.
Scrolling up and down with the arrow keys permits all the channels in the list to be seen.
VDAS Setup and Operating Instructions
__________________________________
50
Condensed Display
The Condensed display uses three columns of shortened rows to show as much information on
the screen as will fit, as shown in Figure 6.3. This is a useful choice for monitoring many channels
at the same time. Each channel is tagged with the shortened label used in the channel selection
list. All three columns scroll together.
Condensed Display Screen
Figure 6.3
When a data value exceeds an alarm value, the data is shown in reverse video, and the number
of the exceeded alarm (1 or 2) appears in reverse video next to the data. If the data value drops
below the alarm value, the data again appears in normal video, but the alarm number remains in
reverse video, showing that the channel data at some time exceeded that alarm.
VDAS Setup and Operating Instructions
__________________________________
51
Stabilization Display
The Stabilization display, as shown in Figure 6.4, shows the last five data samples recorded for
each channel to reveal trends for stabilization test requirements. Each channel is tagged with its
shortened label, and each data value appears in large font (double height and double width) at
the side of the screen. Differences in values indicate whether the test environment has stabilized
into its steady-state operating conditions.
Stabilization Display
Figure 6.4
When a data value exceeds an alarm value, the data is shown in reverse video, and the number
of the exceeded alarm (1 or 2) appears in reverse video next to the data. If the data value drops
below the alarm value, the data returns to normal video, but the alarm number remains in reverse
video.
VDAS Setup and Operating Instructions
__________________________________
52
Large Font Display
The Large Font display shows 10 data values in enlarged font as an aid in monitoring the
channels while otherwise occupied Each channel is tagged with its shortened label. The font is
double height and double width, for reading at a glance, as shown in Figure 6.5.
Large Font Display
Figure 6.5
A data value exceeding an alarm value is shown in reverse video, and the number of the
exceeded alarm (1 or 2) appears in reverse video next to the data. If the data value drops below
the alarm value, the data returns to normal video, but the alarm number remains in reverse video.
VDAS Setup and Operating Instructions
__________________________________
53
Line Graph Display
The Line Graph display, as shown in Figure 6.6, presents the test data simultaneously on three
channels in a graphical format, with the channels plotted against time. Each channel is tagged
with its shortened label. Scrolling with the up and down arrows permits all the channels to be
viewed. The current data value for each channel is printed in large font to the right of its graph,
along with its two alarm values in small font.
Line Graph Display Screen
Figure 6.6
When a data value exceeds an alarm value, the data and the alarm value are shown in reverse
video. If the data value drops below the alarm value, the data returns to normal video, but the
alarm value remains in reverse video.
VDAS Setup and Operating Instructions
__________________________________
54
Bar Graph Display
The Bar Graph display, shown in Figure 6.7, is similar to the Line Graph display. Here, however,
the three channel values are plotted as horizontal bar graphs rather than versus time, and the two
alarms for each channel are indicated by their numbers instead of alarm values.
Each channel is tagged with its shortened label. Scrolling with the arrow keys permits all the
channels to be viewed. The current data value for each channel is printed in large font to the
right of its graph.
Bar Graph Display Screen
Figure 6.7
A data value exceeding an alarm value is shown in reverse video, and the number of the
exceeded alarm (1 or 2) appears in reverse video next to the data. If the data value drops below
the alarm value, the data returns to normal video, but the alarm number remains in reverse video.
VDAS Setup and Operating Instructions
__________________________________
55
Mixed Line-Graph Display
The Mixed Line Graph display (entered on the Display Group Setup screen as type "2 Line +
Nums") is a mixture of the Line Graph display and the Large Font display as shown in Figure 6.8.
It is well suited for applications where the user needs to monitor a few channels in line graph
format, but also needs to see some other channels on the screen in digital format.
The first two channels in the Channel List are displayed as line graphs at all times. The rest of
the list is shown in Large Font format below the second graph, eight channels at a time.
Mixed Line Graph Display Screen
Figure 6.8
The graph channels are tagged the same way as in the Line Graph display, and the digital
channels at the bottom are tagged similar to the Large Font display. Here, however, shortened
channel titles appear above the data values. Handling of alarm values is the same as in these
other two displays.
VDAS Setup and Operating Instructions
__________________________________
56
Mixed Bar Graph Display
The Mixed Bar Graph display (entered on the Display Group Setup screen as type "3 Bar +
Nums") is a mixture of the Bar Graph display and the Large Font display, as shown in figure 6.9.
It is well suited for applications where the user needs to monitor a few channels in bar graph
format, while also watching some other channels in digital format.
The first three channels in the channel list are displayed as bar graphs at all times. The rest of
the list is shown in Large Font format below the third graph, eight channels at a time.
Mixed Bar Graph Display Screen
Figure 6.9
The graph channels are tagged the same way as in the Bar Graph display, and the digital
channels at the bottom are tagged similar to the Large Font display. Here, however, shortened
channel titles appear above the data values. Handling of alarm values is the same as in these
other two displays.
Data Sampling
The user can sample data manually by pressing the pickle switch or the Space Bar. When
there are no test sequences active, the manual sample command causes the instrument to
sample every data group that has a member channel. If the sample tone is turned on, a lowpitched beep tells the user that sampling is occurring. The sampling flags at the top of the screen
also flash momentarily.
VDAS Setup and Operating Instructions
__________________________________
57
When the instrument is operating under automatic test sequence control, the manual sample
command causes sampling of only the active data group.
The user can start or stop each data group's automatic sampling by triggering it individually, by
pressing the number keys - 1 (to start) and 0 (to stop). Once begun, the data group automatically
samples at its specified sample interval until its sample count is exhausted or until the user
triggers it off.
Note: A data group with an automatic start trigger starts sampling as soon as its trigger becomes
true, without user intervention.
Event Marking
When some special event occurs during the test, the user can record an Event Marker, as shown
in Figure 6.10, by pressing F11. At the end of the test sequence, the Controller displays a Test
Events screen, which shows a list of marker numbers and the times at which they were recorded.
A description field in the right column enables the user to enter comments for each marker,
explaining its nature.
Test Events
Figure 6.10
When test sequences are active, the Controller automatically enters an event marker as the user
moves from one test sequence to the next, and enters a default comment that the particular
sequence was completed.