1
1
SOFTWARE FOR ELECTROENCEPHALOGRAM
ACQUISITION AND PROCESSING
“WinEEG”
Version 2.8
(User Manual)
St-Petersburg, Russia
2009
2
MAIN FEATURES....................................................................................................................................................................9
WINEEG SOFTWARE INSTALLATION ...........................................................................................................................11
MITSAR EEG SYSTEM OVERVIEW .................................................................................................................................21
1. THE EEG RECORDING SYSTEM CONFIGURATION.................................................................................................................21
2. THE ERP RECORDING SYSTEM CONFIGURATION. ................................................................................................................23
3. THE VIDEO EEG RECORDING SYSTEM CONFIGURATION. .....................................................................................................24
MAIN FUNCTIONS................................................................................................................................................................27
1. EEG RECORDING................................................................................................................................................................27
2. VISUAL EEG ANALYSIS. ....................................................................................................................................................27
3. EEG PROCESSING. ..............................................................................................................................................................27
4. COMPOSING A FINAL REPORT.............................................................................................................................................28
5. PRINTING EEG FRAGMENTS, PROCESSING RESULTS AND REPORT TEXT............................................................................28
6. MAINTAINING EEG DATABASE AND PROCESSING RESULTS...............................................................................................29
QUICK START .......................................................................................................................................................................30
DATA ARCHIVING ...............................................................................................................................................................31
DIGITAL EEG FILTERING .................................................................................................................................................32
ELECTROOCULOGRAPHIC ARTIFACTS CORRECTION ..........................................................................................32
CORRECTION OF EEG ARTIFACTS................................................................................................................................34
AUTOMATIC AND MANUAL ARTIFACTS ELIMINATION.........................................................................................34
EEG INDICES .........................................................................................................................................................................35
EEG POWER SPECTRA .......................................................................................................................................................37
EVENT-RELATED POTENTIALS ......................................................................................................................................39
EVENT-RELATED EEG DE-SYNCHRONIZATION AND COHERENCE....................................................................40
WAVELET ERP AND WAVELET COHERENCE ANALYSIS .......................................................................................41
RECORDING AND ANALYSIS OF ERP, ERD, ERCOH WAVELET POWER AND WAVELET COHERENCE...42
EQUIPMENT PREPARATION FOR PERFORMING ERP STUDIES. ..................................................................................................42
1. Installation and preparation PSYTASK program. .........................................................................................................42
2. Testing the synchronization of computers......................................................................................................................42
CARRYING OUT OF ERP STUDIES............................................................................................................................................43
COMPUTING AND ANALYSIS OF ERP, ERD OR ERCOH...........................................................................................................44
ANALYSIS OF EEG INDEPENDENT COMPONENTS AND ERP INDEPENDENT COMPONENTS......................45
1 THE SPECTRA OF EEG INDEPENDENT COMPONENTS. ...........................................................................................................47
2 SINGLE TRIAL INDEPENDENT COMPONENTS ANALYSIS OF ERPS. .........................................................................................48
3 THE GRAND AVERAGE SPECTRA OF EEG INDEPENDENT COMPONENTS. ...............................................................................49
4 THE GRAND AVERAGE ERPS OF INDEPENDENT COMPONENTS..............................................................................................50
5 THE GRAND AVERAGE ERD AND WAVELET BAND POWER OF INDEPENDENT COMPONENTS. ................................................51
VIDEO EEG RECORDING ...................................................................................................................................................53
EXPORT AND IMPORT THE DATA ..................................................................................................................................53
GRAND AVERAGING AND BATCH DATA PROCESSING ...........................................................................................54
DIPOLE SOURCE LOCALIZATION ..................................................................................................................................55
3
WINEEG AND LORETA.......................................................................................................................................................56
AUTOMATED SPIKES DETECTION AND ANALYSIS ..................................................................................................56
WARRANTIES........................................................................................................................................................................59
WINEEG COMMANDS AND INTERFACE REFERENCE..............................................................................................60
WINEEG WINDOWS ...............................................................................................................................................................60
1. EEG Window .................................................................................................................................................................60
2. Final Report Window.....................................................................................................................................................72
3. EEG Maps Window........................................................................................................................................................73
4. EEG Power Spectra (Auto and Cross-correlations) Window........................................................................................74
5. EEG Indices Window.....................................................................................................................................................80
6. ERP Window..................................................................................................................................................................82
7. ICA Window...................................................................................................................................................................86
WINEEG BARS.......................................................................................................................................................................89
1. Main Toolbar .................................................................................................................................................................89
2. Input Control Toolbar....................................................................................................................................................91
3. Analysis Toolbar............................................................................................................................................................92
4. Status Bar ......................................................................................................................................................................93
5. Print Preview Control Bar.............................................................................................................................................94
6. Filters Bar......................................................................................................................................................................94
7. Channel Names Bar.......................................................................................................................................................95
8. Maps Bar (Map Window) ..............................................................................................................................................95
9. Dipole Window ..............................................................................................................................................................96
10. Maps, Spectra and Indices Bars ..................................................................................................................................97
11. Calculator Bar .............................................................................................................................................................97
12. Averaging Groups Bar.................................................................................................................................................98
13. ERP Bar.......................................................................................................................................................................98
14. Video Window..............................................................................................................................................................99
MENU COMMANDS ...............................................................................................................................................................100
File Menu Commands......................................................................................................................................................100
Edit Menu Commands......................................................................................................................................................100
View Menu Commands ....................................................................................................................................................101
Format Menu Commands ................................................................................................................................................101
Recording Menu Commands............................................................................................................................................101
Analysis Menu Commands...............................................................................................................................................102
Setup Menu Commands ...................................................................................................................................................105
Window menu commands.................................................................................................................................................105
Help menu commands......................................................................................................................................................105
DESCRIPTION OF MENU COMMANDS ....................................................................................................................................106
1. File: New command .....................................................................................................................................................106
2. File: Open EEG Database command ..........................................................................................................................107
3. File: Open Another Database->EEG Spectra command.............................................................................................107
4. File: Open Another Database->EEG Cross-correlations command...........................................................................107
5. File: Open Another Database->EEG Indices command .............................................................................................107
6. File: Open Another Database ->ERP (EP) File command .........................................................................................107
7. File: Open Another Database ->ERD File command .................................................................................................108
8. File: Open Another Database ->ERCoh File command.............................................................................................108
9. File: Open Another Database -> Biofeedback File command ....................................................................................108
10. File: Open File… command.......................................................................................................................................108
11. File: Import EDF+ Data command...........................................................................................................................108
12. File: Import Data command ......................................................................................................................................108
13. File: Close command .................................................................................................................................................108
14. File: Save command...................................................................................................................................................109
15. File: Save As… command ..........................................................................................................................................109
16. File: Compress video files… command .....................................................................................................................109
17. File: Export Data… command...................................................................................................................................109
18. File: Export EEG and Video EEG… command .........................................................................................................110
19. File: Print... command...............................................................................................................................................110
20. File: Page Setup... command .....................................................................................................................................111
21. File: Print Preview command....................................................................................................................................111
4
22. File: Print Setup... command .....................................................................................................................................111
23. File: 1, 2, 3, 4 commands...........................................................................................................................................111
24. File: Exit command....................................................................................................................................................111
25. Edit: Undo command .................................................................................................................................................112
26. Edit: Cut command ....................................................................................................................................................112
27. Edit: Copy command .................................................................................................................................................112
28. Edit: Paste command .................................................................................................................................................112
29. Edit: Clear command.................................................................................................................................................112
30. Edit: Select All command...........................................................................................................................................112
31. Edit: Clear All command ...........................................................................................................................................113
32. Edit: Clear All Video Data command ........................................................................................................................113
33. Edit: Find… command...............................................................................................................................................113
34.Edit: Replace… command ..........................................................................................................................................113
35.Edit: Find Selection command....................................................................................................................................113
36.Edit: Find Fragment... command................................................................................................................................113
37.Edit: Add Label command ..........................................................................................................................................113
38.Edit: Delete Label command ......................................................................................................................................114
39.Edit: Patient Card... command ...................................................................................................................................114
40. Edit: Trial Labels… command...................................................................................................................................114
41. Edit: Adjust trial synchronization … command .........................................................................................................114
42. Edit: Change polarity… command ............................................................................................................................114
43. Edit: Load Trial List… command ..............................................................................................................................114
44. View: Toolbar -> Main Toolbar command................................................................................................................115
45. View: Toolbar -> Input Control Toolbar command ..................................................................................................115
46. View: Toolbar -> Analysis Toolbar command ..........................................................................................................115
47. View: Toolbar -> Maps Window command...............................................................................................................115
48. View: Toolbar -> Dipole Window command.............................................................................................................115
49. View: Toolbar -> Filters Bar command ....................................................................................................................115
50. View: Toolbar -> Maps Bar command......................................................................................................................115
51. View: Toolbar -> Spectra Bar command...................................................................................................................115
52. View: Toolbar -> Indices Bar command ...................................................................................................................116
53. View: Toolbar -> ERP Bar command .......................................................................................................................116
54. View: Toolbar -> Biofeedback Bar command ...........................................................................................................116
55. View: Toolbar -> Calculator Bar command..............................................................................................................116
56. View: Toolbar -> Averaging Groups Bar command .................................................................................................116
57. View: Toolbar -> Customize Main Toolbar... command ...........................................................................................116
58. View: Toolbar -> Customize Input Control Toolbar... command..............................................................................116
59. View: Toolbar -> Customize Analysis Toolbar... command ......................................................................................116
60. View: Status Bar command........................................................................................................................................117
61. View: Channel Names Bar command ........................................................................................................................117
62. View: Main Video Window command........................................................................................................................117
63. View: Additional Video Window command ...............................................................................................................117
64. View: Video Window size command ..........................................................................................................................117
65. View: Decrease Gain command.................................................................................................................................117
66. View: Increase Gain command..................................................................................................................................118
67. View: Decrease Speed command ...............................................................................................................................118
68. View: Increase Speed command ................................................................................................................................118
69. View: Select Montage... command.............................................................................................................................118
70. Format: Font... command ..........................................................................................................................................119
71. Format: Paragraph command ...................................................................................................................................119
72. Recording: EEG Monitoring command .....................................................................................................................119
73. Recording: EEG Recording (on/off) command..........................................................................................................119
74. Recording: Pause command ......................................................................................................................................119
75. Recording: Stop command.........................................................................................................................................120
76. Recording: Turn On (Off) Calibration command ......................................................................................................120
77. Video recording command.........................................................................................................................................120
78. Reset DC Filter command (not in a menu) ................................................................................................................120
79. Recording: Photostimulation On/Off command.........................................................................................................120
80. Recording: Photostimulation Program command .....................................................................................................121
81. Recording: Stimuli Presentation Program command ................................................................................................121
82. Recording: Turn On (Off) Music command...............................................................................................................121
83. Recording: Calibration command .............................................................................................................................121
84. Recording: Impedance command ..............................................................................................................................121
5
85. Recording: Rewind Back command ...........................................................................................................................122
86. Recording: Playback command .................................................................................................................................122
87. Recording: Play Forward command .........................................................................................................................122
88. Recording: Fast Forward command..........................................................................................................................122
89. Analysis: Final Report command...............................................................................................................................122
90. Analysis: Signal Parameters command .....................................................................................................................122
91. Analysis: EEG Mapping command............................................................................................................................122
92. Analysis: EEG Indices… command ...........................................................................................................................123
93. Analysis: EEG Spectra… command...........................................................................................................................123
94. Analysis: EEG Cross-correlation… command ..........................................................................................................124
95. Analysis: Spectra Density Array command ...............................................................................................................124
96. Analysis: Source distribution (LORETA)... command ...............................................................................................124
97. Analysis: Spectrum power distribution (LORETA)... command ................................................................................124
98. Analysis: Dipole Source (BrainLock)... command.....................................................................................................124
99. Analysis: Nonlinear Analysis... command .................................................................................................................124
100. Analysis: Spike Detection... command .....................................................................................................................124
101. Analysis: Spike Averaging... command....................................................................................................................125
102. Analysis: Remove EOG... command ........................................................................................................................125
103. Analysis: Mark artifacts... command .......................................................................................................................125
104. Analysis: Artifacts correction... command...............................................................................................................125
105. Analysis: Artifacts correction using templates... command .....................................................................................126
106. Analysis: Turn on (off) band pass filter (not in a menu)..........................................................................................126
107. Analysis: Compute ERP... command .......................................................................................................................126
108. Analysis: Compute ERD... command .......................................................................................................................126
109. Analysis: Compute ERCoh... command ...................................................................................................................127
110. Analysis: Compute Wavelet... command..................................................................................................................127
111. Analysis: Compute Wavelet... command..................................................................................................................128
112. Analysis: Independent component spectra... command ...........................................................................................128
113. Analysis: Independent component spectra... command ...........................................................................................128
114. Analysis: Comparison of results command..............................................................................................................128
115. Pop-up menu of EEG window: Add Spike command ...............................................................................................128
116. Pop-up menu of EEG window: Delete Spike command ...........................................................................................128
117. Pop-up menu of EEG window: Change Channel command ....................................................................................128
118. Pop-up menu of EEG window: Copy EEG command..............................................................................................129
119. Pop-up menu of EEG window: Copy Spike command .............................................................................................129
120. Pop-up menu of EEG window: Copy EEG to Report command ..............................................................................129
121. Pop-up menu of EEG window: Copy Spike to Report command .............................................................................129
122. Analysis: Graphs command .....................................................................................................................................129
123. Analysis: Histograms command ..............................................................................................................................129
124. Analysis: Table command ........................................................................................................................................129
125. Analysis: Maps command ........................................................................................................................................129
126. Analysis: Asymmetry command ...............................................................................................................................129
127. Analysis: Formula (Mapping) command .................................................................................................................130
128. Analysis: Formula (Graphs) command....................................................................................................................130
129. Analysis: Interaction diagram command.................................................................................................................130
130. Analysis: Power Spectra (Autocorrelations) command ...........................................................................................130
131. Analysis: Coherence (Cross-correlations) for Channels command.........................................................................130
132. Analysis: Average Coherence command..................................................................................................................131
133. Analysis: Phase Spectra command ..........................................................................................................................131
134. Analysis: Bispectra command..................................................................................................................................131
135. Analysis: Bicoherence command .............................................................................................................................131
136. Analysis: Average Spectra command.......................................................................................................................131
137. Analysis: Spectra Dynamics command ....................................................................................................................131
138. Analysis: Parameters of interaction diagrams ........................................................................................................131
139. Analysis: Insert tables into report............................................................................................................................131
140. Pop-up Menu of Spectra Window: Add Map command...........................................................................................132
141. Analysis: Channels/Groups command .....................................................................................................................132
142. Analysis: Groups/Channels command .....................................................................................................................132
143. Analysis: Time/Groups Mapping command.............................................................................................................132
144. Analysis: Groups/Time Mapping command.............................................................................................................132
145. Analysis: Formatted Page command .......................................................................................................................132
146. Analysis: Average Bandpower command ................................................................................................................133
147. Analysis: Rasters Time/Frequency command ..........................................................................................................133
6
148. Analysis: Channel List… command .........................................................................................................................133
149. Analysis: Group Info… command............................................................................................................................133
150. Analysis: Export trial parameters command ...........................................................................................................133
151. Pop-up menu of ERP window: Add Map command.................................................................................................134
152. Pop-up menu of ERP window: Add Label command ...............................................................................................134
153. Pop-up menu of ERP window: Copy Parameter Distribution command.................................................................134
154. Pop-up menu of ERP window: Copy Channel command.........................................................................................134
155. Pop-up menu of ERP window: Copy Channel to Report command.........................................................................134
156. Pop-up menu of ERP window: Source distribution (LORETA)... command............................................................134
157. Pop-up menu of ERP window: Dipole source (BrainLock))... command ................................................................134
158. Pop-up menu of ERP window: Delete All Labels command....................................................................................134
159. Pop-up menu of ERP window: Delete Labels and Maps command.........................................................................134
160. Analysis: Insert Patient Card command ..................................................................................................................134
161. Analysis: Generate Final Report command.............................................................................................................135
162. Analysis: Insert Final Report Template... command................................................................................................135
163. Analysis: Select groups command ...........................................................................................................................135
164. Analysis: Select group pairs command....................................................................................................................135
165. Analysis: Change graph scale command .................................................................................................................135
166. Analysis: Correct baseline command ......................................................................................................................135
167. Analysis: Save components filter command.............................................................................................................135
168. Analysis: Save signal filter command ......................................................................................................................135
169. Analysis: Export activation curves (spectra) command...........................................................................................135
170. Pop-up menu of ICA window: Copy component command......................................................................................136
171. Pop-up menu of ICA window: Component name command ....................................................................................136
172. Pop-up menu of ICA window: LORETA for component command..........................................................................136
173. Analysis Export of component parameters command ..............................................................................................136
174. Setup: Database Pathnames… command ................................................................................................................136
175. Setup: Preferences... command................................................................................................................................136
176. Setup: Mapping Style... command............................................................................................................................136
177. Setup: Montage List… command .............................................................................................................................137
178. Setup: Fragment Names... command .......................................................................................................................137
179. Setup: Label List… command ..................................................................................................................................137
180. Setup: Photostimulation Programs… command......................................................................................................137
181. Setup: EEG Bandranges… command ......................................................................................................................138
182. Setup: Stimuli Presentation Programs… command.................................................................................................138
183. Setup: Graph Formats… command .........................................................................................................................138
184. Setup: Title… command...........................................................................................................................................138
185. Setup: Final Report… command..............................................................................................................................138
186. Setup: Final Report Templates… command ............................................................................................................138
187. Setup: Video recording… command ........................................................................................................................138
188. Setup: Equipment Parameters… command .............................................................................................................138
189. Window: Cascade command....................................................................................................................................138
190. Window: Tile Horizontally command ......................................................................................................................139
191. Window: Tile Vertically command...........................................................................................................................139
192. Window: Arrange Icons command...........................................................................................................................139
193. Window: Split command ..........................................................................................................................................139
194. Window: 1, 2, ... command ......................................................................................................................................139
195. Help: About WinEEG... command ...........................................................................................................................139
196. Title Bar...................................................................................................................................................................139
197. Scroll bars................................................................................................................................................................140
198. Size command (System menu) ..................................................................................................................................140
199. Move command (System menu)................................................................................................................................140
200. Minimize command (System menu)..........................................................................................................................140
201. Maximize command (System menu) .........................................................................................................................140
202. “Next” command (document window System menu) ...............................................................................................140
203. “Previous” command (document window System menu) ........................................................................................141
204. “Close” command (System menu)...........................................................................................................................141
205. “Restore” command (System menu)........................................................................................................................141
DIALOGS...............................................................................................................................................................................142
1. Montage Parameters: Patient Card dialog .................................................................................................................142
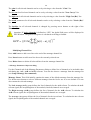
2. Montage Parameters: Channels dialog .......................................................................................................................143
3. Montage Parameters: Referents dialog .......................................................................................................................146
4. Montage Parameters: Colors dialog ...........................................................................................................................147
7
5. Montage Parameters: View dialog ..............................................................................................................................148
6. Montage Parameters: Electrodes dialog .....................................................................................................................149
7. Transformation Matrix for Weighted Average Referent dialog ...................................................................................151
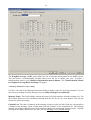
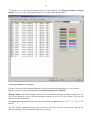
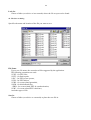
8. Record List dialog........................................................................................................................................................152
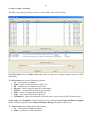
9. Batch EEG Processing dialog .....................................................................................................................................156
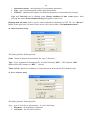
10. Averaging Spectra dialog ..........................................................................................................................................157
11. Base Record Search Parameters dialog ....................................................................................................................158
12. Backup Data To Archive dialog.................................................................................................................................159
13. Archive Data dialog...................................................................................................................................................160
14. Delete Data From Database dialog...........................................................................................................................160
15. Add File To Database dialog.....................................................................................................................................161
16. Statistical report dialog .............................................................................................................................................162
17. File Open dialog ........................................................................................................................................................163
18. File Save As dialog ....................................................................................................................................................164
19. Import of EDF+ data dialog......................................................................................................................................165
20. Channel attributes dialog ..........................................................................................................................................166
21. Event attributes dialog..............................................................................................................................................166
22. Export ERP (ERD) dialog..........................................................................................................................................167
23. Export wavelet bandpower (coherence) dialog .........................................................................................................170
24. Export EEG Data dialog............................................................................................................................................171
25. Export video EEG dialog...........................................................................................................................................172
26. Export EEG Spectra dialog .......................................................................................................................................174
27. Export EEG Indices dialog ........................................................................................................................................176
28. Export EEG independent components parameters. ...................................................................................................176
29. Video file compression dialog....................................................................................................................................178
30. Print dialog................................................................................................................................................................179
31. Printing dialog...........................................................................................................................................................180
32. Page Setup dialog ......................................................................................................................................................180
33. Print Setup dialog ......................................................................................................................................................181
34. Stimuli Presentation Program List dialog .................................................................................................................182
35. Update task list from slave computer dialog .............................................................................................................182
36. Checking Impedance Of Electrodes...........................................................................................................................183
37. Calibration Of Amplifiers dialog ...............................................................................................................................183
38. Find dialog.................................................................................................................................................................184
39. Find Events ................................................................................................................................................................185
40. Replace dialog ...........................................................................................................................................................185
41. Patient Card dialog ...................................................................................................................................................186
42. Fragments List dialog................................................................................................................................................187
43. Modify fragment name dialog....................................................................................................................................187
44. Deleting of selected EEG fragment............................................................................................................................188
45. Deleting of video data................................................................................................................................................188
46. Modify Trial Labels dialog ........................................................................................................................................189
47. Adjust trial synchronization using synchro impulse dialog .......................................................................................190
48. Change signal polarity dialog ...................................................................................................................................191
50. Open dialog trial list..................................................................................................................................................192
51. Font dialog.................................................................................................................................................................192
52. Paragraph dialog.......................................................................................................................................................193
47. Final Report Template List ........................................................................................................................................193
53. Parameters Of signals dialog ....................................................................................................................................195
54. Parameters Of EEG Indices Computation dialog......................................................................................................196
55. Parameters Of EEG Spectra Computation dialog .....................................................................................................197
56. Parameters Of EEG Auto and Cross-correlation Computation dialog .....................................................................200
56. Nonlinear analysis parameters dialog.......................................................................................................................201
58. Spike detection dialog................................................................................................................................................202
59. Averaged spikes calculation dialog ...........................................................................................................................204
60. EOG Rejection dialog................................................................................................................................................205
61. Search and rejection artifacts dialog.........................................................................................................................206
62. Spatial Filter Parameters Estimation dialogue .........................................................................................................207
63. Artifact correction using standard component topographies as templates dialogue.................................................208
64. Parameters For Evoked Potential Computation dialog.............................................................................................210
65. Parameters for Event-Related Potential Computation dialog ...................................................................................211
67. Parameters For Event-Related Coherence Computation dialogue ...........................................................................215
68. Wavelet Decomposition dialog ..................................................................................................................................216
8
69. Wavelet Coherence dialog .........................................................................................................................................217
70. Choose Group Differences dialog .............................................................................................................................218
71. Artifact Rejection Thresholds dialog .........................................................................................................................219
72. Subject Response Processing Parameters dialog ......................................................................................................219
73. Parameters of ICA spectra calculation dialog ..........................................................................................................221
74. Parameters of ERP ICA spectra dialog .....................................................................................................................223
75. Parameters of independent component analysis (ICA) dialog..................................................................................225
76. Parameters of ICA Spectra calculation for selected group of observations dialog...................................................226
77. Select List Of Channels dialog...................................................................................................................................228
78. Results Of Averaging And Subject Response Processing dialog ...............................................................................229
79. List of channel pairs and parameters for EEG coherence and EEG cross-correlations dialog................................230
80. Parameters of averaging groups dialog ....................................................................................................................231
81. Select averaging groups for displaying dialog ..........................................................................................................232
82. Define graphs scale dialog ........................................................................................................................................232
83. Correct graphs baseline dialog ................................................................................................................................233
84. Select components for filter dialog ............................................................................................................................233
85. Component name dialog ...........................................................................................................................................234
86. Export of parameters of independent component dialog ...........................................................................................234
86. Export of spectrum parameters of independent component dialog............................................................................235
87. Processing results comparison dialog .......................................................................................................................236
88. Insert tables of spectra parameters dialog ................................................................................................................236
89. Insert tables of spectra comparison dialog................................................................................................................240
90. Database Parameters: Databases Of Raw Data dialog ............................................................................................245
91. Database Parameters: Databases of Processing Results dialog ...............................................................................246
92. Database Parameters: Browser Settings dialog ........................................................................................................248
93. Database Parameters: Base Record Search Parameters dialog ...............................................................................248
94. Choose Folder dialog ................................................................................................................................................250
95. Preferences: EEG Input dialog..................................................................................................................................251
96. Preferences: EEG Window dialog .............................................................................................................................252
97. Preferences: Scale dialog ..........................................................................................................................................254
98. Preferences: Signal polarity dialog ...........................................................................................................................255
99. Preferences: Printing dialog .....................................................................................................................................256
100. Colors dialog ...........................................................................................................................................................257
101. Mapping parameters dialog.....................................................................................................................................257
102. Names Of Fragments (Trials) dialog .......................................................................................................................258
103. User Label Description dialog.................................................................................................................................259
104. Photostimulation Program List dialog ....................................................................................................................260
105. EEG Bandranges dialog ..........................................................................................................................................261
106. Parameters Of Bandpass Filter dialog ....................................................................................................................262
107. Graphics Page Format dialog .................................................................................................................................263
108. Page Size dialog ......................................................................................................................................................264
109. Line Style dialog ......................................................................................................................................................265
110. Graphics Page Format List dialog ..........................................................................................................................265
111. Parameters Of Graphics dialog...............................................................................................................................265
112. Running Header dialog............................................................................................................................................266
113. Final Report Template List dialog...........................................................................................................................267
114. Final Report Template dialog..................................................................................................................................268
115. Setup Final Report Generator dialog .....................................................................................................................268
116. Video recorder parameters ......................................................................................................................................269
117. Equipment Configuration dialog .............................................................................................................................271
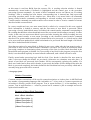
APPENDIX 1. FINAL REPORT GENERATION SETUP................................................................................................273
PROGRAMMING LANGUAGE FOR AUTOMATIC FINAL REPORT GENERATION SYSTEM ..........................................................273
1. Basic Terms. ................................................................................................................................................................273
2. Hierarchical Menu System Cycle.................................................................................................................................273
3. Language Syntax..........................................................................................................................................................274
4. Example of a Hierarchical Menu Program .................................................................................................................276
5. Limitations. ..................................................................................................................................................................277
9
Main Features
The WinEEG software runs on a PC (personal computer) and is intended for clinical observation of
EEG, video EEG and ERP/ERD recording for diagnostic of brain diseases. WinEEG software for MS
Windows XP/Vista allows perform an advanced computerized analysis of the EEG on standard personal
computer or Notebook including digital filtering, montage reformatting, spectra and coherence analysis,
ERP and event related de-synchronization analysis, topographic maps and etc.
WinEEG software is designed to work with Mitsar-EEG-201 and Mitsar-EEG-202 amplifiers.
WinEEG is designed for the IBM PC and MS Windows XP/Vista which together define minimal system
requirements. But the program performance significantly depends on capabilities of the computer. Here
are recommended computer specifications:
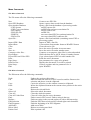
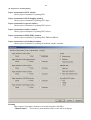
Minimal - to work with EEG or ERP recording and analysis:
CPU
Celeron 850
RAM
128 Mb
HDD
20 Gb, IDE
Video Adapter
SVGA 16 Mb, AGP, accelerator
Monitor
17"
Floppy drive
3.5", 1.44 Mb
CD-Writer
4 x 4 x 32
Printer
HP Laser Jet 1020
OS
MS Windows XP
Optimal - to perform different EEG/ERP/ERD processing efficiently:
CPU
Pentium III 800 and higher
RAM
256 Mb
HDD
40 Gb
Video Adapter
SVGA 32 Мb, AGP, accelerator
Monitor
17”
Floppy drive
3.5", 1.44 Mb
CD-ROM
40 x
CD-Writer
8 x 4 x 32
Printer
HP Laser Jet 1020
OS
MS Windows XP
Professional - to perform additional processing like independent component analysis (ICA) or wavelet
band power and wavelet coherence analysis:
CPU
Pentium IV 2000 and higher
RAM
2 Gb
HDD
500 Gb
Video Adapter
SVGA 64 Мb, AGP, accelerator
Monitor
19"
Floppy drive
3.5", 1.44 Mb
CD-ROM
40 x
CD-Writer
8 x 4 x 32
Printer
HP Laser Jet 1020
OS
MS Windows XP/Vista
10
For Video EEG – this computer provide synchronously recording of EEG, video from one or two
cameras with on-line MPEG4 compression and audio with on-line MPEG3 compression during at least
48 hours.
CPU
Pentium IV 3000 and higher
RAM
2 Gb
HDD
500 Gb
Video Adapter
SVGA 64 Mb, AGP, accelerator.
Sound card
Any
Monitor
19 “
FDD
3.5 “, 1.44 Mb
DVD-Writer
8 x 4 x 32
Printer
HP Laser Jet 1020
OS
MS Windows XP/Vista and Direct X 9.0
Attention!!! DirectX 9.0 should be installed.
11
WinEEG software Installation
To install WinEEG software:
1. Insert the CD to the corresponding drive
2. Open folder with name “WinEEG” (or “WinEEGCompact” or “WinEEGMedium” or
“WinEEGSP”
3. Run SETUP.EXE program.
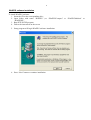
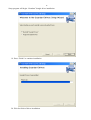
4. Follow the instruction on the screen
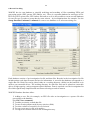
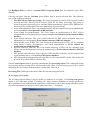
5. Setup program will begin WinEEG software installation
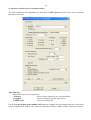
6. Press “Next” button to continue installation.
12
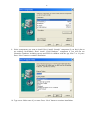
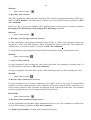
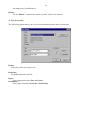
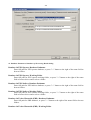
7. Press “Browse…” button if you would like to change location WinEEG program. Press “Next”
button to continue installation.
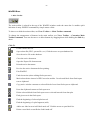
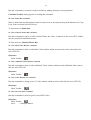
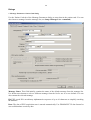
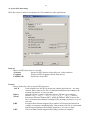
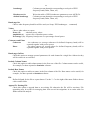
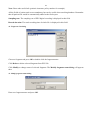
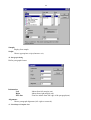
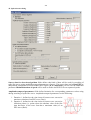
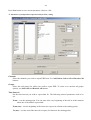
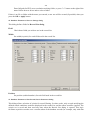
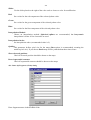
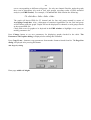
8. Select type of Setup you prefer. Press “Next” button to continue installation. If Custom
installation is selected following window will appear on the screen:
13
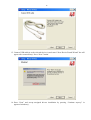
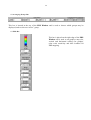
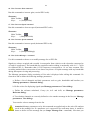
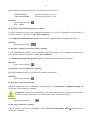
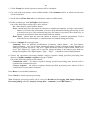
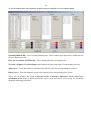
9. Select components you want to install. Don’t install “Sounds” component if you don’t plan to
use auditory biofeedback. Don’t install “Child Database” component if you will not use
Normative Database including spectra and ERP for children with the age from 7 to 16 years.
Press “Next” button to continue installation.
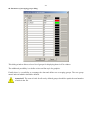
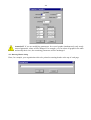
10. Type a new folder name if you want. Press “Next” button to continue installation.
14
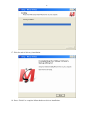
11. Wait for finish of WinEEG software installation.
Setup program will begin installation of Mitsar hardware drivers
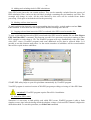
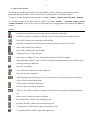
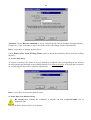
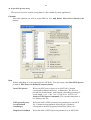
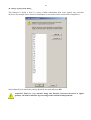
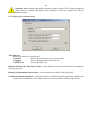
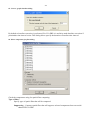
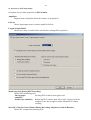
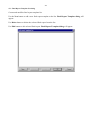
12. Select English language from the list as following:
15
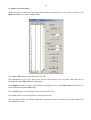
13. Press “Next” button to continue installation.
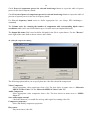
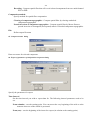
14. Select required hardware drivers that you are going to install in dependence on your hardware
configuration and press “Next” button.
16
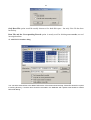
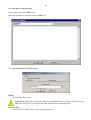
15. Connect USB cable(s) to the selected device(s) and cancel “New Device Found Wizard” the will
appear after connection(s). Press “Next” button.
16. Press “Next” and accept unsigned drivers installation by pressing “Continue anyway” in
appeared window(s).
17
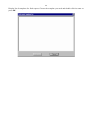
17. Wait for end of driver(s) installation.
18. Press “Finish” to complete Mitsar hardware drivers installation.
18
Setup program will begin “Guardant” dongle driver installation.
19. Press “Finish” to continue installation
20. Wait for finish of driver installation.
19
21. Press “Finish” to complete Mitsar software installation.
22. Insert the “Guardant” dongle in free USB connector.
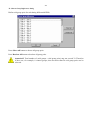
23. Windows will detect a new hardware
24. Select Automatic search for the corresponding driver and allow Windows to install it (press
button “NEXT”).
25. Sometimes you will need to reboot computer
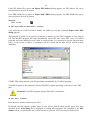
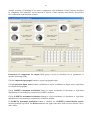
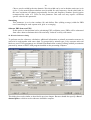
After finishing of Setup you need to run WinEEG program. It will ask for automatically search
connected Mitsar amplifiers. If Mitsar amplifiers are not connected now or some problem occurs the
manual search of connected amplifiers can be performed using Setup: Equipment parameters
command.
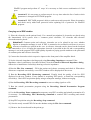
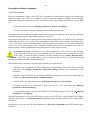
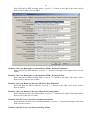
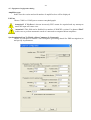
Is you haven’t Security Key you can open protected functions by Access Codes. The Access Codes are
distributed by Mitsar Ltd. Mitsar will give you these codes by requirement if you have purchased the
corresponding hardware/software configuration.
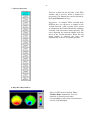
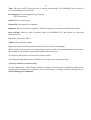
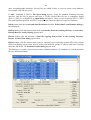
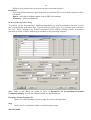
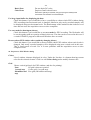
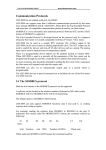
The Access Codes are unique for each amplifier box and are active if this amplifier box is connected to
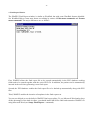
computer only. To generate Access Codes it is necessary to know the information about amplifier box
such as its version and its serial number. This information can be found using Setup: Equipment
parameters command. The next or similar string will be displayed in “Amplifiers type” field if the
amplifier box is connected to the computer:
Mitsar 201 version 8 serial number 46
20
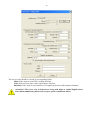
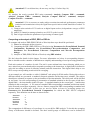
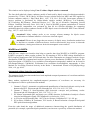
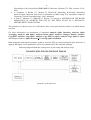
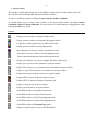
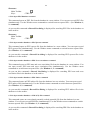
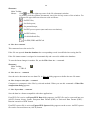
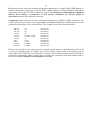
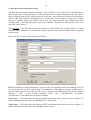
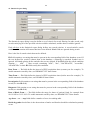
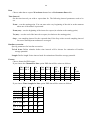
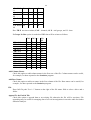
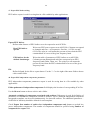
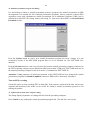
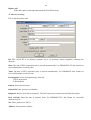
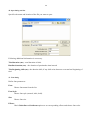
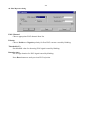
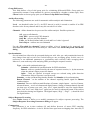
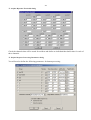
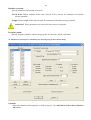
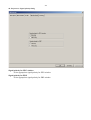
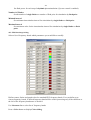
The access codes should be entered to corresponding fields:
Main field is used to open EEG recording function.
Video field is used to open video signal capture function.
Database field is used to open functions of comparison the data with normative database.
Attention!!! The access code is 8-characters string with digits or capital English letters
and without additional symbols such as space, point, comma and others.
21
Mitsar EEG System Overview
There are at least three system configurations that can be used for practical goals:
1. The EEG recording system configuration.
2. The ERP recording system configuration.
3. The video EEG recording system configuration.
Any combination of mentioned above system configuration can be used also.
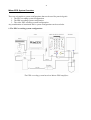
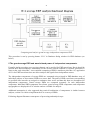
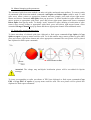
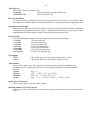
1. The EEG recording system configuration.
The EEG recording system based on Mitsar-EEG amplifiers.
22
The EEG recording system based on Mitsar-EEG-202 amplifiers (model 401 and 403).
The EEG recording system based on Mitsar-EEG-202 amplifiers (model 404 and 406).
All modifications of system differ in the connected Mitsar-EEG amplifiers only and include the doctorphysiologist’s PC (with keyboard, mouse, printer and USB dongle), the EEG amplifiers, the photo
stimulator, the patient’s warning button and the power supply.
23
WinEEG software receives the amplified, pre-filtered and digitized EEG signals, stores them to hard
disk of PC for the future processing, process the signals in real-time and displays them on the PC
monitor. All functions of recording and analysis are controlled using the keyboard and the mouse of PC.
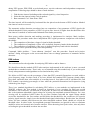
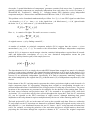
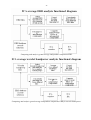
2. The ERP recording system configuration.
The EEG recording system.
This system configuration includes an additional PC (so called stimuli presentation computer). Stimuli
presentation computer is connected with EEG recording computed vie COM ports using null-modem
cable to provide synchronization of signals recording and stimuli presentation. The additional
PSYTASK software developed for Windows XP/Vista presents different stimuli of additional PC such
as images, sounds and text.
PSYTASK software allows prepare pre-defined stimuli presentation protocols and presents these
protocols during ERP recording. During ERP recording PSYTASK software is working in so called
“slave” modes and WinEEG software controls the PSYTASK’s functions by sending the control codes
via COM ports. WinEEG software receives the amplified, pre-filtered, digitized EEG signals, stores
them to hard disk of PC for the future processing and control synchronously stimuli presentation
process.
24
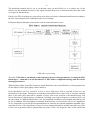
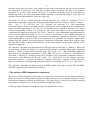
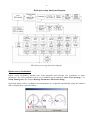
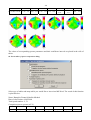
3. The video EEG recording system configuration.
The video EEG recording system with one camera.
25
The video EEG recording system with two cameras.
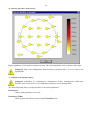
One or two video cameras and microphone can be connected to doctor’s PC for synchronous recording
of EEG and video movies.
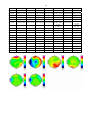
WinEEG software receives the amplified, pre-filtered, digitized EEG signals, stores them to hard disk of
PC for the future processing. WinEEG receives synchronously the signals from cameras and
microphone, compress these signals on-line and stores them to hard disk for future playback and
analysis.
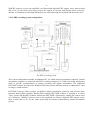
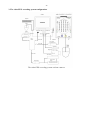
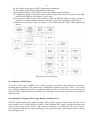
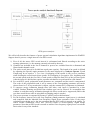
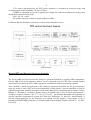
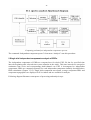
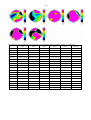
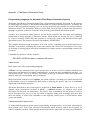
During the work WinEEG and PSYTASK interact with OS and different external modules and drivers
(see figure below).
26
Diagram of interaction of WinEEG and PSYTASK software with different external modules and drivers
27
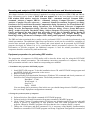
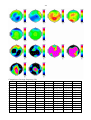
Main Functions
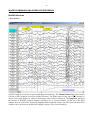
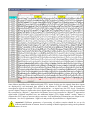
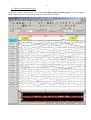
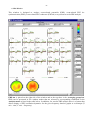
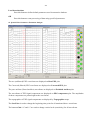
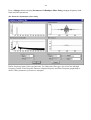
1. EEG Recording.
During recording, EEG and other signals are acquired in digital form by the computer through amplifier
block and displayed on the monitor screen as curves (graphs) simulating those made by a plotter on
moving paper. WinEEG software includes graphic tools allowing the display of paper speed (mm/sec)
and sensitivity (mV/cm) with 10% accuracy. A user can initiate, stop and resume writing EEG signals
on the hard disk to save them for future analysis. Total record duration is limited only by available disk
space.
A video signal from a camera connected to the computer can be recorded synchronously with EEG. The
best results will be if analog or digital camera connected to corresponding video capture card is used. In
this case video signal is compressed on-line that decrease required disk space and increase possible total
recording time. The night video EEG monitoring can be performed if video camera with infrared
illuminant is used. Video capture can be continuous or can be turned on and turned off manually many
times. The video EEG can be played back in moving paper emulation mode. User interface provides a
fast access to any part of EEG and video record. Video signal can be recompressed off line. Any
selected part of video signal can be deleted to decrease total space. Any selected part of EEG and
corresponding video signal can be copied to another smaller file to prepare the data for writing to CD. A
free distributed video EEG viewer is available. It is similar to WinEEG programs and includes all
functions for visual analysis of video EEG data you need.
2. Visual EEG Analysis.
After finishing EEG acquisition, it is possible to analyze stored data visually. During both data
acquisition and visual analysis, EEG signals are displayed in plotter-like mode. Also, the visual analysis
mode enables manual measurement of signal parameters (intervals and amplitudes), horizontal and
vertical (speed and sensitivity) scaling, marking sites of interest, removing artifacts, etc.
3. EEG Processing.
WinEEG includes the following methods of EEG analysis:
1)
2)
3)
4)
5)
6)
7)
Digital EEG filtering.
Artifacts correction based on PCA or ICA decomposition and spatial filtering.
Automatic artifacts detection and elimination.
Automated dipole based spike detection.
Spectral and coherence analysis (including topographic power and asymmetry mapping)
Analysis of EEG indices.
Topographic mapping of instantaneous scalp potential values, spectral parameters and etc,
using 2-D (spherical spline) or 3-D (LORETA) methods.
8) Source dipole localization
9) Event-related potentials.
10) Event-related EEG de-synchronization.
11) Event-related EEG coherence.
12) Event-related wavelet band power.
13) Event-related wavelet coherence.
14) The spectra of EEG independent components.
15) Single trial independent components analysis of ERPs
28
16) The grand average spectra of EEG independent components.
17) The grand average ERPs of independent components.
18) Exporting the data to ASCII file for analysis by another statistical package.
19) Computing of grand average EEG spectra, grand average EEG coherence, grand average ERP,
grand average ERD for selected set of observation.
20) Comparison of EEG spectra, EEG coherence, ERP and ERD for different subjects (groups of
subjects) or condition with the simplest estimation of statistical significance of differences.
21) Batch data processing. It helps to compute a lot of different spectra, ERP, ERD automatically
and etc.
Data flow functional diagram
4. Composing a Final Report.
To create a final report, WinEEG has a built-in window text editor with standard text functions,
including block operations. The patient card is automatically added to the report. There is also a help
menu enabling automatic inclusion of standard formulations in the text. The final report can be prepared
using MS Word. Both the patient card and pictures and tables of processing results can be inserted into
final report text.
5. Printing EEG Fragments, Processing Results and Report Text.
WinEEG enables high-quality graphic printing of EEG signals and processing results on many of the
most popular color or black-and-white printers. When printing EEG signals, absolute horizontal and
vertical scales (paper speed, mm/sec, and sensitivity, Ohm/cm) are maintained with 10% accuracy.
Color printing maintains hues when printing spectra, graphs and maps. Monochrome printers replace
hues with gray levels.
29
6. Maintaining EEG Database and Processing Results.
WinEEG has a built-in database for simplifying data save and search. Using this database is not
mandatory, but it provides features that are often useful. These include automatic conditional data
search, long file archiving and record restoration tools, and dividing the whole set of EEG records into
several independent databases (which may be placed on different changeable magneto optical disks or
CD of large capacity).
WinEEG software database structure
Whole database is divided on two parts: EEG recording database and EEG processing results database.
EEG recording database includes “raw EEG database file” – the list of EEG observations and “raw EEG
working folder” that is the storage of EEG data files and corresponding video movies files and final
report files. Off-line EEG processing results database includes six independent storages (see figure 6).
Each of storages consist of “processing results database file” – the list of records and corresponding
working folder using for writing “processing result files”.
30
Quick Start
The following steps describe briefly how to acquire an EEG and to create a final report:
1). Place the electrodes on the patient's head. For a normal investigation 19 electrodes are placed using
the International 10-20 system. Also a "common point" electrode, "N" electrode and reference
electrodes must be placed.
Attention!!! Common point and reference electrodes are to be placed in any case, whether
bipolar or monopolar montage is used. If EEG is assumed to be recorded in reference to ears two
reference electrodes are placed on the ears. A reference electrode can be placed on the forehead
and connected to A1 or A2 input (the appropriate electrode is provided in the set) and a corresponding
montage is set in the program. EEG signal quality depends on paying special attention to the placement
of common point and reference electrodes.
2) Connect the electrodes to their respective inputs on the front panel of the amplifier block.
3) Set the electrode impedance checking mode using Recording: Impedance command. If the
impedance value is satisfactory (less than 5 kOhm), close the Control of Electrode Impedance dialog.
Otherwise re-install electrodes showing excessive impedance.
4) Run the File: New command. - Fill in the patient card, choose a montage and check it. When these
actions are completed successfully, a new EEG window will be displayed on the screen.
.
5) Run the Recording: EEG Monitoring command. Visually check the quality of the live EEG
displayed in the new window. If any channel is acquiring EEG poorly, re-install the corresponding
electrode(s). Check EEG acquisition quality using a monopolar montage, without averaging.
6) Run the Recording: EEG Recording command to start recording signals to a file. To stop
recording, run the Recording: EEG Recording command once more. One fragment of the EEG will be
recorded. Record another fragment if necessary. Before recording a fragment its name should be set
using the Fragment list on the Recording bar Input Control Toolbar. If photo stimulation is
necessary, set its frequency using arrows in the PS Frequency field of the Recording bar, start the
EEG fragment recording, turn the photo stimulator on using the Recording: Photostimulation (on/off)
command, wait for the time needed, change the photo stimulation frequency or turn the photo stimulator
off, and so on. After finishing the photo stimulation procedure, stop EEG recording.
7) Stop EEG acquisition using the Recording: Stop command.
8) Save the newly created EEG file into the database using the File: Save command.
9) Remove the electrodes and let the patient go.
(Attention!!! To avoid data loss, do not carry out Step 9 before Step 8).
10) Analyze the newly recorded EEG. (See EEG window).
11) Open the Final Report window using the Analysis: Final Report command.
31
12) Compose the final report and save it to the database using the File: Save command.
13) Print the final report and illustrative fragments of the EEG using the File: Print command.
14) Close the WinEEG window using the File: Exit command.
Note. The EEG recorded to the database is the raw one, acquired using monopolar montage in relation
to reference electrodes, with the bandwidth 0.5 - 30 Hz for "Mitsar EEG-2" or 0.15 - 70 Hz for "Mitsar
EEG-3". But the EEG displayed on the screen is reformatted and filtered according to the montage
parameters that have been set (see Setup: Montage List command). The raw EEG data may be
reformatted into any montage, without limitation.
Data Archiving
Don't forget the main difference between "paper" and "paperless" technologies. By recording an EEG on
a paper sheet and putting it in a bookcase, you can be absolutely sure it will be stored safely unless a
catastrophe happens or an untidy colleague accidentally throws the EEG record in a dustbin. We of
course assume that you have effectively arranged your EEG records so you can find any particular one
among all the others, quickly and easily. Paperless technologies help avoid storing kilometers and
kilograms of paper on bookshelves and also simplify searching for necessary records. But it is too soon
for you to relax.
Unfortunately, practically no operating system enables 100% safe data storage. Moreover, magnetic
media are sensitive to damage by different external factors, either mechanical or electromagnetic.
Operating systems and environments on a computer hard disk are even more sensitive given additional
damaging factors such as computer viruses, abuses, hardware (especially hard disk) and software
failures. If you think your computer performance is stable enough, don't rush to calm yourself.
Remember your friends and colleagues who have been working on a PC for a year or longer? Do they
ever complain that documents, graphs, tables or other data, having taken plenty of time to obtain, were
"lost" or "cannot be read"? You should listen to them, because your unique experimental data, from onetime procedures - or your own creative results - is the most valuable information of all.
Modern computer technologies allow development of highly robust storage systems which are, however,
very expensive to apply in medicine. So, data archiving (duplication) is the only way to save results of
your work. Remember also that the capacity of your hard disk is limited, so sooner or later there will be
no free space in which to continue working.
So, in case we succeeded in persuading you that accurate archiving and duplication of EEG data is
necessary and inevitable, here are some words about magnetic media.
Of course, copying EEG files to floppy disks is the easiest way, but also the most expensive. CD or
DVD Writers are the most convenient and relatively cheap. A CD or Writer costs $30-50, and a 700 Mb
optical disk and 4.7 Gb DVD disk costs less than $1. So we recommend this device for EEG archiving.
Finally, what to archive?
EEG files, of course, are most valuable - and, in a number of cases, unrecoverable. After system setup,
these files will be stored in the “\DATA” folder and named as D0000001.EEG, D0000002.EEG,
D0000003.EEG, etc. These names are assigned automatically by the built-in database. Final report texts
are also stored as D0000001.RTF, D0000002.RTF, D0000003.RTF or D0000001.DOC,
32
D0000002.DOC, D0000003.DOC, etc. Processing results, such as power spectra or EEG indices (.SPC
and .IDX files respectively) can also be of a certain value.
In addition, there are database files eegbase.dbf, spcbase.dbf, idxbase.dbf, erpbase.dbf, bfbbase.dbf, etc.,
in the WinEEG working directory. These contain information necessary for automatic data searching
and also links to data files. If you have EEG files or processing results stored, it is always possible to
restore database files, but it can take plenty of effort. So we recommend archiving database files
regularly.
Note that the placement of database and EEG files is not fixed and can be modified by user. So,
additional attention may be needed to archive and duplicate data properly.
Digital EEG Filtering
WinEEG software offers at least two methods of digital EEG filtering.
The first method is used to define the bandwidth and to suppress AC line interference at 50 (60) Hz. It
uses filters with infinite impulse response (IIR) characteristics that most accurately simulate the RC
circuits used in "paper" chart recorders. In other words, IIR filters allow EEG recordings that most
closely mimic results achieved by means of "paper" chart recorders. IIR filters with different order are
used for various goals. Low cut filters are first-order so signal suppression outside the pass-band is small
- 6 dB per octave. High cut filters are second-order. They signal suppression at stop-band is equal to 12
dB per octave. All notch filters are twelfth-order. This filters have the high suppression of at 50 (60) Hz
– more then 40 dB. The notch filters with different stop-band can be used in dependence on settings: 4555, 40-50, 35-65, 55-65, 50-60 or 45-75 Hz. The additional combinations of filters are also available 4555 & 95-105, 40-50 & 90-110, 35-65 & 85-115, 55-65 & 115-125, 50-60 & 110-130 or 45-75 & 105-135
Hz. The last combinations of notch filters can be used for suppression both first and second harmonics of
AC line interference.
Parameters of filters mentioned above can be set in the montage parameter list or by means of the Filters
bar. The disadvantage of these filters is that they shift signal phase.
The second method can be used to detect signals in a certain frequency range, for example, when
calculating event-related EEG de-synchronization. It uses filters with finite impulse response (FIR).
They provide significant signal suppression outside the bandwidth of interest and do not shift signal
phase. Filter parameters can be set by means of the Setup: EEG Bandranges... command. The
disadvantage of these filters is that they take a long time for calculations so they can not be used for real
time EEG acquisition.
Electrooculographic artifacts correction
The method of electrooculographic artifacts correction based on linear regression method in the time
domain. It is very helpful if there are many artifacts related eyes blinks. To use this method an additional
signal (electrooculogram) should be recorded. The electrooculogram (EOG) is recorded using two
additional electrodes placed higher and below eye and connected to additional EEG channels (for
example Fpz and Oz sockets). In this case a montage should include one additional bipolar channel FpzOz.
During the processing WinEEG program using threshold criteria will automatically detect time intervals
in which eye blinks were observed. Using this data WinEEG program calculates coefficient of influence
33
of EOG for each EEG channel separately. Finally WinEEG program subtracts EOG signal multiplied in
corresponding coefficient from EEG signal. This correction procedure can be performed using Analysis:
Remove EOG command.
Attention!!! The quality of work of this correction procedure depends on quality if EOG
recording. The EOG and EEG signals should be recorded using the same frequency bands.
Because additional artifacts can influence on quality of correction of eye blink artifacts the
visual inspection of its result should be done.
34
Correction of EEG artifacts
Eye blink artifacts and some other artifacts can be corrected using this procedure even if the EOG signal
was not recorded. This method based on blind source separation procedure from multi-channel EEG data
and spatial filtering of some components of EEG signal. The input data is manually selected time
interval including artifacts. Blind source separation can be performed using both principal component
analysis (PCA) and independent component analysis (ICA) methods. After the decomposition of miltichannel signal the components of signal related to artifacts are selected manually based during the
analysis of their topographies and waveforms of components. The components corresponding to artifacts
are cleared (set to zero) and corrected EEG waveforms are computed by multiplying artifacts
topographies matrix and new components set. In fact a spatial filter performing equivalent
transformation is calculated and applied to raw EEG. This correction procedure can be performed using
Analysis: Artifacts correction and Analysis: Artifacts correction using templates commands. At last
case the artifacts related components are selected automatically using criteria of similarity to predefined
artifact topography templates.
More information concerning this method can be found at: Jung T., Makeig S., Humphries C., Lee T.,
McKeown M., Iragui V and Sejnowski T. Removing electroencephalographic artifacts by blind source
separation. // Psychophysiol. 2000, V.37, P.163-178.
It should be emphasized that the quality of artifact signal correction depends on a possibility to separate
the blind source signals related to the artifacts. Theoretically the artifact related signals usually correlate
with brain signals. As results there is no way to separate pure artifact related components. That is why
some EEG signals will be suppressed also by this method. Our studies are shown that this method will
suppress EEG and ERP signals for the frontal recording sites (Fp1 and Fp2 channels) to a marked
degree. These studies are shown that ICA method will give smaller signal distortions in comparison with
PCA method.
Attention!!! The quality of work of this correction procedure depends on selection of time
interval used for estimation of spatial filter matrix. That is why the visual inspection should
be done after performing this procedure. If the results of artifact correction are not
satisfactory another time interval should be selected for analysis.
Automatic and manual artifacts elimination
WinEEG program includes different artifacts detection procedures. The simplest way is a visual
inspection of EEG record and marking or removing the time intervals including artifact related signals.
Long term artifacts can be constantly removed from EEG recording. Following steps should be done to
remove artifacts.
1. Find the time interval including artifact related signals by visual inspection.
2. Select the time interval using vertical markers (see Chapter 15.7.7).
3. Run command “Clear” from menu “Edit”.
WinEEG software will remove selected time interval from EEG recording and length of EEG file will
decreases.
This method of removing artifacts related time interval has some disadvantage. The additional artifacts
related to transient response of band pass and notch filters in EEG recording parts joint time moments.
Another manual procedure does not remove artifacts related time intervals from EEG recording but
marks it only. These time intervals will exists in EEG recording but will be eliminated from processing
35
during EEG spectra, ERP, ERD, wavelet band power, wavelet coherence and independent components
computation. Following steps should be done to mark artifacts.
1. Find the time interval including artifact related signals by visual inspection.
2. Select the time interval using vertical markers.
3. Run command “Cut” from menu “Edit”.
The time interval will be marked by horizontal blue bar placed on the bottom of EEG window. Marked
time interval can be recovered.
The automatic artifact detection procedures base on comparison of any parameter of EEG signal with
defined threshold. If this parameters of EEG for given time interval is higher then threshold then this
time interval is marked as artifact and eliminated from further processing.
Most power artifact detection and marking procedure is implemented in Analysis: Mark Artifacts
command. This procedure makes three independent EEG signal parameters comparison with defined
thresholds:
1. The comparison of absolute voltage of signal with the threshold.
2. The comparison of amplitude of slow wave in defined frequency band with the threshold.
3. The comparison of amplitude of fast wave in defined frequency band with the threshold.
This procedure can be performed many times independently.
Command “Mark Artifacts…” from submenu “Analysis” runs this procedure. Search and rejection
artifacts” dialog will appear on the screen and allows enter or change parameters of automatic artifact
detection.
EEG Indices
The section describes the algorithm for analyzing EEG indices and its features.
We should note that the method of EEG index analyses implemented in this software is more a research
method than a standard routine. That is why we recommend using this method only if you realize quite
clearly what parameters and algorithms are used and what they mean.
We define an EEG index as the percentage of time that EEG potential fluctuations occurred within a
given frequency range. In other words, if we have defined four standard EEG frequency bands (alpha,
beta, theta, and delta) then, after analysis of recording interval, four indices will be calculated for each
EEG channel, representing percentages of time when the potential fluctuations had frequencies lying
within the given ranges.
There is no standard algorithm for calculating EEG indices, so two methods are implemented in the
WinEEG software: the first method is based on detection of zero crossings for half-wave period
calculation; the second one - on detection of local peaks. In either case one additional parameter is used:
this is the minimum (threshold) signal voltage for rejecting low-amplitude potential changes. So a zero
crossing will be considered valid if there are two time readouts such that the signal voltage should
exceed the threshold for the first readout, and fall below the threshold for the second one (for opposite
polarity signal intervals, simply invert the threshold and signal relationships). Besides that, the potential
values for time readouts placed between the above-threshold readouts found, should not exceed the
threshold value. In other words, low-amplitude potential fluctuations are ignored in order to eliminate
amplifier noises and external ones from the analysis. When detecting local peak values, also only those
exceeding the given threshold are taken into account.
36
The threshold potential may be set as an absolute value (in microVolts) or as a relative one. In the
relative case the standard deviation of the signal potential about zero is calculated and half of this value
is accepted as the threshold.
Finally, raw EEG recordings are not used for processing, only those reformatted and filtered according to
the user-selected parameters established in the active montage.
Following diagram illustrates consequence of processing and analysis steps.
EEG indices processing.
Therefore, EEG indices calculation results depend on the processing parameters (set using the EEG
Bandranges... command or in the Parameters of EEG indices computation dialog) and also on the
montage parameters.
While defining limits of the EEG frequency bands should not cause any difficulties, selecting parameters
for the indices can be quite highly counter-intuitive.
If the threshold is too low (could be as low as zero), half-waves will be selected if there are any
fluctuations of the signal. Taking into account that real amplifiers have some level of self noise and that
there is also other noise detected in a number of cases, such a low selection of the threshold may well
lead to detection of high-frequency oscillations, including some with a frequency exceeding 30 Hz. On
the other hand, if a high threshold value is set, low-amplitude oscillations (beta-rhythm most likely) will
be lost. In addition, these algorithms are unstable in the presence of circuit noise if its level is significant.
So it is impossible to offer unified recommendations for choosing the optimal amplitude threshold setup,
especially in view of the dependence of noise level on montage parameters and the notch filter use. Here
we list a set of parameters that is optimal from our point of view: low-frequency filter 30 Hz, notch filter
37
50 Hz is on, absolute peak-to-peak threshold 3 uV. The peak-to-peak threshold should be chosen to
exceed the amplifier noise level for the chosen bandwidth.
Selection of half-wave detection algorithm is also not trivial.
If you use the algorithm based on zero crossing detection, processing will detect low-frequency highamplitude oscillations caused by signal baseline fluctuations generated by motor or vascular artifacts.
The influence of artifacts can be reduced by choosing a lower frequency limit. We recommend the value
of 0.1 sec (or 1.5 Hz). Unfortunately, even in this case estimated EEG indices would be offset towards
the low frequency range. For example, high-frequency low-amplitude signal oscillations in the beta
range are often observed against high-amplitude low-frequency potential fluctuations. In this case, the
zero-cross half-wave detection algorithm will not detect the high-frequency signal components.
However, at the same time, the results obtained by means of this algorithm will correspond better to
those of spectral analysis, although not precisely.
On the other hand, the algorithm of half-wave detection from local extremes is less sensitive to motor
and vascular artifacts and is also more sensitive when detecting high-frequency low-amplitude signal
oscillations. The results of EEG indices analysis by means of these methods are the closest to visual EEG
estimations. Though this method leads to some offset of the indices toward the high-frequency range, we
consider it to be the most stable. But, unfortunately, this approach is used practically nowhere and seems
to be original. That, certainly, is a significant disadvantage for its implementation in routine
encephalographic investigations.
So, if you still have not given up EEG indices analysis, here are some recommendations that of course
must not be considered as dogma:
1) Choose the bandwidth (we recommend 0.1 sec for low cut and 30 Hz for high cut).
2) Turn on the notch filter.
3) Set the absolute threshold near 3 uV.
4) Choose an appropriate algorithm of half-wave detection (the local extreme-based algorithm has
a number of advantages but if you use it, further comparison of results with the limited, existing
data will be complicated). The algorithm choice, therefore, is defined by your goal.
5) Either fix the chosen parameters once and for all, or systematically investigate the dependence
of results on control parameters. Don't try to manipulate parameters in order to reach a certain
local goal: for example to prepare a remarkable illustration for your EEG description.
6) A final reminder: there are no standards or norms for the methods of EEG indices analysis.
EEG Power Spectra
This section describes the algorithm of power spectral computation.
We assume you are already acquainted with theoretical basis of spectral analysis. If not, you can find
complete information in the book by J.Bendat, A.Pirsol «Random data. Analysis and measurement
procedure», John Wiley and Sons, NY 1986, 540 pp. As for the practical use of EEG spectral analysis in
the diagnosis of diseases, you can read specialized journals such as «Electroencephalography and
Clinical Neurophysiology».
Following diagram illustrates consequence of processing and analysis steps.
38
EEG spectra analysis.
We will briefly describe the features of power spectral calculation algorithms implemented in WinEEG.
Suppose that we process a single interval of an EEG record:
1) First of all, the source EEG record interval is reformatted and filtered according to the active
montage parameters (i.e. the montage currently selected by the user).
2) Channels not included in the list of channels to process are excluded from the reformatted and
filtered multi-channel record.
3) The entire record interval is divided into equal parts (epochs). The length of an epoch is defined
by adjusting the Epoch Length parameter in the menu displayed by Analysis: Spectra. Epoch
Length may be set equal to 1, 2 or 4 sec. Overlapping of the epochs is also set as a parameter
when dividing the record interval into epochs. If Overlapping is set equal to 50%, beginning with
the second epoch each, the first 50% of each epoch overlaps the final 50% of the previous epoch.
After the interval is divided into epochs, separate calculations are performed for each channel.
4) For each EEG epoch, polynomial trend parameters are computed and the trend is compensated.
The order of the polynomial trend is set by means of the corresponding parameter and can be
chosen from 0 to 5. If zero trend order is chosen, only the constant (DC) component is eliminated.
5) To suppress energy infiltration through filter side lobes, each epoch is smoothed by a time
window. Bartlett, Hanning and Welch time window types can be selected. If a rectangular time
window is used then energy infiltration through side lobes would not be suppressed (and in this
case there would be no sense in using half-overlapping analysis epochs).
6) The power spectrum is computed by means of "quick Fourier transformation".
7) For the frequency interval set by the Low-Frequency Band parameter, signal power is calculated
and compared with the Maximal Low-Frequency Signal Power parameter value. If the power
calculated exceeds that set by the last parameter then the EEG epoch is treated as an artifact. To
cancel artifact elimination, select zero (0.25 Hz) limits of Low-Frequency Signal Range
parameter. Note that an EEG epoch is treated as artifact if low-frequency signal power exceeds the
limit value for any of the channels.
39
8) Finally the average spectrum is calculated for each separate channel over all non-artifact EEG
record epochs in the single interval.
You may think choosing EEG spectral analysis parameters is too cumbersome. If so, we recommend you
use a standard parameter set: epoch length - 4 sec, 50% overlapping, zero order of polynomial trend,
Hanning time window, 0.2-1.25 Hz range of low-frequency signal, 200 mkV2 maximal low-frequency
signal power. The duration of the analyzed interval should not be less than 10 sec (for at least 4 epochs
to be averaged). Use other settings and parameter values only when needed to obtain data compatible
with that described in the literature.
EEG power spectra dynamics, EEG coherence, EEG phase spectra, bi-spectra and bi-coherence can be
computed and saved together with EEG power spectra but auto and cross correlations are computed
separately and saved in another file.
Event-Related Potentials
This section describes the main features of the event-related potential (ERP) acquisition tool. (We
assume you are familiar with the ERP method.)
WinEEG permits recording the simplest long-latency visual evoked potentials (evoked by a photo
stimulator flash) as well as event-related potentials (ERP_, such as P300 wave, mismatch negativity
(MMN), conditionally negative variance (CNV) and many others. In evoked response measurements, an
additional computer is used as a universal device for presenting visual and auditory stimuli. It is
connected to the WinEEG computer by a null-modem (link) cable through the COM1 or COM2 serial
port in order to synchronize stimulation and EEG recording. The stimulus-presenting computer should
use PSYTASK 2.x software working in concert with WinEEG. In addition, a pushbutton connected to
the ECG channel input or to “digital input” (in dependence on amplifiers type) can be used for
monitoring user response.
Although EEG is being recorded non-stop during the whole investigation, non-overlapping EEG
intervals (trials) will be selected for ERP calculation, for synchronizing signal, and used for ERP
summation. If photo flash ERPs are recorded then trial length and pre-stimulus interval duration are set
as processing parameters. In this case you may calculate ERPs for a selected EEG record interval, for the
whole record, or for each fragment separately.
If an additional stimulus-presenting computer is used, trial length is defined by a protocol set in the
PSYTASK program. In this case one trial can present more than one stimulus. Several different ERPs are
calculated for different trial subsets. To sort trials into subsets, special trial labels (arbitrary integer
numbers) are also set in the stimuli presentation protocol.
Artifact records are eliminated during ERP calculation. For cognitive ERPs, the patient response is also
analyzed: reaction time and percent of error are calculated separately for each trial subset.
Following diagram illustrates consequence of processing and analysis steps.
40
ERP analysis.
Finally, you can average ERP over a group of patients selected from the database.
Event-Related EEG De-synchronization and Coherence
Event-related EEG de-synchronization (ERD) and event-related EEG coherence (ERCoh) are computed
similarly to ERPs (see above). ERD and ERCoh can be calculated only for EEG files recorded together
with stimulus presentation by PSYTASK program on an additional stimulus-presenting computer.
Below we describe the algorithm of ERD computation (see Kalcher J. Pfurtsheller G. Discrimination
between phase-locked and non-phase-locked event-related EEG activity // EEG and Clin. Neurophysiol.
1995, V. 94, P.381. and G. Pfurtscheller, F.H. Lopes da Silva. Event-related EEG/MEG synchronization
and desynchronization: basic principles // Clinical Neurophysiology. 1999, V. 110, P. 1842-1857.). The
method of ERCoh is not common at present but it is described, for example, in: Shibata T., Shimoyama
I., Ito T., Abla D., Iwasa H., Koseki K., Yamanouchi N., Sato T., Nakajima Y. The synchronization
between brain areas under motor inhibition process in humans estimated by event-related EEG
coherence // Neurosci. Res. 1998, v.31., p. 265-271.
Event-related EEG de-synchronization and synchronization (ERDS) is calculated by several steps:
1) To reduce the affect of the common referent, source EEG is reformatted to average weighted
referent (do not forget to use a montage containing an average weighted referent AvW).
2) The signal for a given frequency range is detected for each EEG fragment (trial) by means of
digital band pass filters (do not forget to turn band pass filter on).
3) To reduce the influence of ERP components on ERDS, averaged ERPs are computed over the
trial to be then subtracted from each trial.
4) To assess EEG signal power dynamics for a given frequency range, for each time readout (bin)
the values are squared and averaged over all trials.
41
5) To reduce data dispersion, the EEG power dynamics is smoothed by moving average with
averaging epoch width (optimally 100 ms or 25 bins).
6) ERDS is calculated as percent of signal power change for each bin in relation to average power
during the prestimulus interval (R):
((P(i) - R) / R) x 100%
The signals obtained are then averaged similarly to ERPs.
Following diagram illustrates consequence of processing and analysis steps.
ERD analysis.
Wavelet ERP and Wavelet Coherence Analysis
The wavelet ERP and wavelet coherence analysis is performed similarly to cognitive ERP computation,
wavelet ERP and wavelet coherence analysis can be performed only for EEG files recorded together
with stimuli presentation by PSYTASK program on an additional stimulus-presenting computer.
These methods is based on signal power and coherence dynamics assessment for the given frequency
range by means of source EEG wavelet decomposition. Usually Morlet’s wavelet transform is used for
signal decomposition. Detailed description event-related band power computing can be found in TallonBraudry C., Bertrand O. Oscillatory gamma activity in humans and its role in object representation //
Trends in Cognitive Science 1999. V.3., No 4, P.151-162, and detailed description the algorithm of
wavelet coherence computation is present in R. Saab, M.J. McKeown, L.J. Myers, R. Abu-Gharbieh. A
Wavelet Based Approach for the Detection of Coupling in EEG Signals // Proceedings of the 2
International IEEE EMBS Conference on Neural Engineering Arlington, Virginia · March 16 - 19, 2005.
P.616-620
42
Recording and analysis of ERP, ERD, ERCoh Wavelet Power and Wavelet coherence.
This chapter includes a brief description of method of recording and analysis of ERP, ERD and ERCoh.
More information can be found in PSYTASK user manual and in the next chapters of this manual:
EEG window, ERP window, Analysis: Compute ERP… command, Analysis: Compute ERD…
command, Analysis: Compute ERCoh… command, Analysis: Compute Wavelet… command,
Analysis: Compute Wavelet coherence… command, Stimuli Presentation Program List dialog,
Parameters For Event-Related Potential Computation dialog, Parameters For Event-Related Desynchronization Computation dialog, Parameters For Event-Related Coherence Computation
dialog, Wavelet Decomposition dialog, Wavelet Coherence dialog, Choose Group Differences
dialog, Artifact Rejection Thresholds dialog, Subject Response Processing Parameters dialog,
Export and Import the data, Batch data processing, Select List of Channels dialog, Results of
Averaging And Subject Response Processing dialog, Graphics Page Format Dialog, EEG
Bandranges dialog, Parameters of Bandpass Filter dialog and Equipment Configuration dialog.
The ERP and other mentioned above studies can be performed if EEG is recorded synchronously with
stimuli presentation. The additional signal from special micro switch can be recorded for estimation of
reaction time and task performance. The auditory and visual stimuli can be presented by PSYTASK
program developed by Mitsar Ltd or by conventional stimuli presentation software (for example
Presentation or E-Prime program). An additional computer is used for stimuli presentation. Both
computers should be connected by null-modem cable.
Equipment preparation for performing ERP studies.
The preparation of computers for ERP studies will be describe below only for using the PSYTASK
program for the stimuli presentation. The information concerning preparation of computers for using
other presentation software can be found in corresponding user manuals.
1. Installation and preparation PSYTASK program.
1. Install PSYTASK program. To do this installation insert CD with PSYTASK setup program and
run SETUP. Follow the instruction on the screen.
2. Run PSYTASK program.
3. Perform Modify Synchronization Parameters (Windows XP) command and check parameters of
Serial Port for External Synchronization. The default parameters are the next:
Baud Rate – 57600,
Word length – 8,
Stop bits –1
Parity – NONE
You can change these parameters. But in this case you should change them in WinEEG program
also (see Setup: Equipment configuration command).
2. Testing the synchronization of computers.
4. Perform Switch to Slave Mode command of PSYTASK program.
5. Perform Analysis: Stimuli Presentation Programs command of WinEEG program
6. Click “Update” button. If synchronization COM ports are defined correctly the progress bar will
display a process of transferring of task protocols from PSYTASK program to WinEEG
program. Otherwise WinEEG program will report that the slave computer doesn’t respond.
7. Change the COM ports and their parameters if it is necessary using Modify Synchronization
Parameters command of PSYTASK program and Setup: Equipment configuration command of
43
WinEEG program and perform 4-7 steps. It is necessary to find correct combination of COM
ports.
Attention!!! It is necessary to perform steps 4-6 every time when the list of tasks or their
parameters is changed in PSYTASK program.
Attention!!! PSYTASK program is able to send correct task protocols. Please be attentive
and check newly added task protocols before updating list of protocols for WinEEG
program.
Carrying out of ERP studies.
1). Place the electrodes on the patient's head. For a normal investigation 19 electrodes are placed using
the International 10-20 system. Also a "common point" electrode, "N" electrode and reference
electrodes must be placed.
Attention!!! Common point and reference electrodes are to be placed in any case, whether
bipolar or monopolar montage is used. If EEG is assumed to be recorded in reference to ears two
reference electrodes are placed on the ears. A reference electrode can be placed on the forehead
and connected to A1 or A2 input (the appropriate electrode is provided in the set) and a corresponding
montage is set in the program. EEG signal quality depends on paying special attention to the placement
of common point and reference electrodes.
2) Connect the electrodes to their respective inputs on the front panel of the amplifier block.
3) Set the electrode impedance checking mode using Recording: Impedance command. If the
impedance value is satisfactory (less than 5 kOhm), close the Control of Electrode Impedance dialog.
Otherwise re-install those electrode(s) showing excessive impedance.
4) Run the File: New command. - Fill in the patient card, choose a montage and check it. When these
actions are completed successfully, a new EEG window will be displayed on the screen.
.
5) Run the Recording: EEG Monitoring command. Visually check the quality of the live EEG
displayed in the new window. If any channel is acquiring EEG poorly, re-install the corresponding
electrode(s). Check EEG acquisition quality using a monopolar montage, without averaging.
6) Run the Recording: EEG Recording command to start recording signals to a file.
7) Run the stimuli presentation program using the Recording: Stimuli Presentation Program
command.
8) Use the Recording: Pause command to temporary stop EEG recording and stimuli presentation if it
is necessary. Use Recording: EEG Monitoring command to continue EEG recording and stimuli
presentation.
9) Stop EEG acquisition using the Recording: Stop command.
10) Save the newly created EEG file into the database using the File: Save command.
11) Remove the electrodes and let the patient go.
44
(Attention!!! To avoid data loss, do not carry out Step 11 before Step 10).
12) Analyze the newly recorded EEG using commands: Analysis: Compute ERP… command,
Analysis: Compute ERD… command, Analysis: Compute ERCoh… command, Analysis:
Compute Wavelet… command.
Attention!!! If it is necessary to study subject reaction time and task performance parameters
(omission and commission errors) the signal from special micro-switch should be recorded. To
do this:
1) Connect micro-switch to ECG socket or to digital inputs socket (in dependence on type of EEG
amplifiers).
2) Add ECG channel to montage planed to use (if ECG socket is used).
3) Don’t forget to define the parameters of processing of button signal.
Computing and analysis of ERP, ERD or ERCoh.
To compute and analyze ERP (ERD, ERCoh or Wavelet) three steps should be performed:
1) Manual or automatic artifact rejection.
2) Computing the ERP (ERD, ERCoh or Wavelet) using Parameters for Event-Related Potential
Computation, Parameters for Event-Related De-synchronization Computation, and
Parameters for Event-Related Coherence Computation and Wavelet Decomposition
dialogs.
3) Analysis of ERP (ERD, ERCoh or Wavelet) using ERP window.
We don’t describe details in this chapter. For more information see below in corresponding chapters.
But we should to make a number of definitions to simplify understanding of used processing parameters.
Each task consists of a number of trials. The trial is some minimal time interval during which one or
more stimuli are presented and subject responds according to the instruction. A digital label is defined to
each trial according to mean of stimulus (stimuli) and task instruction. This digital labels help to sort
EEG sweeps corresponding to task trials for averaging.
As an example we will consider so called “Odd ball” task using for P300 studies. During this task two
different stimuli are presented: a standard (frequent) stimulus and deviant (rare) stimulus. The subject
should press a button in response to the presentation of deviant stimulus. The whole task will be divided
on two parts. Let trial corresponding to presentation of standard stimulus in the first part of task have
digital label 1, deviant stimulus in the first part – 2, standard stimulus in the second part – 3 and deviant
stimulus in the second part – 4. We want to compute ERP corresponding to standard and deviant stimuli
in the first and second parts separately. Also we want to compute the ERP corresponding to standard and
deviant stimuli in whole task. In this case we need to define at least six averaging groups (see
Parameters for Event-Related Potential Computation) for which the ERP will be computed
separately. This definition can be done as shown below:
Standard1
Deviant1
Standard2
Deviant2
Standard
Deviant
1
2
3
4
1,3
2,4
The computation of differences of waveforms is very useful for ERP analysis. To do this the averaging
Group of differences should be defined. The three useful groups of differences can be defined for
45
mentioned above example: Deviant1 – Standard1, Deviant2 – Standard2 and Deviant – Standard. In this
case the processing parameters will be the next:
2-1,4-3,6-5
The artifacts elimination procedure bases on comparison absolute voltage of EEG with defined
threshold. The recommended value of voltage threshold is in voltage interval from 70 to 100 uV.
Attention!!! Select “Only EEG” mode for artifact detection if the micro-switch signal was
recorded. Otherwise all sweeps including subject response will be eliminated.
Usually the synchronization by first stimulus is recommended. Another setting of synchronization
parameters can be used if two or more stimuli in the trials are presented with different intra stimuli
interval.
The parameters of subject response processing should be defined if signal of micro-switch was recorded
only.
Finally WinEEG have a number of predefined sets of ERP processing parameters saved in the files into
WinEEG\ERPPARAM folder and corresponding to each example of task included in PSYTASK
program:
P300.PAR
Go_NoGo.RAP
TOVA.PAR
PAT_H.PAR,
PAT_HLR.PAR,
PAT_LR.PAR
- for Odd ball task,
- for Go-NoGo task,
- for TOVA task,
- for Reversionary pattern tasks.
The parameters of computation of ERD, ERCoh and Wavelet are the similar.
Analysis of EEG independent components and ERP independent components
A common view of EEG and ERP components recorded from the scalp is that they are a superposition
of several signals from sites placed inside the brain. Many attempts of localization of these sources were
made at different scientific laboratories in the world. The results of this studies is the development very
effective methods of localization of equivalent brain sources thus as dipole source localization, low
resolution electro-magnetic tomography and etc.
This studies display some problems that should be solved to increase the accuracy of localization of
brain sources. So in the case of equivalent dipole sources localization the number of dipoles is a priori
unknown.
One of solution of this problem is to decompose raw multi channel EEG to a number of components
using information about interaction of signals recorded from different sites and localize equivalent
sources for resulting components separately. The additional suggestion is usually any independence of
these components.
Assumptions that underline the application of ICA for analysis of array of individual EEG and ERPs are
as follow: 1) summation of the electric currents induced by separate generators is linear at the scalp
46
electrodes; 2) spatial distribution of components’ generators remains fixed across time, 3) generators of
spatially separated components are temporally independent from each other (for review see Onton, J.,
Westerfield M., Townsend J., Makeig, S., Imaging human EEG dynamics using independent
component analysis // Neuroscience and Biobehavioral Reviews 2006, V.30, P.808–822.).
This problem can be formulated mathematically as follow. Let X i (t ) is raw EEG signal recorded from
i -th electrode ( i = 1, N ), t – time, s j (t ) is the signal from j -th blind source ( j = 1, M ) placed inside
the brain. Let X i (t ) is the sum of s j (t ) with different waves:
X i (t ) = ∑ Ai , j s j (t )
j
Here Ai , j is a matrix of weights. The task is to recover a version,
u j (t ) = ∑ W j ,i X i (t ) ,
i
of original sources s j (t ) by finding a matrix W j ,i .
A number of methods as principal component analysis (PCA) suggest that the sources s j (t ) are
uncorrelated ( 〈u i u j 〉 = 0, ∀ ij ). In contract with decorrelation techniques independent component
analysis (ICA) is imposes a much stronger criterion, statistical independence required that all secondorder and higher-order correlations of u j (t ) are zero. Statistical independence means the joint
probability density function (pdf) of the output factorizes
N
p (u ) = ∏ pi (u i )
i =1
The data submitted to ICA are simply the recorded EEG channel data arranged in a matrix of n channels
(rows) by t time points (columns). No channel location information at all is used in the analysis. ICA
performs a blind separation of the data matrix (X) based only on the criterion that resulting source time
courses (U) are maximally independent. Specifically, ICA finds a component ‘unmixing’ matrix (W)
that, when multiplied by the original data (X), yields the matrix (U) of independent component (IC) time
courses.
Each column of the (W-1) mixing matrix represents the relative projection weight at each electrode of a
single component source (IC topography). Mapping these weights to corresponding electrodes on a
cartoon head model allows visualization of the scalp projection or scalp map of each source. The source
locations of the components are presumed to be stationary for the duration of the training data. That is,
the brain source locations and projection maps (W-1) are assumed to be spatially fixed, while their
‘activations’ (U) reveal their activity time courses throughout the input data. Thus, the IC activations
(U), can be regarded as the EEG waveforms of single sources, although obtaining their actual
amplitudes at the scalp channels requires multiplication by the inverse of the unmixing matrix (W-1).
The back-projected ICs (Xi) are in the same mV units as the recorded scalp data. However, neither the
IC scalp maps nor the IC activations are themselves calibrated. Rather, the original activity units (mV)
and polarities (+/-) are distributed between the two IC factors - the IC scalp map and activation time
series. For example, reversing the polarities of the activation and inverse weight matrices, then backprojecting the activations through the respective columns of W-1 recovers the original component
47
activities in their native mV units. Thus, neither the sign of the scalp maps nor the sign of the activations
are meaningful in themselves, but only their product, which determines the sign of the potential
accounted for at each scalp channel. However, IC activation magnitudes may be normalized by
multiplying each by the root-mean square (RMS) amplitude of the corresponding IC scalp map. The
activation units are then RMS mV across the scalp array.
The matrix W can be s found using the infomax approach (see Bell A.J., Sejnowski T.J. An
information-maximization approach to blind separation and blind deconvolution // Neural. Comput. –
1995. – Vol. 7. – P. 1129-1159., Lee, T.W., Girolami, M., Sejnowski, T.J., 1999. Independent
component analysis using an extended infomax algorithm for mixed subgaussian and supergaussian
sources. Neural Computation 11, 417–441.) to carry out blind source separation. Infomax ICA is one of
a family of algorithms (Cardoso, J.-F., Laheld, B., 1996. Equivariant adaptive source separation. IEEE
Transactions on Signal Processing 44, 3017–3030.; Comon, P., 1994. Independent component analysis,
a new concept. Signal Processing 36, 287–314. Jutten C and Herault J (1991): Blind separation of
sources I. An adaptive algorithm based on neuromimetic architecture. Signal Processing 24:1–10. ) that
exploit independence to perform blind source separation. ICA algorithms can separate complex multi
channel data into spatially fixed and temporally independent components whose linear mixtures form
the input data records, without detailed models of either the dynamics or the spatial structure of the
separated components.
The “Infomax” algorithm was implemented in EEGLAB software (Delorme A., Makeig S. EEGLAB:
an open source toolbox for analysis of single-trial EEG dynamics including independent component
analysis // Journal of Neuroscience Methods 2004, Vol.134, pp. 9–21.) and successfully applied for
both analysis of independent components of EEG, ERP (for review see Onton, J., Westerfield M.,
Townsend J., Makeig, S., Imaging human EEG dynamics using independent component analysis //
Neuroscience and Biobehavioral Reviews 2006, V.30, P.808–822.) and for artifacts correction
procedures (Delorme A., Sejnowski T, Makeig S. Enhanced detection of artifacts in EEG data using
higher-order statistics and independent component analysis. NeuroImage, 2007, V. 34, P. 1443–1449.).
This “Infomax” algorithm was implemented in WinEEG software for analysis on raw EEG and ERPs.
WinEEG program provides following possibilities:
1 The spectra of EEG independent components.
The spectra of EEG independent components are computed for selected time interval. Multi-channel raw
EEG is decomposed to independent components. Than power spectra are computed separately for each
independent component similarly described above. The single spectra, average spectra and component
topographies are displayed in ICA window and are available for analysis.
Following diagram illustrates consequence of processing and analysis steps.
48
Computing and analysis independent components spectra.
The command “Independent component spectra” from menu “Analysis” runs this procedure.
2 Single trial independent components analysis of ERPs.
The independent components of ERPs are computed not for whole EEG file but for specified time
intervals beginning after selected time events (stimulus in the trials). This time intervals are merged to
continuous time series and corresponding multi-channel raw EEG is decomposed to independent
components. ERPs are computed separately for each independent component similarly described above
ERPs calculation (Chapter 15.15). Single trials component waveforms, average component ERPs and
component topographies are displayed in ICA window and are available for analysis.
Following diagram illustrates consequence of processing and analysis steps
49
Computing and analysis independent components ERP.
The command “Independent component ERP” from menu “Analysis” runs this procedure.
3 The grand average spectra of EEG independent components.
The spectra of EEG independent components are computed for selected in EEG database collection of
EEG recordings. Additional assumption is also suggested that cortical localization of components is
similar between subjects, so that it is viable to implement the ICA on array of EEGs. The ICA
decomposition of the array of individual EEGs was performed as follows. Several seconds epochs
(defined as parameter of processing) of artifact-free multi channel EEG recording of each subject were
merged into conjunct time series. This time series was used for assessment of W matrix.
Let Xc - conjunct time series.
XC = U X j
j
where Xj – individual EEG of j-th subject, and
U
denote conjunction operator.
j
The unmixing matrix was estimated in accordance to the next equation
X C = WC−1 S C
using Infomax algorithm.
Then individual activation curves for each subject were calculated as following
S j = WC X j
50
For each individual and for each independent component the power spectra were computed. Individual
spectra of components, grand average spectra of components and component topographies are displayed
in ICA window and are available for analysis.
Following diagram illustrates consequence of processing and analysis steps.
Computing and analysis grand average independent components spectra.
This procedure is run by pressing button “ICA” in Database dialog window for EEG database (see
below)
4 The grand average ERPs of independent components.
The independent components of average ERPs are computed using selected in ERP database array of
individual (subject or observation) ERPs as a source data. The parts of ERP waveforms corresponding to
specified time intervals are merged to continuous time series and than this data are decomposed to
independent components. Grand average ERPs are computed separately for each independent
component. Individual ERP component waveforms, grand average ERP components and component
topographies are displayed in ICA window and are available for analysis.
Additional assumption is also suggested that cortical localization of components is similar between
subjects, so that it is viable to implement the ICA on array of ERPs.
Following diagram illustrates consequence of processing and analysis steps.
51
Computing and analysis grand average independent components ERP.
This procedure is run by pressing button “ICA” in Database dialog window for ERP database (see
below)
5 The grand average ERD and wavelet band power of independent components.
Formally similar procedure (see previous chapter) can be applied for ERD waveforms. But it should be
stressed here that assumption “Summation of the electric currents induced by separate generators is
linear at the scalp electrodes” is not satisfied computing of ERD is nonlinear procedure. So, application
of ICA for ERD waveforms does not allow analyzes the signals from independent sources.
The independent components of average ERDs are computed using selected in ERD database array of
individual (subject or observation) ERDs as a source data. The parts of ERD waveforms corresponding
to specified time intervals are merged to continuous time series and than this data are decomposed to
independent components. Grand average ERDs are computed separately for each independent
component. Individual ERD component waveforms, grand average ERD components and component
topographies are displayed in ICA window and are available for analysis.
Additional assumption is also suggested that cortical localization of components is similar between
subjects, so that it is viable to implement the ICA on array of ERDs.
Following diagram illustrates consequence of processing and analysis steps.
52
Computing and analysis grand average independent components ERD.
Computing and analysis grand average independent components ERD for wavelet band power.
53
Video EEG recording
WinEEG program provides the next features for Video EEG recording:
1. Synchronous on-line recording of EEG, video signals from one or two cameras and audio signal
from microphone.
2. On-line and off-line compression/recompression of video and audio signal. MPEG4 compression
of video signal and MPEG3 compression of audio signal are provided.
3. Night video monitoring using video camera with infrared illuminant.
4. Manual marking of events during EEG and video recording.
5. Off-line synchronous playback of EEG, video and audio signals.
6. Automatic positioning to video pictures corresponding to manually selected EEG sample or
marker.
7. Editing of EEG, video and audio signals to save meaningful fragments only.
8. Advanced service for preparation of CD copy of video EEG record.
9. Compact but powerful free video EEG viewer for displaying of CD or DVD copy of video EEG
record provides next passivity: off-line.
The next command of WinEEG program help to control corresponding features of Video EEG
recording: Setup: Video Recording, View: Main Video Window, View: Additional Video Window,
View: Video Window Size, Recording: Video Recording, Edit: Clear All…, Edit: Clear All Video
Data, File: Compress Video Files, File: Export EEG and Video EEG, Recording: Play Forward,
Recording: Rewind Forward. Positioning to video pictures corresponding to manually selected EEG
sample can be performed using horizontal scroll bar of EEG window. The selection of sample in EEG
window to which corresponding video frame will be displayed can be done using Sample slider placed
at the top of EEG window.
Export and Import the data
There is a possibility to save raw EEG data for selected time interval or whole EEG record to anther
data format. The WinEEG program supports the next data formats for export raw EEG data:
1) ASCII data format. The columns of resulting data file correspond to montage channels and rows
– to time samples. The data is processed before exporting according to the montage parameters,
band pass filtering and artifacts correction procedures and is stored to the file in micro Volts.
2) Binary data format. The data is stored as 4-bytes float number in multiplexed format; i.e., letting
J = number of montage channels and I = number of time points (samples) in selected time
interval, the data points are as follows: data point #1 for channel #1, data point #1 for channel
#2, … , data point #1 for channel #J; … ; data point #I for channel #1, data point #I for channel
#2, … , data point #I for channel #J. The data is processed before exporting according to the
montage parameters, band pass filtering and artifacts correction procedures and is stored to the
file in micro Volts.
3) European Data Format (EDF) that supported by software developed by another companies. The
data is processed before exporting according to the montage parameters, band pass filtering and
artifacts correction procedures.
4) Universal Data Format (UDF) – an extension of EDF data format.
5) LEXICOR data format.
The WinEEG program is able to export EEG spectra, EEG coherence, ERP and ERD to ASCII data
format for the further processing of these data by STATISTICA or similar programs for more advanced
statistical analysis.
The WinEEG program supports the next data formats for import raw EEG data recorded by other
equipment:
54
1) ASCII data format. The columns of resulting data file correspond to montage channels and rows
– to time samples.
2) European Data Format (EDF) that supported by software developed by another companies.
3) Universal Data Format (UDF) – an extension of EDF data format.
4) NeuroScan CNT data format.
5) NeuroScan EEG data format.
Grand averaging and Batch data processing
The WinEEG program can compute grand average EEG spectra, grand average EEG coherence, grand
average ERP and grand average ERD for selected set of observation. To perform grand averaging open
corresponding database, select subset of records and press button “Average”.
Attention!!! The compatible data only can be used for grand average computation. This means
the montage and processing parameters should be the same for all averaging spectra, ERPs or
ERDs.
The WinEEG program can perform batch data processing. It helps to process large amount of data
automatically. This could be artifacts correction, artifacts detection, EEG filtering, computation EEG
power spectra and coherence, ERP, ERD, wavelet analysis and wavelet coherence. The results of
processing can be saved to source EEG data files and to new processing results data files in dependence
on settings. The power spectra and coherence, ERP, ERD, wavelet decomposition and wavelet
coherence are saved in corresponding databases of processing results. The processing report could be
generate automatically and could be used for detection of processing mistakes. To start batch data
processing open EEG database, select subset of records and press button “Average”.
Following diagram illustrates automatic EEG batch processing steps.
55
EEG batch processing functional diagram.
Dipole source localization
Dipole source localization function uses scalp potentials and electrode 3-D coordinates as input
parameters. The 3-D coordinates can be set or modified using commands View: Select montage… or
Setup: Montage list (See chapter Montage Parameters: Electrodes dialog)
Equivalent dipole source coordinates and momentums are computed automatically using this method
and are displayed in a special window.
56
This window can be displayed using View: Toolbar->Dipole window command
The four-shell spherical volume conductor model of head used by dipole source localization method is
presented by C.J.Stol, J.W.H. Meijs, M.J.Peter Inverse solution based on MEG and EEG applied to
volume conductor analysis // Phys. Med. Biol., 1987, V.32, No.1, P.99-104. Least-square solution if
inverse problem is performed by Nelder-Meade simplex method (W.H.Press, S.A.Teukolsky,
W.T.Vetterling, B.P.Flannery. Numerical Recipes in C. The Art of Scientific Computing. Second
Edition. Cambrige University Press 1992, 994 p. Used in WinEEG program optimization of forward
model parameters computation was presented by Sun M. An efficient algorithm for computing
multishell spherical volume conductor models in EEG dipole source localization. IEEE Trans. Biomed.
Eng., 1997, V. 44, P.1243–1252.
Attention!!! Many authors prefer to use average referent montage for dipole source
localization to eliminate influence of reference electrode signal.
Attention!!! Please do not forget that an accuracy of dipole source localization method can
be bad due to a number of different factors: incorrect head model, large errors in electrode
coordinates, existing more than one brain electromagnetic source and etc.
WinEEG and LORETA
WinEEG have simple user interface that helps to transfer data from WinEEG to LORETA program.
LORETA program is rather popular software for 3D mapping of EEG or ERP voltage distribution or
EEG frequency band power into 3D Talairach atlas. For more information see chapters Analysis: Source
distribution (LORETA) command and Analysis: Spectra power distribution (LORETA) command. The
detail description of LORETA (Low resolution electromagnetic tomography) method can be found in
R.D.Pasqual-Marqui, C.M.Michel, D.Lehmann Low resolution electromagnetic tomography: A New
Method for Localizing Electrical Activity in the Brain. // International Journal of Psychophysiology
1994, v.18, pp. 49-65.
Automated spikes detection and analysis
The automated spike detection method uses both amplitude-temporal parameters of waveforms and their
spatial characteristics.
Many authors emphasized the amplitude-temporal parameters of waveforms are necessary for
development of effective spike detection methods.
1. Gotman J, Gloor P. Automatic recognition and quantification of interictal epileptic activity in the
human scalp EEG. Electroenceph clin Neurophysiol, 1976, Vol. 41, P. 513–529.
2. Gotman J, Wang LY. State-dependent spike detection: concepts and preliminary results.
Electroenceph clin Neurophysiol, 1991, Vol. 79, P. 11–19.
3. P.Y.Ktonas Automated spike and sharp wave (SSW) detection. In Methods of analysis of brain
electrical and Magnetis signals. EEG handbook (revised series, Vol 1)
4. A.S.Gevins and A.Remond (Eds). 1987, Elsevier Science Publishers B.V. 211-241 pp.,
5. P.Van Hesse, H.Hallez, B. Vanrumste, Y.D`Asseler, P. Boon Evaluation of temporal and spatial
EEG spike detection algorithms.
From the other hand the usage of additional parameters characterizing the spatial distribution of
potentials (for example, equivalent dipole parameters) can increase a specificity of detection method.
57
1. D. Flanagana, R. Agarwala, Y.H. Wanga, J. Gotman Improvement in the performance of
automated spike detection using dipole source features for artifact rejection. Clinical
Neurophysiology, 2003, Vol. 114. P. 38–49.
2. A. Ossadtchi, S. Baillet, J.C. Mosher D. Thyerlei,W. Sutherling, R.M.Leahy Automated
Interictal Spike Detection and Source Localization in MEG using ICA and Spatio-Temporal
Clustering. Clinical Neurophysiology, 2003, submitted.
The amplitude-temporal parameters using by WinEEG program are the following:
1. Duration 1, defined as the time interval between two successive
maxima or minima of an EEG wave (Dur1).
2. Duration 2, defined as the time interval between two successive
inflection points (i.e. points where the absolute value of the first
time derivative of the wave form has a maximum value) of an
EEG wave (Dur2).
3. Duration A, defined as the time interval between the beginning
and the pick of an EEG wave (DurA).
4. Duration B, defined as the time interval between the pick and the
end of an EEG wave (DurB).
5. Amplitude A, measured from the beginning to the pick of EEG wave (AmpA).
6. Amplitude B, measured from the pick to the end of EEG wave (AmpB).
7. Amplitude, measured from the baseline (zero-voltage) to the pick of EEG wave (AmpZ).
8. Slope 1, defined as the maximum magnitude of the first time-derivative during the leading edge
of an EEG wave (Sl1).
9. Slope 2, defined as the maximum magnitude of the first time-derivative during the trailing edge
of an EEG wave (Sl2).
10. Sharpness, defined as the second time derivative of an EEG wave at its pick: (d2P/d2t).
For more information see following papers:
1. P.Y.Ktonas Automated spike and sharp wave (SSW) detection. In Methods of analysis of brain
electrical and Magnetic signals. EEG handbook (revised series, Vol 1).
2. A.S.Gevins and A.Remond (Eds). 1987, Elsevier Science Publishers B.V. 211-241 pp.
The dipole parameters using by WinEEG program are the following:
1. Relative residual energy (RRE)
2. Dipole source eccentricity (ECC = X2+Y2+Z2).
The parameters of dipole source are used both for more exact spike detection and for eye blink artifact
rejection. Both monopolar and bipolar montages could be used for EEG to which automated spike
detection is applied. But dipole source parameters will be not estimated for EEG at bipolar montage.
The estimation of dipole model could be done using raw EEG voltage and EEG component (PCA or
ICA) topographies.
1. D. Flanagana, R. Agarwala, Y.H. Wanga, J. Gotman Improvement in the performance of
automated spike detection using dipole source features for artefact rejection. Clinical
Neurophysiology, 2003, Vol. 114. P. 38–49.
2. P. Van Hese, P. Boon, K. Vonck, I. Lemahieu1, R. Van de Walle A New Method for Detection
and Source Analysis of EEG Spikes.
3. Bart Vanrumste, Richard D. Jones and Philip J. Bones DETECTION OF FOCAL
EPILEPTIFORM ACTIVITY IN THE EEG: AN SVD AND DIPOLE MODEL APPROACH.
58
Proceedings of the Second Joint EMBS/BMES Conference Houston, TX, USA, October 23-26,
2002.
4. A. Ossadtchi, S. Baillet, J.C. Mosher D. Thyerlei,W. Sutherling, R.M.Leahy Automated
Interictal Spike Detection and Source Localization in MEG using ICA and Spatio-Temporal
Clustering. Clinical Neurophysiology, 2003, submitted.
5. S. Faul, L. Marnane, G. Lightbody, G. Boylan, S. Connolly A METHOD FOR THE BLIND
SEPARATION OF SOURCES FOR USE AS THE FIRST STAGE OF A NEONATAL
SEIZURE DETECTION SYSTEM.
The parameters of dipole source are used both for more exact spike detection and for eye blink artifact
rejection.
For more information see description of command Analysis: Spike Detection, Analysis: Spike
Averaging, Analysis: Add Spike, Analysis: Delete Spike, Analysis: Change Channel, Analysis:
Copy EEG, Analysis: Copy Spike, Analysis: Copy EEG to report, Analysis: Copy Spike to report
and dialogue windows: Spike detection and Average spike calculation
Both monopolar and bipolar montages could be used for EEG to which automated spike detection is
applied. But dipole source parameters will be not estimated for EEG at bipolar montage.
Following diagram illustrates consequence of processing and analysis steps.
Automatic spike detection.
59
Warranties
Of course WinEEG may have its own bugs as any other software. We apologize in advance for possible
troubles and promise to do our best to find and correct software errors hoping that you would meet them
not very often. If you detect any discrepancy between the manual and the real performance of the
software, please do not hesitate to contact the developers directly. You can always learn the contact
information using the Help: About WinEEG… command. Quick and effective troubleshooting is our
duty, and we shall be grateful for your help in detecting any bugs. You will receive a free revised
software version on your request.
Extending the WinEEG vocabulary of software features is another question. WinEEG is a commercial
product, so the developers follow industry practices and deliver the product "as is". Your comments on
the product features will be gratefully accepted and probably be taken into account when developing
further software versions. But we cannot guarantee immediate addition of new features requested by our
users.
Naturally, we will meet the wishes of any customer who wishes to support the development of new
methods for EEG analysis.
60
WinEEG COMMANDS AND INTERFACE REFERENCE
WinEEG Windows
1. EEG Window
An EEG window is used for electroencephalogram monitoring. The Channel Names bar placed on the
left side of EEG window is used for channel selection. The Slider placed in the top of EEG window is
used to select time sample for which a synchronous video frame is displayed. The Status bar placed in
the bottom of WinEEG window displays parameters for a selected channel. In the top of the EEG
window there is a time scale displaying fragment names and time marks. Any EEG interval in the EEG
window can be selected for further processing by means of two vertical markers.
61
Some Mitsar amplifiers have additional digital (TTL) inputs. In this case the signals from these inputs
are displayed by red horizontal bars placed at the bottom of EEG window. Thin horizontal bar
correspond to logical zero (high TTL level) and thick bar – to logical one (low TTL level). Usually the
special “digital” button is connected to these digital inputs to measure subject reaction. Upper horizontal
bar correspond to “Digital 1” input and to left button, lower bar correspond to “Digital 2” input and to
right button. If Mitsar amplifiers have not additional digital (TTL) inputs another “analog” button is
connected to ECG input to measure subject reaction. Last modification of button has two output levels:
left button – low level, right button – high level and provide all possibilities as “digital button.
Attention!!! Different parameters of processing of subject reaction should be set up for
different modification of buttons. Incorrect settings of button signal processing can be potential
source of errors.
62
Main features of EEG window are listed below:
1. EEG Acquisition.
During EEG recording additional information is displayed in the window.
Current time is displayed on the left top corner of the window. Total duration of EEG recorded to the
hard disk is shown on the left bottom corner of the window. The time scale colored by yellow indicates
the signals which are really recorded to the disk.
Attention!!! If window background is colored by red this means that batteries are low and you
should change them as soon as it is possible.
63
Use Record menu commands to manage EEG acquisition including start EEG monitoring and recording,
start/stop video capturing, pause and stop recording. Note that these commands are available only for a
new EEG file. In other words, you cannot record EEG into a pre-existing file in the database. To create a
new EEG file, use File: New command.
2. Searching for an EEG interval.
To find a certain EEG interval, use the scrollbar or keys (Left arrow, Right arrow, Page Up, Page
Down). To go to the beginning of a certain fragment, use the View: Find Fragment command. To
playback EEG or video EEG use the Record: Rewind Back, Record: Play Back, Record: Play
Forward and Record: Rewind Forward commands.
The video frames are displayed synchronously with EEG scrolling in pop-up Video Windows. This
window is shown or hided by View: Main Video Window and View: Additional Video Window
commands. Its size is changed by View: Video Window Size command.
3. Comparing two EEG intervals.
To perform this task, first of all split the EEG window in two panes using Window: Split command.
Then use scrollbars in each pane to find the intervals of interest.
4. Copying window contents to clipboard.
To perform this task, use Edit: Copy command. The waveform areas visible in the EEG window will be
copied to clipboard and can be then pasted into final report text or into any application (WinWord,
Paint. etc.) window by means of Edit: Paste command.
5. Selecting an interval for processing.
To select an interval, use vertical markers. Place the cursor on the time scale of the active window - the
cursor should change its form to:
Clicking the left or right mouse button sets the corresponding left or right marker. The time scale for
selected interval will be highlighted in color.
Marker position can be changed by means of the mouse. Place the cursor on one of the markers - the
cursor should change its form to:
Then drag the cursor (with left mouse button pressed).
Marker position can also be changed using keyboard. Press Shift + Left /Right arrow keys to move left
marker. Press Ctrl + Left /Right arrow keys to move right marker. Press Ctrl + Shift + Left /Right
arrow keys to move both markers simultaneously.
6. Printing an EEG interval
To print an EEG interval, use File: Print and File: Print Preview commands.
64
7. Deleting an EEG interval
You may need to delete an EEG artifact interval. To delete an interval, select it and use Edit: Clear
command. This command can be used to delete a part of video data only but EEG data will be kept.
Attention!!! Using this command you have a risk to loss the data. That is why the usage of
Edit: Clear command to mark artifacts time interval is the better ideas.
8. Choosing a channel to be processed.
To choose a channel, press the corresponding button on the Channel Names bar. You can also choose
channels using Arrow Up and Arrow Down keys. For more detailed view of a single channel use onechannel display mode. To toggle between one-channel and multi channel modes, place cursor on a
button on the Channel Names bar or on the corresponding EEG curve and double click left mouse
button.
9. Comparing EEG for different channels.
To compare EEG recorded from different sites you can place one curve over another while viewing.
Place cursor on a button on the Channel Names bar and drag vertically with left mouse button pressed.
The curve depicting the selected channel also will move in the vertical direction. When left mouse
button is released the selected curve automatically returns to its original position.
10. Measuring channel parameters.
Channel parameters are measured automatically and displayed in the status bar fields. Note that all
parameters are not always measured. The selected interval (see 8. above) should be 100msec - 10sec
long and visible in the EEG window.
The following parameters are computed automatically:
1. EEG value at the left marker: L = 0.1 uV.
2. EEG value at the right marker: R = 0.1 uV.
3. Time interval between two markers: T[R-L] = 0.1 sec.
4. Difference between EEG values at the two markers: R-L = 0.1 uV.
5. EEG amplitude, i.e. difference between maximal and minimal values in the selected interval
A=0.1 uV.
6. «Average» signal frequency: F = 1.0 Hz.
7. Photo stimulation frequency: FS = 5 Hz.
11. Montage modification.
To edit montage parameters, run the View: Select Montage… command.
12. Changing speed (horizontal scaling).
On the Filters bar choose an appropriate value from the Speed list. You can also use "*" and "/" keys.
Press "/" key to decrease speed by half or "*" key to double the speed.
13. Changing gain (vertical scaling).
On the Filters bar choose an appropriate value from the Gain list. You can also use "+" and "-" keys.
Press "-" key to half reduce gain by half or "+" key to double the gain.
65
To change gain only for a selected channel, hold Ctrl pressed. Otherwise gain will be changed for all
channels that are visible in the montage.
14. Changing upper cutoff frequency.
On the Filters bar choose an appropriate value from the High Cut (Hz) list.
To change high cut only for a selected channel, hold Ctrl pressed. Otherwise high cut will be changed
for all channels that are visible in the montage.
15. Changing lower cutoff frequency
On the Filters bar choose an appropriate value from the Low Cut (Hz) list.
To change low cut only for a selected channel, hold Ctrl pressed. Otherwise low cut will be changed for
all channels that are visible in the montage.
16. Setting AC Mains (50/60) Hz notch filter.
On the Filters bar choose an appropriate value from the Notch (Hz) list.
To change notch only for a selected channel, hold Ctrl pressed. Otherwise notch will be changed for all
channels that are visible in the montage.
17. Baseline offset.
On the Filters bar click up and down arrows of the Baseline field to change baseline.
To change baseline only for a selected channel, hold Ctrl pressed. Otherwise baseline will be changed
for all channels that are visible in the montage.
18. Adding or clearing user labels.
To add a user label, run the Edit: Add Label command or press Add Label button on the main
toolbar and choose label type from the popup menu. The cursor will change its shape to:
Place cursor at the desired position in the EEG window and click. When adding a Channel or a
Contour label, its length can be adjusted by dragging and releasing the left mouse button.
To find a certain label, use Find next left label and Find next right label buttons on the main toolbar.
To delete a label, run Edit: Delete Label command or press Delete Label button on the main toolbar.
The cursor will change its shape to:
Place it on the label to be deleted and click the left mouse button.
Attention!!! After you have finished dealing with labels, press the Add Label or Delete Label
button on the main toolbar to return to default mode. The cursor will return to its standard
shape.
66
19. Adding and excluding trials for ERP calculations.
Some EEG trials (intervals) can contain artifacts. They can be manually excluded from the process of
ERP calculation. Place cursor on the trial label (rectangle containing the trial number) and click. The
rectangle will change its color. All the trials labeled by this color will be excluded from further
processing. Click again to include the trial in the processing.
20. Marking artifacts time intervals.
To mark artifacts time intervals, select corresponding time interval by vertical markers and use Edit:
Cut command. A horizontal blue bar displayed the artifacts marking time interval.
21. Copying selected time intervals of EEG record and video EEG record to another file.
To copy a selected time intervals of EEG record and video EEG record to another file, use File: Export
EEG and Video EEG” command. This function is useful if it is necessary to prepare a number of video
EEG examples to write them to CD. The WinEEG program will copy automatically video EEG data,
video EEG viewer (ViewEEG program) and some additional service data in selected folder. It is
possible to run this function many times. As the results a number of subfolders will be created and the
data will be copied in these subfolders.
START.EXE utility helps to open all copied data automatically by ViewEEG program.
ViewEEG program is restricted version of WinEEG program providing reviewing of video EEG data.
Attention!!! ViewEEG program requires DirectX 9.0 installation.
22. Search for EEG events.
Sometime it is necessary to find quickly such called EEG events. WinEEG program is able to finds
simplest events: time intervals during which the absolute voltage of selected EEG channel is higher the
defined threshold. To start this procedure, use Edit: Find command.
67
23. Automated spike detection.
To automatically find and mark spikes use a command Analysis: Spike Detection. All founded spikes
will be marks by vertical dot-lines and spike’s labels in the bottom of EEG window. A name of channel
in which the pick voltage was maximal is printed in spike’s label.
The EEG window could be divided into two parts by horizontal splitter. In this case the EEG will be
displayed in upper parts and position of all founded spike will be output in lower part by vertical bars.
The horizontal scale is selected thus as the whole array of spikes can be displayed in lower part. The left
and right border of track-button of scroll bar will correspond to first and last displayed EEG sample.
They will correspond to first and last displayed spike’s mark also. This relationship between trackbutton, displayed spikes array and displayed time interval at upper part will help to find a part of EEG
required for analysis.
68
24. Manual changing spike parameters.
The automated spike detection method can miss real spikes and mark some artifacts. To correct results
of automated spike detection method commands Add Spike and Delete Spike could be used. To add
spike move mouse pointer to appropriate channels and time sample, press and release right mouse
button and choose command Add Spike from pop-up menu. To delete marked as spike artifact move
mouse pointer to appropriate spike label, press and release right mouse button and choose command
Delete Spike from pop-up menu. To change “main” channel of spike (defining a localization of spike
source) move mouse pointer to appropriate spike label, press and release right mouse button, select
command Change Channel in pop-up menu and choose appropriate channel from additional menu.
25. Insert spike waveform into report.
To insert waveform of selected spike into clipboard or final report commands Copy Spike of Copy
Spike to report of pop-up menu could be used. To do this artifact move mouse pointer to spike label
press and release right mouse button and select appropriate command The next picture will be placed
into clipboard or final report commands.
Attention! The voltage map and dipole localization picture will be not added for bipolar
montage.
To insert corresponding to spike waveforms of EEG into clipboard or final report commands Copy
EEG of Copy EEG to report of pop-up menu could be used. The next picture will be placed into
clipboard or final report commands.
69
Attention! Use MS Word only if you want to insert picture into final report.
70
26. Display spectra density arrays.
To display “Spectra density arrays” use command Analysis: Spectra Density Array. The color bitmaps
(time-frequency plots) will be displayed at lower part of EEG window.
71
27. Scalp potentials maps.
Scalp potentials maps are displaying automatically in Maps window for selected by vertical markers
time samples.
28. Dipole source localization.
The dipole source localization is performed automatically for selected by vertical markers time samples.
The results of dipole source localization are displayed in Dipole window.
72
2. Final Report Window
The WinEEG Final Report window is similar to WordPad, but with some WordPad features disabled.
See WordPad Help to learn more about text editing by means of Edit menu commands and Format
menu commands. The major differences are as follows:
First, WinEEG allows the final report file to be created automatically in the EEG database working
folder and to be opened together with the active EEG file. In addition, the patient card is automatically
inserted in the text when generating a new final report.
Second, the EEG database enables the final report file to be backed-up automatically along with EEG
files.
Third, WinEEG enables the insertion of templates in the final report text.
You are not obliged to use the built-in WinEEG final report editor. To use Microsoft Word and to keep
all the advantages of the built-in editor, you should install MS Office 2000 and customize WinEEG for
using Microsoft Word (see Setup: Final Report... command).
73
3. EEG Maps Window
This window displays maps of instantaneous ERP values for a selected EEG interval. The EEG interval
is divided into non-overlapping epochs with length defined by the Step parameter value. Thus, the
number of maps displayed depends on the selected interval duration and on the "Step" parameter value.
For each channel and each epoch, time-averaged ERP values are used as input data for an interpolation
algorithm. Under each map there are figures displaying the beginning and the end of the averaging
epoch relative to the first time readout of the selected EEG interval.
On the right side of the window there is Maps bar. In the top of the bar there is a color scale and below
it controls allows to modify mapping parameters are placed.
Use the Scale list or "+" and "-" keys to change color scale sensitivity.
Use the Step list to change averaging epoch length.
Use the Size list to zoom maps.
Use the Setup: Mapping Style command to change color scale palette and appearance of maps.
Use Edit: Copy command to copy maps visible in the window to the clipboard. They can then be pasted
into final report text or into any application (WinWord, Paint. etc.) window by means of Edit: Paste
command.
74
4. EEG Power Spectra (Auto and Cross-correlations) Window
This window is designed for EEG power spectra and correlation analysis. On the right side of the
window there is Spectra bar and at the window bottom there is the Calculator bar.
The results of EEG power spectral analysis can be presented in seven window modes that are selected
by commands available on the Analysis menu:
Graphs
Histograms
Table
Maps
Asymmetry
Power spectra (auto and cross correlation) are shown as graphs for each
separate channel. For the Spectral Dynamics display mode, spectra for each
epoch are superposed with a small vertical shift.
Total signal power for given EEG frequency bands is depicted as a
histogram for each separate channel. Disabled for auto and cross
correlation
For EEG power spectra: absolute or related (percent) of spectral power and
the frequency of signal maximum for given EEG frequency bands are listed
in the table
For EEG coherence: average coherence and the frequency of signal
maximum for given EEG frequency bands are listed in the table
For EEG autocorrelations: minimal lag value in which autocorrelation
function cross zero and corresponding to lag frequency are listed in the
table
For EEG cross-correlations: value of first maximum (minimum) of cross
correlation function and corresponding lag are listed in the table
Total signal power for given EEG frequency bands is shown on maps. For
the Spectral Dynamics mode, power is mapped separately for each epoch.
Disabled for auto and cross correlation
Total signal power asymmetry for given EEG frequency bands is shown on
75
Formula
(Mapping)
Formula
(Graphs)
Interaction
diagram
maps. For the Spectral Dynamics mode, asymmetry is mapped separately
for each epoch. Disabled for auto and cross correlation
A map depicting the ratio of signal powers for two given EEG frequency
bands. The ratio formula is defined by means of the Calculator bar. For
the Spectral Dynamics mode, multiple maps are displayed. Disabled for
auto and cross correlation
Signal power ratio dynamics for two given EEG frequency bands. Disabled
for auto and cross correlation
The EEG coherence and cross correlation can be presented by so called
interaction diagrams.
For EEG coherence: electrodes will be connected by curves with different
thickness and colors in dependence of value of average coherence
For EEG cross correlation: electrodes will be connected by curves with
different thickness and colors in dependence of value first maximum
(extreme) of cross correlation function.
The window can display background EEG coherence and phase spectra as well as power spectra.
Bi-spectra and bi-coherence are displayed by frequency-frequency color plots.
76
To switch between window modes, use the following Analysis menu commands:
EEG Spectra
Coherence for
Channels
Average Coherence
Phase Spectra
Bispectra
Bicoherence
Displays EEG power spectra (autocorrelation)
Displays EEG coherence (cross correlation) for a
selected channel
Displays average EEG coherence for all channels
Disabled for auto and cross correlation
Displays EEG phase spectra for a selected channel.
Disabled for auto and cross correlation
Displays EEG bi-spectra frequency-frequency plots
Disabled for auto and cross correlation
Displays EEG bi-coherence frequency-frequency plots
Disabled for auto and cross correlation
If spectral dynamics have been calculated during EEG processing, you can toggle between Average
Spectra and Spectral Dynamics window modes (see Analysis menu commands) Disabled for auto and
cross correlation.
Use the Scale list or “+” and “-” keys to change color scale sensitivity (or Y axis scale for graphs).
Use the Value list (disabled for auto and cross correlation) to choose what value to depict in graphs
and maps:
P (uV^2)
Graphs: Y axis shows signal power. Color scale encodes power
(in regular intervals).
Measurement units – squared microvolt.
77
A (uV)
Graphs: Y axis shows signal “amplitude”, i.e. square root of
power. (The “amplitude” term has physical sense only for
spectral graphs, in all other cases it means square root of the
total signal power in a given frequency band). Color scale
encodes “amplitude” (in regular intervals).
Measurement units – microvolt.
%
Graphs: Y axis shows percentage of total broadband signal
power is in a particular frequency band. Color scale encodes
power percentage (in regular intervals).
Measurement units – percent.
Graphs: Y axis shows logarithm of signal power
For coherence and auto and cross-correlations
For phase
Log(P)
Units
Grad
Use the Fill By list (disabled for auto and cross correlation) to choose how to fill areas under a graph
or a histogram.
None
Bandranges
Color Scale
Blank (white) areas
Fills areas by colors defined in the standard frequency band
parameters (see Setup: EEG Bandranges… command)
Fills areas by color scale showing power level
Choose graph or map size from the Size list.
Use Normalization fields (disabled for auto and cross correlation) to define frequency band used for
computation and displaying normalized spectra (see above Value: %). These parameters will influence
on results of statistical comparison of two spectra (see Analysis: Comparison of results command).
Use Statistics field (disabled for auto and cross correlation) to show or hide results of statistical
comparison of two spectra. The statistical significance of differences is displayed be vertical bar with
different height: shorter bar means that significant of differences is lower then 0.05 (p<0.05), middle bar
– p<0.01 and longer bar – p<0.001.
Use the Channel list to choose a channel to display EEG coherence or phase spectrum for.
For Graphs and Histograms modes, Value, Freq. (tag) and p<0.0* fields of the status bar are used to
show power level, frequency and significance of differences. A frequency component may be pointed to
on a graph or selected in a histogram by cursor position, when holding the left mouse button pressed.
There is a possibility to add one or more maps corresponding to selected frequency of frequency band.
A frequency component may be pointed to on a graph or selected in a histogram by cursor position,
when holding the right mouse button pressed. When right button will be released a pop-up menu will
appears on the screen. Use Add Map command to add map for selected frequency.
78
Use the Setup: EEG Bandranges… command (disabled for auto and cross correlation) to modify
parameters for standard EEG frequency bands.
Use the Setup: Mapping Style command to change color scale palette and map appearance.
Use Edit: Copy command to copy graphs or maps visible in the window to the clipboard. They can then
be pasted into final report text or into any application window (WinWord, Paint and etc.) by means of
Edit: Paste command. The table of spectral parameters can be also copied to clipboard as text.
Use the File: Save command to save newly calculated EEG power spectra in the database.
Use the Analysis: Insert tables into report command (disabled for auto and cross correlation) to
insert detailed report into the text of MS Word window. This option is available only if raw spectra are
kept during computation of power spectra (see Parameters of EEG spectra computation dialog).
Use the File: Print command to printout of content of window. Graphs and maps are rescaled to fit
single page.
79
The preliminary review of printing form can be done using the command File: Print Preview.
80
5. EEG Indices Window
This window is designed for EEG indices analysis.
On the right side of the window there is the Maps/Spectra/Indices bar and at the window bottom there
is a Calculator bar. The results of EEG indices analysis can be presented in six window modes that are
switched from one to another by corresponding commands found on the Analysis menu:
Graphs
Histograms
Table
Maps
Asymmetry
Formula
Indices are depicted as graphs for each separate channel. X axis
- frequency (0.25 Hz increments), Y axis – percentage of time,
that signal of a given frequency was detected.
Indices are depicted as graphs for each separate channel. X axis
- frequency (0.25 Hz increments), Y axis – percentage of time,
that signal of a given frequency lay within a certain standard
EEG frequency band.
EEG indices are listed in a table.
Percentage of time a signal existed within a certain standard
EEG frequency band.
Map of Asymmetry of EEG indices.
Ratio of percentages of signal existence time for two standard
EEG frequency bands is mapped. Ratio formula to be mapped
is defined by means of Calculator bar
Use the Scale list or “+” and “-” keys to change color scale sensitivity (or Y axis scale for graphs).
Use the Fill By list to choose how to fill areas under a graph or a histogram.
None
Bandranges
Blank (white) areas
Fills areas by colors defined in the standard frequency band
81
Color Scale
parameters (see Setup: EEG Bandranges… command)
Fills areas by color scale showing index level
Choose graph or map size from the Size list.
For Graph and Histogram modes, Value and Freq. Fields of the status bar are used, showing level
and frequency for an index indicated by cursor on a graph or a histogram when holding the left mouse
button pressed.
Use the Setup: EEG Bandranges… command to modify parameters for standard EEG frequency
bands.
Use the Setup: Mapping Style command to change color scale palette and map appearance.
Use Edit: Copy command to copy graphs or maps visible in the window to the clipboard. They can then
be pasted into final report text or into any application (WinWord, Paint and etc.) window by means of
Edit: Paste command. The table of spectral parameters can be also copied to clipboard as text.
Use the File: Save command to save newly calculated EEG indices in the database.
82
6. ERP Window
This window is designed to analyze event-related potentials (ERP), event-related EEG desynchronization (ERD), event-related EEG coherence (ERCoh) or to perform wavelet ERP analysis.
ERP bar is placed on the right side of the window and at the top there is the Averaging group bar.
ERPs can be presented in five window modes that are selected by corresponding commands on the
Analysis menu as listed in the table below. In addition, for wavelet ERP analysis there is a feature that
allows display of EEG oscillation dynamics for the given frequency band as graphs or as bitmaps (X
axis – time, Y axis – frequency)
83
Channels /
Groups
Groups/
Channels
Time / Groups
Mapping
Groups / Time
Mapping
Formatted Page
Average
bandpower
Rasters
Time/Frequency
ERPs are depicted as graphs arranged in columns by channels
and in rows by trial groups.
ERPs are depicted as graphs arranged in columns by trial
groups and in rows by channels
ERPs are depicted as maps arranged in columns by time
readouts and in rows by trial groups.
ERPs are depicted as maps arranged in columns by trial
groups and in rows by time readouts.
ERPs are depicted as graphs and maps. ERPs are depicted as
graphs and maps. Graphs are placed according to selected
format parameters (see “Setup->Graph Formats…”
command). Maps are placed below graphs.
Displays average band power graphs for wavelet ERP
analysis.
Displays time/ frequency rasters for wavelet ERP analysis.
Use the Scale list in the ERP bar or “+” and “-” keys of keyboard to change color scale sensitivity (or
Y axis scale for graphs).
84
Choose graph or map size from the Size list in the ERP bar.
Use Active group fields in the ERP bar to set start and end time of the interval to be depicted by ERP
graphs.
Use Maps group fields in the ERP bar to set start and end time of the interval to be mapped and also to
define degree of ERP compression. If the Step parameter value exceeds quantizing interval then timeaveraged ERPs will be mapped.
Use Baseline group fields in the ERP bar to modify interval for baseline calculation
Use Active Groups group fields in the Averaging group bar to choose groups to be displayed and to
select an “active” group.
Use Averaging bandrange group fields in the Averaging group bar to set frequency band for
displaying average band power graphs for wavelet ERP analysis.
Use Setup: Mapping Style command to change color scale palette and map appearance.
Use Edit: Copy command to copy graphs or maps visible in the window to the clipboard. They can then
be pasted into final report text or into any application (WinWord, Paint and etc.) window by means of
Edit: Paste command.
Use the File: Save command to save newly calculated ERPs in the database.
Click right mouse button to show the popup menu. If the cursor is placed on a graph then Add Map,
Add Label, Copy Parameter Distribution, Copy Channel and Copy Channel to Report commands
will be available in the popup menu.
Use the Add Map command to add a map in the Formatted Page window mode.
Use Add Label command to add peak labels on the “active” group ERP curve.
Use Copy Parameter Distribution to place a string of voltages into clipboard for selected “active”
group ERP curve and time sample:
Subject Name, [T4-Av],
148,
37.30,
39.38,
30.82,
34.50,
11.81,
2.91,
20.26, -36.97, -120.12,
-8.24, -74.47, -36.31,
-0.21, -15.95
34.88,
11.20,
Use Copy Channel and Copy Channel to Report commands to place selected channel and the “active”
group waveform into clipboard or final report.
85
The map and dipole localization picture will added for selected time sample if monopolar montage was
used.
86
7. ICA Window
The design of ICA window for spectra of EEG independent components is presented on following
figure.
ICA window for independent component spectra.
The topographies of components are placed on the left side of ICA window. The “power” (variance) of
components is placed below topographies. The bitmaps displaying individual (not averaged)
components spectra are place on the right from topographies. The average components spectra are
displayed by curves places below bitmaps.
Each row of bitmap corresponds to single epoch spectra or individual spectra. The first spectrum is
displayed on the bottom of bitmap. The x-axis corresponds to the frequency. The power of spectrum is
coded by color. The curve displays average power spectra of EEG component. The parameters of
equivalent dipole source for component topographies are displayed on right side of window. Here RRE
is “Residual Relative Energy” allowing estimate the accuracy of fitting of real data by dipole model and
ECC is eccentricity of dipole.
The frequency of selected by mouse spectrum harmonic is displayed on status bar.
The design of ICA window for independent components of ERPs is presented on following figure.
87
ICA window for independent component ERPs.
The topographies of components are placed on the left side of ICA window. The “power” (variance) of
components is placed below topographies. The bitmaps displaying individual (not averaged)
components are place on the right from topographies. The average components are displayed by curves
places below bitmaps.
Each row of bitmap corresponds to single trial or individual ERP. The first or individual ERP trial is
displayed on the bottom of bitmap. The x-axis corresponds to the time. The value of components is
coded by color. The curves display average ERPs for different conditions. The legend of curves (the
correspondence of colors to conditions) is displayed right.
The parameters of equivalent dipole source for component topographies are displayed on right side of
window. Here RRE is “Residual Relative Energy” allowing estimate the accuracy of fitting of real data
by dipole model and ECC is eccentricity of dipole.
The time offset of selected ERP samples is displayed on status bar.
The command “Copy component” from pop-up menu of window is used to place corresponding
bitmaps and graphs to clipboard.
The command “Component name” from pop-up menu of window is used to modify corresponding
name.
88
The command “LORETA for component” from pop-up menu of window is used to runs LORETA
application and automatically store to it the topographies of selected component.
The command “Select groups” from menu “Analysis” is used to select the list of conditions to which
corresponding average curves will be displayed.
The command “Select group pairs” from menu “Analysis” is used to select the list of condition pairs to
which corresponding difference waves will be displayed.
The command “Change graph scale” from menu “Analysis” is used to change vertical scale of the
graph.
The command “Correct baseline” from menu “Analysis” is used to define the length of baseline time
interval for baseline correction.
The command “Save components filter” from menu “Analysis” is used to save to ASCII file matrix
Ai , j using as a spatial filter for transformation raw EEG (ERP) to components.
The command “Save signals filter” from menu “Analysis” is used to save to ASCII file matrix using as
a spatial filter for reviling (or suppression) of signals from raw EEG (ERP) for selected list of
components.
The command “Export of component parameters” from pop-up menu of window is used to save to
ASCII file the parameters of selected component for the future statistical analysis.
The “Save” command from submenu “File” is used to save newly calculated independent components
ICA file.
The “Save As…” command from submenu “File” is used to save independent components in ICA file
with another name.
89
WinEEG Bars
1. Main Toolbar
The main toolbar is placed in the top of the WinEEG window under the menu bar. It enables quick
initiation of many WinEEG commands by simple mouse clicks.
To show or to hide the main toolbar, use View: Toolbar -> Main Toolbar command.
To change the arrangement of buttons in the main toolbar, use View: Toolbar – Customize Main
Toolbar command. You can also move or delete buttons by dragging them while holding the Shift key
down.
Click To
Create a new EEG file.
Open a data file (EEG, spectra file, etc.) Click the arrow to open database list
Save the active file to the database.
Close the active document.
Open the Export file format menu.
Print the active document.
Preview the active document before printing.
Exit WinEEG.
Undo last action (when editing final report text).
Mark selected time interval of EEG record as artifact. Cut selected block from final report
text to clipboard.
Copy active window contents or selected block of text from final report to clipboard.
Paste the clipboard content to final report text
Delete selected block from final report text or selected interval from data plot.
Find given text in the final report.
Find the beginning of selected plot interval.
Find the beginning of a plot fragment (trial).
Add a user label or turn Add Label mode off. Click the arrow to open label list.
Delete a user label or turn Delete Label mode off.
90
Find nearest user label beyond the left border of the plot window.
Find nearest user label beyond the right border of the plot window.
View or edit patient card.
Decrease sensitivity (vertical scale).
Increase sensitivity (vertical scale).
Decrease speed (horizontal scale).
Increase speed (horizontal scale).
Modify montage. Click arrow to open montage list.
Turn band pass filter on or off. Click arrow to open filter list.
Open or activate final report window for the active program file.
Open map window.
Calculate EEG indices.
Calculate EEG spectra.
Correct electro oculogram (EOG)
Correct EEG artifacts or restore last correction.
Mark EEG artifacts automatically.
Computes event-related potentials.
Computes event-related EEG desynchronization.
Computes event-related EEG coherence.
Computes event-related wavelet EEG bandpower.
Computes event-related wavelet EEG coherence.
Insert patient card into final report text.
Insert a final report template.
Cascade windows.
Tile windows horizontally.
Tile windows vertically.
Get context sensitive help on a WinEEG control.
91
2. Input Control Toolbar
This toolbar is usually placed in the top of the WinEEG window under the main toolbar (but can
positioned differently) and is used to control EEG acquisition and to scroll EEG window.
To show or to hide the Input Control toolbar, use View: Toolbar – Input Control Toolbar command.
To arrange buttons in the Input Control toolbar, use View: Toolbar – Customize Input Control
Toolbar command. You can also move or delete buttons by dragging them when holding the Shift key
pressed.
Click To
Start EEG acquisition and monitoring without recording to hard disk.
Start EEG fragment recording to hard disk. Click arrow to open list of fragment names.
Pause EEG acquisition, monitoring and recording.
Stop EEG acquisition, monitoring and recording and switch to EEG view mode.
Show (hide) Main Video Window.
Show (hide) Additional Video Window
Change the size of Video Window.
Start (stop) recording of Video signal synchronously with EEG recording.
Start calibration signal (0.5 Hz, 0.1 Ohm) acquisition and monitoring in a new EEG window
without recording to hard disk.
Reset DC component
View calibration efficiencies of the amplifiers.
Measure electrode impedance.
Turn rhythmic photo stimulation on or off. Click arrow to open menu of photo stimulator
colors (White, Red and Red-With).
Increase photo stimulation frequency.
Decrease photo stimulation frequency.
Turn on (off) a photo stimulation program. Click arrow to open photo stimulation program
list.
Start or stop a stimuli presentation program.
Rewind the EEG window left (with high speed).
Playback the EEG window left (with normal speed).
To playback the EEG window right (with normal speed).
To rewind the EEG window right (with high speed).
92
3. Analysis Toolbar
This toolbar is usually placed in the top of the WinEEG window under the main toolbar (but can be
moved) and is used to manage ERP, Spectra and Indices windows.
To show or to hide the toolbar, use View: Toolbar Analysis Toolbar command.
To modify button set or to change order of buttons in the Input Control toolbar, use View: Toolbar
Customize Analysis Toolbar command. You can also move or delete buttons by dragging them when
holding the Shift key pressed.
Click To
Display spectra or indices as graphs (Graphs mode).
Display spectra or indices as histograms (Histograms mode).
List spectra or indices parameters in a table (Table mode).
Display spectra or indices as maps (Maps mode).
Map asymmetry for spectra or indices (Asymmetry mode).
Map ratio for spectra or indices (Formula Mapping mode).
Display interaction diagrams (Interaction diagrams mode).
Display ratio dynamics for spectra as graphs (Formula Graphs mode).
Display power spectra or their parameters in spectra window.
Display EEG coherence or its parameters for each channel in spectra window.
Display average EEG coherence or its parameters in spectra window.
Display phase spectra or their parameters in spectra window.
Displays EEG bi-spectra frequency-frequency plots.
Displays EEG bi-coherence frequency-frequency plots
Display average spectra in spectra window.
Display spectra dynamics in spectra window.
Switch ERP window to Channels/Groups mode.
Switch ERP window to Groups/Channels mode.
Switch ERP window to Time/Groups Mapping mode.
Switch ERP window to Groups/Time Mapping mode.
Switch ERP window to Formatted Page mode.
Display average band power for wavelet ERP analysis.
93
Display time-frequency plots for wavelet ERP analysis.
Copy window contents and paste it into MS Word (to current cursor position on instead
selection).
Insert tables of EEG spectra parameters into MS Word.
4. Status Bar
The status bar is located at the bottom of the WinEEG window. To show or to hide it, run View: Status
Bar command.
The left part of the status bar displays a brief description of a menu command, a toolbar button, a Filters
bar control, an Input Control bar control or a Channel Names bar control pointed to by the mouse cursor
(used, e.g., to preview a software action by hesitating with the mouse cursor on a command item to
ensure the intended action will take place when the mouse button is clicked).
On the right side of the status bar there are fields displaying values for a selected EEG channel (or
spectrum or ERP parameters evaluated at the marker) and indicating states of the locking keys.
Field
L=
R=
T[R-L] =
R-L =
A=
F=
ФС =
Description
For EEG window:
Instantaneous EEG value at left marker
Instantaneous EEG value at right marker
time interval between markers
Difference between instantaneous values at the markers
Peak-to-peak EEG amplitude for selected interval (difference between maximal and
minimal values)
“Average” signal frequency
Photo stimulation frequency
For EEG spectra window:
6. Measured parameter value
2.
Frequency at the marker position
3.
For ERP window:
V
Measured potential value (uV)
T
Time from the last preceding stimulus (ms); stimulus number is indicated by number
before colon
F
Frequency (Hz) for time-frequency plots.
P<
Statistical significance.
Indicator
Description
CAP
NUM
SCRL
Caps Lock key locked
Num Lock key locked
Scroll Lock key locked
94
5. Print Preview Control Bar
Print – Call Print dialog to start printing the document.
Next – View next page.
Previous – View previous page.
Two Pages / One Page – View two pages or one page at a time.
Zoom in – Zoom page in.
Zoom out – Zoom page out.
Close – Close Print Preview.
6. Filters Bar
This bar is usually placed at the top of the WinEEG window (but can be moved) and is used to edit a
number of parameters for the active EEG window or active EEG file.
Use the Speed list to choose horizontal scale (simulating paper speed). You can also use “*” and “/”
keys. Press “/” key to half decrease speed or “*” key to increase the speed twice.
Use the Gain list to choose vertical scale (gain). You can also use “+” and “-” keys. Press “-” key to
half decrease gain or “+” key to increase gain twice.
To change gain only for a selected channel, hold Ctrl pressed (see Channel Names bar), otherwise
gain will be changed for all channels that are visible in the montage.
Use High Cut (Hz) list to choose EEG band pass high frequency cutoff.
To change high cutoff only for a selected channel, press and hold Ctrl to avoid changing cutoff
frequency for all channels that are visible in the montage.
Use Low Cut (Hz) list to choose EEG band pass low frequency cutoff.
To change low frequency cutoff only for a selected channel, press and hold Ctrl to avoid changing
cutoff frequency for all channels that are visible in the montage.
Use Notch (Hz) list to turn notch 50 or 60 Hz filter on or off.
To change notch only for a selected channel, hold Ctrl pressed, otherwise notch will be changed for all
channels that are visible in the montage.
Use Baseline field to change baseline.
To change baseline only for a selected channel, hold Ctrl pressed, otherwise baseline will be changed
for all channels that are visible in the montage.
95
7. Channel Names Bar
This bar is placed at the left side of the EEG
window and is used to select a channel for
processing. The channel also can be selected by
the Up and Down arrow keys.
Suggestion: to compare EEGs recorded from
different sites you can move a channel in the
vertical direction while viewing. Place cursor
on a button on the Channel Names bar and drag
vertically with left mouse button pressed. The
curve depicting the selected channel will also
move in the vertical direction. When the left
mouse button is released, the curve will
automatically return to its original position.
8. Maps Bar (Map Window)
Select an EEG interval and run View:
Toolbar Maps command to view two
potential or spectral power maps
corresponding to each of the vertical mouse
cursors (Left and Right).
96
9. Dipole Window
The dipole source localization and
dipole parameters id displayed in
this window. RRE is relative
residual energy and ECC is
eccentricity. Use buttons “Copy” or
“Copy parameters” to copy this
picture or table of dipole
parameters into clipboard
97
10. Maps, Spectra and Indices Bars
This bar is located at the right side of the EEG
mapping, spectra or indices windows. Its
controls depend on window type.
At the top of this bar is a color scale. Numbers
above and below the scale indicate parameter
values corresponding to highest and lowest
color degree.
Below the color scale are controls for setting
color scale sensitivity, size of maps or graphs,
etc. To learn for additional details about these
controls, see the sections describing particular
windows.
11. Calculator Bar
This bar is located at the bottom edge of the EEG Spectra window or EEG Indices window and is
used to define a formula for calculating a value to be mapped in the Formula mode.
The bar has two rows of buttons corresponding to standard EEG frequency bands. The top row defines
the sum for ratio numerator and the bottom one – for ratio denominator. The standard EEG frequency
band parameters (signal powers or EEG indices) marked by “checked” buttons will be summed when
calculating the ratio of numerator and denominator.
For example, if “Alpha” and “Beta” buttons are checked in the top row, and “Delta” and “Theta” – in
the bottom row, then the following power ratio would be calculated for each channel:
(P[alpha] + P[beta] ) / (P[delta] + P[theta]),
and displayed whenever Formula mapping were selected.
98
12. Averaging Groups Bar
This bar is located at the top of the ERP Window and is used to choose which groups may be
displayed, and to select an “active” group.
13. ERP Bar
This bar is placed on the right edge of the ERP
Window and is used to set graph or map size,
vertical and horizontal scaling (for graphs),
color scale sensitivity and time readouts for
ERP mapping.
99
14. Video Window.
The video data corresponding to position of
slider (see EEG window) is displayed in this
window. Use command View: Video Window
to show (hide) this window.
100
Menu Commands
File Menu Commands
The File menu offers the following commands:
New
Open EEG Database
Open Another Database
- EEG Spectra
- EEG Cross-correlations
- EEG Indices
- ERP (EP) File
- ERD File
- ERCoh File
Open File…
Import EDF+ Data
Import Data
Close
Save
Save As…
Compress video files…
Export Data…
Export EEG and Video EEG
Print…
Page Setup…
Print Preview…
Print Setup…
Exit
Creates a new EEG file.
Opens a source data record from the database
Opens a file from the database of processing results:
an EEG spectra file
…an EEG auto and cross-correlation file
an EEG indices file
an ERP file
an event-related EEG de-synchronization file
an event-related EEG coherence file
Opens a file from hard disk (containing source EEG or
processing results).
Import of EDF+ data file.
Converts data from another format to WinEEG format
Closes the active file.
Saves the active file under its current name.
Saves the active file under another name.
Compress or recompress video files by selected method
Writes the data file in ASCII, binary or another format.
Copy selected part of EEG record to another file.
Prints the active document.
Sets parameters for a page to be printed.
Displays the document, as it will be printed.
Chooses a printer and sets parameters for it.
Quits WinEEG.
Edit Menu Commands
The Edit menu offers the following commands:
Undo
Cut
Copy
Paste
Clear
Select All
Clear All
Clear All Video Data
Find…
Replace…
Find Selection
Find Fragment…
Add Label
Delete Label
Patient Card
Undoes the previous edit action.
Mark selected time interval of EEG record as artifact. Removes the
selection and places it on the clipboard.
Copies the selection (or the window content) to clipboard.
Inserts the clipboard content at the current cursor position in the active
document.
Deletes the selected block.
Selects the whole document.
Clears the whole document.
Clears all video data for active document.
Finds events in EEG record. Finds a string in the text.
Finds one string in the text and replaces it with a different string.
Finds the EEG interval selected by left and right vertical markers.
Finds the beginning of an EEG fragment.
Adds a user label.
Deletes an existing user label.
Edits a patient card.
101
Trial Labels
Adjust trial synchronization
Change polarity
Load Trial List
Edits trial labels used for ERP calculation.
Adjust trial synchronization using synchronization signal recorded from
special detector (for example photodiode)
Change polarity of signals for selected list of channels.
Load trial list from ASCII file.
View Menu Commands
The View menu offers the following commands:
Toolbar
- Main Toolbar
- Input Control Toolbar
- Analysis Toolbar
- Maps
- Dipole Window
- Filters Bar
- Maps Bar
- Spectra Bar
- Indices Bar
- ERP Bar
- Biofeedback Bar
- Calculator Bar
- Averaging Group Bar
- Customize MainToolbar
- Customize Input Control Toolbar.
- Customize Analysis Toolbar…
Status Bar
Channel Names Bar
Main Video Window
Additional Video Window
Video Window size
Decrease Gain
Increase Gain
Decrease Speed
Increase Speed
Select Montage…
Toggles display of:
- Main toolbar
- Input Control toolbar
- Analysis toolbar
- maps of two EEG instants selected by Left and Right cursors
- dipole source localization of two EEG instants selected by
Left and Right cursors
- Filters bar.
- Maps bar in an EEG mapping window.
- Spectra bar in a spectra window.
- Indices bar in an indices window.
- ERP bar in an ERP window.
- Biofeedback bar in a biofeedback window.
- Calculator (ratio formula) bar in a spectra window, an indices
window or a biofeedback window.
- Averaging Group Bar in an ERP window.
Modifies Customize MainToolbar button set.
Modifies Input Control toolbar button set.
Modifies Analysis toolbar button set.
Shows or hides the status bar.
Shows or hides the Channel Names bar.
Show (hide) Video Window for main video camera
Show (hide) Video Window for additional video camera
Change a size of Video window
Decrease vertical scale in an EEG window.
Increase vertical scale in an EEG window.
Decrease horizontal scale in an EEG window.
Increase horizontal scale in an EEG window.
Chooses or modifies a montage: channel list, filters, gain, color,
electrodes, etc.
Format Menu Commands
The Format menu offers the following commands:
Font
Paragraph
Chooses a font.
Formats a paragraph.
Recording Menu Commands
The Recording menu offers the following commands:
EEG Monitoring
Starts (resumes) EEG monitoring without recording data to the hard
102
Turn On(Off) Calibration
EEG Recording(on/off)
Pause
Stop
Video Recording
Reset DC Filter
Photostimulation (on/off)
Photostimulation Program
Stimuli Presentation Program
Turn on (off) Music
Calibration
Impedance
Rewind Back
Play Back
Play Forward
Rewind Forward
disk.
Turns on (off) calibrating signal.
Starts recording a new EEG fragment to the hard disk.
Pauses EEG acquisition.
Stops EEG acquisition and switches to signal view mode.
Start (stop) recording of video data.
Use this command to reset constant component of the signal.
Turns photo stimulator on (off).
Starts a photo stimulation program.
Starts presenting stimuli for ERP acquisition.
Turns on (off) music (for auditory biofeedback).
Checks calibration of the amplifiers.
Enables automatic measurement of electrode impedance.
Rewinds the EEG window left.
Plays back the EEG window left.
Plays back the EEG window right.
Rewinds the EEG window right.
Analysis Menu Commands
The Analysis menu offers the following commands:
For EEG Window
Opens a final report.
Inserts patient card into final report text.
Inserts a final report template into final report text.
Display signal parameters table
Opens an EEG Mapping window.
Calculates EEG indices for a selected interval.
Calculates EEG power spectra and the coherence function for a
selected interval.
EEG Cross-correlations…
Calculates EEG power auto and cross correlation for a selected
interval.
Spectra Density Array
Calculate and display (hide) spectra density arrays in EEG window
Source distribution (LORETA) Runs LORETA application and store to it the voltage data
corresponding to position of vertical markers.
Spectra power distribution
Runs LORETA application and store to it the EEG power (covariance
(LORETA)
matrix) computing for selected time interval.
Dipole Source (BrainLock)
Run BrainLock program (optional)
Nonlinear Analysis
Run utilities for nonlinear analysis of EEG (optional)
Spike Detection…
Start automated spike detection procedure
Spike Averaging
Calculate averaged spike waveforms and open ERP window
Remove EOG
Correct electro oculogram artifacts (caused by eye movements) from
the record.
Mark artifacts
Mark EEG artifacts.
Artifacts correction
Correct EEG artifacts by spatial filtering of raw EEG or recover
previous correction. The artifact components are selected manually.
Artifacts correction using Correct EEG artifacts by spatial filtering of raw EEG. The artifact
templates
components are selected automatically by similarity component
topographies to predefined templates.
Bandrange filter
Turn on (off) band pass filter defined by Setup: EEG bandranges…
command.
Final Report
Insert Patient Card
Insert Final Report Template
Signal Parameters
EEG Mapping
EEG Indices…
EEG Spectra…
103
Compute ERP
Compute ERD
Compute ERCoh
Compute Wavelet
Compute Wavelet coherence
Independent component
spectra
Independent component ERP
Comparison of results
Computes event-related potentials.
Computes event-related EEG de-synchronization.
Computes event-related EEG coherence.
Performs wavelet ERP analysis.
Compute Wavelet coherence
Compute spectra for independent component of EEG and open ICA
window
Compute ERP for independent component of EEG and open ICA
window
Compare spectra, ERP or ERD.
Add Spike
Delete Spike
Change Channel
Copy EEG
Copy Spike
Copy EEG to Report
Copy Spike to Report
For pop-up menu of EEG window
Add spike label for selected channel and time sample
Delete selected spike label
Change “main” channel for selected spike label
Copy EEG time interval into clipboard for selected spike
Copy spike waveform into clipboard for selected spike
Copy EEG time interval into clipboard for selected spike
Copy spike waveform into text of final report for selected spike
Average Spectra
Spectra Dynamics
Graphs
Histograms
Table
Maps
Asymmetry
Formula (Mapping)
Formula (Graphs)
Interaction diagram
Power Spectra
(Autocorrelations)
Coherence (Cross-correlations)
for Channels
Average Coherence
Phase Spectra
Parameters of interaction
diagrams
Insert tables into Report
Bispectra
Bicoherence
Add map
For EEG Spectra and EEG Indices Window
Displays average EEG spectra.
Displays EEG spectra dynamics.
Shows processing results as graphs.
Shows processing results as histograms (by EEG frequency bands).
Shows processing results as a table of parameters for EEG frequency
bands.
Shows processing results as distribution maps by EEG frequency
bands.
Shows processing results as asymmetry distribution maps by EEG
frequency bands.
Maps spectra (indices) ratio.
Displays spectral ratio dynamics in a Spectra window as graphs.
Displays interaction diagram in a Spectra window.
For EEG Spectra
Displays EEG power spectra or EEG autocorrelations.
Displays EEG coherence for one of selected channels or EEG crosscorrelations.
Displays EEG coherence averaged over all channels.
Displays phase spectra for one of selected channels.
Modify parameters of interaction diagrams: channel pairs and
thresholds.
Insert tables of EEG spectra parameters into MS Word
Display bispectra frequency-frequency plot
Display bicoherence frequency-frequency plot
For pop-up menu of EEG Spectra window
Add map for selected frequency
104
Channels/Groups
Groups/ Channels
Time/Groups Mapping
Groups/Time Mapping
Formatted Page
Average Bandpower
Rasters Time/Frequency
Channel List
Group Info
Export trial parameters
Add Map
Add Label
Copy Parameter Distribution
Copy Channel
Copy Channel to Report
Sources distribution LORETA
Dipole source (BrainLock)
Delete All Labels
Delete Labels and Maps
Generate Final Report
Insert Patient Card
Insert Final Report Template
Select groups
Select group pairs
Change graph scale
Correct baseline
Save components filter
Save signal filter
For ERP Window
Displays ERP graphs arranging channels in columns and averaging
groups in rows.
Displays ERP graphs arranging channels in rows and averaging
groups in columns.
Displays ERP maps arranging time intervals in columns and
averaging groups in rows.
Displays ERP maps arranging time intervals in rows and averaging
groups in columns.
Displays ERP graphs according to ERP Display Format you have
chosen.
Displays average EEG bandpower graphs for wavelet ERP analysis.
Displays Time/Frequency rasters for wavelet ERP analysis.
Selects channels to be displayed on graphs or maps.
Views the statistics for averaging of ERP and response reaction
processing results.
Export parameters of task performance for single trials
For pop-up menu of ERP Window
Adds an ERP map for selected (active) trial group.
Adds a peak label on the graph for selected (active) trial group.
Copy string of voltages of “active” ERP group for selected
sample into clipboard
Copy channel waveform, map and dipole picture for “active”
group into clipboard
Copy channel waveform, map and dipole picture for “active”
group into final report
Runs LORETA application and store to it the voltage
corresponding to selected time point.
Runs BrainLock application and store to it the voltage
corresponding to selected time point.
Clear all pick labels
Clear all pick labels and maps
time
ERP
ERP
data
data
For Final Report window
Activates final report generation procedure. (Only Russian version
available).
Inserts patient card into final report text.
Inserts a final report template into final report text.
For ICA window
Select averaging groups from list of groups for displaying of the
graphs.
Select averaging group pairs from list of groups for displaying of the
difference curve graphs.
Change vertical scale for ICA average curves.
Define time interval for baseline correction
Save to the ASCII file a matrix transforming raw EEG (ERP) to the
components of EEG (ERP).
Save to the ASCII file a matrix – spatial filter, revealing or
suppressing signals from raw EEG (ERP) for selected list of
105
components.
Export activation curves or spectra into ASCII text file.
Export activation curves
(spectra)
For pop-up menu of ICA Window
Place bitmaps and graphs to clipboard corresponding to selected
component by mouse.
Modify component name
Runs LORETA application and store to it the topography of selected
component.
Save to the ASCII file the parameters of selected component for the
future statistical analysis
Copy component
Component name
LORETA for component
Export of component
parameters
Setup Menu Commands
The Setup menu offers the following commands:
Database Pathnames...
Preferences...
Mapping Style...
Montage List...
Fragment Names...
Label List...
Photo stimulation Programs...
EEG Bandranges...
Stimuli Presentation Programs...
Graph Formats...
Title...
Final Report...
Final Report Templates...
Video recording
Equipment Parameters...
Sets (modifies) Database pathnames.
Sets EEG display parameters.
Sets map display parameters.
Edits list of montages.
Edits list of fragment names.
Edits list of user labels.
Edits list of photo stimulation programs.
Modifies standard EEG frequency bands.
Views and modifies the list of stimuli presentation programs for
ERP acquisition.
Modifies formats for displaying ERP graphs.
Edits organization title.
Customizes final report generator.
Edits list of final report templates.
Select video capturing device. Set and modifies parameters of
capturing: resolution, frame rate, signal format and on-line
compression.
Customizes hardware configuration.
Window menu commands
The Window menu offers the following commands:
Cascade
Tile Horizontally
Tile Vertically
Arrange Icons
Split
1, 2...
Arranges windows in cascade.
Tiles windows horizontally.
Tiles windows vertically.
Arranges icons of minimized windows.
Splits active window in two panes.
Activates window you choose.
Help menu commands
The Help menu offers the following commands:
About WinEEG...
Displays program information and copyright.
106
Description of Menu Commands
1. File: New command
Run this command to create a new EEG file. It should be created before starting EEG monitoring.
Before creating a new EEG file a number of EEG parameters should be defined in the Montage
Parameters dialog box consisting of 7 tabs. Switch from tab to tab to define parameters for a new EEG
file:
1. Fill in the patient card (see Montage parameters: Patient card dialog).
2. Choose a montage from the existing list and/or enter its parameters.
A montage includes a number of options such as list of monitored channels, list of displayed channels
and their parameters (gains, bandwidths, baseline, colors, etc.)
Don't forget that signals are acquired and recorded always monopolarly (in relation to the electrodes
connected with «А1», «А2» inputs). The bandwidth for acquisition and recording is maximally wide:
0.15 - 70 Hz or 0.5 -30 Hz. Remember that 0.15 Hz frequency corresponds to 1.0 sec time constant and
0.5 Hz - to 0.3 sec time constant. This acquisition method allows convert raw data to any mono- or
bipolar montage with any bandwidth during subsequent viewing and processing.
Attention!!! Montage parameters set by New command are active only for the currently
created file and are not saved in the montage list. If a parameter set is expected to be used
many times, it would be better to define it in the montage list (see Setup: Montage List...
command). Next time you would simply select it from the list instead of repeatedly entering
parameters (which may take a considerable time).
When customizing a montage you must define a number of its parameters:
a. Define a list of channels for EEG acquisition corresponding to electrodes really placed and
connected (see Montage parameters: Electrodes dialog). Define also coordinates of the
electrodes.
b. Define a list of channels in the montage and their parameters such as gain, bandwidth and
baseline (see Montage parameters: Channels dialog).
c. Define colors for signal displaying (see Montage parameters: Colors dialog).
d. Define referents to be calculated if there are any (Av, AvL and AvR) (see Montage
parameters: Referents dialog).
e. Test whether channels are correctly defined or view another montage in the list (see Montage
parameters: View dialog).
When the parameters are set, press OK button to create a new EEG file. A new (blank) EEG window
appears on the screen. Use Recording menu commands to start monitoring EEG and to manage photo
stimulators.
Don't forget to save the new file in the database (see File: Save command) when EEG monitoring is
finished.
107
Shortcuts:
Main Toolbar:
Keys:
CTRL+N
2. File: Open EEG Database command
This command opens an EEG file from the database in a new window. You can open several EEG files
simultaneously. Use the Window menu commands to switch between opened files. (See Window: 1,
2...command).
As you run this command a Record List dialog is displayed for searching EEG files in the database or
in the archive.
Shortcuts:
Main Toolbar:
Keys:
CTRL+O
3. File: Open Another Database->EEG Spectra command
This command opens an EEG spectra file from the database in a new window. You can open several
EEG spectra files simultaneously. Use the Window menu commands to switch between opened files.
(See Window: 1, 2...command).
As you run this command a Record List dialog is displayed for searching EEG spectra files in the
database or in the archive.
4. File: Open Another Database->EEG Cross-correlations command
This command opens an EEG auto and cross correlation file from the database in a new window. You
can open several EEG auto and cross correlation files simultaneously. Use the Window menu
commands to switch between opened files. (See Window: 1, 2...command).
As you run this command a Record List Dialog is displayed for searching EEG auto and cross
correlation files in the database or in the archive.
5. File: Open Another Database->EEG Indices command
This command opens an EEG indices file from the database in a new window. You can open several
EEG indices files simultaneously. Use the Window menu commands to switch between opened files.
(See Window: 1, 2...command).
As you run this command a Record List Dialog is displayed for searching EEG indices files in the
database or in the archive.
6. File: Open Another Database ->ERP (EP) File command
This command opens an event-related potential (evoked potential) file from the database in a new
window. You can open several ERP files simultaneously. Use the Window menu commands to switch
between opened files. (See Window: 1, 2...command).
As you run this command a Record List dialog is displayed for searching ERP files in the database or
in the archive.
108
7. File: Open Another Database ->ERD File command
This command opens an event-related EEG de-synchronization (ERD) file from the database in a new
window. You can open several ERD files simultaneously. Use the Window menu commands to switch
between opened files. (See Window: 1, 2...command).
As you run this command a Record List Dialog is displayed for searching ERD files in the database
or in the archive.
8. File: Open Another Database ->ERCoh File command
This command opens an event-related EEG coherence (ERCoh) file from the database in a new
window. You can open several ERCoh files simultaneously. Use the Window menu commands to
switch between opened files. (See Window: 1, 2...command).
As you run this command a Record List Dialog is displayed for searching ERCoh files in the database
or in the archive.
9. File: Open Another Database -> Biofeedback File command
This command opens a biofeedback file from the database in a new window. You can open several
biofeedback files simultaneously. Use the Window menu commands to switch between opened files.
(See Window: 1, 2...command).
As you run this command a Record List dialog is displayed for searching biofeedback files in the
database or in the archive.
10. File: Open File… command
This command uses the Windows standard file open interface to open a previously recorded data file
(EEG, EEG spectra, etc.) in a new window. You can open more than one file. Use the Window menu
commands to switch between opened files. (See Windows: 1, 2...command).
When you run this command a File Open dialog appears
11. File: Import EDF+ Data command
This command opens EDF+ files and converts them to EEG format. When you run this command a
File Open dialog appears. After selection of appropriate EDF+ file a Import of EDF+ data dialog
will appear on the screen.
12. File: Import Data command
This command opens files of other formats and converts them to EEG format.
When you run this command a File Open dialog appears.
13. File: Close command
Close all windows for the active data file (EEG or others). WinEEG will ask about saving changes
before closing the file.
109
Shortcuts:
Main Toolbar:
Mouse:
Click
icon in the right top corner of the file (document) window.
Or double-click the window (document) icon in the left top corner of the window. For
different file types different icons are used as follows:
- for EEG files,
- for final reports,
- for potential maps,
- for EEG power spectra (auto and cross-correlations),
- for EEG indices,
- for biofeedback files,
- for ERP, ERD and ERCoh.
14. File: Save command
This command saves the active file.
If the file was opened from the database the corresponding record is modified when saving the file.
If the file is new a name is assigned to it automatically and a record is added to the database.
To save the latest changes in another file, use the File: Save As… command.
Shortcuts:
Main Toolbar:
Keys:
CTRL+S
15. File: Save As… command
Save the active document in a new data file. A Save As dialog appears to define the new file name.
16. File: Compress video files… command
Compress or recompress video files by selected method. When you run this command a Video files
compression dialog appears.
17. File: Export Data… command
Save the data in a format compatible with other applications.
If an EEG file is active an Export EEG Data dialog appears. An EEG file can be converted into text
(ASCII) format, binary format, European Data Format (EDF) or Universal Data Format (UDF) –
Russian extension of EDF format.
If an EEG spectra file is active an Export EEG Spectra dialog appears on the screen. An EEG spectra
file can be converted into text (ASCII) format.
110
If an EEG indices file is active an Export EEG Indices dialog appears. An EEG indices file can be
converted into text (ASCII) format.
If an ERP (ERD) file is active an Export ERP (ERD) dialog appears. An ERP (ERD) file can be
converted into text (ASCII) format.
Shortcut:
Main Toolbar:
18. File: Export EEG and Video EEG… command
Copy selected part of EEG record to another file. When you run this command Export video EEG
dialog appears.
This function is useful if it is necessary to prepare a number of video EEG examples to write them to
CD. The WinEEG program will copy automatically video EEG data, video EEG viewer (ViewEEG
program) and some additional service data in selected folder. It is possible to run this function many
times. As the results a number of subfolders will be created and the data will be copied in these
subfolders.
START.EXE utility helps to open all copied data automatically by ViewEEG program.
ViewEEG program is the restricted version of WinEEG program providing reviewing of video EEG
data.
Attention!!! ViewEEG program requires DirectX 9.0 installation.
19. File: Print... command
Print the active window content (active file).
By default, the full contents (graphs, maps or text) will be printed unless specific pages have been
specified in the Print dialog that is displayed on calling this command. The exception is the EEG
window where you position the two vertical cursors to select the EEG interval you wish to print.
111
Use File: Print Preview command to preview the document you are going to print.
Shortcuts:
Main Toolbar:
Keys:
CTRL+P
20. File: Page Setup... command
Set the print page parameters.
The Page Setup dialog is displayed on calling this command.
21. File: Print Preview command
Use this command to display the active document, as it would appear when printed. When you choose
this command, the main window will be replaced with a print preview window in which one or two
pages will be displayed in their printed format.
Use print preview control bar for detailed preview.
Shortcut:
Main Toolbar:
22. File: Print Setup... command
Use this command to select a printer and to set printer options. The Print Setup dialog box is
displayed on calling this command.
23. File: 1, 2, 3, 4 commands
Use the numbers and filenames listed at the bottom of the File menu to open any of the last four
documents you have been working with.
24. File: Exit command
Use this command to end your WinEEG session.
Shortcuts:
Main Toolbar:
Mouse:
Click
icon in the right upper corner of the WinEEG window.
Double click application icon:
Keys:
ALT+F4
, in the left upper corner of the WinEEG window.
112
25. Edit: Undo command
Undo last change in the final report.
Shortcuts:
Main Toolbar:
Keys:
CTRL+Z
ALT+BACKSPACE
26. Edit: Cut command
Mark selected time interval of EEG record as artifact ff EEG window is active.
Cut selected text to the clipboard if Final report window is active, . The command is not available
unless text is selected.
Shortcuts:
Main Toolbar:
Keys:
CTRL+X
27. Edit: Copy command
Copy selected text (in the final report) or the active window (EEG waveforms, spectra graphs, ERP
maps, etc.) to the clipboard.
Previous clipboard content is replaced.
Shortcuts:
Main Toolbar:
Keys:
CTRL+C
28. Edit: Paste command
Paste the clipboard content to the final report. The clipboard may contain text or graphic objects - EEG
waveforms, spectra graphs, ERP maps etc.
Shortcuts:
Main Toolbar:
Keys:
CTRL+V
29. Edit: Clear command
Deletes selected text from the final report or a selected fragment from the EEG record.
Shortcut:
Main Toolbar:
30. Edit: Select All command
Select the whole final report text.
113
31. Edit: Clear All command
Clear the whole final report text.
32. Edit: Clear All Video Data command
Clear the whole video data. Video Data Deleting dialog is displayed after calling this command.
33. Edit: Find… command
Finds evens in EEG record based on threshold criteria. Find events dialog is displayed after calling
this command.
Find a text string in the final report. The Find dialog is displayed after calling this command.
Shortcut:
Main Toolbar:
34.Edit: Replace… command
Finds a text string in the final report and replaces that string with another one.
The Replace dialog is displayed after calling this command.
35.Edit: Find Selection command
Use this command to find the beginning of the selected EEG time interval.
Shortcut:
Main Toolbar:
36.Edit: Find Fragment... command
Find the beginning of an EEG fragment (a trial).
Shortcut:
Main Toolbar:
37.Edit: Add Label command
Add a user label (run the command once more to turn Add Label mode off). After calling this
command, choose label type from the popup menu. The cursor will change its shape to:
Place cursor at the desired position in the EEG window and click. If you are adding a Channel or a
Contour label, also set its length by dragging to the desired length before releasing the left mouse
button.
Shortcut:
Main Toolbar:
114
38.Edit: Delete Label command
Delete a user label (run the command once more to turn Delete Label mode off). The cursor will
change its shape to:
Position it over the label to be deleted and left-click.
Shortcut:
Main Toolbar:
39.Edit: Patient Card... command
Edit patient card for the active file (document).
The Patient Card dialog is displayed after calling this command.
Shortcut:
Main Toolbar:
40. Edit: Trial Labels… command
Edit trial labels used for grouping trials in ERP calculations for the active EEG file.
The Modify Trial Labels dialog is displayed after calling this command.
41. Edit: Adjust trial synchronization … command
Adjust trial synchronization using synchronization signal recorded from special detector (for example
photodiode) for the active EEG file.
The Adjust trial synchronization using synchro-impulse dialog is displayed after calling this
command.
42. Edit: Change polarity… command
Change polarity of signals for selected list of channels for the active EEG file.
The Change signal polarity dialog is displayed after calling this command.
43. Edit: Load Trial List… command
Load trial list from ASCII file. This feature is implemented for compatibility with Neurobotics EEG
system. The format of trial list file is follow:
EventTable V2.0
00024118,1, 11
00024518,1, 11
00024924,1, 11
00025331,1, 11
115
00025737,1, 13
00026144,1, 4
00026551,1, 11
Where fist column – is the sample of trial beginning, second column – type of event (1 – trial), third
column – trial label used for trials sorting during ERP computation.
44. View: Toolbar -> Main Toolbar command
Run this command to show or to hide the main toolbar containing shortcut buttons for most frequently
used WinEEG menu commands such as "Print".
See Main Toolbar to learn how to use it.
45. View: Toolbar -> Input Control Toolbar command
Run this command to show or to hide the Input Control toolbar containing buttons used to manage
EEG acquisition and scrolling.
See Input Control Toolbar to learn how to use it.
46. View: Toolbar -> Analysis Toolbar command
Run this command to show or to hide the Analysis toolbar containing buttons used to manage spectra,
indices and ERP windows.
See Analysis Toolbar to learn how to use it.
47. View: Toolbar -> Maps Window command
Run this command to show or to hide the side window that presents mapping potentials and other
processing parameters depending on the positions of two vertical cursors.
48. View: Toolbar -> Dipole Window command
Run this command to show or to hide the side window that presents dipole sources.
49. View: Toolbar -> Filters Bar command
Run this command to show or to hide Filters bar which presents a number of processing options or
window parameters for the active EEG window.
To learn more see Filters Bar.
50. View: Toolbar -> Maps Bar command
Run this command to show or to hide Maps bar which presents data display options for the active EEG
mapping window.
See Maps/Spectra/Indices Bar to learn how to use it.
51. View: Toolbar -> Spectra Bar command
116
Run this command to show or to hide Spectra bar which presents data display options for the active
EEG spectra window.
See Maps/Spectra/Indices Bar to learn how to use it.
52. View: Toolbar -> Indices Bar command
Run this command to show or to hide Indices bar which presents data display options for the active
EEG indices window.
See Maps/Spectra/Indices Bar to learn how to use it.
53. View: Toolbar -> ERP Bar command
Run this command to show or to hide ERP bar which presents data display options for the active ERP
window.
To learn more see ERP Bar.
54. View: Toolbar -> Biofeedback Bar command
Run this command to show or to hide Biofeedback bar containing controls for a number of additional
parameters affecting EEG acquisition and processing during biofeedback sessions.
To learn more see Biofeedback Bar.
55. View: Toolbar -> Calculator Bar command
Run this command to show or to hide Calculator bar in a spectra window or an indices window used to
define processing for the Formula mode.
To learn more see Calculator Bar.
56. View: Toolbar -> Averaging Groups Bar command
Run this command to show or to hide Averaging Groups bar in an ERP window offering a choice of
four trial groups to be depicted on ERP graphs.
To learn more see Averaging Groups Bar.
57. View: Toolbar -> Customize Main Toolbar... command
Run this command to customize main toolbar by adding, deleting or moving buttons.
Customize Toolbar dialog appears on calling this command.
58. View: Toolbar -> Customize Input Control Toolbar... command
Run this command to customize Input Control toolbar by adding, deleting or moving buttons.
Customize Toolbar dialog appears on calling this command.
59. View: Toolbar -> Customize Analysis Toolbar... command
117
Run this command to customize Analysis toolbar by adding, deleting or moving buttons.
Customize Toolbar dialog appears on calling this command.
60. View: Status Bar command
Show or hide status bar that displays hints for menu items or bar buttons along with indicators for Caps
Lock, Num Lock and Scroll Lock keys.
To learn more see Status Bar.
61. View: Channel Names Bar command
Run this command to show or hide Channel Names bar where a channel in the active EEG window
may be selected for additional actions.
To learn more see Channel Names Bar.
62. View: Main Video Window command
Run this command to show or hide Main Video window which presents main video camera data for
active EEG file.
Shortcuts:
Main Toolbar:
63. View: Additional Video Window command
Run this command to show or hide Additional Video window which presents additional video camera
data for active EEG file.
Shortcuts:
Main Toolbar:
64. View: Video Window size command
Run this command to change a size of Video window which presents video data for active EEG file.
Shortcuts:
Main Toolbar:
65. View: Decrease Gain command
Run this command to decrease gain (vertical EEG scale).
Shortcuts:
Main Toolbar:
Keys:
- (Numpad Minus)
118
66. View: Increase Gain command
Run this command to increase gain (vertical EEG scale).
Shortcuts:
Main Toolbar:
Keys:
+ (Numpad Plus)
67. View: Decrease Speed command
Run this command to decrease speed (horizontal EEG scale).
Shortcuts:
Main Toolbar:
Keys:
/ (Numpad Divide)
68. View: Increase Speed command
Run this command to increase speed (horizontal EEG scale).
Shortcuts:
Main Toolbar:
Keys:
* (Numpad Multiply)
69. View: Select Montage... command
Use this command to choose or to modify montage for an EEG file.
Signals are always acquired and recorded in monopolar form (relative to the electrodes connected to
A1 and А2 connectors). The bandwidth for acquisition and recording is maximally wide: 0.15 - 70 Hz
for «Mitsar-EEG-3». Remember that 0.15 Hz frequency corresponds to 1.0 sec time constant. This
recording method allows conversion of raw data to any mono- or bipolar montage with any bandwidth
during subsequent viewing and processing.
The Montage parameters dialog consisting of five tabs is displayed after calling this command. Go
from tab to tab to define the following montage parameters:
a. Define a list of channels and their parameters such as gain, bandwidth and baseline (see
Montage parameters: Channels dialog).
b. Define colors for displaying signals (see Montage parameters: Colors dialog).
c. Define the referents calculated, if any (Av, AvL and AvR; see Montage parameters:
Referents dialog).
d. Test whether channels are correctly defined or view another montage in the list (see Montage
parameters: View dialog).
You can also select a montage from the list.
Attention Montage parameters set by this command are applied only to the active file and not
saved in the montage list. If a parameter set is expected to be used many times, it would be
better to define it in the montage list (see Setup: Montage List... command). Next time you
119
need only select it from the list instead of entering parameters all over again.
Shortcut:
Main toolbar:
70. Format: Font... command
Modify font for selected text in final report. Font dialog is displayed after calling this command.
71. Format: Paragraph command
Formats selected paragraph(s) in the final report. . The Paragraph dialog is displayed after calling this
command.
72. Recording: EEG Monitoring command
Use this command to start EEG monitoring - that means acquiring EEG to the computer memory and
monitoring it in the new EEG window without recording EEG to hard disk. The command is available
only if a new EEG window is opened (see File: New command).
To start recording EEG to hard disk use the Recording: EEG Recording command.
Use Filters bar to modify "paper" speed, montage, sensitivity and bandwidth.
To stop EEG acquisition, run Recording: Stop command.
Shortcut:
Input Control toolbar: 73. Recording: EEG Recording (on/off) command
Use this command to start recording EEG fragment to hard disk. The command is available only if a
new EEG window is opened (see File: New command).
To stop recording the fragment and to resume EEG monitoring mode, run this command once more.
Use Filters bar to modify "paper" speed, montage, gain and bandwidth.
To stop EEG recording, run Recording: Stop command.
Shortcuts:
Input Control toolbar: Keys: - Enter, F2, F3, F4, F5, F6, F7, F8 or F9.
74. Recording: Pause command
Pause EEG acquisition, monitoring and recording. The ensuing EEG fragment will be absent in the
record. The command is available only if a new EEG window is opened (see File: New command).
To resume EEG acquisition and monitoring or recording, use the Recording: EEG Monitoring
command.
120
Shortcut:
Input Control toolbar: 75. Recording: Stop command
Stops EEG acquisition, monitoring and recording or EEG window scrolling and switches to EEG view
mode (see EEG Window). The command is available only if a new EEG window is opened (see File:
New command).
Before new file is saved in the database, EEG monitoring and recording can be resumed by running
Recording: EEG Monitoring and Recording: EEG Recording commands.
Shortcut:
Input Control toolbar: 76. Recording: Turn On (Off) Calibration command
Use this command to start acquiring calibration signal (0.5 Hz, 0.1 Ohm) to the computer memory and
monitoring it in the new EEG window without recording the signal to hard disk. The command is
available only if a new EEG window is opened (see File: New command).
To stop calibration signal acquisition and to start EEG monitoring, run this command once more.
Shortcut:
Input Control toolbar:
77. Video recording command
Use this command to start recording the video data to hard disk. The command is available only if a
new EEG window is opened (see File: New command).
To stop recording the video data and to resume video monitoring mode, run this command once more.
Shortcut:
Input Control toolbar:
78. Reset DC Filter command (not in a menu)
Use this command to reset constant component of the signal. It can be necessary if extended-band
amplifiers are used. Output potential of these amplifiers can contain a significant DC component (as a
result of motor artifacts or after electrodes are changed) slowly returning to initial state. The command
is used to speed up the process of resetting amplifiers to initial state.
How to Run:
Input Control toolbar: 79. Recording: Photostimulation On/Off command
Use this command to turn rhythmic photo stimulation mode on or off. The command is available only
if a new EEG window is opened (see File: New command).
Use Input Control toolbar to change photo stimulation frequency.
121
Photo stimulation frequency can also be modified by means of keys:
Ctrl+Arrow Up
Ctrl+Arrow Down
Increases frequency by 1 Hz
Decreases frequency by 1 Hz
Shortcuts:
Input Control toolbar: Keys: - Blank.
80. Recording: Photostimulation Program command
Use this command to turn a photo stimulation program on or off. The command is available only if a
new EEG window is opened (see File: New command).
Use Setup: Photostimulation Programs command to set photostimulation program parameters.
Shortcut:
Input Control toolbar: 81. Recording: Stimuli Presentation Program command
Use this command to start/stop visual or auditory stimuli presentation. The command is available only
if a new EEG window is opened (see File: New command).
The Stimuli Presentation Program List dialog is displayed after calling this command.
Shortcut:
Input Control toolbar: 82. Recording: Turn On (Off) Music command
Run this command to turn on (off) music for auditory biofeedback.
Shortcut:
Input Control toolbar: 83. Recording: Calibration command
Run this command to review calibration of the amplifiers The Calibration of Amplifiers dialog will
be displayed on calling this command.
Attention!!! Amplifiers are calibrated by the manufacturer before metrological certification.
WinEEG users are able only to view calibration results, not to modify them.
Shortcut:
Input Control toolbar:
84. Recording: Impedance command
Call the function of electrode impedance control. Electrode Impedance dialog is displayed after
calling this command.
122
Shortcut:
Input Control toolbar: 85. Recording: Rewind Back command
Run this command to rewind EEG window.
Shortcut:
Input Control toolbar:
86. Recording: Playback command
Run this command to play EEG window backwards.
Shortcuts:
Input Control toolbar:
Keys:
ALT + Left Arrow
87. Recording: Play Forward command
Run this command to play EEG window forward.
Shortcuts:
Input Control toolbar:
Keys:
ALT + Right Arrow
88. Recording: Fast Forward command
Run this command to Fast Forward the EEG window.
Shortcut:
Input Control toolbar:
89. Analysis: Final Report command
Open a Final Report window for the active EEG file. When opening the Final Report window,
WinEEG is looking for a corresponding file in the EEG database working directory (.RTF file with the
same name as the active EEG file). If the final report file is found, it is opened in the Final Report
window and can be read and edited. If not found, a new file is created and Patient Card contents are
inserted in it automatically.
Shortcut:
Main toolbar:
90. Analysis: Signal Parameters command
Open Parameters of Signal dialog window. The parameters of signals (Amplitude from pick to pick,
approximated frequency and voltage difference will be measured for selected by vertical markers time
interval.
91. Analysis: EEG Mapping command
123
Open an EEG Mapping window for active EEG file. You can open several Mapping windows for one
active EEG file, but for different intervals. Use vertical markers in the EEG window to mark an
interval of interest. An interval for mapping must not exceed 1 sec. Raw data is processed according to
montage parameters before mapping. ECG channels are excluded automatically.
Electrode coordinates are additional parameters for maps (see Montage parameters: Electrodes
dialog). Incorrect coordinate settings can disable mapping.
Attention!!! EEG data reformatted to a bipolar montage cannot be mapped. Choose a
monopolar montage for the active EEG window before calling this command.
Shortcut:
Main toolbar:
92. Analysis: EEG Indices… command
Calculate EEG indices for a selected EEG interval and opens an EEG Indices window for the active
EEG file. You can open several indices windows for one active EEG file, but there can be only one
window for any specific record interval. Use vertical markers in the EEG window to mark an interval
of interest. An interval for processing must not be shorter than 1 sec.
After calling this command, the Parameters of EEG Indices Computation dialog is opened to set
additional processing parameters.
Raw data is processed according to montage parameters.
Attention EEG reformatted to a bipolar montage cannot be mapped. If you wish to view
maps of indices, choose a monopolar montage for the active EEG window before calling this
command.
Electrode coordinates are additional parameters for maps (see Montage parameters: Electrodes
dialog). Incorrect coordinate settings can disable mapping.
Shortcut:
Main Toolbar:
93. Analysis: EEG Spectra… command
Calculate EEG power spectra for a selected EEG interval and opens an EEG Spectra window for the
active EEG file. You can open several spectra windows for one active EEG file, but for different
intervals. Use vertical markers in the EEG window to mark an interval of interest. An interval for
processing must not be shorter than 1 sec.
After calling this command, the Parameters of EEG Spectra Computation dialog is opened to set
additional processing parameters.
Raw data is processed according to montage parameter.
Attention! EEG reformatted to a bipolar montage cannot be mapped. If you wish to view
spectral maps, choose a monopolar montage for the active EEG window before calling this
command.
124
Electrode coordinates are additional parameters for maps (see Montage parameters: Electrodes
dialog). Incorrect coordinate settings can disable mapping.
Shortcut:
Main Toolbar:
94. Analysis: EEG Cross-correlation… command
Calculate EEG auto and cross-correlation for a selected EEG interval and opens an EEG Spectra
window (Auto and Cross-correlation) for the active EEG file. You can open several spectra
windows for one active EEG file, but for different intervals. Use vertical markers in the EEG window
to mark an interval of interest. An interval for processing must not be shorter than 1 sec.
After calling this command, the Parameters of EEG Auto and Cross-correlation Computation
dialog is opened to set additional processing parameters.
Raw data is processed according to montage parameters.
95. Analysis: Spectra Density Array command
Calculate and display (hide) spectra density arrays in EEG window for the whole EEG file
96. Analysis: Source distribution (LORETA)... command
Run this command to call LORETA application and store to it the voltage data corresponding to
position of vertical markers.
Before the first call of the LORETA application the WinEEG program ask for a location of
LORETA.EXE file. Its usual location is folder with name \LORETA\020-MAIN
97. Analysis: Spectrum power distribution (LORETA)... command
Run this command to call LORETA application and store to it the EEG power (covariance matrix)
computing for selected time interval. This command can be used together with Analysis: Turn on (off)
band pass filter to estimate the distribution of sources for EEG signal in the selected frequency band.
Before the first call of the LORETA application the WinEEG program ask for a location of
LORETA.EXE file. Its usual location is folder with name \LORETA\020-MAIN
98. Analysis: Dipole Source (BrainLock)... command
Run BrainLock program (optional)
99. Analysis: Nonlinear Analysis... command
Run special utilities for nonlinear analysis of EEG (optional). The Nonlinear analysis parameters
dialog will be displayed on calling this command.
100. Analysis: Spike Detection... command
Run this command to automatically find spike waveforms in the whole EEG file. The Spike detection
dialog will be displayed on calling this command.
125
101. Analysis: Spike Averaging... command
Run this command to calculate average waveform of spikes and opens an ERP window. The spikes
will be sorted by “main” channel assigned with spike labels. The Averaged spikes calculation dialog
will be displayed on calling this command.
102. Analysis: Remove EOG... command
Run this command to calculate coefficients for electro oculogram influence on EEG and to subtract
weighted EOG signal from signals of other channels. One of the EOG Rejection dialog will be
displayed on calling this command.
Attention! The algorithm of EOG artifact elimination is not ideal and supposes that a "pure"
EOG was recorded at least by one channel. It also assumes that no other high-amplitude
artifact occurred during EEG acquisition. Otherwise EEG can be significantly distorted and
eye movement artifact elimination may be quite poor.
Shortcut:
Main toolbar:
103. Analysis: Mark artifacts... command
Run this command to automatically detect artifacts parts of EEG record based on threshold criteria and
to mark corresponding time intervals. One of the Search and rejection artifacts dialog will be
displayed on calling this command.
Shortcut:
Main toolbar:
104. Analysis: Artifacts correction... command
Run this command to calculate spatial filter matrix that is used to correct EEG artifacts. The selected
part of EEG record is used to estimate EEG and artifact components of record by PCA or ICA
methods. The artifacts components are selected manually by visual inspection of their topography.
Using these data the corresponding spatial filter is computed. The Artifacts space filtering
parameters estimation dialog will be displayed on calling this command.
Run this command again to disable previously activated artifacts correction spatial filter.
Attention! The processed part of EEG record should include both the artifacts signals and the
artifacts free EEG signal to have a possibility to estimate their components.
Attention! The algorithm of artifacts correction is not ideal. That is why the visual inspection
of results of correction is necessary. If the results are not satisfied another time interval should
be selected and analyzed.
Attention! The correct usage of this method is possible for fixed parameters of EEG montage
and band pass filters. That is why any changes of mentioned above parameters will
automatically disable artifact correction spatial filter.
Shortcut:
Main toolbar:
126
105. Analysis: Artifacts correction using templates... command
Run this command to correct EEG artifacts by spatial filtering of raw EEG. The artifact components
are selected automatically by similarity component topographies to predefined templates. The
Artifacts correction using standard component topographies as templates will be displayed on
calling this command.
106. Analysis: Turn on (off) band pass filter (not in a menu)
Run this command to turn on (off) band pass filter defined by Setup: EEG bandranges… command.
Press right placed arrow button to displayed pop-up menu helps to select filter.
Shortcut:
Main toolbar:
107. Analysis: Compute ERP... command
Calculates event-related potentials (ERP) for a selected EEG interval in the active EEG file and opens
an ERP window. You can open several ERP windows for one active EEG file, but for different
intervals.
ERPs can be calculated only if presentation of visual (auditory) stimuli was carried out synchronously
with EEG acquisition.
After calling this command, a Parameters for Event-Related Potential Computation
(photostimulation) dialog or a Parameters for Event-Related Potential Computation (stimuli
presentation) dialog is displayed to define additional processing parameters depending on whether
source data type is photostimulation EEG or stimuli presentation EEG.
Raw data is reformatted according to montage parameters before processing.
Attention! EEG reformatted to a bipolar montage cannot be mapped. If you wish to view
ERP maps, choose a monopolar montage for the active EEG window before calling this
command.
Electrode coordinates are additional parameters for maps (see Montage parameters: Electrodes
dialog). Incorrect coordinate settings can disable mapping.
Shortcut:
Main toolbar:
108. Analysis: Compute ERD... command
Calculate event-related de-synchronization (ERD) for the active EEG file and opens an ERP window.
ERD can be calculated only if presentation of visual (auditory) was carried out synchronously with
EEG acquisition.
After calling this command Parameters for Event-Related De-synchronization Computation
dialog is displayed to define additional processing parameters.
127
Raw data is reformatted according to montage parameters before processing.
Attention! EEG reformatted to a bipolar montage cannot be mapped. If you wish to view
ERD maps, choose a monopolar montage for the active EEG window before calling this
command.
Electrode coordinates are additional parameters for maps (see Montage parameters: Electrodes
dialog). Incorrect coordinate settings can disable mapping.
Shortcut:
Main toolbar:
109. Analysis: Compute ERCoh... command
Calculate event-related coherence (ERCoh) for the active EEG file and opens an ERP window.
ERCoh can be calculated only if presentation of visual (auditory) was carried out synchronously with
EEG acquisition.
After calling this command Parameters for Event-Related De-synchronization Computation
dialog is displayed to define additional processing parameters.
Raw data is reformatted according to montage parameters before processing.
Attention! EEG reformatted to a bipolar montage cannot be mapped. If you wish to view
ERCoh maps, choose a monopolar montage for the active EEG window before calling this
command.
Electrode coordinates are additional parameters for maps (see Montage parameters: Electrodes
dialog). Incorrect coordinate settings can disable mapping.
Shortcut:
Main toolbar:
110. Analysis: Compute Wavelet... command
Perform wavelet ERP analysis for the active EEG file and opens an ERP window. Wavelet power can
be calculated only if presentation of visual (auditory) stimuli was carried out synchronously with EEG
acquisition.
After calling this command, one of the Wavelet Decomposition dialogs is displayed to define
additional processing parameters.
Raw data is reformatted according to montage parameters before processing.
Attention! EEG reformatted to a bipolar montage cannot be mapped. If you wish to view
maps, choose a monopolar montage for the active EEG window before calling this command.
Electrode coordinates are additional parameters for maps (see Montage parameters: Electrodes
dialog). Incorrect coordinate settings can disable mapping.
Shortcut:
128
Main toolbar:
111. Analysis: Compute Wavelet... command
Compute wavelet coherence for the active EEG file and opens an ERP window. Wavelet coherence
can be calculated only if presentation of visual (auditory) stimuli was carried out synchronously with
EEG acquisition.
After calling this command one of the Wavelet Coherence dialog is displayed to define additional
processing parameters.
Raw data is reformatted according to montage parameters before processing.
Attention! EEG reformatted to a bipolar montage cannot be mapped. If you wish to view
maps, choose a monopolar montage for the active EEG window before calling this command.
Electrode coordinates are additional parameters for maps (see Montage parameters: Electrodes
dialog). Incorrect coordinate settings can disable mapping.
Shortcut:
Main toolbar:
112. Analysis: Independent component spectra... command
Compute ERP for independent component of EEG and open ICA window.
The Parameters of ICA spectra calculation dialog will be displayed on calling this command.
113. Analysis: Independent component spectra... command
Compute ERP for independent component of EEG and open ICA window.
The Parameters of ERP ICA calculation dialog will be displayed on calling this command.
114. Analysis: Comparison of results command
Run this command to compare spectra, ERP or ERD. The results can be compared between different
conditions and different subjects, or with normative database. The Processing results comparison
dialog will be displayed on calling this command.
115. Pop-up menu of EEG window: Add Spike command
Run this command to add spike label for selected channel and time sample.
116. Pop-up menu of EEG window: Delete Spike command
Run this command delete selected spike label.
117. Pop-up menu of EEG window: Change Channel command
Run this command to change “main” channel for selected spike label
129
118. Pop-up menu of EEG window: Copy EEG command
Run this command to copy EEG time interval into clipboard for selected spike
119. Pop-up menu of EEG window: Copy Spike command
Run this command to copy spike waveform into clipboard for selected spike.
120. Pop-up menu of EEG window: Copy EEG to Report command
Run this command to copy EEG time interval into text of final report for selected spike
121. Pop-up menu of EEG window: Copy Spike to Report command
Run this command to copy spike waveform into text of final report for selected spike.
122. Analysis: Graphs command
Display processing results (spectra or indices) as graphs for each channel in an EEG indices window
or in an EEG spectra window.
Shortcut:
Analysis toolbar:
123. Analysis: Histograms command
Display histograms (for standard EEG frequency bands) for each channel in an EEG indices window
or in an EEG spectra window.
Shortcut:
Analysis toolbar:
124. Analysis: Table command
Display table of spectral parameters (for standard EEG frequency bands) for each channel in an EEG
indices window or in an EEG spectra window.
Shortcut:
Analysis toolbar:
125. Analysis: Maps command
Map spectral parameters distribution (for standard EEG frequency bands) for each channel in an EEG
indices window or in an EEG spectra window.
Attention! Maps cannot be viewed if the source EEG was reformatted to a bipolar montage
before processing.
Shortcut:
Analysis toolbar:
126. Analysis: Asymmetry command
130
Map asymmetries in the distribution of spectral parameters (for standard EEG frequency bands) for
each channel in an EEG indices window or in an EEG spectra window.
Attention! Maps cannot be viewed if the source EEG was reformatted to a bipolar montage
before processing.
Shortcut:
Analysis toolbar:
127. Analysis: Formula (Mapping) command
Map ratio of two spectral parameters for standard EEG frequency bands in an EEG indices window or
in an EEG spectra window. Ratio formula is defined by means of Calculator bar.
Attention! Maps cannot be viewed if the source EEG was reformatted to a bipolar montage
before processing.
Shortcut:
Analysis toolbar:
128. Analysis: Formula (Graphs) command
Display dynamics of the ratio of two spectral parameters for standard EEG frequency bands as graphs
in EEG spectra window. Ratio formula is defined by means of Calculator bar.
Shortcut:
Analysis toolbar:
129. Analysis: Interaction diagram command
Display interaction diagrams in an EEG spectra window.
Shortcut:
Analysis toolbar:
130. Analysis: Power Spectra (Autocorrelations) command
Display EEG power spectra or EEG autocorrelations in an EEG spectra window.
Shortcut:
Analysis toolbar:
131. Analysis: Coherence (Cross-correlations) for Channels command
Display EEG coherence channels or EEG cross-correlations for a selected channel in an EEG spectra
window.
Shortcut:
Analysis toolbar:
131
132. Analysis: Average Coherence command
Display EEG coherence averaged over all channels in an EEG spectra window.
Shortcut:
Analysis toolbar:
133. Analysis: Phase Spectra command
Display EEG phase spectra for a selected channel in an EEG spectra window.
Shortcut:
Analysis toolbar:
134. Analysis: Bispectra command
Display bispectra frequency-frequency plot in an EEG spectra window.
Shortcut:
Analysis toolbar:
135. Analysis: Bicoherence command
Display bicoherence frequency-frequency plot in an EEG spectra window.
Shortcut:
Analysis toolbar:
136. Analysis: Average Spectra command
Display average spectra in an EEG spectra window.
Shortcut:
Analysis toolbar:
137. Analysis: Spectra Dynamics command
Display spectra dynamics in an EEG spectra window.
Shortcut:
Analysis toolbar:
138. Analysis: Parameters of interaction diagrams
Run this command to modify parameters of interaction diagrams: used channel pairs and thresholds.
After calling this command, a List of channel pairs and parameters for EEG coherence and EEG
cross-correlations dialog is displayed to modify these parameters.
139. Analysis: Insert tables into report
Run this command to insert detailed report into the text of MS Word window. This option is available
only if raw spectra are kept during computation of power spectra (see Parameters of EEG spectra
132
computation dialog). After calling this command, an Insert table of spectra parameters dialog is
displayed to define a set of inserted tables and maps.
140. Pop-up Menu of Spectra Window: Add Map command
Add a map in Spectra window. The map is added for selected frequency component or frequency
band in dependence on displaying mode of Spectra window. A frequency component may be pointed
to on a graph or selected in a histogram by cursor position, when holding the right mouse button
pressed.
141. Analysis: Channels/Groups command
Display ERP graphs in an ERP window arranging them in columns by channels and in rows by trial
groups.
Shortcut:
Analysis toolbar:
142. Analysis: Groups/Channels command
Display ERP graphs in an ERP window arranging them in columns by trial groups and in rows by
channels.
Shortcut:
Analysis toolbar:
143. Analysis: Time/Groups Mapping command
Display ERP maps in an ERP window arranging them in columns by time readouts and in rows by
trial groups.
Attention! Maps cannot be viewed if source EEG was reformatted to a bipolar montage
before processing.
Shortcut:
Analysis toolbar:
144. Analysis: Groups/Time Mapping command
Display ERP maps in an ERP window arranging them in columns by trial groups and in rows by time
readouts.
Attention! Maps cannot be viewed if source EEG was reformatted to a bipolar montage
before processing.
Shortcut:
Analysis toolbar:
145. Analysis: Formatted Page command
Display ERP graphs and maps in an ERP window. Graphs are placed in the window according to
defined ERP display format (see Setup: Graph Formats... command).
133
Attention! Maps cannot be viewed if source EEG was reformatted to a bipolar montage
before processing.
Shortcut:
Analysis toolbar:
146. Analysis: Average Bandpower command
Display average EEG band power graphs for wavelet ERP analysis in an ERP window.
Shortcut:
Analysis toolbar:
147. Analysis: Rasters Time/Frequency command
Display time/frequency time-frequency plots for wavelet ERP analysis in an ERP window.
Shortcut:
Analysis toolbar:
148. Analysis: Channel List… command
Selects channel list for displaying graphs and maps in the ERP window.
Select List of Channels dialog is displayed after calling this command
149. Analysis: Group Info… command
Display statistical results of ERP averaging and response reaction analysis. Use this command also to
edit trial group names.
Results of Averaging and Subject Response Processing dialog is displayed after calling this
command.
150. Analysis: Export trial parameters command
Export parameters of task performance for single trials to ASCII text file. The next table is written to
text file:
1. First column – Time offset (in milliseconds) of the beginning of trial.
2. Second column – Label of trial. If the trial includes artifacts its label is equal zero.
3. Columns include reaction time measured by “first” button (in according with parameters of
subject response processing) for each averaging group or zero if this trial does not belong to
averaging group.
4. Columns include reaction time measured by “second” button (in according with parameters of
subject response processing) for each averaging group or zero if this trial does not belong to
averaging group.
5. Columns include number of “first” button presses during the trial (in according with
parameters of subject response processing) or zero if this trial does not belong to averaging
group.
134
6. Columns include number of “second” button presses during the trial (in according with
parameters of subject response processing) or zero if this trial does not belong to averaging
group.
151. Pop-up menu of ERP window: Add Map command
Add a map in ERP window. The map is added for active trial group (see Averaging Groups Bar) and
for the time readout (bin) marked on the ERP graph by the by cursor position, when holding the right
mouse button pressed.
152. Pop-up menu of ERP window: Add Label command
Add a peak label on a graph in an ERP window. Peak label is added for active trial group (see
Averaging Groups Bar) and for time readout (bin) marked on the ERP graph by the by cursor
position, when holding the right mouse button pressed.
Before the first call of the LORETA application the WinEEG program ask for a location of
LORETA.EXE file. Its usual location is folder with name \LORETA\020-MAIN
153. Pop-up menu of ERP window: Copy Parameter Distribution command
Copy string of voltages of “active” ERP group for selected time sample into clipboard
154. Pop-up menu of ERP window: Copy Channel command
Copy channel’s waveform, map and dipole picture for “active” ERP group into clipboard. The map
and dipole picture will correspond to time sample selected by mouse pointer.
155. Pop-up menu of ERP window: Copy Channel to Report command
Copy channel’s waveform, map and dipole picture for “active” ERP group into text of final report. The
map and dipole picture will correspond to time sample selected by mouse pointer.
156. Pop-up menu of ERP window: Source distribution (LORETA)... command
Run this command to call LORETA application and store to it the voltage data corresponding to
selected time point of ERP data. Time readout (bit) may be pointed to on an ERP graph by cursor
position, when holding the right mouse button pressed.
157. Pop-up menu of ERP window: Dipole source (BrainLock))... command
Run this command to call BrainLock application and store to it the voltage data corresponding to
selected time point of ERP data. Time readout (bit) may be pointed to on an ERP graph by cursor
position, when holding the right mouse button pressed.
158. Pop-up menu of ERP window: Delete All Labels command
Run this command to clear all pick labels.
159. Pop-up menu of ERP window: Delete Labels and Maps command
Run this command to clear all pick labels and maps.
160. Analysis: Insert Patient Card command
135
Insert patient card into final report text.
Shortcut:
Main toolbar:
161. Analysis: Generate Final Report command
Activate final report generation procedure (Only Russian version available).
162. Analysis: Insert Final Report Template... command
Insert a final report template into final report text.
Shortcut:
Main toolbar:
163. Analysis: Select groups command
Select averaging groups from list of groups for displaying of the graphs.
Parameters of averaging groups dialog is displayed after calling this command.
164. Analysis: Select group pairs command
Select averaging group pair from list of groups for displaying of the difference curve graphs.
Select group pairs dialog is displayed after calling this command.
165. Analysis: Change graph scale command
Change vertical scale for ICA average curves.
Define graph scale dialog is displayed after calling this command.
166. Analysis: Correct baseline command
Define time interval for baseline correction.
Correct graphs baseline dialog is displayed after calling this command.
167. Analysis: Save components filter command
Save to the ASCII file a matrix transforming raw EEG (ERP) to the components of EEG (ERP).
168. Analysis: Save signal filter command
Save to the ASCII file a matrix – spatial filter, revealing or suppressing signals from raw EEG (ERP)
for selected list of components.
Select components for filter dialog is displayed after calling this command.
169. Analysis: Export activation curves (spectra) command
136
Export activation curves for independent components of ERP or spectra of independent components
into ASCII text file.
170. Pop-up menu of ICA window: Copy component command
Place bitmaps and graphs to clipboard corresponding to selected component by mouse. The result of
work of this command will be similar to
171. Pop-up menu of ICA window: Component name command
Modify component name.
Component name dialog is displayed after calling this command.
172. Pop-up menu of ICA window: LORETA for component command
Runs LORETA application and store to it the topography of selected component.
173. Analysis Export of component parameters command
Save to the ASCII file the parameters of selected component for the future statistical analysis.
Export of parameters of independent component dialog is displayed after calling this command.
174. Setup: Database Pathnames… command
Create or opens EEG, spectra and indices databases and customizes their parameters.
The Database Parameters dialog consisting of four tabs is displayed after calling this command. Go
from tab to tab to define parameters for Databases of Raw Data, Databases of Processing Results,
and also Browser Settings and Base Record Search Parameters.
175. Setup: Preferences... command
Set graphic output parameters for EEG window. Preferences dialog is displayed after calling this
command.
176. Setup: Mapping Style... command
Modify map display style. Mapping Style dialog is displayed after calling this command.
137
177. Setup: Montage List… command
Modify montages in the montage list.
A montage includes a number of options such as list of registered channels, list of displayed channels
and their parameters (gains, bandwidths, baselines, colors, etc.).
Remember that signals are acquired and recorded always in monopolar form (referenced to the
electrode connected with A1 and А2 nets). The bandwidth for acquisition and recording is maximally
wide: 0.15 - 70 Hz for «Mizar-EEG-3». Remember that 0.15 Hz frequency corresponds to 1.0 sec time
constant. This recording method allows conversion of raw data to any mono- or bipolar montage with
any bandwidth* during subsequent viewing and processing.
*Note: After recording EEG data, the phrase “any bandwidth” must be understood to mean “any
bandwidth that is less than or equal to the instrument’s maximum bandwidth,” i.e. 70Hz in the case of
the Mitsar-EEG-3.
A Montage parameters dialog consisting of six tabs is displayed after calling this command. Go from
tab to tab to define the following montage parameters:
a. Define a list of channels for EEG acquisition corresponding to electrodes actually placed and
connected (see Montage parameters: Electrodes dialog). Also define coordinates of the
electrodes.
b. Define a list of channels in the montage and their parameters such as gain, bandwidth and base
line (see Montage parameters: Channels dialog).
c. Define colors for displaying each channel (see Montage parameters: Colors dialog).
d. Define the calculated referents if there are any (e.g. Av, AvL and AvR) (see Montage
parameters: Referents).
e. Test whether channels are correctly defined or view another montage in the list (see Montage
parameters: View dialog).
178. Setup: Fragment Names... command
Define list of EEG fragment names for Input Control toolbar.
Names of Fragments (Trials) dialog is displayed after calling this command.
179. Setup: Label List… command
Define up to 10 user labels for Labels popup menu.
User Label Description dialog is displayed after calling this command.
180. Setup: Photostimulation Programs… command
Define list of photostimulation programs.
Photostimulation Program List dialog is displayed after calling this command.
138
181. Setup: EEG Bandranges… command
Define a list of standard EEG frequency bands to be used for data processing in an EEG Indices
window or in an EEG Spectra window.
EEG Bandranges dialog is displayed after calling this command.
182. Setup: Stimuli Presentation Programs… command
Display and modifies stimuli presentation programs (protocols) for ERP acquisition.
Stimuli Presentation Program List dialog is displayed after calling this command.
183. Setup: Graph Formats… command
Change graph output options in an ERP window.
Graphics Page Format dialog is displayed after calling this command.
184. Setup: Title… command
Define a running header to be printed at the top of each page (for example, your organization title).
Running Head dialog is displayed after calling this command.
185. Setup: Final Report… command
Customize final report generator.
Final Report Generator Setup dialog is displayed after calling this command.
186. Setup: Final Report Templates… command
Define and modifies list of final report templates.
Final Report Template List dialog is displayed after calling this command.
187. Setup: Video recording… command
Select video capturing device. Set and modifies parameters of capturing: resolution, frame rate, signal
format and on-line compression.
Video recorder parameters dialog is displayed after calling this command.
188. Setup: Equipment Parameters… command
Set and modify hardware configuration.
Equipment Configuration dialog is displayed after calling this command.
189. Window: Cascade command
139
Cascades all open windows.
Shortcut:
Main toolbar:
190. Window: Tile Horizontally command
Tiles all open windows horizontally.
Shortcut:
Main toolbar:
191. Window: Tile Vertically command
Tiles all open windows vertically.
Shortcut:
Main toolbar:
192. Window: Arrange Icons command
Arrange the icons for minimized windows at the bottom of the main window.
193. Window: Split command
Split the active window into two panes.
194. Window: 1, 2, ... command
WinEEG displays a list of currently open document windows at the bottom of the Window menu.
Check a document from this list to make its window active.
195. Help: About WinEEG... command
Displays copyright and version number for your copy of WinEEG.
196. Title Bar
The title bar is located along the top edge of a WinEEG window, a document window or a dialog. It
displays application name, document name or dialog name.
To move a window or a dialog, drag its title bar.
A title bar may contain the following elements:
Application icon (in the left top corner of the application window) for calling application
system menu.
Document icon (in the left top corner of a document window) for calling document system
menu.
Maximize button (in the right top corner of a window).
Minimize button (in the right top corner of a window).
Restore window size button (in the right top corner of a maximized or a minimized window).
140
Close button (in the right top corner of a window): closes document or application.
Application name.
Document name.
Dialog name.
197. Scroll bars
Scroll bar is placed at the right and bottom edges of a document window. The scroll boxes inside the
scroll bars indicate your vertical and horizontal position in the document. You can use the mouse to
scroll the document.
198. Size command (System menu)
Run this command to size the active window by means of arrow keys. After the cursor shape has
changed:
1. Choose what window edge to move (left, right, top or bottom) by pressing a corresponding arrow
key.
2. Press arrow keys to move the edge.
3. Press ENTER when the window reaches necessary size.
199. Move command (System menu)
Run this command to size the active window by means of arrow keys. The cursor will change its shape
to:
Use arrow keys to move the window. Press ENTER when the window reaches the necessary position.
Shortcuts:
Keys:
CTRL+F7
200. Minimize command (System menu)
Minimize the window to an icon.
Shortcuts:
Title bar:
Keys:
ALT+F9
201. Maximize command (System menu)
Maximize an application window to screen size or a document window to application window size.
Shortcuts:
Title bar:
Double-click title bar
Keys:
CTRL+F10.
202. “Next” command (document window System menu)
Activates next document window (in order of opening time).
141
Shortcut:
Keys:
CTRL+F6
203. “Previous” command (document window System menu)
Activate previous document window (in turn by time of opening).
Shortcut:
Keys:
SHIFT+CTRL+F6
204. “Close” command (System menu)
Close a document window or application.
Shortcuts
Title bar:
Keys:
CTRL+F4 to close a document
ALT+F4 to close WinEEG
205. “Restore” command (System menu)
Restore a minimized or a maximized window.
142
Dialogs
1. Montage Parameters: Patient Card dialog
Use the Patient Card tab of the Montage Parameters dialog to enter data in the patient card. You can
also choose a montage from the montage list (see Setup: Montage List... command).
Montage Name: This field initially contains the name of the default montage from the montage list.
Use down-arrow button to select a different montage from the list for use as a new default. You can
also rename the selected montage.
ID: EEG record ID is an arbitrary alphanumeric sequence of up to 10 characters to simplify searching
the database.
Date: The date of EEG acquisition start is entered automatically. Use DD/MM/YYYY date format for
successful database search by date.
143
Time: The time of EEG acquisition start is entered automatically. Use HH:MM:SS time format for
successful database search by time.
Investigation: Select investigation type from list:
1. EEG observation
Patient: Enter patient's name.
Patient ID: Enter patient's card number.
Diagnosis: Enter a brief disease diagnosis. The final report may contain more detailed description.
Date of birth: Enter the date of patient's birth. Use DD/MM/YYYY date format for successful
database search.
Sex: Enter patient's sex (M/F)
Address: Enter patient's address.
Note: Enter other useful info (patient's insurance policy number for example).
All the fields of patient card are not mandatory but can be useful when searching database. Remember
that all patient info would be automatically added to the final report.
The fields are placed below used for EEG monitor control.
The fields with information about available disk free space place near patient card.
2. Montage Parameters: Channels dialog
Use the Channels tab of the Montage Parameters dialog to define the list of channels included in the
montage and for setting their parameters. You can also choose a montage from the montage list (see
Setup: Montage List command).
144
Montage Name: This field initially contains the name of default montage from the montage list. Use
down-arrow button to select a different montage from the list for use as a new default. You can also
rename the selected montage.
Channel List: The table of channels in the montage is placed on the left side. Each row corresponds to
a channel in the montage (don't confuse them with the channels in the acquisition list. The montage
channel list includes channels that will be displayed during the monitoring and processed). Columns
correspond to channel parameters:
a. The «No» column contains the ordinal number of the channel. To the left of it there is a
pictogram: its color is the same that the waveform color in the EEG window. It depicts also the
channel status ("visible" or "hidden"): if the pictogram is marked by a "V" character the channel
is shown in the EEG window ("visible"); otherwise the channel is not displayed ("hidden"). All
channels included in the list of montage channels will be used for processing (except universal
channels «Bio1», «Bio2»...)
145
a. The «Channel» column shows the electrode scheme (for example Fp1-Fp2; the electrode
named first is the active one and the second is the passive one). A channel can be used if it is
included in the list of monitored channels.
b. The «Gain» column shows the channel gains. For any channel in the montage you can select a
gain value from list:
1.0, 1.5, 2.0, 3.0, 5.0, 7.0, 10.0, 15.0, 20.0, 30.0, 50.0, 70.0, 100.0, 150.0, 200.0, 300.0, 500.0,
700.0 uV/cm, 1.0, 1.5, 2.0, 3.0, 5.0, 7.0, 10.0, 15.0, 20.0, 30.0, 50.0, 70.0, 100.0, 150.0,
200.0, 300.0, 500.0, 700.0 mV/cm.
c. The «Low cut» column shows the selected low frequency cutoff value. For any channel in the
montage you can set one of the following values for low cutoff frequency:
0.16 Hz (1.0 sec), 0.53 Hz (0.3 sec), 1.6 Hz (0.1 sec) и 5.3 Hz (0.03 sec), and 0.0 Hz (DC),
0.016 Hz (10.0 sec), 0.032 Hz (5.0 sec), 0.053 Hz (3.0 sec), 0.045 Hz (3.5 sec) for DC
amplifiers
d. The «High cut» column shows the selected high frequency cutoff value. For any channel in
the montage you can set one of the following values for high cutoff frequency:
15 Hz, 30 Hz, 50 Hz, 70 Hz, and possible 150 Hz, 0.5 Hz и 1.5 Hz for different modification
of amplifiers.
All filters are 2-d order Butterworth filters.
e. The «Notch» column shows the notch values. For any channel one of the following notch
values can be set:
Turn Off, 45-55 (Hz), 40-60 (Hz), 35-65 (Hz), 55-65 (Hz), 50-70 (Hz), 45-75 (Hz).
All filters are 12-th order Butterworth notch filters.
Attention! Do not use the wide width filters unless absolutely necessary since it can distort
bandwidth.
f. The «Baseline» shows the selected value of the channel baseline offset. The offset is set in mV
(micro Volts); its range and step depend on the selected gain for the given channel. So, minimal
baseline offset corresponds to 1 mm on the screen, and offset range is from 100 mm below to
100 mm above.
Changing Channel Parameters
To modify a parameter for a channel in the montage, first of all select a row in the table by clicking the
left mouse button on that row. The row is then highlighted by color. You can select several or all of the
rows. To select multiple lines, use the mouse holding Ctrl or Shift key pressed. To select all lines, click
any column heading in the table.
To change channel status ("visible"/"hidden") click the pictogram to the left of the channel, or press
the Space key. The Show All and Hide All buttons set the same status for all channels simultaneously.
The active electrode is defined for all selected channels in the montage by pressing the desired button
in the Electrode>EEG Channels group. This group includes buttons for EEG and universal (Bio)
channels.
The passive electrode is defined for all selected channels in the montage by pressing the desired
button in the Referent>EEG Channels group. This group includes buttons for EEG channels and other
referent types.
146
The gain for all selected channels can be set by selecting a value from the "Gain" list.
The low cut for all selected channels can be set by selecting a value from the "Low Cut (s)" list.
The high cut for all selected channels can be set by selecting a value from the "High Cut (Hz)" list.
The notch parameters for all selected channels can be set by selecting a value from the "Notch (Hz)"
list.
The baseline for all selected channels is changed by pressing arrow buttons to the right of the
"Baseline" list.
Attention! If active electrode is defined as “GFP” the global field power will be displayed in
EEG Window. The global field power is calculated according a formula:
n
n
GFP = {(1 / 2n)∑∑ [u (i ) − u ( j )]2 }0.5
i =1 j =1
Modifying Channel List
Press Add button to add a new line to the end of the montage channel list.
Press Insert button to add a new line above the currently selected one.
Press Delete button to delete all selected lines from the montage channel list.
3. Montage Parameters: Referents dialog
Use the Channels tab of the Montage Parameters dialog to define lists of channels to be included when
calculating Av, AvL, AvR and AvW referents. You can also choose a montage from the montage list
(see Setup: Montage List command).
Montage Name: This field initially contains the name of the default montage from the montage list.
Use down-arrow button to select a different montage from the list for use as a new default. You can
also rename the selected montage.
The Left Average (AvL) group defines the list of channels for the AvL referent. To calculate the AvL
referent signal, the encephalograms of the marked (checked) channels are averaged.
The Right Average (AvR) group defines the list of channels for the AvR referent. To calculate the
AvR referent signal, the encephalograms of the marked channels are averaged.
The Average (Av) group defines the list of channels for the Av referent. To calculate the Av referent
signal, the encephalograms of the marked channels are averaged.
147
The Weighted Average (AvW) group defines the list of channels and weights for the AvW referent.
You can choose a transformation (weight) matrix from the list or define your own. To define a
transformation matrix, press Modify transformation matrix button. The Transformation Matrix
for Weighted Average Referent dialog will appear.
4. Montage Parameters: Colors dialog
Use the Colors tab of the Montage Parameters dialog to define colors for depicting channels. You can
also choose a montage from the montage list (see Setup: Montage List command).
Montage Name: This field initially contains the name of default montage from the montage list. Use
down-arrow button to select a different montage from the list for use as a new default. You can also
rename the selected montage.
Channel List: The table of channels in the montage is placed on the left side. Each row corresponds to
a channel in the montage (don't confuse them with the channels in the acquisition list. The montage
channel list includes channels that will be displayed during the monitoring and processed). Columns
correspond to channel parameters (for more info see Montage List: Channels dialog).
148
To change colors for the selected channels (how to select channels - see Montage Settings: Channels
dialog), click one of the color buttons located to the right of the channels table.
5. Montage Parameters: View dialog
Use the Colors tab of the Montage Parameters dialog to monitor the parameters set. You can also
choose a montage from the montage list (see Setup: Montage List command).
Montage Name: This field initially contains the name of default montage from the montage list. Use
down-arrow button to select a different montage from the list to use as a new default. You can also
rename the selected montage.
The paper speed (horizontal scale) can be selected from the Speed list: 60, 30, 15, 7.5, 3.75 or 1.875
mm/sec.
The left window graphically depicts the electrodes used, their position (coordinates) and the site
scheme (montage). The referent electrodes are also shown.
149
6. Montage Parameters: Electrodes dialog
Use the Electrodes tab of the Montage Parameters dialog to list electrodes to be used and their
coordinates. You can also choose a montage from the montage list (see Setup: Montage List
command).
Montage Name: This field initially contains the name of default montage from the montage list. Use
down-arrow button to select a different montage from the list for use as a new default. You can also
rename the selected montage.
Check a channel to include it in the list for acquisition.
Spherical coordinates of the electrode upon the head (top hemisphere) are listed to the right of the
channel name.
The coordinate system is set as follows: X axis goes from the left ear to the right one, Y axis - from the
nape to the forehead, Z axis - upwards.
150
The Theta spherical coordinate must lie in the range from 0 to 90 degrees, the Phi coordinate - from 0
to 360 degrees.
Connect Channels A1 and A2: Check this option if you are not going to acquire EEG from different
channels in relation to different ears or to the "average" ear. If the option is checked, A1 and A2 nets
are connected directly in the amplifier block so that there is no necessity to connect two electrodes to
these nets or to use a jumper.
151
7. Transformation Matrix for Weighted Average Referent dialog
Change transformation coefficients if needed.
152
8. Record List dialog
WinEEG has its own database to simplify archiving and searching of files containing EEGs and
processing results (EEG spectra, EEG indices, etc.). There is a separate database for each type of file:
EEG files, EEG spectra files, EEG indices files and so on. It is also possible to create several databases
for one file type in order to group data by some criteria - by investigation date for example. Use the
Setup: Database Pathnames command to create a new database or to select an existing one.
Each database consists of an investigation list file and data files. Records in the investigation list file
include patient card, data file name and service information. A record in the database corresponds to a
single data file. Data files can be placed either in a working directory (folder) on the hard disk or in
archives on removable drives. The working directory for data files also can be placed on removable
drives of high capacity, such as magneto-optical diskettes. Data is searched over the investigation list
file which significantly simplifies and accelerates selecting records of interest.
WinEEG Database functions allow:
1. Adding a new file (for example, an EEG file after an investigation or a spectra file after
processing) to the database.
(See File: Save command).
2. To add a previously created data file.
3. To sort records (patient cards) by any criterion (field).
4. To select a subset of records by a set of criteria.
5. To copy (or to move) a file to an archive.
6. To copy a file from an archive to the working directory.
153
7. To delete a data file and/or a database record.
In the top of the Record List dialog window there is a record list. Each row in it corresponds to one
record in the investigation list file. Each column in the list corresponds to one field of the patient card
form. Use Setup: Database Pathnames command to define what fields are to be displayed and in
what order.
When Record List dialog is opened record list is unsorted: the first row displays the latest investigation
added to the database, etc.
To sort the record list by any field, click the corresponding column header.
To select a record for further processing, click the corresponding row so it becomes highlighted. In the
bottom of the Record List window the patient card from the selected record is displayed (see Edit
Patient Card dialog). Additional data file information is also shown there.
File field displays the name of data file corresponding to selected record.
Size field contains size (in bytes) of the data file if it is placed in the working directory. Otherwise this
field contains "Not found".
Backed up? Field contains "Yes" if the data file was backed up in the archive and "No" otherwise.
Record search condition (filter) field contains the information about records filter. If this field
contains word “Defined” this means the search condition is not clear. If this field contains word
“Undefined” this means the search condition is clear.
To the right of the patient card there are control buttons:
Open button opens the data (EEG, ERP EEG spectra and etc.) file corresponding to the record selected
in a new window. The file can also be opened by double-clicking the row in the record list. The
Record List dialog is then closed.
Note: If you open an ERP, EEG spectra and etc. database and select multiple records then the Average
button appears instead of the Open button. If you press the Average button, ERPs, EEG spectra and
etc. that have been averaged over all selected records will be calculated and then a new ERP window
or a new EEG Spectra window will be opened. If a raw EEG database is opened then on pressing
Average button, a Batch EEG processing dialog appears, allowing the calculation of ERP, ERD,
ERCoh, wavelet bandpower and etc. for several investigations simultaneously.
Cancel button closes the Record List dialog without opening any data file.
Export button calls the function of ERP (ERD, EEG spectra and EEG independent components
spectra) export. It can be useful for exporting processing results of several investigations to one ASCII
file for further statistical analysis.
Find... calls automatic record search function. A Base Record Search Parameters dialog will then
be opened.
Add... button calls the function that adds a data file to the database. A file is added to the database in
two cases. First, if it is necessary to add a file to the database that has not yet been recorded. This may
happen after an investigation if data was saved by Save As... command, or if the file was copied from
154
other encephalographic hardware. Second, files are added if there is a need to create a new database,
for example if the old one is lost.
If Add... command is called a File Open dialog appears. Using the standard Windows browsing
interface, find the file of interest and open it. If the selected data file has a compatible format
(EEG 1.5, EEG 3.0 or WinEEG) an Open dialog will appear. There are two exceptions: EEG 1.5 EEG
files with bipolar acquisition and EEG 3.0 spectra files cannot be added to respective databases.
Delete button calls the record and data file deletion function. Delete Data From Database dialog is
then displayed.
Backup button calls the function that backs up data files from the working directory to an archive.
Backup Data To Archive dialog appears then.
Restore button calls the function of data file copying from archive to the working directory.
Restore Archive Data dialog appears then.
Report button calls the function that creates a statistical report including quantity EEG observations
carried out during selected time interval and/or with different groups of subjects and insert resulting
table into MS Word. The Statistical results dialog appears then.
The databases of results of processing can have additional buttons. So, Database of evoked potentials
has two additional buttons.
155
ICA button calls the function computing independent components of average ERPs if ERP database is
opened, independent components of average ERD if ERD database is opened and EEG independent
components average spectra if EEG database is opened. The Parameters of independent component
analysis (ICA) dialog or Parameters of ICA spectra calculation for selected group of
observations appears after calling this function.
Components button calls the function performing transformation of ERPs to ERP components. The
results of processing will store to the same database as additional ERP files. WinEEG ask for text file
contains the description of list of spatial filters. The example of such file is presented below.
"P1N1 vO"
"p-p"
"VCPT1ref.cmx"
"P1N1 vTL"
"p-p"
"VCPT2ref.cmx"
"P1N1 vTR"
"p-p"
"VCPT3ref.cmx"
"N1P2 aC"
"p-h"
"VCPT4ref.cmx"
"v comTL"
"a-p NoGO - a-a GO"
"VCPT5ref.cmx"
"v comTR"
"a-p NoGO - a-a GO"
"VCPT6ref.cmx"
"P4 wmF"
"+"
"VCPT7ref.cmx"
"P3b P"
"a-a GO"
"VCPT8ref.cmx"
"SW H"
"a-a GO"
"VCPT9ref.cmx"
"P3 supF"
"a-p NoGO"
"VCPT10ref.cmx"
"P4 monCC"
"a-p NoGO"
"VCPT11ref.cmx"
Each row corresponds to one component. First column contains name of component that will be used
as name of averaging group in resulting file. Second column contains name of averaging group of
source ERP file to which the processing will be applied. Third column contains name of text file in
which the transformation matrix (spatial filter) revealing the component from multi-channel ERP is
written by command Analysis: Save signal filter command.
156
9. Batch EEG Processing dialog
Montage list allows automatic changing of source EEG file montage.
Check Artifacts correction option to suppress the components of EEG related to artifacts. Press
Parameters button to call up the Artifact correction using standard component topographies as
templates dialog and set parameters of processing.
Check EOG Rejection option to eliminate eye motion artifacts for all files. Press Parameters button
to call up the EOG Rejection dialog and set parameters for EOG rejection.
Check Artifacts Rejection option to automatically detect parts of EEG record including artifacts and
eliminated them from processing for entire file. Press Parameters button to call up the Search and
Rejection Artifacts dialog and set parameters for artifacts rejection.
Use Bandpass List to choose a list of standard EEG frequency bands for automatic source EEG
filtering.
157
Use Bandpass Filter to choose a standard EEG frequency band filter for automatic source EEG
filtering.
Choosing an option from the Calculate group defines how to process selected files. The following
processing could be performed:
1. Save EEG file for future processing. The results of artifact correction, EOG rejection, artifact
rejection and EEG filtering will be saved to EEG file for future processing. This option is
useful if the goal of processing is to calculate different parameters: spectra, ERP, ERD and etc.
for the same list of files and for the same parameters of preprocessing.
2. Event related potentials. The event related potentials will be computed and saved automatically
to corresponding Evoked potentials (ERP) database.
3. Event related de-synchronization. The event related de-synchronization of EEG will be
computed and saved automatically to corresponding Event related de-synchronization (ERD)
database.
4. Event related coherence. The event related coherence of EEG will be computed and saved
automatically to corresponding Event related coherence (ERCoh) database.
5. Wavelet band power (ERD). The event related de-synchronization of EEG will be computed
using Morlet wavelet decomposition and saved automatically to Event related desynchronization (ERD) database.
6. Wavelet coherence (ERCoh). The event related coherence of EEG will be computed using
Morlet wavelet decomposition and saved automatically to Event related coherence (ERCoh)
database.
7. EEG spectra (and coherence). Power spectra of EEG and EEG coherence will be computed and
saved automatically to corresponding EEG spectra database.
8. EEG independent component spectra separately for each selected EEG record. The results will
be saved in specified folder as separate files.
Check Create report button to generate automatically the processing report. The compressed results
of processing and processing errors will inserted to this report. The processing report will be useful
monitoring the processing results and allow estimate their correctness.
Processing File field displays the name of the file currently being processed.
10. Averaging Spectra dialog
The Averaging Spectra dialog if used to define a parameter of averaging. Check Keep raw spectra
button to save individual spectra in resulting file. More accurate estimation of spectral parameters,
their confidences levels and statistical significance of differences can be done using individual spectra
(For more information see Analysis: Insert tables into report… command).
158
11. Base Record Search Parameters dialog
The Base Record Search Parameters dialog is used to define a set of criteria for record filtering. In
other words, only records satisfying all of the specified criteria would be displayed in the list, and the
others would be ignored. The search criteria are saved and re-used each time the Record List dialog is
opened. This logic facilitates manipulation of a certain subset of the database records (for example,
only data acquired during last month). But it may also cause mistakes and complications when
searching data. If you find that some records have suddenly "disappeared" from the base, first of all
check the search criteria.
Each edit box in the Base Record Search Parameters dialog defines one search criterion. A record
satisfies search conditions if it contains all features that have been defined. Blank fields are ignored
during search.
Here is the list of search criteria that can be defined:
ID field contains a text string that must be present in the corresponding field of the database record. If
the text defined for search is shorter than in the database, a substring is searched. Symbol case is
ignored. Blank spaces before and after the text are deleted. If the ID field in the search condition
contains " ABC ", then records containing "ABC", "abc", "AbCXXxxXX", "xxxxxaBc",
"xXxaBCXXx" in their ID fields satisfy this condition.
Date From ... - To fields define the interval of EEG acquisition dates (current year for example). To
enable automatic search by date, use DD/MM/YYYY date format.
Time From ... - To fields define the interval of EEG acquisition times (before noon for example). To
enable automatic search by time, use HH:MM:SS time format.
159
Investigation field contains a text string that must be present in the corresponding field of the database
record (see also ID field).
Patient field contains a text string (for example, patient name) that is to present in the corresponding
field of the database record (see also ID field).
Patient ID field contains a text string that must be present in the corresponding field of the database
record (see also ID field).
Diagnosis field contains a text string that must be present in the corresponding field of the database
record (see also ID field).
Date of Birth From ... - To fields define the range for dates of patients' birth, for example from
01/01/1950 to 31/12/1959. To enable automatic search by date, use DD/MM/YYYY date format.
Sex field signs patient sex (M or F). [Editing note: what about trans-gendered individuals?]
Address field contains a text string that must be present in the corresponding field of the database
record (see also ID field).
Note field contains a text string that must be present in the corresponding field of the database record
(see also ID field).
Check Existed in the working folder option to select only records corresponding to files existing in
the working folder. Attention! Using this condition may significantly slow down the database search.
Check Backed-up option to select only records corresponding to EEG files that have been backed up
at least once
Press OK button to accept search conditions.
Press Clear button to clear all fields.
12. Backup Data To Archive dialog
To backup a data file means to copy it to an archive on some disk. If the data file is larger than free
space on the disk (for example when copying on a floppy) it will be split into several parts and the
copying procedure will sequentially ask for the necessary number of removable disks.
160
Attention! Use the Restore command to restore a backed-up file into the database working directory.
Using a file “Copy” procedure to move data in the archive can change format of the data file.
Drive - select drive to backup the data file to.
Check Remove Files From Working Folder option to delete the backed-up file(s) from the working
directory.
13. Archive Data dialog
To restore an archive file means to copy a backed-up (archived) file corresponding to the selected
record from the specified disk to the working directory (see Data Archiving). If the data file is archived
on several floppies they will be asked for sequentially.
Drive - select drive to restore the data file from.
14. Delete Data From Database dialog
Be careful when running this command! A mistake can lead to unrecoverable loss of
important data.
First of all define what exactly is to be deleted:
161
Only Data File option would be usually chosen to free hard disk space - but only if the file has been
backed-up.
Data File and the Corresponding Record option is mostly used for deleting test records, not real
investigation data.
15. Add File To Database dialog
You can select several files to be added. Define also if file names should be kept, if data files should be copied
to working directory, if archive name should be recorded in the database and if patient card should be viewed
before file adding.
162
16. Statistical report dialog
The Statistical report dialog is used to define a set of criteria for record filtering. In other words, only
records satisfying all of the specified criteria would be calculated, and the others would be ignored.
Each edit box in the Statistical report dialog defines one search criterion. A record satisfies search
conditions if it contains all features that have been defined. Blank fields are ignored during search.
Here is the list of search criteria that can be defined:
ID field contains a text string that must be present in the corresponding field of the database record. If
the text defined for search is shorter than in the database, a substring is searched. Symbol case is
ignored. All blanks placing before and after the text are deleted. If the ID field in the search condition
contains “
ABC ", then records containing "ABC", "abc", "AbCXXxxXX", "xxxxxaBc",
"xXxaBCXXx" in their ID fields satisfy this condition.
Date From ... - To fields define the interval of EEG acquisition dates (current year for example). To
enable automatic search by date, use DD/MM/YYYY date format.
Time From ... - To fields define the interval of EEG acquisition times (before noon for example). To
enable automatic search by time, use HH:MM:SS time format.
Investigation field contains a text string that must be present in the corresponding field of the database
record (see also ID field).
Diagnosis field contains a text string that must be present in the corresponding field of the database
record (see also ID field).
Date of Birth From ... - To fields define the range for dates of patients' birth, for example from
01/01/1950 to 31/12/1959. To enable automatic search by date, use DD/MM/YYYY date format.
Age from … to … step fields define a number of rows in resulting table.
Divide by gender box defines is the observations of males and females should be calculated separately
or not.
163
Press OK button for start a searching and calculation procedure. The example of resulting table is
placed below:
Age
1-10
11-20
21-30
31-40
41-50
51-60
61-70
71-80
Male
5
12
2
3
26
11
1
0
17. File Open dialog
Specify a file to open.
Files of Type
Select the type of file you want to open:
*.EEG - EEG file,
*.RTF - final report file,
*.SPC - EEG spectra file,
*.IDX - EEG indices file,
*.ERP - event-related potential file,
*.ERD - event-related de-synchronization (wavelet) file,
*.ERC - event-related coherence file,
*.BFB - biofeedback file,
And other types of file.
Female
4
1
6
7
6
12
1
0
164
Look In:
Choose a folder (on a drive or in a network) where the file to open can be found.
18. File Save As dialog
Specifies the name and location of the file you want to save.
File Name
Type a new file name, the extension will be suggested by the application.
The following extensions are used:
*.EEG - for EEG files,
*.RTF - for final reports,
*.SPC - for EEG power spectra,
*.IDX - for EEG indices
*.ERP - for event-related potentials,
*.BFB - for biofeedback files,
*.ERD - for event-related EEG de-synchronization,
*.ERC - for event-related EEG coherence,
And other types of file.
Save In
Choose a folder (on a drive or a network) to place the new file in.
165
19. Import of EDF+ data dialog
The EDF+ data export procedure is used to convert EDF+ data to EEG format.
Both Waveform table and Time events table helps to define list of signal channels and list of EDF
annotations.
The Waveform table includes following columns:
1. No – order number of channel
2. Label – name of channel written to EDF+ file.
3. Hz – sampling rate of channel in source file.
4. Physical – name of physical units for each channel.
5. Prefilter – textual data described frequency bands
6. Name – name of channel for destination file.
7. Type – type of data: EEG, Bio or Referent.
8. Coordinates – spherical coordinates of sensors placed on the head (for EEG channels only).
Name, Type and Coordinates channel attributes can be changed using Change attributes of signals
button. After pressing this button Channel attributes dialog will appear on the screen.
The Time events table includes following columns:
1. No – order number of EDP annotation.
2. Label – fixed name: “EDF annotation”.
166
3. Annotation content – the beginning of corresponding annotation.
4. Type – type of annotation that used for data interpretation.
5. Trial info – additional information for definition parameters of imported trials (sweeps)/
Type and Trial info can be changed using Change attributes of time events button. After
pressing this button Event attributes dialog will appear on the screen.
Hypnogramm file name field is used to attach additional information to EEG file. Use “Browse”
button on the right of the file name field to select a drive and a folder. (Not implemented now!)
20. Channel attributes dialog
This dialog includes following fields:
Name – Name of channel for destination file: up to 7 characters.
Type – Type of channel for destination file. It can be following “EEG” – EEG channel, “BIO”
additional not EEG channel or “REF” – referent.
Theta and Phi - spherical coordinates of sensors placed on the head (for EEG channels only).
21. Event attributes dialog
This dialog includes following fields:
Type – type of event for its interpretation. . It can be following:
1. Fragment – the beginning of fragments
2. User mark – the user label with text
167
3. Artifact – the beginning of artifact and its duration
4. Beginning of trial – the beginning of trials
5. Stimulus onset – the stimuli onsets.
Following additional information is necessary for Beginning of trial and Stimulus onset event types:
Baseline time interval (ms) – the duration of prestimulus time interval.
Duration (ms) – the stimulus time interval
Poststimulus time interval (ms) - the duration of poststimulus time interval.
Total duration of trial will be equal to the sum of these tree parameters.
Check Use digits only button to exclude time events with textual information during adding trials list.
22. Export ERP (ERD) dialog
ERP (ERD) export is used for saving data in a text file readable by other applications.
Channels
Select the channels you wish to export ERP from. Use Add, Delete, Select All and Deselect All
buttons.
Groups
Select the trial groups for which you wish to export ERP. To select or to unselect all groups
quickly, use Select All and Deselect All buttons.
168
Data
Choose what data to export: Waveforms themselves or Performance Data table.
Time Interval
Set the time interval you wish to export data for. The following interval parameters need to be
set:
From: - sets the starting point. You can start at the very beginning of the trial or at the moment
when one of the stimuli is presented.
From (ms): - sets the beginning of the interval to export (in relation to the starting point).
To (ms): - sets the end of the interval to export (in relation to the starting point).
Step: - sets sampling interval for the exported data. If the Step value exceeds sampling interval
for source data adjacent readouts are averaged.
Baseline correction
Specify parameters for baseline correction:
To left from: Define stimulus before time interval will be chosen for estimation of baseline
average potential.
Length: Define length if time interval used for estimation of baseline average potential.
Format
Choose format for ERP export.
If you choose the Channels In Line option ERP data will be written as follows:
Ch 1 Ch 2 ...
Gr 1 Gr 1
TR 1
TR 2
D,
D,
D,
D,
Ch
M
Gr 1
D,
D,
TR N
D,
D,
D,
Ch 1 Ch 2 ...
Gr 2 Gr 2
D,
D,
D,
D,
Ch
M
Gr 2
D,
D,
D,
D,
D,
...
Ch 1 ...
Gr
K
D,
D,
Ch
M
Gr K
D
D
D,
D
If you choose Time Samples In Line option ERP data will be written as follows:
Ch 1 Gr 1
Ch 2 Gr 1
TR
1
D,
D,
Ch M Gr D,
1
Ch 1 Gr D,
2
Ch 2 Gr D,
2
TR
2
D,
D,
...
TR N
D,
D,
D,
D,
D,
D,
D,
D,
169
Ch M Gr D,
2
D,
D,
Ch 1 Gr D,
K
Ch 2 Gr D,
K
D,
D,
D,
D,
Ch M Gr D,
K
D,
D,
Here TR X are time readouts, Ch X - channels, Gr X - trial groups, and D - data.
If Groups In Line option is unchecked ERP data will be written as follows:
Ch 1 Ch 2 ...
TR 1 G 1
TR 2 G 1
D,
D,
D,
D,
Ch
M
D,
D,
TR N G 1
TR 1 G 2
TR 2 G 2
D,
D,
D,
D,
D,
D,
D,
D,
D,
TR N G 2
D,
D,
D,
TR 1 G K
TR 2 G K
D,
D,
D,
D,
D,
D,
TR N G K
D,
D,
D,
Add Column Names
Check this option to add column names in the first row of the file. Column names can be useful,
for example, for data exported to the Statistica program.
Add Row Names
Check this option to add row names in the first column of the file. Row names can be useful, for
example, for data exported to the Statistica program.
File
Enter full file path. Use “...” button on the right of the file name field to select a drive and a
folder.
Append To the End Of File
Check this option to append data to an existing file otherwise the file will be rewritten. File
appending may be useful for arranging data of several investigations in an entire table for further
statistical analysis.
170
23. Export wavelet bandpower (coherence) dialog
This dialog works similar as described in previous chapter but user should also specify Frequency
band for which average power or coherence will be calculated.
171
24. Export EEG Data dialog
EEG data export is used for saving data in a file readable by other applications.
Interval
Choose an EEG interval to be exported.
Exports an EEG interval selected by two vertical markers
Selection
Exports an EEG fragment chosen from the list
Fragment
Exports the whole EEG
Full EEG file
Format
Choose format for a file to export EEG interval to.
Each column in an ASCII file means one channel and each row - one time
ASCII
readout. Data written to the file is reformatted and filtered according to the
montage parameters: it is not raw data.
In binary format, a single value takes 4 bytes. The data is recorded as
Binary
follows: <S1C1> <S1C2> ... <S1Cn> <S2C1> <S2C2> ... <S2Cn>, where Si
(Float)
denotes the i-th time readout and Cj means jth channel. Data written to the
file is reformatted and filtered according to the montage parameters: it is not
raw data.
European Data Format supported by a number of European and American
EDF
vendors of computer encephalography. Data written to the file is reformatted
and filtered according to the montage parameters: it is not raw data..
Universal Data Format supported by leading vendors of computer
UDF
172
ANL
DAT
(Lexicor
data files)
encephalography in Russia. UDF is an extension for the EDF format. Raw
data is written to the file.
Old ERP data format
Lexicor data format. In this case the sampling rate can be changed according
the setting of field Sampling Rate
File
Define full path of the destination file for exporting data to. Use the "..." on the right of the
name field to choose a drive and a folder.
25. Export video EEG dialog
The following options allow you to specify how the raw EEG and video EEG should be copied to
another file:
Interval
Choose an EEG interval to be copied.
Copy an EEG interval selected by two vertical markers
Selection
Copy an EEG fragment chosen from the list
Fragment
Copy the whole EEG
Full EEG file
Output data
Choose a type of output EEG data.
Copy unfiltered (raw) EEG
Raw EEG
Copy filtered EEG
Filtered EEG
Low cut (s), High cut (Hz) and Notch (Hz) fields allow you specify filters parameters for filtered
EEG.
Folder
Define a destination folder in which the EEG data and video files will be recorded.
173
This function is useful if it is necessary to prepare a number of video EEG examples to write them to
CD. The WinEEG program will copy automatically video EEG data, video EEG viewer (ViewEEG
program) and some additional service data in selected folder. It is possible to run this function many
times. As the results a number of subfolders will be created and the data will be copied in these
subfolders.
START.EXE utility helps to open all copied data automatically by ViewEEG program.
ViewEEG program is the restricted version of WinEEG program providing reviewing of video EEG
data.
Attention!!! ViewEEG program requires DirectX 9.0 installation.
174
26. Export EEG Spectra dialog
EEG spectra export is used for saving data in a file readable by other applications.
Channels
Select the channels you wish to export ERP for. Use Add, Delete, Select All and Deselect All
buttons.
Data
Defines what data are to be exported in an ASCII file. You can export either Raw EEG Spectra
or table of EEG Power for Defined Frequency bands.
Raw EEG spectra
Writes raw EEG power spectra to an ASCII file. Columns
correspond to channels and rows - to harmonics. The first row
presents the first harmonic with frequency depending on analysis
epoch length: 1 sec - 1 Hz, 2 sec- 0.5 Hz, 4 sec- 0.25 Hz (see
Analysis: EEG Spectra command). The constant component is
not written to the file.
EEG spectral power
for the defined
bandranges
Writes the table of EEG spectral power parameters to an ASCII
file. Columns present channels and each pair of channels
corresponds to an EEG frequency band (Delta, Theta, etc).
Bispectra for defined
Writes the table of EEG bispectral parameters to an ASCII file.
175
bandrange
Columns present channels corresponding to each pair of EEG
frequency band (Delta, Theta, etc).
Bicoherence for
defined bandrange
Writes the table of EEG bicoherence parameters to an ASCII file.
Columns present channels corresponding to each pair of EEG
frequency band (Delta, Theta, etc).
Bandrange list
Choose what frequency band list will be used (see Setup: EEG bandranges… command)
Values
Choose what values to export:
Power (P)
– absolute power values.
Amplitude (A) – square root of absolute power values.
Percentage (%)– frequency band power as a percentage of total power
Coherence and Phase
Coherence
– the coherence (or average coherence for defined frequency band) will be
exported together with power spectra
Phase
– the phase spectra (or average phase for defined frequency band) will be
exported together with power spectra
Bandranges In Row
Check this option to arrange spectral parameters for each channel in a single line. Otherwise they
will be written in several lines.
Include Column Names
Check this option to add column names in the first row of the file. Column names can be useful,
for example, for data exported to Statistica software.
Include Row Names
Check this option to add row names in the first column of the file. Row names can be useful, for
example, for data exported to Statistica software.
File
Define full path for the file to export data to. Use the "..." to the right of the name field to choose
a drive and a folder.
Append To Existing File
Check this option to append data to an existing file otherwise the file will be rewritten. File
appending may be useful for arranging data from several investigations in an entire table for
further statistical analysis.
176
27. Export EEG Indices dialog
EEG indices export is used for saving data in a file readable by other applications.
Export EEG Indices
Defines what features of EEG indices are to be exported to an ASCII file:
Raw EEG indices
spectra
Writes raw EEG power spectra to an ASCII file. Columns correspond
to channels and rows - to frequencies: first line - 0.25 Hz, second 0.5 Hz The value in a cell means the percent of time when the EEG
contained half of waves of the given frequency band.
EEG indices for the
defined bandranges
Writes the table of parameters of EEG indices to an ASCII file.
Columns present channels and each line correspond to an EEG
frequency band (Delta, Theta, etc). The value in a cell means the
percent of time when the EEG contained half of waves of the given
frequency band.
File
Define full path for the file to export data to. Use the "..." to the right of the name field to choose
a drive and a folder.
28. Export EEG independent components parameters.
EEG independent components parameters export is used for saving data in a file readable by other
applications.
Folder pathname of independent components field displays the location of corresponding ICA files.
Use the Browse button to choose a drive and a folder.
Automatic excluding of components associated with artifacts fields group is used for definition of
parameters of eliminations components related to artifacts. Up to 6 different independent component
topography templates can be used simultaneously for detection artifacts. The additional parameters –
coefficient of similarity should be defined for each template.
Check Export first number of artifact free independent components only button to exclude low
power independent components. The number of components should be specified using Number of
components for export field.
177
Another criterion of excluding of low power components is the definition of total variance described
by component. This parameter can be entered in Percent of total variance described by first artifact
free components with maximal variance.
Parameters of components for output fields group is used for definition list of parameters. It
includes following fields:
Check Component topography button to export topographies table.
Check Equivalent dipole source button coordinates to export coordinates of dipole source equivalent
to component topography.
Check LORETA maximum localization button to export coordinates of maximum of equivalent
distribution of current density computed by LORETA method.
Check sLORETA maximum localization button to export coordinates of maximum of equivalent
distribution of current density computed by sLORETA method.
If sLORETA maximum localization button is checked the sLORETA transformation matrix
location should be specified. The Browse button to the right of the name field is used to choose a drive
and a folder
178
Check Power of component spectra for selected band range button to export the table of spectra
power for the list of frequency bands.
Check Percent of power of component spectra for selected band range button to export the table of
percents of spectra power for the list of frequency bands.
Use List of frequency bands menu to define appropriate list. (see Setup: EEG bandranges…
command)
The Volume areas for counting the number of components with corresponding dipole source
coordinates table can be used for definition up to 16 cubic areas (not implemented now).
The Output file name field is used to define full path for the file to export data to. Use the "Browse"
to the right of the name field to choose a drive and a folder.
29. Video file compression dialog
The following options allow you to specify how the video files should be compressed:
Video Compressor
Select appropriate video compressor from a list. The best choice in mane cases is “Microsoft
MPEG-4 Video Codec V1” or “Microsoft MPEG-4 Video Codec V3”
Audio Compressor
Select appropriate video compressor from a list. The best choice in mane cases is “MPEG
Layer-3”
Save audio output stream?
Check this button if you would like to keep audio signal in resulting video file.
Compressor properties
Select and modify compressor properties
Play source
Play back source video file
179
Play destination
Playback compressed or re-compressed video file. The raw video file will be compressed before
playing back function will be started. This option helps to choose the best compressor before
beginning the video compression procedure.
Stop
Stop playing back function
OK
Start video compression procedure.
Attention!!! Not all existing compressor from a list can be compatible with source video
files.
Attention!!! A number of compressors can unrecoverable decrease a quality of video
signal.
Attention!!! A number of compressors will take a lot of time to process the video data.
30. Print dialog
The following options allow you to specify how the document should be printed:
Printer
Select active printer and its connection. Choose Properties command to modify printer properties.
Properties
Call a dialog to define additional printer options.
Print Range
Specify the pages you want to print:
180
All
Selection
Pages
Prints the entire document.
Prints the currently selected text.
Prints the range of pages you specify in the From and To boxes.
Copies
Specify the number of copies you want to print for the above page range.
Collate
Prints copies in page number order, instead of separated multiple copies of each page.
31. Printing dialog
The Printing dialog box is shown during the time WinEEG is sending output to the printer. The page
number indicates progress of the printing task.
To abort printing, choose Cancel.
32. Page Setup dialog
You can define the following parameters for the page to be printed.
Paper:
Select appropriate paper Size and Source.
Orientation:
Select page orientation (Portrait or Landscape).
Margins:
181
Set margin size (in millimeters).
Printer...
Use the Printer... command to choose a printer and to set its options.
33. Print Setup dialog
The following options allow you to select the destination printer and its connection.
Printer
Select the printer you want to use.
Properties
Set additional printer options.
Paper:
Select appropriate paper Size and Source.
Orientation:
Select page orientation (Portrait or Landscape).
182
34. Stimuli Presentation Program List dialog
Use this dialog to choose a stimuli presentation protocol (program) for stimuli presentation in ERP
investigations or to modify the list of stimuli presentation programs. After a program is chosen EEG
acquisition starts with simultaneous stimuli presentation on an additional computer. ERPs can be
calculated for this EEG file during further processing. To learn more about ERP, see Event-Related
Potentials section.
Press the Update button to read a new stimuli presentation program list from a floppy if it was
recorded by means of the PSYTASK program that it is to be installed on. (See PSYTASK User
manual).
Press the Reread button to read a new file directly from the stimuli-presenting computer connected to
the EEG-acquiring computer by an additional cable between their COM ports. PSYTASK must run on
the stimuli-presenting computer in the slave mode. (Command line: PSYTASK /S).
Attention: If any parameter of stimuli presentation in the PSYTASK has been changed the stimuli
presentation program list should be updated, otherwise ERPs will be incorrectly calculated.
Turn on EEG recording
Check this option to start recording EEG to hard disk. If the option is unchecked the data will be only
acquired and monitored; this mode can be useful for testing a stimuli presentation protocol or for
training the patient.
35. Update task list from slave computer dialog
The dialog displays dynamics of reading task list from the presenting computer.
Press Cancel to stop reading the stimuli presentation program list. (The old list is not saved.)
183
36. Checking Impedance Of Electrodes
Depict impedance of electrodes by means of color. The color/impedance scale is shown on the right.
Attention! After every manipulation with electrodes, transients take 1-2 sec to reach a new
equilibrium.
37. Calibration Of Amplifiers dialog
Attention! Amplifiers are calibrated by manufacturer before metrological certification.
WinEEG user is only able to view calibration parameters, not to change them.
The following fields allow viewing the table of correction parameters.
Parameters:
Choose what parameter set to view.
Parameters Table:
Table of gains and offsets is placed under Parameters list.
184
38. Find dialog
Find What:
Define the string to be searched for.
Match Whole Word Only:
Check to find only whole words matching the Find What string.
Match Case:
Extends search criteria to include uppercase and lowercase attributes while searching for the
Find What string in the text.
Find Next:
Find next string matching the Find what one.
185
39. Find Events
The following options allow you to specify parameters of searching “Events” when the absolute
voltage of EEG signal is higher then defined threshold. If selected channel is “digital” channel the
voltage threshold is not used.
Channel
Select processed channel
Threshold
Select voltage threshold
Find Next:
Find next time interval of EEG record when absolute voltage of EEG signal of selected channel
was higher then defined threshold and display EEG waveforms in EEG window.
40. Replace dialog
Find What:
Define the string to be searched for.
Replace With:
Define the string to replace the one found.
Match Whole Word Only:
Check to find only whole words matching the Find What string.
Match Case:
Extend search criteria to include uppercase and lowercase attributes while searching for the
Find What string in the text.
Find Next:
Find next string matching the Find what one.
Replace:
Replaces the string found and resumes searching.
186
Replace All:
Finds and replaces all strings that match the Find What string.
41. Patient Card dialog
Fill or edit the patient card.
ID: EEG record ID is an arbitrary sequence up to 10 characters which simplifies searching the
database.
Date: The date of EEG acquisition start is entered automatically. Use DD/MM/YYYY date format for
successful database search by date.
Time: The date of EEG acquisition start is entered automatically. Use HH:MM:SS time format for
successful database search by time.
Investigation: Select investigation type from list:
1. EEG observation
2. Biofeedback
Patient: Enter patient's name.
Patient ID: Enter patient's card number.
Diagnosis: Enter a brief disease diagnosis. The final report may contain more detailed description.
Date of birth: Enter the date of patient's birth. Use DD/MM/YYYY date format for successful
database search.
Sex: Enter patient's sex (M/F)
Address: Enter patient's address.
187
Note: Enter other useful info (patient's insurance policy number for example).
All the fields of patient card are not mandatory but can be useful when searching database. Remember
that all patient info would be automatically added to the final report.
Sampling rate: The sampling rate of EEG digital recording is displayed in this field.
Record duration: The total recording time of whole file is displayed in this field.
42. Fragments List dialog
Choose a fragment and press OK or double-click the fragment name.
Click Delete to delete selected fragment from EEG file
Click Modify to change name of selected fragment. The Modify fragment name dialog will appears
then.
43. Modify fragment name dialog
Enter new fragment name and press OK.
188
44. Deleting of selected EEG fragment
Select what kind of data are you going to delete and press OK button.
45. Deleting of video data
Select what kind of data are you going to delete and press OK button.
189
46. Modify Trial Labels dialog
Trial list is there on the left of the dialog. Select trials to edit labels for. Click a trial to select it. Use
Shift and Ctrl keys to select multiple trials.
Press Select All button to select all trials in the file.
Press Set button to set a new label value for the trials selected. The new label value must be set
beforehand in the Value field of the Set group.
Press Replace button to replace all trial labels matching the value in the Old Value field with a new
value defined in the New Value field.
Press Load button to load trial labels from selected ASCII file.
Press Save button to save trial labels to selected ASCII file.
The last options allow also modify manually a structure of trial (a number of presented stimuli and
intra stimuli intervals).
190
47. Adjust trial synchronization using synchro impulse dialog
Use Synchro impulse channel list to select channel to which the synchronization signal is recorded
using special detector (for example, photodiode).
Use Impulse polarity group of fields to define the appropriate polarity of the synchronization signal.
Threshold: Enter appropriate voltage threshold to detect the beginning of synchronization impulses.
The threshold should be defined as low as in is possible but higher the amplifier or detector noise.
Attention! The synchronization signal should be recorded from first stimulus in the trail.
There is no way to adjust the beginnings of all stimuli in the trial except one.
191
48. Change signal polarity dialog
This function is useful if there is a priori reliable information then some signals were recorded
incorrect (for example due to incorrect installation of electrodes of their connection to amplifiers).
Select channel list in which the polarity should be inverted and press OK.
Attention! Please be very attentive using this function. Incorrect inversion of signal
polarity can lead to mistakes in processing results and their interpretation.
192
50. Open dialog trial list.
Specifies the name and location of the file you want to open.
Following additional information is necessary:
Trial duration (ms) – total duration of trials.
Baseline duration (ms) – the duration of prestimulus time interval
Trial beginning shift (ms) - the duration shift, if any shift exists between event and real beginning of
trial.
51. Font dialog
Define font parameters.
Font:
Choose font name from the list.
Font Style:
Choose font style (normal, italic, bold).
Size:
Choose font size.
Effects:
Check Underline and Strikeout options to set corresponding effects and choose font color.
193
Sample:
Display font sample.
Script:
Choose appropriate script (character set).
52. Paragraph dialog
Define paragraph format.
Indentation:
Left
Right
First line
Indent from left margin (cm)
Indent from right margin (cm)
First line indent from left edge of the paragraph(cm)
Alignment:
Choose paragraph alignment (left. right or centered).
47. Final Report Template List
194
Display list of templates for final reports. Choose the template you need and double-click its name or
press OK.
195
53. Parameters Of signals dialog
The table displayed in this window includes the next columns:
Channel – channel names
Amplitude –amplitude from pick to pick for signal of each channel and for selected by vertical
markers time interval
Frequency – an approximate frequency of signals.
Difference – a difference of voltages for selected by vertical markers EEG samples.
Extrema – the minimal and maximal values of amplitude are marked in this column.
Press Insert into report button into insert this table in text of report. A usage of MS Word is
recommended.
196
54. Parameters Of EEG Indices Computation dialog
The basic definitions and algorithms are described in EEG Indices section. Here only processing
parameters are listed.
Interval
Define the EEG interval to be processed.
Interval between two vertical markers
Selection
Fragment selected from the list
Fragment
The whole file
Full EEG file
Method
Choose an algorithm for EEG indices calculation.
Select half of waves by base line cross points
Use Zero Crossings
Select half of waves between a local minimum
Use Local Extrema
and its adjacent maximum or a maximum and its
adjacent minimum
Detection threshold
Define half of wave detection threshold to filter noise.
Thresholds will be calculated for each separate
% of Standard Deviation
channel from standard signal deviation.
One common threshold is set for all channels (in
Absolute (uV)
uV).
197
55. Parameters Of EEG Spectra Computation dialog
The basic definitions and algorithms are described in EEG Spectra section. Here only processing
parameters are listed.
Time Interval
Define EEG interval to be processed.
Process interval between two vertical markers
Selection
Process fragment selected from the list
Fragment
Process the whole file
Full EEG file
Check Average defined epoch number only button to compute the spectra and coherence with strong
equal averaged epoch number. This option is extremely useful for analysis of EEG coherence because.
198
Epoch number: Specify number of epoch for averaging.
Channels
Define a sunset of channels to be processed.
Epoch Length
Select epoch length for analysis. Spectrum step is derived from epoch length:
1 Hz spectrum step.
1 second
0.5 Hz spectrum step.
2 seconds
0.25 Hz spectrum step.
4 seconds
0.125 Hz spectrum step.
8 seconds
0.0625 Hz spectrum step.
16 seconds
0.03125 Hz spectrum step.
32 seconds
0.015625 Hz spectrum step.
64 секунды
Overlapping
50 %
None
Choose this option if a non-square time window is used
Choose this option if a square time window is used
Time window
Choose time window type. Time windows are used to suppress side lobe infiltration by
smoothing a source realization (epoch) to decrease sharp variations in its initial and final
intervals.
w[j] = 1
Square
w[j] = 1 – abs( ( j – 0.5 N ) / 0.5 N)
Bartlett
w[j] = 0.5 ( 1 – cos ( 6.28 j / N ) )
Hanning
w[j] = 1 – ( ( j – 0.5 N ) / 0.5 N) ( ( j – 0.5 N ) / 0.5 N)
Welch
Upper spectra frequency
Choose upper spectra frequency (their length)
Artifact elimination
Check options to define types of artifacts to be eliminated.
Polynomial trend is estimated for each epoch and each channel and
Polynomial trends
eliminated from source signal
Additional parameter: polynomial order
Epochs with too large slow-wave signal component (cause by eye
Slow waves
motion or other artifact) are eliminated from averaging.
Additional parameters: 1) maximal allowed slow-wave power, 2)
frequency band to be treated as slow-wave.
Bispectra
Check this option to compute bispectra and bicoherence
Additional Processing
None
Spectra Dynamics
Calculate
Coherence
Calculate Phase
Calculate only average EEG spectra.
Calculate spectra dynamics together with average spectra. The
Averaging parameter is used to define how many successive epochs
to average when calculating dynamics.
Calculate EEG coherence for each pair of channels together with
average power spectra.
Calculate EEG coherence and EEG phase spectra for each pair of
199
Spectra
Keep raw spectra
channels together with average power spectra.
Save raw (not averaged) spectra in resulting file. This option allows
do more accurate estimation of power spectra parameters, their
confidence levels and statistical significance of differences during
comparison.
Press Load button to read parameter values from a file.
Press Save button to save current parameter values to a file.
Load from database
Press this button to load standard parameters of spectra computation compatible with normative
database.
To define correct parameters press button Load from database and select corresponding
condition from the list of conditions.
200
56. Parameters Of EEG Auto and Cross-correlation Computation dialog
Time Interval
Define EEG interval to be processed.
Process interval between two vertical markers
Selection
Process fragment selected from the list
Fragment
Process the whole file
Full EEG file
Channels
Define a sunset of channels to be processed.
Epoch Length
Select epoch length for analysis. Maximal lag is half of epoch length:
Maximal lag - ±512 ms.
1 second
Maximal lag - ±1024 ms
2 seconds
Maximal lag - ±2048 ms
4 seconds
Maximal lag - ±4096 ms.
8 seconds
Maximal lag - ±8192 ms.
16 seconds
Maximal lag - ±16384 ms
32 seconds
Maximal lag - ±32768 ms
64 секунды
Artifact elimination
Check options to define types of artifacts to be eliminated.
Polynomial trend is estimated for each epoch and each channel and
Polynomial trends
201
Slow waves
eliminated from source signal
Additional parameter: polynomial order
Epochs with too large slow-wave signal component (cause by eye
motion or other artifact) are eliminated from averaging.
Additional parameters: 1) maximal allowed slow-wave power, 2)
frequency band to be treated as slow-wave.
56. Nonlinear analysis parameters dialog
Attention! This window helps to define parameters of nonlinear analysis and run processing
utilities. The nonlinear analysis is optional function and can be ordered separately by special
order together with description of this window.
202
58. Spike detection dialog
Source data for detection algorithm fields define what kind of data will be used for searching of
spike like waves using amplitude-temporal parameters of waves. The source data can be Raw EEG or
independent components of multi-channel EEG signal (ICA components). In last case the additional
parameter Minimal duration of epoch will be used to divide whole EEG file on separated epochs.
Amplitude-temporal parameters fields define limitation for corresponding parameters values using
during searching of spike like waves. Amplitude-temporal parameters are the following:
1. Duration 1, defined as the time interval between two successive
maxima or minima of an EEG wave (Dur1).
2. Duration 2, defined as the time interval between two successive
inflection points (i.e. points where the absolute value of the first
time derivative of the wave form has a maximum value) of an
EEG wave (Dur2).
203
3. Duration A, defined as the time interval between the beginning and the pick of an EEG wave
(DurA).
4. Duration B, defined as the time interval between the pick and the end of an EEG wave (DurB).
5. Amplitude A, measured from the beginning to the pick of EEG wave (AmpA).
6. Amplitude B, measured from the pick to the end of EEG wave (AmpB).
7. Amplitude, measured from the baseline (zero-voltage) to the pick of EEG wave (AmpZ).
8. Slope 1, defined as the maximum magnitude of the first time-derivative during the leading edge
of an EEG wave (Sl1).
9. Slope 2, defined as the maximum magnitude of the first time-derivative during the trailing edge
of an EEG wave (Sl2).
10. Sharpness, defined as the second time derivative of an EEG wave at its pick ) (d2P/d2t).
Dipole and spatial parameters fields define a usage and limitation for corresponding parameters
values using during searching of spike like waves. Dipole and spatial parameters are the following:
1. Use dipole parameters – if this button is checked the dipole source parameters will be used in
spike detection algorithm
2. Use relative residual energy fields define a usage and limitation of this parameter.
3. Use dipole eccentricity fields define a usage and limitation of this parameter.
4. Use SVD before dipole estimation field define will singular value decomposition of multichannel EEG data will be performed before dipole source localization procedure will be
applied or not. If this button checked the topography of first component will be used as source
data for dipole source localization procedure.
Attention! Is the source data are independent components the singular value
decomposition is not performed.
5. Epoch duration for SVD field defines duration of time interval corresponding to spike wave
for which the multi-channel EEG data is used as source data for singular value decomposition.
The time interval is selected so that the pick of spike places at center of interval.
6. Use relative fraction of total energy of first component fields to define a usage and
limitation of this parameter.
7. Use "spikeness" of component [(Smax*Smax)/sum(S*S)/N] fields define a usage and
limitation of this parameter. The "spikeness" is computed according following formula:
(Smax*Smax) / sum(S*S) / N
Where Smax – maximal value of signal in the first component, sum(S*S) – total energy of first
component and N – number of samples in epoch.
Eye blink artifact parameters fields define a usage and limitation for corresponding parameters
values using during searching and elimination of eye blink artifacts. The set of eye blink artifact
parameters are the following:
1. Remove eye blinks define a usage of eye blink artifact detection procedure.
2. Dipole location Y coordinates > and Dipole location Y coordinates > fields define an
appropriate values of Y and Z coordinates of dipole source of eye blink artifact wave.
3. Dipole eccentricity (ECC) > field defines an appropriate value of eccentricity of dipole source
of eye blink artifact wave.
4. Polarity field defines a polarity of eye blink artifact wave.
5. Waveform duration (ms) > field defines minimal duration of eye blink artifact wave.
204
Attention! Both monopolar and bipolar montages could be used for EEG to which automated
spike detection is applied. But dipole source parameters will be not estimated for EEG at
bipolar montage.
59. Averaged spikes calculation dialog
Time Interval
Define EEG interval to be processed.
Process interval between two vertical markers
Selection
Process fragment selected from the list
Fragment
Process the whole file
Full EEG file
Duration Of Base Line Time Interval (ms) - set the duration of interval used for base line estimation
(before spike pick).
Duration of poststimulus interval (ms) - set the duration of the interval after spike pick.
Calculate Statistical Significance - check this option to calculate statistical significance of difference
of spike wave from baseline. The Student criterion is used to estimate statistical significance.
205
60. EOG Rejection dialog
EOG Channel
Choose appropriate EOG channel from list.
Polarity
Choose Positive or Negative polarity for first EOG extreme caused by blinking.
Threshold (uV)
Set threshold value for detecting EOG signal caused by blinking.
Duration (ms)
Set average duration for EOG signal caused by blinking.
Press Reset button to undo previous EOG rejection.
206
61. Search and rejection artifacts dialog
This dialog allows specify parameters of automatically detection of parts of EEG record including
artifacts signals and mark corresponding time intervals. The detection bases on threshold comparison
of absolute voltage of EEG signal and amplitude of show and fast waves with defined thresholds.
Channels
Select channels which signals will be used for processing
Voltage Threshold Condition
Check this button if you would like to use voltage criteria and select appropriate threshold
(Level).
Slow Waves
Check this button if you would like to use slow wave amplitude criteria and select appropriate
threshold (Amplitude) and frequency band (Frequency from… to)
Fast Waves
Check this button if you would like to use fast wave amplitude criteria and select appropriate
threshold (Amplitude) and frequency band (Frequency from… to)
Clear previous set of artifacts intervals
Check this button if you would like to restore all previously marked time intervals.
Clear all
Press this button if you would like to restore all previously marked time intervals.
207
Load from database
Press this button to define default parameters used in normative database.
OK
Press this button to start processing of data using specified parameters.
62. Spatial Filter Parameters Estimation dialogue
The raw (unfiltered) EEG waveforms are displayed on Raw EEG plot.
The Corrected (filtered) EEG waveforms are displayed on Corrected EEG plot.
The pure artifacts (filtered artifacts) waveforms are displayed on Excluded Artifacts plot.
The waveforms of EEG signal components are displayed on EEG components plot. The amplitudes
of these components are printed right to the waveforms.
The topographies of EEG signal components are displayed by Topographies maps.
The Scroll bar is used to change the beginning time point for all mentioned above waveforms.
The buttons Gain “+” and “-” are used to change vertical scale (sensitivity) for all waveforms.
208
The buttons Speed “+” and “-” are used to change horizontal scale (speed) for all waveforms.
The group of buttons Method is used for selection of EEG signal decomposition.
1. PCA method using singular value decomposition (SVD) and
2. ICA (independent component analysis) method can be used for this goal.
The button Invert filter allows estimate spatial filter so that Corrected EEG and Excluded Artifacts
will be flipped. This possibility allows separate clean EEG component waveforms from mix of
components in raw EEG for the future processing.
Click on Map of topographies to include (exclude) it to (from) the data set used for spatial filter
estimation.
Click Save topographies button to store the selected topographies to ASCII test file.
Attention! The algorithm of artifacts correction is not ideal. That is why the visual inspection
of results of correction is necessary. If the results are not satisfied another time interval
should be selected and analyzed.
63. Artifact correction using standard component topographies as templates dialogue
Use Fragment list to select EEG fragment that will be used for estimation of spatial filter.
209
Use First word delimiter list to select delimiter of first word in fragment name. This option is very
useful if EEG recordings have different names of fragments but there is a common part at the
beginning of one.
The topographies of components are placed below. Check only those topographies for which
corresponding components will be cleared for artifact correction.
Similarity: specify the value of similarity for used topographies. If all components have similarity of
their topographies with template are lower this value WinEEG will report an error of processing.
Component number: define number of components with maximal power that will be used for search
of maximally similar to template. This parameter helps to exclude the components with small power
from the consideration.
There is a possibility to add manually own unique topographies into list to extend the possibility of this
function. The list of topographies templates is stored in file with name TopEng.cfg. The example of
content of similar file is presented below:
"Моргание глаз 1, референт - объединенные уши, 19 каналов"
Fp1-Ref Fp2-Ref F7-Ref F3-Ref Fz-Ref F4-Ref F8-Ref T3-Ref C3-Ref Cz-Ref C4-Ref T4-Ref T5-Ref P3-Ref Pz-Ref P4-Ref T6-Ref O1-Ref O2-Ref
0.9539 0.9312 0.0405 0.0222 0.1812 0.0383 -0.0842 -0.2245 -0.1529 -0.1550 -0.1611 -0.2318 -0.1815 -0.1404 -0.1451 -0.1497 -0.1733 -0.1536 -0.1647
0.8 5
"Моргание глаз 1, средний референт, 19 каналов"
Fp1-Av Fp2-Av F7-Av F3-Av Fz-Av F4-Av F8-Av T3-Av C3-Av Cz-Av C4-Av T4-Av T5-Av P3-Av Pz-Av P4-Av T6-Av O1-Av O2-Av
1.0530 0.9975 0.4066 0.0717 0.0979 0.0518 0.0650 -0.2405 -0.1508 -0.1461 -0.1481 -0.2091 -0.2983 -0.2314 -0.2187 -0.2228 -0.2684 -0.3023 -0.3069
0.8 5
Each component template is described by four consequent lines:
1. First line – text name of topographies that will displayed in dialog window.
2. Second line – list of channel names (in dependence on used montage). The names include the
reference names also to have a possibility to use separate topographies for different referents.
3. Third line – weights for each electrode in topographies
4. Forth line – default values of Similarity and Component number parameters.
Attention! Be very attentive modifying content of TopEng.cfg file. Incorrect modification
of this file can fail this function.
210
64. Parameters For Evoked Potential Computation dialog
Time Interval
Define EEG interval to be processed.
Process interval between two vertical markers
Selection
Process fragment selected from the list
Fragment
Process
the whole file, calculating ERPs for each fragment
Full EEG file with
separate processing separately
for each fragment
Process the whole file
Full EEG file
Duration Of Base Line Time Interval (ms) - set the duration of interval used for base line estimation.
Duration of poststimulus interval (ms) - set the duration of the poststimulus interval.
Artifact elimination parameters - set Threshold in uV and choose which Channels to process. You
can choose one of the following values for the Channel parameter: All, Only EEG channels, or
Only Bio channels. An EEG interval (a trial) is treated as artifact if an ERP absolute value for
any channel and for any bin exceeds the threshold.
Calculate Differences of Waveforms - check this option to calculate differential ERPs if Full EEG
file with separate processing for each fragment time interval option is chosen.
Calculate Statistical Significance - check this option to calculate statistical significance of ERP
difference from baseline (separately for each ERP or differential ERP and for each bin or for
each pair of bins taken to calculate differential signal). The Student criterion is used to estimate
statistical significance.
211
65. Parameters for Event-Related Potential Computation dialog
To calculate ERPs, additional information on stimuli presentation structure in each trial is used
together with source data. To group trials by stimuli types or by response task, trial labels are used.
These parameters are defined beforehand when creating (editing) stimuli presentation protocols by
means of PSYTASK program installed on the presenting computer.
Groups Of Trials
The table defines context names for trial groups (Name fields) and corresponding trial label lists
(Labels fields). Up to 8 different trial groups can be defined. For each trial group, a label list is
defined (label values in the list are separated by commas: 1, 2, 5, 9…). The same trial label value
may be used in several different trial groups. For groups with empty label lists ERP would not be
calculated.
On the right side of the table there are fields for displaying statistical results of trial grouping,
artifact analysis and response processing. The Correct fields show number of trials in each
group when the patient performed the task correctly. The Incorrect fields show number of trials
when the patient performed the task incorrectly.
Task performing correctness is controlled by monitoring button states according to Subject
Response Processing parameters. Number of trials treated as artifact is displayed in the Artifact
fields.
212
Group Differences
This field defines a list of trial group pairs for calculating differential ERPs. Group pairs are
separated by commas. Group numbers in a pair are separated by a hyphen (a minus sign). Press
Choose button to choose group pairs (see Choose Group Differences dialog.)
Artifact Processing
The following parameters are used for automatic artifact analysis and elimination:
Level - set threshold value (in uV). An EEG interval (a trial) is treated as artifact if an ERP
absolute value for any channel and for any bin exceeds Level value.
Channels - define channels to be processed for artifact analysis. Possible options are:
All - process all channels
Only EEG - process only EEG channels
Only Bio - process only Bio channels
Table - the defined channel table is used and Level value is ignored
Don't Reject - artifacts are not eliminated
Use the “Threshold for channels” button to define a list of channels to be processed and
individual threshold values for artifact analysis. This button calls Artifact Rejection Thresholds
dialog.
Synchronization
Several stimuli are allowed to be presented during one trial. Also, pre- and poststimulus intervals
may change from trial to trial even if trials belong to one averaging group. In this case it is
necessary to set additional parameters to synchronize trials correctly when averaging them.
Moreover, some tasks may need analyzing ERPs preceding the response reaction.
Type - select trial synchronization type:
Stimulus - standard trial synchronization for ERP calculation
Button - trials are synchronized by the start of response reaction, i.e. by the moments
when the patient's finger presses the button.
Spike – trials are ignored. Averaged sweeps are selected using spike detection
information. Subject response is not processed.
Stimulus - set the synchronizing stimulus number for Stimulus trial synchronization
Button Channel - set the number of the channel acquiring button signal for Button
synchronization
Attention! There are different modifications of buttons: simple button – one level button,
advanced button – two levels button and digital button. Setting of button channel depends
on what type of button was used. “Any level” signal should be used for simple button.
Both “Low level” and “High level” signal can be used for advanced button if the subject
press both key during investigation. The digital inputs (“Dig1”, “Dig2”…) should be used
for digital button.
Subject Response Processing
Press Define button to define or to modify parameters for subject response processing. The
Subject Response Processing Parameters dialog will appear.
Compression
The parameter is set in time readouts (N) and defines decrease of source EEG sampling
frequency for ERP calculation. A trial is divided into equal non-overlapping time intervals (N
213
time readouts long) and average potential value is calculated for each interval. The result trial
will have N times less time readouts than the source one.
Time Interval Before (ms)
If the parameter value exceeds zero and the interval from the trial beginning till the
synchronizing stimulus (see above) exceeds this value, resulting trial will be shortened from its
start.
Time Interval After (ms)
If the parameter value exceeds zero and the interval from the trial beginning till the
synchronizing stimulus (see above) exceeds this value, resulting trial will be shortened from its
end.
Calculate Statistical Significance
Check this option to calculate statistical significance of ERP difference from baseline (separately
for each ERP or differential ERP and for each time read out or for each pair of readouts taken to
calculate differential signal). The Student criterion is used to estimate statistical significance.
Use as Default
Check this option to have the current parameter values saved and then used for next EEG file
processing.
Press Load button to read parameter values from a file.
Press Save button to save current parameter values to a file.
214
Load from database
Press this button to load standard parameters of spectra computation compatible with normative
database.
To define correct parameters press button Load from database and select corresponding
condition from the list of conditions.
66. Parameters For Event-Related De-synchronization Computation dialog
To calculate ERD, additional information on stimuli presentation structure in each trial is used together
with source data. To group trials by stimuli types or by response task, trial labels are used. These
parameters are defined beforehand when creating (editing) stimuli presentation protocols by means of
PSYTASK program installed on the presenting computer.
Many fields of this dialog are similar to those of Parameters for Event-Related Potential
Computation dialog. So, additional fields are described below only.
Smoothing - this parameter is set in time readouts (N) and defines filter (sliding average) width for
ERD curve smoothing for each separate trial before averaging.
Method - defines method for ERD computation:
Squared Amplitude
Signal power is defined as square of EEG value.
215
Envelope
Signal envelope is computed by means of Gilbert transformation before power calculation.
Subtract ERP from raw EEG
If this option is checked then before calculating EEG oscillation power ERPs will be subtracted
from source data to eliminate their effect and only "induced" activity will remain.
Normalize Each Trial
If this option is unchecked average signal power dynamics is calculated over all trials and then
normalized by average signal power value for prestimulus interval. Otherwise each trial is
normalized separately.
Attention!!! Check this option only if prestimulus intervals and intervals between trials are
long enough (not less than one second). Otherwise prestimulus signal power variance will be
very big and may significantly distort ERD dynamics.
67. Parameters For Event-Related Coherence Computation dialogue
To calculate ERCoh, additional information on stimuli presentation structure in each trial is used
together with source data. To group trials by stimuli types or by response task, trial labels are used.
These parameters are defined beforehand when creating (editing) stimuli presentation protocols by
means of PSYTASK program installed on the presenting computer.
Many fields of this dialog are similar to those of Parameters for Event-Related Potential
Computation dialog. So, only additional fields are described below.
Channel List
216
Define a list of channel pairs to be processed (not more than 24 pairs).
Frequency
This group defines harmonic signal frequency for which the EEG event-related coherence will be
calculated.
Epoch - sets width of sliding window used for ERCoh calculation
Frequency - defines the harmonic
68. Wavelet Decomposition dialog
To perform wavelet decomposition, additional information on stimuli presentation structure in each
trial is used together with source data. To group trials by stimuli types, or by response task, trial labels
are used. These parameters are defined beforehand when creating (editing) stimuli presentation
protocols by means of PSYTASK program installed on the presenting computer.
Many fields of this dialog are similar to those of Parameters for Event-Related Potential
Computation dialog. So only the additional fields are described below.
Frequency From, Frequency To
Choose two values defining frequency range for wavelet decomposition
Step
Choose step for calculations within a certain frequency range
Wavelet Width
217
Choose wavelet width in the time domain. Wavelet width can be set in absolute units (ms) or in
cycles. Cycles mean different absolute wavelet width for each frequency. On the other hand, in
this case resolution will change proportionally for time and frequency domains. Special papers
recommend the value of 5 cycles for this parameter. But each case may require a different
specific value for this parameter.
Smoothing
This parameter is set in time readouts (N) and defines filter (sliding average) width for ERD
curve smoothing for each separate trial, prior to averaging.
Subtract ERP from raw EEG
If this option is checked then before calculating EEG oscillation power ERPs will be subtracted
from source data to eliminate their effect and only "induced" activity will remain.
69. Wavelet Coherence dialog
To perform wavelet coherence calculation, additional information on stimuli presentation structure in
each trial is used together with source data. To group trials by stimuli types, or by response task, trial
labels are used. These parameters are defined beforehand when creating (editing) stimuli presentation
protocols by means of PSYTASK program installed on the presenting computer.
This dialog box works similar as described in previous chapter. But user should also specify a list of
channel pairs to which wavelet coherence should be compute.
218
70. Choose Group Differences dialog
Define trial group pairs for calculating differential ERPs.
Press Select All button to choose all group pairs.
Press Deselect All button to deselect all group pairs.
Attention!!! Total number of (trial groups + trial group pairs) may not exceed 32. Therefore
if there are, for example, 8 context groups, then not more than 24 trial group pairs can be
selected.
219
71. Artifact Rejection Thresholds dialog
Check the channels that will be tested for artifacts and define an individual threshold value for each of
these channels.
72. Subject Response Processing Parameters dialog
You will need to define the following parameters for button processing:
220
1. Check Groups for which response reactions will be calculated.
2. For each of the trial groups, set the ordinal number of the Stimulus relative to which reaction time
will be calculated.
3. Set the allowed Time Interval for reaction time values in milliseconds.
4. Define reaction type for Left, Right or both buttons.
One of the following reaction types can be chosen:
No - don't analyze signal from the button
Press - patient must press the button in response to stimulus presentation. Average reaction time,
number of correct trials and number of errors will be determined during processing. A trial
is treated as an error if the patient did not press the button, or pressed it more than once, or
pressed it not within the time interval that had been defined.
Don't Press - patient must not press the button in response to stimulus presentation. Correct
trials and errors (false alarms, or commissions) are counted during processing.
5. Choose a Channel for each registered.
Attention! There are different modifications of buttons: simple button – one level button,
advanced button – two levels button and digital button. Setting of button channel depends on
what type of button was used. “Any level” signal should be used for simple button. Both “Low
level” and “High level” signal can be used for advanced button if the subject press both key
during investigation. The digital inputs (“Dig1”, “Dig2”…) should be used for digital button.
6. Choose the agreement concerning multiple subject responses during specified processing time
interval. (Consider multiple response as group of fields)
One of the following options can be chosen:
Commission error – all subject responses during specified processing time interval will be
considered as commission errors.
Correct response – all subject responses during specified processing time interval will be
considered as correct subject response.
Press Reset to reset default parameters.
Press Cancel to cancel response processing.
Note. Response processing results can be viewed in Results Of Averaging And Subject Response
Processing dialog called by Analysis: Group Info... command (in an ERP window.)
221
73. Parameters of ICA spectra calculation dialog
Channels
Select the channels which signals you wish to process. Use Add, Delete, Select All and Deselect
All buttons.
Time Interval
Define EEG interval to be processed.
Process interval between two vertical markers
Selection
Process fragment selected from the list
Fragment
Process the whole file
Full EEG file
Epoch Length
Select epoch length for analysis. Spectrum step is derived from epoch length:
1 Hz spectrum step.
1 second
0.5 Hz spectrum step.
2 seconds
0.25 Hz spectrum step.
4 seconds
0.125 Hz spectrum step.
8 seconds
0.0625 Hz spectrum step.
16 seconds
0.03125 Hz spectrum step.
32 seconds
0.015625 Hz spectrum step.
64 секунды
222
Overlapping
50 %
None
Choose this option if a non-square time window is used
Choose this option if a square time window is used
Time window
Choose time window type. Time windows are used to suppress side lobe infiltration by
smoothing a source realization (epoch) to decrease sharp variations in its initial and final
intervals.
w[j] = 1
Square
w[j] = 1 – abs( ( j – 0.5 N ) / 0.5 N)
Bartlett
w[j] = 0.5 ( 1 – cos ( 6.28 j / N ) )
Hanning
w[j] = 1 – ( ( j – 0.5 N ) / 0.5 N) ( ( j – 0.5 N ) / 0.5 N)
Welch
Upper spectra frequency
Choose upper spectra frequency (their length)
Artifact elimination
Check options to define types of artifacts to be eliminated.
Polynomial trend is estimated for each epoch and each channel and
Polynomial trends
eliminated from source signal
Additional parameter: polynomial order
Epochs with too large slow-wave signal component (cause by eye
Slow waves
motion or other artifact) are eliminated from averaging.
Additional parameters: 1) maximal allowed slow-wave power, 2)
frequency band to be treated as slow-wave.
223
74. Parameters of ERP ICA spectra dialog
Channels
Select the channels which signals you wish to process. Use Add, Delete, Select All and Deselect
All buttons.
Groups Of Trials
The table defines context names for trial groups (Name fields) and corresponding trial label lists
(Labels fields). Up to 8 different trial groups can be defined. For each trial group, a label list is
defined (label values in the list are separated by commas: 1, 2, 5, 9…). The same trial label value
may be used in several different trial groups. For groups with empty label lists ERP would not be
calculated.
On the right side of the table there are fields for displaying statistical results of trial grouping,
artifact analysis and response processing. The Correct fields show number of trials in each
group when the patient performed the task correctly. The Incorrect fields show number of trials
when the patient performed the task incorrectly.
Task performing correctness is controlled by monitoring button states according to Subject
Response Processing parameters. Number of trials treated as artifact is displayed in the Artifact
fields.
Artifact Processing
The following parameters are used for automatic artifact analysis and elimination:
224
Level - set threshold value (in uV). An EEG interval (a trial) is treated as artifact if an ERP
absolute value for any channel and for any bin exceeds Level value.
Channels - define channels to be processed for artifact analysis. Possible options are:
All - process all channels
Only EEG - process only EEG channels
Only Bio - process only Bio channels
Table - the defined channel table is used and Level value is ignored
Don't Reject - artifacts are not eliminated
Use the “Threshold for channels” button to define a list of channels to be processed and
individual threshold values for artifact analysis. This button calls Artifact Rejection Thresholds
dialog.
Synchronization
Several stimuli are allowed to be presented during one trial. Also, pre- and poststimulus intervals
may change from trial to trial even if trials belong to one averaging group. In this case it is
necessary to set additional parameters to synchronize trials correctly when averaging them.
Moreover, some tasks may need analyzing ERPs preceding the response reaction.
Type - select trial synchronization type:
Stimulus - standard trial synchronization for ERP calculation
Button - trials are synchronized by the start of response reaction, i.e. by the moments
when the patient's finger presses the button.
Spike – trials are ignored. Averaged sweeps are selected using spike detection
information. Subject response is not processed.
Stimulus - set the synchronizing stimulus number for Stimulus trial synchronization
Button Channel - set the number of the channel acquiring button signal for Button
synchronization
Attention! There are different modifications of buttons: simple button – one level button,
advanced button – two levels button and digital button. Setting of button channel depends
on what type of button was used. “Any level” signal should be used for simple button.
Both “Low level” and “High level” signal can be used for advanced button if the subject
press both key during investigation. The digital inputs (“Dig1”, “Dig2”…) should be used
for digital button.
Subject Response Processing
Press Define button to define or to modify parameters for subject response processing. The
Subject Response Processing Parameters dialog will appear.
Time Interval Before (ms)
If the parameter value exceeds zero and the interval from the trial beginning till the
synchronizing stimulus (see above) exceeds this value, resulting trial will be shortened from its
start.
Time Interval After (ms)
If the parameter value exceeds zero and the interval from the trial beginning till the
synchronizing stimulus (see above) exceeds this value, resulting trial will be shortened from its
end.
Press Load button to read parameter values from a file.
225
Press Save button to save current parameter values to a file.
75. Parameters of independent component analysis (ICA) dialog
Channels
Select the channels you wish to export ERP from. Use Add, Delete, Select All and Deselect All
buttons.
Groups
Select the trial groups for which you wish to export ERP. To select or to unselect all groups
quickly, use Select All and Deselect All buttons.
Time Interval
Set the time interval you wish to export data for. The following interval parameters need to be
set:
From: - sets the starting point. You can start at the very beginning of the trial or at the moment
when one of the stimuli is presented.
From (ms): - sets the beginning of the interval to export (in relation to the starting point).
To (ms): - sets the end of the interval to export (in relation to the starting point).
226
Baseline correction
Specify parameters for baseline correction:
To left from: Define stimulus before time interval will be chosen for estimation of baseline
average potential.
Length: Define length if time interval used for estimation of baseline average potential.
Attention!!! These parameters are not used in this version of program.
Frequency band:
Specify frequency band for which average power or coherence will be calculated.
76. Parameters of ICA Spectra calculation for selected group of observations dialog
Channels
Select the channels which signals you wish to process. Use Add, Delete, Select All and Deselect
All buttons.
227
Time Interval
Define EEG interval to be processed.
Process fragment selected from the list
Fragment
Process the whole file
Whole EEG file
First word delimiter
Use this list to select delimiter of first word in fragment name. This option is very useful if EEG
recordings have different names of fragments but there is a common part at the beginning of one.
Beginning interval length
Define maximal duration of artifact free EEG record for each selected file included in estimation
of component topographies matrix (see above). This parameter should not be very large because
computational time and computer memory consumption problems can occur.
Epoch Length
Select epoch length for analysis. Spectrum step is derived from epoch length:
1 Hz spectrum step.
1 second
0.5 Hz spectrum step.
2 seconds
0.25 Hz spectrum step.
4 seconds
0.125 Hz spectrum step.
8 seconds
0.0625 Hz spectrum step.
16 seconds
0.03125 Hz spectrum step.
32 seconds
0.015625 Hz spectrum step.
64 секунды
Overlapping
50 %
None
Choose this option if a non-square time window is used
Choose this option if a square time window is used
Time window
Choose time window type. Time windows are used to suppress side lobe infiltration by
smoothing a source realization (epoch) to decrease sharp variations in its initial and final
intervals.
w[j] = 1
Square
w[j] = 1 – abs( ( j – 0.5 N ) / 0.5 N)
Bartlett
w[j] = 0.5 ( 1 – cos ( 6.28 j / N ) )
Hanning
w[j] = 1 – ( ( j – 0.5 N ) / 0.5 N) ( ( j – 0.5 N ) / 0.5 N)
Welch
Upper spectra frequency
Choose upper spectra frequency (their length)
Minimal number of averaged epochs
Define this parameter to automatically exclude EEG recordings with large amount of artifacts from future
analysis.
228
77. Select List Of Channels dialog
Select channels to be depicted by graphs or maps in an ERP Window.
Use Select All and Deselect All buttons to select or to deselect all channels.
229
78. Results Of Averaging And Subject Response Processing dialog
The table of ERP averaging results consists of the following columns:
Group Name - group names; can be edited.
Total - total number of trials of the given group in the source EEG data (as result of trial label sorting).
Averaged - number of trials used to average ERPs. This value is obtained as result of subtracting
Artifact, Omission and Commission values from the Total value (for the given group).
Error - number of trials when the patient pressed incorrect button
Omission - number of trials when the patient should press the button in response to the stimulus but
didn't do it.
Commission - number of trials when the patient should ignore the stimulus but pressed the button
instead.
Artifacts - number of artifact trials.
RT1 - mean reaction time for the "1st" button.
RT2 - mean reaction time for the "2nd" button.
var(RT1) - mean square variation of reaction time for the "1st" button.
var(RT2) - mean square variation of reaction time for the "2nd" button.
230
79. List of channel pairs and parameters for EEG coherence and EEG cross-correlations dialog
Channel pairs of file – list of existing channel pairs. Select channel pairs that will be added into one
of tree channel pairs list.
First list, Second list and Third list – Three independent lists of channel pairs.
Not used, All pairs and Selected pairs radio buttons defines using mode if each channel pairs list.
Add buttons – Press this button to add selected in left list pairs into corresponding list of pairs.
Delete button - Press this button to delete selected pairs from corresponding list of pairs.
Three sets of buttons and fields Coherence levels, Coherence differences levels and Crosscorrelation levels helps to define thresholds, curves style and curves colors using by interaction
diagrams displaying procedure.
231
80. Parameters of averaging groups dialog
This dialog window allows select a list of groups for displaying them in ICA window.
The additional possibility is to define colors and line style for graphics.
Finally there is a possibility to rearrange the data and define new averaging groups. The new group
names and trial number should be defined.
Attention!!! The sum of trials for all newly defined groups should be equals the total number
of trials in the file.
232
81. Select averaging groups for displaying dialog
This dialog window allows select a list of groups for displaying them in ICA window.
The additional possibility is to define colors and line style for graphics.
82. Define graphs scale dialog
By default independent components graphs have individual vertical scale. This dialog allows define
common scale for all graphs with specific value. Graphs vertical scale fields group provides these
changes.
By default whole duration of independent components time interval is displayed. The Graphs
horizontal scale fields group allows set to display only beginning time interval with specified duration
233
83. Correct graphs baseline dialog
By default no baseline correction is performed. For ICA ERP it is useful to make baseline correction if
prestimulus time interval exists. This dialog allows specify the duration of baseline time interval.
84. Select components for filter dialog
Check the components using for spatial filter computing.
Type of filter:
Specify type of spatial filter that will be computed:
Suppressing – Compute spatial filter that will suppress selected components from raw multichannel EEG or ERP.
234
Revealing - Compute spatial filter that will reveal selected components from raw multi-channel
EEG or ERP.
Computation method:
Specify method for spatial filter computation
Clearing of component topographies - Compute spatial filter by clearing unchecked
component topographies
Pseudo inversion of component topographies - Compute spatial filter by Moore-Penrose
pseudo inversion of rectangular (not squared) matrix of checked component topographies.
File:
Define output file name
85. Component name dialog
Enter new name for selected component.
86. Export of parameters of independent component dialog
Specify the parameters for export
Time Interval
Set the time interval you wish to export data for. The following interval parameters need to be
set:
From stimulus: - sets the starting point. You can start at the very beginning of the trial or at the
moment when one of the stimuli is presented.
From (ms): - sets the beginning of the interval to export (in relation to the starting point).
235
Baseline correction
Specify parameters for baseline correction:
To left from: Define stimulus before time interval will be chosen for estimation of baseline
average potential.
Length: Define length if time interval used for estimation of baseline average potential.
File:
Define output file name
Add to existing file
Check this option to append data to an existing file otherwise the file will be rewritten. File
appending may be useful for arranging data of several investigations in an entire table for further
statistical analysis.
The output file consists of four columns:
1. First column – order number of trial.
2. Second – order number of averaging group.
3. Third – average value for selected time interval
4. Fourth – Latency of pick in selected time interval
Attention!!! There is no way to determine the pick latency in selected time interval
absolutely exact for each trial due to a different kind of noise. Please check output data
attentively and try to determine pick latency manually for incorrect output results.
86. Export of spectrum parameters of independent component dialog
Specify the parameters for export
Bandrange list
Choose what frequency band list will be used (see Setup: EEG bandranges… command)
Values
236
Choose what values to export:
Power (P)
– absolute power values.
Amplitude (A) – square root of absolute power values.
Percentage (%)– frequency band power as a percentage of total power
Label
Specify “label” for exporting data
File:
Define output file name
Add to existing file
Check this option to append data to an existing file otherwise the file will be rewritten. File
appending may be useful for arranging data of several investigations in an entire table for further
statistical analysis.
87. Processing results comparison dialog
Select spectra, ERP or ERP from the left and right list for comparison.
Press button Load Database to load a list of processing results included in normative database.
Press button OK to compute the differences between spectra (ERP or ERD) and open corresponding
Spectra (ERP or ERD) window.
88. Insert tables of spectra parameters dialog
237
Select type of tables and maps while you would like to insert into MS Word. The result of this function
is placed below:
Name: Schindler Michael
Date of observation: 17/04/2003
Total epoch number: 76
Time interval duration: 181.472 s
Average power of spectra (uV^2)
Delta
Theta
Alfa
Beta1
Beta2
Gamma
Total
Fp1-AvW
1.78 : 0.20
1.25 : 0.11
1.09 : 0.08
0.87 : 0.08
2.54 : 0.22
1.24 : 0.13
12.32 : 0.56
Fp2-AvW
2.19 : 0.30
1.58 : 0.18
1.42 : 0.11
1.08 : 0.11
3.20 : 0.23
1.82 : 0.21
16.55 : 1.37
F7-AvW
12.38 : 3.15
6.23 : 0.96
3.25 : 0.28
1.45 : 0.10
2.56 : 0.16
0.77 : 0.06
64.65 : 15.04
F3-AvW
6.31 : 0.82
5.06 : 0.53
4.04 : 0.30
2.23 : 0.16
3.74 : 0.28
1.13 : 0.08
30.01 : 1.60
Fz-AvW
7.00 : 0.78
6.11 : 0.88
3.58 : 0.31
1.05 : 0.08
0.80 : 0.06
0.26 : 0.02
25.62 : 1.93
F4-AvW
6.66 : 0.82
4.79 : 0.37
3.65 : 0.29
1.91 : 0.14
3.39 : 0.21
1.24 : 0.14
29.79 : 1.64
F8-AvW
15.38 : 4.07
6.26 : 0.71
4.75 : 0.46
2.73 : 0.17
7.38 : 0.46
2.58 : 0.36
80.26 : 14.80
T3-AvW
9.00 : 1.23
9.01 : 0.93
5.40 : 0.56
6.23 : 0.69
15.31 : 1.66
5.43 : 0.89
69.83 : 11.22
C3-AvW
5.23 : 0.57
6.07 : 0.61
3.65 : 0.25
0.89 : 0.06
0.83 : 0.06
0.24 : 0.03
22.50 : 1.15
Cz-AvW
10.91 : 1.25
13.67 : 1.54
5.47 : 0.46
0.75 : 0.04
0.48 : 0.03
0.13 : 0.01
40.03 : 2.55
C4-AvW
5.20 : 0.50
5.36 : 0.52
3.43 : 0.25
0.83 : 0.06
0.77 : 0.05
0.23 : 0.02
21.78 : 1.12
T4-AvW
9.06 : 1.01
7.18 : 0.72
4.26 : 0.33
3.30 : 0.27
6.76 : 0.68
2.84 : 0.22
48.85 : 4.09
T5-AvW
6.65 : 0.65
7.24 : 0.68
4.79 : 0.35
1.23 : 0.09
0.89 : 0.08
0.32 : 0.04
28.59 : 1.75
P3-AvW
4.15 : 0.41
5.00 : 0.50
3.54 : 0.26
0.73 : 0.05
0.48 : 0.04
0.14 : 0.02
19.93 : 1.25
Pz-AvW
8.18 : 0.91
6.82 : 0.74
3.91 : 0.24
0.65 : 0.06
0.34 : 0.02
0.11 : 0.01
30.34 : 2.31
P4-AvW
5.32 : 0.57
4.71 : 0.52
3.21 : 0.20
0.76 : 0.05
0.43 : 0.03
0.13 : 0.01
21.77 : 1.29
T6-AvW
5.31 : 0.55
4.97 : 0.47
3.73 : 0.28
1.17 : 0.08
0.78 : 0.08
0.30 : 0.04
22.22 : 1.23
O1-AvW
8.81 : 0.88
8.27 : 0.77
6.63 : 0.54
1.36 : 0.10
1.03 : 0.07
0.44 : 0.04
38.35 : 2.47
O2-AvW
9.46 : 0.89
8.29 : 0.71
7.74 : 0.50
1.25 : 0.10
0.78 : 0.05
0.28 : 0.03
40.26 : 2.43
238
Average values of normalized spectra (%), Normalization frequency band: 0.0-64.0 Hz
Delta
Theta
Alfa
Beta1
Beta2
Gamma
Fp1-AvW
14.50 : 1.50
10.28 : 0.80
9.19 : 0.75
7.38 : 0.76
20.85 : 1.62
10.23 : 1.06
Fp2-AvW
13.01 : 1.22
9.99 : 0.99
9.38 : 0.87
6.95 : 0.72
20.43 : 1.43
11.61 : 1.35
F7-AvW
20.83 : 2.03
13.20 : 1.65
8.23 : 1.18
3.88 : 0.60
6.79 : 0.96
1.96 : 0.27
F3-AvW
20.61 : 1.98
16.96 : 1.49
13.79 : 0.98
7.70 : 0.64
12.95 : 1.12
3.91 : 0.31
Fz-AvW
27.73 : 2.43
23.28 : 1.83
14.77 : 1.29
4.49 : 0.49
3.40 : 0.30
1.09 : 0.11
F4-AvW
22.05 : 2.12
16.35 : 1.10
12.85 : 1.18
6.59 : 0.51
11.80 : 0.81
4.38 : 0.58
F8-AvW
18.51 : 1.78
9.86 : 1.18
7.96 : 1.03
4.61 : 0.49
12.97 : 1.57
4.42 : 0.81
T3-AvW
13.39 : 1.29
13.98 : 1.29
8.35 : 0.61
9.47 : 0.79
23.12 : 1.61
7.93 : 0.64
C3-AvW
23.36 : 2.22
26.93 : 2.13
16.73 : 1.24
4.07 : 0.32
3.84 : 0.34
1.09 : 0.12
Cz-AvW
26.98 : 2.14
33.62 : 2.39
14.47 : 1.33
2.01 : 0.16
1.30 : 0.12
0.36 : 0.04
C4-AvW
23.83 : 1.82
24.48 : 1.86
16.24 : 1.24
3.98 : 0.34
3.74 : 0.31
1.08 : 0.10
T4-AvW
18.78 : 1.71
15.34 : 1.58
9.14 : 0.72
7.13 : 0.60
14.35 : 1.32
6.09 : 0.48
T5-AvW
23.18 : 1.60
25.47 : 1.77
17.22 : 1.15
4.55 : 0.39
3.32 : 0.36
1.19 : 0.17
P3-AvW
21.06 : 1.67
25.56 : 2.15
18.48 : 1.34
3.84 : 0.32
2.51 : 0.20
0.71 : 0.09
Pz-AvW
27.56 : 2.34
23.42 : 2.31
13.93 : 1.23
2.29 : 0.23
1.23 : 0.13
0.38 : 0.05
P4-AvW
24.71 : 2.24
22.05 : 2.05
15.48 : 1.16
3.65 : 0.27
2.10 : 0.17
0.62 : 0.07
T6-AvW
24.02 : 2.13
22.47 : 1.80
17.54 : 1.45
5.47 : 0.43
3.71 : 0.41
1.41 : 0.18
O1-AvW
23.44 : 1.84
21.66 : 1.54
18.07 : 1.46
3.75 : 0.32
2.90 : 0.26
1.21 : 0.13
O2-AvW
23.67 : 1.80
21.06 : 1.56
20.23 : 1.59
3.26 : 0.27
2.07 : 0.18
0.74 : 0.10
239
Average frequency (Hz)
Delta
Theta
Alfa
Beta1
Beta2
Gamma
Total
Fp1-AvW
2.33 : 0.06
5.43 : 0.07
9.99 : 0.13
16.97 : 0.09
24.58 : 0.18
33.67 : 0.16
14.13 : 0.75
Fp2-AvW
2.38 : 0.06
5.38 : 0.07
10.10 : 0.11
16.84 : 0.10
24.75 : 0.17
33.77 : 0.15
14.52 : 0.77
F7-AvW
2.32 : 0.07
5.37 : 0.09
9.83 : 0.11
16.45 : 0.11
24.38 : 0.15
33.56 : 0.16
5.72 : 0.58
F3-AvW
2.41 : 0.06
5.36 : 0.07
9.83 : 0.11
16.79 : 0.11
23.98 : 0.15
34.16 : 0.16
10.11 : 0.47
Fz-AvW
2.49 : 0.06
5.43 : 0.09
9.60 : 0.11
16.35 : 0.12
23.88 : 0.15
33.64 : 0.16
5.70 : 0.23
F4-AvW
2.39 : 0.05
5.40 : 0.08
9.70 : 0.12
16.76 : 0.11
24.24 : 0.15
33.89 : 0.19
9.38 : 0.43
F8-AvW
2.33 : 0.06
5.38 : 0.09
9.91 : 0.13
16.83 : 0.11
24.68 : 0.17
33.65 : 0.20
8.61 : 0.84
T3-AvW
2.46 : 0.07
5.34 : 0.08
9.86 : 0.11
17.22 : 0.11
23.98 : 0.14
34.28 : 0.15
14.82 : 0.63
C3-AvW
2.48 : 0.06
5.45 : 0.07
9.55 : 0.09
16.45 : 0.12
23.74 : 0.13
34.02 : 0.16
6.07 : 0.23
Cz-AvW
2.52 : 0.05
5.59 : 0.08
9.10 : 0.10
16.33 : 0.10
23.71 : 0.12
33.78 : 0.14
4.86 : 0.16
C4-AvW
2.40 : 0.06
5.43 : 0.07
9.63 : 0.09
16.48 : 0.09
23.80 : 0.14
34.04 : 0.15
5.89 : 0.20
T4-AvW
2.42 : 0.06
5.36 : 0.07
9.76 : 0.12
17.09 : 0.12
23.82 : 0.18
34.66 : 0.16
12.18 : 0.61
T5-AvW
2.41 : 0.05
5.45 : 0.07
9.69 : 0.09
16.25 : 0.10
23.86 : 0.15
33.98 : 0.12
6.09 : 0.27
P3-AvW
2.38 : 0.05
5.42 : 0.09
9.51 : 0.10
16.26 : 0.11
23.53 : 0.14
33.92 : 0.12
5.49 : 0.24
Pz-AvW
2.39 : 0.06
5.40 : 0.08
9.46 : 0.09
16.27 : 0.10
23.55 : 0.13
34.04 : 0.12
4.35 : 0.20
P4-AvW
2.39 : 0.06
5.41 : 0.08
9.62 : 0.11
16.25 : 0.09
23.60 : 0.13
33.93 : 0.14
4.98 : 0.21
T6-AvW
2.36 : 0.06
5.38 : 0.06
9.79 : 0.10
16.25 : 0.11
23.80 : 0.14
34.10 : 0.16
6.38 : 0.29
O1-AvW
2.42 : 0.06
5.38 : 0.06
9.75 : 0.11
16.28 : 0.12
24.03 : 0.15
34.15 : 0.14
5.80 : 0.25
O2-AvW
2.42 : 0.06
5.36 : 0.07
9.49 : 0.08
16.21 : 0.11
23.90 : 0.13
33.96 : 0.13
5.33 : 0.25
Beta2
Gamma
Average asymmetry for power spectra (%)
Delta
Fp2-AvW/Fp1-AvW 7.41 : 7.28
F4-AvW/F3-AvW
Theta
Alfa
Beta1
Total
9.59 : 4.53 12.31 : 4.32 9.71 : 3.82 12.49 : 2.72 18.17 : 2.19 12.56 : 3.38
2.97 : 5.50 -0.81 : 5.20 -5.09 : 5.05 -7.58 : 4.72 -3.93 : 3.98
1.38 : 4.48 -0.41 : 2.87
F8-AvW/F7-AvW
11.40 : 6.95 2.79 : 5.41 17.32 : 5.23 30.14 : 3.62 47.25 : 3.41 48.72 : 3.76 16.50 : 4.13
C4-AvW/C3-AvW
0.74 : 6.43 -5.61 : 5.31 -3.35 : 4.67 -3.21 : 4.70 -2.63 : 3.55 -1.55 : 4.00 -1.57 : 3.25
-10.75 :
-11.22 :
-27.92 :
-37.48 :
-26.60 :
-14.79 :
1.70 : 6.17
5.16
3.84
4.50
4.18
4.51
3.63
10.94 : 6.39 -3.04 : 6.13 -4.36 : 4.41 2.57 : 4.35 -4.01 : 3.73 -1.61 : 3.50 4.32 : 3.23
T4-AvW/T3-AvW
P4-AvW/P3-AvW
T6-AvW/T5-AvW
-11.13 :
-17.88 :
-11.78 :
-2.56 : 4.52 -7.11 : 4.03 -3.75 : 4.76
-12.02 :
240
O2-AvW/O1-AvW
6.39
5.38
3.46 : 4.71
0.81 : 4.14
4.75
3.19
8.56 : 3.41 -3.74 : 4.20
-13.75 :
2.99
-21.29 :
4.17
2.61 : 2.33
The values of corresponding spectra parameters and their confidence interval are placed in the cells of
tables.
89. Insert tables of spectra comparison dialog
Select type of tables and maps while you would like to insert into MS Word. The result of this function
is placed below:
Name: Battaglia Gianna-Schindler Michael
Date of observation: 09/05/2004
Total epoch number: 2, 76
Comparison power spectra (uV^2)
Delta
Fp1-AvW
Theta
Alfa
Beta1
Beta2
Gamma
23.89 p<0.190 5.56 p<0.319 9.39 p<0.119 0.80 p<0.117 4.63 p<0.000 1.02 p<0.000
Total
113.59
241
p<0.106
Fp2-AvW
19.11 p<0.178 3.64 p<0.000 5.82 p<0.096 0.45 p<0.216 2.13 p<0.021 -0.35 p<0.119 93.94 p<0.141
F7-AvW
-0.22 p<0.553 -4.38 p<0.171 9.30 p<0.232 0.91 p<0.156 -1.22 p<0.108 -0.22 p<0.098 -6.07 p<0.788
F3-AvW
-3.01 p<0.300 -0.25 p<0.961 9.16 p<0.195 2.73 p<0.012 -0.33 p<0.474 -0.56 p<0.002 5.32 p<0.583
Fz-AvW
-2.63 p<0.333 -2.06 p<0.579 5.00 p<0.323 2.66 p<0.000 0.40 p<0.002 -0.05 p<0.379 2.98 p<0.670
F4-AvW
C3-AvW
-0.27 p<0.585 -1.00 p<0.665 2.68 p<0.644 2.07 p<0.139 -1.19 p<0.396 -0.70 p<0.026 -0.91 p<0.933
-35.45
-9.08 p<0.002 4.48 p<0.986 5.50 p<0.014 -0.41 p<0.708 -5.60 p<0.089 -2.04 p<0.081
p<0.354
-11.83
-27.38
-4.15 p<0.249 -7.59 p<0.082 5.14 p<0.015 -3.35 p<0.002
-4.33 p<0.008
p<0.005
p<0.206
-1.69 p<0.173 -2.27 p<0.512 10.43 p<0.088 3.91 p<0.002 0.61 p<0.000 0.07 p<0.000 12.56 p<0.134
Cz-AvW
1.19 p<0.760 -5.49 p<0.442 8.67 p<0.130 5.50 p<0.034 2.11 p<0.163 0.51 p<0.054 19.34 p<0.008
C4-AvW
2.41 p<0.309 -1.58 p<0.612 15.62 p<0.073 3.84 p<0.002 0.99 p<0.002 0.08 p<0.055 35.73 p<0.212
T4-AvW
0.72 p<0.617 4.24 p<0.730 17.15 p<0.083 -0.02 p<0.538 -1.41 p<0.533 -0.66 p<0.605 15.67 p<0.166
T5-AvW
-1.73 p<0.533 -5.14 p<0.147 11.08 p<0.353 3.52 p<0.186 0.45 p<0.146 -0.09 p<0.484 16.46 p<0.280
F8-AvW
T3-AvW
P3-AvW
0.09 p<0.828 -3.07 p<0.132 14.03 p<0.318 2.77 p<0.099 0.28 p<0.007 0.01 p<0.504 16.01 p<0.264
Pz-AvW
-0.14 p<0.730 -2.14 p<0.578 30.01 p<0.072 2.63 p<0.000 1.14 p<0.002 0.09 p<0.170 38.74 p<0.168
P4-AvW
-0.93 p<0.693 -0.74 p<0.736 18.77 p<0.104 2.99 p<0.048 0.43 p<0.000 0.07 p<0.250 33.84 p<0.237
T6-AvW
13.88 p<0.224 3.78 p<0.461 25.85 p<0.033 2.96 p<0.084 0.62 p<0.000 0.15 p<0.224 78.14 p<0.037
O1-AvW
0.23 p<0.072 -4.16 p<0.401 17.73 p<0.227 10.93 p<0.002 0.60 p<0.198 -0.01 p<0.704 26.50 p<0.176
O2-AvW
1.84 p<0.000 1.99 p<0.900 29.17 p<0.096 6.25 p<0.053 1.54 p<0.000 0.20 p<0.175 56.39 p<0.147
242
Comparison of normalized power spectra (%), Normalization frequency band: 0.0-64.0 Hz
Delta
Theta
Alfa
Beta1
Beta2
Gamma
Fp1-AvW
3.48 p<0.645
-5.56 p<0.312
1.71 p<0.957
-5.92 p<0.105
-14.40 p<0.185
-8.18 p<0.145
Fp2-AvW
4.74 p<0.344
-4.57 p<0.344
-0.90 p<0.794
-5.22 p<0.237
-14.55 p<0.229 -10.03 p<0.136
F7-AvW
0.75 p<0.309
-9.88 p<0.013
12.60 p<0.002
1.15 p<0.620
-4.19 p<0.262
-0.81 p<0.552
F3-AvW
-10.29 p<0.383
-3.80 p<0.470
22.43 p<0.099
6.73 p<0.126
-2.91 p<0.486
-2.20 p<0.202
Fz-AvW
-10.88 p<0.456 -10.00 p<0.322
13.75 p<0.207
9.14 p<0.120
1.01 p<0.351
-0.36 p<0.142
F4-AvW
1.12 p<0.787
-3.95 p<0.571
7.51 p<0.540
7.20 p<0.000
-4.35 p<0.215
-2.48 p<0.002
F8-AvW
-3.34 p<0.698
10.44 p<0.736
15.76 p<0.018
1.57 p<0.912
-8.93 p<0.002
-3.11 p<0.249
T3-AvW
-2.07 p<0.358
-10.49 p<0.165
16.65 p<0.002
-2.61 p<0.139
-14.67 p<0.148
-5.26 p<0.153
C3-AvW
-13.30 p<0.002 -15.50 p<0.362
23.06 p<0.011
9.62 p<0.000
0.29 p<0.309
-0.20 p<0.500
Cz-AvW
-6.16 p<0.631
-20.09 p<0.235
9.67 p<0.274
8.50 p<0.002
3.17 p<0.243
0.73 p<0.102
C4-AvW
-10.18 p<0.132 -18.55 p<0.161
18.28 p<0.109
4.84 p<0.195
-0.28 p<0.862
-0.49 p<0.375
T4-AvW
-3.80 p<0.513
1.62 p<0.991
24.77 p<0.137
-1.99 p<0.337
-5.91 p<0.313
-2.59 p<0.435
T5-AvW
-11.10 p<0.383 -20.87 p<0.002
15.20 p<0.407
5.60 p<0.136
-0.27 p<0.989
-0.63 p<0.364
P3-AvW
-7.66 p<0.508
-20.06 p<0.002
25.33 p<0.356
5.91 p<0.000
-0.28 p<0.783
-0.31 p<0.202
Pz-AvW
-14.94 p<0.285 -17.01 p<0.140
35.01 p<0.000
2.66 p<0.154
0.98 p<0.161
-0.07 p<0.743
P4-AvW
-16.41 p<0.095 -15.66 p<0.184
24.61 p<0.000
4.26 p<0.368
-0.38 p<0.653
-0.20 p<0.576
T6-AvW
-5.45 p<0.639
-14.00 p<0.244
12.36 p<0.196
-1.28 p<0.523
-2.31 p<0.001
-0.95 p<0.157
O1-AvW
-9.10 p<0.264
-15.66 p<0.189
17.86 p<0.269
15.83 p<0.083
-0.27 p<0.863
-0.55 p<0.002
O2-AvW
-11.45 p<0.219 -11.21 p<0.315
17.73 p<0.000
5.08 p<0.229
0.43 p<0.452
-0.22 p<0.570
243
Comparison of average frequency (Hz)
Delta
Theta
Alfa
Beta1
Beta2
Gamma
Total
Fp1-AvW
-0.16 p<0.000 -0.17 p<0.767 -0.06 p<0.320 0.22 p<0.010 -0.40 p<0.448 0.34 p<0.186 -8.71 p<0.120
Fp2-AvW
-0.33 p<0.164 -0.66 p<0.002 -0.19 p<0.058 -0.28 p<0.532 -0.67 p<0.031 0.17 p<0.742 -9.70 p<0.118
F7-AvW
-0.02 p<0.914 0.49 p<0.316 0.34 p<0.334 0.05 p<0.359 -0.84 p<0.035 1.23 p<0.165 -0.06 p<0.966
F3-AvW
-0.20 p<0.002 0.16 p<0.017 0.06 p<0.848 -0.30 p<0.000 -0.89 p<0.293 -0.61 p<0.002 0.74 p<0.488
Fz-AvW
-0.23 p<0.007 -0.15 p<0.488 0.21 p<0.083 -0.27 p<0.024 -0.18 p<0.855 -0.07 p<0.859 2.72 p<0.008
F4-AvW
-0.13 p<0.490 0.06 p<0.490 0.19 p<0.114 -0.68 p<0.208 -0.40 p<0.686 0.27 p<0.662 -0.53 p<0.706
F8-AvW
0.20 p<0.702 -0.45 p<0.365 0.13 p<0.790 -0.05 p<0.767 -0.89 p<0.255 1.17 p<0.002 -1.68 p<0.219
T3-AvW
0.03 p<0.782 0.39 p<0.276 0.12 p<0.684 -0.32 p<0.773 -1.58 p<0.002 0.34 p<0.363 -6.56 p<0.115
C3-AvW
-0.20 p<0.116 0.48 p<0.002 0.62 p<0.172 -0.28 p<0.573 -0.39 p<0.390 -0.01 p<0.984 2.70 p<0.000
Cz-AvW
-0.21 p<0.454 -0.41 p<0.002 0.90 p<0.019 -0.12 p<0.744 -0.90 p<0.301 -0.11 p<0.769 2.14 p<0.270
C4-AvW
-0.34 p<0.358 -0.17 p<0.621 0.57 p<0.002 -0.20 p<0.721 -0.72 p<0.362 -0.54 p<0.248 0.97 p<0.546
T4-AvW
-0.12 p<0.803 -0.39 p<0.245 0.46 p<0.095 0.32 p<0.463 1.17 p<0.149 0.36 p<0.006 -1.64 p<0.574
T5-AvW
-0.44 p<0.120 0.34 p<0.284 0.64 p<0.002 -0.44 p<0.026 -1.65 p<0.000 -0.98 p<0.174 0.75 p<0.671
244
P3-AvW
-0.26 p<0.229 0.44 p<0.000 0.53 p<0.202 -0.38 p<0.089 -1.34 p<0.240 -0.76 p<0.282 2.25 p<0.370
Pz-AvW
0.20 p<0.660 -0.25 p<0.421 0.17 p<0.558 -0.49 p<0.408 -0.91 p<0.145 -0.42 p<0.244 2.74 p<0.082
P4-AvW
-0.21 p<0.267 0.23 p<0.692 -0.01 p<0.955 -0.48 p<0.014 0.16 p<0.840 -0.53 p<0.450 2.09 p<0.313
T6-AvW
-0.17 p<0.000 0.20 p<0.553 0.66 p<0.167 -0.63 p<0.251 -0.92 p<0.144 -0.22 p<0.021 -0.46 p<0.598
O1-AvW
-0.21 p<0.526 -0.15 p<0.000 0.96 p<0.000 -0.66 p<0.322 -0.74 p<0.050 -0.07 p<0.312 3.61 p<0.064
O2-AvW
-0.07 p<0.822 0.39 p<0.479 1.28 p<0.071 -0.04 p<0.622 -1.30 p<0.209 -0.64 p<0.237 2.58 p<0.140
Comparison of asymmetry of power spectra (%)
Fp2-AvW/Fp1-AvW
F4-AvW/F3-AvW
F8-AvW/F7-AvW
C4-AvW/C3-AvW
T4-AvW/T3-AvW
P4-AvW/P3-AvW
T6-AvW/T5-AvW
O2-AvW/O1-AvW
Delta
-12.80
p<0.000
30.03
p<0.000
-39.88
p<0.000
34.08
p<0.000
31.77
p<0.000
-8.59
p<0.000
63.09
p<0.000
7.65
p<0.000
Theta
-8.61
p<0.000
-14.23
p<0.000
42.69
p<0.000
1.03
p<0.000
77.12
p<0.000
25.96
p<0.000
76.53
p<0.000
40.27
p<0.000
Alfa
-27.87
p<0.000
-35.15
p<0.000
-21.69
p<0.000
17.80
p<0.000
43.82
p<0.000
24.91
p<0.000
46.14
p<0.000
15.26
p<0.000
Beta1
-14.04
p<0.000
-3.85
p<0.000
-38.51
p<0.000
1.99
p<0.000
34.37
p<0.000
2.00
p<0.000
-1.05
p<0.000
-20.78
p<0.000
Beta2
-27.24
p<0.000
-19.34
p<0.000
-33.30
p<0.288
12.99
p<0.000
58.13
p<0.000
10.05
p<0.000
9.57
p<0.000
31.62
p<0.000
Gamma
-39.15
p<0.000
-4.01
p<0.000
-50.31
p<0.000
0.44
p<0.000
55.56
p<0.000
17.46
p<0.000
36.74
p<0.000
25.74
p<0.000
Total
-19.85
p<0.000
-9.21
p<0.000
-26.96
p<0.000
22.70
p<0.000
35.70
p<0.000
15.78
p<0.000
50.75
p<0.000
16.61
p<0.000
245
The values of differences of corresponding spectra parameters and their significance level are placed in
the cells of tables.
90. Database Parameters: Databases Of Raw Data dialog
Database Of EEG: Base Pathname
Enter full path for EEG database, or press "..." button on the right of the name field to browse
folders.
Database Of EEG: Working Folder
Enter full path for EEG working folder, or press "..." button on the right of the name field to
browse drives and to select a folder.
Database Of Biofeedback Records: Base Pathname
Enter full path for biofeedback database, or press "..." button on the right of the name field to
browse folders.
Database Of Biofeedback Records: Working Folder
Enter full path for biofeedback working folder, or press "..." button on the right of the name
field to browse drives and to select a folder.
If there is no file or folder with the name you entered, a new one will be created (if possible) when you
press ОК or Apply button.
246
91. Database Parameters: Databases of Processing Results dialog
Database Of EEG Spectra: Database Pathname
Enter full path for EEG spectra database, or press "..." button to the right of the name field to
browse folders.
Database Of EEG Spectra: Working Folder
Enter full path for EEG spectra working folder, or press "..." button to the right of the name
field to browse drives and to select a folder.
Database Of EEG Indices: Database Pathname
Enter full path for EEG indices database, or press "..." button to the right of the name field to
browse folders.
Database Of EEG Indices: Working Folder
Enter full path for EEG indices working folder, or press "..." button to the right of the name
field to browse drives and to select a folder.
Database Of Evoked Potentials (ERP): Database Pathname
Enter full path for ERP database, or press "..." button to the right of the name field to browse
folders.
Database Of Evoked Potentials (ERP): Working Folder
247
Enter full path for ERP working folder, or press "..." button to the right of the name field to
browse drives and to select a folder.
Database Of Event-Related De-synchronization (ERD): Database Pathname
Enter full path for ERD database, or press "..." button to the right of the name field to browse
folders.
Database Of Event-Related De-synchronization (ERD): Working Folder
Enter full path for ERD working folder, or press "..." button to the right of the name field to
browse drives and to select a folder.
Database Of Event-Related Coherence (ERCoh): Base Pathname
Enter full path for ERCoh database, or press "..." button to the right of the name field to
browse folders.
Database Of Event-Related Coherence (ERCoh):Working Folder
Enter full path for ERCoh working folder, or press "..." button on the right of the name field to
browse drives and select a folder.
Database Of EEG Cross-correlation: Database Pathname
Enter full path for EEG cross-correlation database, or press "..." button to the right of the name
field to browse folders.
Database Of EEG Cross-correlation: Working Folder
248
Enter full path for EEG cross-correlation working folder, or press "..." button to the right of the
name field to browse drives and to select a folder.
If there is no file or folder with the name you entered, a new one will be created (if possible) when you
press the ОК or Apply button.
92. Database Parameters: Browser Settings dialog
This dialog defines fields for Record List dialog.
Field
Check those fields you wish to use in the record list.
Width
Set width (in pixels) for each field used in the record list.
Position
Set position (ordinal number) for each field used in the record list.
93. Database Parameters: Base Record Search Parameters dialog
This dialog allows selection of criteria for record filtering. In other words, only records satisfying the
defined search conditions would be displayed in the results list, and the others would be ignored. The
criteria set is saved and then used any time when the Record List dialog is opened. This logic
facilitates repetitive searches over a certain subset of the database records (for example, only with data
249
acquired during last month). But it may also cause mistakes and complications when looking for data.
If you find that some records have suddenly "disappeared" from the database, first of all check the
search criteria.
Each edit box in the Base Record Search Parameters dialog defines one search criterion. A record
satisfies search conditions if it contains all features that have been defined. Blank fields are ignored
during search.
Here is the list of search criteria that can be defined:
ID field contains a text string that must be present in the corresponding field of the database record. If
the text defined for search is shorter than in the database, a substring is searched. Symbol case is
ignored. Blanks placing before and after the text are deleted. If the ID field in the search condition
contains " ABC ", then records containing "ABC", "abc", "AbCXXxxXX", "xxxxxaBc",
"xXxaBCXXx" in their ID fields satisfy this condition.
Date From ... - To fields define the interval of EEG acquisition dates (current year for example). To
enable automatic search by date, use DD/MM/YYYY date format.
Time From ... - To fields define the interval of EEG acquisition times (before noon for example). To
enable automatic search by time, use HH:MM:SS time format.
Investigation field contains a text string to be presented in the corresponding field of the database
record (see also ID field).
250
Patient field contains a text string (for example, patient name) to be presented in the corresponding
field of the database record (see also ID field).
Patient ID field contains a text string to be presented in the corresponding field of the database record
(see also ID field).
Diagnosis field contains a text string to be presented in the corresponding field of the database record
(see also ID field).
Date of Birth From ... - To fields define the interval for dates of patients' birth, for example from
01/01/1950 to 31/12/1959. To enable automatic search by date, use DD/MM/YYYY date format.
Sex field displays patient sex (M or F).
Address field contains a text string to be presented in the corresponding field of the database record
(see also ID field).
Note field contains a text string to be presented in the corresponding field of the database record (see
also ID field).
Check Existed in the working folder option to select only records corresponding to files located in
the working folder. Attention! Using this condition may significantly slow down the database search.
Check Backed-up option to select only records corresponding to EEG files that have been backed-up
at least once.
94. Choose Folder dialog
Folder
Enter folder name or browse the list to find the appropriate folder.
Drive
Choose a drive to look for the necessary folder on.
251
95. Preferences: EEG Input dialog
Set options for new data acquisition in EEG window.
Amplifiers
Displays name of amplifier block the software is designed for.
I/O Port
Choose input/output port to connect amplifier block to.
Length of Input Buffer
Choose how many seconds will be stored before starting EEG acquisition.
Monitoring Style During EEG Recording:
Choose EEG monitoring style.
Scrolling EEG window from right to left.
Moving paper
emulation
Oscilloscope emulation Redrawing EEG window from left to right. Can be used if the
computer is not fast enough to enable smooth EEG window
scrolling.
Show DC Value For Each Channel During Recording: #$[unknown item in Russian]
Choose DC component monitoring style.
252
Don't Show
Color Boxes
Do not depict DC value.
Depict as small colored boxes.
Рисовать прямоугольники, внутри которых выводятся
значения постоянной составляющей.
Use large input buffer for displaying the data
Check this button if you would like to have a possibility to redraw whole EEG window during
EEG recording when horizontal scale is changed. Otherwise only newly recorded samples will
be displayed using new horizontal scale. The disadvantage of this method is that it takes a lot of
time and can cause the acquisition errors on slow computers.
Use save mode for data input (slower)
Check this button if you would like to use save mode for EEG recording. The file header will
be saved together with new portion of data in this case. The data can be recovered in this case if
a crash of WinEEG program or Microsoft Windows have occurred.
Do not redraw EEG window after sensitivity changing (faster)
Check this button if you would like to do not redraw whole EEG window when vertical scale is
changed. Only newly recorded samples will be displayed using new vertical scale in this case.
This is fastest mode of work. Use it if some problems with the acquisition errors on slow
computers occur.
96. Preferences: EEG Window dialog
Colors
List of window elements displayed in color. Under the list there is a button showing current
color for the selected element. Click it to call Colors dialog and to modify element color.
Grid
Choose vertical grid style for EEG window (and also for printing).
No grid is shown or printed.
None
Coarse grid (1 second step).
1 second step
200 millisecond Fine grid (200 millisecond step).
step
253
Show
Check additional graphical elements to be shown in EEG window.
Horizontal dashed lines showing "zero" level for each channel in
Channel Baselines
EEG window.
Numbers showing gains (uV/cm) to the right of the channel names
Calibration In
in the Channel names bar.
Channel Names
Graphic object marking EEG interval of specific interest to user.
User Labels
254
97. Preferences: Scale dialog
Monitor Size
Choose the display size corresponding to your monitor. Then, using the two sliders, adjust the
square size so that its width and height are exactly 30 mm. This will provide proper horizontal
and vertical screen scaling.
Use sliders to fine-tune EEG scaling on the screen.
255
98. Preferences: Signal polarity dialog
Signal polarity for EEG window
Select appropriate signal polarity for EEG window
Signal polarity for ERP
Select appropriate signal polarity for ERP window
256
99. Preferences: Printing dialog
Paper orientation for EEG window
Choose paper orientation for printing EEG.
Paper orientation for EEG mapping window
Choose paper orientation for printing EEG maps.
Paper orientation for spectra window
Choose paper orientation for printing EEG spectra.
Paper orientation for indices window
Choose paper orientation for printing EEG indices.
Paper orientation for ERP (ERD) window
Choose paper orientation for printing ERP, ERD and ERCoh.
Paper orientation for biofeedback window
Choose paper orientation for printing biofeedback window contents.
Printing
Check options for graphic elements to be printed together with EEG.
Check this to print channel names on the left of each page.
Channel names
257
Calibration
Check this to print conventional calibration signals showing
gains and bandwidths for EEG channels. If this option is
checked calibration will be printed on the last page
increasing selected interval by 60 mm.
Calibration style:
Choose an option defining how to print calibration.
Line width for EEG window
Choose an option defining line width for printing EEG waveforms.
100. Colors dialog
To choose a color, click the corresponding button.
101. Mapping parameters dialog
Palette:
Choose a color palette from the list. The palette encodes values displayed on the maps by color.
258
Slider:
Use the slider placed to the right of the color scale to choose a color for modification.
Red:
Set a value for the red component of the selected palette color.
Green:
Set a value for the green component of the selected palette color.
Blue:
Set a value for the blue component of the selected palette color.
Interpolation Method
Choose an interpolation method. Spherical splines are recommended, but barycentric
interpolation is better if few electrodes are used.
Interpolation Order:
Set interpolation order (recommended value is 2).
Quality:
This parameter defines pixel size for the maps (Best option is recommended, meaning the
smallest pixel size). If you choose Draft maps will be painted about three times faster.
Show electrode position:
Check if electrode position should be shown on the maps.
Draw isopotential contours:
Check if isopotential contours should be shown on the maps.
102. Names Of Fragments (Trials) dialog
Enter fragment names in the F2-F11 fields.
259
103. User Label Description dialog
Use this dialog to define up to 10 user labels
Name
Enter label name to be included in the Label popup menu.
Type
Select label type. WinEEG uses 5 label types:
A vertical blue "transparent" bar without text.
Vertical bar
A horizontal blue "transparent" bar without text. It highlights an
Channel bar
interval within one certain channel (Fp1-Ref) independent of its
position in the window. Label length is defined by the user when
creating the label.
A blue rectangular contour highlighting an interval within one
Channel contour
certain channel (Fp1-Ref) independent of its position in the window.
Label length is defined by the user when creating the label.
A vertical gray "opaque" bar with text.
Vertical label
A horizontal gray "opaque" rectangle with text. Its vertical position
Horizontal label
is defined by user when creating the label.
Text
Enter label text (for a Vertical label or a Horizontal label.)
260
104. Photostimulation Program List dialog
Photostimulation programs are used during EEG acquisition (see Input Control toolbar). There are
two types of photostimulation programs: rhythmic and flashes.
A rhythmic photostimulation program may consist of several (from one to twenty) steps. For each
step the photostimulator flashes with constant frequency and power for a certain time.
For photostimulation by single flashes, three parameters are set: number of flashes, minimum
interval and maximum interval, in milliseconds. WinEEG automatically creates and uses a sequence
of intervals with random durations within the range from minimal to maximal value defined.
Name
Select a photostimulation program to modify or enter a new name.
Type
Choose photostimulation program type: Rhythmic, Single flashes, or Pairs of flashes.
Duration
Define duration (in seconds) for each step of rhythmic photostimulation program.
Frequency
Set stimulation frequency for each step of the rhythmic photostimulation program. If zero
frequency value is set, the photostimulator will be off during that step.
Power
261
Set flash power for each step of rhythmic photostimulation (if power control is enabled).
Number Of Flashes
Set the number of single flashes or number of flash pairs for stimulation by flash pairs.
Minimal interval
Set minimum interstimulus interval for stimulation by single flashes or flash pairs.
Maximal interval
Set maximum value for the interstimulus interval for stimulation by single flashes or flash
pairs.
105. EEG Bandranges dialog
Select a list of frequency bands which parameters you would like to modify.
Defines names, limits and graph colors for standard EEG frequency bands. You can define up to
sixteen frequency bands. A desired frequency band will be used in processing only if the checkbox to
the left of the frequency band name is checked.
Use List name list to select list of frequency bands.
Press a Color button to display Colors dialog.
262
Press a Change button to display Parameters Of Bandpass Filter dialog changing frequency band
limits and filter parameters.
106. Parameters Of Bandpass Filter dialog
Define frequency limits, filter type and order. For Chebyshev filter type, also select low and high
frequency cutoffs. Filter Response Function, Impulse Response and Filter Response graphs help to
check if filter parameters you enter are adequate.
263
107. Graphics Page Format dialog
Name
Choose a format from list or enter a new name for current format.
Page Size
Press Change button to set new graphic page size. The Page Size dialog is displayed after
calling this command. After setting new size horizontal and vertical sizes and positions of
graphs would be proportionally modified.
Axes
Customize axes output. Check axes to be displayed (X and/or Y) and set values for tic mark
step (milliseconds for X, micro Volts for Y).
Calibration
Customize calibration scale output: position on the page (in relation to left upper corner) and
size.
Waveform graphic line parameters for groups
Choose color and style for ERP graph lines for each trial group (up to four groups can be
depicted on a page simultaneously; see ERP window). Press a color-filled button to call
Colors dialog. Press a button with a horizontal line to call Line Style dialog.
Table of Graph Parameters
Each row of the table displays parameters for one graph: position (in relation to upper left page
corner), horizontal and vertical size and list of depicted curves. One graph can depict up to four
264
curves corresponding to different trial groups - for only one channel. Besides, under the graph
there can be histograms (for each of four trial groups) encoding results of ERP statistical
analysis (see ERP window). For example, if "Curves List" field contains the following:
F3: <Gr1+St> < Gr2> < Gr3> < Gr4>
The graph will depict ERPs for F3 channel and for four trial groups named by means of
Averaging Groups bar. Also, a histogram of statistical significance for the first trial group
will be shown under the graph. Graphs will not be displayed for channels or trial groups absent
in the opened ERP file.
Check table rows for graphs to be depicted in the ERP window or highlight a row (rows) to
modify parameters for.
Press Change button to set new parameters for displaying graphs checked in the table. The
Parameters Of Graphics dialog is displayed after calling this command.
Press Copy From… button to copy parameters from another format selected from list. The Page Size
dialog is displayed after pressing this button.
108. Page Size dialog
Enter page width and height.
265
109. Line Style dialog
Press a button to select an appropriate line style.
110. Graphics Page Format List dialog
Choose a format from list.
111. Parameters Of Graphics dialog
Rectangle
Enter graph size and coordinates of its upper left corner relatively to the upper left corner of the
page. If the graph size exceeds page dimensions, they page dimensions will be increased.
Channel
Select a channel to be depicted.
Waveforms
Choose a trial group to be depicted by each of curves on the graph (up to four groups can be
depicted) and define whether a statistical significance histogram is to be shown for the group.
266
Attention!!! If you are modifying parameters for several graphs simultaneously only newly
entered parameter values will be changed. For example, you can select all graphs in the table
and modify their sizes; the remaining parameters will be unchanged.
112. Running Header dialog
Enter, for example, your organization title to be printed as running header at the top of each page.
267
113. Final Report Template List dialog
Creates and modifies final report template list.
Use the New button to add a new final report template to the list. Final Report Template dialog will
appear.
Use Delete button to delete the selected final report from the list.
Use Edit button to edit selected final report. Final Report Template dialog will appear.
268
114. Final Report Template dialog
Enter template name in the Name field.
Enter final report text in the edit box below Name field.
115. Setup Final Report Generator dialog
Editor
Define what editor to use.
Attention!!! MS Word can be chosen only if it is installed on your computer. WinEEG works
only with MS Word 97 and MS Word 2000. MS Word 95 is not supported.
Resource File
Choose resource (.RES) file for final report generation.
269
Edit template
Run MS Word application to modify empty final report.
116. Video recorder parameters
The parameters of main and additional cameras can be specified using this dialog/
Video input device
Select video capturing device
Video input
Select video input to which camera is connected.
Video compressor
Select on line video compressor. The compressors “Microsoft MPEG-4 Video Codec V1” or
“Microsoft MPEG-4 Video Codec V3” will be the best for many system configurations. We don’t
270
recommend you to use this option with rather slow computers. Use Source button to specify
compression parameters if corresponding video capture card support on line compression.
Frames per second
Select frame rate if it is possible.
Video format
Press this button to specify parameters of video format.
Video Source
Press this button to specify parameters of video capturing.
Audio input device
Select audio input device.
Audio source
Press this button to specify parameters of audio input.
Audio Compressor
Select on line video compressor. The compressors “MPEG Layer-3” will be the best for many
system configurations.
Would you like to capture audio?
Check this button if you would like to capture audio signal.
Video block length
Specify minimal length of block of video data placed into one file. By another words each
specified seconds the old video file will be closed and new file will be created.
Attention! Please specify all parameters of Video format, Video source and Audio source carefully.
The quality of recorded signal will depend on these parameters. Unfortunately corresponding dialog
boxes are unique for each video capture and audio capture devices. Please look for information about
them in corresponding operation manuals.
271
117. Equipment Configuration dialog
Amplifiers type
In this case the version and serial number of amplifiers box will be displayed.
I/O Port
Choose COM1 or COM2 port to connect encephalograph.
Attention!!! If I/O Port is chosen incorrectly EEG cannot be acquired and any attempt to
start EEG input will cause error.
Attention!!! This field can be disabled in a number of WinEEG versions. Use button “Find”
in this case to perform automatic search of connected to computer Mitsar amplifiers.
Synchronization Port To Which a Slave Computer Is Connected:
Choose a COM port to connect a slave computer (presenting stimuli for ERP investigation) to
and specify its parameters.
272
Parameters of port for external marks
Choose a COM port to connect another computer (sending external marks) to and specify its
parameters.
Presentation device
Select presentation device. The presentation device can be PSYTASK program or
EXTERNAL. Select EXTERNAL option if you would like to use Presentation program or
E-prime program
Graphics acceleration
Select the method of graphics acceleration that you prefer. Default – Turn off.
Access codes
Enter 8-characrters access codes into these fields (see above).
273
Appendix 1. Final Report Generation Setup
Programming Language for Automatic Final Report Generation System
Automatic Final Report Generation dialog uses a programming language developed for the purpose
of simplifying the creation of hierarchical menus that are used for selecting specific wordings. By
means of this programming language you can develop practically any structure for calling wordinginteractive menus. The developers, however, made their aim to design as simple and convenient a
language as possible, and not to create the most perfectly general hierarchical menu system.
A source for a hierarchical menu system is an ASCII file created by any text editor and containing
information on future structure of interactive menus. When menus are created, the text is compiled
by a special compiler (FRC.EXE) that generates a resource file used by the automatic final report
generation system. The resource file name is mandatory: EEGFR.RES.
The compiler interprets menu description. If an error occurs, compiling process breaks and an error
messages is generated, containing the source line number and a brief error description. If no errors
are detected, a message about successful compilation is displayed and a corresponding resource file
is created.
Command line syntax to call the compiler:
FRC.EXE <ACSII file name> <resource file name>
1. Basic Terms.
Basic terms used in the programming language:
A Menu is a basic automatic final report resource unit. A menu is a list of wordings united into an
entire group and showed in a window simultaneously. A menu can have an additional attribute - socalled menu header. This is an arbitrary text shown in the top of automatic final report generation
window when the corresponding menu is displayed.
Menu description contains a list of options. An option contains: a wording to be shown and selected
in the window; text to be inserted into final report on selecting the option, and a set of commands
organizing menu display sequence.
All menus described in the system must be organized in menu blocks. A menu block is a set of
separate menu descriptions enclosed in block ... endblock brackets. In simplest cases menu
description file has only one menu block. The "block" term is introduced into the syntax in order to
lessen description text size. It is very favorable to organize menus with wordings used more than
once into blocks. It seems also reasonable to unit logically closed pieces of a hierarchical menu
system into blocks.
2. Hierarchical Menu System Cycle.
To understand hierarchical menu system programming principles better, let us study a hierarchical
menu system cycle. First of all, just after a hierarchical menu system is called, the first block (in
order) is loaded to memory. Then, the first menu in the block is processed. All necessary information
274
on this menu is read into RAM from the resource file. A wording selection window is formed
automatically, menu header (if defined) is highlighted and the control goes to the procedure
processing operator commands - by means of these commands an user can choose one of existing
wordings. After a wording has been chosen, corresponding text is inserted into final report and
processing procedure starts. In the simplest case, when there is no menu block call commands
among control transfer commands corresponding to selected wording, next menu is processed.
Control transfer commands can enable transfer to next menu in order or to miss a number of menus
described within executed block.
In a more complicated case, one more menu block is called to be executed. In this case required
block information is loaded to memory and the first menu of new block is processed. When
processing of newly loaded block menus is finished, the control transfer command corresponding to
the wording that had been selected and had caused the new menu block loading to memory. In other
words, in this case one more menu block is processed after inserting the selected wording into text
and before control transfer to next menu according to the described control transfer command
described. The system enables nested calls of menu blocks to be processed, i.e. a block can be called
to be processed from another block called beforehand to be processed. But total length of all blocks
that can be loaded into RAM is limited.
Note that processing of a menu block is finished in two cases: either after the last menu in order is
processed, or after a break control transfer command is executed. The system of hierarchical menu
processing completes its functioning when processing of the first (in order) block described in the
hierarchical menu program is finished. So if processing of any block in the program (except the first
block) is not described explicitly in control transfer commands, such a block will not be used.
Finally, menu header processing logic shall be fixed. If no header is described for next menu in
order, it does not change the header set previously. Otherwise two situations may take place. If
menus of one block are processed, their headers will be consequently replacing one another. If a
block was loaded and a menu with a header is processed, the header will be changed. But after the
block is processed completely the header defined in the block that has been previously called and is
currently being processed will be restored.
3. Language Syntax.
Notation Convention.
Common notation conventions will be used in syntax descriptions as it takes place in MS DOS and
in a number of programming languages like Assembler or C. A key word or a syntax expression not
in brackets is directly present in the program. Text in square brackets [ ] is not mandatory to be
present. Text in angle brackets < > must be present but its contents is just an example and can be
replaced with another text.
Structure of Menu Block Description.
block <Block Identifier>
<Menu Description 1>
[<Menu Description 2]
[<Menu Description 3]
...
[<Menu Description n]
275
endblock
<Block Identifier> is a character string not exceeding 16 characters, not containing punctuation
signs (dots, commas, colons, etc). Any block must have an identifier that will be used to program
calls of this block.
Structure of Menu Description.
menu <Menu Identifier > [title "<Menu Header Text>"]
<Option Description 1>
[<Option Description 2>]
[<Option Description 3>]
...
[<Option Description m>]
end
<Menu Identifier> is a character string not exceeding 16 characters, not containing punctuation
signs (dots, commas, colons, etc). Any menu must have an identifier that will be used to program
calls of this menu.
<Menu Header Text> is an arbitrary text not exceeding 60 characters, enclosed into double
quotation marks.
Menu header is not mandatory according to the notation convention.
Structure of Option Description.
"<Name>" "<Text>" [goblock <Block Identifier>] [<Transfer>],
where <Name> is a wording name indicated in the wording list window. It is an arbitrary text in
double quotation marks, not exceeding 50 characters.
<Text> is the wording text to be inserted into final report. It is an arbitrary text in double quotation
marks. Special characters can also be used:
new line - \n (line feed)
double quotation marks - \"
apostrophe - \'
backslash - \\.
goblock <Block Identifier> - call of a block to be processed,
<Transfer> - control transfer command.
There are four control transfer commands:
next - goes to next menu (default);
break - finishes block processing;
quit - stops the whole hierarchical menu processing system functioning;
go <Menu Identifier> - starts processing the menu with the corresponding identifier.
There are several limitations for programming block calls and menu transfers:
Only a block can be called that is described in the text below the block currently processed.
A menu can call another menu only within a block, and the menu to be called shall be described in
the text below the menu calling it.
These limitations can complicate development of a user's own hierarchical menu system but they
leave out the possibility of occurrence of closed loops and therefore simplify debug of the system.
Comments
276
Any text from a semicolon (;) to the end of line is treated as a comment and is not included in the
syntax analysis.
4. Example of a Hierarchical Menu Program
Here is a short example of a program showing all key words and features of the language. You can
analyze this text by yourself, and having done it, you surely will be able to create a hierarchical
menu system as complicated as you need.
block Block1
menu Menu1 title "text of
"Option1 menu1" "\nOption
"Option2 menu1" "\'Option
"Option3 menu1" "\"Option
"Option4 menu1" "\\Option
end
menu Menu2
"Option1 menu2"
"Option2 menu2"
"Option3 menu2"
"Option4 menu2"
end
"Option
"Option
"Option
"Option
title1"
insert text1
insert text2
insert text3
insert text4
insert
insert
insert
insert
menu1"
menu1"
menu1"
menu1"
next
break
go Menu5
quit
text1
text2
text3
text4
menu2"
menu2"
menu2"
menu2"
next
break
go Menu4
quit
menu Menu3 title "text of title3"
"Option1 menu3" "Option insert text1
"Option2 menu3" "Option insert text2
"Option3 menu3" "Option insert text3
"Option4 menu3" "Option insert text4
end
menu3"
menu3"
menu3"
menu3"
goblock
goblock
goblock
goblock
menu Menu4 title ""
"Option1 menu4" "Option
"Option2 menu4" "Option
"Option3 menu4" "Option
"Option4 menu4" "Option
end
menu4"
menu4"
menu4"
menu4"
next
break
go Menu5
quit
insert
insert
insert
insert
text1
text2
text3
text4
Block2
Block3
Block2
Block3
menu Menu5 title ""
"Option1 menu5 " "Option insert text1 menu5" next
; "Option2 menu5 " "Option insert text2 menu5" break
; "Option3 menu5 " "Option insert text3 menu5" go Menu6
"Option4 menu5 " "Option insert text4 menu5" quit
end
endblock
block Block2
menu Menu6 title "text of title6"
"Option1 menu6" "Option insert text1
"Option2 menu6" "Option insert text2
"Option3 menu6" "Option insert text3
"Option4 menu6" "Option insert text4
end
menu Menu7
"Option1 menu7"
"Option2 menu7"
"Option3 menu7"
"Option4 menu7"
end
"Option
"Option
"Option
"Option
insert
insert
insert
insert
text1
text2
text3
text4
menu6"
menu6"
menu6"
menu6"
next
break
go Menu8
quit
menu7"
menu7"
menu7"
menu7"
next
break
go Menu8
quit
next
break
go Menu5
quit
277
menu Menu8 title "text of title8"
"Option1 menu8" "Option insert text1
"Option2 menu8" "Option insert text2
"Option3 menu8" "Option insert text3
"Option4 menu8" "Option insert text4
end
menu8"
menu8"
menu8"
menu8"
goblock
goblock
goblock
goblock
Block3
Block3
Block3
Block3
next
break
go Menu9
quit
menu Menu9 title ""
"Option1 menu9" "Option insert text1 menu9" next
; "Option2 menu9" "Option insert text2 menu9" break
; "Option3 menu9" "Option insert text3 menu9" go Men10
"Option4 menu9" "Option insert text4 menu9" quit
end
endblock
block Block3
menu Menu10 title "text of title10"
"Option1 menu10" "Option insert text1
"Option2 menu10" "Option insert text2
"Option3 menu10" "Option insert text3
"Option4 menu10" "Option insert text4
end
menu10"
menu10"
menu10"
menu10"
next
break
go Menu11
quit
menu Menu11
"Option1 menu11" "Option insert text1 menu11" next
"Option2 menu11" "Option insert text2 menu11" break
; "Option3 menu11" "Option insert text3 menu11" go Menu8
"Option4 menu11" "Option insert text4 menu11" quit
end
endblock
5. Limitations.
String length should not exceed 256 characters
Not more than 256 menus can be described
Total length of blocks simultaneously loaded to memory should not exceed 64 menus
Not more than 128 blocks can be described
A menu should not exceed 32 options
A menu description (including header, wording names, and texts to be inserted) should not exceed
4000 characters