1
Summit T3‐8
PCI Express Multi‐Lane Protocol Analyzer
User Manual
PCIe Protocol Suite software version 7.36
Generated: July 1, 2015, 14:14
Teledyne LeCroy Protocol Solutions Group Trademarks and Servicemarks
Teledyne LeCroy, CATC Trace, PETracer, PETracer Summit, Summit T3‐8, Universal Protocol Analyzer System, UPAS, and BusEngine are trademarks of Teledyne LeCroy.
Microsoft and Windows are registered trademarks of Microsoft Corporation.
Intel and Pentium are registered trademarks of Intel Corporation.
All other trademarks and registered trademarks are property of their respective owners.
THE SPECIFICATIONS AND INFORMATION REGARDING THE PRODUCTS IN THIS MANUAL ARE SUBJECT TO CHANGE WITHOUT NOTICE. ALL INFORMATION, EXAMPLES AND RECOMMENDATIONS IN THIS MANUAL ARE BELIEVED TO BE ACCURATE BUT ARE REPRESENTED WITHOUT WARRANTY OF ANY KIND, EXPRESS OR IMPLIED. USERS ARE FULLY RESPONSIBLE FOR THEIR APPLICATION OF ANY PRODUCTS.
THE SOFTWARE LICENSE AND LIMITED WARRANTY FOR THE ACCOMPANYING PRODUCT ARE SET FORTH IN INFORMATION THAT SHIPPED WITH THE PRODUCT AND ARE INCORPORATED HEREIN BY THIS REFERENCE. IF YOU ARE UNABLE TO LOCATE THE SOFTWARE LICENSE OR LIMITED WARRANTY, CONTACT TELEDYNE LECROY FOR A COPY.
© 2012 Teledyne LeCroy, Inc. All rights reserved.
This document may be printed and reproduced without additional permission, but all copies should contain this copyright notice.
WEEE Program Teledyne LeCroy
3385 Scott Blvd.
Santa Clara, CA 95054
TEL: 800‐909‐7112 (USA and Canada)
TEL: 408‐653‐1260 (worldwide)
Summit T3‐8 PCI Express Multi‐Lane Protocol Analyzer User Manual
ii
Contents
Contents: .................................................................................................................. iii
Chapter 1: Overview................................................................................................1
1.1 PCIe Protocol Suite Analyzer Hardware and Software ....................................................... 1
1.1.1 CATC Trace Software .............................................................................................................................2
1.1.2 Summit T3-8 Analyzer ............................................................................................................................3
1.1.3 Features...................................................................................................................................................4
1.1.4 Other Documents ...................................................................................................................................4
Chapter 2: Hardware Description ..........................................................................5
2.1 System Components .............................................................................................................. 5
2.2 Host Machine Requirements ................................................................................................. 5
2.3 Summit T3-8 Front Panel Description................................................................................... 5
2.4 Summit T3-8 Rear Panel Description.................................................................................... 6
Chapter 3: Installation and Setup ..........................................................................7
3.1 Installing the PCIe Protocol Suite software ......................................................................... 7
3.2 Setting Up the Summit T3-8 Analyzer using a USB Connection........................................ 8
3.3 Setting Up the Summit T3-8 Analyzer using an Ethernet Connection............................... 9
3.4 Adding Devices Manually .................................................................................................... 12
3.5 Daisy-chaining with CATC SYNC Expansion Card............................................................ 13
3.6 Interposers and Probes........................................................................................................ 14
3.7 Using Interposers ................................................................................................................. 14
3.7.1 Gen2 Active Interposer ........................................................................................................................14
3.7.2 Gen3 Interposer ....................................................................................................................................16
3.8 Using Probes......................................................................................................................... 17
3.8.1 Connecting the Summit T3-8 Analyzer to the Device Under Test
Summit T3‐16 PCI Express Multi‐Lane Protocol Analyzer User Manual
iii
Teledyne LeCroy
Contents
Using a Gen3 MidBus Probe ........................................................................................................................17
3.8.2 Connecting the Summit T3-8 Analyzer to the Device Under Test
Using a Gen3 Multi-lead Probe for x1 and x4 .............................................................................................19
3.8.3 Connecting the Summit T3-8 Analyzer to the Device Under Test
Using a Gen2 Multi-lead Probe for x8..........................................................................................................20
3.9 Expansion Mode using Two Summit T3-8 Analyzers........................................................ 21
Chapter 4: Software Overview .............................................................................23
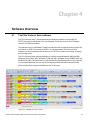
4.1 The PCIe Protocol Suite Software....................................................................................... 23
4.2 Application Layout ............................................................................................................... 24
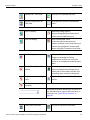
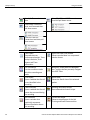
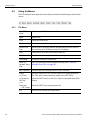
4.3 Using the Toolbar ................................................................................................................. 24
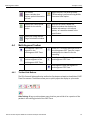
4.4 Multi-Segment Toolbar......................................................................................................... 27
4.4.1 Toolbar Hide Buttons ...........................................................................................................................27
4.5 Using the Menus ................................................................................................................... 30
4.5.1 File Menu ..............................................................................................................................................30
4.5.2 Setup Menu ...........................................................................................................................................36
4.5.3 Record Menu.........................................................................................................................................36
4.5.4 Report Menu..........................................................................................................................................37
4.5.5 Search Menu .........................................................................................................................................37
4.5.6 Quick Search Feature...........................................................................................................................40
4.5.7 View Menu .............................................................................................................................................41
4.5.8 Tools Menu............................................................................................................................................43
4.5.9 Window Menu .......................................................................................................................................43
4.5.10 Help Menu ...........................................................................................................................................43
4.6 Dashboard View.................................................................................................................... 44
4.7 Tool Tips................................................................................................................................ 46
4.8 Keyboard Shortcuts ............................................................................................................. 46
4.9 Status Bar.............................................................................................................................. 47
4.9.1 Recording Progress Bar ......................................................................................................................47
4.9.2 Recording Status..................................................................................................................................47
4.9.3 Recording Activity................................................................................................................................48
4.9.4 Search Direction Indicator...................................................................................................................48
4.10 Making a PCI Express Recording...................................................................................... 48
4.10.1 Stopping a Recording ........................................................................................................................50
4.10.2 Saving a Recording ............................................................................................................................50
4.11 PCIe Protocol Suite Files ................................................................................................... 51
4.11.1 CATC Trace Files................................................................................................................................51
4.11.2 Recording Options Files ....................................................................................................................51
4.11.3 Display Options Files .........................................................................................................................51
iv
Summit T3‐16 PCI Express Multi‐Lane Protocol Analyzer User Manual
Contents
Teledyne LeCroy
4.12 Saving CATC Trace Files ................................................................................................... 51
4.12.1 Using the Save As Function ..............................................................................................................51
4.12.2 Saving a Portion of a CATC Trace ....................................................................................................52
4.12.3 Trace File Structure............................................................................................................................53
4.13 Exporting a CATC Trace File ............................................................................................. 53
4.14 Printing Data Files .............................................................................................................. 55
4.15 Analyzer Chat Window ....................................................................................................... 56
4.15.1 CrossSync Control Panel ..................................................................................................................57
Chapter 5: Recording Options .............................................................................59
5.1 Recording Overview ............................................................................................................. 59
5.2 General Tab ........................................................................................................................... 59
5.3 Recording Options-General Tab ......................................................................................... 59
5.4 Simple and Advanced Mode ................................................................................................ 61
5.5 Trace Filename and Path ..................................................................................................... 61
5.6 Saving and Loading Previously Saved Recording Options ............................................. 62
5.6.1 Setting Default Recording Options.....................................................................................................62
5.6.2 Loading Recording Options ................................................................................................................62
5.6.3 Saving Recording Options ..................................................................................................................63
5.7 Recording Type..................................................................................................................... 63
5.7.1 Snapshot ...............................................................................................................................................64
5.7.2 Manual Trigger......................................................................................................................................64
5.7.3 Event Trigger ........................................................................................................................................64
5.8 Buffer Size ............................................................................................................................. 64
5.9 Upload Size ........................................................................................................................... 65
5.10 Misc...................................................................................................................................... 65
5.11 Recording Mode.................................................................................................................. 66
5.11.1 Protocol Recording Mode..................................................................................................................66
5.11.2 Bit Tracer Recording ..........................................................................................................................66
5.12 Trigger Position .................................................................................................................. 66
5.12.1 Viewing Legacy Multi-Segmented CATC Traces .............................................................................67
5.13 Link Settings ....................................................................................................................... 67
5.13.1 Speed...................................................................................................................................................68
5.13.2 Link Width ...........................................................................................................................................69
5.13.3 Upstream and Downstream ...............................................................................................................69
5.13.4 Use External Reference Clock...........................................................................................................69
5.13.5 Disable Descrambling ........................................................................................................................70
5.13.6 Auto-Configure Lane Polarity............................................................................................................70
Summit T3‐16 PCI Express Multi‐Lane Protocol Analyzer User Manual
v
Teledyne LeCroy
Contents
5.13.7 Ignore EDS ..........................................................................................................................................70
5.13.8 Ignore Idle Errors................................................................................................................................70
5.13.9 Swizzling Config... ..............................................................................................................................70
5.14 Triggering ............................................................................................................................ 71
5.14.1 Triggering On (Simple Mode) ............................................................................................................72
5.14.2 Triggering On (Advanced Mode).......................................................................................................73
5.15 Navigating Recording Rules.............................................................................................. 74
5.15.1 Toolbar ................................................................................................................................................74
5.15.2 Available Events Area ........................................................................................................................74
5.15.3 Main Display Area...............................................................................................................................75
5.15.4 Recording Rules Buttons ..................................................................................................................75
5.16 Recording Rules Overview ................................................................................................ 75
5.16.1 Defining Recording Rules..................................................................................................................75
5.17 Resources ........................................................................................................................... 78
5.17.1 Packet Match Resource .....................................................................................................................78
5.17.2 Basic Resource...................................................................................................................................81
5.17.3 Payload Match Resource ...................................................................................................................82
5.18 Global State and Sequence States.................................................................................... 84
5.18.1 Global State.........................................................................................................................................85
5.18.2 Sequence State...................................................................................................................................86
5.19 Recording Rules Events .................................................................................................... 87
5.20 Properties Dialog Boxes for Events.................................................................................. 90
5.20.1 Accessing the Properties Dialog ......................................................................................................90
5.20.2 Event Properties Dialog Box Features .............................................................................................90
5.20.3 Link State Dialog ................................................................................................................................91
5.20.4 Ordered Set Properties Dialog ..........................................................................................................92
5.20.5 Error Properties Dialog ......................................................................................................................92
5.20.6 DLLP Packet Properties Dialog.........................................................................................................93
5.20.7 TLP Header Properties Dialog...........................................................................................................94
5.20.8 TLP Prefix Properties Dialog .............................................................................................................94
5.20.9 AHCI Register Properties Dialog.......................................................................................................95
5.20.10 ATA Command Properties Dialog...................................................................................................95
5.20.11 NVME Register Properties Dialog ...................................................................................................97
5.20.12 NVME Command Submission Properties Dialog ..........................................................................99
5.20.13 NVME Command Completion Properties Dialog .........................................................................101
5.20.14 PQI Register Properties Dialog .....................................................................................................102
5.20.15 PQI Command Properties Dialog ..................................................................................................102
5.20.16 SOP IU Type Properties Dialog .....................................................................................................103
5.20.17 SCSI Block Command Set Properties Dialog ..............................................................................103
5.20.18 Actions Properties Dialog..............................................................................................................104
vi
Summit T3‐16 PCI Express Multi‐Lane Protocol Analyzer User Manual
Contents
Teledyne LeCroy
5.21 Filter Out............................................................................................................................ 106
5.22 Filter In............................................................................................................................... 107
5.23 Triggering Configuration on a per Lane Basis .............................................................. 112
5.24 Counter .............................................................................................................................. 120
5.24.1 How to Set a Counter .......................................................................................................................121
5.24.2 How to Increment or Reset a Counter ............................................................................................122
5.24.3 Changing the Value of the Counter ................................................................................................123
5.24.4 Deleting a Counter............................................................................................................................124
5.25 Timer .................................................................................................................................. 124
5.25.1 How to Set a Timer ...........................................................................................................................126
5.25.2 How to Start or Reset a Timer .........................................................................................................126
5.25.3 Changing the Value of the Timer ....................................................................................................128
5.25.4 Deleting a Timer................................................................................................................................128
5.26 Channel.............................................................................................................................. 128
5.27 Probe Settings .................................................................................................................. 129
5.27.1 Setting Auto Calibration ..................................................................................................................129
5.27.2 PCIe Gen3 Auto Calibration.............................................................................................................133
5.27.3 Save ...................................................................................................................................................136
5.27.4 Load ...................................................................................................................................................137
Chapter 6: Reading CATC Traces......................................................................139
6.1 Viewing PCI Express CATC Traces................................................................................... 139
6.2 Expand and Collapse Data Fields ..................................................................................... 139
6.3 Resizing Cells ..................................................................................................................... 140
6.4 Pop-up Menus ..................................................................................................................... 140
6.5 View Data Block .................................................................................................................. 140
6.6 Show Raw 10b Codes......................................................................................................... 141
6.7 Show Header Fields............................................................................................................ 142
6.8 Packet Cell Popup Menus .................................................................................................. 143
6.8.1 Set Start Quick Timing Marker ..........................................................................................................143
6.8.2 Set End Quick Timing Marker............................................................................................................143
6.8.3 Delete All Quick Timing Marker.........................................................................................................143
6.8.1 Packet Header R-> Cell Popup Menu................................................................................................145
6.8.2 Packet Header G1 Cell Popup Menu.................................................................................................145
Summit T3‐16 PCI Express Multi‐Lane Protocol Analyzer User Manual
vii
Teledyne LeCroy
Contents
6.9 Set Marker ........................................................................................................................... 145
6.10 Edit or Clear Marker.......................................................................................................... 147
6.11 Compressed CATC Trace View ....................................................................................... 147
6.12 Spreadsheet View ............................................................................................................. 148
6.12.1 Columns ............................................................................................................................................150
6.12.2 Detail View and Spreadsheet View .................................................................................................152
6.13 Decoding Traffic ............................................................................................................... 153
6.13.1 Packet ................................................................................................................................................153
6.13.2 Link ....................................................................................................................................................153
6.13.3 Split....................................................................................................................................................154
6.13.4 NVMe..................................................................................................................................................155
6.13.5 AHCI...................................................................................................................................................164
6.13.6 ATA ....................................................................................................................................................165
6.13.7 PQI .....................................................................................................................................................167
6.13.8 SOP ....................................................................................................................................................168
6.13.9 SCSI ...................................................................................................................................................168
Chapter 7: Searching CATC Traces ..................................................................169
7.1 CATC Trace Search Overview ........................................................................................... 169
7.2 Go to Trigger ....................................................................................................................... 169
7.3 Go to Selected Packet ........................................................................................................ 169
7.4 Go to Packet........................................................................................................................ 169
7.5 Go to Time ........................................................................................................................... 170
7.6 Go To Marker....................................................................................................................... 170
7.6.1 Markers................................................................................................................................................171
7.6.2 Attaching Markers ..............................................................................................................................174
7.6.3 Adding an Attachment .......................................................................................................................174
7.6.4 Recording an Audio File ....................................................................................................................175
7.6.5 Video Files Supported........................................................................................................................175
7.6.6 Attachment Types and Visualization ................................................................................................175
7.6.7 Embedded Attachments to a Marker ................................................................................................175
7.6.8 Viewing Attachments of a Marker .....................................................................................................176
7.6.9 Edit Marker ..........................................................................................................................................180
7.6.10 All Markers Window .........................................................................................................................181
7.7 CATC Walk Playlist............................................................................................................. 183
7.7.1 Playlist Functionality..........................................................................................................................183
7.7.2 Playback Window ...............................................................................................................................184
viii
Summit T3‐16 PCI Express Multi‐Lane Protocol Analyzer User Manual
Contents
Teledyne LeCroy
7.8 Go To SCSI Menu................................................................................................................ 186
7.9 Go To Menu ......................................................................................................................... 186
7.10 Search Direction ............................................................................................................... 187
7.11 Find .................................................................................................................................... 187
7.11.1 Event Groups ....................................................................................................................................189
7.12 Search for the Next Packet Type..................................................................................... 194
7.13 Quick Search Feature....................................................................................................... 195
Chapter 8: Display Options ................................................................................199
8.1 Setting Display Options ..................................................................................................... 199
8.2 Specifying General Display Options................................................................................. 200
8.2.1 Collapsing Data Fields .......................................................................................................................200
8.2.2 Fonts....................................................................................................................................................201
8.2.3 Configuration Name ...........................................................................................................................201
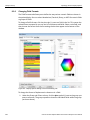
8.2.4 Color, Format, and Hiding Options...................................................................................................201
8.2.5 Setting Field Colors............................................................................................................................202
8.2.6 Changing Field Formats ....................................................................................................................204
8.2.7 Hiding Fields .......................................................................................................................................205
8.2.8 Hiding Levels ......................................................................................................................................205
8.3 Load a Previously Saved Display Options File................................................................ 209
8.4 Saving Display Options...................................................................................................... 210
Chapter 9: BitTracer Recording .........................................................................211
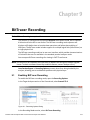
9.1 Enabling BitTracer Recording ........................................................................................... 211
9.2 Trigger Modes ..................................................................................................................... 212
9.3 Views Available for Captured Data ................................................................................... 212
9.4 De-skewing Data ................................................................................................................. 213
9.5 Data Display Formats ......................................................................................................... 214
9.6 Color-Coding of BitTracer Contents ................................................................................. 214
9.7 Report and Analysis Windows .......................................................................................... 215
9.8 Timing Measurements Bar................................................................................................. 215
9.8.1 Markers Bar.........................................................................................................................................216
Summit T3‐16 PCI Express Multi‐Lane Protocol Analyzer User Manual
ix
Teledyne LeCroy
Contents
9.9 Errors Bar ............................................................................................................................ 217
9.10 Symbols Bar...................................................................................................................... 218
9.11 Events Bar ......................................................................................................................... 219
9.12 Packets Bar ....................................................................................................................... 219
9.13 Decoding Bar .................................................................................................................... 221
9.14 Search................................................................................................................................ 222
9.15 Link Configuration............................................................................................................ 223
9.16 Export of BitTracer Capture to CATC Trace Format ..................................................... 225
9.16.1 Exports Involving Multiple Logical Links on One Physical Link .................................................225
9.16.2 Export To CSV Text ..........................................................................................................................225
9.17 Compressing and Expanding the Data View.................................................................. 226
9.18 Opening and Saving BitTracer Captures........................................................................ 226
Chapter 10: Reports and Tools ..........................................................................227
10.1 Trace Information ............................................................................................................. 228
10.2 Error Summary.................................................................................................................. 229
10.2.1 Error Summary for Storage Protocols............................................................................................230
10.2.2 Error Summary for Storage Protocols -- NVMe .............................................................................232
10.3 Traffic Summary ............................................................................................................... 233
10.3.1 Traffic Summary for Storage Protocols .........................................................................................234
10.3.2 Using the Traffic Summary Window to Search the CATC Trace..................................................235
10.3.3 NVMe Queue Time Metrics ..............................................................................................................236
10.3.4 Traffic Summary Buttons.................................................................................................................236
10.4 Bus Utilization................................................................................................................... 237
10.4.1 Bus Utilization Pop-up Menu...........................................................................................................238
10.4.2 Bus Utilization Buttons ....................................................................................................................239
10.5 Link Tracker ...................................................................................................................... 242
10.5.1 Using the Link Tracker Window ......................................................................................................243
10.5.2 Zooming In and Out..........................................................................................................................243
10.5.3 Collapsing Idle Time, Enabling Tool tips, and Resetting Column Widths ..................................243
10.5.4 Docking and Undocking the Window .............................................................................................244
10.5.5 Setting Markers.................................................................................................................................244
10.5.6 Calculating Time between DWORDs ..............................................................................................245
10.5.7 Hiding Traffic ....................................................................................................................................245
10.5.8 Link Tracker Buttons........................................................................................................................245
x
Summit T3‐16 PCI Express Multi‐Lane Protocol Analyzer User Manual
Contents
Teledyne LeCroy
10.6 Data Flow Window ............................................................................................................ 247
10.7 Flow Control Tracking...................................................................................................... 248
10.8 Using the CATC Trace Navigator .................................................................................... 250
10.8.1 Displaying the Navigator .................................................................................................................250
10.8.2 Navigator Toolbar.............................................................................................................................250
10.8.3 Navigator Ranges .............................................................................................................................251
10.8.4 To Determine Current Position .......................................................................................................251
10.8.5 To Reset Navigator Range...............................................................................................................253
10.8.6 Navigator Panes ...............................................................................................................................253
10.8.7 To Show/Hide Navigator Panes.......................................................................................................254
10.8.8 Navigator Slider ................................................................................................................................254
10.8.9 CATC Trace Navigator Legend........................................................................................................254
10.8.10 Using the Legend to Show/Hide Navigator Panes ......................................................................255
10.8.11 Using the Legend to Set the Priority of Information Display .....................................................255
10.9 Detail View......................................................................................................................... 256
10.10 LTSSM Flow Graph......................................................................................................... 257
10.11 Packet Header Bar .......................................................................................................... 258
10.12 Packet Data Window....................................................................................................... 258
10.13 Configuration Space View ............................................................................................. 259
10.13.1 Configuration Space Editor ...........................................................................................................261
10.14 Using Unit Metrics .......................................................................................................... 261
10.15 Metrics Defined for Link Transactions ......................................................................... 262
10.15.1 Metrics Defined for Split Transactions.........................................................................................262
10.16 Show Metrics in the CATC Trace Display..................................................................... 262
10.16.1 Collapsed Metrics Header Display................................................................................................262
10.16.2 Metrics Tool Tip Display ................................................................................................................263
10.16.3 Expanded Metrics Header Display................................................................................................263
10.17 Show Metrics in the Traffic Summary Window............................................................ 264
10.17.1 Reports at Split Transaction Level ...............................................................................................264
10.17.2 Reports at the Link Transaction Level .........................................................................................265
10.18 Show Metrics in the Bus Utilization Window ............................................................... 265
10.18.1 Unit-Based Averaging ....................................................................................................................266
10.18.2 Bus Utilization Window Features..................................................................................................267
10.18.3 Split Transaction Level Graphs.....................................................................................................267
10.18.4 Link Transaction Level Graphs .....................................................................................................268
10.19 Real-Time Statistics Window......................................................................................... 268
10.19.1 Real-Time Statistics Buttons.........................................................................................................269
10.19.2 Real-Time Statistical Monitor Pop-up Menu ................................................................................271
10.19.3 Real-Time Statistics Graph Areas.................................................................................................272
Summit T3‐16 PCI Express Multi‐Lane Protocol Analyzer User Manual
xi
Teledyne LeCroy
Contents
10.20 Memory I/O Space Editor ............................................................................................... 273
10.21 TC to VC Mapping........................................................................................................... 274
10.22 Timing and Bus Usage Calculations............................................................................. 275
10.22.1 Timing Calculator ...........................................................................................................................275
10.22.2 Queue Utilization ............................................................................................................................277
10.22.3 Bus Utilization.................................................................................................................................278
10.22.4 Split Transaction Performance .....................................................................................................278
10.22.5 Memory Writes Performance.........................................................................................................278
10.23 PCIe SSD Base Address Mapping................................................................................. 280
10.23.1 NVMe PCIe SSD Device Configuration .........................................................................................280
10.23.2 AHCI PCIe SSD Device Configuration ..........................................................................................284
10.23.3 PQI PCIe SSD Device Configuration.............................................................................................286
10.23.4 SOP and SCSI PCIe SSD Device Configuration...........................................................................288
10.24 Running Verification Scripts ......................................................................................... 289
10.24.1 NVMe Performance: Doorbell Timing ...........................................................................................292
10.25 Trace Expert .................................................................................................................... 293
10.25.1 Performance Analysis....................................................................................................................295
10.25.2 Trace Analysis Statistics ...............................................................................................................296
10.25.3 Error Reports ..................................................................................................................................298
10.25.4 Trace File Information ....................................................................................................................300
Chapter 11: Updates and Licensing ..................................................................303
11.1 Updating the Analyzer...................................................................................................... 303
11.2 License Keys..................................................................................................................... 303
11.3 License Information.......................................................................................................... 303
Appendix A: Configuration Space Decoding ...................................................305
12.1 Mandatory Definitions ...................................................................................................... 305
12.2 Mandatory Module Functions.......................................................................................... 305
12.2.1 DecodeRegister(offset) ....................................................................................................................305
12.2.2 GetSize() ............................................................................................................................................306
12.3 Configuration Register Types ......................................................................................... 306
12.4 Primitives........................................................................................................................... 306
12.4.1 GetRegisterField...............................................................................................................................306
12.4.2 AddField ............................................................................................................................................307
12.4.3 AddSubField( ....................................................................................................................................307
xii
Summit T3‐16 PCI Express Multi‐Lane Protocol Analyzer User Manual
Contents
Teledyne LeCroy
12.5 Helper File ......................................................................................................................... 308
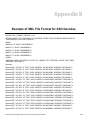
Appendix B: Example of XML File Format for SSD Decodes..........................309
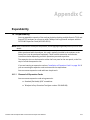
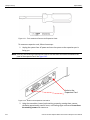
Appendix C: Expandability.................................................................................311
14.1 Expandability .................................................................................................................... 311
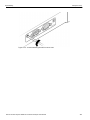
14.1.1 Removal of Expansion Cards..........................................................................................................311
14.1.2 Installation of Expansion Cards......................................................................................................316
14.1.3 Daisy-Chaining with CATC SYNC Expansion Cards.....................................................................319
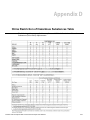
Appendix D: China Restriction of Hazardous Substances Table ...................321
Appendix E: How to Contact Teledyne LeCroy ................................................323
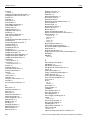
Index: ..................................................................................................................... 325
Summit T3‐16 PCI Express Multi‐Lane Protocol Analyzer User Manual
xiii
Teledyne LeCroy
xiv
Contents
Summit T3‐16 PCI Express Multi‐Lane Protocol Analyzer User Manual
Chapter 1
Overview
Designed for developers and validators, the Teledyne LeCroy Summit T3‐8™ is a Gen1/
Gen2/Gen3 PCI Express™ advanced verification system. By leveraging years of experience in protocol analysis tools for emerging markets, Summit T3‐8 blends sophisticated functionality with practical features to speed the development of PCI Express IP cores, semiconductors, bridges, switches, add‐in boards, and systems.
1.1
PCIe Protocol Suite Analyzer Hardware and Software
Features and Benefits
Summit T3‐8 Analyzer has these features and benefits:
Features
Powerful and Intuitive CATC Trace™ Analysis Software
Extensive Decoding
Intelligent Reporting
Sophisticated Viewing
4 GB Recording Capacity, 2 GB in each direction
Benefits
Faster interpretation and debug of PCI Express traffic with color‐coded, clearly labeled protocol elements in a graphical display.
Complete, accurate and reliable decoding of TLPs (Transaction Layer Packets), DLLPs (Data Link Layer Packets), NVMe, PQI, AHCI, ATA, SOP and SCSI command transactions and all PCI Express Primitives.
Quickly identify and track error rates and abnormal link or timing conditions. Display configuration space and protocol specification details.
View Packet, Link, Split, NVMe, PQI, AHCI ATA, SOP and SCSI command transaction levels of the PCI Express protocol. Collapsible/expandable headers with Tool tip explanations make it easy to navigate and interpret packet contents, headers, and commands. View packets, transactions of TLPs and DLLPs in classic CATC Trace™ format or in raw bit stream for deeper analysis.
Capture long recording sessions for analysis and problem solving.
Summit T3‐8 PCI Express Multi‐Lane Protocol Analyzer User Manual
1
Teledyne LeCroy
PCIe Protocol Suite Analyzer Hardware and Software
Flexible Host Interface
Downloadable CATC Trace Viewer
USB and GIGE.
Share and annotate CATC Trace recordings within a development team. Freely distributable PCIe Protocol Suite software enables collaborative analysis across sites and time zones.
Bidirectional x1‐x8,
2.5 GBps to 8.0 GBps
recording support
Field‐upgradeable firmware and recording engine
Flexible probing options
Accurate and non‐intrusive collection of PCI Express CATC Trace data.
External interface Dword to Transaction Level Viewer
1.1.1
Upgrades available for download direct from the Teledyne LeCroy website.
Supports a variety of probing options including slot interposers, MidBus probes and speciality probes.
Enables cross triggering between other test instruments.
View Dwords, Packet, Link, Split, NVMe, PQI, AHCI ATA, SOP and SCSI command transaction levels of the PCI Express protocol.
CATC Trace Software
Summit T3‐8 utilizes the CATC Trace to assist users in analyzing how PCI Express components work together, diagnose problems, and test for interoperability and standards compliance. The CATC Trace is a powerful and intuitive expert software system embedding detailed knowledge of the protocol hierarchy and intricacies, as defined in the protocol specification. The software allows the user to control the Analyzer and set specific real‐
time triggering and filtering conditions. The CATC Trace utilizes a Windows‐based graphical display that has been optimized for fast and easy navigation through a captured traffic session. Users are alerted as violations are detected at all levels of the protocol layering and can easily drill down on areas of interest or collapse and hide fields that are not relevant. 2
Summit T3‐8 PCI Express Multi‐Lane Protocol Analyzer User Manual
PCIe Protocol Suite Analyzer Hardware and Software
1.1.2
Teledyne LeCroy
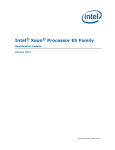
Summit T3-8 Analyzer
The Teledyne LeCroy Summit T3‐8 is Teledyne LeCroy’s high performance PCI Express analyzer for customers in server, workstation, desktop, graphics, storage and network card markets.
Figure 1.1: Summit T3-8 Analyzer
With advanced features such as support for PCI Express Spec 3.0, data rates from 2.5 to 8.0 GBps, lane widths from x1 to x8, and 4 GB of memory, the Summit T3‐8 provides unmatched capability and flexibility for developers and users of advanced PCI Express products. The Summit T3‐8 is the most advanced and sophisticated PCI Express Analyzer available in the market today.
As with other Teledyne LeCroy PCI Express analyzers, the Summit T3‐8 leverages the intuitive and powerful CATC Trace analysis software system, embedding a deep understanding of the PCI Express protocol hierarchy and intricacies. The colorful, intuitive and easy‐to‐use graphical display allows you to quickly capture and validate PCI Express product designs.
In addition to a full suite of advanced hardware and software features, the Summit T3‐8 has user‐convenience and analysis features, such as support for automatic “lane swizzling,” which allows a board developer to lay out a mid‐bus probe pad with lanes in non‐standard order, simplifying the design of the board. Internally, the Summit T3‐
8 maps the lanes back into their correct order and accurately displays the embedded bus traffic. An optional BitTracer™ mode allows bytes to be recorded as they come across the link, allowing debugging of PHY layer problems and combining the features of a logic analyzer format with a protocol analyzer format.
The Summit T3‐8 supports USB and GIGE host interfaces. By connecting over GIGE, engineers can operate the system remotely (for example, install the client software on their desktop systems to control an analyzer operating in a remote lab). Also, multiple engineers working collaboratively can time‐share use of a single analyzer, reducing the need for an additional analyzer for each engineer and increasing the cost effectiveness of the product.
Summit T3‐8 PCI Express Multi‐Lane Protocol Analyzer User Manual
3
Teledyne LeCroy
1.1.3
PCIe Protocol Suite Analyzer Hardware and Software
Features
1.1.4
Powerful and Intuitive CATC Trace Analysis Software System: The CATC Trace embeds deep understanding of the PCI Express protocol hierarchy and intrica‐
cies. This knowledge is presented in a colorful, intuitive and easy‐to‐use graphi‐
cal display, allowing you to quickly capture and validate PCI Express product designs. Protocol Hierarchical Viewing: Displays Packet, Transaction, Split, NVMe, PQI, AHCI, ATA, SOP and SCSI command transactions levels of the PCI Express proto‐
col, with increased drill‐down detail for PCI Express primitives, errors, payloads or individual packets.
Lane‐Reversal Compatible: Triggers, records, and displays PCI Express traffic log‐
ically, regardless of the physical configuration of the lanes. Statistical and Error Reporting: Provides a quick summary of the CATC Trace file to identify and track error rates and abnormal link or timing conditions. BitTracer Recording Mode (optional): Records the bytes exactly as they come across the link, allowing debugging of PHY layer problems. Auto Speed detection: Follows link transitions through speed changes.
Auto Calibration: Provides better signal recovery while recording traces.
Automatic Lane Swizzling Support: Allows board developers to lay out lanes in a non‐standard order, simplifying board design. Field‐upgradeable Firmware and Engine: Positions you to receive the latest PCIe Protocol Suite enhancements and future additional capabilities. Allows field upgrades of all system types. 4‐GB Data Buffer: Capture long time windows for in‐depth analysis and identifi‐
cation of erratic problems. GIGE Ethernet Connectivity: Allows connection to an Ethernet network and sharing of analyzer resources by multiple engineers. USB connectivity: Allows connection by USB cable.
CrossSync Application: The CrossSync application allows you to select analyzers for synchronization and manage the recording process.
Other Documents
For more information, refer to the following documents:
4
Teledyne LeCroy Analyzers File‐based Decoding Manual
PCIe Protocol Suite/Trainer Automation Manual
PCIe Protocol Suite VSE Manual
CrossSync Control Panel User Manual
Summit T3‐8 PCI Express Multi‐Lane Protocol Analyzer User Manual
Chapter 2
Hardware Description
The PCI Express™ system features Summit Analyzers.
2.1
System Components
2.2
Summit T3‐8 analyzer system
AC Power Cable
USB and Ethernet cables
PCIe Protocol Suite software program DVD‐ROM
(optional) probes and interposers (see “Adding Devices Manually” on page 12)
Host Machine Requirements
The Summit T3‐8 connects to host machine. Please consult the readme file on the installation DVD for the latest host machine requirements.
2.3
Summit T3-8 Front Panel Description
When powered on, the Summit T3‐8 activates the user‐accessible controls and LEDs on the front panel. Please see the Summit T3‐8 Quick Start for an illustration of the front panel.
WARNING: Do not open the enclosure. There are no operator serviceable parts inside. Refer servicing to Teledyne LeCroy.
The controls and LEDs are:
Power Switch (black): 1 = On and 0 = Off. Once the analyzer is powered off you need to wait at least 10 seconds before you power it back on, otherwise the ana‐
lyzer may not initialize properly.
UPSTREAM [7:0] connector: Connection to the probe for the capture of upstream direction of the link.
Speed LEDs: Indicate the current speed for the Upstream and Downstream link:
2.5 GT/s, 5 GT/s, or 8 GT/s.
LCD Menus: Allow you to set up the Summit T3‐8 and view status.
LCD Menu Navigation Buttons: Allow you to navigate through the LCD menu.
DOWNSTREAM [7:0] connector: Connection to the probe for the capture of Summit T3‐8 PCI Express Multi‐Lane Protocol Analyzer User Manual
5
Teledyne LeCroy
Summit T3‐8 Rear Panel Description
2.4
downstream direction of the link.
Trigger: In for SMA external trigger input. Trigger Input has a 1.5 kohm pullup resistor to 3.3 volts and a 50 ohm RC termination.
Threshold voltage for Trigger Input is 0.55 volts.
Voltages below 0.4 volts will be detected as low, voltages above 0.7 volts will be detected as high.
The minimal pulse width is 70ns for rising pulses and 20us for falling pulses. When Internal Triggering option is selected in the recording options, any edge of this signal will cause the analyzer to trigger.
Out for SMA external trigger output.
Output buffer is 3.3 volts. The buffer can drive up to 32 mA of current and meet VOH (2.5 V) and VOL (0.5 V) thresholds.
Output buffer can drive a 50 ohm DC load (such as scope input).
Expansion Slot connector: Used for Teledyne LeCroy Expansion cards.
USB connector: USB Type B connector for connection to host machine.
ETHERNET connector: 1 Gigabit Ethernet connector for connection to host machine.
Summit T3-8 Rear Panel Description
The Summit T3‐8 rear panel contains a Wide‐range AC Connector Module with
Power socket
Enclosed 5.0 A 250 V fuse
It also has an x16 Expansion Slot, which is used for Teledyne LeCroy Expansion cards.
6
Summit T3‐8 PCI Express Multi‐Lane Protocol Analyzer User Manual
Chapter 3
Installation and Setup
The Summit T3‐8 is a standalone system.
You can begin PCI Express recordings after following the steps in this chapter. 3.1
Installing the PCIe Protocol Suite software
PCIe Protocol Suite software operates all of Teledyne LeCroy’s PCI Express protocol Analyzer and Exerciser products:
The PCIe Protocol Suite software is installed on a Microsoft® Windows®‐based host machine and serves as the interface for the Exerciser and/or Analyzer.
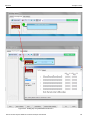
To install the Protocol Software Suite on the host machine: 1. Insert the Installation DVD‐ROM into the DVD drive on the host machine.
2. The installation automatically starts setup, unless Auto Run is off. In that case, select the DVD‐ROM from “My Computer” and click Setup.
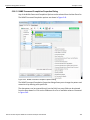
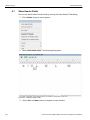
3. After the warning to close all other programs and before starting the installation, the Install component selection opens.
4. Select components for installation.
5. Click Next to complete the installation.
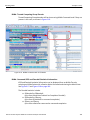
6. To start the application, launch the PETracer program from the Start menu: Start > Programs > LeCroy > PCIe Protocol Suite > PCIe Protocol Suite
Summit T3‐8 PCI Express Multi‐Lane Protocol Analyzer User Manual
7
Teledyne LeCroy
Setting Up the Summit T3‐8 Analyzer using a USB Connection
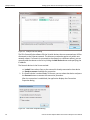
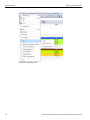
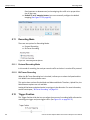
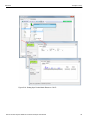
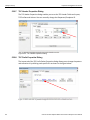
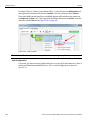
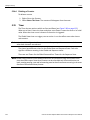
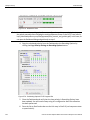
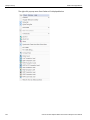
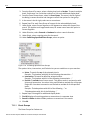
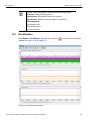
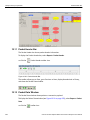
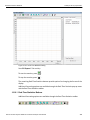
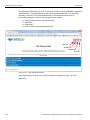
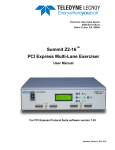
The PCIe Protocol Suite program displays.
Figure 3.2: Teledyne LeCroy PCI Express Protocol Analyzer Application
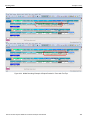
Note: The software may be used with or without the Analyzer. When used without an Analyzer attached to the computer, the program functions as a CATC Trace Viewer to view, analyze and print captured traffic. 3.2
Setting Up the Summit T3-8 Analyzer using a USB Connection
To set up the Analyzer using a USB connection: 1. Connect the Analyzer to a 100‐volt to 240‐volt, 50 Hz to 60 Hz, 120 W power outlet using the provided power cord. 2. Connect the USB port to a USB port on the host machine using a USB cable.
Note: To connect using Ethernet, see “Setting Up the Summit T3‐8 Analyzer using an Ethernet Connection” on page 9.
3. Turn on the front power switch. Note: At power‐on, the Analyzer initializes itself in approximately five seconds and performs an exhaustive self‐diagnostic that lasts about forty seconds. The results are reflected by messages 8
Summit T3‐8 PCI Express Multi‐Lane Protocol Analyzer User Manual
Setting Up the Summit T3‐8 Analyzer using an Ethernet Connection
Teledyne LeCroy
on the Summit T3‐8 LCD display. If the LCD display indicates failure, call Teledyne LeCroy Customer Support for assistance. 4. Follow the Microsoft® Windows® on‐screen Plug‐and‐Play instructions for the automatic installation of the Analyzer as a USB device on your analyzing host machine. (The required USB drivers are installed on your system by the PCIe Protocol Suite software installation.)
Click Finish when you see the message that says “Windows has finished installing the software that your new hardware requires” and the file has been installed in your host machine. 3.3
Setting Up the Summit T3-8 Analyzer using an Ethernet
Connection
1. Connect the Analyzer to a 100‐volt to 240‐volt, 50 Hz to 60 Hz, 120 W power outlet using the provided power cord. 2. Connect the Summit T3 Analyzer to the network. The Ethernet port is on the front of the Analyzer.
Note: To connect using USB, see “Setting Up the Summit T3‐8 Analyzer using a USB Connection” on page 8.
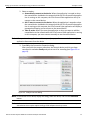
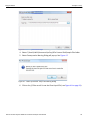
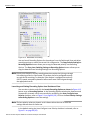
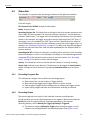
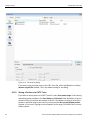
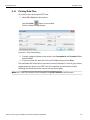
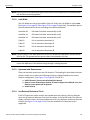
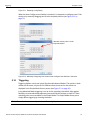
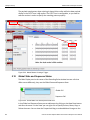
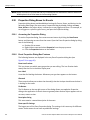
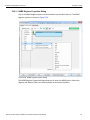
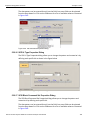
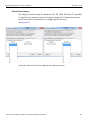
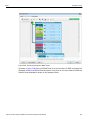
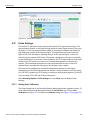
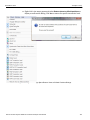
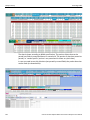
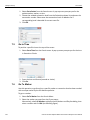
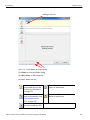
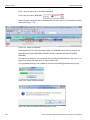
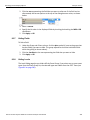
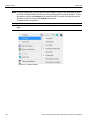
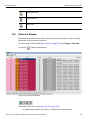
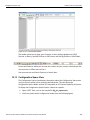
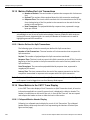
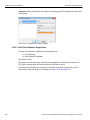
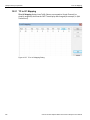
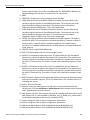
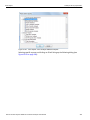
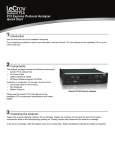
3. Turn on the front power switch. Note: At power‐on, the Analyzer initializes itself in approximately five seconds and performs an exhaustive self‐diagnostic that lasts about forty seconds. The results are reflected by messages on the Summit T3‐8 LCD display. If the LCD display indicates failure, call Teledyne LeCroy Customer Support for assistance. 4. After you have installed the PCIe Protocol Suite application software, perform the following procedure to connect to a Summit T3‐8 analyzer in the local network. Select the Setup > All connected devices… menu in the PCIe Protocol Suite application to display the Analyzer Devices dialog.
Summit T3‐8 PCI Express Multi‐Lane Protocol Analyzer User Manual
9
Teledyne LeCroy
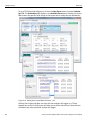
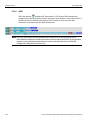
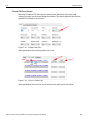
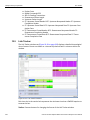
Setting Up the Summit T3‐8 Analyzer using an Ethernet Connection
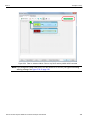
Figure 3.3: Analyzer Devices Dialog
The PCIe Protocol Suite software fills the list with devices that are connected over USB or discovered on the Ethernet network. The discovery mechanism works only within one network subnet. If a Summit is connected to the network on a different subnet, you can manually add the subnet to the list by clicking the Add Device button and specifying the IP address.
The Summit devices in the list are marked:
Locked: Some other client on the network is already connected to that device
Ready to connect: Available for connection
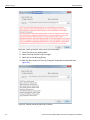
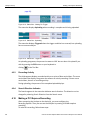
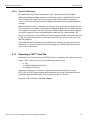
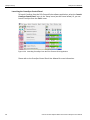
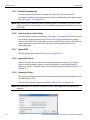
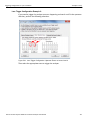
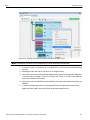
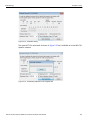
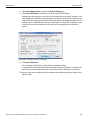
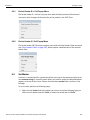
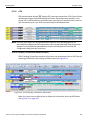
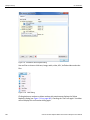
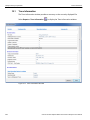
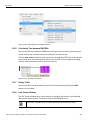
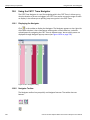
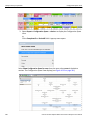
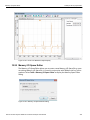
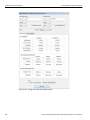
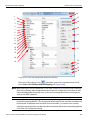
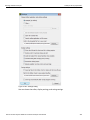
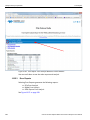
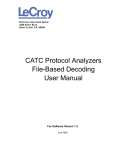
1. If a Summit device is marked Ready To Connect, you can select that device and press the Connect button to execute the connection procedure. After the connection is established, the application displays the Connection Properties dialog.
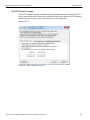
Figure 3.4: Connection Properties Dialog
10
Summit T3‐8 PCI Express Multi‐Lane Protocol Analyzer User Manual
Setting Up the Summit T3‐8 Analyzer using an Ethernet Connection
Teledyne LeCroy
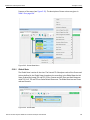
2. Select an option:
Automatically connect to the device: When the application is started or when the named device is added to the network while the PCIe Protocol Suite applica‐
tion is running on this computer, the PCIe Protocol Suite application will try to connect to the named device. Ask if I want to connect to the device: When the application is started or when the named device is added to the network while the PCIe Protocol Suite applica‐
tion is running on this computer, the PCIe Protocol Suite application will display a message box allowing you to connect to the named device. Take no action: When you start the application or when you want to add the named device to the network while the PCIe Protocol Suite application is running on this computer, you must connect manually to use the named device. Note: When you close the application on this computer (or you perform a manual disconnect), the application disconnects from the device. 3. Press OK in the Connection Properties dialog.
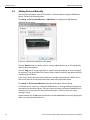
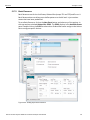
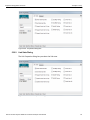
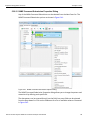
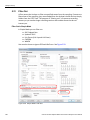
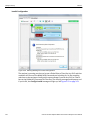
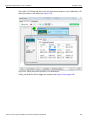
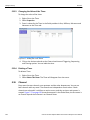
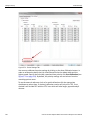
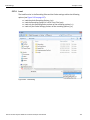
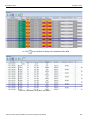
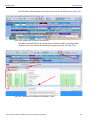
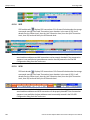
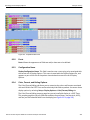
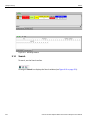
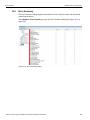
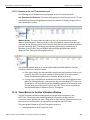
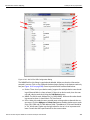
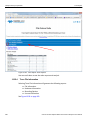
After you finish the connect procedure, the Summit device to which you have connected is marked as Ready and you can use it for recording (see Figure 3.5 on page 11).
Figure 3.5: Analyzer Devices Dialog
Note: To disconnect from a device, display this dialog, select the device, and click the Disconnect button.
Note: As of version PCIe Protocol Suite version 7.34, the software is able to access a Summit analyzer via VPN solutions that require explicit bindings to PPP adapters that they create.
Summit T3‐8 PCI Express Multi‐Lane Protocol Analyzer User Manual
11
Teledyne LeCroy
3.4
Adding Devices Manually
Adding Devices Manually
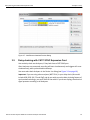
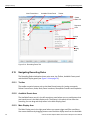
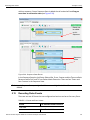
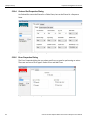
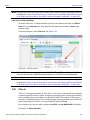
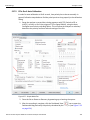
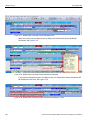
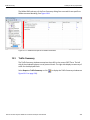
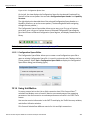
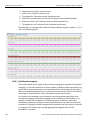
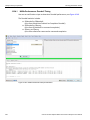
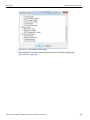
You can locate and add a summit T3 located in a Ethernet subnet using the Add Device button. Perform the following steps:
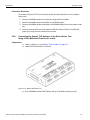
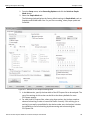
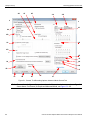
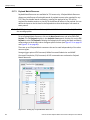
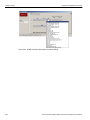
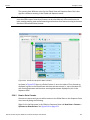
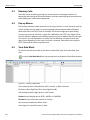
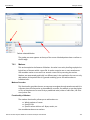
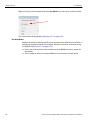
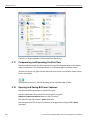
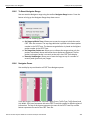
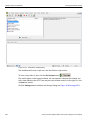
Click Setup ‐> All Connected Devices ‐> Add Device ‐> to display the Add Ethernet Attached Device dialog.
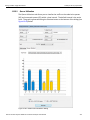
Figure 3.6: Add Ethernet Attached Devices Dialog
Click the Recent button to display a list of recently added devices (up to 15) and quickly add a recently used device.
Click the Ping button to ping a device as a network node (prompting an error message if no response). Ping also allows PCIe Protocol Suite to detect a device type before actually connecting to the device. If the "Ping" feature discovers that the device is already connected and "locked" then it will inform the user and provide information about who locked the device.
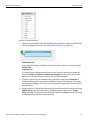
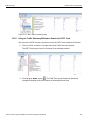
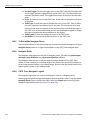
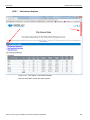
Click Setup ‐> All Connected Devices to display the Analyzer Devices dialog .
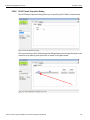
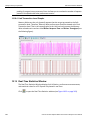
If software fails to connect to a manually added device, a message displays notifying the user about the connection failure. The user is given the option to keep the failed device in the device list, in this case PCIe Protocol Suite displays a "Failed to connect" status message in grey.
Square brackets for IP addresses are used for manually added devices to easily distinguish them from auto‐discovered devices. 12
Summit T3‐8 PCI Express Multi‐Lane Protocol Analyzer User Manual
Daisy‐chaining with CATC SYNC Expansion Card
Teledyne LeCroy
Figure 3.7: Add Ethernet Attached Devices Dialog
3.5
Daisy-chaining with CATC SYNC Expansion Card
You can daisy‐chain two Analyzers, if they both have a CATC SYNC port:
After Analyzers are connected, recording will start simultaneously and triggers will occur simultaneously, with synchronized timestamps.
You must select both Analyzers in the Device List dialog (see Figure 3.3 on page 10).
Important: If you are using other analyzers (NOT PCIe!) in your daisy chain (this would include USB, DDR, SAS, FC and GigE) and do not wish to use the daisy chaining feature of synchronized recordings, you must UNPLUG the cable! If you do not unplug, the electrical signal prevents recording on all Analyzers.
Summit T3‐8 PCI Express Multi‐Lane Protocol Analyzer User Manual
13
Teledyne LeCroy
3.6
Interposers and Probes
Interposers and Probes
The Summit T3‐8 works with Interposers and Probes. Some of them are listed below.
Gen2 MidBus Probe: The Gen2 MidBus Probe is designed for use with the Summit T3‐8 Analyzer and supports lane widths from x1 to x8 at data rates of 2.5 GT/s (Gen1) or 5.0 GT/s (Gen2). Gen2 Multi‐lead Probe: The Gen2 Multi‐lead Probe is designed for use with the Summit T3‐8 Protocol Analyzer. The probe consists of 1 to 2 probe pods, which are connected to the analyzer using either iPass Y‐Cables (for x1 and x4) or straight x4‐to‐x8 iPass cables (for x8). Each probe pod supports up to 8 Flex Tips, with each Flex Tip connected via two coax cables.
Gen2 Active Slot Interposer: The Gen2 Active Slot Interposer is designed for use with the Summit T3‐8 Analyzer and supports lane widths from x1 to x8 at data rates of 2.5 GT/s (Gen1) or 5.0 GT/s (Gen2). For lane widths up to x8, one iPass Y‐
cable is required.
Gen3 Slot Interposer: The Gen3 Slot Interposer is designed for use with the Summit T3‐8 Analyzer and supports lane widths from x1 to x8 at data rates of 2.5 GT/s (Gen1), 5.0 GT/s (Gen2), and 8.0 GT/s (Gen3). For lane widths up to x8, one iPass Y‐cable is required. Gen3 MidBus Probe: The Gen3 MidBus Probe is designed for use with the Summit T3‐8 Analyzer and supports lane widths from x1 to x8 at data rates of 2.5 GT/s (Gen1), 5.0 GT/s (Gen2), and 8.0 GT/s (Gen3). Please refer to the Interposers and Probes for Teledyne LeCroy PCI Express Systems datasheet at www.teledyneleroy.com for a comprehensive list.
3.7
Using Interposers
The following section describes how to connect interposers.
3.7.1
Gen2 Active Interposer
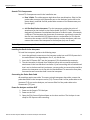
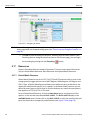
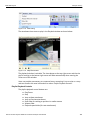
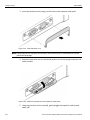
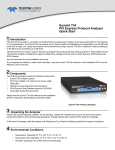
The following figure shows the Gen2 Active Interposer connections.
Figure 3.8: Connecting the Summit T3-8 Analyzer to the Device Under Test Using a
Gen2 Active Interposer
14
Summit T3‐8 PCI Express Multi‐Lane Protocol Analyzer User Manual
Using Interposers
Teledyne LeCroy
Summit T3-8 Components
Summit T3‐8 components used in the installation are:
iPass Y‐Cable: The cable supports eight lanes from two directions. Side A of the probe cable connects to the Upstream port on the Analyzer (on the left in the photo above), and Side B of the probe cable connects to the Downstream port (on the right).
x16 Slot Gen2 Active Interposer: The slot Interposer provides the point of attachment for the Analyzer to the Device Under Test (DUT). The Interposer is designed to fit between a motherboard and one of its device cards ‐ for example, a LAN card. The Interposer has three sets of connectors: a gold male connector that fits into a standard x16 PCI Express slot on a motherboard, a PCIe female connector that accepts a x16 PCI Express device, and two Interposer cable con‐
nectors that connect the Interposer to the Analyzer (only one is used). Note: Edge reducers are required for lane widths less than x16.
Installing the Gen2 Active Interposer
To install the Interposer, perform the following steps.
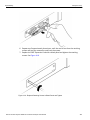
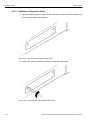
1. Insert the gold male connector on the Interposer probe into a x16 PCI Express slot in the motherboard. Use edge adaptors for x1, x4, and x8 slots.
2. Insert the PCI Express DUT into the Interposer’s PCIe female device connector. 3. The slot Interposer is shipped from Teledyne LeCroy with a metal face plate for attachment to the host machine’s enclosure. If you are working with a motherboard that is not in the host machine’s enclosure, you may prefer to remove the metal face plate so the Interposer can sit flat with the motherboard. To remove the face plate, unscrew the two screws that hold it onto the Interposer
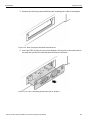
Connecting the Probe Data Cable
x8 recordings require one cable. To connect a single Interposer data cable, connect the probe data cable to the Interposer card at [7:0]. Connect Side A of the probe cable to the Upstream [7:0] port on the Analyzer, and connect Side B of the probe cable to the Downstream [7:0] port.
Power On Analyzer and then DUT
1. Power on the Summit T3‐8 Analyzer.
2. Power on the DUT.
3. Open the PCIe Protocol Suite software on the host machine. The Analyzer is now ready for PCI Express traffic recording.
Summit T3‐8 PCI Express Multi‐Lane Protocol Analyzer User Manual
15
Teledyne LeCroy
3.7.2
Using Interposers
Gen3 Interposer
The following figure shows the Gen3 Interposer connections.
Figure 3.9: Connecting the Summit T3-8 Analyzer to the Device Under Test Using a
Gen3 Interposer
Summit T3-8 Components
Summit T3‐8 components used in the installation are:
iPass Y‐Cable: The cable supports eight lanes from two directions. Side A of the probe cable connects to the Upstream port on the Analyzer (on the left in the photo above), and Side B of the probe cable connects to the Downstream port (on the right).
x16 Slot Gen3 Interposer: The slot Interposer provides the point of attachment for the Analyzer to the Device Under Test (DUT). The Interposer is designed to fit between a motherboard and one of its device cards ‐ for example, a LAN card. The Interposer has three sets of connectors: a gold male connector that fits into a standard x16 PCI Express slot on a motherboard, a PCIe female connector that accepts a x16 PCI Express device, and two Interposer cable connectors that con‐
nect the Interposer to the Analyzer. Installing the Gen3 Interposer
To install the Interposer, perform the following steps:
1. Insert the gold male connector on the Interposer probe into a x16 PCI Express slot in the motherboard. Interposers are available in x1, x4, x8, and x16 versions.
2. Insert the PCI Express DUT into the Interposer’s PCIe female device connector. 3. The slot Interposer is shipped from Teledyne LeCroy with a metal face plate for attachment to the host machine’s enclosure.
16
Summit T3‐8 PCI Express Multi‐Lane Protocol Analyzer User Manual
Using Probes
Teledyne LeCroy
Connecting the Probe Data Cable
x8 recordings require one cable. To connect a single Interposer data cable, connect the probe data cable to the Interposer card at [7:0]. Connect Side A of the probe cable to the Upstream [7:0] port on the Analyzer, and connect Side B of the probe cable to the Downstream [7:0] port.
3.8
Using Probes
3.8.1
Connecting the Summit T3-8 Analyzer to the Device Under Test
Using a Gen3 MidBus Probe
Note: Mid‐bus probes require attachment‐pad and reference‐clock connections. For information about how to connect the attachment pad, reference clock, and cables in your system, see the MidBus Probe Manual. Components
Figure 3.10: iPass Y-cable
Figure 3.11: MidBus Probe Pod
Summit T3‐8 PCI Express Multi‐Lane Protocol Analyzer User Manual
17
Teledyne LeCroy
Using Probes
Figure 3.12: Half-size Gen2 Mid-bus Probe Cable and Header Assembly
Figure 3.13: Clock Cable
Connections Overview for Gen2 MidBus Probe
Use a 1‐pod setup.
Use the iPass Y‐cables to connect the probe data connectors on the Analyzer to the MidBus pod(s). On the other side of the pod, connect the MidBus probe assembly.
Connect the header on the MidBus probe assembly to the MidBus footprint on the System Under Test (host platform or root complex under test). The following picture shows two midbus footprints, with one connected to the MidBus probe assembly.
Figure 3.14: Connect MidBus Probe to MidBus Footprint
18
Summit T3‐8 PCI Express Multi‐Lane Protocol Analyzer User Manual
Using Probes
Teledyne LeCroy
Connection Procedure
To connect the Summit T3‐8 to the System Under Test (host platform or root complex under test): 1. Connect the MidBus pods to the Analyzer using the iPass Y‐cables.
2. Connect the MidBus probe assemblies to the MidBus pods.
3. Connect the MidBus probe assemblies to the MidBus footprints on the system under test. 4. Connect external reference clock signal to Mid‐Bus External Clock In on Mid‐Bus probe pod, using external reference clock cable.
3.8.2
Connecting the Summit T3-8 Analyzer to the Device Under Test
Using a Gen3 Multi-lead Probe for x1 and x4
Components
1 iPass Y‐cable for x1 and x4 (see “iPass Y‐cable” on page 17). 1 Multi‐lead Probe Pod for x1 and x4
Figure 3.15: Multi-Lead Probe Pod
Up to 16 MidBus Probe SSMP Cables, and up to 8 Flexible Leads, per pod
Summit T3‐8 PCI Express Multi‐Lane Protocol Analyzer User Manual
19
Teledyne LeCroy
Using Probes
Figure 3.16: Midbus Probe SSMP Cables
1 Clock Cable (see Figure 3.13 on page 18).
Connections for Gen2 Multi-lead Probe
Overview
Use a 1‐pod setup.
For x1 or x4, use the iPass Y‐cable to connect the probe data connectors on the Analyzer to the pod(s). On the other side of the pod, connect the flexible lead tips.
Connection Procedure
To connect Summit T3‐8 to the System Under Test (host platform or root complex under test): 1. Connect the pods to the Analyzer using the iPass Y‐cable cables.
2. Connect the flexible lead tips to the pods using the SSMP cables.
3. Connect the lead tips to the system under test by soldering to the trace. 3.8.3
Connecting the Summit T3-8 Analyzer to the Device Under Test
Using a Gen2 Multi-lead Probe for x8
Components
2 iPass Straight cables for x8
Figure 3.17: iPass Straight Cables
20
Summit T3‐8 PCI Express Multi‐Lane Protocol Analyzer User Manual
Expansion Mode using Two Summit T3‐8 Analyzers
Teledyne LeCroy
2 Multi‐lead Probe pods for x8
(See “1 Multi‐lead Probe Pod for x1 and x4” on page 19).
Up to 16 MidBus Probe SSMP Cables, and up to 8 Flexible Leads, per pod.
(See Figure 3.15 on page 19).
1 Clock Cable (see Figure 3.13 on page 18).
Connections Overview for Gen2 Multi-lead Probe
Use a 1‐pod setup.
For x8, use the straight iPass cables to connect the probe data connectors on the Analyzer to the pod(s). On the other side of the pod, connect the flexible lead tips.
Connection Procedure
To connect Summit T3‐8 to the System Under Test (host platform or root complex under test): 1. Connect the pods to the Analyzer using the straight iPass cables.
2. Connect the flexible lead tips to the pods using the SSMP cables.
3. Connect the lead tips to the system under test by soldering to the trace. 3.9
Expansion Mode using Two Summit T3-8 Analyzers
Expansion Mode
You can setup two Summit T3‐8 analyzers to work together as one analyzer, in Expansion Mode, to support x16 recording capability. To set up the hardware configuration, both analyzers must have a CATC‐Sync card plugged into a front or back expansion slot. Then perform the following steps:
1. Before setting up the hardware configuration, turn power off on both analyzers.
2. Using a CATC‐Sync Cable, connect the Sync‐Out connector on the CATC‐Sync card of one Summit T3‐8 analyzer to the Sync‐In connector on the CATC‐Sync card of the second Summit T3‐8 analyzer.
3. Using an x16 Expansion Cable, connect the Expansion connector on the back of one Summit T3‐8 analyzer to the Expansion connector on the back of the other Summit T3‐8 analyzer.
4. Connect both analyzers to the host machine that has the PCIe Protocol Suite application.
5. After completing the hardware configuration, power on both Summit T3‐8 analyzers.
6. Open the PCIe Protocol Suite application on the host machine.
The software automatically detects and configures the analyzers to work as one x16 ‐ capable analyzer. One Summit T3‐8 analyzer is assigned the Upstream direction, and the other analyzer is assigned the Downstream direction. The LCD display on the front of each analyzer displays its direction assignment.
Summit T3‐8 PCI Express Multi‐Lane Protocol Analyzer User Manual
21
Teledyne LeCroy
Expansion Mode using Two Summit T3‐8 Analyzers
Standalone Mode
To reconfigure a Summit T3‐8 analyzer to work alone, in Standalone Mode, first turn power off to the analyzer.
Disconnect the CATC Sync and Expansion cables from the analyzer.
After completing the hardware configuration, power on the Summit T3‐8 analyzer.
Note: When operating two Summit T3‐8 analyzers in X16 Expansion Mode, neither the TLP Payload nor the storage protocol triggers (NVMe, AHCI, ATA) are available for selection in the sequencer.
22
Summit T3‐8 PCI Express Multi‐Lane Protocol Analyzer User Manual
Chapter 4
Software Overview
4.1
The PCIe Protocol Suite Software
The PCIe Protocol Suite™ software administers Analyzer platforms and handles all CATC Trace analysis and display. The core software is thus the same for all of Teledyne LeCroy's PCI Express products.
The software runs on a Windows® based host machine that is attached to the Analyzer via an Ethernet or USB 2.0 connection (USB 1.0 is also supported). PCIe Protocol Suite software can be used without the Analyzer as a CATC Trace viewer for viewing, analyzing and printing traces.
The PCIe Protocol Suite software operates on systems using Windows 8 (x86 and x64), Windows Server 2012 (x64), Windows 7 (x86 and x64), Windows Server 2008R2 (x64) and Windows XP (x86). The latest Service Pack available for the Windows OS in use is required. It is recommended that you use one of the supported 64‐bit Windows versions listed above as they allow using more RAM than the 32‐bit ones.
Figure 4.1: Sample of a CATC Trace
Summit T3‐8 PCI Express Multi‐Lane Protocol Analyzer User Manual
23
Teledyne LeCroy
4.2
Application Layout
Application Layout
The PCIe Protocol Suite application contains the following components:
Title bar: The title bar is at the top of the application window and displays the CATC Trace file name or generation script name.
Menu bar: The menu bar is located below the title bar, by default. The menu bar can be moved by clicking a blank area of the bar and then dragging the menu to a new position. It can be docked in another part of the application window or moved outside of the window to become a floating menu.
Toolbar: The toolbar is composed of buttons that represent the commonly used commands. The toolbar divides into smaller toolbars that can be moved and docked in a new position or made to float outside of the window.
Display area: The display area is the main part of the application window in which CATC Traces are displayed.
Status bar: The status bar is located at the bottom of the application window. The left end of the status bar displays descriptions of buttons and menu items when the mouse is positioned over them. The right end of the bar shows the search direction.
4.3
Using the Toolbar
You can use the PCIe Protocol Suite application Toolbar as a shortcut to most of the operations supplied by the menus
Figure 4.2: Summit T3 Toolbar
Opens a previously recorded CATC Trace file.
Stop Recording.
Setup Recording Options
Opens the Recording Options dialog.
Real Time Statistics monitor
Opens a window that displays real‐time information.
Start Recording.
24
Summit T3‐8 PCI Express Multi‐Lane Protocol Analyzer User Manual
Using the Toolbar
Teledyne LeCroy
Displays CATC Trace view.
Displays color spreadsheet view.
Displays compressed CATC Trace view.
Displays black and white spreadsheet view.
Zoom in display.
Advanced Hiding Options
Opens a dialog box that allows you to select items to hide from view.
Zoom out display.
Hide Unassociated Traffic
Hides the lower‐level transaction packets. Example: Link Transactions and Packets are considered "unassociated" when using Split Transaction Level view.
Hide Training Sequence.
Compact View
Toggles compacting of training sequences to analyze CATC Trace data faster, or no compacting to display more data.
Hide SKIP and Update FC packets.
Find
Opens a dialog box that allows you to select one or more items to find in the recording, then searches to that point.
Hide Upstream recording/
traffic.
Find Next. Repeats last Find or Search action.
Hide Downstream traffic/
recording.
Quick Search window: Allows user to search for pre‐defined terms or type in their own term to search for. See “Quick Search Feature” on page 40.
View Packet Level data.
Summit T3‐8 PCI Express Multi‐Lane Protocol Analyzer User Manual
View ATA Transaction Level data.
25
Teledyne LeCroy
Using the Toolbar
View Split Transaction Level data.
View PQI, SOP and SCSI Transaction Level dta pull down menus
View NVME Transaction Level and Command data pull down menus
View AHCI and ATA Transaction Level data pull down menus
26
Trace Expert
Generates data on Performance Analysis, Trace Analysis Statistics, Error Reports and Trace Information.
Opens the Data Flow window.
Shows recorded data in a compressed tabular format.
File Information
Lists the conditions under which the recording was made.
Navigator. Shows/hides the Navigator bar ‐ a utility that lets you easily navigate the CATC Trace
Error Report
Opens a window that lists all errors identified in the recording.
Detail View
Shows the Detail view of the selected packet.
Traffic Summary
Opens a window that lists all events that occurred during the recording
Running Verification Scripts
Runs selected Verifcation Scripts
Bus Utilization
Opens a window that graphically represents various information about the recording.
LTSSM Flow Graph
Shows a state diagram of the Link Training and Status State machine.
Summit T3‐8 PCI Express Multi‐Lane Protocol Analyzer User Manual
Multi‐Segment Toolbar
Teledyne LeCroy
Link Tracker
Opens a window that displays symbol information per lane.
Opens view for TCG Security Codes.
TCG decoding is performed using NVMe Command Level option.
Displays the Data/Payload window for the current packet.
Displays the Packet Header bar.
Opens a window that displays the header information in the current packet, as it would be viewed in the specification.
Opens the Timing and Bus Usage Calculations window.
4.4
Multi-Segment Toolbar
First Segment. Open first segment in the multisegment CATC Trace.
Index file. This button becomes active if a multisegment CATC Trace file is open and displays the index file for the recording.
Previous segment. Open previous segment in the multisegment CATC Trace.
Next Segment. Open next segment in multisegment CATC Trace.
Last segment. Open last segment in multisegment CATC Trace.
4.4.1
Toolbar Hide Buttons
The PCIe Protocol Suite application toolbar has five buttons related to show/hide of CATC Trace file contents. The buttons allow you to quickly adjust the display to your needs.
Hide Training: Brings up a drop‐down menu that lets you to hide all or a portion of the packets in the training portion of the CATC Trace.
Summit T3‐8 PCI Express Multi‐Lane Protocol Analyzer User Manual
27
Teledyne LeCroy
Multi‐Segment Toolbar
Hide SKIP and Update FC: Brings up a drop‐down menu that lets you hide SKIP, Update FC packets and hide EDS packets in a CATC Trace.
Hide Upstream: Hide all traffic from endpoint devices to the root complex.
Hide Downstream: Hide all traffic from the root complex to endpoint devices.
Advanced Hiding Options: Brings up the Level Hiding pane of the Display Options window. Use this pane to tune the show/hide options within the CATC Trace display. You can also select Setup > Display Options from the menu to display this dialog.
Hide Unassociated Traffic: Hides the lower‐level transaction packets. Example: Link Transactions and Packets are considered "unassociated" when using Split Transaction Level view.
28
Summit T3‐8 PCI Express Multi‐Lane Protocol Analyzer User Manual
Multi‐Segment Toolbar
Teledyne LeCroy
Figure 4.3: Display Options
Summit T3‐8 PCI Express Multi‐Lane Protocol Analyzer User Manual
29
Teledyne LeCroy
4.5
Using the Menus
Using the Menus
The PCIe Protocol Suite application main display includes the following set of pull‐down menus:
4.5.1
30
File Menu
New PETrainer Script
Creates a new Traffic Generation file.
Open
Opens a file.
Close
Closes the current file.
Save as
Saves all or a specified range of packets to a uniquely named file.
Convert Old Files
Convert CATC Trace files made in previous versions of PETracer to the new format for PETracer version 5.0 and higher.
Print
Prints part or all of the current traffic data file.
Print Preview
Produces an on‐screen preview before printing.
Print Setup
Setup your current or new printer.
Clean Up Decoder Temp Files
Let’s you selectively delete decoder temp files (see “Clean Up Decoder Temp Files” on page 32).
Edit Comment
Create or edit the comment field in a CATC Trace file.
Export
>> to Text >> Packets to CSV Text
>> to Generator File Format
Saves all or part of a CATC Trace to a text file or traffic generation file. This text file summarizes the traffic in the CATC Trace.
Saves the CATC Trace to a text file in Comma Separated Value (CSV) format.
Exit
Exit the PCIe Protocol Suite application.
Saves the CATC Trace to a generation file.
Summit T3‐8 PCI Express Multi‐Lane Protocol Analyzer User Manual
Using the Menus
Teledyne LeCroy
File Dialog
Figure 4.4: File Dialog
Summit T3‐8 PCI Express Multi‐Lane Protocol Analyzer User Manual
31
Teledyne LeCroy
Using the Menus
Clean Up Decoder Temp Files
This command deletes selected decoder temp files from the selected folder. The file types effected by this command are:
*.pem
*.pex
*.peraw
*.mpex
*.peg
To use this command follow the steps below:
1. The Sample File Folder has Temp files for every trace that has been opened: See Figure 4.5.
Figure 4.5: Sample Files Folder After Opening a Variety of Traces
2. Now select the File ‐> Clean Up Decoder Temp Files (see Figure 4.4 on page 31).
3. The following Dialog will pop up : See Figure 4.6 on page 33.
32
Summit T3‐8 PCI Express Multi‐Lane Protocol Analyzer User Manual
Using the Menus
Teledyne LeCroy
Figure 4.6: Clean Up Decoder Temp Files Dialog
4. Select C:\Users\Public\Documents\LeCroy\PCIe Protocol Site\Sample Files folder
5. Select Cleanup and a Warning Dialog will pop up. See Figure 4.7.
Figure 4.7: Clean Up Decoder Temp Files Warning Dialog
6. Click on Yes, (if files are still in use the Clean Up will Fail, see Figure 4.8 on page 34).
Summit T3‐8 PCI Express Multi‐Lane Protocol Analyzer User Manual
33
Teledyne LeCroy
Using the Menus
Figure 4.8: Clean Up Decoder Temp Files if Files are Still Open
7. Close Files you’re not working with.
8. Select Clean Up Decoder Temp Files again.
9. Select Yes on the Warning Dialog.
10. With the files closed, the Clean Up Dialog will respond as shown below (see Figure 4.9).
Figure 4.9: Results of Running Clean Up Command
34
Summit T3‐8 PCI Express Multi‐Lane Protocol Analyzer User Manual
Using the Menus
Teledyne LeCroy
11. Confirm that the Clean Up Command was successful by viewing the C:\Users\Public\Documents\LeCroy\PCIe Protocol Site\Sample Files folder contents, (see Figure 4.10).
Figure 4.10: Sample File Folder After Temp File Clean Up
12. Compare Figure 4.5 on page 32 with Figure 4.10 to ensure that the .tmp files have been deleted.
Summit T3‐8 PCI Express Multi‐Lane Protocol Analyzer User Manual
35
Teledyne LeCroy
4.5.2
4.5.3
36
Using the Menus
Setup Menu
Display Options
Allows you to customize display options such as field colors, field formats and level hiding.
Recording Options
Allows you to customize control and setup features associated with recording, triggering, and filtering recorded events.
Generation Options
The Generation Options dialog is used to set configuration settings in a traffic generation script (*.peg). This dialog provides a convenient alternative means of editing a traffic generation file.
Generation Macros
Opens a dialog for creating buttons on the status bar that can be used to run traffic generation macros.
Update Device
Opens a dialog box that lets you update the BusEngine™ and Firmware.
Calibrate Device
Opens a dialog box that lets you calibrate the BusEngine™ and Firmware.
Launch CrossSync Control Panel
Launches the CrossSync application. The CrossSync Control Panel allows you to select analyzers for synchronization and manage the recording process. See “CrossSync Control Panel” on page 57.
All Connected Devices
Opens a dialog box with a list of locally or remotely connected devices. Allows you to update the BusEngine, Firmware, and your licensing information.
Record Menu
Start
Causes the Analyzer to begin recording traffic.
Stop
Causes the Analyzer to stop recording traffic.
Reupload
Causes the Analyzer to re‐send all, or selected portions, of the CATC Trace from the Analyzer buffer to the host machine.
Manual Trigger
Trigger command for Analyzer is generated upon clicking this button.
Reset Link Configuration
Causes the Analyzer to reset the Serdes and thereby reset the Analyzers current link configuration. This command is needed when lane width or other lane settings are changed. Otherwise, the old link configuration is used and errors are generated in the CATC Trace.
Summit T3‐8 PCI Express Multi‐Lane Protocol Analyzer User Manual
Using the Menus
4.5.4
Teledyne LeCroy
Report Menu
Report Menu operations are only available when you are working with a CATC Trace file.
4.5.5
File Information
Displays information about the file contents and describes the conditions of the file’s recording (Recording Options, hardware information, and so on).
Error Summary
Displays an error summary of the current CATC Trace file and allows you to go to a specific packet, and save the error file to a uniquely named file.
Traffic Summary
Details the number and types of packets that were transferred during the recording. You can hide, save, send, text, print, and view.
Bus Utilization
Opens a window with graphs of bus usage for the open CATC Trace.
Link Tracker
Opens a window for displaying a detailed chronological view of traffic. The window provides view and navigation options.
Data Flow
Opens the Data Flow Window, providing a tabular view of transactions and their payload.
Trace Navigator
Shows the Navigator bar for navigating a CATC Trace. Shows a snapshot of the recording and allows you to adjust the memory area for the view.
LTSSM Flow Graph
Shows a state diagram of bus activity. Also allows you to navigate through the LTSSM, based on the current recording.
Packet Header
Opens the Packet Header bar, showing the Packet Header information as it would be viewed in the specification.
Packet Data/
View Data
Opens the Data Window for the current packet or transaction, with the options: Hide, Save, Hexadecimal, ASCII, Decimal, Binary, MSB Format, LSB Format, Big Endian, and Little Endian. Format Line allows you to enter the number of bytes, words, or dwords per line. Configuration Space
Presents a list of Configuration Spaces. Clicking an item displays the selected Configuration Space in a Configuration Table format.
Search Menu
Search Menu operations are only available when you are working with a CATC Trace file.
Go to Trigger
Repositions the display to show the first packet following the trigger event.
Go to Selected Packet
Repositions the display to a specific packet, Link or Split transaction of PCI Express protocol or NVME, PQI, AHCI, ATA, SOP and SCSI command transaction levels.
Summit T3‐8 PCI Express Multi‐Lane Protocol Analyzer User Manual
37
Teledyne LeCroy
38
Using the Menus
Go to Packet
Allows searching for specific link events packets or time.
Go to Time
Repositions the display to specific timestamp.
Go to Marker
Repositions the display to a previously marked packet, Link, Split, NVME, PQI, AHCI, ATA, SOP and SCSI command transaction levels.
Go to SCSI
Allows searching for SCSI commands and sub‐commands: SCSI Operation, Command Status, Task Management, Task Management Response, Error, SCSI Logical Unit Number.
Go to Packet
Allows searching for specific link events: TLP Type, DLLP Type, Ordered Set, Link Event, Traffic Class, DLLP Virtual Channel, TLP Virtual Channel, Direction, Speed, Link Width, Requester ID, Completer ID, Data Lengths, Errors.
Summit T3‐8 PCI Express Multi‐Lane Protocol Analyzer User Manual
Using the Menus
Teledyne LeCroy
Find
Displays the Find dialog to allow searching for various events within a CATC Trace. You can search by Display Level: Packets, Link or Split transaction of PCI Express protocol or NVME, PQI, AHCI, SATA, SOP and SCSI protocol Transaction.
You can search packets by Event Group: TLP Type, TLP Header, TLP Requester ID, TLP Completer ID, TLP Data Pattern, TLP Data Lengths, TLP Tag, TLP Sequence Number, DLLP Type, DLLP Header, DLLP Virtual Channel, ACK/NAK Seq Number, Ordered Sets, Link Event, Direction, Errors, TS1 Data, TS2 Data. You can search link transactions by Event Group: TLP Type, Traffic Class, Virtual Channel, Direction, Requester ID, Completer ID, Status, Tag. You can search Link, Split, NVMe and PQI transactions by Event Group: TLP Type, Traffic Class, Virtual Channel, Direction, Requester ID, Completer ID, Status, Tag, Address. You can search NVMe transactions by the following Event Groups: Controller Registers, Queue IDs, Command IDs, Doorbell Registers, Admin Submission Command Set, NVMe Submission Command Set, Completion Queue Entry, and PRP.
You can search PQI transactions by Event Group: PQI Register ID, PQI Admin Functions, PQI Errors. You can search AHCI transactions by Event Group:
AHCI Register ID, AHCI Port Number, AHCI Slot Number, AHCI Port Multiplier Port, Raw Address, AHCI Direction, AHCI Errors.
You can search ATA transactions by Event Group: ATA Register Type, ATA Port Number, ATA Slot Number, ATA Raw Address, ATA Port Multiplier, ATA Interruption Reason, ATA Error Type, ATA Input/
Output, ATA Payload Portion, ATA CFS Fields, ATA RFIS Device to Host Fields, ATA DSFIS Fields, ATA PSFIS Fields, ATA SDBFIS Fields.
You can search SOP transactions by Event Group: SOP Information Unit ID, SOP Errors.
You can search SCSI transactions by Event Group: SCSI Operation, Command Status, Task Management, Task Management Response, Errors, SCSI Logical Unit Numbers.
Find allows you to create complex searches based on numerous criteria.
Find Next
Repeats the previous Find or Search operation.
Search Direction
Allows you to specify a forward or backward search of a CATC Trace file.
Summit T3‐8 PCI Express Multi‐Lane Protocol Analyzer User Manual
39
Teledyne LeCroy
4.5.6
Using the Menus
Quick Search Feature
The Quick Search feature allows you to either search for a pre‐defined term (see Figure 4.11) within a loaded Trace by clicking on the down arrow
your own term into the search window the cursor into the window and hitting the Enter key.
or by typing and then moving Figure 4.11: Quick Search: Pre-Defined Terms
This feature will scroll through the entire Trace searching for the requested term and either stop at a highlighted Packet within the Trace or not move to a new positon in the Trace if the term was not found. For more details see “Quick Search Feature” on page 195.
40
Summit T3‐8 PCI Express Multi‐Lane Protocol Analyzer User Manual
Using the Menus
4.5.7
Teledyne LeCroy
View Menu
Toolbars>>
Displays available toolbars: Standard, View Type, Frequently Used, Analysis, MultiSegment and Transaction Level. Use Customize to display the Windows Customize window.
Script Editor
Displays the Script Editor (only appears if a .peg file is open).
Analyzer Network Chat Bar Opens a chat window for communicating with persons working with networked Analyzers. This command requires that your host machine be attached to a LAN. The Chat window broadcasts messages to whatever host machines have been connected. Status Bar
Switches display of the Status Bar on or off.
CATC Walk
Select Play to play Playlists. Manage Playlists to display Edit CATC Walk Playlists dialog (see “CATC Walk Playlist” on page 183).
Real Time Statistics Opens the Real Time Statistics monitor dialog and displays a real‐
time graph of link activity.
Unhide Cells
Unhides PQI Reserved, PQI SGL Reserved and SOP reserved cells. You can also select Unhide all.
Zoom In
Zoom in increases the size of the displayed elements.
Zoom Out
Zoom out decreases the size of the displayed elements.
Synchronize Trace View With Other Views
Synchronizes the Trace view with other views.
FC Credits
Toggles a display for tracking Flow Control Credit update and consumption on a PCI Express link.
FC Credits Setup
Allows you to customize the display for tracking Flow Control Credits.
Compact View
Toggles compacting of the Link Training sequence to analyze CATC Trace data faster or no compacting to display more data.
Packet Level
View the current recording at the Packet Level.
Link Transaction Level
View the current recording at the Link Transaction Level.
Split Transaction Level
View the current recording at the Split Transaction Level.
NVMe Transaction Level
View the current recording at the NVMe Transaction Level.
Summit T3‐8 PCI Express Multi‐Lane Protocol Analyzer User Manual
41
Teledyne LeCroy
42
Using the Menus
PQI Transaction Level
View the current recording at the PQI Transaction Level.
AHCI Transaction Level
View the current recording at the AHCI Transaction Level.
ATA Transaction Level
View the current recording at the ATA Transaction Level.
SOP Transaction Level
View the current recording at the SOP Transaction Level.
SCSI Transaction Level
View the current recording at the SCSI Transaction Level.
Restore views to default positions
Restores views to the default positions after you click Yes on the prompt.
Summit T3‐8 PCI Express Multi‐Lane Protocol Analyzer User Manual
Using the Menus
4.5.8
4.5.9
4.5.10
Teledyne LeCroy
Tools Menu
Configuration Space Editor
Displays the Configuration Space Editor dialog which allows you to either create a new Configuration Space File or open an existing Configuration Space File.
Memory/IO Space Editor
Displays the Memory/IO Space Editor dialog which allows you to either create a new Address Space File or open an existing Address Space File. Select the memory size from the drop‐down menu.
TC to VC Mapping
Allows Traffic Classes to be mapped to Virtual Channels for purposes of simplifying navigation (for example, Search > Go to > TLP Virtual Channel) and changing the way the CATC Trace is displayed (for example, in Split Transactions).
Timing Calculations
Starts the mode‐less calculator dialog for calculating various timing and bandwidth parameters in the recording file.
PCIe SSD Base Address Mapping
Presents the PCIe SSD Base Address Mapping dialog.
Run Verification Scripts
Presents a list of verification scripts, from which you can run a verification script.
Window Menu
New Window
Opens a copy of the current CATC Trace window.
Cascade
Displays all open CATC Trace windows in an overlapping arrangement.
Tile
Displays all open CATC Trace windows as a series of strips across the display.
Arrange Icons
Arranges minimized CATC Trace windows at the bottom of the display.
Synchronize Traces
Synchronizes the CATC Trace View windows so that a move in one window repositions the other window of the same recording.
Help Menu
User Manuals F1
Click User Manuals or press F1 to access the documentation guide for all Teledyne LeCroy PCIe products. Display License Opens an information box describing the current license Information
information.
Summit T3‐8 PCI Express Multi‐Lane Protocol Analyzer User Manual
43
Teledyne LeCroy
4.6
Dashboard View
Register Product Online
Register at the Teledyne LeCroy website registration page.
Check for Updates
Check whether a new software version is available. If so, you can download from the Teledyne LeCroy web site. You can select to Check for updates at application startup
Tell Teledyne LeCroy
Report a problem to Teledyne LeCroy Support via e‐mail. This requires that an e‐mail client be installed and configured on the computer.
Shortcut List
Displays a list of Keyboard shortcuts.
About PCIe Protocol Suite
Displays version information about the attached Analyzer and its Firmware and BusEngine™.
Dashboard View
Dashboard View shows state of the link that analyzer is tracking. Click the Dashboard View icon to view the Dashboard View window for the selected device. Figure 4.12: Dashboard View Icon Displaying Device
Dashboard (see Figure 4.13 on page 45) displays the following information for Upstream and Downstream:
Link Width
Link speed
Per lane activity indication Green ‐ lane is active, analyzer does not detect any signal errors on this lane
Orange ‐ lane is active, analyzer detects signal errors on this lane
Grey ‐ lane is inactive
Logical to physical lane mapping
Lane polarity
Link Number
NFTS ‐ The number of FTS advertized by the device for each speed
Note: The dashboard display depends on the Recording Options configuration and may not match the current actual link state. For example, if the analyzer is configured to track 2.5 GT/s speed only, the Dashboard View will display 2.5GT/s speed as a current tracking speed regardless of the actual speed of the link.
44
Summit T3‐8 PCI Express Multi‐Lane Protocol Analyzer User Manual
Dashboard View
Teledyne LeCroy
Figure 4.13: Dashboard View Dialog
You can launch Recording Options for the analyzer from the Dashboard View and adjust recording settings to match the current link configuration. The Copy Polarity Settings to Recording Options button allows you to copy the detected polarity into Recording Options. The Copy Lane Swizzling Settings to Recording Options button allows you to copy the detected Lane Swizzling Settings into Recording Options.
Note: Polarity auto detection and lane swizzling detection requires the link to go through link retraining at Gen1 or Gen2 speed. The analyzer has to be configured correctly to track this link retraining. For example, if the analyzer is configured to track only 8.0 GT/s speed, auto polarity detection will not work even if the link goes through the appropriate retrain.
Launching and Setting Recording Option from Dashboard View
You can select a device and click the Launch Recording Options as shown in Figure 4.13 button to go to Recording Options. In the Recording Options window the Upstream and Downstream channels can be set manually by unchecking the Auto‐Configure Lane Polarity checkbox, refer to Figure 5.1 on page 60 (3G). Click on the Port Polarity Settings to Recording Options to save the settings.
Note: The lane polarity values are dynamic so this feature allows the user to make the settings and save them for future use. In the default setting the Auto‐Configure Lane Polarity checkbox is selected, refer to Figure 5.1 on page 60 (3G).
Summit T3‐8 PCI Express Multi‐Lane Protocol Analyzer User Manual
45
Teledyne LeCroy
4.7
Tool Tips
Tool Tips
Tool tips provide details about fields within the CATC Trace. To see a tool tip, position your mouse pointer over a field within the CATC Trace.
You can turn off this capability in the Display Options menu.
4.8
46
Keyboard Shortcuts
Keystrokes
Operation
Ctrl + N
New PCIe Protocol Suite script
Ctrl+O
Open file
Ctrl+P
Print
Ctrl+S
Save file
Ctrl + R
Start Analyzer recording
Ctrl + T
Stop Analyzer recording
Ctrl+Home
Jump to first packet
Ctrl+End
Jump to last packet
Ctrl + G
Go to packet ...
Ctrl + F
Search forward
F1
Access documentation
F3
Find next
F6
Next pane
Shift+F6
Previous pane
Ctrl+B
Search backward
Summit T3‐8 PCI Express Multi‐Lane Protocol Analyzer User Manual
Status Bar
Teledyne LeCroy
4.9
Status Bar
The Status Bar is a gray bar that runs along the bottom of the application window.
From left to right:
PCIe Protocol Suite SN:309: Analyzer Serial Number
Ready: Analyzer Status
Recording Progress Bar: The colored bar to the right of the serial number represents how much traffic has been recorded. The upper bar indicates "Upstream", and the lower bar indicates "Downstream". The trigger point is indicated by the black line at the left side of the bar. In this example, the trigger occurred at the very beginning of the CATC Trace. If the trigger is set in the middle of the CATC Trace, the line is positioned in the middle of the bar. Additionally, the color of the bar is different on each side of the trigger point. For examples, see “Recording Progress Bar” on page 47. The white strip along the top edge of the color bar indicates how much traffic has been uploaded from the Analyzer buffer to the host machine. Uploading and 20%: Indicates the Analyzer's recording status, what part of the recording process the Analyzer is now in. In this example, the Analyzer is in the upload stage and has completed 20% of the upload from the Analyzer to the host machine. See “Recording Status” on page 47 for details on other status messages.
Activity: The colored bar moves to indicate that the Analyzer is currently recording.
Search: Fwd: Indicates search direction. The direction can be toggled to Search: Bwd by double‐clicking the search direction or by selecting Search Direction from the Search menu.
4.9.1
Recording Progress Bar
This indicator bar changes color to reflect the recording progress.
4.9.2
Black vertical line is at the location of Trigger position.
Black vertical line wiggles when Trigger Position is nearly reached.
Field to right of Trigger Position changes color to indicate post‐trigger activity.
Upper half of progress indicator turns white when recording is complete.
Recording Status
The second segment from the left in the Status Bar indicates recording status.
During recording, the current Recording Status is in a segment. When you activate the Record function, this segment flashes a message depending on the selected Recording Options, such as Waiting for Trigger, Uploading or Triggered.
The status bar displays Waiting for Trigger while waiting for trigger to occur based on the settings defined in the Recording Options (see Figure 4.14 on Summit T3‐8 PCI Express Multi‐Lane Protocol Analyzer User Manual
47
Teledyne LeCroy
Making a PCI Express Recording
page 48).
Figure 4.14: Status Bar - Waiting For Trigger
The status bar displays Uploading when recording is complete and is being uploaded.
Figure 4.15: Status Bar - Uploading
The status bar displays Triggered when the trigger condition has occurred, but uploading has not commenced yet.
Figure 4.16: Status Bar - Triggered
As uploading progresses, the percent increases to 100. You can abort this upload if you wish by pressing the ESC button on your keyboard or clicking
4.9.3
in the Tool Bar.
Recording Activity
The third segment displays recorded activity as a series of blue vertical bars. The more vertical bars that display, the greater the amount of activity recording. If there are no vertical bars, there is no recording activity. During uploading, the percent of the completed upload displays.
4.9.4
Search Direction Indicator
The fourth segment in the status bar indicates search direction. The direction can be changed by selecting Search Direction from the Search menu.
4.10
Making a PCI Express Recording
After connecting the Analyzer to the device(s), you must configure the Recording Options. Then you can test the Analyzer by creating a 16‐MB snapshot recording.
To make this recording, follow these steps:
48
Summit T3‐8 PCI Express Multi‐Lane Protocol Analyzer User Manual
Making a PCI Express Recording
Teledyne LeCroy
1. From the Setup menu, select Recording Options and click the Switch to Simple Mode button.
2. Select the Simple Mode tab. The following window displays the factory default settings in Simple Mode, such as Snapshot and 16‐MB buffer size. For your first recording, select proper speed and link width.
Figure 4.17: Summit T3-8 in Simple Recording Mode
3. In the Link section, specify the lane width of the PCI Express link to be analyzed. The rest of the settings in this section can be left at the factory defaults for most PCI Express systems. 4. For multi‐lane PCI Express links, when using Auto options, the Analyzer needs to observe link training in order to record link traffic correctly. If link training (or re‐
training) is not easily controllable for the devices under test, the Analyzer includes the capability to force link training by disconnecting and reconnecting the PCI Express link.
Summit T3‐8 PCI Express Multi‐Lane Protocol Analyzer User Manual
49
Teledyne LeCroy
Making a PCI Express Recording
Note: For x1 PCI Express links, it is not necessary for the Analyzer to observe link training in order to record link traffic; this step may be skipped.
5. Click OK at the bottom of the Recording Options dialog to apply the Analyzer recording settings specified.
6. Click the Record
4.10.1
button. Stopping a Recording
You can stop the recording process at any time by pressing the Stop button
. This causes the Analyzer to stop the recording and upload the CATC Trace to the host machine. If you press the Stop button again, the Analyzer temporarily halts the upload process and opens the following dialog box (see Figure 4.18 on page 50).
Figure 4.18: Abort Upload
This dialog presents options for stopping, continuing, or aborting the upload:
Stop: Aborts further CATC Trace upload and displays whatever data that has already been uploaded.
Continue: Resumes the upload. This command tells the Analyzer to finish uploading whatever CATC Trace data is still in its buffer.
Flush: Flushes the CATC Trace without saving or displaying it.
If you allow the traffic data to be uploaded, it is automatically saved on the host machine’s hard drive as a file named data.pex or the name you assign as the default filename in the recording options. 4.10.2
Saving a Recording
1. To save a current recording for future reference, select Save As from the File menu.
2. Give the recording a unique name, then save it to the appropriate directory.
50
Summit T3‐8 PCI Express Multi‐Lane Protocol Analyzer User Manual
PCIe Protocol Suite Files
4.11
Teledyne LeCroy
PCIe Protocol Suite Files
The PCIe Protocol Suite software creates and uses different kinds of files:
4.11.1
CATC Trace Files: Recorded traffic
Recording Options Files: Configuration file that contains the various options selected in the Recording Options dialog to configure the recording
Display Options Files: Configuration file that contains the options selected in the Display Options dialog to configure how traffic is displayed
CATC Trace Files
PCIe Protocol Suite records PCI Express traffic into a CATC Trace file with the default name data.pex or any other that you specified in the Recording Options. This file is overwritten with new data each time PCI Express traffic is recorded. If you want to save a CATC Trace, use the File > Save As function. This option allows you to save the current CATC Trace to a unique file name, thereby ensuring that it is not overwritten. This option also allows you to save a range of packets in a CATC Trace file.
You can pre‐define the name of the recorded CATC Trace file using the Trace Filename and Path option in Recording Options. 4.11.2
Recording Options Files
Recording Options files are created when you set recording options. These files use the .rec extension and contain recording option information. 4.11.3
Display Options Files
Display Options files are created when you set display options. These files use the .opt extension and contain the display options information.
4.12
Saving CATC Trace Files
4.12.1
Using the Save As Function
When you record a CATC Trace file, the Analyzer software provides a pre‐defined name to the CATC Trace file (data.pex or any other that you specified in the Recording Options). If you do consecutive recordings, each time the previous recording is overwritten. If you see a recording you want to analyze later, you need to give a unique name to the CATC Trace file, so it is not overwritten with the next recording.
Also, when you analyze a recorded CATC Trace file, you might be interested in preserving just a part of the PCI Express traffic that was recorded. If you save a portion of a CATC Trace file, it can get significantly smaller, allowing you to attach it to an e‐mail.
To save a portion of a CATC Trace file or the whole file to a unique name, select Save As from the File menu (see Figure 4.19 on page 52).
Summit T3‐8 PCI Express Multi‐Lane Protocol Analyzer User Manual
51
Teledyne LeCroy
Saving CATC Trace Files
Figure 4.19: File Save As Dialog
If you want to give a unique name to the CATC Trace file, select the All option and keep Rename original file checked. This is the default setting for the dialog.
4.12.2
Saving a Portion of a CATC Trace
If you want to save a portion of a CATC Trace file, select Save packet range. Enter starting and ending packet numbers in the From Packet and To Packet fields. By default, it has the numbers of the first and the last packets in the file. The software is going to save all the packets in specified range to the new file, unless you have Do not save hidden packets checked. In this case it is going to save all packets in the range, EXCLUDING the currently hidden packets.
52
Summit T3‐8 PCI Express Multi‐Lane Protocol Analyzer User Manual
Exporting a CATC Trace File
4.12.3
Teledyne LeCroy
Trace File Structure
The captured trace file has an extension of ".pex". When the trace file is loaded, additional decoding and data reduction is done which results in additional files of data which are placed in a folder of the same name as the trace file (with the extension ".tmp"). This allows the trace file to be loaded and displayed quickly during subsequent viewings. When copying a trace file, or sending it to someone, you can chose to send just the .pex file. In that case, the software re‐generates the additional folder and files when the trace is first opened. The other choice is to send the additional folder with contents along with the .pex file, which will save the rebuilding effort when the file is opened again. The choice is up to the user. If you do NOT want these files kept, and don't mind the extra time it takes to re‐build these every time you load a trace file, then you can select this in the Recording Options.
If the additional files ever become out of date (newer software structures from a new release, etc.) or if any of the files are lost or damaged, the software will rebuild a fresh version of the information.
4.13
Exporting a CATC Trace File
By default, PCIe Protocol Suite saves CATC Trace files in the .pex format. However, you can export a CATC Trace to a file in any of the following other formats:
Text
Comma Separated Value (CSV)
Generator file format
Exporting to Generator file format is a simple way to create a script file from your CATC Trace. Only PCI Express packets will be exported to a script. All transaction levels, including supported SSD decodes, can be exported to Text or CSV Text.
To export a CATC Trace file, select File > Export.
Summit T3‐8 PCI Express Multi‐Lane Protocol Analyzer User Manual
53
Teledyne LeCroy
Exporting a CATC Trace File
Figure 4.20: Exporting a File
54
Summit T3‐8 PCI Express Multi‐Lane Protocol Analyzer User Manual
Printing Data Files
4.14
Teledyne LeCroy
Printing Data Files
To print all or part of the open CATC Trace:
1. Select File > Print from the menu or click the Printer
button on the toolbar. The Print Packets dialog displays
Figure 4.21: Print Packets Dialog
2. To select a range of packets, enter values in the From packet # and To packet # fields and click Print. 3. To print an entire file, leave the From and To fields empty and click Print.
The specified traffic information is printed as currently displayed, in color or gray scale as supported by your printer. Any CATC Trace File comments you entered are printed following the current document name at the top of each page. Note: CATC Trace File comments can be created by using Edit Comment on the File menu.
Summit T3‐8 PCI Express Multi‐Lane Protocol Analyzer User Manual
55
Teledyne LeCroy
4.15
Analyzer Chat Window
Analyzer Chat Window
PCIe Protocol Suite has a Chat window that allows you to communicate with users on remote host machines. For Chat to work, two conditions must be met:
The host machines must have PCIe Protocol Suite software installed and run‐
ning.
The host machines must be listed in each other's All Connected Devices list. This means that your host machine must have the remote host machine listed in its Analyzer Devices window and the remote host machine must have your host machine listed in its Network Browse window.
Figure 4.22: Typical Analyzer Network Dialog
If the above conditions are met, a Chat session is initiated by running the command: View > Analyzer Network Chat Bar. The following dialog box opens.
56
Summit T3‐8 PCI Express Multi‐Lane Protocol Analyzer User Manual
Analyzer Chat Window
Teledyne LeCroy
Figure 4.23: Analyzer Network Chat Dialog
Enter some text, then press Send. The message is then broadcast to all host machines listed in your network browse window. If a target host machine also lists your host machine in its Network Browse window, then it can receive your message. When the message arrives, the Chat window automatically opens.
4.15.1
CrossSync Control Panel
The CrossSync Control Panel allows you to select analyzers for synchronization and manage the recording process. It supports a wide combination of Teledyne LeCroy’s flagship analyzers including PCI Express, USB, DDR, Serial ATA (SATA), Serial Attached SCSI (SAS), Fibre Channel (FC) and Ethernet.
CrossSync is Teledyne LeCroy’s analyzer synchronization solution that enables time‐
aligned display of protocol traffic from multiple daisy‐chained analyzers showing packet traffic from multiple high‐speed serial busses. A lightweight software control panel allows users to select analyzers for synchronization and manage the recording process. Captured traffic is displayed using the latest analyzer software (in separate windows) with all the protocol specific search and reporting features.
Captured packets are displayed in separate windows that share a common time scale. Navigating the traffic in either direction will scroll to the same timestamp in a synchronized window. When using the CrossSync option, users can access the full complement of analysis capabilities available within the individual Teledyne LeCroy software. Search, reporting, and decoding all operate normally.
This feature is available with the Teledyne LeCroy PCIe Protocol Suite software application.
Summit T3‐8 PCI Express Multi‐Lane Protocol Analyzer User Manual
57
Teledyne LeCroy
Analyzer Chat Window
Launching the CrossSync Control Panel
To launch CrossSync from the PCIe Protocol Suite software application, select the ‘Launch CrossSync Control Panel‘ entry in the ‘Setup’ menu (see the screen below). Or, you can launch CrossSync from the ‘Start’ menu.
Figure 4.24: Launching CrossSync from the PCIe Protocol Suite Application
Please refer to the CrossSync Control Panel User Manual for more information.
58
Summit T3‐8 PCI Express Multi‐Lane Protocol Analyzer User Manual
Chapter 5
Recording Options
5.1
Recording Overview
After installing the software recording options should be set prior to recording. The recording options define the behavior of the Summit T3‐8 Analyzer during recording. You can create, save and load previously saved recordings. This section explains how to define recording options on the Summit T3‐8 Analyzer.
5.2
General Tab
The Recording Options dialog is used to configure a recording. To open the Recording Options window, click
Setup > Recording Options.
or select the command Note: There are separate sets of Recording Options for each Analyzer type. To set the Analyzer type, select the appropriate platform from the Target Analyzer menu in the General tab of the Recording Options. The General tab displays options that affect all recordings (see Figure 5.1 on page 60). 5.3
Recording Options-General Tab
This section describes the General Tab recording options.
Summit T3‐8 PCI Express Multi‐Lane Protocol Analyzer User Manual
59
Teledyne LeCroy
Recording Options‐General Tab
2F
2G
2E
3A
3B
2
3
3C
2A
2B
3D
2C
2D
1
3E
3F
3G
1A
3H
1B
3I
1C
1D
1E
1F
3J
Figure 5.1: Summit T3-8 Recording Options Advanced Mode General Tab
Note: Please refer to the figure callout numbers in each of the sections below to co‐relate to Figure 5.1 shown above. For instance, for Simple and Advanced Mode, see Figure 5.1: 1B.
60
Summit T3‐8 PCI Express Multi‐Lane Protocol Analyzer User Manual
Simple and Advanced Mode
5.4
Teledyne LeCroy
Simple and Advanced Mode
The recording options can be defined in Simple or Advanced modes. The Simple Recording and Advanced Recording options are the same in functionality, only the interface displayed is different. The Simple Mode allows quick access to commonly used options. The recording options are the same in both modes (see Figure 5.1 on page 60: 1B).
Clicking on the Switch to Simple Mode toggles you between Simple and Advanced Mode (see Figure 5.2).
Figure 5.2: Switch to Simple Mode Button
5.5
Trace Filename and Path
The Trace Filename and Path button sets the path and CATC Trace name for the recording. It allows you to change the default file name and path for the recorded CATC Trace file. The pre‐defined name is data.pex. See Figure 5.1 on page 60: 1A.
1.
2.
3.
4.
Select the Recording File Name button.
The Specify Trace File Name dialog opens to navigate to the directory you want.
Enter the new file name in the File name field.
Click the Save button.
This action does not do any immediate save operation. It just changes the default name and uses it in subsequent recordings.
Summit T3‐8 PCI Express Multi‐Lane Protocol Analyzer User Manual
61
Teledyne LeCroy
5.6
Saving and Loading Previously Saved Recording Options
Saving and Loading Previously Saved Recording Options
You can save a recording or load previously saved recordings. In the general tab the following Save options are available (see Figure 5.1 on page 60).
5.6.1
Setting Default Recording Options
To save the current recording options into the default Recording Options file:
Click Save As Default. The default file for the options is default.rec. When the PCIe Protocol Suite software begins execution, it automatically loads the default.rec file, if one exists.
Options Name: See Figure 5.1 on page 60: 1F.
The Options Name is a descriptive, supplemental label that you can assign to a Recording Options file so you can easily recall what settings are in the Recording Options file. For example, if your Recording Options file were named StandardSettings.rec, your Options Name could be a long descriptive label such as Standard Record Options used for all normal Recordings.
Save: See Figure 5.1 on page 60: 1C.
Saves the current options to whatever file name you provide.
Save As Default: See Figure 5.1 on page 60: 1D.
Saves the current options into the default options file. This file is called default.rec or any other name you have assigned to the default options file. Whenever the Teledyne LeCroy PCIe Protocol Suite software begins execution, it automatically loads the default file, if one exists.
Load: See Figure See Figure 5.1 on page 60: 1E.
Loads a previously saved set of recording options.
OK
Applies changes and closes the Recording Options dialog.
Cancel
Cancels changes and closes the Recording Options dialog.
5.6.2
Loading Recording Options
In the Recording Options menu, you can load a previously saved recording options file.
To load Recording Options:
1. Select Setup > Recording Options from the menu.
2. Click the Load button from the Recording Options dialog. The Load dialog opens and lists previously saved options files (*.rec). 3. Select a file and click OK. The options file loads.
62
Summit T3‐8 PCI Express Multi‐Lane Protocol Analyzer User Manual
Recording Type
5.6.3
Teledyne LeCroy
Saving Recording Options
Recording Options settings can be saved and later reused. Recording options settings are stored in *.rec files. 1. Open the Recording Options dialog by selecting Setup > Recording Options.
2. Set your options, then click Save. 3. Enter a unique file name. The .rec extension is added by default.(optional) To add a descriptive label to this file to help you remember what options were set, use the Options Name box.
5.7
Recording Type
Recording Type allows you to specify the type of recording you want to make. (See Figure 5.1 on page 60: 2A.) They are:
Snapshot
Manual Trigger
Event Trigger
The recording options available on each analyzer are different. As shown in Figure 5.1 on page 60 the Summit T3‐8 Analyzer is detected and the recording options available for it are displayed (See Figure 5.1 on page 60: 2E).
Figure 5.3: Summit T3-8 Target Analyzer Options.
When the analyzer is not yet detected, you can choose the analyzer from the drop‐down menu which displays the following:
PETracer Summit: Displays the options for the PETracer Summit Analyzer.
Summit T24: Displays the options for the Summit T24 Analyzer.
Summit T28: Displays the options for the Summit T28 Analyzer.
Summit (T2‐16): Displays the options for the Summit T16 Analyzer.
Summit T3‐8: Displays the options for the Summit T3‐8 Analyzer.
Summit T3‐8 (2 Units): Displays the same options as Summit T3‐8 but lists Unit 1 and Unit 2 in the Link Section on the right. In a two‐unit setup, Unit 1 and Unit 2 are two separate Analyzers linked together.
Summit T3‐8 PCI Express Multi‐Lane Protocol Analyzer User Manual
63
Teledyne LeCroy
Buffer Size
5.7.1
Summit T3‐16: Displays the options for the Summit T3‐16 Analyzer.
Summit T34: Displays the options for the Summit T34 Analyzer.
Summit T34 (2 Units): Displays the same options as Summit T34 but lists Unit 1 and Unit 2 in the Link Section on the right. In a two‐unit setup, Unit 1 and Unit 2 are two separate Analyzers linked together.
Eclipse X34: Displays options for the Eclipse X34 Analyzer.
Snapshot
A recording of a pre‐determined length. You set the recording length in the Buffer Size box. Recording begins when you click the Rec button on the toolbar and ends when the selected buffer size is filled or when you press the Stop button.
5.7.2
Manual Trigger
Recording begins when you select Start in the application. Pressing the Trigger button allows the Analyzer to finish recording by switching between the pre‐trigger buffer and the post‐trigger buffer. Recording continues until the post‐trigger buffer has been filled. You can also end the recording immediately by pressing the Stop button in the application.
Note: Consider that when filtering is enabled, pressing the Trigger button will not necessarily cause the post‐trigger buffer to fill automatically, due to packets being filtered and not stored. In this case you will have to use the Stop button to immediately end the recording.
5.7.3
Event Trigger
A recording that switches between the pre‐trigger buffer and the post‐trigger buffer when it is triggered by an event in the CATC Trace. An Event Trigger begins when you select Start in the application and ends when the specified triggering event occurs in the CATC Trace or you press Stop. If an event triggers the end of the recording, the Analyzer records a predefined amount of post‐trigger data (specified by Trigger Position and Buffer Size.)
You can also terminate an Event Trigger recording by pressing the Manual Trigger button on the front of the Analyzer. When the Manual Trigger button is pressed, the Analyzer continues to record until the specified post‐trigger buffer has been filled.
5.8
Buffer Size
The Buffer Size allows the Analyzer to record traffic to its buffer and then upload the CATC Trace to the host machine. Recordings are limited in size to the size of the Analyzer's buffer, see Figure 5.1 on page 60: 2B (2 GB per direction, Upstream and Downstream).
The Buffer Size slide‐bar allows you to set the size of the recording buffer.
64
Summit T3‐8 PCI Express Multi‐Lane Protocol Analyzer User Manual
Upload Size
Teledyne LeCroy
Figure 5.4: Buffer Size Slide Bar.
The size selection is per direction. For example, selecting 32 MB creates two memory areas of that size.
After you have set the Buffer Size, you must set the Recording type and Trigger position options. These options determine how the buffer is used.
Note: The Buffer Size slide‐bar does not precisely portray the buffer size because of the way the packets are stored in the Analyzer’s memory.
5.9
Upload Size
Causes the Analyzer to upload a portion of the Analyzer's buffer. This option lets you look at part of the CATC Trace. Half of the uploaded CATC Trace is pre‐buffer and half post‐
trigger. (See Figure 5.1 on page 60: 2C.)
Figure 5.5: Upload Size Slide Bar.
5.10
Misc
Turns on trigger beep and tells the Analyzer to use whatever TC to VC mapping was used in the last recording. Click on the Default TC to VC mapping to manually map the Traffic Classes to Virtual Channels. (See Figure 5.1 on page 60: 2D.)
Allows you to specify the following parameters for recording and uploading traffic.
Figure 5.6: Misc Section in Recording Options.
Beep When Trigger Occurs: Causes the host machine to beep when a trigger event is detected.
Preserve TC to VC mapping across the channels: Causes the Analyzer to use whatever TC (Traffic Classes) to VC (Virtual Channel) mapping it established in the last recording (to re‐use previously discovered Configuration Space data) in all future recordings. Disable Auto Channel Swap: Prevents the software from determining the traffic Summit T3‐8 PCI Express Multi‐Lane Protocol Analyzer User Manual
65
Teledyne LeCroy
Recording Mode
flow (upstream or downstream) and reassigning this traffic to its proper direc‐
tion in the trace.
Default TC to VC mapping button: Lets users manually configure the default mapping (See Figure 5.7 on page 66).
Figure 5.7: Default TC to VC Mapping.
5.11
Recording Mode
There are two options for Recording Mode:
Protocol Recording
Bit Tracer Recording
Figure 5.8: Recording Mode Options.
5.11.1
Protocol Recording Mode
In this mode of recording, the analyzer records traffic on the bus in a native PCIe protocol.
5.11.2
Bit Tracer Recording
When the Bit Tracer Recording box is checked, it allows you to select the Speed and the Link Width from the drop‐down menu.
This option does not have Simple Mode and Advanced Mode. Therefore, Upload Size, the Miscellaneous options are not available. Leaving all the boxes unchecked results in no trigger in that direction. For more information, see the next chapter, “BitTracer Recording” on page 211.
5.12
Trigger Position
This Trigger Position slide‐bar lets you adjust the amount of recording buffer allocated to recording pre‐trigger and post‐trigger traffic. (See Figure 5.1 on page 60: 2F.)
66
Summit T3‐8 PCI Express Multi‐Lane Protocol Analyzer User Manual
Link Settings
Teledyne LeCroy
Figure 5.9: Trigger Position Slide Bar
For example, if you set the Trigger Position to 90% Post‐Triggering Traffic, the Analyzer records 10% pre‐trigger traffic and 90% post‐trigger traffic. Trigger Position is only available when Manual Trigger or Event Trigger is selected.
5.12.1
Viewing Legacy Multi-Segmented CATC Traces
Current PCIe Protocol Suite software handles traces as large as the maximum buffer size selected. It does not need to generate segmented traces, but is able to open segmented traces generated with older software versions. Simply open the *.pem extension file, and the trace will be converted to a new format single trace. If you are opening a *.pex file part of a segmented trace make sure not to update the file, in order for the original segmented index to work properly.
5.13
Link Settings
The Link options panel allows you to manage links. You can define the basic link parameters or leave it on Auto detect. The various link settings are described in this section. (See Figure 5.1 on page 60: 3.)
Summit T3‐8 PCI Express Multi‐Lane Protocol Analyzer User Manual
67
Teledyne LeCroy
Link Settings
Link Width Displayed
Link Speed Displayed
Figure 5.10: Link Options for Summit T3-8
5.13.1
Speed
The Speed can be set at Auto, 8.0 GT/s, 5.0 GT/s, or 2.5 GT/s from the drop‐down menu. The default is Auto. (See Figure 5.1 on page 60: 3A or Figure 5.10 on page 68 left side.)
Auto: When set to Auto, the hardware auto‐determines the speed.
8.0 GT/s, 5.0 GT/s, or 2.5 GT/s: When set to a specific speed Teledyne LeCroy’s software forces the hardware to record at that speed.
For Auto speed setting to work the polarity setting of lane 0 has to be correct. The polarity can be set manually if the link is already in L0 state, or, for automatic polarity detection, the bus has to go through a training sequence so the analyzer can track the polarity.
Note: For certain build configurations speed options 5.0 GT/s and 8.0 GT/s may be disabled.
68
Summit T3‐8 PCI Express Multi‐Lane Protocol Analyzer User Manual
Link Settings
Teledyne LeCroy
Note: Selecting Auto in the Speed drop‐down list will set the correct speed even if the analyzer does not record a link training sequence.
5.13.2
Link Width
The Link Width sets the physical width of the link. Select the Link Width or select Auto. (See Figure 5.1 on page 60: 3B or Figure 5.10 on page 68 right side). The available options (and the default) will be shown according to the detected product.
Auto Max X8 Calculates link width automatically up X8
Auto Max X4 Calculates link width automatically up X4
Auto Max X2 Calculates link width automatically up X2
Fixed X1
Link is assumed to be always X1
Fixed X2 Link is assumed to be always X2
Fixed X4
Fixed X8 Link is assumed to be always X4
Link is assumed to be always X8
Note: If the bus goes to a link width different from the one selected as fixed option, the trace will be full of errors. The appropriate Auto option needs to be selected in this case.
Note: When selecting Auto in the Link Width drop‐down list the embedded software is able to find the correct link width even if the link does not go through a training sequence.
5.13.3
Upstream and Downstream
Gives you low‐level control over each link direction. The heading for these boxes indicates the port and/or unit to which the following options are applied based on the current Analyzer configuration. (See Figure 5.1 on page 60: 3C and 3D.)
5.13.4
Inhibit Channel: Do not record/upload this channel
Reverse Lanes: Manual lane reversal. If Auto‐Configure Lane Swizzle is set, the Reverse Lanes option will be ignored.
Invert Polarity Use External Reference Clock
If the PCI Express link under analysis uses spread‐spectrum clocking, then the Analyzer must use the external reference clock from the system. If the Device Under Test does not supply a reference clock, the internal reference clock in the Analyzer module can be used instead. (See Figure 5.1 on page 60: 3E.) Only the standard PCIe reference clock is supported.
Summit T3‐8 PCI Express Multi‐Lane Protocol Analyzer User Manual
69
Teledyne LeCroy
5.13.5
Link Settings
Disable Descrambling
If checked, causes the Analyzer to assume that none of the PCI Express traffic is scrambled. By default, the Analyzer determines the scrambling state of the devices under test. (See Figure 5.1 on page 60: 3F.)
Note: When selecting Gen3 speed the disable scrambling option is not available. This option can be used only for Gen1 or Gen2 speeds. It will show as well for Auto speed but it affects only Gen1 or Gen2 traffic.
5.13.6
Auto-Configure Lane Polarity
Lets the Analyzer determine lane polarity. (See Figure 5.1 on page 60: 3G.) Auto functions such as Auto Configure polarity rely on Gen1 or Gen2 training sequences to properly discover their values. If the speed option is set to fixed Gen3, the analyzer will never see these sequences and the polarity discovery will not be reported properly in the dashboard dialog.
5.13.7
Ignore EDS
Lets the Analyzer ignore EDS. (See Figure 5.1 on page 60: 3H.)
5.13.8
Ignore Idle Errors
When set analyzer will not store errors in between packets into memory. This option helps to preserve analyzer memory to store more packets in cases where memory efficiency is critical. This option filters out Compliance Pattern as well. (See Figure 5.1 on page 60: 3I.)
5.13.9
Swizzling Config...
The Swizzling Config dialog allows you to reconfigure the order of the US (UpStream) and DS (DownStream) lanes. Check the box to Auto‐Configure Lane Swizzle. (See Figure 5.1 on page 60: 3J.) Note: Autoswizzle works only when the analyzer sees the LTSSM Configuration state link training sequence.
70
Summit T3‐8 PCI Express Multi‐Lane Protocol Analyzer User Manual
Triggering
Teledyne LeCroy
Figure 5.11: Swizzling Config Dialog
When the Auto‐Configure Lane Swizzle is checked, it is important to configure Lane 0. You can do so by manually dragging Lane 0 to the required position (see Figure 5.12 on page 71).
Manually moving Lane 0 to the
required position
Figure 5.12: Manually Configuring Lane 0 when Auto-Configure Lane Swizzle is Checked
5.14
Triggering
Triggering Options can be set in both Simple and Advanced Modes. The options in both modes are the same, only the GUI is different where shortcuts for the events are displayed in the Simple Mode for easy access (see Figure 5.2 on page 61).
In the Advanced Mode triggering is set up via the recording rules which allow greater flexibility to create advanced sequences you would like the analyzer to look for. These recording rules are not available in the Simple Mode. The Simple Mode allows you to simply define triggering by checking the boxes. Note: Ensure that the correct analyzer is selected for the right options.
Summit T3‐8 PCI Express Multi‐Lane Protocol Analyzer User Manual
71
Teledyne LeCroy
5.14.1
Triggering
Triggering On (Simple Mode)
You can check any of the boxes shown in Table 5.1 for Trigger On in Simple Mode (see Figure 5.13 on page 73). TABLE 5.1: Simple Mode Trigger On Events
Enter Elec Idle
Exit Elec Idle
CLKREQ#
WAKE#
Switch to G1
Switch to G2
Switch to G3
Link Width Change
TS1
TS2
InitFC1
NAK
PM
Any TLP
Config
Memory
IO
Message
RD Error
Invalid Symbol
Block Align Error
Token Error
Idle Symbol Error
Trigger Position is only available when Event Trigger or Bit Tracer Recording is selected.
Note: If you check 2 boxes or more the triggering will occur based on an OR condition, not AND condition.
Note: External Input Trigger is not configurable, it will always cause the analyzer to trigger on a toggle when using manual trigger or triggering on any event. Note: If you check 2 boxes or more the triggering will occur based on an OR condition, not AND condition.
72
Summit T3‐8 PCI Express Multi‐Lane Protocol Analyzer User Manual
Triggering
Teledyne LeCroy
Figure 5.13: Simple Mode Triggering Options
5.14.2
Triggering On (Advanced Mode)
The same triggering options are available in the Advanced Mode as in the Simple Mode. The Advanced Mode gives you additional flexibility to drill down and configure these options in greater detail via the Recording Rules dialog. In the Advanced mode click on the Recording Rules tab to configure the settings. As shown in Figure 5.14 on page 74, the Recording Rules tab allows you to create New Events. For each event you can create Actions. A detailed explanation of the Recording Rules is given in the following sections.
Note: External Input Trigger is not configurable, it will always cause the analyzer to trigger on a toggle when using manual trigger or triggering on any event. Summit T3‐8 PCI Express Multi‐Lane Protocol Analyzer User Manual
73
Teledyne LeCroy
Navigating Recording Rules
New Events Menu
Available Events Panel
Toolbar
Global
State Cell
Sequence
Cells
Actions
Menu
Main
Display
Area
Figure 5.14: Recording Rules Tab
5.15
Navigating Recording Rules
The Recording Rules window has three main areas, the Toolbar, Available Events panel and the Main Display panel (see Figure 5.14 on page 74).
5.15.1
Toolbar
The toolbar contains buttons such as the New Events button for issuing commands, Delete Current Event, Undo, Redo, Zoom in and out, Show/Hide Channels and Properties. 5.15.2
Available Events Area
The Available Events area is in the left repository panel where you can park buttons that you intend to use in the Main display area. The events in this panel do not affect the recording. You can drag and drop events in the Main Display panel.
5.15.3
Main Display Area
The Main Display area is the right panel where you create trigger and filter conditions. You create conditions by dragging buttons onto the Main display area from the Available 74
Summit T3‐8 PCI Express Multi‐Lane Protocol Analyzer User Manual
Recording Rules Overview
Teledyne LeCroy
Events area. You then create additional conditions by right‐clicking a button and selecting options from a pop‐up menu.
5.15.4
Recording Rules Buttons
The Recording Rules toolbar allows you to create and edit recording rules:
TABLE 5.2: Recording Rules Toolbar Buttons
New Event. Opens a drop‐down menu with a list of events.
Delete. Delete selected event.
Undo. Undoes last action.
Redo. Undoes last Undo command.
Zoom in
Zoom out
Show/Hide Channels. Shows/hides the channel buttons.
Show properties. Opens the Properties dialog for the selected item.
Lane Trigger Configuration: Sets lane pre‐conditions for event categories.
5.16
Recording Rules Overview
The Recording Rules allows you to specify complex triggering and filtering options. The Summit T3‐8 Analyzer monitors incoming traffic and looks for specified events. It performs actions like triggering and filtering. Complex options can be created by putting Events in a sequence.
Events are based on Resources (see “Resources” on page 78).
5.16.1
Defining Recording Rules
The Recording Rules page is used to set triggers and filters. To access this page, select Setup > Recording Options > Recording Rules.
You can also access the New Event menu by right‐clicking in the blue space in the Global State or in the Sequence State (see Figure 5.15 on page 76).
Summit T3‐8 PCI Express Multi‐Lane Protocol Analyzer User Manual
75
Teledyne LeCroy
Recording Rules Overview
Figure 5.15: Defining New Events
There are three steps to creating a recording rule: 1. Select events.
2. Place the events in the Global State or Sequence cells.
3. Assign actions to the events.
Note: There are limits to the types of rules that can be created. 1. Click
and select one or more events from the menu (see Figure 5.16 on page 77). Selecting an event automatically places it in the Available Events area. This repository area serves as a parking lot where you can place event buttons without them having any effect on the Analyzer.
76
Summit T3‐8 PCI Express Multi‐Lane Protocol Analyzer User Manual
Recording Rules Overview
Teledyne LeCroy
Figure 5.16: New Event Menu
2. Drag the selected events from the Available Events area into either the Global State Cell or the Sequence Cell (see “Recording Rules Overview” on page 75).
Global State Cell
If you want the Analyzer to always search for the event, place it in the cell marked Global State.
Sequence Cell
To create an event sequence, place two or more events in the faintly marked cell that reads Drag an event here to add a new sequence. At this point, the selected events have no effect because an action has not been assigned.
3. To select a sub‐set of your selected event, right‐click it and choose Properties. A Properties dialog opens that presents additional options. For example, if you open the Properties dialog for Errors, you can set the specific types of errors the Analyzer should look for. 4. Assign an action to the selected events by right‐clicking each of the events, selecting Specify Action from the pop‐up menu, and assigning an action such as Trigger, Filter, or Count. Be sure to click the event itself and not the State cell that it is sitting in (which produces a different pop‐up menu).
Summit T3‐8 PCI Express Multi‐Lane Protocol Analyzer User Manual
77
Teledyne LeCroy
Resources
Figure 5.17: Assigning an Action
Note: You can also assign actions to events by double‐clicking the event or action and selecting the Actions page when the Properties dialog opens (see “Event Properties Dialog Box Features” on page 90).
5. Click OK to close the dialog. At this point, assuming that the other options in the Recording Options dialog have been set (such as the General page), you can begin the recording by pressing the Start Recording
5.17
button.
Resources
Events in Recording Rules are based on Resources. There are three types of Resources. They are Packet Match Resources, Basic Resources and Payload Match Resources.
5.17.1
Packet Match Resource
Packet Match Resources are for the TLP, DLLP, TS1 and TS2 events as well as some of the storage protocol trigger options such as AHCI Register, NVMe Register, PQI Register and SOP IU Type. A Packet Match Resource allows you to define not only packets but it also allows you to define each specific bit in a packet. In the Packet Match resource you can define the exact layout to the bit level so that the Analyzer can match the exact pattern that applies to a TLP, DLLP, TS1 or TS2 event.
To set a Packet Match Resource, click on the New Event button and select any of the options. In this case we have selected DLLP: InitFC1. The DLLP: InitFC1 displays in the Available Events panel. Double‐click on the DLLP: InitFC1 to select the specific fields and go to the Layout tab to change the pre‐defined bits (see Figure 5.18 on page 79).
78
Summit T3‐8 PCI Express Multi‐Lane Protocol Analyzer User Manual
Resources
Teledyne LeCroy
Figure 5.18: Setting Up a Packet Match Resource - DLLP
Summit T3‐8 PCI Express Multi‐Lane Protocol Analyzer User Manual
79
Teledyne LeCroy
Resources
To set a TS1 Packet Match Resource, click on the New Event button and select Ordered Set: TS1. The Ordered Set: TS1 displays in the Available Events panel. Double‐click on the TS1 to select the specific fields and go to the Layout tab to change the pre‐defined bits.
Figure 5.19: Setting Up a Packet Match Resource - TS1
Defining Gen3 Layout tab does not mean the that analyzer will trigger on a TS that happens just at Gen3. Gen3 Layout will allow you to define the bits but if these bits are matched at any other speed the analyzer will trigger.
80
Summit T3‐8 PCI Express Multi‐Lane Protocol Analyzer User Manual
Resources
Teledyne LeCroy
5.17.2
Basic Resource
Basic Resources are for the Link States, Ordered Sets (except TS1 and TS2) and Errors. A Basic Resource does not allow you to define patterns to the bit level. It just matches events that have been predefined.
To set a Basic Resource, click on the New Event button and select any of the options. In this case we have selected Ordered Set: EIEOS. The EIEOS displays in the Available Events panel. Double‐click on the EIEOS to select other Ordered Set events and go to the Actions tab to configure specific Actions.
Figure 5.20: Setting Up a Basic Resource
Summit T3‐8 PCI Express Multi‐Lane Protocol Analyzer User Manual
81
Teledyne LeCroy
5.17.3
Resources
Payload Match Resource
Payload Match Resources are available for TLP events only. A Payload Match Resource allows you to define up to five double‐words of payload content to be matched for any TLP. These five double‐words are floating, meaning the payload of any TLP will be analyzed five double‐words at a time for all double‐words offsets in the payload. You can define the layout to the bit level in the Payload tab so that the Analyzer can match an exact pattern.
Note: The TLP Payload option will be available only if the Link Width is selected as fixed X1, X2 or X4 in the recording options.
To set a Payload Match Resource, click on the New Event button and select TLP >TLP Payload. The TLP Payload displays in the Available Events panel. Double‐click on the TLP Payload to select TLP Payload to display the Payload tab for setting the Mask and Match values and go to the Actions tab to configure specific Actions (see Figure 5.21 on page 82 and Figure 5.22 on page 83).
There are up to 8 Payload Match resources that can be used independently of the other resource types.
Storage trigger options ATA Command, NVMe Command Submission and NVME Command Completion, PQI Command, all SCSI commands sets are based on Payload Match Resources. Figure 5.21: Setting Up a Payload Match Resource 1
82
Summit T3‐8 PCI Express Multi‐Lane Protocol Analyzer User Manual
Resources
Teledyne LeCroy
Figure 5.22: Setting Up a Payload Match Resource 2
Summit T3‐8 PCI Express Multi‐Lane Protocol Analyzer User Manual
83
Teledyne LeCroy
Global State and Sequence States
The payload match pattern byte ordering is always little‐endian while the data payload display in the CATC Trace is big‐endian. The CATC Trace is configurable, so you need to exercise caution in order to specify the matching pattern properly.
Figure 5.23: Match Pattern Causing a Trigger
5.18
Global State and Sequence States
The Main Display area in the center of the Recording Rules window has two cells that affect events differently, they are the Global State and Sequence State. Global Cell
Sequence Cell
Figure 5.24: Global State Cell and Sequence State Cell
In the Global and Sequence State you can add events by clicking on the New Event button and after the event is in the State you can right‐click to Specify Actions, Move, Copy or Delete the event. You can view the Properties dialog to make additional changes to the 84
Summit T3‐8 PCI Express Multi‐Lane Protocol Analyzer User Manual
Global State and Sequence States
Teledyne LeCroy
Property of the event (see Figure 5.25). The description of these actions are given in Table 5.4 on page 104. Figure 5.25: Global State Menu
5.18.1
Global State
The Global State is active all the time. The Summit T3‐8 Analyzer tracks all the Events and Actions defined in the Global State throughout the recording. In the Global State the Link State, Ordered Set (except TS1 and TS2), Errors, Counter and the Timer use Basic Resources while TLP, DLLP, TS1 and TS2 use Packet Match Resources. The Global State has two Timers and two Counters.
Figure 5.26: Global State
Summit T3‐8 PCI Express Multi‐Lane Protocol Analyzer User Manual
85
Teledyne LeCroy
Global State and Sequence States
For the Global State there are only 2 Basic Resources for each Channel. Some optimization is done internally to accommodate additional resources. You can keep adding resources to the Global state so long as the Config is valid button stays green. If you add a new event which is not valid a window appears with a message prompting Invalid Recording Rules Configuration and the Config is valid button will turn red (see Figure 5.27 on page 86).
Figure 5.27: Valid and Invalid Recording Rules Configuration Dialogs
5.18.2
Sequence State
The cell marked Drag an event here to add another sequence is the Sequence State. In the Sequence State you can define a sequence of Events and Actions which the Summit T3‐8 Analyzer looks for at pre‐determined times. Sequences are chains of events culminating in a trigger or any other action. A sequence which is a separate chain of events can be created with up to 16 states. A state is an event condition with an action 86
Summit T3‐8 PCI Express Multi‐Lane Protocol Analyzer User Manual
Recording Rules Events
Teledyne LeCroy
within a sequence. Once a Sequence State is added the cell marked will read Drag an event here to add another state (see Figure 5.28).
Events can be added to this Sequence
Sequence States
Figure 5.28: Sequence State Events
In the Sequence State the Link State, Ordered Set, Errors, Counter and the Timer use Basic Resources while DLLP and TLP use Packet Match Resources. There are four Timers and four Counters in the Sequence State.
Note: In each Sequence State up to eight Basic Resources and eight Packet Match Resources can be defined.
5.19
Recording Rules Events
There are ten sets of Events that can configured and actions can be set for every Event.
TABLE 5.3: Events and Event Actions
Event
Link State
Pre-Defined Event Actions
Enter Electrical Idle
Summit T3‐8 PCI Express Multi‐Lane Protocol Analyzer User Manual
87
Teledyne LeCroy
Recording Rules Events
TABLE 5.3: Events and Event Actions (Continued)
Exit Electrical Idle
Speed Switch to 2.5Gb/s
Speed Switch to 5.0Gb/s
Speed Switch to 8.0Gb/s
CLKREQ# Falling
CLKREQ# Rising
WAKE# Falling
WAKE# Rising
Switch to x1
Switch to x2
Switch to x4
Switch to x8
Switch to x16
Ordered Set
TS1
TS2
EIEOS
EIOS
Skip
FTS
SDS
Compliance
Gen1 / Gen2
Errors
Idle Error
Disparity Error
Symbol Error
Token Error
Block Align Error
DLLP
Generic (User‐definable)
Any DLLP
MR DLLP
InitFC1
InitFC2
UpdateFC
88
Summit T3‐8 PCI Express Multi‐Lane Protocol Analyzer User Manual
Recording Rules Events
Teledyne LeCroy
TABLE 5.3: Events and Event Actions (Continued)
ACK
NAK
Power Management
Vendor
TLP
Any TLP
Config Rd
Config Wr
IO Rd
IO Wr
Mem Rd
Mem Wr
Message
Completion
AHCI
AHCI Register
NVME NVME Register
NVME Command Submission
NVME Cmmand Completion
PQI
PQI Register
PQI Command
SOP
SOP IU Type
SCSI
SCSI Block Command Set
SCSI Multimedia Command Set
SCSI Media Changer Command Set
SCSI Enclosure Services Command Set
SCSI Controller Command Set
SCSI Stream Command Set
SCSI Primary Command Set
Summit T3‐8 PCI Express Multi‐Lane Protocol Analyzer User Manual
89
Teledyne LeCroy
Properties Dialog Boxes for Events
Note: NVME Command, PQI Command and SCSI command sets are available for selection when Link Width option is set to X4 or lower in the Recording Options.
5.20
Properties Dialog Boxes for Events
Properties dialog boxes provide additional settings for Events, States, and Actions in the Recording Rules page. You can access a Properties dialog by double‐clicking an Event, State, Action or any other object. It allows you to set triggers and filters. For example, to set a trigger on a specific type of error, you open the Properties dialog.
5.20.1
Accessing the Properties Dialog
To see the Properties dialog, first create an event button by clicking the New Events button and choosing an event from the menu. Open the Event Properties dialog by doing one of the following:
5.20.2
Double‐click an event.
Right‐click an event and select Properties from the pop‐up menu.
Click the Properties button on the toolbar.
Event Properties Dialog Box Features
The following features are displayed in the any Event Properties dialog box (see Figure 5.29 on page 91).
Event Icon Preview
This icon shows you which event properties you are editing. The Icon Preview looks exactly like the icon in the Main Display area.
Icon Label
A text box for labeling the button. Whatever you type here appears on the button.
Channels
These controls allow you to select the channel(s) that the Analyzer should search when it is looking for the event. Pin Button
The Pin Button on the top right corner of the dialog allows you to pin the Properties dialog to the application so that it does not go away when another object appears such as an event, state or action.
Description String
This area contains a textual description of the event.
Event‐specific Settings
The largest part of the Event Properties dialog. The settings in this area vary for different events. Some events do not have any additional settings. 90
Summit T3‐8 PCI Express Multi‐Lane Protocol Analyzer User Manual
Properties Dialog Boxes for Events
Teledyne LeCroy
Figure 5.29: Properties Dialog Box.
5.20.3
Link State Dialog
The Link Properties dialog lets you select the link state. Figure 5.30: Link State Properties Dialog.
Summit T3‐8 PCI Express Multi‐Lane Protocol Analyzer User Manual
91
Teledyne LeCroy
5.20.4
Properties Dialog Boxes for Events
Ordered Set Properties Dialog
An Ordered Set cannot be filtered in a Global State, but can be filtered in a Sequence State. Figure 5.31: Ordered Set Properties Dialog.
5.20.5
Error Properties Dialog
The Error Properties dialog lets you select specific error types for performing an action. There are two sets of Error types: Packet Errors and Idle Errors.
Figure 5.32: Error Properties Dialog.
92
Summit T3‐8 PCI Express Multi‐Lane Protocol Analyzer User Manual
Properties Dialog Boxes for Events
5.20.6
Teledyne LeCroy
DLLP Packet Properties Dialog
The DLLP Packet Properties dialog allows you to specify any DLLP field as shown below. Figure 5.33: DLLP Packet Properties Dialog.
The Layout tab of the DLLP Packet Properties dialog allows you to change the pattern and customize it by defining each specific bit as shown in the figure below.
Figure 5.34: DLLP Packet Properties Dialog.
Summit T3‐8 PCI Express Multi‐Lane Protocol Analyzer User Manual
93
Teledyne LeCroy
5.20.7
Properties Dialog Boxes for Events
TLP Header Properties Dialog
The TLP Header Properties dialog enables you to set the TLP Header Fields and Layout, TLP Prefixes and Actions. You can manually change the Requester/Completer ID.
Figure 5.35: TLP Header Properties Dialog.
5.20.8
TLP Prefix Properties Dialog
The Layout tab of the TLP Prefix Packet Properties dialog allows you to change the pattern and customize it by defining each specific bit as shown in the figure below.
Figure 5.36: TLP Prefix Properties Dialog
94
Summit T3‐8 PCI Express Multi‐Lane Protocol Analyzer User Manual
Properties Dialog Boxes for Events
5.20.9
Teledyne LeCroy
AHCI Register Properties Dialog
The AHCI Register Properties dialog allows you to enter the MBAR value, choose the Register and Address Type from the drop‐down list and enter the offset.
Figure 5.37: AHCI Register Properties Dialog.
Note: Triggering on register event with 32‐bit address and payload defined is applicable to register write transactions only.
5.20.10 ATA Command Properties Dialog
The ATA Command Properties dialog allows you to change the pattern and customize it by defining each specific bit.
The data pattern can be entered directly into the field, but some fields can be selected from the drop‐down list. Click on the fieldname for a list of available values as illustrated in Figure 5.38.
Summit T3‐8 PCI Express Multi‐Lane Protocol Analyzer User Manual
95
Teledyne LeCroy
Properties Dialog Boxes for Events
Figure 5.38: ATA Command Properties Dialog.
96
Summit T3‐8 PCI Express Multi‐Lane Protocol Analyzer User Manual
Properties Dialog Boxes for Events
Teledyne LeCroy
5.20.11 NVME Register Properties Dialog
Any of the NVMe Register options can be selected from the New Event list. The NVME Register options are shown in Figure 5.39.
Figure 5.39: NVME Register Options Dialog
The NVME Register Properties dialog allows you to enter the MBAR value, choose the Register and Address Type from the drop‐down list and enter the offset.
Summit T3‐8 PCI Express Multi‐Lane Protocol Analyzer User Manual
97
Teledyne LeCroy
Properties Dialog Boxes for Events
Figure 5.40: NVME Register Properties Dialog.
Note: Triggering on register event with 32‐bit address and payload defined is applicable to register write transactions only.
98
Summit T3‐8 PCI Express Multi‐Lane Protocol Analyzer User Manual
Properties Dialog Boxes for Events
Teledyne LeCroy
5.20.12 NVME Command Submission Properties Dialog
Any of the NVMe Command Submissions can be selected from the New Event list. The NVME Command Submission options are shown in Figure 5.41.
Figure 5.41: NVME Command Submission Options Dialog
The NVME Command Submission Properties dialog allows you to change the pattern and customize it by defining each specific bit.
The data pattern can be entered directly into the field, but some fields can be selected from the drop‐down list. Click on the fieldname for a list of available values as illustrated in Figure 5.42.
Summit T3‐8 PCI Express Multi‐Lane Protocol Analyzer User Manual
99
Teledyne LeCroy
Properties Dialog Boxes for Events
Figure 5.42: NVME Command Submission Properties Dialog.
100
Summit T3‐8 PCI Express Multi‐Lane Protocol Analyzer User Manual
Properties Dialog Boxes for Events
Teledyne LeCroy
5.20.13 NVME Command Completion Properties Dialog
Any of the NVMe Command Completion Options can be selected from the New Event list. The NVME Command Completion options are shown in Figure 5.43.
Figure 5.43: NVME Command Completion Options dialog
The NVME Command Completion Properties dialog allows you to change the pattern and customize it by defining each specific bit.
The data pattern can be entered directly into the field, but some fields can be selected from the drop‐down list. Click on the fieldname for a list of available values as illustrated in Figure 5.44.
Summit T3‐8 PCI Express Multi‐Lane Protocol Analyzer User Manual
101
Teledyne LeCroy
Properties Dialog Boxes for Events
Figure 5.44: NVME Command Completion Properties Dialog.
5.20.14 PQI Register Properties Dialog
The PQI Register Properties dialog allows you to enter the MBAR value, choose the Register and Address Type from the drop‐down list and enter the offset.
Figure 5.45: PQI Register Properties Dialog.
Note: Triggering on register event with 32‐bit address and payload defined is applicable to register write transactions only.
5.20.15 PQI Command Properties Dialog
The PQI Command Properties dialog allows you to change the pattern and customize it by defining each specific bit as shown in the figure below.
102
Summit T3‐8 PCI Express Multi‐Lane Protocol Analyzer User Manual
Properties Dialog Boxes for Events
Teledyne LeCroy
The data pattern can be entered directly into the field, but some fields can be selected from the drop‐down list. Click on the fieldname for a list of available values as illustrated in Figure 5.46.
Figure 5.46: PQI Command Properties Dialog.
5.20.16 SOP IU Type Properties Dialog
The SOP IU Type Properties dialog allows you to change the pattern and customize it by defining each specific bit as shown in the figure below.
Figure 5.47: SOP IU Type Properties Dialog
5.20.17 SCSI Block Command Set Properties Dialog
The SCSI Block Command Set Properties dialog allows you to change the pattern and customize it by defining each specific bit.
The data pattern can be entered directly into the field, but some fields can be selected from the drop‐down list. Click on the fieldname for a list of available values as illustrated in Figure 5.48.
Summit T3‐8 PCI Express Multi‐Lane Protocol Analyzer User Manual
103
Teledyne LeCroy
Properties Dialog Boxes for Events
Figure 5.48:
SCSI Block Command Set Properties Dialog.
The SCSI Multimedia Command Set, SCSI Media Changer Command Set, SCSI Enclosure, Services Command Set, SCSI Controller Command Set, SCSI Stream Command Set and SCSI Primary Command Set all have the same dialog shown in Figure 5.48.
5.20.18 Actions Properties Dialog
Every Event has an Action tab as shown in Figure 5.49 on page 105. The following tables describes the Actions for each Event.
TABLE 5.4: Event Actions
Action
Label Channels
Internal Triggering
External Triggering
Sequence
104
Description
Label the action.
Select Channels to go upstream or downstream.
Check the box to enable Internal Triggering from the Trigger In input. Any edge of the supplied signal will cause the analyzer to trigger.
Set the External Triggering to Low, High or Toggle. The default is None.
Set the Sequence to Advance. The default is None.
Summit T3‐8 PCI Express Multi‐Lane Protocol Analyzer User Manual
Properties Dialog Boxes for Events
Teledyne LeCroy
TABLE 5.4: Event Actions (Continued)
Filtering
Local Timer
Action
Local Counter
Local Counter Action
Global Timer
Global Timer Action
Global Counter
Global Counter Action
Set the Filtering to Filter Out. You cannot Filter In in the Summit Z3‐16. The default is None.
Set the Local Timer, there are four options available.
You can set the Action of the timer to Start or Reset. When you reset the timer it resets to it’s initial value. The default is No Action.
Set the Local Counter, there are four options available.
You can set the Action of the Counter to Increment or Reset. The Counter increments by one and resets to its initial value. The default is No Action.
Set the Global Timer, there are two options available.
You can set the Action of the timer to Start or Reset. When you reset the timer it resets to it’s initial value. The default is No Action.
Set the Global Counter, there are two options available.
You can set the Action of the Counter to Increment or Reset. The Counter increments by one and resets to its initial value. The default is No Action.
Figure 5.49: Actions Properties Dialog
Summit T3‐8 PCI Express Multi‐Lane Protocol Analyzer User Manual
105
Teledyne LeCroy
5.21
Filter Out
Filter Out
A filter causes the Analyzer to filter out specified events from the recording. If events are filtered out of the recording, they are excluded from the Analyzer's buffer and not simply hidden from the CATC Trace. The purpose of “filtering out” is to preserve recording memory so you conduct longer recording sessions and exclude events that do not interest you.
Filter-Out In Simple Mode
In Simple Mode you can filter out:
SKIP Ordered Sets
UpdateFC DLLP
Link Events (Link Up and Link Down)
CLKREQ#
WAKE#
You can also choose to Ignore EDS and Idle Errors. See Figure 5.50.
Figure 5.50: Simple Mode: Filter Out
106
Summit T3‐8 PCI Express Multi‐Lane Protocol Analyzer User Manual
Filter In
Teledyne LeCroy
Note: If you did Filter‐Out all the events shown above, you’d create an empty trace and get a warning message (see “Empty Trace File Warning: If you’ve chosen recording conditions which result in an empty trace (no traffic is recorded), a warning message is displayed.” on page 200.)
Filter-Out in Advanced Mode
To enable “filter‐out” in Advanced Mode, place an event button into either the Global State cell or the Sequence cell, then right‐click the button and choose an Action (see previous topic). From the sub‐menu, select Filter‐Out. See Figure 5.51.
Figure 5.51: Filter Out Option
Note: The Filter‐Out option is only available in the DLLP, TLP, TS1 and TS2 Ordered Sets, for Link Events Enter/Exit Electrical Idle, WAKE# Asserted/Deasserted, or CLKREQ# Asserted/Deasserted.
Note: f you did Filter‐Out all events (by mistake), you’d create an empty trace and get a warning message (see “Empty Trace File Warning: If you’ve chosen recording conditions which result in an empty trace (no traffic is recorded), a warning message is displayed.” on page 200.)
5.22
Filter In
“Filter in” is the logical opposite of “Filter Out”. In this case, you are specifically interested in capturing specific events or traffic and ignoring everything else. If events are filtered in to the recording, they are included in the Analyzer's buffer. The purpose of “filtering in” is to preserve recording memory so you conduct longer recording sessions and include only events that interest you. Filter ‐n is only available in Advanced Mode.
As an example, let’s say you want to capture Any DLLP and Any NVMe:ACQ Commands. First switch to Advanced Mode.
Summit T3‐8 PCI Express Multi‐Lane Protocol Analyzer User Manual
107
Teledyne LeCroy
Filter In
To enable “Filter‐In” place an event button (DLLP ‐> Any DLLP) into the Global State cell, then right‐click the button and choose an Action. From the sub‐menu select Filter‐In.
Then select NVMe under New Event and NVMe Register:ACQ and place that event into the Sequence 1, State 1 cell. Then right‐click the button and choose an Action. From the sub‐menu select Filter‐In. See Figure 5.53 on page 109.
Figure 5.52: Filter In Option
Note: When a Filter‐In is selected the analyzer filters out everything else by default.
Valid Configuration
In this case, you have chosen a Global State Filter‐In on any DLLP and Sequence 1, State 1 to have an NVMe Command:ACQ Filter‐In. This is a valid configuration as shown in Figure 5.53.
108
Summit T3‐8 PCI Express Multi‐Lane Protocol Analyzer User Manual
Filter In
Teledyne LeCroy
Figure 5.53: Filter In: Advanced Mode: Filter In Any DLLP and Any NVMe ACQ Command
Note: If you change the Global State to Any DLLP but switch to FILTER‐OUT you’ll get the following warning message: See Figure 5.54 on page 110.
Summit T3‐8 PCI Express Multi‐Lane Protocol Analyzer User Manual
109
Teledyne LeCroy
Filter In
Invalid Configuration
Figure 5.54: Warning Message for Invalid Configuration
The analyzer is warning you that you’ve set a Global Rule to Filter‐Out Any DLLP and that condition will filter out the NVMe:ACQ Command you’re looking for. So the recording rules have to be consistent. You’d get the same message if you set Any DLLP to Filter‐In but set the NVMe:ACQ Command to Filter‐Out. The warning message would pop up and if you hit OK, the Config is Invalid message will light up. See Figure 5.55 on page 111.
110
Summit T3‐8 PCI Express Multi‐Lane Protocol Analyzer User Manual
Filter In
Teledyne LeCroy
Figure 5.55: Filter In: Any DLLP, Filter Out Any NVMe:ACQ Command -> Invalid Config
So the tool won’t let you try to set recording options that are logically inconsistent.
Summit T3‐8 PCI Express Multi‐Lane Protocol Analyzer User Manual
111
Teledyne LeCroy
5.23
Triggering Configuration on a per Lane Basis
Triggering Configuration on a per Lane Basis
The Lane Trigger Configuration Icon (available on the Recording Options => Recording Rules toolbar see Figure 5.56) provides the user with the ability to add pre‐conditions on specific lanes that the analyzer will use as an additional restriction on a defined triggering event.
Figure 5.56: Lane Trigger Configuration
This option has three categories of events which can be made lane‐based:
DLLP/TLP Packets
Errors
Ordered Sets
Each of these events has restrictions on the lanes available, as spelled out in the GUI.
112
These selections will be applied globally
Lane selections will be applied to logical lane(s) and NOT physical lane(s)
Default is “all Lanes”, but you can select one or more lanes as targets
Filter‐in/out will not function is you are using per lane triggering
Summit T3‐8 PCI Express Multi‐Lane Protocol Analyzer User Manual
Triggering Configuration on a per Lane Basis
Teledyne LeCroy
DLLP/TLP Packets Category
For DLLP/TLP packets starting in selected lanes, the packet must start in lanes 0, 4, 8 or 12. One or more of these four lanes can be selected to look for the start of DLLP/TLP packets and the selection can be made for each direction by checking boxes.
See Figure 5.57.
Figure 5.57: Start of Packet in lane GUI
Summit T3‐8 PCI Express Multi‐Lane Protocol Analyzer User Manual
113
Teledyne LeCroy
Triggering Configuration on a per Lane Basis
Errors Category
Errors category can be used as a pre‐condition to trigger on an event in selected Upstream or Downstream lanes. The types of errors that will be detected are limited to:
Symbol errors
Disparity errors
Block errors
See Figure 5.58.
Figure 5.58: Error Found In Selected Lanes
114
Summit T3‐8 PCI Express Multi‐Lane Protocol Analyzer User Manual
Triggering Configuration on a per Lane Basis
Teledyne LeCroy
Ordered Sets Category
This category includes all types of ordered sets (TS1, TS2, EIEOS, EIOS, Skip, FTS, and SDS). If a specific lane is selected in the Event Properties dialog of a TS ordered set the same specific lane must be selected here or no triggering event will occur.
See Figure 5.59.
Figure 5.59: Ordered Sets Found in Upstream and Downstream Lanes
Summit T3‐8 PCI Express Multi‐Lane Protocol Analyzer User Manual
115
Teledyne LeCroy
Triggering Configuration on a per Lane Basis
Lane Trigger Configuration Example 1:
If you need to trigger on TLPs that start on lane 4 in the upstream direction perform the following selection (see Figure 5.60):
Figure 5.60: Lane Trigger Configuration: Example 1
Then select the appropriate event to trigger the analyzer.
116
Summit T3‐8 PCI Express Multi‐Lane Protocol Analyzer User Manual
Triggering Configuration on a per Lane Basis
Teledyne LeCroy
Lane Trigger Configuration Example 2:
If you need to trigger the analyzer on errors happening on lanes 4 and 6 in the upstream direction, perform the following selections:
Figure 5.61: Lane Trigger Configuration: Upstream Errors on Lanes 4 and 6
Then select the appropriate event to trigger the analyzer.
Summit T3‐8 PCI Express Multi‐Lane Protocol Analyzer User Manual
117
Teledyne LeCroy
Triggering Configuration on a per Lane Basis
Lane Trigger Configuration Example 3:
If you need to trigger on a TS1 Event with Link Number = 00 and Lane Number = PAD that happens on Lane 3 only in the Downstream direction, perform the following selections for Lane Triggering (see Figure 5.62):
Figure 5.62: Lane Trigger Configuration: Downstream TS1, Downstream, Lane 3
118
Summit T3‐8 PCI Express Multi‐Lane Protocol Analyzer User Manual
Triggering Configuration on a per Lane Basis
Teledyne LeCroy
Then select a TS1 Event and select only the Downstream direction, set Link Number = 00 and Lane number = PAD fields (see Figure 5.63):
Figure 5.63: Setting the Event Properties for TS1 Downstream
Finally, set the Action Tab to trigger the analyzer (see Figure 5.64 on page 120).
Summit T3‐8 PCI Express Multi‐Lane Protocol Analyzer User Manual
119
Teledyne LeCroy
Counter
Figure 5.64: Event Properties: Actions = Trigger Analyzer
Now the analyzer will be triggered on a TS1 Event with Link Number = 00 and Lane Number = PAD that happens on Lane 3 only in the Downstream direction.
5.24
Counter
Counters can be created for any specific event or for multiple events. Counters function similar to an event and are independent of the event, thus allowing greater flexibility. You can select a counter for any event and if both channels are selected you can set the counter to count upstream and downstream. Counters can be reset providing further flexibility. The counter once set lives in the State. In an Advance to Sequence state once the action proceeds from one sequence state to the next, the counter in the preceding state will stop and the counter in the current state will start.
There are two Counters for the Global State and four Counters for the Sequence State (see Figure 5.65 on page 121).
Note: It is an invalid configuration for some events when you try and set a counter and timer when both channels are selected.
120
Summit T3‐8 PCI Express Multi‐Lane Protocol Analyzer User Manual
Counter
Teledyne LeCroy
The counters have different colors for the Global State and Sequence State. Each color signifies a different meaning in the Global and Sequence states.
Note: Global timers/counters can be used by events from any direction as long as the events occur more than 380 ns apart. State timer/counters can be controlled only from one direction not both, meaning starting, reset and incrementing must be done from events occurring in the same direction of the selected timer/counter.
Figure 5.65: Global and Sequence State Counters
As shown in Figure 5.65 there is a Global Counter 1, set to the value of 2 on channel up displayed in green in the Global State and there are two counter 1s, set to the value of 2, one counting upstream and the other counting downstream displayed in pink in the Sequence State.
5.24.1
How to Set a Counter
Counters are events and you can add a counter to the Global State or the Sequence State as an event by doing the following:
Right‐click in the blue space in the Global or Sequence State and New Event > Counter > UpStream or DownStream. See Figure 5.66 on page 122.
Summit T3‐8 PCI Express Multi‐Lane Protocol Analyzer User Manual
121
Teledyne LeCroy
Counter
Figure 5.66: Setting Global and Sequence State Counter Events
5.24.2
How to Increment or Reset a Counter
You can Increment or Reset counters in the Global State and in the Sequence State by performing the following steps:
1. Open the Recording Rules page, select an event, and drag it to the Global State or Sequence cells. For details on these steps (see “Probe Settings” on page 129).
2. Right‐click on an event and select Specify Actions > Increment Global Counter > Global Counter 1 from the menu (see Figure 5.67 on page 123).
122
Summit T3‐8 PCI Express Multi‐Lane Protocol Analyzer User Manual
Counter
Teledyne LeCroy
Figure 5.67: Incrementing and Resetting Global and Sequence State Counters
Note: Listed below are some of the considerations to note about the counter functionality
1. If a counter is reset, it will restore to it's original value, in this case the value defined by the user.
2. Resetting a counter will stop it and set it to it's original value.
3. Local counters for a particular state will automatically reset if the sequencer advances to another state. Example: "Counter A" in State 1 and "Counter A" in State 2 are different timers not related to each other.
4. Local counters are controlled by events defined in the same state where the counters are defined.
5. In case of competing actions to control global counters using the same event from global and local states, the control from local states takes priority.
5.24.3
Changing the Value of the Counter
To change the value of the counter:
1. Double‐click on the Counter.
2. Enter a new value in the pop‐up dialog. This causes the new value to appear in the counter button.
Summit T3‐8 PCI Express Multi‐Lane Protocol Analyzer User Manual
123
Teledyne LeCroy
5.24.4
Timer
Deleting a Counter
To delete a counter
1. Right‐click on the Counter. 2. Select Delete This Event. The counter will disappear from the event.
5.25
Timer
The Timer has two options which are Start and Reset (see Figure 5.68 on page 125). When set to Start it starts the timer and when set to Reset it resets the timer to its initial value. When the timer count is down to 0 the action is triggered.
The Global State timer can trigger, start an action. It can also affect some other timers and counters.
Note: It is an invalid configuration for some events when you try and set a counter and timer when both channels are selected.
The timers have different colors for the Global State and Sequence State. Each color signifies a different meaning in the Global and Sequence states.
There are two Timers for the Global State and four Timers for the Sequence State.
Note: Global timers/counters can be used by events from any direction as long as the events occur more than 380 ns apart. State timer/counters can be controlled only from one direction not both, meaning starting, reset and incrementing must be done from events occurring in the same direction of the selected timer/counter.
124
Summit T3‐8 PCI Express Multi‐Lane Protocol Analyzer User Manual
Timer
Teledyne LeCroy
Figure 5.68: Global and Sequence State Timers
As shown in Figure 5.68 there is a Global Timer A, set to the value of 1.000s on channel Up displayed in blue in the Global State and there is one timer A, set to the value of 1.000s on channel Down displayed in brown in the Sequence State.
Summit T3‐8 PCI Express Multi‐Lane Protocol Analyzer User Manual
125
Teledyne LeCroy
5.25.1
Timer
How to Set a Timer
Timers are events and you can add a timer to the Global State or the Sequence State as an event by doing the following:
Right‐click in the blue space in the Global or Sequence State and New Event > Timer. See Figure 5.69.
Figure 5.69: Setting Global and Sequence State Timer Events
5.25.2
How to Start or Reset a Timer
You can Start or Reset the Timer in the Global State and in the Sequence State by performing the following steps:
1. Open the Recording Rules page, select an event, and drag it to the Global State or Sequence cells (see Figure 5.70 on page 127). For details on these steps (see “Probe Settings” on page 129).
2. Right‐click on an event and select Specify Actions > Start Global Timer > Global Timer A or Timer B from the menu. See the figure below.
126
Summit T3‐8 PCI Express Multi‐Lane Protocol Analyzer User Manual
Timer
Teledyne LeCroy
Figure 5.70: Starting and Resetting Global and Sequence State Timers
Note: Listed below are some of the considerations to note about timer functionality
1. If a timer is reset, it will restore to it's original value, in this case the value defined by the user.
2. Resetting a timer will stop it and set it to it's original value.
3. Local timers for a particular state will automatically reset if the sequencer advances to another state. Example: "Timer A" in State 1 and "Timer A" in State 2 are different timers not related to each other.
4. Local timers are controlled by events defined in the same state where the timers are defined.
5. In case of competing actions to control global timers using the same event from global and local states, the control from local states takes priority.
Summit T3‐8 PCI Express Multi‐Lane Protocol Analyzer User Manual
127
Teledyne LeCroy
5.25.3
Channel
Changing the Value of the Timer
To change the value of the timer:
1. Right‐click on the Timer. 2. Select Properties 3. Enter in values for the Timer in the fields provides in Secs, Millisecs, Microsecs and Nanosecs on the Timer tab.
Figure 5.71: Setting the Timer Values
4. Click on the Actions tab and set the External and Internal Triggering, Sequencing and Filtering options. You can label the timer.
5.25.4
Deleting a Timer
To delete a Timer
1. Right‐click on the Timer. 2. Select Delete This Event. The Timer will disappear from the event.
5.26
Channel
Every event has two channels, one upstream and the other downstream. You can use both channels with any event. The channels are independent of each other. If both channels are selected it is valid but no action occurs, and thus no timer and counter is created. Figure 5.72 on page 129 shows three events in the Global State, the first event is on Channel Up and the 3rd event is on Channel Down.
128
Summit T3‐8 PCI Express Multi‐Lane Protocol Analyzer User Manual
Probe Settings
Teledyne LeCroy
Figure 5.72: Events with Channels
5.27
Probe Settings
The Summit T3‐8 analyzer can be optimized for specific DUT signal characteristics. The auto calibration feature in the Probe Settings allows for better signal recovery. There are 16, 0 db to 15 db, internal equalization modes in the analyzer hardware that boost the high frequency content of the captured signal. This equalization does not impact the signal to the DUTs, but helps in ‘opening the eye’ of the captured signal, so that the internal logic can capture PCIe frames. The system is designed to allow you to manually set the equalization to one of the sixteen modes for the CTLE values and one of the eight modes for the DFE values or choose to run an automated algorithm, internal to the analyzer. This automated calibration sets the optimized values for each of the PCIe captured lanes, provided that the signal at the analyzer input is stable.
Each lane can be configured to use specific equalization settings to match signal characteristics of the lane and improve the analyzer’s ability to capture error free traces. For 2.5/5.0 GT/s speeds only CTLE setting is required to achieve good captures. For 8.0GT/
s you can adjust CTLE, DFE and DC Gain parameters.
Select Recording Options > Probe Settings from the Setup menu to display Probe Settings.
5.27.1
Setting Auto Calibration
The Probe Settings tab in the Recording Options dialog displays the equalizer settings. To set all lanes upstream and downstream check the Set All Lanes box. Click on Auto Calibration (see Figure 5.73) to display the Calibrate dialog (see Figure 5.74 on page 131). Summit T3‐8 PCI Express Multi‐Lane Protocol Analyzer User Manual
129
Teledyne LeCroy
Probe Settings
Figure 5.73: Probe Settings Tab
You can auto calibrate the probe settings by clicking on the Auto Calibration button. In order to calibrate the device the link should be trained to the widest width and the highest speed. Specify the link width, speed and lane polarity click Start Calibration (see Figure 5.74 on page 131). By default, the polarity settings are carried over from the recording options menu.
To use the external reference clock or for quick calibration click the appropriate checkboxes to select them. If checked, calibration routine will only scan CTLE, if not checked it will include DFE with the CTLE scan which will take longer, approximately 9 minutes.
130
Summit T3‐8 PCI Express Multi‐Lane Protocol Analyzer User Manual
Probe Settings
Teledyne LeCroy
Figure 5.74: Calibrate Dialog
The optimal CTLE is calculated. As shown in Figure 5.76 the Link Width of x4 and 8.0 GT/s Speed is selected. Figure 5.75: Calculating Optimal CTLE Progress Bar
Summit T3‐8 PCI Express Multi‐Lane Protocol Analyzer User Manual
131
Teledyne LeCroy
Probe Settings
The calculated CTLE values are automatically displayed in the relevant lane fields as shown in Figure 5.76. Click Save to save the settings or click Save As Default to save the settings as the default. Click Load to save the settings as a .rec file as a PE Tracer Recording option to be used at a later time. Click Reset to clear the settings.
Figure 5.76: Auto Calibration Settings
132
Summit T3‐8 PCI Express Multi‐Lane Protocol Analyzer User Manual
Probe Settings
5.27.2
Teledyne LeCroy
PCIe Gen3 Auto Calibration
In order for auto calibration at Gen3 to work, lane polarity has to be set manually. In general, follow the steps below to find the polarity and set it up properly in the calibration dialog.
1. Setup the analyzer to record the training sequence with (TS2, Switch to G3 or InitFC1), at Gen1 or Gen2 (use trigger as TS2 or Speed Switch), using the Auto‐
Configure Lane Polarity recording option. This will allow the analyzer to calculate/
determine the polarity and lane reversal settings of the link.
Figure 5.77: Simple Mode Tab
2. Drive the link to Detect or Recovery by powering up or booting the system.
3. After the recording is complete, click the Dashboard View icon to open the Dashboard dialog and verify the polarity calculated by the analyzer (see Figure 5.78 on page 134).
Summit T3‐8 PCI Express Multi‐Lane Protocol Analyzer User Manual
133
Teledyne LeCroy
Probe Settings
Figure 5.78: Dashboard View
Note: You can also set the recording option for auto configure lane polarity to unchecked and set up the polarity manually after reviewing the training sequences shown in the CATC Trace (refer to http://cdn.teledynelecroy.com/files/appnotes/lane_reversal_and_polarity.pdf). In this case, do not open the Dashboard dialog and go directly to step 6.
4. Copy the calculated polarity from the Dashboard to the Recording Options by clicking the Copy Polarity Settings to Recording Options button.
Figure 5.79: Calculating Optimal CTLE Progress Bar
5. Close the Dashboard and verify that the lane polarity in Recording Options have been updated. You will need to keep using this configuration after the calibration has been performed.
6. Drive the link to Gen3 and make sure the link stays in Gen3 L0 (no low power states or speed switch).
134
Summit T3‐8 PCI Express Multi‐Lane Protocol Analyzer User Manual
Probe Settings
Teledyne LeCroy
7. Select Recording Options and click the Probe Settings tab. 8. Click Auto Calibration to display the Calibrate SummitT3‐8 Dialog.
Manually set the polarity for each lane in this dialog with the polarity settings in the Link Dashboard. Link Width, Speed and Polarity must be set the same as the current state of the link. Checking the Quick Calibration option will sweep through the CTLE setting only. If unchecked it will sweep through both CTLE and DFE. Using Detect Idle Errors will increase the calibration time but it will improve/optimize calibration results.
Figure 5.80: Calibrate Summit T3-8 Dialog
9. Click Start Calibration On completion of calibration, close the Auto Configure dialog.
It may take 10‐20 minutes for x8 and upwards 45 minutes to calibrate an X16 link for both directions with Detect Idle Errors checked and Quick Calibration unchecked.
10. You can now start recording at Gen3 speed using the Recording Option Speed set to Gen3 or Auto.
Summit T3‐8 PCI Express Multi‐Lane Protocol Analyzer User Manual
135
Teledyne LeCroy
5.27.3
Probe Settings
Save
The Save function in the Recording Rules and the Probe settings tab has the following options:
Save the whole Recording Options (.rec)
Save only the Recording Rules portions of the recording options (.rr)
Save only the Probe Settings portions of the recording options (.ps)
Figure 5.81: Save Dialog
136
Summit T3‐8 PCI Express Multi‐Lane Protocol Analyzer User Manual
Probe Settings
5.27.4
Teledyne LeCroy
Load
The Load function in the Recording Rules and the Probe settings tab has the following options (see Figure 5.82 on page 137):
Load the whole Recording Options (.rec)
Load the Recording Options of a PCIe Trace Files (.pex)
Load only the Recording Rules portions of the recording options (.rr)
Load only the Probe Settings portions of the recording options (.ps)
Figure 5.82: Load Dialog
Summit T3‐8 PCI Express Multi‐Lane Protocol Analyzer User Manual
137
Teledyne LeCroy
138
Probe Settings
Summit T3‐8 PCI Express Multi‐Lane Protocol Analyzer User Manual
Chapter 6
Reading CATC Traces
6.1
Viewing PCI Express CATC Traces
PCIe Protocol Suite™ displays traffic as labeled, color‐coded, and time‐stamped rows.
Tool tips provide details about fields within the CATC Trace. Hold the mouse cursor over a field to see a tool tip. Additional information is available from pop‐up menus. For example, if you click the left mouse button on the first cell in a packet a menu appears with an option to view Raw 10b Codes.
6.2
Expand and Collapse Data Fields
Packet data fields are displayed in a short format by default. You can view a data field’s long format by performing one of the following three actions:
Click the small triangle in the left corner.
Double‐click anywhere in the data field.
Click once in the Data Field with the left mouse button, then choose Expand Data from the pop‐up menu.
A repeat of any above methods causes the display to return to a Short Data format.
Summit T3‐8 PCI Express Multi‐Lane Protocol Analyzer User Manual
139
Teledyne LeCroy
6.3
Resizing Cells
Resizing Cells
Data cells can be resized by pointing the mouse pointer on the edge of a data cell, depressing and holding the left mouse button, and then repositioning the mouse pointer while keeping the mouse button depressed.
6.4
Pop-up Menus
The Analyzer software makes extensive use of pop‐up menus. In some instances, pop‐up menus provide the only means of accessing dialogs that contain detailed information about cells within the CATC Trace, for example, the Show Configuration Space dialog. To see a pop‐up menu, left‐click or right‐click a cell within the CATC Trace. Right‐click or left‐click behavior depends on the Display Options setting. For default left‐click, the right‐
click menu is not cell‐dependent. For other left‐click behavior, the type of menu that opens varies depending on the type of cell that is selected. Take some time to explore CATC Traces and the various pop‐up menus.
6.5
View Data Block
To view the raw bits that make up the data in a data field, right‐click a data field, then click
or select View Data Block from the pop‐up menu to display the Data Block window
Figure 6.1: Viewing a Data Block.
You can display data in Hexadecimal, ASCII, Decimal, or Binary formats.
Bit Order is Most Significant Bit or Least Significant Bit.
You can display data in Big Endian or Little Endian.
Format lets you display data as BYTEs, WORDs, or DWORDs.
Columns lets you select the number of columns.
You can enter hexadecimal offset values.
You can go to or search Previous or Next.
140
Summit T3‐8 PCI Express Multi‐Lane Protocol Analyzer User Manual
Show Raw 10b Codes
6.6
Teledyne LeCroy
Show Raw 10b Codes
You can view the raw bits that make up the data field by left‐clicking the field and selecting View Data Block from the pop‐up menu.
To view Raw 10b Codes:
1. Right‐click the first cell in a packet.
2. Select Show Raw 10b Codes from the pop‐up menu to display the Raw 10b Codes window.
Figure 6.2: Show Raw 10b Codes Dialog.
3. To change the format of the data, use the options along the right side of the dialog. 4. To navigate the CATC Trace, use the Prev and Next buttons.
Summit T3‐8 PCI Express Multi‐Lane Protocol Analyzer User Manual
141
Teledyne LeCroy
6.7
Show Header Fields
Show Header Fields
You can view details about header fields by opening the Show Header Fields dialog.
1. Click a header. A pop‐up menu appears.
2. Select Show Header Fields. The following dialog opens.
Figure 6.3: Viewing Packet Fields.
3. Use the Prev and Next buttons to navigate to other headers.
142
Summit T3‐8 PCI Express Multi‐Lane Protocol Analyzer User Manual
Packet Cell Popup Menus
6.8
Teledyne LeCroy
Packet Cell Popup Menus
The Packet cell has a right‐click pop‐up menu that includes the Show Raw 10b Codes command.
6.8.1
Set Start Quick Timing Marker
Sets the start packet for the Quick Timing marker. An S symbol is displayed at the packet.
Quick Timing provides immediate time deltas and bandwidth calculations. If the Start is placed on a packet that contains an Address and Endpoint, the bandwidth for that combination is displayed in the Status Bar below the trace data.
Quick Timing Markers are special ""Start"" and ""End"" markers used to mark the boundaries of the calculations. The results are shown in a special Quick Timing Bar at the bottom of the TraceView. The markers are set from a context sensitive menu.
6.8.2
Set End Quick Timing Marker
Sets the end packet for the Quick Timing marker. An E symbol is displayed at the packet. 6.8.3
Delete All Quick Timing Marker
Deletes all Quick Timing markers.
Summit T3‐8 PCI Express Multi‐Lane Protocol Analyzer User Manual
143
Teledyne LeCroy
Packet Cell Popup Menus
The right‐click pop‐up menu from Packet cell is displayed below. 144
Summit T3‐8 PCI Express Multi‐Lane Protocol Analyzer User Manual
Set Marker
6.8.1
Teledyne LeCroy
Packet Header R-> Cell Popup Menu
The Packet Header R‐> cell has a pop‐up menu with the Swap Upstream/Downstream command, which changes the directionality of the packets in the CATC Trace.
6.8.2
Packet Header G1 Cell Popup Menu
The Packet Header CRC 16 cell has a pop‐up menu with the Show Header Fields command (see “Show Header Fields” on page 142), which exposes a detailed view of the selected Header field.
6.9
Set Marker
A marker is a unique label for a packet that allows you to go to that packet and also serves as a comment string for a specific packet. When you select a marker, the identified packet appears at the top of the screen. Packets that have been marked have a red bar on the left edge.
To set a marker, perform the following steps:
1. Right‐click the Packet field of the packet you want to mark (see following figure) or hover over the packet and click Ctrl+K, or select the packet and click Ctrl+L.
Summit T3‐8 PCI Express Multi‐Lane Protocol Analyzer User Manual
145
Teledyne LeCroy
Set Marker
2. Click Set Marker.
3. When the Create Marker for Packet # pop‐up displays (see Figure 6.4 on page 146), enter a unique identifier for the packet in the Comment field.
Figure 6.4: Create Marker for Packet Dialog.
Later, you can go directly to this packet using the Go To Marker operation in the Search Menu. 146
Summit T3‐8 PCI Express Multi‐Lane Protocol Analyzer User Manual
Edit or Clear Marker
6.10
Teledyne LeCroy
Edit or Clear Marker
To change a markers identifier, or clear (delete) the marker:
1. Right‐click the Packet field of the desired packet to display a pop‐up menu (see Figure 6.5 on page 147).
Figure 6.5: Edit Marker Pop-up Menu.
2. Choose Edit Marker and enter a new identifier into the Edit Marker for Packer # pop‐up, or Choose Clear Marker. When you choose Clear Marker, the marker is removed and the red line disappears.
6.11
Compressed CATC Trace View
The Compressed CATC Trace view shows fields in the format “Attribute: Value”, whereas the normal CATC View shows the attribute name on top and the value below.
The Compressed CATC Trace view has almost all the information of the normal CATC View and behaves mostly the same way, while displaying more information on each window (see Figure 6.6 on page 148).
To compress the CATC Trace:
Click
on the toolbar.
Summit T3‐8 PCI Express Multi‐Lane Protocol Analyzer User Manual
147
Teledyne LeCroy
Spreadsheet View
Figure 6.6: Compressed CATC Trace.
6.12
Click
on the toolbar to return to the normal CATC Trace View, or
Select View > Trace Views > CATC Trace. Spreadsheet View
You can view the CATC Trace as a spreadsheet in color or black and white.
Click
148
on the toolbar to display the Spreadsheet View (see Figure 6.7 on page 149).
Summit T3‐8 PCI Express Multi‐Lane Protocol Analyzer User Manual
Spreadsheet View
Teledyne LeCroy
Figure 6.7: Spreadsheet View (Color).
Click
on the toolbar to display the Spreadsheet View B/W.
Figure 6.8: Spreadsheet View (Black And White).
Summit T3‐8 PCI Express Multi‐Lane Protocol Analyzer User Manual
149
Teledyne LeCroy
6.12.1
Spreadsheet View
Columns
To add a column, right‐click a column header, select Add Column, and then select the column name. To delete a column, right‐click a column header and then select Remove Column.
To reposition a column, drag the column header to the new position.
To resize columns, select the column divider and drag the divider to the right or left.
Each of the SSD options (NVMe, PQI, AHCI, ATA, SOP, SCSI) can be viewed and has its own customizable column configuration. The figure below shows the NVMe transaction level.
Figure 6.9: NVMe Transaction Level.
Restore Factory Default Settings
You can use one of the following three methods to restore the columns to the factory default settings:
Right‐click the column header and select Restore default columns to display a confirmation dialog. Click Yes to restore for selected transaction level.
Figure 6.10: Right-click Header Restore Default Columns Dialogs.
150
Summit T3‐8 PCI Express Multi‐Lane Protocol Analyzer User Manual
Spreadsheet View
Teledyne LeCroy
Right‐click in the empty space and select Restore views to default positions to display a confirmation dialog. Click Yes to restore for specific transaction level.
Figure 6.11: Right-click Empty Space Restore Views to Default Positions Dialogs.
Summit T3‐8 PCI Express Multi‐Lane Protocol Analyzer User Manual
151
Teledyne LeCroy
Spreadsheet View
Select Setup > Display Options to display the Display Options dialog. Click Restore Factory Settings.
Figure 6.12: Setup and Display Options Dialog.
6.12.2
Detail View and Spreadsheet View
In the Spreadsheet View, double‐click a packet, transaction, or transfer, or select a field and then click
Figure 6.13 on page 152).
on the toolbar, to display the Detail View (see To put a Detail View header as a column in the Spreadsheet View, drag the header to a column divider in the Spreadsheet View. Figure 6.13: Detail View in Spreadsheet View.
152
Summit T3‐8 PCI Express Multi‐Lane Protocol Analyzer User Manual
Decoding Traffic
6.13
Teledyne LeCroy
Decoding Traffic
The PCIe Protocol Suite software has several decode levels: 6.13.1
Packet
Packet level decode
includes all TLP packets, DLLP packets, and all ordered sets.
Note: The PCI‐E 3.0 (and 2.1 with Errata) specifications state that there are two formats of the AER capability structure, and the AER_CAP_VER field indicates if format 1 or format 2 is used.
The difference between format 1 and format 2 is whether or not the TLP Prefix Header section is present in the AER capability, even if it is not actually implemented.
This means that:
If AER_CAP_VER = 1 and it is not a Root Port or RC Event Collector, there are 11 DWs (00h to 24h)in the total AER Capability structure.
If AER_CAP_VER = 1 and it is a Root Port or RC Event Collector, there are 14 DWs (00h to 34h)in the total AER Capability structure.
If AER_CAP_VER = 2 then, there are 18 DWs (00h to 44h) in the total AER Capa‐
bility structure.
In fact, there are PCI‐E 3.0 compliant devices that have AER_CAP_VER=1. Example H/W:
A PCI‐E 3.0 device that supports Multiple Header Recording, but does NOT support TLP Prefixes. This device is allowed to have AER_CAP_VER=1, and Multiple_Header_Recording_Capable=1
Therefore, the Teledyne LeCroy software decodes the Multiple_Header_Recording_Capable field regardless of the value of AER_CAP_VER.
6.13.2
Link
Link level decode
is composed of TLP packets matched with a corresponding ACK or NAK coming from the opposite direction.
Summit T3‐8 PCI Express Multi‐Lane Protocol Analyzer User Manual
153
Teledyne LeCroy
6.13.3
Decoding Traffic
Split
Split level decode
is composed of two Link transactions, the Request TLP and the Completion TLP from the other direction.
154
Summit T3‐8 PCI Express Multi‐Lane Protocol Analyzer User Manual
Decoding Traffic
6.13.4
Teledyne LeCroy
NVMe
To decode the NVMe protocol there are two levels available: NVMe Transaction level, which decodes the individual NVMe transactions from the PCI Express protocol and NVMe Command level, which gathers NVMe transactions into a single command. If the top level button is selected, it will decode the NVMe Command level directly.
The NVMe Transaction level option displays NVMe transactions. PCIe Protocol Suite decodes the storage commands starting from lower PCI Express Transaction Layer decodes. In the case of NVMe, it will decode first the Packet Level, then the Link Transaction level, then the Split Transaction Level and finally the NVMe Transaction decode level.
The NVMe Command level option displays NVMe Commands. The NVME commands decode all the lower level decodes first.
Summit T3‐8 PCI Express Multi‐Lane Protocol Analyzer User Manual
155
Teledyne LeCroy
Decoding Traffic
Note: As of software version 7.34, the NVMe decoding will be performed properly even if the ACK DLLPs have been filtered.
Note: As of software version 7.34, once the NVMe decoding has been applied, it will be kept in a separate temporary file not the Trace file (see “Trace File Structure” on page 53). The next time the trace is opened for review there will be no need to re‐decode, making opening of the file in NVMe mode faster.
Note: As of software version 7.36 Beta, the NVMe decoding can handle multiple controller resets within the same recording.
NVMe: Device ID and Model Name Decoded
As of software version 7.34, the Device ID and Device Model Name field is displayed in the decoded command (see Figure 6.14 and Figure 6.15 on page 157).
Figure 6.14: Device ID and Model Number Decoded from NVMe Trace
The trace must contain the device enumeration sequence so the decoding picks up the associated base addresses and NVMe transactions can be properly decoded. If the enumeration sequence is not available the base addresses must be manually entered in the PCIe SSD Configuration dialog from the Tools menu. See Figure 6.15 on page 157.
156
Summit T3‐8 PCI Express Multi‐Lane Protocol Analyzer User Manual
Decoding Traffic
Teledyne LeCroy
Figure 6.15: Device ID and Device Model Name Shown in SSD Configuration Dialog
NVMe: Data Field on Packets
While the data field section displayed for a PCIe packet shows the actual payload for that PCIe packet (as shown below):
The content for this field changes depending on the decode level selected and the particular command decoded.
For example, at the PCIe transaction level, this field still reflects the PCIe payload field involved in the PCIe transaction (as shown below):
At the NVMe transaction level for identify command is shown below:
Summit T3‐8 PCI Express Multi‐Lane Protocol Analyzer User Manual
157
Teledyne LeCroy
Decoding Traffic
The data is shown according to NVMe specification. The portion of data that can be parsed into fields is parsed and drawn in named cells. The portion of data that cannot be parsed (i.e. 'vendor specific' portion is not parsed and is shown as a plain data).
In case you need to see this plain data (not parsed by named fields) the packet data view can be used. (as shown below):
158
Summit T3‐8 PCI Express Multi‐Lane Protocol Analyzer User Manual
Decoding Traffic
Teledyne LeCroy
NVMe: Trusted Computing Group Decode
Trusted Computing Group decodes will be shown using NVMe Command Level if they are present in the trace, as shown in Figure 6.16.
Figure 6.16: NVMe Command with TCG Details
NVMe: Command IOPS and Doorbell Statistical Information
IOPS and Doorbell statistical information can be displayed from an NVMe Trace by selecting an NVMe Packet with a Read or Write Command and viewing the Metrics box. See Figure 6.17 and Figure 6.18 on page 160.
The Doorbell statistics include:
SQdoorbell to CQdoorbell, (time from Submission Doorbell to Completion Doorbell)
SQDoorbell to CQentry, (time from SQ doorbell to command completion)
SQentry to CQentry, (time from submission command to command completion
Summit T3‐8 PCI Express Multi‐Lane Protocol Analyzer User Manual
159
Teledyne LeCroy
Decoding Traffic
Figure 6.17: NVMe Read Command Packet with Metrics Box
Move the cursor over the Metrics box to display the information about the NVMe Command. See Figure 6.18.
Figure 6.18: NVMe Read Command Packet with Metrics Displayed
If you click on the white arrow in the Metrics box, the information about the packet will be displayed in the Trace. See Figure 6.19.
Figure 6.19: NVMe Read Command Packet with Metrics Displayed in Trace
160
Summit T3‐8 PCI Express Multi‐Lane Protocol Analyzer User Manual
Decoding Traffic
Teledyne LeCroy
The IOPS value is defined when you move the cursor over the IOPS box. See Figure 6.20.
Figure 6.20: NVMe READ Command: IOPS Defined
The NMV Command IOPS can be viewed in Bus Utilization mode by selecting the Bus Utilization icon in the toolbar and selecting the Graph areas icon. See Figure 6.21.
Figure 6.21: NVMe READ Command: Bus Utilization -- IOPS
Summit T3‐8 PCI Express Multi‐Lane Protocol Analyzer User Manual
161
Teledyne LeCroy
Decoding Traffic
NVMe Command IOPS is also displayed in the Spreadsheet and Detailed Views. See Figure 6.22.
Figure 6.22: NVMe READ Command: IOPS Statistics
NVMe: Decode for Doorbells
Each type of doorbell's cell of an NVMe command is able to represent 1 of 4 states:
Explicit (NVMe command contain concrete DBL). See Figure 6.23 on page 163.
Implicit (Some doorbells implicitly complete previous commands. Such com‐
mands do not have a doorbell that can be associated one to one. This will be indicated in the trace.)
Missing (NVMe cmd Is Incomplete, and DBL missing) Filtered (DBL is filtered out in Recording rules)
Tooltips:
162
For SQyTDBL: Command was explicitly/implicitly initiated by SQyTDBL in NVMe #number (See Figure 6.23 on page 163)
For CQyHDBL: Command was explicitly/implicitly finished by CQyHDBL in NVMe #number
For Missing Doorbells: Doorbell is missing
For Filtered: Doorbells are filtered out
Summit T3‐8 PCI Express Multi‐Lane Protocol Analyzer User Manual
Decoding Traffic
Teledyne LeCroy
Figure 6.23: NVMe Decoding: Example of Explicit Doorbell in Trace with Tool Tips
Summit T3‐8 PCI Express Multi‐Lane Protocol Analyzer User Manual
163
Teledyne LeCroy
6.13.5
Decoding Traffic
AHCI
AHCI level decode
displays AHCI transactions. PCIe Protocol Suite decodes the storage commands starting from lower Transaction Layer decodes. In the case of AHCI, it will decode first the Packet Level, then the Link Transaction level, then the Split Transaction Level and finally the AHCI decode level.
Note: The trace must contain the device enumeration sequence so the decoding picks up the associated base addresses and AHCI transactions can be properly decoded. If the enumeration sequence is not available the base addresses must be manually entered in the PCIe SSD Configuration dialog from the Tools menu.
164
Summit T3‐8 PCI Express Multi‐Lane Protocol Analyzer User Manual
Decoding Traffic
6.13.6
Teledyne LeCroy
ATA
ATA command level decode
displays ATA command transactions. PCIe Protocol Suite decodes the storage commands starting from lower Transaction Layer decodes. In the case of ATA, it will decode first the Packet Level, then the Link Transaction level, then the Split Transaction Level, then AHCI level and finally the ATA decode level.
Note: The trace must contain the device enumeration sequence so the decoding picks up the associated base addresses and ATA transactions can be properly decoded. If the enumeration sequence is not available the base addresses must be manually entered in the PCIe SSD Configuration dialog from the Tools menu.
ATA IO: Pending Transactions Statistical Report
ATA IO Pending Transactions statistical information can be displayed from an ATA Trace by selecting an ATA Packet and viewing the Metrics box. See Figure 6.24.
Figure 6.24: ATA IO Pending Transactions: Metrics Box
Move the cursor over the Metrics box to display the information about the ATA Packet. See Figure 6.25 on page 166.
Summit T3‐8 PCI Express Multi‐Lane Protocol Analyzer User Manual
165
Teledyne LeCroy
Decoding Traffic
Figure 6.25: ATA IO Pending Transactions: Metrics Box -- Information Displayed
You can click on the small white arrow in the Metrics box to display the information in the Trace. See Figure 6.26.
Figure 6.26: ATA IO Pending Transactions: Metrics Displayed in Trace
You can also view the ATA IO Pending Transactions by selecting the Bus Utilization icon in the toolbar and selecting the Graph Areas icon. See Figure 6.27 on page 167.
166
Summit T3‐8 PCI Express Multi‐Lane Protocol Analyzer User Manual
Decoding Traffic
Teledyne LeCroy
Figure 6.27: ATA IO Pending Transactions: Bus Utilization View
6.13.7
PQI
PQI level decode
displays PQI transactions. PCIe Protocol Suite decodes the storage commands starting from lower Transaction Layer decodes. In the case of PQI, it will decode first the Packet Level, then the Link Transaction level, then the Split Transaction Level and finally the PQI decode level.
Summit T3‐8 PCI Express Multi‐Lane Protocol Analyzer User Manual
167
Teledyne LeCroy
6.13.8
Decoding Traffic
SOP
SOP level decode
displays SOP transactions. PCIe Protocol Suite decodes the storage commands starting from lower Transaction Layer decodes. In the case of SOP, it will decode first the Packet Level, then the Link Transaction level, then the Split Transaction Level, then PQI level and finally the SOP decode level. Note: The trace must contain the device enumeration sequence so the decoding picks up the associated base addresses and SOP transactions can be properly decoded. If the enumeration sequence is not available the base addresses must be manually entered in the PCIe SSD Configuration dialog from the Tools menu.
6.13.9
SCSI
SCSI level decode
displays SCSI transactions. PCIe Protocol Suite decodes the storage commands starting from lower Transaction Layer decodes. In the case of SCSI, it will decode first the Packet Level, then the Link Transaction level, then the Split Transaction Level, then PQI level and finally the SCSI decode level. Note: The trace must contain the device enumeration sequence so the decoding picks up the associated base addresses and SCSI transactions can be properly decoded. If the enumeration sequence is not available, the base addresses must be manually entered in the PCIe SSD Configuration dialog from the Tools menu.
168
Summit T3‐8 PCI Express Multi‐Lane Protocol Analyzer User Manual
Chapter 7
Searching CATC Traces
This chapter describes how to search for CATC Trace events.
7.1
CATC Trace Search Overview
Several search commands let you navigate a CATC Trace view to search for key events, such as errors and triggers. To view the search options, click Search in the Menu bar.
Figure 7.1: Search Menu Options
7.2
Go to Trigger
To position a trigger packet at the top of the screen:
Select Search > Go to Trigger.
7.3
Go to Selected Packet
To position a selected packet at the top of the screen:
Select the packet and Select Search > Go to Selected Packet.
7.4
Go to Packet
To position a transaction at the top of the screen:
Summit T3‐8 PCI Express Multi‐Lane Protocol Analyzer User Manual
169
Teledyne LeCroy
Go to Time
1. Select Go to Packet from the Search menu. A pop‐up menu prompts you for the packet number, marker, or time. 2. Choose the needed transaction level from the Packet drop‐down list and enter the transaction number. Please note that transaction levels is added to list if corresponding level is decoded for current trace file.
3. Click OK.
7.5
Go to Time
To position a specific time at the top of the screen:
1. Select Go to Time from the Search menu. A pop‐up menu prompts you for the time in Seconds or Clocks.
2. Enter the time and format (seconds or clocks).
3. Click Go.
7.6
Go To Marker
Use this operation to go directly to a specific packet or transaction that has been marked with a unique marker by the Set Marker operation. To go to a marker: 1. Select Go To Marker from the Search Menu.
2. Select the marker you want from the fly‐out menu.
Alternatively, select All Markers to display the All Markers and Playlists dialog, then select a marker and click OK (see following figure).
170
Summit T3‐8 PCI Express Multi‐Lane Protocol Analyzer User Manual
Go To Marker
Teledyne LeCroy
Deletes selected Marker
The packet you want appears at the top of the screen. Marked packets have a red bar on the left edge.
7.6.1
Markers
This section explains the features of Markers. A marker is an entity that flags a physical or logical item of interest within a trace file. A marker contains one or more attachments. You can add a marker to a trace file or unmark a trace file by removing the marker.
Markers are represented graphically in a different way in the application.You can not only add markers to the packets but it is granular enabling you to also add markers to individual cells.
Markers Overview
This functionality provides the user an easy way to navigate through attachments which is a discrete piece of information or data added to a marker, for example, a text description or file, an attachment of a trace file by a predefined order, video or audio files, URL links or any other files. Functionality of Markers
The markers functionality allows you to add markers to:
Whole packets or frames
Specific Cells Specific values within a cell: Bytes, words, etc.
You can add attachments to markers.
Summit T3‐8 PCI Express Multi‐Lane Protocol Analyzer User Manual
171
Teledyne LeCroy
Go To Marker
Right‐click on any cell of a packet and select Set Marker from the menu as shown below.
The Create Marker dialog displays (see Figure 7.2 on page 173).
Set New Marker
Markers are useful to identify specific points in the data. By default markers follow a numbering convention but can be renamed. Markers can also be inserted by using the keyboard (see Figure 7.2 on page 173):
Hover your mouse pointer over a packet and press Ctrl+K to insert a marker for that packet.
Click a packet to select it and press Ctrl+L to insert a marker for that packet.
172
Summit T3‐8 PCI Express Multi‐Lane Protocol Analyzer User Manual
Go To Marker
Teledyne LeCroy
Adding a new line
Figure 7.2: Create Marker for Packet Dialog
Click Enter to close the Marker dialog.
Click ALT > Enter to add a new line.
As shown above you can:
Add icon. Click on this icon to add any file. See “Adding an Attachment” on page 174.
Record icon. Click on this icon to record audio. See “Recording an Audio File” on page 175.
New URL icon. Click on this icon to add any URL.
Summit T3‐8 PCI Express Multi‐Lane Protocol Analyzer User Manual
Export icon. Click on this icon to export an attachment.
Delete icon. Click on this icon to delete an attachment
173
Teledyne LeCroy
7.6.2
Go To Marker
Attaching Markers
You can attach a discrete piece of information/data to a marker, for example, a text description or file, an attachment of a trace file by a predefined order, video or audio files, URL links or any other files. You can also remove an attachment from a Marker.
7.6.3
Adding an Attachment
Perform the following steps to add an attachment to a marker:
1. Right‐click on any cell in the trace and select Set Marker.
The Create Marker window displays (see Figure 7.3 on page 174).
2. Click on the Add icon.
The Add File to the Marker dialog displays.
3. Go to the file and select it to add it to the marker as an attachment.
4. Click Open.
The file will appear in the Create Marker for Transfer... dialog as shown below. The Marker # appears in the top panel, the icons are displayed in the second panel and you can click on the icon on the third panel to view the file you are about to attach.
5. Click OK to add the attachments.
Figure 7.3: Create Marker for Packet Dialog
174
Summit T3‐8 PCI Express Multi‐Lane Protocol Analyzer User Manual
Go To Marker
7.6.4
Teledyne LeCroy
Recording an Audio File
The audio quality supports voice attachment and is not designed for high‐quality audio Playback of audio content is not limited and depends on the formats supported by the installed playback engine.
Click the record icon and speak into the microphone to record an audio file.
Note: This functionality is disabled if a microphone is not installed.
7.6.5
Video Files Supported
The user can attach video clips to the trace file (“add to the marker”). The playback of the Video clips is limited to the formats that are supported by the video codecs installed in the system. 7.6.6
Attachment Types and Visualization
The markers are represented graphically by a yellow triangle at the top right of the marked item and a red vertical bar at the left‐most cell of a packet as shown below. Marked Cell
A marker may comprise any number of attachments of any types.
7.6.7
Embedded Attachments to a Marker
Embedded files are attached to the item marked and transported with the trace. You can embed the following types of files to a marker:
Audio Files
Video Files
Image Files
YouTube Files
Web Pages
Text Attachments
Other Attachments
Attachments are embedded in the marker and saved in the trace file. Once attachments are placed in a marker, the marker can then be presented to a user in a story structured form. On opening the marker the window resembles the marker editing dialog.
Note: The use of Audio and Video markers is limited to the file types supported on a user’s system. CATC Walk has been tested with .mp3 and .wmv files, which are supported by Windows as installed. If additional codecs are installed, they should also work, but it is the user’s responsibility to choose formats that will work for whomever they intend to exchange CATC Summit T3‐8 PCI Express Multi‐Lane Protocol Analyzer User Manual
175
Teledyne LeCroy
Go To Marker
trace files (no different than email attachments in this regard). Because of this dependency on installed codecs, there are situations where bugs in the codecs supplied by Microsoft or third‐
party applications can prevent proper operation of the Teledyne LeCroy PCIe Protocol Suite application. See the Teledyne LeCroy PCIe Protocol Suite Application Read‐Me file for more information if you have problems with application crashes, etc.
7.6.8
Viewing Attachments of a Marker
If you hover over the marked cell (yellow triangle at the top right of the marked item), refer to “Attachment Types and Visualization” on page 175, a window pops up displaying the contents of the marked cell. While hovering over the marked cell, it can start playing the start of the audio or video file, but it will stop after a short time due to the Analyzer's host system timeout for Tooltips. You must click on it to open the audio or video attachment for further listening or viewing.
To view an attachment you can click on any of the icons in the attachment bar and or you can double‐click on the icon itself to open the attachment. Figure 7.4: Pop-up Displaying Marker Contents
Text
The text attachment is displayed in the icon bar and in the main pop‐up window. Text attachments are always shown at the top. The attachment file name is displayed in the field as shown below (see Figure 7.5 on page 177).
176
Summit T3‐8 PCI Express Multi‐Lane Protocol Analyzer User Manual
Go To Marker
Teledyne LeCroy
Figure 7.5: Text Attachment Pop-up Window
If there is no attachment, No Attachments displays in the status bar at the bottom.
Figure 7.6: No Attachments Pop-up Window
If there are attachments, the status bar is hidden. You can move the cursor to an attachment icon in the list view and a preview of the attachment starts (see Figure 7.7 on page 177).
Figure 7.7: Preview Attachments Pop-up Window
Summit T3‐8 PCI Express Multi‐Lane Protocol Analyzer User Manual
177
Teledyne LeCroy
Go To Marker
Audio
Audio snippets that are recorded and attached to certain point of interest in a trace can be played. The basic Play, Start, Stop, Pause buttons are displayed to listen to the audio file.
Video
Video clips that are recorded and attached to certain point of interest in a trace can be played. The video is embedded in the tooltip with simple playback controls.
File Attachment
You can attach any kind of file, including images, PDFs, documents, media files, etc. 178
Summit T3‐8 PCI Express Multi‐Lane Protocol Analyzer User Manual
Go To Marker
Teledyne LeCroy
URL Link
You can specify a URL that links to a web page (i.e., YouTube), a network location, or a local file‐system location.
Web Link
Due to the small size, the web page is not embedded in the callout. You can use the Open button to open the web link in the default web browser.
YouTube Video
YouTube’s video player is embedded for YouTube Video playback.
Summit T3‐8 PCI Express Multi‐Lane Protocol Analyzer User Manual
179
Teledyne LeCroy
Go To Marker
Images
The image is embedded in the trace.
Other Attachments
Click the Open button to open the attachment file with the system’s default application for that file type. 7.6.9
Edit Marker
To edit a marker, right‐click on the marked item and select Edit marker from the menu or click Ctrl + L. The Edit Marker dialog displays (see Figure 7.8 on page 181). This Edit Marker window can be used to edit one marker at a time.
You can do the following in the Edit Marker dialog:
180
Edit text attachment.
Record audio attachment.
Add URL link attachment
Add a file attachment. Click on File and click the Open button or drag and drop the file.
Preview audio/video/image/URL/YouTube attachment or open other files with system default application.
Save an attachment to a file. Remove attachment.
Summit T3‐8 PCI Express Multi‐Lane Protocol Analyzer User Manual
Go To Marker
Teledyne LeCroy
Figure 7.8: Edit Marker for Packet Dialog
7.6.10
All Markers Window
Select Search > Go to Marker > All Markers or press Ctrl + M to display a list of all the markers in the file. The window uses a tree structure to show packets, fields and markers. The features of the Markers window are (see Figure 7.9 on page 182):
All Markers are displayed.
All attachments within the marker are displayed. Hovering over the marker dis‐
plays a tool‐tip displaying the size of all the attachments.
You can collapse or expand the item marked to view the attachments.
The Time and size of audio and video files are displayed.
You can edit Playlists from this window.
You can edit, delete a marker or delete all markers from this location.
You can filter attachments within the marker.
You can select a range of markers by clicking Shift and selecting a range.
You can select multiple markers by clicking Ctrl and selecting individual markers.
Double‐click on a marker to go to that marker in the trace and close the dialog.
Summit T3‐8 PCI Express Multi‐Lane Protocol Analyzer User Manual
181
Teledyne LeCroy
Go To Marker
Figure 7.9: All Markers and Playlists Dialog
You can filter to show or hide text, image, audio, video, URL, YouTube videos and other files.
Figure 7.10: Filter Dialog
Clicking delete on markers to delete markers with attachments displays the Delete Marker(s) dialog (see Figure 7.11 on page 183). Checking the “Don’t ask again” checkbox will not display this confirmation dialog again.
182
Summit T3‐8 PCI Express Multi‐Lane Protocol Analyzer User Manual
CATC Walk Playlist
Teledyne LeCroy
Figure 7.11: Confirmation Dialog
7.7
CATC Walk Playlist
This feature allows users to configure sequences of attachments into playlists. Any arbitrary order of attachments are allowed, and there are no limits on the number of playlists supported. This feature can be used for collaborating among developers as well for training, support and marketing purposes.
To access a playlist click on the View menu in the top toolbar of application, select CATC Walk and then select Manage Playlists.
Figure 7.12: Edit CATC Walk Playlists Dialog
7.7.1
Playlist Functionality
You can do the following to manage playlists:
Remove or edit current playlists Edit the playlist name
Summit T3‐8 PCI Express Multi‐Lane Protocol Analyzer User Manual
183
Teledyne LeCroy
CATC Walk Playlist
Edit the playlist description
List the sequence of attachments in current playlist
List of all available attachments and drag/drop to a playlist.
As shown in the previous figure the Playlist window lists the markers with their attachments on the left and the playlist on the right.
Figure 7.13: Edit CATC Walk Playlists Dialog
You can drag and drop and item or attachment from the Marker panel into the Playlist panel and build a story. Give a description of the playlist in the Description field and you can give a name to the playlist in the Name field.
You can add a new playlist by clicking on the green plus sign (+) on the right top corner of the Playlist panel, or delete a playlist by clicking the red (x) button.
If you have more than one playlist saved click on the Name drop‐down arrow to select it. The drop‐down menu lists all the available playlists
7.7.2
Playback Window
To playback a playlist, click on the View menu in the top toolbar of application, select CATC Walk and then select Play > Playlist 1 (see Figure 7.14 on page 185).
184
Summit T3‐8 PCI Express Multi‐Lane Protocol Analyzer User Manual
CATC Walk Playlist
Teledyne LeCroy
Figure 7.14: View Dialog
The attachment item starts to play in the Playback window as shown below.
Figure 7.15: Playback Window
The playback window is resizable. The close button at the top right corner and the size grip for resizing at the bottom right corner will hide automatically when moving the cursor out of the window.
Users can provide commentary to a captured trace, converting it into a script or a story and can transfer this meta‐information to others. Playlist Playback Controls.
Playlist Playback Controls
The playlist playback control buttons are:
Play/Pause
Stop
Jump to Next attachment
Jump to Previous attachment Seek slider for seeking to positions in media streams
Volume slider
Playback speed slider (for text attachments)
Summit T3‐8 PCI Express Multi‐Lane Protocol Analyzer User Manual
185
Teledyne LeCroy
Go To SCSI Menu
As a playlist is played back, the playback window is displayed in close proximity to the marked area, just like a regular tooltip window.
As the playback progresses, the view jumps to the element corresponding to the current attachment being played and the marked element is highlighted. During playback the user is prevented from interacting with the trace. To reinforce this restriction, the trace view is grayed‐out visually, and only the packet with the item corresponding to the current attachment is colorized.
Figure 7.16: Playlist Playback View
7.8
Go To SCSI Menu
The Go To SCSI menu in the Search menu provides a quick way to search for a packet based on a SCSI commands and sub‐commands. You can search for the following types of events:
7.9
SCSI Operation
Command Status
Task Management
Task Management Response
Error
SCSI Logical Unit Number
Go To Menu
The Go To menu in the Search menu provides a quick way to search for a packet based on a simple condition. You can search for the following types of events:
186
TLP Type
DLLP Type
Ordered Set
Link Event
OBFF Message
Traffic Class
Summit T3‐8 PCI Express Multi‐Lane Protocol Analyzer User Manual
Search Direction
Teledyne LeCroy
7.10
DLLP Virtual Channel
TLP Virtual Channel
Direction
Speed
Link Width
Requester ID
Completer ID
Data Lengths
Errors
Search Direction
Search direction can be toggled back and forth by using the command under the Search menu. Search Direction controls the direction of the search. Each time Search Direction is selected, the search order is reversed. For example, if the previous search was forward, choosing Search Direction toggles the current search to backward.
To verify the direction of a search look at the lower right corner of the screen. Search: Bwd or Search: Fwd should appear. If a direction is not indicated, it means that the status bar is turned off. To turn on the Status bar, select from the menu View > Status Bar. Keyboard shortcuts can also be used to control search direction:
7.11
Alt‐f means Search Forward.
Alt‐b means Search Backward.
Find
Find allows you to conduct complex searches in a CATC Trace. You can search by protocol level (Packets, Link Transactions, Split Transactions).
You can search packets by Event Group: TLP Type, TLP Header, TLP Prefix, TLP Requester ID, TLP Completer ID, TLP Data Pattern, TLP Data Lengths, TLP Tag, TLP Sequence Number, DLLP Type, DLLP Header, DLLP Virtual Channel, ACK/
NAK Seq Number, Ordered Sets, Link Event, OBFF Code, Direction, Errors, TS1 Data, TS2 Data. You can search link transactions by Event Group: TLP Type, Traffic Class, Virtual Channel, Direction, Requester ID, Completer ID, Status, Tag. You can search split transactions by Event Group: TLP Type, Traffic Class, Virtual Channel, Direction, Requester ID, Completer ID, Status, Tag, Address. You can search NVMe transactions by the following Event Groups: Controller Registers, Queue IDs, Command IDs, Doorbell Registers, Admin Submission Command Set, NVMe Submission Command Set, Completion Queue Entry, and PRP.
You can search PQI transactions by Event Group: TLP Type, Traffic Class, Virtual Channel, Direction, Requester ID, Completer ID, Status, Tag, Address. Summit T3‐8 PCI Express Multi‐Lane Protocol Analyzer User Manual
187
Teledyne LeCroy
Find
You can search AHCI transactions by Event Group: AHCI Register ID, AHCI Port Number, AHCI Slot Number, AHCI Port Multiplier Port, AHCI Raw Address AHCI Direction and, AHCI Errors.
You can search ATA transactions by Event Group: ATA Register Type, ATA Port Number, ATA Slot Number, ATA Raw Address, ATA port Multiplier Port, ATA Interruption Reason, ATA Error Type ATA Input/Output, ATA Payload Portion, ATA CFIS Fields, ATA RFIS Device to Host Fields, ATA DSFIS Fields, ATA PSFIS Fields, ATA SDBFIS Fields.
You can search SOP transactions by Event Group: SOP Information Unit ID, SOP Errors.
You can search SCSI transactions by Event Group: SCSI Operation, Command Status, Task Management, Task Management Response, Errors, SCSI Logical Unit Numbers.
The options Union, Intersection, and Exclusion allow you to create complex searches such as “Find x OR y” or “Exclude all x or y.” To find an item:
1. Open a CATC Trace.
2. Open Find dialog by selecting Search > Find from the menu or clicking
Figure 7.17 on page 188).
(see Figure 7.17: Find Dialog
188
Summit T3‐8 PCI Express Multi‐Lane Protocol Analyzer User Manual
Find
Teledyne LeCroy
3. From the Search For menu, select a display level such as Packets. To search multiple levels, finish steps 3 to 9, and then repeat 3 to 9 for each additional display level.
4. From the Event Groups menu, select an Event Group. The menu in the far right of the dialog is context sensitive and changes to reflect the options for that group.
5. In the menu in the far right, select one or more items.
6. Repeat Step 5 for each Event Group of interest for the selected display level.
7. Under Scope, select Current Segment or All Segments to reduce the scope of the search. This applies to old segmented traces, for newer traces leave this option in Current Segment.
8. Under Direction, select Forward or Backward to select a search direction.
9. Under Origin, select a starting point for the search.
10. Under Combining Specified Event Groups, select an option.
Figure 7.18: Combining Specified Event Groups
The options Union, Intersection, and Exclusion let you set conditions on your searches:
Union: To search for any of the selected criteria. Example: “Find packets with ANY of the following characteristics …”
Intersection: To search for all of the selected criteria. Example: “Find packets with ALL of the following characteristics …”
Exclude: To exclude items from a search. This option works in conjunction with Union and Intersection. You select Union and Exclude to exclude any of the spec‐
ified traffic. You select Intersection and Exclude to exclude all of the specified traffic. Example: “Exclude packets with ANY of the following …” or “Exclude packets with ALL of the following …” Repeat Steps 3 through 9 for additional display levels.
Find All displays all matching packets or transactions in a separate view.
Search in Hidden includes hidden packets or transactions in the search.
Click OK.
1.
2.
3.
4.
7.11.1
Event Groups
The Event Groups for Packets are:
Summit T3‐8 PCI Express Multi‐Lane Protocol Analyzer User Manual
189
Teledyne LeCroy
Find
TLP Type
TLP Header
TLP Prefix
TLP Requester ID
TLP Completer ID
TLP Data Pattern
TLP Data Lengths
TLP Traffic Class
TLP Tag
TLP Sequence Number
DLLP Type
DLLP Header
DLLP Virtual Channel
ACK/NAK Seq Number
Ordered Sets
Link Event
OBFF Code
Direction
Errors
TS1 Data (see “TS1 and TS2 Event Groups” on page 193)
TS2 Data (see “TS1 and TS2 Event Groups” on page 193)
Message Code
The Event Groups for Link Transactions are:
TLP Type
Traffic Class
Virtual Channel
Direction
RequesterID
CompleterID
Status
Tag
The Event Groups for Split Transactions are:
190
TLP Type
Traffic Class
Virtual Channel
Direction
Requester ID
Completer ID
Status
Tag
Address
Summit T3‐8 PCI Express Multi‐Lane Protocol Analyzer User Manual
Find
Teledyne LeCroy
The Event Groups for NVMe transactions are:
Controller Registers
Other NVMe Entities
Queue IDs
Command IDs
Doorbell Registers
Admin Submission Command Set
NVMe Submission Command Set
Completion Queue Entry
PRP
Submission Command
NVMe Errors
The Event Groups for PQI Transactions are:
PQI Register ID
PQI Admin Functions
PQI Errors
The Event Groups for AHCI Transactions are:
AHCI Register ID
AHCI Port Number
AHCI Slot Number
AHCI Port Multiplier Port
AHCI Raw Address
AHCI Direction
AHCI Errors
The Event Groups for ATA transactions are:
ATA Register Type
ATA Port Number
ATA Slot Number
ATA Raw Address
ATA Port Multiplier Port
ATA Interruption Reason
ATA Error Type ATA Input/Output
ATA Payload Portion
ATA CFIS Fields
ATA RFIS Device to Host Fields
ATA DSFIS Fields
ATA PSFIS Fields
ATA SDBFIS Fields
Summit T3‐8 PCI Express Multi‐Lane Protocol Analyzer User Manual
191
Teledyne LeCroy
Find
The Event Groups for SOP transactions are:
SOP Information Unit ID SOP Errors
The Event Groups for SCSI transactions are:
SCSI Commands
Command Status
Task Management
Task Management Response
Errors
SCSI Logical Unit Numbers
The Event Groups for NVMe Commands are:
192
Admin Command Set
NMVE Command Set
Submission QID
Completion QID
Status
Errors
TCG Types
TCG Method
TCG Invoker
TCG Com ID
TCG Ext Com ID
Summit T3‐8 PCI Express Multi‐Lane Protocol Analyzer User Manual
Find
Teledyne LeCroy
TS1 and TS2 Event Groups
Selecting TS1 Data or TS2 Data options allows further definition of the exact field contents to match via the three dialogs show below. The search algorithm will find the specified TS ordered set on any lane. Figure 7.19: TS Data Fields Tab
Select parameters from the drop‐down lists to use.
Figure 7.20: TS G1/G2 Layout Tab
Select parameters from the links to use and enter the mask and match values.
Summit T3‐8 PCI Express Multi‐Lane Protocol Analyzer User Manual
193
Teledyne LeCroy
Search for the Next Packet Type
Figure 7.21: TS G3 Layout Tab
Select parameters from the links to use and enter the mask and match values.
7.12
Search for the Next Packet Type
Use Find Next or click 194
to search for the next packet meeting the search criteria. Summit T3‐8 PCI Express Multi‐Lane Protocol Analyzer User Manual
Quick Search Feature
7.13
Teledyne LeCroy
Quick Search Feature
As an example, the NVMe_Z3DriveEmulation Trace has been loaded from the C:\Users\Public\Documents\LeCroy\PCIe Protocol Suite\Sample Files (see Figure 7.22).
Figure 7.22: Location of Trace File to be Loaded
Select the NVMe_Z3DriveEmulation.pex file and click on Open.
The Main Menu will look like Figure 7.23 after you chosen to look for NVMe commands and removed unrelated traffic.
Figure 7.23: Main Menu with NVMe_Z3DriveEmulation Trace Loaded
Summit T3‐8 PCI Express Multi‐Lane Protocol Analyzer User Manual
195
Teledyne LeCroy
Quick Search Feature
Enter a term to search for in the Search Window. In this case, we chose “NVM #66 . Place the cursor inside the Search Window and click the Enter key. The results are shown below (see Figure 7.24).
Figure 7.24: Search for NVM #66
Once the packet in the Trace has been found, the NVM #66 can be seen to be part of a doorbell event (Explicit SQyTDBL: NVM #62 with the response of Explicit CQyHDBL NVM #66).
This was just an example, you can search for any of the pre‐defined terms (Figure 4.11 on page 40) or chose your own term or event to search for.
If you started Searching in the middle of the Trace the following windows will pop up:
Figure 7.25: Search Progress WIndow
Figure 7.26: Resume Searching From Beginning of Trace
196
Summit T3‐8 PCI Express Multi‐Lane Protocol Analyzer User Manual
Quick Search Feature
Teledyne LeCroy
If you select Yes, the tool will continue searching from the start of the Trace, then the following window will pop up:
Figure 7.27: Finished Searching Trace
If the tool hasn’t moved to a new Packet, the term being Searched for was not found.
Summit T3‐8 PCI Express Multi‐Lane Protocol Analyzer User Manual
197
Teledyne LeCroy
198
Quick Search Feature
Summit T3‐8 PCI Express Multi‐Lane Protocol Analyzer User Manual
Chapter 8
Display Options
8.1
Setting Display Options
Display Options allow you to customize the colors and formats of displayed traffic. To open the Display Options dialog at the General tab, Select Setup > Display Options from the menu or click the Display Options button
on the toolbar.
Figure 8.1: Display Options Dialog - General Tab
Summit T3‐8 PCI Express Multi‐Lane Protocol Analyzer User Manual
199
Teledyne LeCroy
8.2
Specifying General Display Options
Specifying General Display Options
The Display Options General tab allows you to specify:
Zoom Level: Defines the size of packet fields in the packet view. Zoom level is adjustable as 10, 20, 40, 60, 80, 100, 120, 140, 160, 180 and 200 percent.
Enable Tool tips: Allows information to be displayed on a packet by resting your mouse pointer over it.
Wrap: Allows packets, Link Transactions, and Split Transactions to wrap within the display.
Hierarchy Lines: Adds lines to the trace view indicating relations between packets, Link Transactions, and Split Transactions.
Timestamp position: Moves timestamp location from end of packet to beginning of packet, or merges it with the packet number.
Retain Decoded Files: Decoded Files are retained in Temp folders, which makes re‐
loading the trace much faster.
Empty Trace File Warning: If you’ve chosen recording conditions which result in an empty trace (no traffic is recorded), a warning message is displayed.
Protocol Level to View: Allows the CATC Trace to be displayed in different hierarchical levels: Packets, Link Transactions, Split Transactions NVMe, PQI, AHCI and ATA command transactions.
Time Stamp: Gives you options for setting the timestamp to zero for either the first CATC Trace packet or the trigger packet or for leaving the stamp unchanged as it was originally recorded.
Trace View Mode: Displays Normal CATC Trace View, Compressed CATC View, Spreadsheet View (Color), and Spreadsheet View (B/W).
8.2.1
Collapsing Data Fields
This affects the "Data" field in the TLP packets when using the collapse feature (see Figure 8.2 on page 201).
0 in the collapsed field means no data will be shown. 128 in the expanded field means 128 DWords will be shown when the data field is expanded.
200
Summit T3‐8 PCI Express Multi‐Lane Protocol Analyzer User Manual
Specifying General Display Options
Teledyne LeCroy
Figure 8.2: Expanded Data Field
8.2.2
Fonts
Fonts: Allows the appearance of field text and/or data text to be defined.
8.2.3
Configuration Name
Display Configuration Name: This field is used to enter a text string to be associated with the current set of Display Options. This name is saved with the Display Options file, and appears as part of the title of the packet view window that uses this set of Display Options.
8.2.4
Color, Format, and Hiding Options
The Color/Format/Hiding tab allows you to customize the colors and formats associated with each field in the CATC Trace and to selectively hide fields or packets. You access these display options by selecting Setup > Display Options > Color/Format/Hiding tab. The Color/Format/Hiding property page lets you set how fields display in a CATC Trace. This property page lets you set field color and data format (binary, hex, decimal, ASCII), and lets you hide selected fields from the display (see Figure 8.3 on page 202).
Summit T3‐8 PCI Express Multi‐Lane Protocol Analyzer User Manual
201
Teledyne LeCroy
Specifying General Display Options
Figure 8.3: Display Options Dialog - Color/Format/Hiding Tab
8.2.5
Setting Field Colors
The Field Colors tab allows you to customize the colors associated with each field used in the packet view. You may experiment with this option to achieve a color combination that suits you. Select or change the trigger color using the color buttons labeled ‐ Packet # and + Packet # (before and after trigger) found under the Packet# section of the Field Colors window. You select or change a color by clicking the appropriate color button. This action causes a color palette to pop up. Select the desired color and press OK.
1. Click View > Set Display Options to open the Display Options dialog.
2. Select the Color/Format/Hiding property page (see Figure 8.4 on page 203).
3. Under the Group and Colors column, click the plus symbol (+) next to the group you want to reformat. The group expands to show the individual fields within the group. Each field has a color, as shown below.
202
Summit T3‐8 PCI Express Multi‐Lane Protocol Analyzer User Manual
Specifying General Display Options
Teledyne LeCroy
4. Click the colored cell that you want to change. A color palette appears.
5. Click a color in the palette, then click Apply or OK. Note: The colors of the following Frame types cannot be changed:
Invalid Data (frame error) field (red)
Softbit Errors (yellow)
You can also change color by left‐clicking a field in the CATC Trace and selecting Color from the pop‐up menu.
Figure 8.4: Display Options Dialog Color/Format/Hiding Tab
Summit T3‐8 PCI Express Multi‐Lane Protocol Analyzer User Manual
203
Teledyne LeCroy
8.2.6
Specifying General Display Options
Changing Field Formats
The Field Formats tab allows you to define the way various numeric fields are shown in the packet display. You can select Hexadecimal, Decimal, Binary, or ASCII for certain fields or groups of fields. To change a field's format, click the plus sign (+) next to a field in the list. This causes the selected item to expand so you can see its constituent sub‐fields. Select a sub‐field, and then choose the format from the formatting choices that appear at the bottom of the window.
Figure 8.5: Display Options Dialog Color/Format/Hiding Tab
To change the format of alphanumeric characters in a field: 1. Under the Group and Colors column, click the plus symbol (+) next to the group you want to reformat. The group expands to show the individual fields within the group (as shown above).
204
Summit T3‐8 PCI Express Multi‐Lane Protocol Analyzer User Manual
Specifying General Display Options
Teledyne LeCroy
2. Click the row representing the field that you want to reformat. If the field can be reformatted, the format options at the top of the dialog become active, as shown below:
3. Select a format.
4. Specify the bit order in the displayed fields by checking/unchecking the MSB > LSB checkboxes.
5. Click Apply or OK. 8.2.7
Hiding Fields
To hide a field:
1. Under the Group and Colors column, click the plus symbol (+) next to the group that has the field(s) you want to hide. The group expands to show the individual fields within the group (as shown above).
2. Click the checkbox in the row representing the field that you want to hide.
3. Click Apply or OK.
8.2.8
Hiding Levels
The Level Hiding page lets you hide traffic by Event Group. If you select one or more event types from the Event Group list, the selected types are hidden from the CATC Trace (see Figure 8.6 on page 206).
Summit T3‐8 PCI Express Multi‐Lane Protocol Analyzer User Manual
205
Teledyne LeCroy
Specifying General Display Options
Figure 8.6: Display Options Dialog - Level Hiding Tab
To hide a level:
1.
2.
3.
4.
5.
Select an Event Group.
Select whether to Hide or Show selected items.
Select Upstream, Downstream, or Any Direction.
(Optional) Select Compact EIEOS packets.
Click OK.
The Event Groups for Packets are:
206
TLP Type
TLP Header
TLP Requester ID
TLP Completer ID
TLP Data Pattern
TLP Data Lengths
TLP Traffic Class
TLP Tag
TLP Sequence Number
Summit T3‐8 PCI Express Multi‐Lane Protocol Analyzer User Manual
Specifying General Display Options
Teledyne LeCroy
DLLP Type
DLLP Header
DLLP Virtual Channel
ACK/NAK Seq Number
Ordered Sets
Link Event
Direction
Errors
TS1 Data
TS2 Data The Event Groups for Link Transactions, and PQI Transactions are:
TLP Type
Traffic Class
Virtual Channel
Direction
RequesterID
CompleterID
Status
Tag
The Event Groups for Split Transactions are:
TLP Type
Traffic Class
Virtual Channel
Direction
RequesterID
CompleterID
Status
Tag
Address
The Event Groups for NVMe transactions are:
Controller Registers
Other NVMe Entities
Queue IDs
Command IDs
Doorbell Registers
Admin Submission Command Set
NVMe Submission Command Set
Completion Queue Entry
PRP
Submission Command
NVMe Errors
The Event Groups for PQI Transactions are:
PQI Register ID
Summit T3‐8 PCI Express Multi‐Lane Protocol Analyzer User Manual
207
Teledyne LeCroy
Specifying General Display Options
PQI Admin Functions
PQI Errors
The Event Groups for AHCI Transactions are:
AHCI Register ID
AHCI Port Number
AHCI Slot Number
AHCI Port Multiplier Port
AHCI Raw Address
AHCI Direction
AHCI Errors
The Event Groups for ATA transactions are:
ATA Register Type
ATA Port Number
ATA Slot Number
ATA Raw Address
ATA Port Multiplier Port
ATA Interruption Reason
ATA Error Type ATA Input/Output
ATA Payload Portion
ATA CFIS Fields
ATA RFIS Device to Host Fields
ATA DSFIS Fields
ATA PSFIS Fields
ATA SDBFIS Fields
The Event Groups for SOP transactions are:
SOP Information Unit ID
SOP Errors
The Event Groups for SCSI transactions are:
SCSI Operation
Command Status
Task Management
Task Management Response
Errors
SCSI Logical Unit Numbers
The Event Groups for NVMe Commands are:
208
Admin Command Set
NVME Command Set
Submission QID
Completion QID
Status
Errors
Summit T3‐8 PCI Express Multi‐Lane Protocol Analyzer User Manual
Load a Previously Saved Display Options File
8.3
Teledyne LeCroy
TCG Types
TCG Method
TCG Invoker
TCG Com ID
TCG Ext Com ID
Load a Previously Saved Display Options File
If you have previously saved Display Options, you can load them by opening the Display Options dialog and clicking the Load button. A dialog opens to let you load a previously saved display options file.
1. Click Load to use a previously defined display options file.
2. When you see the Open File pop‐up window, enter the name of the file you want to load and click Open. 3. When the PCIe Protocol Suite™ software returns you to the Recording Options menu, click OK to activate the display options you selected.
Summit T3‐8 PCI Express Multi‐Lane Protocol Analyzer User Manual
209
Teledyne LeCroy
8.4
Saving Display Options
Saving Display Options
If you have customized the Display Options and wish to save them, you can do so by clicking the Save button, then entering a unique file name. The .opt extension is added by default.
Setting the Defaults: Save the currently specified Display Options to the file name: default.opt by clicking Save As Default. When the Analyzer software begins execution, it automatically loads the default.opt file, if one exists.
210
Summit T3‐8 PCI Express Multi‐Lane Protocol Analyzer User Manual
Chapter 9
BitTracer Recording
Note: BitTracer Recording is an optional feature.
The Summit T3‐8 analyzer has an optional BitTracer data capture mode, which captures bi‐directional link traffic in raw format. The BitTracer recording mode captures and displays traffic before lane‐to‐lane de‐skew operations and before descrambling of 10b bytes. The BitTracer mode includes support for multiple logical links (bifurcations) on a single physical link.
The BitTracer recording mode has its own user interface, which provides characterizations of link traffic that are not available in the standard protocol analyzer mode.
You can export BitTracer recordings for viewing in CATC Trace format.
Note: This feature can be included at initial purchase or added in the field with a software upgrade license. To obtain a software license key to add this feature, contact Teledyne LeCroy.
Lane Deskew Bypass in Recording Options prevents lanes from being bonded by the analyzer, allowing you to troubleshoot problems with physical layer.
9.1
Enabling BitTracer Recording
To enable the BitTracer recording mode, open the Recording Options. In the Target Analyzer section of the General tab, select Summit T3‐8.
Figure 9.1: Recording Options Dialog
In the Recording Mode section, select Bit Tracer Recording.
Summit T3‐8 PCI Express Multi‐Lane Protocol Analyzer User Manual
211
Teledyne LeCroy
Trigger Modes
In Bit Tracer Recording, you can use the Snapshot, Manual Trigger, and Event Trigger recording types.
Note: You can also use other standard Recording Options, such as Link Width, Buffer Size, and Lane Polarity Settings, to characterize the link.
.
In Bit Tracer Recording, you can use the Snapshot, Manual Trigger, and Event Trigger recording types.
Note: You can also use other standard Recording Options, such as Link Width, Buffer Size, and Lane Polarity Settings, to characterize the link.
Lane Deskew Bypass in Recording Options prevents lanes from being bonded by the analyzer, allowing you to troubleshoot problems with physical layer.
9.2
Trigger Modes
If you select Event Trigger, you may select basic trigger settings in the Trigger On dialog.
9.3
Views Available for Captured Data
BitTracer mode displays captured data lane‐by‐lane and byte‐by‐byte in each direction (upstream and downstream), with the time scale progressing left to right (see Figure 9.2 on page 213).
212
Summit T3‐8 PCI Express Multi‐Lane Protocol Analyzer User Manual
De‐skewing Data
Teledyne LeCroy
Figure 9.2: Captured Data Display
Other views are provided for timing measurements, marker placement, physical layer errors, captured symbol types, packets, events, and decoding of ordered sets and packets. You can view any or all displays simultaneously, using the Windows selection in the View menu. 9.4
De-skewing Data
By default, BitTracer recordings display captured data in time deskewed format, across all lanes for both directions. But it is possible, for debug purposes, to bypass this deskew using the Lane Deskew Bypass check box in Recording Options.
When lanes are not deskewed, individual bytes are as they were captured on the recorded link, before the receiver device on the link (or the receiver logic on the PCIe Protocol Suite analyzer) has performed lane to lane deskew operations.
You can manually skew the captured data, left or right, in increments of one symbol time, using the associated toolbar buttons.
Summit T3‐8 PCI Express Multi‐Lane Protocol Analyzer User Manual
213
Teledyne LeCroy
Data Display Formats
You can automatically de‐skew an entire lane direction. First, left‐click on the direction in the data window. Then right‐click to display a popup menu. Then select Auto De‐Skew.
You can de‐skew only one direction for each right‐click operation. To automatically de‐
skew the opposite direction, first left‐click on that direction in the data window.
Note: The skew observed in the bit tracer is the actual skew of the lanes in the link plus the skew introduced by the analyzer interface. The De‐skew Bypass option is not intended for skew measurements or estimations.
9.5
Data Display Formats
To display traffic in K/D symbol (with Running Disparity indicated), scrambled, descrambled, 10‐bit, and Binary code formats:
Use the toolbar.
Right‐click to display a menu.
Place the cursor over any given byte to display all byte formats (including an LFSR value) in pop‐up list.
Note: Descrambled values can only be displayed after the first recorded skip ordered set. Data prior to the skip is displayed in scrambled values, due to the unknown LFSR.
Note: For Binary Data Display Format, bits are shown in order of transmission on the bus.
9.6
Color-Coding of BitTracer Contents
To increase visual understanding of BitTracer displays, different symbol types have color‐
coding:
214
Presence or non‐presence of a lane’s byte‐lock
Summit T3‐8 PCI Express Multi‐Lane Protocol Analyzer User Manual
Report and Analysis Windows
Teledyne LeCroy
Idle data characters (D0.0)
K codes
Invalid 10b symbols
Signal presence
Background of the Markers Bar (see “Markers Bar” on page 216) (color coded according to traffic speed).
All symbols of a TS1/TS2 ordered set
By default, these color selections match the standard color selections used in the CATC Trace format. You can modify them in the Display Options menu, accessible from the Main toolbar or the Setup menu.
9.7
Report and Analysis Windows
In the report windows, BitTracer mode provides several functions to analyze traffic:
Statistical information
Timing measurements
Packet decoding
To activate/deactivate a report window, use Views > Windows (see Figure 9.3 on page 215). Figure 9.3: Activate/Deactivate Reports
You can rearrange the report windows.
All report windows are dockable. 9.8
Timing Measurements Bar
BitTracer mode provides timing measurements on captured data:
Measurements from the Trigger position relative to user‐selected X and Y mark‐
ers
X‐Y measurements
Summit T3‐8 PCI Express Multi‐Lane Protocol Analyzer User Manual
215
Teledyne LeCroy
Timing Measurements Bar
Measurements between user‐defined markers
Figure 9.4: Timing Measurements on Captured Data
9.8.1
Markers Bar
The Trigger marker trigger condition. is at the point where BitTracer recognized the user‐defined To set an X marker , left‐click anywhere in the data display, except for the light gray bar located above the data and below the directional label. To set a Y marker , right‐click anywhere in the data display, except for the light gray bar located above the data and below the directional label. To define a marker, select the Set Marker command in the Markers menu or use the Toggle Marker icons in the toolbar. You can also use the Jump to Next or Previous marker icons in the toolbar.
User‐defined markers are numbered in the order they were placed:
U1 , U2, and so on in the upstream direction
D1, D2 , and so on in downstream direction.
You can set a marker with text using the Set Marker with Text… command in the Markers menu. After setting the marker, when the mouse pointer is on the marker symbol, the marker text displays as a tooltip.
You can also display the Markers window, which lists all markers and their locations, including a hyperlink for each.
216
Summit T3‐8 PCI Express Multi‐Lane Protocol Analyzer User Manual
Errors Bar
Teledyne LeCroy
Figure 9.5: Markers Window
Timing measurements between all combinations of X, Y, U, and Trigger cursors are in the Timing window (see Figure 9.6 on page 217).
Figure 9.6: Timing Window
9.9
Errors Bar
BitTracer mode provides a summary of 10b errors (invalid symbols) and disparity errors in the Errors window. The window shows the total error count and errors per‐lane for each error type. Hyperlinks allow jumps to selected errors (see following figure).
Summit T3‐8 PCI Express Multi‐Lane Protocol Analyzer User Manual
217
Teledyne LeCroy
Symbols Bar
Figure 9.7: Errors Window
BitTracer mode also highlights errors:
9.10
Invalid symbols have a black background.
Bytes with incorrect running disparity have red borders.
Symbols Bar
The Symbols window provides a summary of the different symbol types captured, by quantity and direction, and includes hyperlinks for jumps to selected symbols.
Expanding the + sign at the left of each symbol provides a summary of symbols by lane (see following figure). 218
Summit T3‐8 PCI Express Multi‐Lane Protocol Analyzer User Manual
Events Bar
Teledyne LeCroy
Figure 9.8: Symbols Window
9.11
Events Bar
The Events report window summarizes Link Up, Link Down, and Speed Switch events for Upstream and Downstream (see Figure 9.9 on page 219).
Figure 9.9: Events Window
Note: The table entries are hyperlinks.
9.12
Packets Bar
The Packets report window summarizes packet types detected in the file.
Summit T3‐8 PCI Express Multi‐Lane Protocol Analyzer User Manual
219
Teledyne LeCroy
Packets Bar
Note: To obtain packet types, you must perform a post‐capture “Analyze” step. After capture, when you open the Packets Bar for the first time, items can display the command “Analyze”. To start the analysis, click the word Analyze. After analysis finishes, the results are saved with the file. Therefore, you do not need to click Analyze the next time.
The table entries are hyperlinks.
Note: If you edit anything, the results are no longer valid, and the system requires you to click Analyze again.
Figure 9.10: Packets Window
220
Summit T3‐8 PCI Express Multi‐Lane Protocol Analyzer User Manual
Decoding Bar
Teledyne LeCroy
After analysis, the Packets Bar looks like the following:
9.13
Decoding Bar
If you select them in the data view, or search or jump locates a feature, BitTracer mode displays ordered sets and packets in the Decoding window (see Figure 9.11 on page 222):
Logical view is identical to CATC Trace format.
Specification view provides a more elementary display. The Specification view includes an option to display data in hex or binary format.
Note: Packets and ordered sets translate directly to this view from data capture and use any post‐
capture skew manipulations you add, or use natural lane‐to‐lane skew present on the link if you have not added post‐capture skew manipulations. Typically, you would perform an Auto De‐
Skew before viewing ordered sets and packets in this view.
Use the left and right arrows to search for the next or previous symbol type (see following figure).
Summit T3‐8 PCI Express Multi‐Lane Protocol Analyzer User Manual
221
Teledyne LeCroy
Search
Figure 9.11: Decoding Window
9.14
Search
To search, use the Search toolbar.
Clicking the Search icon displays the Search window (see Figure 9.12 on page 223).
222
Summit T3‐8 PCI Express Multi‐Lane Protocol Analyzer User Manual
Link Configuration
Teledyne LeCroy
Figure 9.12: Search Window
You can copy data shown in the BitTracer display across a lane (horizontally) or across multiple lanes (vertically), and then paste it into the Search Pattern window. The Search Pattern window stores previous search values, which you can recall by selecting the Search Pattern drop‐down button.
In the Pattern Format section, select to search in 10‐bit Codes, Scrambled Bytes, or Descrambled Bytes format.
In the Search Order section, select to search Across Lanes (multiple lanes, vertically) or Along Lanes (individual lanes, horizontally).
To define the direction (upstream or downstream) and the lanes on which to search, use the Search On section.
9.15
Link Configuration
Use the toolbar icon or right‐click in the data views to display the Link Configuration dialog. This dialog allows you to associate logical lanes with physical lanes, thereby providing support for lane bifurcation (multiple logical links on the same physical link).
After logical lanes map to physical lanes, BitTracer mode reconfigures the display to show the selected logical link (and the logical link width, as the link width selected in the dialog). Use the arrows to force symbol time skew on any lane.
Summit T3‐8 PCI Express Multi‐Lane Protocol Analyzer User Manual
223
Teledyne LeCroy
Link Configuration
Use the polarity checkbox to invert lane polarity on the selected lane or use the +/‐ toolbar icon.
Use the scrambling option to select a scrambling algorithm, as per specification 1.0a or legacy specification 1.0. Note: This dialog applies to one direction at a time (upstream or downstream). Left‐click in the direction in the data display to edit the configuration for that direction.
Click the Edit Link button to display the Link Configuration for Upstream or Downstream dialog (the dialog display is context sensitive.
Figure 9.13: Link Configuration Dialog
224
Summit T3‐8 PCI Express Multi‐Lane Protocol Analyzer User Manual
Export of BitTracer Capture to CATC Trace Format
9.16
Teledyne LeCroy
Export of BitTracer Capture to CATC Trace Format
You can export BitTracer captures to standard CATC Trace file formats, selecting the Export option from the File menu. Note: If the bit trace is not deskewed, you should use the Auto De‐skew feature before using the export feature The exported CATC Trace keeps association information with the original BitTracer file. Such traces scroll synchronously when you select the Synchronize Traces option in the Windows menu. You can navigate between BitTrace and CATC Trace using the Show in Trace View/
Show Packet in Raw Trace context menu.
9.16.1
Exports Involving Multiple Logical Links on One Physical Link
If a single BitTrace capture contains more than one logical link, you can export each logical link to CATC Trace format. You may then cascade or tile the various BitTracer exports, which then scroll together in linked fashion, along with the original BitTracer file. The Export dialog provides options to export a limited range within the BitTrace capture and to automatically open the exported capture in CATC Trace format. 9.16.2
Export To CSV Text
Select File > Export > Packets to CSV Text to display the Export Packets to comma delimited text dialog. Select desired options from the From and To Segment, Marker and Time drop‐down lists (see Figure 9.14 on page 226).
Summit T3‐8 PCI Express Multi‐Lane Protocol Analyzer User Manual
225
Teledyne LeCroy
Compressing and Expanding the Data View
Figure 9.14: Export Packets to Comma Delimited Text Dialog
9.17
Compressing and Expanding the Data View
You can compress (zoom out) the horizontal timing of the displayed data to view higher‐
order link behaviors. You can expand (zoom in) to examine higher‐resolution views. To zoom in or zoom out, right‐click the data view, then select a command or select a zoom icon on the toolbar.
Alternatively, to zoom in, left‐click and drag across a desired range of data.
9.18
Opening and Saving BitTracer Captures
You can save BitTracer captures in various file types.
You can collate and archive these files for transport, using the Export to Compressed Archive feature in the File menu. The main BitTracer files have a *.peraw extension. You can open these files in the PCIe Protocol Suite application using the File > Open command.
226
Summit T3‐8 PCI Express Multi‐Lane Protocol Analyzer User Manual
Chapter 10
Reports and Tools
Reports assist you in analyzing traffic recorded by the Analyzer. The available reports are:
File Information: To view general information about the CATC Trace file.
Error Summary: To view a count of errors in a CATC Trace file.
Traffic Summary: To view a summary of protocol‐related information in the CATC Trace file summary information about a selected group of items in the CATC Trace file (such as a count of particular frame or packet types).
Bus Utilization: To display information on bandwidth usage for the transmit and receive channels.
Link Tracker: Displays a detailed chronological view of events.
Data Flow: Shows marker, packet, direction, type, length, address, payload, hand‐
shake, and timestamp information.
Trace Navigator: Navigates within the CATC Trace to view the location of errors and triggers, narrow the range of traffic on display, and jump to any point in the CATC Trace.
Detail View: Shows the detail view of the selected packet.
LTSSM Flow Graph: Shows a state diagram of bus activity.
Packet Header: Shows packet header information
Packet Data: Shows packet or transaction payload
Configuration Space: Displays a Configuration Space.
Metrics: Measures key operating parameters.
TC to VC Mapping: To display how Traffic Classes are mapped to Virtual Channels (to simplify navigation) and how the CATC Trace display was changed (for exam‐
ple, in Split Transactions).
NVMe Base Address Mapping: To view if device ID is mapped to NVMe.
Timing Calculations: To view timing measured between two events set within the CATC Trace file.
Run Verification Scripts: Allows you to check errors, link transactions, split trans‐
actions, metrics, ordered sets, replays, DLLPs, and TLPs.
Trace Expert: Generates reports on Performance Analysis, Trace Analysis Statis‐
tics, Error Reports and Trace Information. See “Trace Expert” on page 293.
Reports are available from the Report menu and buttons on the Tool bar. Tools are available from the Tools menu. Summit T3‐8 PCI Express Multi‐Lane Protocol Analyzer User Manual
227
Teledyne LeCroy Corporation
10.1
Trace Information
Trace Information
The Trace Information window provides a summary on the currently displayed file.
Select Reports > Trace Information
to display the Trace Information window.
Figure 10.1: Trace Information Window
228
Summit T3‐8 PCI Express Multi‐Lane Protocol Analyzer User Manual
Error Summary
10.2
Teledyne LeCroy Corporation
Error Summary
The Error Summary dialog displays the number of errors for each event and the packet containing the errors.
Select Reports > Error Summary to open the Error Summary dialog (see Figure 10.2 on page 229).
Figure 10.2: Error Summary Dialog
Summit T3‐8 PCI Express Multi‐Lane Protocol Analyzer User Manual
229
Teledyne LeCroy Corporation
Error Summary
10.2.1 Error Summary for Storage Protocols
After decoding a trace for the corresponding storage protocol, the CATC Trace will have a summary ready of the errors found for the trace. Example: The AHCI Error Summary dialog is a sub‐entry for the main Error Summary dialog. It displays the number of errors for each AHCI transaction containing the errors.
Select Reports > Error Summary to open the Error Summary dialog.
Figure 10.3: AHCI Error Summary Dialog.
The five types of AHCI errors are describe below:
Reserved Field not Zeroes
One or more fields inside the AHCI transaction are not filled with all 0s. The AHCI specification states that all reserved fields and registers must be filled with 0s.
Figure 10.4: Reserved Field Not Filled With Zeroes
Note: Reserved fields for AHCI level are not displayed when filled with all 0s.
Incomplete
The AHCI transaction does not contain enough data or lower‐level transactions (Link or Split) are marked as incomplete.
Figure 10.5: Incomplete
230
Summit T3‐8 PCI Express Multi‐Lane Protocol Analyzer User Manual
Error Summary
Teledyne LeCroy Corporation
Logical Error One or more fields are in an inconsistent state relative to the other fields in the same or other registers.
Figure 10.6: Logical Error
Read‐only Field Changed The value of the read‐only field differs from the previous one.
Figure 10.7: Read-only Field Changed
Unknown
The AHCI decoder is unable to decode a particular transaction correctly. This can be caused by a distorted trace file. This can be caused by missing base address information.
Figure 10.8: Unknown
Checks for Logical error and Read‐only field depending on the values obtained from previous registers. It can result in false‐positive or false‐negative detections in case of partially saved trace file. The AHCI transaction can be marked as incomplete in case of saving a portion.
Summit T3‐8 PCI Express Multi‐Lane Protocol Analyzer User Manual
231
Teledyne LeCroy Corporation
10.2.2
Error Summary
Error Summary for Storage Protocols -- NVMe
The NVMe sub‐entry of the Error Summary dialog displays the number of NVMe errors found while decoding the trace at the NVMe level as shown in Figure 10.9, Figure 10.10 and Figure 10.11.
Figure 10.9: NVMe Errors After Decoding the Trace
The NVMe Queue Error sub‐entry of the Error Summary dialog lists NVMe errors which are specific to interacting with the NVMe queues.
Figure 10.10: NVMe Errors Specific to NVMe Queues
232
Summit T3‐8 PCI Express Multi‐Lane Protocol Analyzer User Manual
Traffic Summary
Teledyne LeCroy Corporation
The NVMe CMD sub‐entry of the Error Summary dialog lists errors which are specific to NVMe command decoding. See Figure 10.11
Figure 10.11: NVMe Errors Specific to NVMe Commands
10.3
Traffic Summary
The Traffic Summary window summarizes the traffic in the current CATC Trace. The left side of the window displays a tree of protocol levels. The right side displays a summary of traffic for the displayed levels. Select Reports > Traffic Summary or click
Figure 10.12 on page 234).
Summit T3‐8 PCI Express Multi‐Lane Protocol Analyzer User Manual
to display the Traffic Summary window see 233
Teledyne LeCroy Corporation
Traffic Summary
Figure 10.12: Traffic Summary Dialog
Buttons at the top of the Traffic Summary window change the display format and enable data to be exported to email, file, or the printer.
10.3.1 Traffic Summary for Storage Protocols
After decoding a trace for the corresponding storage protocol, the CATC Trace will have a summary ready of the commands existing in the trace. Example: The AHCI Traffic Summary window summarizes the AHCI traffic in the current CATC Trace. The right side displays a summary of AHCI transactions and errors.
Select Reports > Traffic Summary to open the Traffic Summary dialog.
234
Summit T3‐8 PCI Express Multi‐Lane Protocol Analyzer User Manual
Traffic Summary
Teledyne LeCroy Corporation
Figure 10.13: AHCI Traffic Summary Dialog
10.3.2
Using the Traffic Summary Window to Search the CATC Trace
You can use the Traffic Summary window to move the CATC Trace to packets of interest: 1. Click one of the numbers in the right side of the Traffic Summary window. The CATC Trace jumps to the first instance of the selected protocol.
2. Click the up or down arrows
. The CATC Trace jumps forward or backward through the display to the next instance of selected protocol level.
Summit T3‐8 PCI Express Multi‐Lane Protocol Analyzer User Manual
235
Teledyne LeCroy Corporation
10.3.3
Traffic Summary
NVMe Queue Time Metrics
NVMe Queue Time Metrics can be seen in the Traffic Summary, which includes all of the Doorbell Metrics (see Figure 10.14).
Figure 10.14: NVMe Queue Time Metrics for Doorbell Operations
10.3.4
Traffic Summary Buttons
Buttons at the top of the Traffic Summary dialog provide options for exporting the data or formatting its appearance:
Save. Saves Traffic Summary results into an HTML format.
Email. Attaches an HTML file of the results to a new email.
Print. Prints results.
Text. Displays results in HTML format.
236
Summit T3‐8 PCI Express Multi‐Lane Protocol Analyzer User Manual
Bus Utilization
Teledyne LeCroy Corporation
Options. Opens a drop‐down menu with the following options:
Grid Lines: Displays/Hides grid lines
Row Selection: Allows entire rows to be selected
Tight Columns: Reformats column widths to match data
Event Navigation: Skip Hidden Items
Show Hidden Items
Prompt each time
10.4
Bus Utilization
Select Report > Bus Utilization from the menu or press
window (see Figure 10.15 on page 237).
to open the Bus Utilization Figure 10.15: Bus Utilization Window
Summit T3‐8 PCI Express Multi‐Lane Protocol Analyzer User Manual
237
Teledyne LeCroy Corporation
Bus Utilization
The Bus Utilization window displays information on bandwidth use for the transmit and receive channels.
10.4.1
Bus Utilization Pop-up Menu
You can reformat the display by right‐clicking a graph and making a selection from the Bus Utilization pop‐up menu (see Figure 10.16 on page 238).
Figure 10.16: Bus Utilization Menu
Go to Packet #: Relocates the CATC Trace to the selected packet number.
Undo Zoom: If you have zoomed in, this command undoes the zoom.
Zoom to Trace View: Zooms in on graph to show traffic currently displayed in the CATC Trace screen.
Fit to Graph Area: Redisplays graph so that the entire CATC Trace fits inside graph area.
Y Scale Type:
Linear: Converts display to linear format
Logarithmic: Converts display to logarithmic format
Hide: Hides the selected graph
Remove: Allows you to remove any graph that you created via the New
command
Properties: Opens a dialog with options for changing the Title, Type, Appearance, and Color of the graphs (see Figure 10.17 on page 239).).
238
Summit T3‐8 PCI Express Multi‐Lane Protocol Analyzer User Manual
Bus Utilization
Teledyne LeCroy Corporation
Figure 10.17: Graph Area Properties Dialog
10.4.2
Bus Utilization Buttons
The Bus Utilization window buttons allow you to reformat the display and export data.
Button
Function
Save. Saves Bus Utilization data to a bitmap file (*.bmp).
Summit T3‐8 PCI Express Multi‐Lane Protocol Analyzer User Manual
239
Teledyne LeCroy Corporation
Bus Utilization
Email. Opens an email and attaches a bitmap file of the Bus Utilization data.
Print. Prints the Bus Utilization data.
Full Screen. Maximizes the Bus Utilization window.
View Settings. Opens a sub‐menu with the following choices:
• Orient Horizontally
• Tile Vertically
• Show Markers
• Show Plumbline
• Status >> • Bar
• Tool tips
• None
• Grid Lines >> • Both Axes
• X Axis
• Y Axis
• No Grid
• Grid on Top
• Fonts & Colors
Horizontal zoom in
Horizontal zoom out
Vertical zoom in
Vertical zoom out
Click and Drag zoom. Click and drag to zoom in on a part of the graph.
Select Range. Displays a dialog for selecting a packet range.
240
Summit T3‐8 PCI Express Multi‐Lane Protocol Analyzer User Manual
Bus Utilization
Teledyne LeCroy Corporation
Synchronize Graph Areas. If two or more graphs are displayed, this button synchronizes the graphs to one another. Once synchronized, the positioning slider of one graph moves the other graphs.
Graph Areas. Provides options for creating and displaying additional graphs of data lengths, packet lengths, and percentage of bus used (see Graph Area Options below). Graph Area Options
The available graphs are shown in Figure 10.18:
Figure 10.18: Graph Area Options Dialog
The available graphs are:
New ‐ Opens Graph Area Properties dialog to specify a new graph
SPLIT: Pending Requests
SPLIT: Response Time
SPLIT: Latency Time
SPLIT: Throughput Per Transaction
SPLIT: Response Time & SPLIT: Latency Time
Memory Writes: Response Time
Memory Writes: Throughput
Packet Length
Link Utilization
Data Throughput
Summit T3‐8 PCI Express Multi‐Lane Protocol Analyzer User Manual
241
Teledyne LeCroy Corporation
10.5
Link Tracker
Packet Count
NVMe Command IOPS
ATA IO: Pending Transactions
Downstream Packet Length
Upstream Packet Length
FC: Upstream Posted Header & FC: Upstream Nonposted Header FC: Upstream Completion Header
FC: Upstream Posted Data & FC: Upstream Nonposted Data FC: Upstream Com‐
pletion Data FC: Downstream Posted Header & FC: Downstream Nonposted Header FC: Downstream Completion Header
FC: Downstream Posted Data & FC: Downstream Nonposted Data FC: Down‐
stream Completion Data
Link Tracker
The Link Tracker window see (Figure 10.19 on page 242).displays a detailed chronological view of events. Events are shown on a channel‐by‐channel basis in columns within the window.
Figure 10.19: Link Tracker Window
Each time slot in the vertical axis represents the minimum time that a DWORD requires to traverse the bus. Toolbar: Presents buttons for changing the format of the Link Tracker window.
242
Summit T3‐8 PCI Express Multi‐Lane Protocol Analyzer User Manual
Link Tracker
Teledyne LeCroy Corporation
Main Display Area: Displays traffic chronologically as it occurred in the recording. The window divides into columns: the first column shows time and traffic is shown on a channel‐by‐channel basis in the columns on the right.
10.5.1
Using the Link Tracker Window
The Link Tracker window can be reformatted in several ways.
10.5.2
Zooming In and Out
Zooming out can give you a quick, high‐level view of a CATC Trace. A fully zoomed out CATC Trace only shows columns and colored lines. Using the colors, you can see what types of traffic run through the CATC Trace. Further information can be obtained on any point of interest in the CATC Trace by positioning your mouse pointer over it. Tool tips provide detailed description of events. When fully zoomed out, the smallest graphical unit is the DWORD, represented by a single line. Zooming out makes the CATC Trace appear smaller and increases the time scale in the first column (see the following figure).
10.5.3
Collapsing Idle Time, Enabling Tool tips, and Resetting Column Widths
Click the View Options button
to open a menu with options for formatting the display. Three options are presented:
Summit T3‐8 PCI Express Multi‐Lane Protocol Analyzer User Manual
243
Teledyne LeCroy Corporation
Link Tracker
Collapsible Idle Time: Opens a dialog box for setting the Idle time value. Setting a value tells the Analyzer when to collapse Idle times and display them as grayed out strips within the Bus View window. Tooltip Display: Opens a menu with options for adding content to Tooltips. Tooltips display when you position the mouse pointer over an item in the Bus View window. The options are:
Tooltips Display Values
Tooltips Display Scrambled Values
Tooltips Display 10‐bit Codes
Tooltips Display Symbols
Time Format: Seconds or Clock
Reset Column Widths: This option resets column widths to their defaults and enables columns to resize themselves automatically any time the application window is resized. Normally, columns automatically resize themselves if the application window is made larger or smaller. However, if you manually resize any columns in the Bus View window, column widths become static. Thereafter, if you resize the application window, the Bus View columns do not adjust automatically. Reset Column Widths re‐enables the automatic resizing capability.
Reset Columns Order: Return to default column sequence.
10.5.4
Docking and Undocking the Window
You can undock the Link Tracker window by double‐clicking the blue title bar along the left side of the window. Once undocked, the window can be dragged anywhere in the application. To redock, double‐click again on the title bar.
10.5.5
Setting Markers
Markers can be set on any event within the Link Tracker window. To set a marker, right‐click an event, then select Set Marker from the pop‐up menu. Once marked, you can navigate to events with the Go to Marker command in the Search menu. Markers set in the Link Tracker window display the packet number and DWORD number. In contrast, markers set in the CATC Trace window just show the packet number.
244
Summit T3‐8 PCI Express Multi‐Lane Protocol Analyzer User Manual
Link Tracker
Teledyne LeCroy Corporation
Figure 10.20: Selecting the Go to Marker Option
10.5.6
Calculating Time between DWORDs
You can calculate time between DWORDs by clicking an event and then positioning your mouse pointer over a second event and reading the ensuing Tool tip.
Click the time value for the first event. Scroll down through the CATC Trace to the second event and position the mouse pointer above its time value. A Tool tip appears showing the time interval between the first and second events.
Figure 10.21: Viewing Time Values
10.5.7
Hiding Traffic
You can hide Idles and other data from the Link Tracker window by clicking the Hide buttons on the toolbar.
10.5.8
Link Tracker Buttons
The Link Tracker window has a row of buttons for changing the format of the displayed data and for exporting data: The buttons have the following functions:
Full Screen. Expands the Link Tracker window to fill the entire screen.
Summit T3‐8 PCI Express Multi‐Lane Protocol Analyzer User Manual
245
Teledyne LeCroy Corporation
Link Tracker
View Options. Opens a menu with three options: • Collapsible Idle Time (Collapse Idle Bigger Than n nanoseconds. Note: Does not affect Collapse Idle Plus.)
• Tooltip Display (Values, Scrambled Values, 10‐bit Codes, Symbols)
• Time Format (Seconds, Clock)
• Reset Columns Widths (return to default widths)
• Reset Columns Order (return to default column sequence)
See “Using the Link Tracker Window” on page 243 for further details.
Synchronize Trace View. Synchronizes the Trace View and Link Tracker windows so that a move in one window repositions the other.
Because of the differences in scale and logic between the Link Tracker and Trace view window, scrolling produces different effects depending on which window is being scrolled. Scrolling in the CATC Trace window causes the Link Tracker window to rapidly jump from event to event. Long periods of idle time are thus skipped. Scrolling in the Link Tracker window, in contrast, produces modest movements within the CATC Trace window. Scrolling in the Link Tracker window causes the CATC Trace window to pause until the beginning of a packet is displayed. At that point, the CATC Trace window repositions itself. While scrolling long Idle periods or through the contents of a packet, the CATC Trace window does not move.
Zoom In
Zoom Out
Continuous Time Scale. No collapsing.
Collapse Idle. Do not show some periods of Link being idle.
Collapse Idle Plus. Do not show periods of Link being idle.
Show Values
Show Scrambled Values
246
Summit T3‐8 PCI Express Multi‐Lane Protocol Analyzer User Manual
Data Flow Window
Teledyne LeCroy Corporation
Show 10b Codes
Show Symbols
Show Text
10.6
Data Flow Window
The Data Flow window shows marker, packet, direction, type, length, address, payload, handshake, and timestamp information.
To view the Data Flow window (Figure 10.22 on page 247), select Report > Data Flow or click the Data Flow toolbar icon.
Figure 10.22: Data Flow Window
The toolbar allows you to (see Figure 10.23 on page 248):
Expand the window to full screen or Collapse to a smaller window.
Summit T3‐8 PCI Express Multi‐Lane Protocol Analyzer User Manual
247
Teledyne LeCroy Corporation
Flow Control Tracking
Synchronize.
Save.
Select Data Flow columns to display and their widths: Marker
Packet
Direction
Type
Length
Address
Payload
Handshake
Time Stamp
Figure 10.23: Data Flow Columns Dialog
10.7
Flow Control Tracking
The Flow Control View mode highlights portions of the packets that affect flow control and displays flow control values. Flow control values shown at the beginning of Link Transaction display the credit values that were available prior to TLP transmission. Flow control values shown at the end of the Link Transaction display the credit values that were available after TLP was transmitted. Hover the mouse over the field to display tool‐
tips. Refer to the following screen capture. 248
Summit T3‐8 PCI Express Multi‐Lane Protocol Analyzer User Manual
Flow Control Tracking
Teledyne LeCroy Corporation
Figure 10.24: Flow Control Display
If the trace includes Flow Control initialization, PCIe Protocol Suite detects the amount of available credits based on the values advertised in InitFC packets. If the InitFC packets are not in the trace, the amount of available credits can be set using the FC Credit Setup dialog. Select View > FC Credits Setup... displays the FC Credit Setup dialog (see the following screen capture). (see the following screen capture). For each virtual channel that is present in the trace you need to specify the amount of available credits before the beginning of the trace. You can also specify the values of credit fields for UpdateFC packets before the beginning of the trace. If the values of the UpdateFC credit fields are different than the values in the first UpdateFC packet, Flow Control tracking view will show that the first UpdateFC packet is releasing appropriate amount of credits. By default, PCIe Protocol Suite sets these values to match the first UpdateFC packets in the trace. Select View > FC Credits Setup... displays the FC Credit Setup dialog (see the following screen capture). Figure 10.25: Flow Control Setup Dialog
Summit T3‐8 PCI Express Multi‐Lane Protocol Analyzer User Manual
249
Teledyne LeCroy Corporation
10.8
Using the CATC Trace Navigator
Using the CATC Trace Navigator
The CATC Trace Navigator is a tool for navigating within the CATC Trace. It allows you to view the location of errors and triggers in a CATC Trace and to narrow the range of traffic on display. It also allows you to quickly jump to any point in the CATC Trace.
10.8.1
Displaying the Navigator
Click
in the toolbar to display the Navigator. The Navigator appears on the right side of the Main window. It has a two‐button toolbar and a vertical slider bar. It also has colored panes for navigating the CATC Trace in different ways. You set which panes are displayed through Navigator pop‐up menus (see Figure 10.26 on page 250).
Figure 10.26: Navigator Dialog
10.8.2
Navigator Toolbar
The Navigator toolbar lets you quickly set Navigator features. The toolbar has two buttons.
250
Summit T3‐8 PCI Express Multi‐Lane Protocol Analyzer User Manual
Using the CATC Trace Navigator
Teledyne LeCroy Corporation
Navigator Ranges: This button brings up a pop‐up menu that lets you reset the Navigator range. The range determines what packets are viewable in the CATC Trace display.
Navigator Panes: This button has two purposes: To select which Navigator panes appear and to bring up the Navigator legend. The legend determines how information is shown in the panes.
10.8.3
Navigator Ranges
You set the viewing range by dragging the yellow range delimiters along the slider. To set the lowest packet viewable, drag the top delimiter up. As you do so, a tool tip appears to indicate the current range. Stop dragging when you reach the desired lowest packet. To set the highest packet viewable, drag the bottom delimiter down. Stop when the tool tip indicates you are at the desired highest packet.
.
10.8.4
To Determine Current Position
In addition to the two range delimiters, the slider has a blue current‐position indicator (see above). The current‐position indicator shows where you are in the CATC Trace display with respect to the possible viewing range. For example, suppose you set viewing range to packet 0 through packet 500 (the top range delimiter is at packet 0, and the bottom range delimiter is at packet 500). If you Summit T3‐8 PCI Express Multi‐Lane Protocol Analyzer User Manual
251
Teledyne LeCroy Corporation
Using the CATC Trace Navigator
then move the current‐position indicator on the slider to midway between the top and bottom delimiters, then packet 250 appears in the middle of the CATC Trace display. 252
Summit T3‐8 PCI Express Multi‐Lane Protocol Analyzer User Manual
Using the CATC Trace Navigator
10.8.5
Teledyne LeCroy Corporation
To Reset Navigator Range
You can reset the Navigator range using the toolbar Navigator Range button. Press the button to bring up the Navigator Range drop‐down menu.
The menu has the following options:
10.8.6
Set Range to Whole Trace: Allows you to reset the range to include the entire CATC Trace file contents. The top range delimiter is placed at the lowest packet number in the CATC Trace. The bottom range delimiter is placed at the highest packet number in the CATC Trace.
Set Range Near Packet xxx: Allows you to collapse the range so that only the packets immediately above and below the xxx packet are displayed. The xxx packet is whatever packet is currently at the top in the CATC Trace display.
Recently Used Ranges: Allows you to reset the range to any of a number of recently used (previously set) ranges. Navigator Panes
You can display any combination of CATC Trace Navigator panes.
From left to right, the panes are: Pre/Post Trigger, Errors, Traffic Type, Traffic Speed, and Link Width. Each pane represents the entire CATC Trace with respect to different types of information. The top of each pane represents the start of the CATC Trace file, and the bottom represents the end of the CATC Trace file.
Summit T3‐8 PCI Express Multi‐Lane Protocol Analyzer User Manual
253
Teledyne LeCroy Corporation
10.8.7
Using the CATC Trace Navigator
Pre/Post Trigger: To view the trigger event in the CATC Trace and the relative size of pre‐trigger and post‐trigger portions of the CATC Trace. The two portions are set apart as different colors. The trigger event occurs at the point the two colors meet.
Errors: To view any errors in the CATC Trace. A thin red line represents each error in the pane.
Traffic Type: To view the types of packets that occur in the CATC Trace. A differ‐
ent color represents each packet type in the pane. The relative size of colored portions in the pane corresponds to the amounts of the various packet types in the CATC Trace. As described below, you can use the Navigator legend to change the types of packets that take precedence in the display.
Traffic Speed: To view the speed that occurs in the CATC Trace. Link Width: To view the link width that occurs in the CATC Trace. To Show/Hide Navigator Panes
You can show/hide any of the panes using pop‐up menus accessible through left‐click the Navigator Panes button or by right‐click anywhere in any CATC Trace Navigator pane.
10.8.8
Navigator Slider
The Navigator slider appears at the left of Navigator panes. The slider has yellow upper and lower range delimiters and a blue current‐position indicator.
The Navigator slider lets you to set the range of packets viewable in the CATC Trace display. In other words, it sets scrolling range of the display. You can scroll the display up to the lowest packet number in the viewing range. You can scroll the display down to the highest packet number in the viewing range.
10.8.9
CATC Trace Navigator Legend
The Navigator legend lets you control the display of content in Navigator panes.
You bring up the legend through the Navigator Pane’s drop‐down menu. Press the toolbar Navigator Panes button to access the menu. Select the Legend option to bring up the Navigator Legend dialog (see Figure 10.27 on page 255).
254
Summit T3‐8 PCI Express Multi‐Lane Protocol Analyzer User Manual
Using the CATC Trace Navigator
Teledyne LeCroy Corporation
Figure 10.27: Navigator Pane and Navigator Legend Dialog
The Navigator Legend dialog has areas corresponding to each of the panes. Each area has check boxes that allow you to hide/display information in the pane. You can set the priority of information displayed in the panes using the up and down triangles on the right.
10.8.10 Using the Legend to Show/Hide Navigator Panes
To use the legend to show/hide an entire pane, use the checkbox next to the name of each pane in the legend. In the case of the Pre/Post Trigger and Errors areas, the action of show/hide in the legend is identical to that provided by CATC Trace Navigator pop‐up menus. In the case of the Traffic Types pane, there is no equivalent show/hide available through the pop‐up menus.
10.8.11 Using the Legend to Set the Priority of Information Display
You can use the legend to set the priority of information displayed in the Pre/Post Trigger Traffic Type panes. This is a two‐step process. 1. For a particular item in a pane, click the column next to the checkbox for the item. That labels the item as currently active. Summit T3‐8 PCI Express Multi‐Lane Protocol Analyzer User Manual
255
Teledyne LeCroy Corporation
Detail View
2. Next, use the up‐down at the lower‐right of the area to move the item higher or lower in priority.
In the case of the Traffic Type pane, priority determines display priority of each packet type. For portions of the CATC Trace that are dominated by a particular packet type, this setting no effect: only the color corresponding to that packet type is displayed in that portion of the pane. Suppose, however, that part of the CATC Trace includes equal or near equal numbers of several types of packets. In that case, you can use the legend to select which among those types is represented in that portion of the Traffic Types pane. This allows you to view only packets of interest in crowded portions of the CATC Trace display.
10.9
Detail View
Click to show the Detail View of the selected packet.
Figure 10.28: Detail View
256
Summit T3‐8 PCI Express Multi‐Lane Protocol Analyzer User Manual
LTSSM Flow Graph
Teledyne LeCroy Corporation
10.10 LTSSM Flow Graph
The LTSSM Flow Graph shows link state transitions that the link goes through, as recorded in the CATC Trace file. To obtain the LTSSM Flow Graph, select Report > LTSSM Flow Graph.
Figure 10.29: LTSSM Flow Graph Dialog
You can display the following directions:
Upstream
Downstream
Both
You can Show Number of Transitions.
Click the blue button (on the Recovery state below) to see the substate.
Summit T3‐8 PCI Express Multi‐Lane Protocol Analyzer User Manual
257
Teledyne LeCroy Corporation
Packet Header Bar
10.11 Packet Header Bar
The Packet Header bar shows packet header information.
To display the Packet Header bar, select Report > Packet Header or click the Packet Header toolbar icon.
Figure 10.30: Packet Header Bar
The toolbar allows you to Save, go to Previous or Next, display Hexadecimal or Binary, and show the Packet Data window.
10.12 Packet Data Window
The Packet Data window shows packet or transaction payload.
To display the Packet Data window (see Figure 10.31 on page 259), select Report > Packet Data or click the 258
toolbar icon.
Summit T3‐8 PCI Express Multi‐Lane Protocol Analyzer User Manual
Configuration Space View
Teledyne LeCroy Corporation
Figure 10.31: Packet Data Window
The toolbar allows you to Save; go to Previous or Next; display Hexadecimal, ASCII, Decimal, or Binary; use MSB Format or LSB Format; and use Big Endian or Little Endian.
Format and Columns allows you to enter the number of bytes, words, or dwords per line.
You can enter an Offset and scroll to it.
You can enter text and Search Previous or Search Next.
10.13 Configuration Space View
The Configuration Space View displays information about the Configuration Space state as of the current packet of the currently selected device. The view shows the Configuration Space Header and the PCI‐compatible or PCI Express Capability Structures.
To display the Configuration Space View for a device at a packet:
1. Open a CATC Trace, such as the sample file cfg_pci_express.pex.
2. Scroll to a packet with a Configuration header (see the following figure).
Summit T3‐8 PCI Express Multi‐Lane Protocol Analyzer User Manual
259
Teledyne LeCroy Corporation
Configuration Space View
3. Select Report > Configuration Space > <device> to display the Configuration Space View.
or
Click a CompleterID or DeviceID field. A pop‐up menu opens.
Select Show Configuration Space for xxxx from the menu, where xxxx is the device number. The Configuration Space View displays (see Figure 10.32 on page 261).
260
Summit T3‐8 PCI Express Multi‐Lane Protocol Analyzer User Manual
Using Unit Metrics
Teledyne LeCroy Corporation
Figure 10.32: Configuration Space View
On the left, the view displays the Configuration Space for the selected CompleterID or DeviceID at the current packet. You can select Configuration Space Header or a Capability Structure. The right displays the decoded data of the selected Configuration Space Header or a Capability Structure, up to the current packet. (The decoding builds while navigating through the next packets.)
The Configuration Space View toolbar allows you to Save, go to First, go to Previous, go to Next, go to Last, go to Previous Access to Selected Configuration Space Register, go to Next Access to Selected Configuration Space Register, and display Hexadecimal or Binary.
Note: See Appendix A “Configuration Space Decoding” on page 305.
10.13.1 Configuration Space Editor
The Configuration Space Editor allows you to create a new Configuration space file or open an existing Configuration Space file. It is used in conjunction with Teledyne LeCroy Trainer products. Select Tools > Configuration Space Editor to display the Configuration Space Editor dialog (see following figure). 10.14 Using Unit Metrics
For every protocol unit at the Link or Split transaction level, PCIe Protocol Suite™ calculates and displays a set of metrics. Metrics are measurements of key operating parameters. You can use metrics to evaluate performance of traffic in the CATC Trace stream. You can view metrics information in the CATC Trace display, the Traffic Summary window, and the Bus Utilization window. PCIe Protocol Suite defines different metrics for Link and Split transactions.
Summit T3‐8 PCI Express Multi‐Lane Protocol Analyzer User Manual
261
Teledyne LeCroy Corporation
Metrics Defined for Link Transactions
10.15 Metrics Defined for Link Transactions
Number of Packets: The total number of packets that compose this Link transac‐
tion.
Payload: The number of data payload bytes this Link transaction transferred.
Response Time: The time it took to transmit this Link transaction on the PE link, from the beginning of the first packet in the transaction to the end of the last packet in the transaction.
Data Throughput: The payload divided by response time, expressed in mega‐
bytes per second.
Note: Usually, the Number of Packets metric for a link transaction is two (in case of explicit acknowledge) or one (in case of implicit acknowledge). However if Naks/link level retries are involved, this metric might be higher. As a result, the Number of Packets metric is useful in highlighting unusual link transactions.
10.15.1 Metrics Defined for Split Transactions
The following types of metrics currently are defined for Split transactions:
Number of Link Transactions: The total number of Link transactions that compose this Split transaction.
Payload: The number of payload bytes this Split transaction transferred.
Response Time: The time it took to transmit this Split transaction on the PE link, from the beginning of the first packet in the Split transaction to the end of the last packet in the Split transaction;
Data Throughput: The transaction payload divided by response time, expressed in megabytes per second.
Latency Time: The time measured from the end of the request transaction to the first completion transmitted in response to the request within this Split transaction.
Note: The Number Of Link Transactions metric for a Split Transaction usually is two for a Configuration or IO request. It can be bigger then two for a Memory Read request.
10.16 Show Metrics in the CATC Trace Display
In the CATC Trace view display of Link Transaction or Split Transaction levels, all metrics information applicable to a specific protocol unit is displayed in a Metrics header. The header is located close to the end of the unit, in front of the Time cell. You can expand and collapse the header to show or hide the metrics information.
10.16.1 Collapsed Metrics Header Display
Following is a collapsed metrics display for a unit of Link Transaction. The collapsed header display shows only the metrics cell representing the Number of Packets (see figure on next page).
262
Summit T3‐8 PCI Express Multi‐Lane Protocol Analyzer User Manual
Show Metrics in the CATC Trace Display
Teledyne LeCroy Corporation
Following is a collapsed metrics display for a unit of Split Transaction. The collapsed header display shows only the metrics cell representing Number of Link Transactions.
10.16.2 Metrics Tool Tip Display
In both CATC Trace level views, you can view the summary of all the unit metrics in the Metrics header tool tip. To view the tool tip, simply place the mouse cursor over the Metrics header. Following is the tool tip for a unit in the Link Transaction view.
Note: The tool tip also presents information for time passed from the start of the recording till the beginning of this Link or Split Transaction.
10.16.3 Expanded Metrics Header Display
When you expand the Metrics header, the display creates a separate cell for each applicable metric:
The following is the expanded Metric header for a unit in the Split Transaction view.
The following is the expanded Metric header for a unit in the Link Transaction view.
Note: Each of the metric cells pops up a tool tip window with the explanation of what the metric means.
Summit T3‐8 PCI Express Multi‐Lane Protocol Analyzer User Manual
263
Teledyne LeCroy Corporation
Show Metrics in the Traffic Summary Window
10.17 Show Metrics in the Traffic Summary Window
Some of the Traffic Summary reports at the Link and Split Transaction levels are based on metrics collected for the corresponding protocol units in the CATC Trace.
10.17.1Reports at Split Transaction Level
Split Transaction Performance: This report table groups the Split Transactions by Requester‐Completer pair and displays Minimum/Average/Maximum data for Number Of Link Transactions and Response Time metrics.
Read Requests Performance: This report table includes only the Split Transactions that present Read Requests (Configuration, IO and Memory). It groups them by the combination of Requester‐Completer pair, request type, and Traffic Class and displays Minimum/Average/Maximum data for Throughput, Response Time, and Latency metrics (see following figure).
Write Requests Performance: This report table includes only the Split Transactions that present Write Requests (Configuration and IO). It groups them by the combination of Requester‐Completer pair, request type, and Traffic Class and displays Minimum/
Average/Maximum data for Throughput, Response Time, and Latency metrics.
264
Summit T3‐8 PCI Express Multi‐Lane Protocol Analyzer User Manual
Show Metrics in the Bus Utilization Window
Teledyne LeCroy Corporation
10.17.2 Reports at the Link Transaction Level
The following metric‐based reports are displayed at the Link Transaction level:
Link Transaction Performance: This report table groups the Link Transactions by TLP Type and displays Minimum/Average/Maximum data for Number Of Packets, Response Time and Payload Bytes metrics.
Memory Writes: This report table includes only the Link Transactions that present Memory Write Requests. Memory Writes are the only (posted) requests that don't get promoted to the Split transaction level, therefore their performance should be viewed at the Link transaction level. The table groups Memory Writes by the combination of Requester ID and Traffic Class and displays Minimum/Average/Maximum data for Response Time, Payload and Throughput metrics.
The following features apply to all of the report tables described above for the Split Transaction and Link Transaction levels:
Each report row for the defined tables contains the total number of units in this group for the CATC Trace (total number of units for Split Transaction perfor‐
mance, Read Requests performance, Memory Writes, and so on).
In many cases, the Maximum and Minimum values in the report tables are navi‐
gable. By clicking table cells, you reposition the corresponding CATC Trace view to the Split or Link Transaction that has yielded this maximum or minimum value. This can help you to find specific units in the CATC Trace, such as transactions that produced spikes in Response Time or Throughput.
10.18 Show Metrics in the Bus Utilization Window
The Bus Utilization window provides graphs for packet‐level information in the CATC Trace. The window also provides graphs for information on Split and Link Transaction levels, plotted over time. The graphs for Split and Link Transaction levels are based on metrics collected for the transactions throughout the CATC Trace.
The seven graphs related to Split and Transaction levels are:
1. Pending Requests at Split Transaction level.
Summit T3‐8 PCI Express Multi‐Lane Protocol Analyzer User Manual
265
Teledyne LeCroy Corporation
2.
3.
4.
5.
6.
7.
Show Metrics in the Bus Utilization Window
Response Time at Split Transaction level.
Latency Time at Split Transaction level.
Throughput Per Transaction at Split Transaction level.
Response Time and Latency Time at Split Transaction level (combined graph).
Response Time at Link Transaction level, for Memory Writes only.
Throughput at Link Transaction level, for Memory Writes only.
The following is an example of Bus Utilization window display of graph numbers 1, 4, 5, 6 and 7 (see following figure):
10.18.1 Unit-Based Averaging
The Analyzer builds metric graphs using unit‐based averaging (as opposed to time‐based averaging). For the total duration of a certain request (or Memory Write transaction), the graph value is assumed equal to the corresponding metric for this request (transaction). If there are overlapping operations for a certain time period, then the value is calculated as an average of metric values for all the overlapped requests (transactions).
It is important to remember that the Analyzer uses unit‐based averaging rather than time‐based averaging. Time‐based averaging can be misleading in some situations. For example, consider the Throughput Per Transaction graph. Sometimes, while many outstanding requests are in progress, latency (and response time) grows for each of the transactions, resulting in a lower throughput per transaction over time (which is reflected in the graph). This happens even though aggregated throughput across all the transactions is constant.
266
Summit T3‐8 PCI Express Multi‐Lane Protocol Analyzer User Manual
Show Metrics in the Bus Utilization Window
Teledyne LeCroy Corporation
10.18.2 Bus Utilization Window Features
For the seven Split‐ and Transaction‐level graphs listed, all Bus Utilization window features are available, such as zooming in/out, changing scale type, scrolling, context‐
sensitive status, and graph synchronization. See Bus Utilization and Bus Utilization Buttons for more on these features.
Note: Clicking a certain place within a graph area repositions the CATC Trace display at the Link or Split transaction level to the transaction that was in progress at that time.
10.18.3 Split Transaction Level Graphs
Transactions at the Split level combine all the non‐posted requests with corresponding completions. This includes Configuration and IO Read and Write requests, as well as Memory Read requests.
The following shows the graphs for the Split level:
Note: The Pending Requests graph is not directly defined by metrics, but it is useful when considering metrics. The Pending Requests graph presents the unit‐averaged number of requests that were Summit T3‐8 PCI Express Multi‐Lane Protocol Analyzer User Manual
267
Teledyne LeCroy Corporation
Real‐Time Statistics Window
pending (in progress) at any moment of time. It allows you to correlate the number of requests posted to a completer with other performance metrics.
10.18.4 Link Transaction Level Graphs
Memory Writes are the only (posted) requests that do not get promoted to the Split transaction level. Therefore, Memory Write performance should be viewed at the Link Transaction level. That is the reason graphs at the Link level only present the Memory Write‐related metrics and are titled Writes: Response Time: and Writes: Throughput (see the following figure).
10.19 Real-Time Statistics Window
The Real‐Time Statistics Window displays Link Utilization, performance measurements, and statistical values for a PCI Express link plotted in real time.
Click
268
to open the Real‐Time Statistics window (see Figure 10.33 on page 269).
Summit T3‐8 PCI Express Multi‐Lane Protocol Analyzer User Manual
Real‐Time Statistics Window
Teledyne LeCroy Corporation
Figure 10.33: Real-Time Statistics Dialog
Start PCI Express™ link activity.
To start the monitor, press
. To stop the monitor, press
. The remaining Real‐Time Statistics buttons provide options for changing the format of the display.
Additional formatting options are available through the Real‐Time Statistics pop‐up menu and the Real‐Time Statistics toolbar.
10.19.1 Real-Time Statistics Buttons
Additional formatting options are available through the Real‐Time Statistics toolbar.
Summit T3‐8 PCI Express Multi‐Lane Protocol Analyzer User Manual
269
Teledyne LeCroy Corporation
Button
Real‐Time Statistics Window
Function
Save. Saves Real‐Time Statistics data to bitmap file (*.bmp).
Email. Opens an email and attaches a bitmap file of the Real‐Time Statistics data.
Print. Prints the Real‐Time Statistics data.
Full Screen. Maximizes the Real‐Time Statistics window.
Synchronize Views.Synchronize the current view with other open views.
View Settings. Opens a sub‐menu with the following choices:
• Orient Horizontally
• Tile Vertically
• Show Markers
•
•
•
•
•
Show Plumbline
Status >> Bar
Tool tips
None
•
•
•
•
•
•
•
Grid Lines >> Both Axes
X Axis
Y Axis
No Grid
Grid on Top
Fonts & Colors
Horizontal zoom in
Horizontal zoom out
Vertical zoom in
270
Summit T3‐8 PCI Express Multi‐Lane Protocol Analyzer User Manual
Real‐Time Statistics Window
Teledyne LeCroy Corporation
Vertical zoom out
Click and Drag Zoom. Click and drag to zoom in on a part of the graph.
Synchronize Graph Areas. If two or more graphs are displayed, this button synchronizes the graphs to one another. Once synchronized, the positioning slider of one graph moves the other graphs.
Graph Areas. Allows you to hide or display the graphs and the counters. You can toggle Statistics Accumulation, Link Utilization, Data Payload Throughput, and Data Packet Count.
Start real‐time statistics. Starts the real‐time statistical monitor. Stop real‐time statistics. Stops the real‐time statistical monitor. Reset Graphs. Resets the graphs.
10.19.2 Real-Time Statistical Monitor Pop-up Menu
Additional formatting options are available through the Real‐Time Statistics pop‐up menu. Right‐click a graph in the Real‐Time Statistical Monitor window to display a pop‐up menu with options for changing the format of the display.
Undo Zoom: If you have zoomed in, this command undoes the zoom.
Fit to Graph Area: Redisplays graph so that the entire CATC Trace fits inside graph area.
Y Scale Type:
Linear: Converts display to linear format.
Logarithmic: Converts display to logarithmic format.
Hide: Hides the selected graph
Summit T3‐8 PCI Express Multi‐Lane Protocol Analyzer User Manual
271
Teledyne LeCroy Corporation
Real‐Time Statistics Window
Properties: Opens a dialog box with options for changing the Title, Appearance, and Color of the graph.
Figure 10.34: Graph Area Properties Display
10.19.3 Real-Time Statistics Graph Areas
The Real‐time Statistics window has three graph areas:
Link Utilization
Data Payload Throughput
Data Packet Count
Each graph area has Upstream and Downstream graphs for a device (if connected to a PC), plus as many graphs as Exerciser devices connected to the PC.
The Statistics Accumulation area shows the PCIe Protocol Suite statistics tab, plus as many tabs as Exerciser devices connected (see Figure 10.35 on page 273):
272
Summit T3‐8 PCI Express Multi‐Lane Protocol Analyzer User Manual
Memory I/O Space Editor
Teledyne LeCroy Corporation
Figure 10.35: Real-Time Statistics Graph Display
10.20 Memory I/O Space Editor
The Memory I/O Space Editor allows you to create a new Memory I/O Space file or open an existing Memory I/O Space file. It is used in conjunction with Teledyne LeCroy Trainer products. Select Tools > Memory I/O Space Editor to display the Memory Space Editor dialog.
Figure 10.36: Memory I/O Space Editor Dialog
Summit T3‐8 PCI Express Multi‐Lane Protocol Analyzer User Manual
273
Teledyne LeCroy Corporation
TC to VC Mapping
10.21 TC to VC Mapping
TC to VC Mapping displays how Traffic Classes are mapped to Virtual Channels (to simplify navigation) and how the CATC Trace display was changed (for example, in Split Transactions).
Figure 10.37: TC to VC Mapping Dialog
274
Summit T3‐8 PCI Express Multi‐Lane Protocol Analyzer User Manual
Timing and Bus Usage Calculations
Teledyne LeCroy Corporation
10.22 Timing and Bus Usage Calculations
10.22.1
Timing Calculator
The Timing and Bus Usage Calculator allows you to calculate time between packets.
Select Tools > Timing Calculations to obtain the Timing Calculator dialog. You can display the timing information in MB or Mb (see Figure 10.38 and Figure 10.39 on page 276).
Figure 10.38: Timing Calculator Dialog (MB Format)
Total Time: Total time from beginning of the first unit to beginning of the second unit.
Summit T3‐8 PCI Express Multi‐Lane Protocol Analyzer User Manual
275
Teledyne LeCroy Corporation
Timing and Bus Usage Calculations
Figure 10.39: Timing Calculator Dialog (Mb Format)
276
Summit T3‐8 PCI Express Multi‐Lane Protocol Analyzer User Manual
Timing and Bus Usage Calculations
10.22.2
Teledyne LeCroy Corporation
Queue Utilization
The Queue Utilization tool allows you to visualize the traffic on the submission queues (SQ) and command queues (CQ) within a time interval. The default interval is the entire trace. The graph is generated using the Calculate button at the bottom of the dialog (see Figure 10.40) below.
Figure 10.40: NVMe Queue Utilization Dialog
Summit T3‐8 PCI Express Multi‐Lane Protocol Analyzer User Manual
277
Teledyne LeCroy Corporation
10.22.3
Timing and Bus Usage Calculations
Bus Utilization
This portion of the Timing Calculator window gives values that are cumulative for all packets during the timing period. For example, throughput is combined throughput of all packets during the timing period.
Upstream is from endpoint devices to the root complex. Downstream is from the root complex to endpoint devices.
Link Utilization: Percentage of non‐idle symbols in total number of symbols transferred.
Time Coverage: Percentage of non‐idle symbol times in total number of symbol times. (Non‐idle symbol time occurs when at least on one of the lanes there were non‐idle symbols transferred.)
Bandwidth: Number of non‐idle symbol bits transferred per second.
Data Throughput: Number of TLP payload bytes transferred per second.
Packets/second: Number of packets transferred per second.
10.22.4
Split Transaction Performance
This portion of the Timing Calculator window gives minimum, maximum, and average values for all Split transactions during the timing period. For example, minimum throughput is throughput of the Split transaction that passes the least amount of data. Maximum throughput is throughput of the Split transaction that passes the most amount of data. Average throughput is the average calculated for all Split transactions during the timing period.
Response Time: The time it took to transmit this Split transaction on the PE link, from the beginning of the first packet in the Split transaction to the end of the last packet in the Split transaction.
Latency: The time measured from the end of the request transaction to the first completion transmitted in response to the request within this Split transaction.
Throughput: The transaction payload divided by response time, expressed in megabytes per second.
10.22.5
Memory Writes Performance
This portion of the Timing Calculator window gives minimum, maximum, and average values for all Memory Write transactions during the timing period. For example, minimum throughput is throughput of the Memory Write transaction that passes the least amount of data. Maximum throughput is throughput of the Memory Write transaction that passes the most amount of data. Average throughput is the average calculated for all Memory Write transactions during the timing period.
278
Summit T3‐8 PCI Express Multi‐Lane Protocol Analyzer User Manual
Timing and Bus Usage Calculations
Teledyne LeCroy Corporation
Response Time: The time it took to transmit this Memory Write on the PE link, from the beginning of the first packet in the Memory Write to the end of the last packet in the Memory Write.
Throughput: The Memory Write payload divided by response time, expressed in megabytes per second.
Summit T3‐8 PCI Express Multi‐Lane Protocol Analyzer User Manual
279
Teledyne LeCroy Corporation
PCIe SSD Base Address Mapping
10.23 PCIe SSD Base Address Mapping
In order for NVMe, PQI, AHCI, ATA, SOP and SCSI decoding to work correctly, the PCIe Protocol Suite software needs to know the Memory Base Address of the device. In cases when Base Address assignment is recorded in the trace, the software will determine all the values automatically. If the Base Address assignment is not present in the trace, you can specify the values manually using this dialog. You need to select the type of the device (NVMe, PQI, AHCI, ATA, SOP or SCSI) and set the value of the Base Address by selecting Tools > PCIe SSD Base Address Mapping. The PCIe SSD Configuration dialog displays (see Figure 10.41 on page 283).
Note: From software release 6.63 onwards, users are able to decode NVMe/PQI traces which are lacking configuration space and administration information, from release 6.70 this is applicable to AHCI traces, from release 7.00 this is applicable to ATA traces and from release 7.10 this is applicable to SOP and SCSI traces. Note: From software release 7.30 onwards, multiple NVMe devices can be decoded from the same trace.
Note: From software release 7.34 onwards, the SSD Dialog displays the Device Name as read in the configuration accesses.
Follow the steps below to perform the applicable storage decoding:
1. Record the trace for NVMe, PQI, AHCI, ATA, SOP or SCSI device boot and decode it. This saves the configuration space and administration information in .xml format, which is used to decode traces with only IO commands.
2. Record the trace of the same NVMe, PQI, AHCI, ATA SOP or SCSI device without rebooting and the application will decode it. You can keep recording and decoding until rebooting. On reboot repeat steps 1 and 2 above.
10.23.1
NVMe PCIe SSD Device Configuration
The PCIe SSD Configuration dialog is used to add missing information to decode the trace without the configuration space and queue administration information. See Figure 10.41 on page 283 for NVMe PCIe SSD Device Configuration. Prior to decoding, if all the required information is available in Configuration Space then the Source field in the PCIe SSD Configuration will be set to "Config Space" (see Figure 10.41 on page 283). The description for important fields and buttons are given below:
1. DEVICE ID: Represents the device ID in the bus/device/function address from the PCIe specification (ID Based routing).
2. DEVICENAME: Device Name
3. MBAR: The MBAR field in this dialog is required and editable. Make sure that the information entered is correct. Click on any field and the description displays in the 280
Summit T3‐8 PCI Express Multi‐Lane Protocol Analyzer User Manual
PCIe SSD Base Address Mapping
Teledyne LeCroy Corporation
bottom read‐only box. The 64‐bit main address bar (i.e. BAR1:BAR0). Without this value decoding cannot be done. It should be in "0x" hex format.
4. BAR2: 5. PROTOCOL: Displays the current storage protocol decoded.
6. ASQS: Defines the size of the Admin Submission Queue in entries. Refer to the controller registers section of the NVMe specification. The minimum size of the Admin Submission Queue is two entries. The maximum size of the Admin Submission Queue is 4096 entries. This is a 0’s based value.
7. ACQS: Defines the size of the Admin Completion Queue in entries. Refer to the controller registers section of the NVMe specification. The minimum size of the Admin Completion Queue is two entries. The maximum size of the Admin Completion Queue is 4096 entries. This is a 0’s based value. 8. DSTRD: This register indicates the stride between doorbell registers. The stride is specified in bytes. This may be used to separate doorbells by a number of bytes in memory space. It may be useful in software emulation of an NVMe Express controller. For hardware implementations of NVMe Express, the expected doorbell stride value is 4.
9. LBASIZE: Size for Logical Block Addressing.
10. MPS: This field indicates the host memory page in bytes.
11. IOCQES: I/O Completion Queue Entry Size. This field defines the I/O Completion Queue entry size that is used for the selected I/O Command Set. The required and maximum values for this field are specified in the Identify Controller data structure for each I/O Command Set. The value is in bytes and is specified as a power of two (2^n).
12. IOSQES: I/O Submission Queue Entry Size. This field defines the I/O Submission Queue entry size that is used for the selected I/O Command Set. The required and maximum values for this field are specified in the Identify Controller data structure for each I/O Command Set. The value is in bytes and is specified as a power of two (2^n).
13. MQES: Maximum Queue Entries Supported. Defines the maximum individual queue size that the controller supports. This is a 0’s based value. The minimum value is 1h, indicating two entries.
14. Source: Source of the data.
15. Queues: Under this node the user can add more missing nodes to decode the current trace. Click the Add Queue or Delete Queue button to add or delete a queue node. Type based on the user selection. 16. XML Schema File Path: Selecting this link pops up a window with the location of the XML Schema File. It is also available in TechBrief_Use_of_NVMe_xml_schema.pdf in the installation AppNotes\ directory (or installation DVD).
17. Import Config Info: Click to Import configuration information.
18. Export Config Info: Click to Export configuration information.
19. Add Device/Delete Device: Click to add/delete device (NVMe/PQI only).
20. Add Queue/Delete Queue: Click to add/delete queue (NVMe/PQI only).
Summit T3‐8 PCI Express Multi‐Lane Protocol Analyzer User Manual
281
Teledyne LeCroy Corporation
PCIe SSD Base Address Mapping
21. Add Namespace/Delete Namespace: Click to add/delete a new namespace if this information is not present in a trace file (NVMe/PQI only). 22. Interrupt Vector: Add/Delete an Interrupt Vector to a selected Device (see “Interrupts” on page 284).
23. Re‐Decode: Click to re‐decode.
24. Reset: Click to reset.
25. OK: Click to accept the settings.
26. Cancel: Click to cancel the settings.
282
Summit T3‐8 PCI Express Multi‐Lane Protocol Analyzer User Manual
PCIe SSD Base Address Mapping
Teledyne LeCroy Corporation
16
1
17
2
18
3
4
19
5
6
20
7
8
9
21
10
11
12
22
13
14
23
15
24
25
26
Figure 10.41: PCIe SSD Configuration Dialog Pre-decoding
Select any of the options in the
drop down menu item to decode the trace and select Tools > PCIe SSD Base Address Mapping (see Figure 10.43).
Note: When opening a trace file created with 7.0X or older versions of PCIe Protocol Suite, these new fields are not present and the application tries to export the configuration information to XML before decoding NVMe transaction level. In this case a message box will show claiming that a value for this field is required. Note: In case of problems when opening older traces try the following: a) Decode NVMe transaction level before exporting XML file. This will apply the default value for the new fields and export can be performed. b) Manually enter the values for the new fields. c) In case the trace contains submission entries which are not decoded, add a new Queue and set the corresponding address in the PCIe SSD Configuration dialog.
Summit T3‐8 PCI Express Multi‐Lane Protocol Analyzer User Manual
283
Teledyne LeCroy Corporation
PCIe SSD Base Address Mapping
Interrupts
MSI and MSI‐x interrupts are decoded at configuration time and include the vector offset and address. These values can be added/deleted/modified by the user to add data that may not have been captured in the trace.
Figure 10.42: MSI and MSI-x Interrupts
10.23.2 AHCI PCIe SSD Device Configuration
The PCIe SSD Configuration dialog is used to add missing information to decode the trace without the configuration space and queue administration information. See Figure 10.43 for AHCI PCIe SSD Device Configuration. Prior to decoding if every thing is available in Configuration Space then Source equals Config Space (see Figure 10.43).
284
Summit T3‐8 PCI Express Multi‐Lane Protocol Analyzer User Manual
PCIe SSD Base Address Mapping
Teledyne LeCroy Corporation
Figure 10.43: AHCI PCIe SSD Configuration Dialog
The MBAR field in this dialog is required and editable. Make sure that the information entered is correct. Click on any field and the description displays in the bottom read‐only box (see Figure 10.45 on page 288). Some important fields are described below:
Device: There is only one device node, (support for multiple device trace decod‐
ing will be available in a later release). If there is no device node, then the user can add a device node by clicking the Add Device button.
MBAR: The 64‐bit main address bar (i.e. BAR1:BAR0). Without this value decod‐
ing cannot be done. It should be in "0x" hex format.
Ports: Under this node the user can add more missing nodes to decode the cur‐
rent trace. Click the Add port or Delete Port button to add or delete a port node. Enter CLB, CLBU and FB, FBU address fields. The address is 32 bit and should be in "0x" hex format. Please use the right value for size as it is an important attri‐
bute. Consult the AHCI specifications for the correct value. Summit T3‐8 PCI Express Multi‐Lane Protocol Analyzer User Manual
285
Teledyne LeCroy Corporation
PCIe SSD Base Address Mapping
Clicking the Re‐Decode button erases the current configuration from this dialog box and attempts to re‐decode based on the information present in the open trace and/or saved on the disk with the last decode.
Click the Import Config Info button to import the configuration information as an .xml file, instead of adding it individually. Click the hyper‐link XML Schema File Path to access the required format to generate the .xml file. This schema provides the detailed format for the imported file. All modern languages are equipped to generate an .xml file on a specific xml schema. The driver software accepts this schema and generates the .xml file with all the required information.
Click the Export Config Info button to export the configuration information as an .xml file.
Click the Reset button to reset the values to the original values. Press the OK button to save all the values.
Note: When opening a trace file created with 7.0X or older versions of PCIe Protocol Suite, these new fields are not present and the application tries to export the configuration information to XML before decoding NVMe transaction level. In this case a message box will show claiming that a value for this field is required. Note: In case of problems opening older traces try the following: a) Decode NVMe transaction level before exporting XML file. This will apply the default value for the new fields and export can be performed. b) Manually enter the values for the new fields.
10.23.3 PQI PCIe SSD Device Configuration
The PCIe SSD Configuration dialog is used to add missing information to decode the trace without the configuration space and queue administration information. See Figure 10.44 on page 287 for PQI PCIe SSD Device Configuration. Prior to decoding if every thing is available in Configuration Space then Source equals Config Space (see Figure 10.44 on page 287).
286
Summit T3‐8 PCI Express Multi‐Lane Protocol Analyzer User Manual
PCIe SSD Base Address Mapping
Teledyne LeCroy Corporation
Figure 10.44: PQI PCIe SSD Configuration Dialog Pre-decoding
All the fields in this dialog are required and editable. Make sure that the information entered is correct. Click on any field and the description displays in the bottom read‐only box (see Figure 10.45). Some important fields are described below:
Device: There is only one device node, (support for multiple device trace decod‐
ing will be available in a later release). If there is no device node, then
the user can add a device node by clicking the Add Device button. You can choose the spec revision from the drop down list.
MBAR: The 64‐bit main address bar (i.e. BAR1:BAR0). Without this value decoding cannot be done. It should be in "0x" hex format.
Queues: Under this node the user can add more missing nodes to decode the Summit T3‐8 PCI Express Multi‐Lane Protocol Analyzer User Manual
287
Teledyne LeCroy Corporation
PCIe SSD Base Address Mapping
current trace. Click the Add Queue or Delete Queue button to add or delete a queue node. Type based on the user selection. The following Node types are known.
Figure 10.45: Node Types
The address is 64‐bit and should be in "0x" hex format. Please use the right value for each size as it is an important attribute. Consult the NVMe specifications for the correct value. Clicking the Re‐Decode button erases the current configuration from this dialog box and attempts to re‐decode based on the information present in the open trace and/or saved on the disk with the last decode.
Click button to decode the trace and select Tools > PCIe SSD Base Address Mapping.
The two figures below show the BAR information for PQI and AHCI. If this information is present in the trace then it is not editable, otherwise it can be edited. Decoding is done only when configuration space and administration information is available.
Note: Only one device should be marked with the appropriate BAR, multiple BARs do not work.
10.23.4 SOP and SCSI PCIe SSD Device Configuration
The PCIe SSD Configuration dialog is used to add missing information to decode the trace without the configuration space and queue administration information. See Figure 10.46 on page 289 for SOP and SCSI PCIe SSD Device Configuration. T he base is the same as PQI Device Configuration but you can additionally choose the SCSI Command Set.
Prior to decoding if every thing is available in Configuration Space then Source equals Config Space (see Figure 10.46 on page 289).
288
Summit T3‐8 PCI Express Multi‐Lane Protocol Analyzer User Manual
Running Verification Scripts
Teledyne LeCroy Corporation
Figure 10.46: PCIe SSD Configuration Dialog - SOP and SCSI
See “Example of XML File Format for SSD Decodes” on page 309 for a template of the XML files.
10.24 Running Verification Scripts
You can run verification scripts to check errors, link transactions, split transactions, metrics, ordered sets, replays, DLLPs, and TLPs.
To display the Verification Script dialog (see Figure 10.47 on page 290), select Tools > Run verification scripts
or click the icon.
Summit T3‐8 PCI Express Multi‐Lane Protocol Analyzer User Manual
289
Teledyne LeCroy Corporation
Running Verification Scripts
Figure 10.47: Verification Scripts Dialog
The available verification scripts are in the Verification script section.
To run a script, select it, then click the Run Scripts button .
The results appear in the bottom window. You can expand or collapse this window. You find a view related to the CATC Trace and place this window under or to the right of it. You can Save the results.
Click the Settings button to display the Settings Dialog (see Figure 10.48 on page 291).
290
Summit T3‐8 PCI Express Multi‐Lane Protocol Analyzer User Manual
Running Verification Scripts
Teledyne LeCroy Corporation
Figure 10.48: Settings Dialog
You can choose the editor, display settings, and saving settings.
Summit T3‐8 PCI Express Multi‐Lane Protocol Analyzer User Manual
291
Teledyne LeCroy Corporation
10.24.1
Running Verification Scripts
NVMe Performance: Doorbell Timing
You can run verification scripts to determine Doorbell performance, see Figure 10.49.
The Doorbell statistics include:
SQdoorbell to CQdoorbell, (time from Submission Doorbell to Completion Doorbell)
SQDoorbell to CQentry, (time from SQ doorbell to command completion)
SQentry to CQentry, (time from submission command to command completion
Figure 10.49: NVMe Performance Script Verification
292
Summit T3‐8 PCI Express Multi‐Lane Protocol Analyzer User Manual
Trace Expert
Teledyne LeCroy Corporation
10.25 Trace Expert
Trace Expert is a reporting tool that is used to create a portable, customized summary and report of a PCI express trace. The generated report groups the selected data and statistics into four groups:
Performance Analysis
Trace Analysis Statistics
Error Reports
Trace File Information
After a Trace has been loaded, Trace Expert is available from the Main Toolbar as shown in Figure 10.50.
Figure 10.50: Main Toolbar: Trace Expert
To launch the Trace Expert dialog click on the icon. Different report sections can be selected for inclusion into the final report using the dialog. The path where the report will be generated can be set at the bottom of the dialog (see Figure 10.51). Any additional decoding required to generate the report will be done automatically.
Figure 10.51: Trace Expert Report Types and Path
Summit T3‐8 PCI Express Multi‐Lane Protocol Analyzer User Manual
293
Teledyne LeCroy Corporation
Trace Expert
The generated report (see Figure 10.52) has sections which can be expanded to show the associated data. The generated file is self‐contained and portable so it can be safely emailed or archived. It will open automatically in the default browser once it is successfully generated. Icons on the top right can be used to:
Save All (Saves to User’s Download folder)
Expand All
Collapse All
Print All of the currently displayed view.
Save All
Expand All
Collapse All
Print All
Figure 10.52: Trace Expert Main Menu
Select Performance Analysis to bring up the respective dialog (see Figure 10.53 on page 295):
294
Summit T3‐8 PCI Express Multi‐Lane Protocol Analyzer User Manual
Trace Expert
10.25.1
Teledyne LeCroy Corporation
Performance Analysis
Figure 10.53: Trace Expert - Performance Analysis
You can scroll down to see the other reports.
Summit T3‐8 PCI Express Multi‐Lane Protocol Analyzer User Manual
295
Teledyne LeCroy Corporation
Trace Expert
NVMe Performance
Queue Time Metrics are shown under NVMe Performance. See Figure 10.54.
Figure 10.54: NVMe Performance: Queue Time Metrics
10.25.2
Trace Analysis Statistics
Selecting Trace Analysis Statistics will produce the following reports:
Overall/Gross Statistics
Packet Statistics
Link Transaction Analysis
PCIe Transfer Analysis
Virtual Channel Analysis
NVMe Analysis
SATA‐Express Analysis
See Figure 10.55 on page 297.
296
Summit T3‐8 PCI Express Multi‐Lane Protocol Analyzer User Manual
Trace Expert
Teledyne LeCroy Corporation
Figure 10.55: Trace Expert: Trace Analysis Statistics Reports
Selecting specific reports and clicking on OK will bring up the following dialog (see Figure 10.56 on page 298):
Summit T3‐8 PCI Express Multi‐Lane Protocol Analyzer User Manual
297
Teledyne LeCroy Corporation
Trace Expert
Figure 10.56: Trace Expert: Trace Analysis Statistics: Packet Statistics
You can scroll down to see the other reports and analysis.
10.25.3
Error Reports
Selecting Error Reports generates the following reports:
PCIe Error Analysis
NVMe Error Analysis
SATA‐Express Error Analysis
See Figure 10.57 on page 299.
298
Summit T3‐8 PCI Express Multi‐Lane Protocol Analyzer User Manual
Trace Expert
Teledyne LeCroy Corporation
Figure 10.57: Trace Analysis: Error Reports
Selecting specific reports and clicking OK will bring up the following dialog (see Figure 10.58 on page 300):
Summit T3‐8 PCI Express Multi‐Lane Protocol Analyzer User Manual
299
Teledyne LeCroy Corporation
Trace Expert
Figure 10.58: Trace Expert: Error Reports
You can scroll down to see the other reports and analysis.
10.25.4
Trace File Information
Selecting Trace File Information will generate the following reports:
File Information
Hardware Information
Recording Options
License Information
See Figure 10.59 on page 301.
300
Summit T3‐8 PCI Express Multi‐Lane Protocol Analyzer User Manual
Trace Expert
Teledyne LeCroy Corporation
Figure 10.59: Trace Expert: Trace File Information
Selecting specific reports and clicking on OK will bring up the following dialog (see Figure 10.60):
Summit T3‐8 PCI Express Multi‐Lane Protocol Analyzer User Manual
301
Teledyne LeCroy Corporation
Trace Expert
Figure 10.60: Trace Expert: Trace Information
Scroll down to see the other reports and information.
302
Summit T3‐8 PCI Express Multi‐Lane Protocol Analyzer User Manual
Chapter 11
Updates and Licensing
11.1
Updating the Analyzer
BusEngine™ and/or Firmware updates are now automatic processes that run anytime a new version of the PCIe Protocol Suite™ software is installed that is incompatible with the currently installed BusEngine or Firmware. The update process generates onscreen instructions.
If, however, you need to manually perform BusEngine or Firmware updates, follow these steps:
1. Select Setup > Update Device … from the menu to display the Update Analyzer dialog box for Summit T3‐8. 2. Select the appropriate file locations for the Firmware and/or BusEngine, using Browse, if necessary. 3. Check the appropriate options (if in doubt, check all options).
4. Click Update to initiate the updating of the Analyzer.
11.2
License Keys
A License Key is necessary to enable software maintenance. If you attempt to record with the Analyzer without an installed License Key, a message appears to indicate that a License Key is necessary in order to record traffic.
A License Key must be obtained from Teledyne LeCroy for each Analyzer.
After you obtain the License Key, follow these steps to install it:
1. Select Setup > All Connected Devices and click the Update License button to display the Select License Key File dialog box.
2. Enter the path and filename for the License Key or use the Browse button to navigate to the directory that contains the License Key. 3. Select the .lic file, and then click Update Device.
11.3
License Information
You can view Licensing information for your Analyzer by selecting Help > Display License Information... from the menu bar. The License Information window displays data about the maintenance expiration and purchased features. Summit T3‐8 PCI Express Multi‐Lane Protocol Analyzer User Manual
303
Teledyne LeCroy
304
License Information
Summit T3‐8 PCI Express Multi‐Lane Protocol Analyzer User Manual
Appendix A
Configuration Space Decoding
The decoded capability structures in the Configuration Space Viewer and Editor are based on programmed definitions in the PCIe Protocol Suite software and on Configuration Space Decode Scripts.
Configuration Space Decode Scripts are tools to define capability structures and instruct the Configuration Space Viewer or Editor how to decode them. These scripts are in the \CfgSpaceScripts sub‐directory below the \Scripts directory in the application directory.
You can write Configuration Space Decode Scripts using the CATC Scripting Language (CSL). See the Teledyne LeCroy Analyzers File Based Decoding Manual for reference.
PCI Express Configuration Space Decode Scripts have the file extension .pecfgdec.
12.1
Mandatory Definitions
Configuration Space Decode Scripts must set the following reserved variables.
12.2
CapabilityName: Name of the capability structure
CapabilityID: ID of the capability structure
ExtAddSpace: Set to 1 if Extended Configuration Space. Else, set to 0 for PCI.
Mandatory Module Functions
Modules are collections of functions and data dedicated to decoding a specific capability structure. Each module has one primary Configuration Space Decode Script file (extension .pecfgdec) and optionally has include files (.inc).
A module function is an entry‐point into a decoding module. To help display a capability structure, the application calls a module function.
The Configuration Space Editor and Viewer support only the DecodeRegister(offset) and GetSize( ) functions.
12.2.1
DecodeRegister(offset)
The application calls this function while decoding a specific DWORD offset of the specified CapabilityID. The offset is the decoding entry point, where the decoding path starts. Summit T3‐8 PCI Express Multi‐Lane Protocol Analyzer User Manual
305
Teledyne LeCroy
Configuration Register Types
The Configuration Space Editor calls this function to determine how to decode the assigned configuration space. The offset parameter is the DWORD to decode. An offset of 0 indicates bytes 00h‐03h, an offset of 1 indicates bytes 04h‐07h, and so on.
Note: The Configuration Space Editor can only decode one DWORD at a time.
12.2.2
GetSize()
This function returns the size of the capability structure specified by CapabilityID.
12.3
Configuration Register Types
The following reserved variables are defined global constants.
CFGREG_UNDEFINED
CFGREG_HWINIT
CFGREG_RO
CFGREG_RW
CFGREG_RW1C
CFGREG_ROS
CFGREG_RWS
CFGREG_RW1CS
CFGREG_RSVDP
CFGREG_RSVDZ
Note: These reserved variables match the Configuration Register Types of Table 7‐2 in Section 7.4 of the PCI Express Base Specification, Rev. 2.1.
12.4
Primitives
Decoding uses the following primitives.
12.4.1
GetRegisterField
GetRegisterField(dword_offset, bit_offset, field_length)
This function returns a register field of length field_length, starting at bit position bit_offset in DWORD dword_offset.
dword_offset: DWORD offset of the register field location
bit_offset: Bit offset of the register field location
field_length: Length of the register field
For example, GetRegisterField(1, 9, 2); means: Go to DWORD 1, bit offset 9, and returns 2 bits.
306
Summit T3‐8 PCI Express Multi‐Lane Protocol Analyzer User Manual
Primitives
Teledyne LeCroy
12.4.2
AddField
AddField(field_name, field_length, configuration_reg_type, tooltip, encoding_table = NULL)
This function adds a register field to the Capability View and returns a pointer to the field, for adding subfields.
field_name: Name of the register field to display in the Capability View
field_length: Length of the register field
configuration_reg_type: Configuration register type of the register field. Note: If subfields are defined, their configuration register types override this set‐
ting for their specified bits.
tooltip: Tooltip displayed for the register field in the Capability View
encoding_table: Optional. Displays encodings as lists for select values.
For example, user input becomes a combo box for the field in the Field View.
As examples: AddField("PCI Express Extended Capability ID", 16, CFGREG_RO, "");
means: Add the field “PCI Express Extended Capability ID” with length 16 and cfg register type CFGREG_RO.
capability_reg = AddField("Capability Register", 32, CFGREG_RW, "");
means: Added the field “Capability Register” with length 32 and cfg register type CFGREG_RW and stored a pointer to this field in variable capability_reg, which can be used to add subfields to this field.
12.4.3
AddSubField(
AddSubField(parent_field, subfield_name, subfield_length, configuration_reg_type, tooltip, encoding_table = NULL);
This function adds a subfield to a register field in the Capability View. Subfields are modifiable and visible in the Field View and appear in the tooltips of register fields.
parent_field: Pointer to a register field in the Capability View
subfield_name: Name of the subfield, displayed in the Field View
subfield_length: Length of the subfield
configuration_reg_type: Configuration register type of the subfield field. Note: This overrides the configuration_reg_type of the parent field.
tooltip: Tooltip displayed for the subfield in the Capability View
encoding_table: Optional. Displays encodings as lists for select values.
For example, user input becomes a combo box for the field in the Field View.
For example, AddSubField(capability_reg, "Mode Supported", 4, CFGREG_RO, "Indicates the Function modes," ), ModeEncodings);
means: Add the subfield “Mode Supported” to the parent field “capability_reg” with length 4, type CFGREG_RO, a tooltip in the Capability View, and a combo box displaying “mode encodings” for input in the Field View.
Summit T3‐8 PCI Express Multi‐Lane Protocol Analyzer User Manual
307
Teledyne LeCroy
12.5
Helper File
Helper File
ConfigSpaceCommon.inc include file contains useful functions for script decoding.
308
Summit T3‐8 PCI Express Multi‐Lane Protocol Analyzer User Manual
Appendix B
Example of XML File Format for SSD Decodes
<DEVICES XML_FORMAT_VERSION="1.0"> <DEVICE ENABLE="0x1" VENDORID="0" CLASSCODE="67586" GUID="{9C9654A1‐B693‐4F30‐912F‐
125059814C42}" DEVICEID="000:00:0"> <BARS> <MBAR ID="0" VALUE="0xF0000000"/> <BAR ID="2" VALUE="0x00000000"/> <BAR ID="3" VALUE="0x00000000"/> <BAR ID="4" VALUE="0x00000000"/> <BAR ID="5" VALUE="0x00000000"/> </BARS> <PROTOCOL ASQS="64" DSTRD="4" ACQS="16" LBASIZE="512" PROTOCOL="NVME" MPS="4096" ADDEDBY="DECODING"/> <Queues> <Queue SIZE="10" QID="2" TYPE="IOSQ" ADDRESS="0x11B210300" ADDEDBY="DECODING"/> <Queue SIZE="10" QID="3" TYPE="IOSQ" ADDRESS="0x11B210340" ADDEDBY="DECODING"/> <Queue SIZE="10" QID="5" TYPE="IOSQ" ADDRESS="0x11B210380" ADDEDBY="DECODING"/> <Queue SIZE="10" QID="7" TYPE="IOSQ" ADDRESS="0x11B2103C0" ADDEDBY="DECODING"/> <Queue SIZE="10" QID="9" TYPE="IOSQ" ADDRESS="0x11B210400" ADDEDBY="DECODING"/> <Queue SIZE="10" QID="11" TYPE="IOSQ" ADDRESS="0x11B210E80" ADDEDBY="DECODING"/> <Queue SIZE="10" QID="14" TYPE="IOSQ" ADDRESS="0x11B210E40" ADDEDBY="DECODING"/> <Queue SIZE="10" QID="16" TYPE="IOSQ" ADDRESS="0x11B210E00" ADDEDBY="DECODING"/> <Queue SIZE="10" QID="6" TYPE="IOSQ" ADDRESS="0x11B233040" ADDEDBY="DECODING"/> <Queue SIZE="10" QID="8" TYPE="IOSQ" ADDRESS="0x11B233080" ADDEDBY="DECODING"/> <Queue SIZE="10" QID="10" TYPE="IOSQ" ADDRESS="0x11B233B40" ADDEDBY="DECODING"/> <Queue SIZE="10" QID="12" TYPE="IOSQ" ADDRESS="0x11B233B00" ADDEDBY="DECODING"/> <Queue SIZE="10" QID="13" TYPE="IOSQ" ADDRESS="0x11B233AC0" ADDEDBY="DECODING"/> <Queue SIZE="10" QID="15" TYPE="IOSQ" ADDRESS="0x11B233A80" ADDEDBY="DECODING"/> <Queue SIZE="10" QID="17" TYPE="IOSQ" ADDRESS="0x11B233A40" ADDEDBY="DECODING"/> <Queue SIZE="10" QID="1" TYPE="IOSQ" ADDRESS="0x11B25F080" ADDEDBY="DECODING"/> <Queue SIZE="10" QID="4" TYPE="IOSQ" ADDRESS="0x11B28B040" ADDEDBY="DECODING"/> Summit T3‐8 PCI Express Multi‐Lane Protocol Analyzer User Manual
309
Teledyne LeCroy
<Queue SIZE="10" QID="3" TYPE="IOCQ" ADDRESS="0x11B2200C0" ADDEDBY="DECODING"/> <Queue SIZE="10" QID="5" TYPE="IOCQ" ADDRESS="0x11B2200E0" ADDEDBY="DECODING"/> <Queue SIZE="10" QID="7" TYPE="IOCQ" ADDRESS="0x11B2200F0" ADDEDBY="DECODING"/> <Queue SIZE="10" QID="9" TYPE="IOCQ" ADDRESS="0x11B220100" ADDEDBY="DECODING"/> <Queue SIZE="10" QID="11" TYPE="IOCQ" ADDRESS="0x11B2203A0" ADDEDBY="DECODING"/> <Queue SIZE="10" QID="14" TYPE="IOCQ" ADDRESS="0x11B220390" ADDEDBY="DECODING"/> <Queue SIZE="10" QID="16" TYPE="IOCQ" ADDRESS="0x11B220380" ADDEDBY="DECODING"/> <Queue SIZE="10" QID="6" TYPE="IOCQ" ADDRESS="0x11B243010" ADDEDBY="DECODING"/> <Queue SIZE="10" QID="8" TYPE="IOCQ" ADDRESS="0x11B243020" ADDEDBY="DECODING"/> <Queue SIZE="10" QID="10" TYPE="IOCQ" ADDRESS="0x11B2432D0" ADDEDBY="DECODING"/> <Queue SIZE="10" QID="12" TYPE="IOCQ" ADDRESS="0x11B2432C0" ADDEDBY="DECODING"/> <Queue SIZE="10" QID="13" TYPE="IOCQ" ADDRESS="0x11B2432B0" ADDEDBY="DECODING"/> <Queue SIZE="10" QID="15" TYPE="IOCQ" ADDRESS="0x11B2432A0" ADDEDBY="DECODING"/> <Queue SIZE="10" QID="16" TYPE="IOCQ" ADDRESS="0x11B243290" ADDEDBY="DECODING"/> <Queue SIZE="10" QID="1" TYPE="IOCQ" ADDRESS="0x11B26F020" ADDEDBY="DECODING"/> <Queue SIZE="10" QID="2" TYPE="IOCQ" ADDRESS="0x11B26F030" ADDEDBY="DECODING"/> <Queue SIZE="10" QID="4" TYPE="IOCQ" ADDRESS="0x11B29B010" ADDEDBY="DECODING"/> </Queues> </DEVICE> </DEVICES> 310
Summit T3‐8 PCI Express Multi‐Lane Protocol Analyzer User Manual
Appendix C
Expandability
14.1 Expandability
You may expand the capacity of the analyzer by daisy‐chaining multiple Summit T3‐16 and Summit T3‐8 analyzers or connect to other Teledyne LeCroy protocol analyzers with the CATC SYNC Expansion Cards (ACC‐EXP‐002‐X). Note: More combinations of analyzers are possible, contact [email protected] for more details.
When purchased with the analyzer, this card is typically installed in the analyzer at the factory but it can be purchased separately. There are both extraction and insertion instructions below depending on which operation you need to perform.
The expansion slot can be located on either the front panel or the rear panel, so the first step is to find the expansion slot. If you are inserting an expansion card see “Installation of Expansion Cards” on page 316. If you are removing an expansion card continue with the steps below.
You can remove expansion cards with two simple tools.
14.1.1
Removal of Expansion Cards
You can remove expansion cards using two tools:
Standard (flat blade) 3/16” screwdriver
Teledyne LeCroy Extraction Tool (part number 230‐0160‐00)
Summit T3‐8 PCI Express Multi‐Lane Protocol Analyzer User Manual
311
Teledyne LeCroy
Expandability
Figure 14.1: Tools needed to Remove the Expansion Cards
To remove an expansion card, follow these steps:
1. Unplug the system from AC power and turn the system so the expansion port is facing you. Note: There are two retaining screws and the holes for the extraction tool that are located on the panel of the expansion card. See Figure 14.2.
Holes in the
Expansion Card
Figure 14.2: Holes in the Expansion Card Panel
2. Using the screwdriver, loosen both retaining screws by rotating them counter‐
clockwise approximately two full turns, until feeling slight resistance. Do not force the retaining screws after two turns.
312
Summit T3‐8 PCI Express Multi‐Lane Protocol Analyzer User Manual
Expandability
Teledyne LeCroy
Figure 14.3: Loosen Retaining Screws on CATC Card
Summit T3‐8 PCI Express Multi‐Lane Protocol Analyzer User Manual
313
Teledyne LeCroy
Expandability
3. Insert the extraction‐tool prongs into the holes in the expansion card panel.
Figure 14.4: Insert Extraction Tool
Note: If the prongs do not slip easily into the holes, use a small nail file or similar device to remove paint from the prongs
4. Rotate the extraction tool to a horizontal position to lock the prongs into place and make a handle.
Figure 14.5: Insertion of Handle/Tool into Expansion Card Panel
5. Using the extraction tool as a handle, gently wriggle the expansion card forward about 1/8”.
314
Summit T3‐8 PCI Express Multi‐Lane Protocol Analyzer User Manual
Expandability
Teledyne LeCroy
6. Repeat step 5 approximately three times, until the card is free from the retaining screws and you can remove the card from the system.
7. Replace the CATC Expansion Card with a blank panel and tighten the retaining screws. See Figure 14.6.
Figure 14.6: Replace Retaining Screws in Blank Panel and Tighten
Summit T3‐8 PCI Express Multi‐Lane Protocol Analyzer User Manual
315
Teledyne LeCroy
14.1.2
Expandability
Installation of Expansion Cards
1. Locate the blank expansion panel on either the front or the rear of the analyzer and then continue with the steps below.
Figure 14.7: Front or Rear of Analyzer: Blank Panel
2. Using a flat bladed screw driver, loosen the two retaining screws.
Figure 14.8: Loosen Retaining Screws from Blank Panel
316
Summit T3‐8 PCI Express Multi‐Lane Protocol Analyzer User Manual
Expandability
Teledyne LeCroy
3. Remove the retaining screws and blank panel, exposing the inside of the analyzer.
Figure 14.9: Rear of Analyzer with Blank Plate Removed
4. Insert the CATC card into the rear of the Analyzer. Gently push on the back panel of the card until you feel the card seat with the internal connector.
Figure 14.10: CATC Card Being Inserted into Rear of Analyzer
Summit T3‐8 PCI Express Multi‐Lane Protocol Analyzer User Manual
317
Teledyne LeCroy
Expandability
5. After the card is seated, tighten the retaining screws.
Figure 14.11: Tighten the Retaining Screws on the CATC Card
6. The CATC card can now be connected to other CATC cards in other analyzers. As decribed in the next section (“Daisy‐Chaining with CATC SYNC Expansion Cards” on page 319).
Figure 14.12: Analyzer with CATC Card Installed
318
Summit T3‐8 PCI Express Multi‐Lane Protocol Analyzer User Manual
Expandability
14.1.3
Teledyne LeCroy
Daisy-Chaining with CATC SYNC Expansion Cards
You may daisy‐chain up to eight analyzer units by connecting the units through the optional CATC SYNC Expansion Card on the analyzer back.
Daisy‐chained analyzer units will have their timestamping, recording, and triggering functions synchronized to +/‐ 100ns. In this example, we daisy‐chain the following analyzers:
Summit T3‐16
Summit T3‐8
Note: More combinations of analyzers are possible, contact [email protected] for more details.
Perform the following steps to connect the CATC Sync ports between two or more analyzers:
1. Make sure to stop any recordings in progress.
Note: You may plug/unplug the sync cable while the analyzer unit is powered on.
2. Connect the female end of the sync cable to the SYNC OUT port of one Analyzer.
3. Connect the male end of the sync cable to the SYNC IN port of the other Analyzer (see Figure 14.13 on page 320.)
4. Repeat steps 2‐3 to connect additional units (up to eight total) as needed.
5. DO NOT create a closed loop from the last unit back to the first unit.
Summit T3‐8 PCI Express Multi‐Lane Protocol Analyzer User Manual
319
Teledyne LeCroy
Expandability
Summit T3‐8
Summit T3‐16
Figure 14.13: An Example of Connecting a Summit T3-8 to a Summit T3-16 Analyzer
320
Summit T3‐8 PCI Express Multi‐Lane Protocol Analyzer User Manual
Appendix D
China Restriction of Hazardous Substances Table
The following tables are supplied in compliance with China's Restriction of Hazardous Substances (China RoHS) requirements:
Summit T3‐8 PCI Express Multi‐Lane Protocol Analyzer User Manual
321
Teledyne LeCroy
322
Summit T3‐8 PCI Express Multi‐Lane Protocol Analyzer User Manual
Appendix E
How to Contact Teledyne LeCroy
Type of Service
Contact
Call for technical support
Fax your questions
US and Canada:
1 (800) 909‐7112
Worldwide:
1 (408) 653‐1260
Worldwide:
1 (408) 727‐6622
Write a letter
Teledyne LeCroy
Protocol Solutions Group
Customer Support
3385 Scott Blvd.
Santa Clara, CA 95054‐3115
USA
Send e‐mail
[email protected]
Visit Teledyne LeCroy’s web
site
teledynelecroy.com/
Tell Teledyne LeCroy
Report a problem to Teledyne LeCroy Support via e‐mail by selecting Help>Tell Teledyne LeCroy from the application toolbar. This requires that an e‐mail client be installed and configured on the host machine.
Summit T3‐8 PCI Express Multi‐Lane Protocol Analyzer User Manual
323
Teledyne LeCroy
324
Summit T3‐8 PCI Express Multi‐Lane Protocol Analyzer User Manual
Index
Symbols
.lic files 303
.opt files 210
.peraw file extension 226
.pex files 51
.rec files 51
+ Packet # button 202
+ sign 218
Bit Tracer mode 3
Bit Tracer Recording 66
BitTracer
color‐coding 214
compressing data view 226
data capture mode 211
data display 214
Data Display toolbar. 214
decoding 221
de‐skewing 213
enabling 211
Errors window 217
expanding data view 226
exporting 225
link configuration 223
logical links 225
markers 216
recording mode 211
report windows 215
saving 226
search 222
Symbol window 218
timing 215
Timing window 217
trigger 212
views 212
zooming 226
Numerics
10b errors 217
10‐bit code format 214
A
Actions Properties Dialog 104
Activity 47
Adding an Attachment 174
address 323
Advanced Hiding Options 28
AHCI level decode 164
All Connected Devices list 56
All Markers Window 181
Analyzer
license 303
update 303
analyzer
testing 48
Analyzer Network Chat Bar command 56
application 7
ATA command level decode 165
Attaching Markers 174
Auto De‐Skew command 214
Auto Run 7
Auto‐Configure Lane Polarity 70
Available Events area 76
74
averaging 266
B
Bandwidth 278
Base Spec 1.0 Rev Compatibility Mode 68
Basic Resource 81
Beep When Trigger Occurs 65
Binary code format 214
blue current‐position indicator 254
Both directions 257
Buffer Size 64
Bus Utilization 237, 278
buttons 239
features 267
metrics 265
pop‐up menu 238
BusEngine update 303
C
calculating time between DWORDs 245
CATC SYNC port 13
CATC Technical Support 323
CATC Trace 2
CATC Trace View 148
CATC Walk Playlist 183
cells 140
resizing 140
states 84
Change Counter Value command 128
Summit T3‐8 PCI Express Multi‐Lane Protocol Analyzer User Manual
325
Teledyne LeCroy
changing
markers 147
Changing the Value of the Counter 123
Changing the Value of the Timer 128
Channel 128
Channels 90
Chat session 56
Chat window 56
Clear Marker command 147
Clocks radio button 170
Collapse Idle 246
Collapse Idle Plus. 246
Collapsible Idle Time 244
collapsing 139
Color Format Hiding tab 201
Color pop‐up menu 203
colors 202
Combining Specified Event Groups 189
Combo box 261
Comma Separated Value files 53
Comment field 146
comment string 145
CompeterID field 260
components 5
Compressed CATC Trace view 147
Configuration Space 259
Configuration Space dialog box 259
Configuration Space Header 261
Configuration Space View 260
configuring
Recording Options 48
connecting 17, 19, 20
interposer data cable 15, 17
contact 323
Continue option 50
Continuous Time Scale 246
Control‐f command 187
controls
Analyzer T3‐8 5
Count action 77
Counters 120
CrossSync Control Panel 4, 36
CSV files 53
current‐position indicator 254
D
daisy‐chain 319
Data Block window 140
data cells 140
Data Field 139
Data Flow command 247
Data Flow window 247
Data Throughput 262, 278
data.pex file 50, 51
decode levels 153
decoding 153
Decoding window 221
default options file 62
default.opt file 210
default.rec file 62
326
Index
Deleting a Counter 124
Deleting a Timer 128
delimiters 254
descrambled format 214
Description String 90
descriptive label 63
Detail View and Spreadsheet View 152
DeviceID field 260
Direction field 189
Disable Descrambling 70
disparity errors 217
Display area 24
Display Configuration Name 201
Display License Information command 303
Display Options 199
command 199
dialog box 199
fFiles 51
loading 209
saving 210
Display Options button 199
DLLP Packet Properties dialog 93
Do not save hidden packets option 52
Downstream 69
Downstream direction 257
Drag an event here to create a new sequence 86
DVD‐ROM 7
DWORDs
timing 245
E
Edit Comment command 55
Edit Marker 180
Edit Marker command 147
Edit Marker for Packet # pop‐up 146
e‐mail 323
Email CATC Support 323
Empty Trace Warning Message 200
Enable Tool tips 200
Error Properties dialog box 92
Error Summary dialog box 229
error types 92
errors
10b 217
disparity 217
Errors pane 253
Errors window 217
ETHERNET 6
Event Groups menu 189
Event Icon Preview 90
Event Navigation 237
Event Trigger recording type 64
events
searching 169
Events report window 219
Event‐specific Settings 90
Exclude option 189
Expand Data command 139
Export command
BitTracer 225
Export to Compressed Archive command 226
Summit T3‐8 PCI Express Multi‐Lane Protocol Analyzer User Manual
Index
exporting 53
F
fax number 323
field
hiding 205
Field Colors tab 202
Field Formats tab 204
file formats 53
File Menu 30
filter 106
Filter action 77
Filter In button 107
Filter Out button 107
Find command 187
Find dialog box 188
Find Next command 194
finding 188
Firmware update 303
First, Prev, Next, and Last buttons 261
Fit to Graph Area 238, 271
Flush option 50
Fonts 201
format
field 204
From packet # field 55
From Packet field 52
front panel 5
Functionality of Markers 171
G
Gen2 PCI Express 16‐lane advanced verification system 1
General tab 59, 199
Generator file format 53
Global State 85
Global State and Sequence States 84
Global State Cell 77
Go To Marker command 170
Go to Marker command 244
Go To menu 186
Go to Packet # 238
Go to Packet command 170
Go to Trigger command 169
Grid Lines 237
Group and Colors column 202, 204
H
header fields 142
Help Menu 43
Hexadecimal vs. Binary tabs 261
Hide 238, 271
Hide buttons 27, 245
Hide Downstream button 28
Hide SKIP and Update FC button 28
Hide Training button 27
Hide Upstream button 28
hiding 205, 206
Idles 245
Teledyne LeCroy
Hierarchy Lines 200
host machine rquirements 5
How to Increment or Reset a Counter 122
How to Set a Counter 121
How to Set a Timer 126
How to Start or Reset a Timer 126
I
Icon Label 90
Idle errors 92
Ignore EDS 70
Ignore Idle Errors 70
information
priority 255
Install component selection 7
interface 7
Interposer 15, 16
interposer
installing 15, 16
interposer data cable
connecting 15, 17
Intersection option 189
K
K/D symbol format 214
Key
License 303
keyboard shortcuts 46
keystrokes 46
L
label 63
lane swizzling 3
Latency 278
Latency Time 262
Launching the CrossSync Control Panel 58
layout 24
LCD Menu Navigation Buttons 5
LCD Menus 5
LeCroy PCIe Protocol Suite command 7
LEDs
Analyzer T3‐8 5
Legend option 254
level hiding 206
Level Hiding tab 205
levels 153
LFSR value 214
license files 303
License Information window 303
License Key 303
licensing information 303
Linear 238, 271
Link Configuration dialog 223
Link level decode 153
Link section 49, 67
Link Settings 67
Link State Dialog 91
Link Tracker
Hiding tab 205
Summit T3‐8 PCI Express Multi‐Lane Protocol Analyzer User Manual
buttons 245
327
Teledyne LeCroy
toolbar 242
Link Tracker window 242
docking 244
markers 244
reformat 243
link training 49
Index
N
navigating 250
Navigating Recording Rules 87
Navigator 250
displaying 250
legend 254
panes 251, 253
range 251, 253
ranges 251
slider 254
toolbar 250
Link Transaction
metrics 265
Link Transaction Level graphs 268
Link Transaction Performance 265
Link Utilization 278
Link Width 68
Link Width pane 253
Load button 62, 209
Load command 62, 209
loading 62, 209
Logarithmic 238, 271
logical links
BitTracer 225
Logical view 221
long format 139
LTSSM Flow Graph 257
LTSSM Flow Graph command 257
M
Main Display Area 243
Main display area 75
Manual Trigger
recording type 64
Markers 171
Adding an Attachment 174
Attachment Types and Visualization 175
Embedded Attachments to a Marker 175
Recording an Audio File 175
Video Files supported 175
markers 145
BitTracer 216
deleting 147
editing 147
setting 145, 244
user‐defined 216
Markers Overview 171
Markers window 216
Memory Writes 265
Memory Writes Performance 278
Menu bar 24
menus 30
pop‐up 140
metrics 261
Bus Utilization 265
Link Transaction 265
Link Transactions 262
Split Transaction 264
Split Transactions 262
trace 262
Traffic Summary 264
unit‐base averaging 266
Metrics Header 262
Metrics Tooltip 263
Microsoft® Windows®‐based host machine 7
Misc 65
Msb ‐> Lsb checkboxes 205
328
Navigator Legend dialog box 255
Navigator Panes button 254
Navigator Range button 253
New Event button 76
New Events button 90
Number of Link Transactions 262
Number of Packets 262
NVMe level decode 155
NVMe PCIe SSD Device Configuration 280
O
opening
program 8
options files 62
Options Name 62
Options Name box 63
Ordered Set Properties Dialog 92
Origin field 189
P
Packet # 202
Packet # field 145
Packet Data command 258
Packet Data window 258
Packet Directionality Cell 145
Packet errors 92
Packet Header bar 258
Packet Header Cell 145
Packet Header command 258
Packet Heading Cell 143
Packet level decode 153
Packet Match Resource 78
Packets report window 219
Packets/second 278
pane checkbox 255
Pattern Format section 223
Payload 262
PCI Express 16‐lane advanced verification system 1
PCI Express Spec 2.0 3
PCIe Protocol Suite SN message 47
PCIe Protocol Suite Summit
components 17, 19, 20
PCIe Protocol Suite T3‐8
opening 8
PHY layer problems 3
Pin Button 90
Playback Window 184
Playlist Functionality 183
Playlist Playback Control 185, 186
Summit T3‐8 PCI Express Multi‐Lane Protocol Analyzer User Manual
Index
Teledyne LeCroy
plus symbol 202, 204
polarity checkbox 224
pop‐up menus 140
Power Switch 5
powering on 15
PQI level decode 167
PQI PCIe SSD Device Configuration 284
Pre/Post Trigger pane 253
Preserve TC to VC mapping across the channels 65
Print command 55
Printer button 55
printing 55
Probe Data Cable 16
program
Recording Type 63
Remove 238
Report Menu 37
Report menu 227
reports 227
Reset Column Widths 244
resizing 140
Resources 78
Response Time 262, 278, 279
Retain Decoded Files 200
riggering 71
Row Selection 237
Run verification scripts command 289
Running Disparity 214
Properties 238, 272
Properties button 90
Properties command 77
Properties dialog 90
Properties dialog box 77, 90
Protocol Level to View 200
protocol unit 261
S
opening 8
R
Save As command 51
Save As Default 62, 210
Save As Default. 62
Save button 210
Save External Interface Signals 65
Save packet range command 52
saving 51, 210
BitTracer 226
range delimiters 254
Raw 10b Codes 141
Read Requests Performance 264
reading 139
Ready message 47
Real‐Time Statistical Monitor window 271
Real‐Time Statistics
buttons 269
pop‐up menu 271
toolbar 269
Real‐Time Statistics window 268
Real‐time Statistics window 272
rear panel 6
Recently Used Ranges 253
Record button 50
Record Menu 36
recorded activity 48
recording 48, 59
stopping 50
Recording button 78
Recording Options
command 59
configuring 48
dialog box 59
files 51
loading 62
saving 62
settings 63
Recording Options command 49
Recording Options‐General Tab 59
recording progress 47
Recording Progress Bar 47
Recording Rules
buttons 75
toolbar 75
Recording Rules Events 87
recording status 47
scrambled format 214
SCSI level decode 168
Search 47
command 169
Search Bwd message 187
search direction 48
Search Direction command 187
Search For menu 189
Search Fwd message 187
Search Menu 37
Search On section 223
Search Order section 223
Search Pattern window 223
Search window
BitTracer 222
searching 169
Seconds radio button 170
selecting components for installation 7
Send command 57
Sequence Cell 77
Sequence State 79, 80, 81, 82, 85, 86
Set Display Options command 202
Set Marker command 146, 244
Set Marker with Text command 216
Set Range Near Packet xxx 253
Set Range to Whole Trace 253
Setting Default Recording Options 62
setting markers 145
Settings button 290
Settings window 290
Setup command 7
Setup Menu 36
short format 139
shortcuts 46
Show Configuration Space for xxxx 260
Show Header Fields command 142
Summit T3‐8 PCI Express Multi‐Lane Protocol Analyzer User Manual
329
Teledyne LeCroy
Show Header Fields dialog box 142
Show Number of Transitions checkbox 257
Show Packet in Raw Trace 225
Show Raw 10b Codes command 141
Simple and Advanced Mode 61
Slot Interposer 15, 16
small triangle 139
Snapshot recording type 64
software 23
installation 7
update 303
SOP and SCSI PCIe SSD Device Configuration 288
SOP level decode 168
Specification view 221
Specify Action command 77
Speed LEDs
Index
BitTracer 215
Timing window 217
Title bar 24
TLP Header Properties dialog box 94
TLP Prefix Properties Dialog 94
To packet # field 55
To Packet field 52
Tool tip Display 244
Toolbar 24, 74
24
Tools Menu 43
Tools menu 227
Tooltips 46
trace
cells 140
exporting 53
files 51
metrics 262
saving 51
5
Split level decode 154
Split Transaction
metrics 264
Split Transaction Level graphs 267
Split Transaction Performance 264, 278
Spreadsheet View 148
StandardSettings.rec file 62
Start menu 7
Statistics Accumulation area 272
Status Bar 47
Status bar 24
Stop button 50
Stop option 50
stopping recording 50
Summit T3‐16 1, 3
Summit T3‐8 5
Summit T3‐8 Analyzer
setting up 9
Summit T3‐8 front panel 5
support 323
Swap Recording Channels 68
Swizzling Config... 70
Symbol window 218
Synchronize Trace View 246
T
Technical Support 323
telephone number 323
testing 48
text files 53
Throughput 278, 279
Tight Columns 237
time between DWORDs 245
Time Coverage 278
Time Stamp 200
time value 245
time‐based averaging 266
Timer 124
Timestamp at the beginning 200
Timing and Bus Usage Calculator 275
Timing Calculations command 275
Timing Calculator dialog box 275
Timing measurement
330
Trace Filename and Path 61
Trace View Mode 200
Trace Viewer 8
traces
searching 169
traffic 139
analyzing 227
Traffic Speed pane 253
Traffic Summary
buttons 236
metrics 264
Traffic Summary window 233
moving to packets 235
Traffic Type pane 253
triangle 139
Trigger action 77
Trigger marker 216
Trigger Position 66
Triggering On (Advanced Mode) 73
Triggering On (Simple Mode) 72
U
Undo Zoom 238, 271
Union option 189
unit 261
unit‐based averaging 266
Update Analyzer dialog 303
Update command 303
Update Device command 303
Update License command 303
updates 303
Upload Size 65
Uploading 47
Upstream 69
Upstream direction 257
Upstream LED 5
USB 6
Use External Reference Clock 69
user‐defined markers 216
Summit T3‐8 PCI Express Multi‐Lane Protocol Analyzer User Manual
Index
Teledyne LeCroy
V
Verification Script dialog box 289
View Data Block command 140, 141
View Menu 40
View Options 246
View Options button 243
View Settings 240
Viewer 8
Viewing Attachments of a Marker 176
W
web site 323
Website, CATC 323
Window Menu 43
Wrap 200
Write Requests Performance 264
Writes Response Time 268
Writes Throughput 268
X
X marker 216
Y
Y marker 216
Y Scale Type 238, 271
yellow range delimiters 254
Z
zoom 243
Zoom Level 200
Zoom to Trace View 238
Summit T3‐8 PCI Express Multi‐Lane Protocol Analyzer User Manual
331
Teledyne LeCroy
332
Index
Summit T3‐8 PCI Express Multi‐Lane Protocol Analyzer User Manual