1
PROTOCOL SOLUTIONS GROUP
3385 SCOTT BLVD
SANTA CLARA, CA 95054
PETracer ML™
PCI Express Multi-Lane Protocol Analyzer
PETrainer ML™
PCI Express Multi-Lane Exerciser
User Manual
For Software Version 6.7x
September 2012
PETracer ML User Manual
Document Disclaimer
The information in this document has been carefully checked and is believed to be
reliable. However, no responsibility can be assumed for inaccuracies that may not have
been detected.
Teledyne LeCroy reserves the right to revise the information in this document without
notice or penalty.
Trademarks and Servicemarks
Teledyne LeCroy, CATC Trace, PCI Express, PETracer Edge, PETracer EML, PETracer
ML, PETracer, PETrainer EML, PETrainer ML, PETracer Summit, Summit T2-16,
Summit Z2-16, Universal Protocol Analyzer System, UPAS, and BusEngine are
trademarks of Teledyne LeCroy.
Microsoft and Windows are registered trademarks of Microsoft Inc.
All other trademarks are property of their respective companies.
Copyright
© 2012 Teledyne LeCroy, Inc. All Rights Reserved.
This document may be printed and reproduced without additional permission, but all
copies should contain this copyright notice.
WEEE Program
Teledyne LeCroy
PETracer ML User Manual
TABLE OF CONTENTS
Section 1. General. . . . . . . . . . . . . . . . . . . . . 1
Chapter 1
Overview . . . . . . . . . . . . . . . . . . . . . . . . . . . . . 3
1.1 PETracer Analyzer Hardware and Software . . . . . . . . . . . . . . . . . . . . . . . . 3
1.2 PETrainer Exerciser Hardware . . . . . . . . . . . . . . . . . . . . . . . . . . . . . . . . . . 5
1.3 CATC Trace Software . . . . . . . . . . . . . . . . . . . . . . . . . . . . . . . . . . . . . . . . . 6
1.4 PETracer ML Analyzer . . . . . . . . . . . . . . . . . . . . . . . . . . . . . . . . . . . . . . . . 7
1.5 PETrainer ML Exerciser . . . . . . . . . . . . . . . . . . . . . . . . . . . . . . . . . . . . . . . 9
1.6 Other Documents . . . . . . . . . . . . . . . . . . . . . . . . . . . . . . . . . . . . . . . . . . . 10
Chapter 2
Hardware Description . . . . . . . . . . . . . . . . . . .11
2.1 System Components . . . . . . . . . . . . . . . . . . . . . . . . . . . . . . . . . . . . . . . . .
2.2 Host Machine Requirements . . . . . . . . . . . . . . . . . . . . . . . . . . . . . . . . . . .
2.3 Universal Protocol Analyzer System (UPAS) . . . . . . . . . . . . . . . . . . . . . .
2.4 Protocol Analyzer Modules . . . . . . . . . . . . . . . . . . . . . . . . . . . . . . . . . . . .
2.5 PETrainer Exerciser . . . . . . . . . . . . . . . . . . . . . . . . . . . . . . . . . . . . . . . . .
2.6 PETracer ML Analyzer LED Descriptions . . . . . . . . . . . . . . . . . . . . . . . . .
2.7 PETrainer ML Exerciser LED Descriptions . . . . . . . . . . . . . . . . . . . . . . . .
2.8 Rear Panel Description . . . . . . . . . . . . . . . . . . . . . . . . . . . . . . . . . . . . . . .
2.9 Specifications for PETracer ML/PETrainer ML . . . . . . . . . . . . . . . . . . . . .
2.10 External Interface Breakout Board . . . . . . . . . . . . . . . . . . . . . . . . . . . . .
Pin-Outs for the Data In/Out Connector . . . . . . . . . . . . . . . . . . . . . . . .
Prototype Rework Area . . . . . . . . . . . . . . . . . . . . . . . . . . . . . . . . . . . . .
Breakout Board Input and Output Signals. . . . . . . . . . . . . . . . . . . . . . .
Chapter 3
11
11
12
12
13
14
15
16
18
21
22
22
23
Installation . . . . . . . . . . . . . . . . . . . . . . . . . . . 25
3.1 Installing the PETracer Software . . . . . . . . . . . . . . . . . . . . . . . . . . . . . . . .
3.2 Setting Up a PETracer Analyzer . . . . . . . . . . . . . . . . . . . . . . . . . . . . . . . .
3.3 Setting Up a PETrainer Exerciser . . . . . . . . . . . . . . . . . . . . . . . . . . . . . . .
3.4 Installing a Dual Analyzer System . . . . . . . . . . . . . . . . . . . . . . . . . . . . . . .
3.5 Networking an Analyzer . . . . . . . . . . . . . . . . . . . . . . . . . . . . . . . . . . . . . .
Setup for IP LAN Use . . . . . . . . . . . . . . . . . . . . . . . . . . . . . . . . . . . . . .
3.6 Browsing to a Networked Analyzer . . . . . . . . . . . . . . . . . . . . . . . . . . . . . .
3.7 Connecting the PETracer ML Analyzer to the Device Under Test. . . . . . .
3.8 Connecting PETrainer ML to the Device Under Test. . . . . . . . . . . . . . . . .
25
27
28
29
29
29
30
31
34
Section 2. PETracer Analyzer Software . . 41
Chapter 4
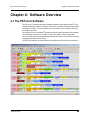
Software Overview . . . . . . . . . . . . . . . . . . . . 43
4.1 The PETracer Software . . . . . . . . . . . . . . . . . . . . . . . . . . . . . . . . . . . . . . .
4.2 Application Layout . . . . . . . . . . . . . . . . . . . . . . . . . . . . . . . . . . . . . . . . . . .
4.3 Using the Toolbar . . . . . . . . . . . . . . . . . . . . . . . . . . . . . . . . . . . . . . . . . . .
Multi-Segment Toolbar . . . . . . . . . . . . . . . . . . . . . . . . . . . . . . . . . . . . .
Traffic Generation Toolbar. . . . . . . . . . . . . . . . . . . . . . . . . . . . . . . . . . .
Toolbar Hide Buttons. . . . . . . . . . . . . . . . . . . . . . . . . . . . . . . . . . . . . . .
Teledyne LeCroy
43
44
45
47
48
49
iii
PETracer ML User Manual
4.4 Using the Menus . . . . . . . . . . . . . . . . . . . . . . . . . . . . . . . . . . . . . . . . . . . .
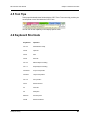
4.5 Tool Tips . . . . . . . . . . . . . . . . . . . . . . . . . . . . . . . . . . . . . . . . . . . . . . . . . .
4.6 Keyboard Shortcuts . . . . . . . . . . . . . . . . . . . . . . . . . . . . . . . . . . . . . . . . . .
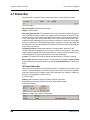
4.7 Status Bar . . . . . . . . . . . . . . . . . . . . . . . . . . . . . . . . . . . . . . . . . . . . . . . . .
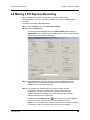
4.8 Making a PCI Express Recording . . . . . . . . . . . . . . . . . . . . . . . . . . . . . . .
4.9 Recording Multi-Segmented CATC Traces . . . . . . . . . . . . . . . . . . . . . . . .
How to Create a Multisegment Recording . . . . . . . . . . . . . . . . . . . . . .
4.10 PETracer Files. . . . . . . . . . . . . . . . . . . . . . . . . . . . . . . . . . . . . . . . . . . . .
CATC Trace Files . . . . . . . . . . . . . . . . . . . . . . . . . . . . . . . . . . . . . . . . .
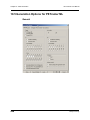
Recording Options Files . . . . . . . . . . . . . . . . . . . . . . . . . . . . . . . . . . . .
Display Options Files . . . . . . . . . . . . . . . . . . . . . . . . . . . . . . . . . . . . . .
4.11 Opening CATC Trace Files . . . . . . . . . . . . . . . . . . . . . . . . . . . . . . . . . . .
4.12 Saving CATC Trace Files . . . . . . . . . . . . . . . . . . . . . . . . . . . . . . . . . . . .
Using the Save As Function . . . . . . . . . . . . . . . . . . . . . . . . . . . . . . . . .
Saving a Portion of a CATC Trace . . . . . . . . . . . . . . . . . . . . . . . . . . . .
4.13 Exporting a CATC Trace File . . . . . . . . . . . . . . . . . . . . . . . . . . . . . . . . . .
4.14 Printing Data Files . . . . . . . . . . . . . . . . . . . . . . . . . . . . . . . . . . . . . . . . . .
4.15 Analyzer Chat Window . . . . . . . . . . . . . . . . . . . . . . . . . . . . . . . . . . . . . .
Chapter 5
Reading CATC Traces . . . . . . . . . . . . . . . . . . 71
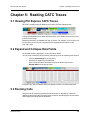
5.1 Viewing PCI Express CATC Traces. . . . . . . . . . . . . . . . . . . . . . . . . . . . . .
5.2 Expand and Collapse Data Fields . . . . . . . . . . . . . . . . . . . . . . . . . . . . . . .
5.3 Resizing Cells . . . . . . . . . . . . . . . . . . . . . . . . . . . . . . . . . . . . . . . . . . . . . .
5.4 Pop-up Menus . . . . . . . . . . . . . . . . . . . . . . . . . . . . . . . . . . . . . . . . . . . . . .
5.5 View Data Block . . . . . . . . . . . . . . . . . . . . . . . . . . . . . . . . . . . . . . . . . . . .
5.6 Show Raw 10b Codes . . . . . . . . . . . . . . . . . . . . . . . . . . . . . . . . . . . . . . . .
5.7 Show Header Fields . . . . . . . . . . . . . . . . . . . . . . . . . . . . . . . . . . . . . . . . .
5.8 Packet Cell Popup Menus . . . . . . . . . . . . . . . . . . . . . . . . . . . . . . . . . . . . .
Packet Header R-> Cell Popup Menu . . . . . . . . . . . . . . . . . . . . . . . . . .
Packet Header G1 Cell Popup Menu . . . . . . . . . . . . . . . . . . . . . . . . . .
5.9 Set Marker . . . . . . . . . . . . . . . . . . . . . . . . . . . . . . . . . . . . . . . . . . . . . . . . .
5.10 Edit or Clear Marker . . . . . . . . . . . . . . . . . . . . . . . . . . . . . . . . . . . . . . . .
5.11 Decoding Traffic. . . . . . . . . . . . . . . . . . . . . . . . . . . . . . . . . . . . . . . . . . . .
Packet . . . . . . . . . . . . . . . . . . . . . . . . . . . . . . . . . . . . . . . . . . . . . . . . . .
Link . . . . . . . . . . . . . . . . . . . . . . . . . . . . . . . . . . . . . . . . . . . . . . . . . . . .
Split . . . . . . . . . . . . . . . . . . . . . . . . . . . . . . . . . . . . . . . . . . . . . . . . . . . .
Chapter 6
71
71
71
72
72
73
74
75
75
76
77
78
79
79
79
79
Searching CATC Traces . . . . . . . . . . . . . . . . 81
6.1 CATC Trace Search Overview. . . . . . . . . . . . . . . . . . . . . . . . . . . . . . . . . .
6.2 Go to Trigger . . . . . . . . . . . . . . . . . . . . . . . . . . . . . . . . . . . . . . . . . . . . . . .
6.3 Go to Packet . . . . . . . . . . . . . . . . . . . . . . . . . . . . . . . . . . . . . . . . . . . . . . .
6.4 Go to Time. . . . . . . . . . . . . . . . . . . . . . . . . . . . . . . . . . . . . . . . . . . . . . . . .
6.5 Go to Marker . . . . . . . . . . . . . . . . . . . . . . . . . . . . . . . . . . . . . . . . . . . . . . .
2. Markers . . . . . . . . . . . . . . . . . . . . . . . . . . . . . . . . . . . . . . . . . . . . . . . . . . . .
Markers Overview . . . . . . . . . . . . . . . . . . . . . . . . . . . . . . . . . . . . . . . . .
Functionality of Markers . . . . . . . . . . . . . . . . . . . . . . . . . . . . . . . . . . . .
Attaching Markers . . . . . . . . . . . . . . . . . . . . . . . . . . . . . . . . . . . . . . . . .
Adding an Attachment. . . . . . . . . . . . . . . . . . . . . . . . . . . . . . . . . . . . . .
5. Recording an Audio File . . . . . . . . . . . . . . . . . . . . . . . . . . . . . . . . . . . . . . .
Video Files supported . . . . . . . . . . . . . . . . . . . . . . . . . . . . . . . . . . . . . .
Attachment Types and Visualization . . . . . . . . . . . . . . . . . . . . . . . . . . .
iv
51
57
57
58
61
63
63
65
65
65
65
66
67
67
67
68
69
70
81
81
81
82
82
83
83
84
86
86
87
87
88
Teledyne LeCroy
PETracer ML User Manual
Embedded Attachments to a Marker. . . . . . . . . . . . . . . . . . . . . . . . . . . 88
Viewing Attachments of a Marker . . . . . . . . . . . . . . . . . . . . . . . . . . . . . 89
Text . . . . . . . . . . . . . . . . . . . . . . . . . . . . . . . . . . . . . . . . . . . . . . . . . . . . 89
Audio . . . . . . . . . . . . . . . . . . . . . . . . . . . . . . . . . . . . . . . . . . . . . . . . . . . 91
Video . . . . . . . . . . . . . . . . . . . . . . . . . . . . . . . . . . . . . . . . . . . . . . . . . . . 92
File Attachment . . . . . . . . . . . . . . . . . . . . . . . . . . . . . . . . . . . . . . . . . . . 92
URL Link . . . . . . . . . . . . . . . . . . . . . . . . . . . . . . . . . . . . . . . . . . . . . . . . 92
YouTube Video . . . . . . . . . . . . . . . . . . . . . . . . . . . . . . . . . . . . . . . . . . . 93
Images . . . . . . . . . . . . . . . . . . . . . . . . . . . . . . . . . . . . . . . . . . . . . . . . . 94
Other Attachments . . . . . . . . . . . . . . . . . . . . . . . . . . . . . . . . . . . . . . . . 94
Edit Marker . . . . . . . . . . . . . . . . . . . . . . . . . . . . . . . . . . . . . . . . . . . . . . 94
All Markers Window . . . . . . . . . . . . . . . . . . . . . . . . . . . . . . . . . . . . . . . 95
6.6 CATC Walk Playlist . . . . . . . . . . . . . . . . . . . . . . . . . . . . . . . . . . . . . . . . . . 97
Playlist Functionality . . . . . . . . . . . . . . . . . . . . . . . . . . . . . . . . . . . . . . . 98
Playback Window . . . . . . . . . . . . . . . . . . . . . . . . . . . . . . . . . . . . . . . . 100
Playlist Playback Controls. . . . . . . . . . . . . . . . . . . . . . . . . . . . . . . . . . 101
6.7 Go To Menu . . . . . . . . . . . . . . . . . . . . . . . . . . . . . . . . . . . . . . . . . . . . . . . 102
6.8 Search Direction . . . . . . . . . . . . . . . . . . . . . . . . . . . . . . . . . . . . . . . . . . . 103
6.9 Find . . . . . . . . . . . . . . . . . . . . . . . . . . . . . . . . . . . . . . . . . . . . . . . . . . . . . 104
Event Groups . . . . . . . . . . . . . . . . . . . . . . . . . . . . . . . . . . . . . . . . . . . 106
6.10 Search for the Next Packet Type. . . . . . . . . . . . . . . . . . . . . . . . . . . . . . 106
Chapter 7
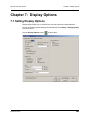
Display Options . . . . . . . . . . . . . . . . . . . . . . 107
7.1 Setting Display Options . . . . . . . . . . . . . . . . . . . . . . . . . . . . . . . . . . . . . .
7.2 Specifying General Display Options . . . . . . . . . . . . . . . . . . . . . . . . . . . .
Analysis Tools Checkboxes. . . . . . . . . . . . . . . . . . . . . . . . . . . . . . . . .
Fonts . . . . . . . . . . . . . . . . . . . . . . . . . . . . . . . . . . . . . . . . . . . . . . . . . .
Configuration Name . . . . . . . . . . . . . . . . . . . . . . . . . . . . . . . . . . . . . .
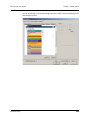
7.3 Color, Format, and Hiding Options . . . . . . . . . . . . . . . . . . . . . . . . . . . . .
Setting Field Colors. . . . . . . . . . . . . . . . . . . . . . . . . . . . . . . . . . . . . . .
Changing Field Formats . . . . . . . . . . . . . . . . . . . . . . . . . . . . . . . . . . .
7.4 Load a Previously Saved Display Options File . . . . . . . . . . . . . . . . . . . .
7.5 Saving Display Options . . . . . . . . . . . . . . . . . . . . . . . . . . . . . . . . . . . . . .
Chapter 8
Recording Options . . . . . . . . . . . . . . . . . . . .117
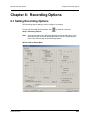
8.1 Setting Recording Options . . . . . . . . . . . . . . . . . . . . . . . . . . . . . . . . . . .
8.2 General Tab . . . . . . . . . . . . . . . . . . . . . . . . . . . . . . . . . . . . . . . . . . . . . . .
Recording Type . . . . . . . . . . . . . . . . . . . . . . . . . . . . . . . . . . . . . . . . . .
Buffer Size. . . . . . . . . . . . . . . . . . . . . . . . . . . . . . . . . . . . . . . . . . . . . .
Target Analyzer . . . . . . . . . . . . . . . . . . . . . . . . . . . . . . . . . . . . . . . . . .
Trigger Position . . . . . . . . . . . . . . . . . . . . . . . . . . . . . . . . . . . . . . . . . .
Trigger On . . . . . . . . . . . . . . . . . . . . . . . . . . . . . . . . . . . . . . . . . . . . . .
Trace Filename and Path . . . . . . . . . . . . . . . . . . . . . . . . . . . . . . . . . .
Options Name . . . . . . . . . . . . . . . . . . . . . . . . . . . . . . . . . . . . . . . . . . .
Save As MultiSegment Trace . . . . . . . . . . . . . . . . . . . . . . . . . . . . . . .
Viewing Multisegmented Files. . . . . . . . . . . . . . . . . . . . . . . . . . . . . . .
Misc. . . . . . . . . . . . . . . . . . . . . . . . . . . . . . . . . . . . . . . . . . . . . . . . . . .
Link for PETrainer ML . . . . . . . . . . . . . . . . . . . . . . . . . . . . . . . . . . . . .
Saving and Loading Previously Saved Recording Options. . . . . . . . .
Setting Default Recording Options . . . . . . . . . . . . . . . . . . . . . . . . . . .
8.3 Recording Rules Overview . . . . . . . . . . . . . . . . . . . . . . . . . . . . . . . . . . .
Global State vs. Sequences . . . . . . . . . . . . . . . . . . . . . . . . . . . . . . . .
Teledyne LeCroy
107
108
108
108
109
109
110
112
116
116
117
118
119
119
120
120
120
120
121
122
122
123
124
126
126
127
128
v
PETracer ML User Manual
8.4 Recording Rules Buttons. . . . . . . . . . . . . . . . . . . . . . . . . . . . . . . . . . . . .
8.5 Creating Recording Rules . . . . . . . . . . . . . . . . . . . . . . . . . . . . . . . . . . . .
8.6 Recording Rule Limits . . . . . . . . . . . . . . . . . . . . . . . . . . . . . . . . . . . . . . .
Configuration Limitations in PETracer ML. . . . . . . . . . . . . . . . . . . . . .
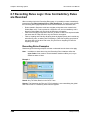
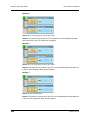
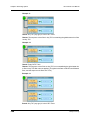
8.7 Recording Rules Logic: How Contradictory Rules are Resolved . . . . . .
Recording Rules Examples. . . . . . . . . . . . . . . . . . . . . . . . . . . . . . . . .
8.8 Properties Dialog Boxes . . . . . . . . . . . . . . . . . . . . . . . . . . . . . . . . . . . . .
8.9 Event Properties Dialog. . . . . . . . . . . . . . . . . . . . . . . . . . . . . . . . . . . . . .
Accessing the Properties Dialog . . . . . . . . . . . . . . . . . . . . . . . . . . . . .
Dialog Settings and Features . . . . . . . . . . . . . . . . . . . . . . . . . . . . . . .
Error Properties Dialog . . . . . . . . . . . . . . . . . . . . . . . . . . . . . . . . . . . .
Actions Properties Dialog . . . . . . . . . . . . . . . . . . . . . . . . . . . . . . . . . .
TLP Header Properties Dialog . . . . . . . . . . . . . . . . . . . . . . . . . . . . . .
TLP Prefix Properties Dialog. . . . . . . . . . . . . . . . . . . . . . . . . . . . . . . .
Payload Properties Dialog. . . . . . . . . . . . . . . . . . . . . . . . . . . . . . . . . .
DLLP Packet Properties Dialog. . . . . . . . . . . . . . . . . . . . . . . . . . . . . .
Ordered Set Properties Dialog . . . . . . . . . . . . . . . . . . . . . . . . . . . . . .
8.10 Counting Events . . . . . . . . . . . . . . . . . . . . . . . . . . . . . . . . . . . . . . . . . .
8.11 Creating a Payload Match . . . . . . . . . . . . . . . . . . . . . . . . . . . . . . . . . . .
8.12 Trigger . . . . . . . . . . . . . . . . . . . . . . . . . . . . . . . . . . . . . . . . . . . . . . . . . .
8.13 Filter In and Filter Out . . . . . . . . . . . . . . . . . . . . . . . . . . . . . . . . . . . . . .
Chapter 9
Reports and Tools . . . . . . . . . . . . . . . . . . . . 153
9.1 File Information . . . . . . . . . . . . . . . . . . . . . . . . . . . . . . . . . . . . . . . . . . . .
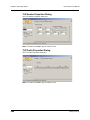
9.2 Error Summary . . . . . . . . . . . . . . . . . . . . . . . . . . . . . . . . . . . . . . . . . . . .
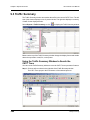
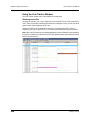
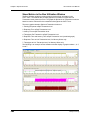
9.3 Traffic Summary . . . . . . . . . . . . . . . . . . . . . . . . . . . . . . . . . . . . . . . . . . .
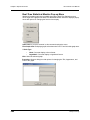
Using the Traffic Summary Window to Search the CATC Trace . . . . .
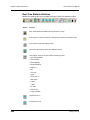
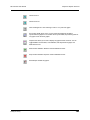
Traffic Summary Buttons. . . . . . . . . . . . . . . . . . . . . . . . . . . . . . . . . . .
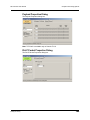
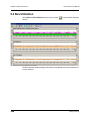
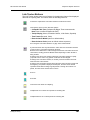
9.4 Bus Utilization . . . . . . . . . . . . . . . . . . . . . . . . . . . . . . . . . . . . . . . . . . . . .
Bus Utilization Pop-up Menu. . . . . . . . . . . . . . . . . . . . . . . . . . . . . . . .
Bus Utilization Buttons . . . . . . . . . . . . . . . . . . . . . . . . . . . . . . . . . . . .
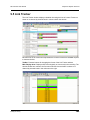
9.5 Link Tracker. . . . . . . . . . . . . . . . . . . . . . . . . . . . . . . . . . . . . . . . . . . . . . .
Using the Link Tracker Window . . . . . . . . . . . . . . . . . . . . . . . . . . . . .
Link Tracker Buttons . . . . . . . . . . . . . . . . . . . . . . . . . . . . . . . . . . . . . .
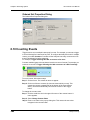
9.6 Data Flow Window. . . . . . . . . . . . . . . . . . . . . . . . . . . . . . . . . . . . . . . . . .
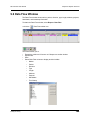
9.7 Using the Trace Navigator. . . . . . . . . . . . . . . . . . . . . . . . . . . . . . . . . . . .
Displaying the Navigator . . . . . . . . . . . . . . . . . . . . . . . . . . . . . . . . . . .
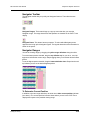
Navigator Toolbar . . . . . . . . . . . . . . . . . . . . . . . . . . . . . . . . . . . . . . . .
Navigator Ranges . . . . . . . . . . . . . . . . . . . . . . . . . . . . . . . . . . . . . . . .
Navigator Panes . . . . . . . . . . . . . . . . . . . . . . . . . . . . . . . . . . . . . . . . .
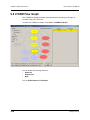
9.8 LTSSM Flow Graph . . . . . . . . . . . . . . . . . . . . . . . . . . . . . . . . . . . . . . . . .
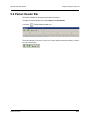
9.9 Packet Header Bar . . . . . . . . . . . . . . . . . . . . . . . . . . . . . . . . . . . . . . . . .
9.10 Packet Data Window . . . . . . . . . . . . . . . . . . . . . . . . . . . . . . . . . . . . . . .
9.11 Configuration Space View . . . . . . . . . . . . . . . . . . . . . . . . . . . . . . . . . . .
9.12 Using Unit Metrics . . . . . . . . . . . . . . . . . . . . . . . . . . . . . . . . . . . . . . . . .
Show Metrics in the CATC Trace Display . . . . . . . . . . . . . . . . . . . . . .
Show Metrics in the Traffic Summary Window . . . . . . . . . . . . . . . . . .
Show Metrics in the Bus Utilization Window . . . . . . . . . . . . . . . . . . . .
9.13 Real-Time Statistics Window . . . . . . . . . . . . . . . . . . . . . . . . . . . . . . . . .
Real-Time Statistics Buttons . . . . . . . . . . . . . . . . . . . . . . . . . . . . . . . .
Real-Time Statistical Monitor Pop-up Menu . . . . . . . . . . . . . . . . . . . .
vi
129
129
132
132
134
134
141
142
142
142
143
143
144
144
145
145
146
146
148
150
151
154
155
156
156
157
158
159
161
163
164
167
169
170
170
171
171
173
176
177
178
179
181
182
184
186
189
190
192
Teledyne LeCroy
PETracer ML User Manual
Real-Time Statistics Graph Areas . . . . . . . . . . . . . . . . . . . . . . . . . . . .
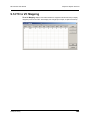
9.14 TC to VC Mapping . . . . . . . . . . . . . . . . . . . . . . . . . . . . . . . . . . . . . . . . .
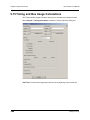
9.15 Timing and Bus Usage Calculations . . . . . . . . . . . . . . . . . . . . . . . . . . .
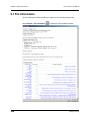
9.16 Running Verification Scripts. . . . . . . . . . . . . . . . . . . . . . . . . . . . . . . . . .
193
195
196
198
Section 3. PETrainer Exerciser
Traffic Generation . . . . . . . . . . 201
Chapter 10 Traffic Generation . . . . . . . . . . . . . . . . . . . . 203
10.1 Theory of Operation . . . . . . . . . . . . . . . . . . . . . . . . . . . . . . . . . . . . . . .
10.1 Traffic Generation Files . . . . . . . . . . . . . . . . . . . . . . . . . . . . . . . . . . . . .
10.2 Creating a Traffic Generation File . . . . . . . . . . . . . . . . . . . . . . . . . . . . .
Exporting a CATC Trace to a Traffic Generation File . . . . . . . . . . . . .
Saving a PETrainer Script to a New File . . . . . . . . . . . . . . . . . . . . . . .
Creating a New Empty Generation File. . . . . . . . . . . . . . . . . . . . . . . .
10.3 Editing Generation Files with the Script Editor . . . . . . . . . . . . . . . . . . .
Script Editor Toolbar . . . . . . . . . . . . . . . . . . . . . . . . . . . . . . . . . . . . . .
Script Edit Window . . . . . . . . . . . . . . . . . . . . . . . . . . . . . . . . . . . . . . .
Command Properties Window . . . . . . . . . . . . . . . . . . . . . . . . . . . . . .
Script Editor File Tabs . . . . . . . . . . . . . . . . . . . . . . . . . . . . . . . . . . . . .
Script Editor Error Log. . . . . . . . . . . . . . . . . . . . . . . . . . . . . . . . . . . . .
View Options Menu . . . . . . . . . . . . . . . . . . . . . . . . . . . . . . . . . . . . . . .
10.4 Generation Options Dialogs Overview . . . . . . . . . . . . . . . . . . . . . . . . .
Opening the Dialog . . . . . . . . . . . . . . . . . . . . . . . . . . . . . . . . . . . . . . .
10.5 Generation Options for PETrainer ML . . . . . . . . . . . . . . . . . . . . . . . . . .
General . . . . . . . . . . . . . . . . . . . . . . . . . . . . . . . . . . . . . . . . . . . . . . . .
Link . . . . . . . . . . . . . . . . . . . . . . . . . . . . . . . . . . . . . . . . . . . . . . . . . . .
Integrity . . . . . . . . . . . . . . . . . . . . . . . . . . . . . . . . . . . . . . . . . . . . . . . .
Flow Control . . . . . . . . . . . . . . . . . . . . . . . . . . . . . . . . . . . . . . . . . . . .
Transactions . . . . . . . . . . . . . . . . . . . . . . . . . . . . . . . . . . . . . . . . . . . .
10.6 Generating Traffic: Set Generation Options . . . . . . . . . . . . . . . . . . . . .
10.7 Generating Traffic: Prepare Traffic Generation . . . . . . . . . . . . . . . . . . .
10.8 Generating Traffic: Begin Traffic Generation . . . . . . . . . . . . . . . . . . . . .
203
205
207
207
208
209
210
211
212
214
215
215
216
217
217
218
218
220
221
223
225
226
227
228
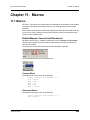
Chapter 11 Macros . . . . . . . . . . . . . . . . . . . . . . . . . . . . . 231
11.1 Macros . . . . . . . . . . . . . . . . . . . . . . . . . . . . . . . . . . . . . . . . . . . . . . . . . . 231
Default Macros: Connect and Disconnect. . . . . . . . . . . . . . . . . . . . . . 231
11.2 Adding New Script Macros . . . . . . . . . . . . . . . . . . . . . . . . . . . . . . . . . . 232
Using the Generation Macros Dialog . . . . . . . . . . . . . . . . . . . . . . . . . 232
Adding Script Files to the GenScriptMacros Directory . . . . . . . . . . . . 233
11.3 Modifying Script Macros . . . . . . . . . . . . . . . . . . . . . . . . . . . . . . . . . . . . 234
11.4 Changing the Order of Macro Icons on the Status Bar . . . . . . . . . . . . . 234
11.5 Deleting User-Defined Script Macros . . . . . . . . . . . . . . . . . . . . . . . . . . 235
11.6 Restoring the Default Appearance of the Connect and Disconnect Icons. .
235
Teledyne LeCroy
vii
PETracer ML User Manual
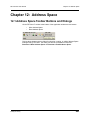
Chapter 12 Address Space. . . . . . . . . . . . . . . . . . . . . . . 237
12.1 Address Space Toolbar Buttons and Dialogs . . . . . . . . . . . . . . . . . . . .
Write Address Space Button . . . . . . . . . . . . . . . . . . . . . . . . . . . . . . . .
Read Address Space Button . . . . . . . . . . . . . . . . . . . . . . . . . . . . . . . .
12.2 Memory/IO Space Editor . . . . . . . . . . . . . . . . . . . . . . . . . . . . . . . . . . . .
237
238
238
239
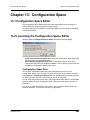
Chapter 13 Configuration Space . . . . . . . . . . . . . . . . . . 241
13.1 Configuration Space Editor . . . . . . . . . . . . . . . . . . . . . . . . . . . . . . . . . .
13.2 Launching the Configuration Space Editor . . . . . . . . . . . . . . . . . . . . . .
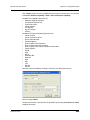
Configuration Space Files . . . . . . . . . . . . . . . . . . . . . . . . . . . . . . . . . .
Editing . . . . . . . . . . . . . . . . . . . . . . . . . . . . . . . . . . . . . . . . . . . . . . . . .
13.3 BARs Setup . . . . . . . . . . . . . . . . . . . . . . . . . . . . . . . . . . . . . . . . . . . . . .
13.4 Configuration Read and Write . . . . . . . . . . . . . . . . . . . . . . . . . . . . . . . .
241
241
241
242
245
246
Chapter 14 Updates and Licensing . . . . . . . . . . . . . . . . 247
14.1 Updating the Analyzer . . . . . . . . . . . . . . . . . . . . . . . . . . . . . . . . . . . . . . 247
14.2 License Keys . . . . . . . . . . . . . . . . . . . . . . . . . . . . . . . . . . . . . . . . . . . . . 248
14.3 License Information . . . . . . . . . . . . . . . . . . . . . . . . . . . . . . . . . . . . . . . . 248
Appendix A Configuration Space Decoding . . . . . . . . . 249
A.1 Mandatory Definitions . . . . . . . . . . . . . . . . . . . . . . . . . . . . . . . . . . . . . . .
A.2 Mandatory Module Functions . . . . . . . . . . . . . . . . . . . . . . . . . . . . . . . . .
A.3 Configuration Register Types . . . . . . . . . . . . . . . . . . . . . . . . . . . . . . . . .
A.4 Primitives . . . . . . . . . . . . . . . . . . . . . . . . . . . . . . . . . . . . . . . . . . . . . . . .
A.5 Helper File. . . . . . . . . . . . . . . . . . . . . . . . . . . . . . . . . . . . . . . . . . . . . . . .
249
249
250
250
251
Appendix B China Restriction of Hazardous Substances
Table252
How to Contact Teledyne LeCroy . . . . . . . . . . . . . . . . . 253
Index
255
viii
Teledyne LeCroy
PETracer ML User Manual
Section 1
Section 1. General
Teledyne LeCroy
1
Section 1
2
PETracer ML User Manual
Teledyne LeCroy
PETracer ML User Manual
Chapter 1: Overview
Chapter 1: Overview
Designed for developers and validators, the Teledyne LeCroy PETracer/Trainer ML™ is
a PCI Express™ Multi-Lane advanced verification system.
By leveraging years of experience in protocol analysis tools for emerging markets,
PETracer/Trainer ML blends sophisticated functionality with practical features to speed
the development of PCI Express™ IP cores, semiconductors, bridges, switches,
add-in boards, and systems.
1.1 PETracer Analyzer Hardware and Software
Features and Benefits
PETracer ML Analyzers have these features and benefits:
Features
Benefits
Powerful and Intuitive
CATC Trace™ Analysis Software
Faster interpretation and debug of PCI Express traffic with
color-coded, clearly labeled protocol elements in a graphical
display. Reduces coding and deciphering.
Extensive Decoding
Complete, accurate and reliable decoding of TLPs (Transaction
Layer Packets), DLLPs (Data Link Layer Packets), and all
PCI Express Primitives
Monitoring and Link Utilization
View link utilization and other performance measurements
changing in real time. Save this data to view as post-session
statistics.
Advanced Triggering
Isolate important traffic, specific errors, or data patterns. Trigger
condition setup is made simple with drag and drop tools to link
events to trigger or filter actions.
Hardware Filtering
Analyze faster and understand transactions more clearly by
removing non-essential fields from the CATC Trace.
Intelligent Reporting
Quickly identify and track error rates and abnormal link or timing
conditions. Display configuration space and protocol specification
details.
Sophisticated Viewing
View Packet, Link and Split Transaction levels of the PCI Express
protocol. Collapsible/expandable headers with Tool tip
explanations make it easy to navigate and interpret packet
contents, headers, and commands. View packets, transactions of
TLPs and DLLPs in classic CATC Trace™ format or in raw 10b
code for deeper analysis.
Teledyne LeCroy
3
Chapter 1: Overview
PETracer ML User Manual
2 GB Recording Capacity
Capture long recording sessions for analysis and problem solving
Hi-Speed USB Port
Access PCI Express recordings up to 40x faster than USB 1.1.
No complicated setup required.
Downloadable Trace Viewer
Share and annotate CATC Trace recordings within a development
team. Freely distributable PETracer software enables collaborative
analysis across sites and time zones.
Taps non-intrusively into a single
x1, 2.5 gigabit/second
PCI Express port using
MicroGigaCN receptacle and
one standard x4 cable
Accurate and non-intrusive collection of PCI Express CATC Trace
data
Field-upgradeable firmware and
recording engine
Upgrades available for download direct from the Teledyne LeCroy
website
Flexible probing options
Active and passive slot interposers
MidBus probe
Flying lead probe
Gen1 AMC interposer
Gen1 XMC interposer
Gen1 SIOM interposer
Gen1 Express card interposer
External interface for probing
and monitoring auxiliary digital
signals
Enables cross triggering between other test instruments.
Dword to Transaction Level
Viewer
View Dwords, Packet, Link and Split Transaction levels of the PCI
Express protocol.
CRC checking
Know that info being displayed is accurate.
4
Teledyne LeCroy
PETracer ML User Manual
Chapter 1: Overview
1.2 PETrainer Exerciser Hardware
Features and Benefits
PETrainer ML Exercisers have these features and benefits
Features
Benefits
Script level traffic generation
Programmability to test PCI Express components with
more precision and control
Convert CATC Trace files into generation
scripts
Recreate failure scenarios by replaying recorded
traffic
Manual Error injection
Verify fault handling and identify error recovery
Host/End-Point Emulation Support
Host emulation platform/end-point emulation
Interposer allows for design and stress testing.
Programmable Physical Layer
Flexibility to program lane skews, link control bits, skip
intervals and link states for more robust verification
Programmable Data Link Layer
Ability to modify flow control, ACK/NAK, and retry
behaviors
Flexible/programmable Transaction Layer
User ability to define arbitrary sequence of
transactions, payload generation, and conditional
repeat of transactions provide users with maximum
flexibility
Raw Generation mode
Allows complete control of each symbol transmitted
Programmable reply timers
Allows testing of ACK latency timeouts and retry
mechanisms
Point and Click Script Editor
Complex scripts can be created quickly and easily
Error Insertion
CRC Errors
Running Disparity Errors
Insertion of Invalid 10-bit symbols
Lane to Lane Skew Insertion
Lane Reversal
Polarity Inversion
Teledyne LeCroy
5
Chapter 1: Overview
PETracer ML User Manual
Programmable ACK/NAK behavior
ACK all TLP packets
NAK all TLP packets
Automatic ACK/NAK behavior
ACK/NAK delay timer
Programmable Flow control behavior
Set Credit values
Disable Credit checking
Set Update InitFC intervals
Automatic CRC
calculation and Sequence number
assignment
DLLP CRC calculation
TLP LCRC calculation
Replay buffer
Programmable Transaction timeout timer
Auto Recovery behavior after 4 Replays
Programmable
configuration space
Full 4 KB configuration space configurable by user
Accessible through Configuration Reads and Writes
over PCI Express
1.3 CATC Trace Software
PETracer ML utilizes the CATC Trace™ to assist users in analyzing how PCI Express
components work together, diagnose problems, and test for interoperability and
standards compliance.
The CATC Trace is a powerful and intuitive expert software system embedding detailed
knowledge of the protocol hierarchy and intricacies, as defined in the protocol
specification. The software allows the user to control the Analyzer and set specific
real-time triggering and filtering conditions. The CATC Trace utilizes a Windows-based
graphical display that has been optimized for fast and easy navigation through a captured
traffic session. Users are alerted as violations are detected at all levels of the protocol
layering and can easily drill down on areas of interest or collapse and hide fields that are
not relevant.
6
Teledyne LeCroy
PETracer ML User Manual
Chapter 1: Overview
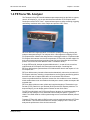
1.4 PETracer ML Analyzer
The Teledyne LeCroy PETracer ML hardware taps transparently into the fabric to capture,
decode, and display x1, x2, x4 and x8 bidirectional transfers of PCI Express traffic.
Developers use the CATC Trace™ expert software system to define recording, triggering
and filtering conditions and to view, analyze and print the CATC Trace.
PETracer ML uses a high impedance, non-intrusive probing technology, allowing full,
unaltered data pass-through. The Analyzer offers a dual approach in tapping into the
PCI Express fabric. Whether the design utilizes a card-edged solution, or implements the
PCI Express link between circuit board components, PETracer ML provides support for
both a Slot Interposer card and a mid-bus probe (for more information about mid-bus
probes, refer to the PETracer Mid-Bus Probe™ Installation Guide).
A single PETracer ML Analyzer supports bidirectional x1, x2 and x4 links, as well as
unidirectional x8 PCI Express link data capture and analysis. Combining two
PETracer ML Analyzer systems allows for full bidirectional decode and capture of a x8
PCI Express link.
PETracer ML has many innovative features that dramatically reduce time-to-market for
PCI Express solutions, including a comprehensive set of triggering and filtering options
that allow the user to capture traffic that is of most interest and relevance.
Users are provided with a list of protocol events from link conditions to error violations,
which enables them to set commands to the Analyzer to search, isolate and capture the
essential data.
PETracer ML provides accurate, reliable and complete decodes of Transaction Layer
Packets (TLPs), Data Link Layer Packets (DLLPs) and all PCI Express primitives. For
deeper analysis, you can display packet contents as raw 10-bit codes.
The PETracer ML Multi-Lane PCI Express Protocol Analyzer is a hardware module that
installs into the Teledyne LeCroy Universal Protocol Analyzer System™ (UPAS™)
10000. The UPAS 10000 is a base system designed to accommodate different protocol
modules.
Together, PETracer ML and the UPAS connect to a host machine that runs the PETracer
user interface. This interface administers the Analyzer, displays CATC Traces, and
analyzes the performance of the devices under test.
Teledyne LeCroy
7
Chapter 1: Overview
PETracer ML User Manual
PETracer ML supports the pairing of two UPAS/PETracer ML. Pairing doubles the width
of the PCI Express bidirectional link that can be monitored from x4 to x8.
PETracer ML uses hardware triggering to capture real-time events, and hardware filtering
to filter in or out different types of packets from the recording. Filtering allows users to
focus recordings on events of interest and to preserve recording memory so that the
recording time can be extended. All traffic is recorded non-intrusively, meaning that
PETracer ML does not adversely affect the link it is recording.
Recorded data is presented in colored graphics in a CATC Trace viewer application. This
application has advanced search and viewing capabilities that allow the user to quickly
locate specific data, errors, and other desired conditions, thereby focusing the user’s
attention on events of interest.
The PETracer ML Protocol Analyzer functions with any personal computer using the
Microsoft® Windows® XP or Vista operating system and equipped with a functional USB
interface.
PETracer ML provides on-the-fly detection of and triggering on PCI Express events.
Whether recording manually or with a specified trigger condition, PETracer ML
continuously records the link data in a wrap-around fashion until manually stopped or until
the Trigger Event is detected and a specified amount of post-Trigger link data is recorded.
Upon detection of a triggering event, the Analyzer continues to record data up to a point
specified by the user. Real-time detection of events can be individually enabled or
disabled to allow triggering on events as they happen. This includes predefined exception
or error conditions and a user-defined set of trigger events. The unit can also be triggered
by an externally supplied signal. An external DB-25 connector provides a path for
externally supplied data or timing data to be recorded along with traffic.
This DB-25 connector also provides a path for PETracer ML to transmit signals externally
for purposes of probing and use by other circuitry.
8
Teledyne LeCroy
PETracer ML User Manual
Chapter 1: Overview
The PETracer ML software provides powerful search functions that enable investigation
of particular events and allow the software to identify and highlight specific events. In
addition to immediate analysis, you can print any part of the data. Use the Save As
feature to save the data on disk for later viewing. The program also provides a variety of
timing information and data analysis reports.
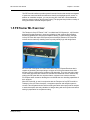
1.5 PETrainer ML Exerciser
The Teledyne LeCroy PETrainer™ ML™ is a Multi-lane PCI Express (x1, x4) Exerciser
designed to assist engineers in improving reliability of their solutions and providing
advanced capabilities for stress and compliance testing. Together with the Teledyne
LeCroy PETracer ML expert PCI Express protocol analysis solutions, PETrainer ML
reduces time to market by enabling users to quickly identify logic and design flaws.
PETrainer ML is designed as a stand alone Multi-lane PCI Express Exerciser that is
capable of generating and responding to all types of PCI Express transactions while
allowing users to create protocol variations and anomalies. The users may also create
corner case and stress test scenarios to evaluate the robustness of their solutions. By
utilizing the PETrainer ML error injection feature, engineers can create worst-case
PCI Express traffic scenarios allowing them to validate the error handling capabilities of
their solutions.
When PETrainer ML is used in conjunction with the Teledyne LeCroy PETracer ML or
Teledyne LeCroy PETracer Analyzer, a complete expert test and analysis system is
created. This integrated solution delivers traffic generation and expert protocol analysis
to assist developers with early validation of designs along with error injection and stress
testing in preparation for compliance testing.
Teledyne LeCroy
9
Chapter 1: Overview
PETracer ML User Manual
1.6 Other Documents
For more information about PETracer and PETrainer, refer to the following documents:
10
•
Teledyne LeCroy Analyzers File-based Decoding Manual
•
PETracer/Trainer Automation Manual
•
PETracer VSE Manual
•
PETracer Gen2 Multi Lead Probe User Manual
•
PETrainer Scripting Language Reference Manual
•
PETracer Online Help
Teledyne LeCroy
PETracer ML User Manual
Chapter 2: Hardware Description
Chapter 2: Hardware Description
The PCI Express™ system features the Universal Protocol Analyzer System™
(UPAS™), PETracer™ Analyzers, and PETrainer™ Exercisers.
2.1 System Components
•
•
PETracer ML system (based on the UPAS 10K platform):
•
Factory-installed PETracer ML™ Analyzer module(s)
•
One USB cable
•
Probe data cable
•
Breakout Board with cable
•
PETracer Software program CD-ROM
•
User Manual
•
PCI Express Slot Interposer probe
PETrainer ML system (based on the UPAS 10K platform):
•
Factory-installed PETrainer ML™ Exerciser module
•
One USB cable
•
Probe data cable
•
Breakout Board with cable
•
PETracer Software program CD-ROM
•
Device Emulation Interposer or Host Emulation Test Fixture
2.2 Host Machine Requirements
PETracer ML and PETrainer ML connect to a host machine. Please consult the readme
file on the installation CD for the latest host machine requirements.
Teledyne LeCroy
11
Chapter 2: Hardware Description
PETracer ML User Manual
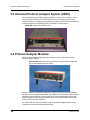
2.3 Universal Protocol Analyzer System (UPAS)
The Universal Protocol Analyzer System (UPAS) is a base unit for Teledyne LeCroy
protocol Analyzer modules. The UPAS contains the recording memory and other
resources used by all Teledyne LeCroy Analyzer modules. At the back of the UPAS is a
hi-speed USB port for transferring CATC Trace data to a host machine.
•
UPAS 10K: Supports the PETracer ML™.
2.4 Protocol Analyzer Modules
PETracer ML hardware modules plug into Teledyne LeCroy’s Universal Protocol
Analyzer System (UPAS).
•
PETracer ML: Multi-lane version of PETracer. It works with the UPAS 10K
and occupies both slots of the UPAS.
Analyzer modules use hardware triggering to capture real-time events and hardware
filtering to exclude unwanted data. Data is recorded into the Analyzer's buffer and then
transferred over a USB line to a host machine for display and analysis. Search and
display capabilities in the Analyzer software allow you to quickly locate specific data,
errors and other desired conditions.
An external DB-25 connector provides a path for externally supplied data or timing
information to be recorded along with link traffic.
12
Teledyne LeCroy
PETracer ML User Manual
Chapter 2: Hardware Description
2.5 PETrainer Exerciser
PETrainer™ is a Multi-lane PCI Express Exerciser designed to assist engineers in
improving reliability of their solutions and providing advanced capabilities for stress and
compliance testing.
•
PETrainer ML™: 4-lane system
All PETrainer models operate as standalone Exercisers capable of generating and
responding to all types of PCI Express transactions. Both Exercisers also have the ability
to create protocol variations and anomalies. Users may also create corner case and
stress test scenarios to evaluate the robustness of their solutions. By utilizing the
PETrainer error injection feature, engineers can create worst-case PCI Express traffic
scenarios allowing them to validate the error handling capabilities of their solutions.
When PETrainer is used in conjunction with a PETracer Analyzer, a complete expert test
and analysis system is created. This integrated solution delivers traffic generation and
expert protocol analysis to assist developers with early validation of designs along with
error injection and stress testing in preparation for compliance testing.
Teledyne LeCroy
13
Chapter 2: Hardware Description
PETracer ML User Manual
2.6 PETracer ML Analyzer LED Descriptions
When powered on, the PETracer ML activates the user-accessible controls and LEDs on
the front and rear panels of the UPAS.
Warning!
Do not open the UPAS enclosure. There are no operator serviceable parts
inside. Refer servicing to Teledyne LeCroy.
UPAS LEDs (from left to right)
(a) Green PWR (power) indicator LED for UPAS: lights when the unit power is switched
on.
(b) Red Status indicator LED for UPAS: lights during initialization/power up of UPAS
base unit. Blinks if a self-test fails.
The following LEDs and the Manual Trigger button on the UPAS function in conjunction
with the PETracer ML module inserted above it:
(c) Green REC (recording) LED: lights when the unit is recording.
(d) Orange TRG (triggered) LED: lights when the unit triggers on an event.
(e) Green UPLD (Upload): lights when unit is uploading data to host machine.
(f) Manual Trigger push-button: allows a manual CATC Trace capture.
LEDs and Connectors on the PETracer ML Module
(g) Green Status LED: Illuminates when there is traffic on the link.
(h) Probe Data Connector
(i) Probe Data Connector
14
Teledyne LeCroy
PETracer ML User Manual
Chapter 2: Hardware Description
2.7 PETrainer ML Exerciser LED Descriptions
When powered on, the PETrainer ML activates the user-accessible controls and LEDs on
the front and rear panels of the UPAS.
Warning!
Do not open the UPAS enclosure. There are no operator serviceable parts
inside. Refer servicing to Teledyne LeCroy.
UPAS LEDs (from left to right)
(a) Green PWR (power) indicator LED for UPAS: Lights when the unit power is switched
on.
(b) Red Status indicator LED for UPAS: Lights during initialization/power up of UPAS
base unit. Blinks if a self-test fails.
The following LEDs on the UPAS function in conjunction with the PETrainer ML module
inserted above it:
(c) Green Run LED: Lights when script execution is in process.
(d) Orange Link Up LED: Lights when the PCI Express link is trained.
(e) Green UPLD (Upload): Lights when script is transferred from host machine to
PETrainer.
(f) Manual Trigger push-button: Disabled.
LEDs and Connectors on the PETrainer ML Module
(g) Green Connect LED: Indicates that cabling is correct.
(h) Tx Cable A: Corresponds to connector A on probe data cable
(i) Rx Cable C: Corresponds to connector C on probe data cable
Teledyne LeCroy
15
Chapter 2: Hardware Description
PETracer ML User Manual
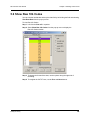
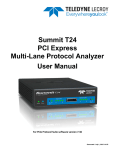
2.8 Rear Panel Description
From left to right, the UPAS rear panel contains the following components:
Figure 2.1 PETracer ML Rear Panel
USB Type B Host Machine Connector
This connector links the Analyzer to the host machine for the purpose of transmitting
commands from the host machine to the Analyzer and uploading CATC Traces from the
Analyzer’s recording memory to the PETracer software for viewing and analysis or links
the PETrainer Exerciser to the host machine for the purpose of downloading scripts and
controlling the behavior of the Exerciser.
RS-232 25-pin Data Input/Output Connector
This connector links a 25 pin RS-232 cable to an external Breakout Board. The
Breakout Board allows signals to be sent from the Exerciser or Analyzer to an external
device such as an oscilloscope or from an external device to the Exerciser or Analyzer
for the purpose of triggering on an external input. You configure input/output signalling
through the Recording Options dialog box. The Breakout Board use is described at the
end of this chapter.
RS-232 40-pin Data Input/Output Connector
This connector links a 40 pin RS-232 cable to an external Breakout Board. The
Breakout Board allows signals to be sent from the Analyzer to an external device such
as an oscilloscope or from an external device to the Analyzer for the purpose of triggering
on an external input. You configure input/output signalling through the Recording Options
dialog box. Breakout Board use is described at the end of this chapter.
16
Teledyne LeCroy
PETracer ML User Manual
Chapter 2: Hardware Description
BNC Connectors Ext. In and Ext. Out
These BNC connectors allow the Analyzer to transmit or receive external signals.
External signaling, in turn, can serve two functions:
•
Linking of Analyzers: On dual Analyzer systems, the BNC connectors are used to
create a loop for transmitting clocking information and commands between the
Analyzers. This linking allows the two Analyzers to function as a single, logical
Analyzer.
•
Triggering: The Ext. In can receive a signal from another device and use that
signal to trigger the end of the recording. Conversely, the Ext. Out connector can be
used to send an output signal from the Analyzer to another device.
The Ext. In and Ext. Out connectors have the same function as the 25 pin RS-232
connector - i.e., they channel input and output signals but do not support the use of a
Breakout Board.
The BNC connectors are not used for the PETrainer Exerciser.
Wide-range AC Connector Module
•
Power socket
•
Power on/off switch
•
Enclosed 5x20 mm 2.0A 250 V fast acting glass fuse
Warning!
Teledyne LeCroy
For continued protection against fire, replace fuse only with the type and
rating specified above.
17
Chapter 2: Hardware Description
PETracer ML User Manual
2.9 Specifications for PETracer ML/PETrainer ML
The following specifications describe a combined PETracer ML or PETrainer ML and
Universal Protocol Analyzer System (UPAS).
Package
Dimensions
UPAS 10000:
12.2 x 12.2 x 3.5 inches (31.1 x 31.1 x 8.9 cm)
PETracer ML Plug-in:
9.3 x 6.7 x 1.3 inches (23.6 x 17.0 x 3.2 cm)
PETrainer ML Plug-in:
9.3 x 6.7 x 1.3 inches (23.6 x 17.0 x 3.2 cm)
Connectors
PETracer ML: 2 Probe Data (HSSDC2 receptacle)
PETrainer ML: 2 Probe Data (SFF-8470 Multi-lane Copper
Connector)
UPAS AC power connection
External trigger connection (DB-25, TRIG IN/OUT, BNC)
host machine connection (USB2.0)
Breakout Board (type D)
Weight
UPAS 10000: 9.5 lbs (4.3 kg)
PETracer ML Plug-in: 1.7 lb (0.77 kg)
PETrainer ML Plug-in: 1.7 lb (0.77 kg)
Power Requirements
90 to 254 VAC, 47 to 63 Hz (universal input), 100 W maximum
Environmental Conditions
Operating Temperature
0 to 40 °C (32 to 104°F)
Storage Range
-20 to 80 °C (-4 to 176°F)
Operating Humidity
10 to 90%, non-condensing
Operating Altitude
Up to 6560 feet (2000 meters)
Switches
18
Power
On/Off
Manual Trigger
When pressed forces a trigger event
Teledyne LeCroy
PETracer ML User Manual
Chapter 2: Hardware Description
Indicators (LEDs)
UPAS:
Power (PWR)
Status (STATUS)
Illuminated when Analyzer is powered on
Illuminated during Power-On Self Test (POST) and when the
Analyzer detects valid on the PCI Express link
Recording (REC)
Illuminated when the Analyzer is actively recording traffic data
Triggered (TRG)
Illuminated when the Analyzer has a valid trigger condition
Uploading (UPLD)
Illuminated when the Analyzer is uploading its recording memory to
the host machine for displaying the CATC Trace and during the
memory-testing step of the POST
PETracer ML Plug-in:
Activity
Illuminated when Analyzer detects valid traffic for the two dual-simplex
connections of the PCI Express Link
Probing Characteristics
Connection
PETracer ML: PCI Express Slot Interposer card
Mid-Bus probe
(for more information about mid-bus probes,
refer to the PETracer Mid-Bus Probe™
Installation Guide)
PETrainer ML: Slot Interposer card (Device emulation Interposer)
Host Emulation Test fixture (Host emulation)
PETracer Recording Memory Size
2 GB for CATC Trace capture, timing, and control information.
PETracer Basic Trigger Events
Link Conditions
Link Alive, Electrical Idle Link Condition, TS1 Ordered Set,
TS2 Ordered Set, Skip Ordered Set, Electrical Idle Ordered Set,
FTS Ordered Set, Compliance Pattern Ordered Set, Comma, DLLP,
TLP
TLP Headers
TLP Type: Mem, I/O, Cfg, Msg, Cpl, Any Traffic Class number
DLLP Messages
Ack/Nak, InitFC1, InitFC2, UpdateFC, PM, Vendor
Payload
Customizable Payload, Mask, Match
Errors
DLLP CRC, TLP LCRC, TLP ECRC, Delimiter,
EDB (End-of-Bad Packet), Disparity, Symbol, Idle data, Skip late,
Ordered Set Format
Breakout Board (BOB)
Filter in/out capabilities
Teledyne LeCroy
19
Chapter 2: Hardware Description
PETracer ML User Manual
PETracer Reporting and Statistics
Transport Layer Packet
(TLP)
Memory Read 32-bit, Memory Read 64-bit, Memory Write 32-bit,
Memory Write 64-bit, I/O Read Request, I/O Write Request,
Configuration Read Type 0, Configuration Write Type 0,
Configuration Read Type 1, Configuration Write Type 1, Message,
Message with Data, Completion, Completion with Data,
Completion for Locked Memory Read, Completion for Locked
Memory Read with Data, Requesters, Completers,
Traffic Class Number, Virtual Channel ID Number
Data Link Layer Packet
(DLLP)
Ack, Nak, PM, Vendor, InitFC1-P, InitFC1-NP, Init-FC1-Cpl,
Update FC-P, Update FC-NP, Update FC-Cpl, InitFC2-P, InitFC2-NP,
Init-FC2-Cpl, Flow Control
Link Transactions
Implicit, Explicit, Incomplete
Split Transaction
Successful Completion, Unsupported Request, Cfg Request Retry,
Completer Abort, Incomplete
Error Reports
Bad ECRCs, Bad LCRCs, Invalid 10b code, Running Disparity Error,
End of Bad Packet, Delimiter Error, TS Data Error, Ordered Set
Format Error, Idle Error
Host Machine Software Requirements
Operating System
Windows® XP and Vista
PETrainer Script Memory Size
2 GB
PETrainer Wait Conditions
Time-Based Wait
Wait for User Input
20
Teledyne LeCroy
PETracer ML User Manual
Chapter 2: Hardware Description
2.10 External Interface Breakout Board
With each Analyzer, Teledyne LeCroy includes an External Interface Breakout Board for
accessing several potentially useful standard, LV TTL output and input signals. The
Breakout Board also offers a simple way to connect logic Analyzers or other tools to the
PETracer ML Analyzer unit. Six ground pins and one 5-volt pin are provided.
The Breakout Board connects via a cable to the Data In/Out connector located on the
rear of the Analyzer unit. Each signaling pin is isolated by a 100 series resistor and a
buffer inside the Analyzer unit.
Data In/Out Connector (on cable)
Teledyne LeCroy
21
Chapter 2: Hardware Description
PETracer ML User Manual
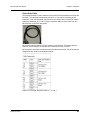
Pin-Outs for the Data In/Out Connector
The following table lists the pin-out and signal descriptions for the Data In/Out connector
on a cable that connects to the Breakout Board.
Data In/Out Connector – Pin-Out
Pin
Signal Name
Signal Description
1
RSV
Reserved
2
GND
Ground
3
GP OUT
General Purpose Output
4
TRG IN 1
Trigger In 1
5
GND
Ground
6
DATA 6
Data 6
7
DATA 4
Data 4
8
DATA 3
Data 3
9
DATA 1
Data 1
10
GND
Ground
11
RSV
Reserved
12
RSV
Reserved
13
+5V
+5 Volts, 250 mA DC Source
14
RSV
Reserved
15
GND
Ground
16
TRG OUT
Trigger Out
17
TRG IN 0
Trigger In 0
18
DATA 7
Data 7
19
DATA 5
Data 5
20
GND
Ground
21
DATA 2
Data 2
22
DATA 0
Data 0
23
GND
Ground
24
RSV
Reserved
25
RSV
Reserved
Note:
(*) Pins 4 and 17 have the same function: they allow external signals to be
used to cause triggering or recording. Pins 3 and 16 are used to transmit
output signals. Pins 6, 7, 8, 9, 18, 19, 21, and 22 (data pins) are used to
define data patterns for external input signals.
Note:
All models of PETracer only support Data 0 - Data 3.
Prototype Rework Area
The Breakout Board contains a prototype rework area for making custom circuits for rapid
development. The area consists of plated-through holes, 20 columns wide by 27 rows
long. The top row of holes is connected to GND and the bottom row is connected to +5V.
The remaining holes are not connected. Use the rework area to insert custom
components and wire-wrap their respective signal, power, and ground pins.
22
Teledyne LeCroy
PETracer ML User Manual
Chapter 2: Hardware Description
Breakout Board Input and Output Signals
A Breakout Board can be used to channel input signals into the Analyzer in order to cause
triggering. A Breakout Board can also be used to channel signals from the Analyzer to an
external source.
Drive strength for all outputs is about 30 mA high (@2 V) and 60 mA low (@0.5 V). Inputs
can handle 0 V to 5.5 V. Inputs above 2 V are detected as logic high; inputs below 0.8 V
are detected as logic low.
The Breakout Board connects via a cable to the Data In/Out connector on the rear of the
UPAS.
External Recordable Signals
Breakout Board Data 0-3: These pins let you define a 4-bit Data Pattern that can be
recorded in a CATC Trace file.
External Input Triggers
You can use either an external input signal or the Trigger button on the front of the UPAS
to cause triggering. The following descriptions show what pins or buttons to use:
Breakout Board Data 3 - Data 0: Triggers on a 4-bit input pattern.
Breakout Board Trigger In 0: Selectable Edge triggered inputs. Triggers on any edge it
detects.
Breakout Board Trigger In 1: Selectable Edge triggered inputs. Triggers on any edge it
detects.
BNC Trigger (EXT IN): Selectable Edge triggered inputs. Triggers on any edge it detects.
Located on the back of the chassis.
Push Button Trigger: The Trigger button on the front of the UPAS can be pressed to
manually cause a trigger.
External Outputs
The Analyzer can be configured to send an external signal anytime a trigger and/or event
occurs. The following descriptions show the behavior of these output signals:
Breakout Board Trigger Out: Changes from low to high when Analyzer triggers
(one time per recording only)
Breakout Board G.P. Output: Programmable waveform (low or high pulse, toggle). Each
event can be programmed to enable this external signal.
BNC Output (EXT OUT): Same as Breakout Board G.P. Output. Located on the back of
the chassis.
Setting Recording Options to Support External Input/Output
Signaling
After a Breakout Board has been connected to a UPAS, the Analyzer must be configured
for external or internal input signaling.
Teledyne LeCroy
23
Chapter 2: Hardware Description
24
PETracer ML User Manual
Teledyne LeCroy
PETracer ML User Manual
Chapter 3: Installation
Chapter 3: Installation
PETracer™ ML™ or PETrainer™ ML™ is a factory-installed hardware module that is
sold as part of the Universal Protocol Analyzer System™ 10000 (UPAS™ 10K).
The UPAS 10K, UPAS 100K, modules, and associated software are easily installed. You
can begin making PCI Express™ recordings or begin traffic generation after following the
steps in this chapter.
3.1 Installing the PETracer Software
PETracer software operates all of Teledyne LeCroy’s PCI Express protocol Analyzer and
Exerciser products:
The PETracer software is installed on a Microsoft® Windows®-based host machine and
serves as the interface for the Exerciser and/or Analyzer. When an Exerciser is attached,
traffic generation features are enabled.
After the Analyzer or Exerciser has been recognized as a USB device, install the
PETracer software on the host machine:
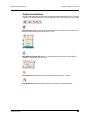
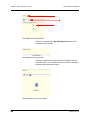
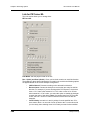
Step 1 Insert the CD into the CD ROM drive of the host machine that controls
the Analyzer or Exerciser. The installation window opens and displays
links to the PETracer software, user manuals, a readme file, and Acrobat
Reader.
Step 2 Select Install Software and follow the on-screen instructions.
The PETracer software installs automatically on the host machine’s hard disk.
During installation, all necessary USB drivers are loaded automatically. Drivers
included in the installation are:
•
ctcupa10.sys: UPAS 10K driver
•
petrcrml.sys: PETracer ML driver
•
petranx4.sys: PETrainer ML driver
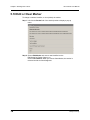
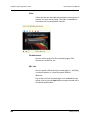
Step 3 To start the application, launch the PETracer program from the Start
menu:
Start > Programs > LeCroy > PETracer > LeCroy PETracer
Teledyne LeCroy
25
Chapter 3: Installation
PETracer ML User Manual
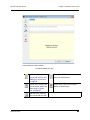
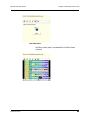
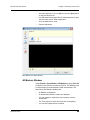
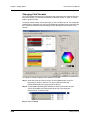
The PETracer program opens:
Note:
26
The software may be used with or without the Exerciser or Analyzer. When
used without an Exerciser or Analyzer attached to the computer, the program
functions as a Trace Viewer to view, analyze, and print captured traffic.
Teledyne LeCroy
PETracer ML User Manual
Chapter 3: Installation
3.2 Setting Up a PETracer Analyzer
Step 1 Remove the Analyzer/UPAS from its shipping container. The module is
already installed in the UPAS.
Step 2 Connect the Analyzer unit to a 100-volt to 240-volt, 50 Hz to 60 Hz,
120 W power outlet using the provided power cord.
Note: The Analyzer is capable of supporting supply voltages between 100 volts
and 240 volts, 50 Hz or 60 Hz, thus supporting all known supply voltages around
the world.
Step 3 Connect the USB cable between the USB port on the back of the
Analyzer and a USB port on the host machine.
Step 4 Turn on the power switch on the rear of the UPAS.
Note: At power-on, the Analyzer initializes itself in approximately five seconds
and performs an exhaustive self-diagnostic that lasts about fifteen seconds. The
Status LED of the UPAS base unit turns red on power up/initialization. The LED
remains on approximately 20 seconds while the Analyzer performs
self-diagnostic testing. If the diagnostics fail, the Status LED blinks red, indicating
a hardware failure. If this occurs, call Teledyne LeCroy Customer Support for
assistance.
Step 5 Follow on-screen Plug-and-Play instructions for the automatic
installation of the Analyzer as a USB device on the host machine (the
required USB files are included on the CD). Step through the Windows®
hardware wizard. If the wizard prompts you for driver information, point
it to the CD which should be in your disk drive.
The host machine’s operating system detects the Analyzer and begins to install
the USB driver.
Teledyne LeCroy
27
Chapter 3: Installation
PETracer ML User Manual
3.3 Setting Up a PETrainer Exerciser
Step 1 Remove the Exerciser and UPAS from its shipping container. The
PETracer ML module is already installed in the UPAS.
Step 2 Connect the Exerciser to a 100-volt to 240-volt, 50 Hz to 60 Hz, 120 W
power outlet using the provided power cord.
Note: The Exerciser is capable of supporting supply voltages between 100-volt
and 240-volt, 50 Hz or 60 Hz, thus supporting all known supply voltages around
the world.
Step 3 Connect the USB cable between the USB port on the back of the UPAS
and a USB port on the host machine.
Note: All hardware and cables should be setup prior to power-up.
Install Device Emulator or Host Emulator as described in the previous sections.
Also install any cables between the Emulator and PETrainer ML Exerciser as
described in the previous sections.
Step 4 Turn on the power switch on the rear of the UPAS.
Note: At power-on, the Exerciser initializes itself in approximately five seconds
and performs an exhaustive self-diagnostic that lasts about fifteen seconds. The
Status LED of the UPAS base unit turns red on power up/initialization. The LED
remains on approximately 20 seconds while the Exerciser performs
self-diagnostic testing. If the diagnostics fail, the Status LED blinks red, indicating
a hardware failure. If this occurs, call Teledyne LeCroy Customer Support for
assistance.
Step 5 Follow on-screen Plug-and-Play instructions for the automatic
installation of the Exerciser as a USB device on the host machine (the
required USB files are included on the CD). Step through the Windows®
hardware wizard. If the wizard prompts you for driver information, point
it to the CD which should be in your disk drive.
The host machine’s operating system detects the Exerciser and begins to install
the USB driver.
28
Teledyne LeCroy
PETracer ML User Manual
Chapter 3: Installation
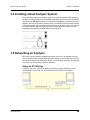
3.4 Installing a Dual Analyzer System
If you have purchased a dual Analyzer system, you must physically link the Analyzers
together. You link the Analyzers via their BNC connectors on the back of the two UPASs.
You connect the Ext. Out connector of one Analyzer to the Ext. In connector on the other
Analyzer, and vice versa, thereby creating a loop. The Analyzers use this loop to transmit
clocking information and commands from one Analyzer to the other. From a user point of
view, the interaction between the two Analyzers is transparent and requires no user
intervention other than the physical linking of the Analyzers.
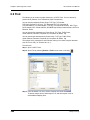
3.5 Networking an Analyzer
PETracer™ has a networking capability that allows users to run an Analyzer remotely
over an IP-based LAN. Using the Network browse dialog, you can locate and connect to
other host machines on the LAN, which, in turn, are connected to Analyzers. Through this
connection, you can remotely control an Analyzer.
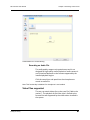
Setup for IP LAN Use
In order to connect to a remote Analyzer, the Analyzer must be attached to a host
machine that is on the LAN. This host machine must have PETracer installed.
Teledyne LeCroy
29
Chapter 3: Installation
PETracer ML User Manual
3.6 Browsing to a Networked Analyzer
For the PETracer ML and the PETrainer ML, you can browse to a networked analyzer.
To browse to a networked Analyzer:
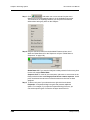
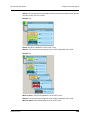
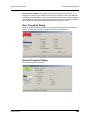
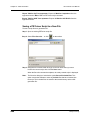
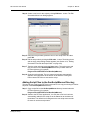
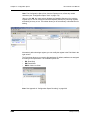
Step 1 From the menu, select Setup > Analyzer Network. The Analyzer
Network dialog box opens. Locally connected Analyzers (connected via
USB) display in the list. The list may also show host machines and
Analyzers identified in previous sessions.
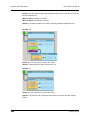
Step 2 If the desired host machine and Analyzer are not present in the list, click
Add. The Add Analyzer dialog box opens.
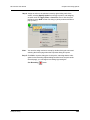
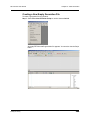
Step 3 Browse to the host machine that has the Analyzer(s), then click Select.
The selected host machine and its Analyzer appear in the Analyzer
Network browse dialog.
Note: The Analyzer must be turned on before it appears in the list.
Step 4 Remove host machines and Analyzers you do not intend to use in the
current recording session by selecting them from the list and clicking
Remove.
The PETracer software establishes a connection to the selected Analyzer.
30
Teledyne LeCroy
PETracer ML User Manual
Chapter 3: Installation
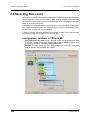
3.7 Connecting the PETracer ML Analyzer to the
Device Under Test
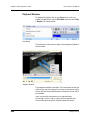
PETracer ML Components
(a) PETracer ML Probe Data connector
(b) PETracer ML Probe Data connector
(c) Probe Data cable: Cable with four connectors. The four-connector cable supports
x8, x4, x2, and x1 links. The small connectors connect to the front of the Analyzer(s).
The large connector at the other end connects to the Interposer.
(d) Probe Data cable: Cable with two connectors. The two-connector cable supports x4,
x2, and x1 links. The small connectors connect to the front of the Analyzer(s).
The large connector at the other end connects to the Interposer.
(e) PETracer ML Slot Interposer Probe: The probe has two connectors: a gold male
connector that fits into a standard PCI Express slot, and a black female connector
that accommodates a PCI Express device. There are two versions of the probe, an
x8 probe and a x4 probe. The gold male adapter on the x4 probe is half the length of
the x8.
Black Female Connector for a Device
PETracer
Cable Connector
To Analyzer
Edge Connector (to Motherboard)
Teledyne LeCroy
31
Chapter 3: Installation
PETracer ML User Manual
Installing the Interposer between the Devices Under Test (DUTs)
To install the Interposer between the Devices Under Test (DUT), perform the following
step:
Step 1 If not already powered off, power off the UPAS 10000 Analyzer and the
DUTs.
Step 2 Insert the gold male connector on the Interposer probe [e] into a
PCI Express slot in the motherboard (or whatever board you are testing).
The x4 Interposer is designed to fit tightly into any standard x4, x8, or x16
PCI Express slot. The x8 Interposer is designed to fit into any x8 or x16
PCI Express slot.
Step 3 Insert the PCI Express DUT into the black female device connector on
the top edge of the Interposer. The Interposer's female device connector
can accommodate any standard PCI Express device (x1, x4, x8, x16).
Step 4 The slot Interposer is shipped from Teledyne LeCroy with a metal face
plate for attachment to a PC case. If you are working with a motherboard
that is not in a PC case, you may prefer to remove the metal face plate
so the Interposer can sit flat with the motherboard. To remove the face
plate, unscrew the two screws that hold it onto the Interposer.
Connecting the Probe Data Cable
The next step is to connect the Probe Data cable. How you connect the cable depends
on the width of your connection.
Probe Data Cable Description
The Probe Data cable consists of a single, large connector on one end and two or four
smaller, 16 pin connectors on the other end. The large connector attaches to the
Interposer, the smaller connectors attach to the front of the Analyzer.
32
Teledyne LeCroy
PETracer ML User Manual
Chapter 3: Installation
The smaller connectors are labeled A, B, C, and D. Each transmits four physical lanes of
traffic in one direction (shown in the illustration on the right). This means that to record
bidirectional traffic you must use at least two of the small connectors: one to capture the
transmit traffic and one to capture the receive traffic (with respect to one of the devices).
The various configurations of connectors and link widths are shown in the table below.
Connecting the Interposer Data Cable
To connect the Interposer data cable:
Step 1 Insert the large connector of the Interposer data cable [c] or [d] into the
Interposer’s data connector located on the metal face plate of the
Interposer [e].
Step 2 Connect the small connectors of the Interposer data cable [c] or [d] to the
Analyzer probe data connectors [a] and, if needed, [b] on the front of the
Analyzer. The number of connectors you use depends on the width and
direction of the link you are attempting to monitor. See foregoing table to
determine the appropriate number of connectors for your test.
Connect USB Cable and Power on the Analyzer and DUTs
Step 1 Connect the provided USB cable between the UPAS 10000 Analyzer
and the host machine that runs the PETracer ML software.
Step 2 Power on the UPAS10000 Analyzer. The Analyzer's green power LED
lights, and the red status LED turns on for approximately 20 seconds
while the Analyzer performs self-diagnostics.
Step 3 After the Analyzer's red status LED turns off, power on the PCI Express
system under test.
Step 4 Open the PETracer ML software on the host machine. The Analyzer is
now ready for PCI Express traffic recording.
Teledyne LeCroy
33
Chapter 3: Installation
PETracer ML User Manual
3.8 Connecting PETrainer ML to the Device Under Test
PETrainer ML can test both the host machine and device sides of a PCI Express link
through the use of two types of adapter:
•
Motherboards and host controllers: Using a device emulation Interposer. A
device emulation Interposer is a PCI Express adapter card that fits into slotted
PCI Express devices.
•
PCI Express add-on cards: Using a host emulation test fixture. A host emulation
test fixture is a box-like adapter with a slot for testing PCI Express cards.
Both of these test devices can be purchased from Teledyne LeCroy.
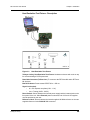
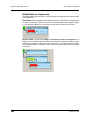
Device Emulator Interposer - Description
The Teledyne LeCroy Device emulation Interposer is an adapter that provides a way of
connecting a PETrainer ML Exerciser or PETracer ML Analyzer to a PCI Express
motherboard. The Interposer has two connectors: a connector for a data cable and an
edge connector for inserting the Interposer into a slotted DUT.
34
Teledyne LeCroy
PETracer ML User Manual
Chapter 3: Installation
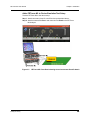
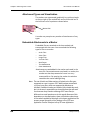
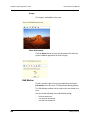
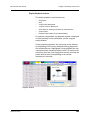
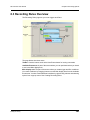
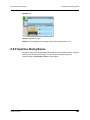
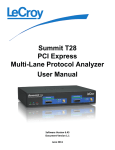
Host Emulation Test Fixture - Description
Figure 3.2
Host Emulation Test Fixture
Teledyne LeCroy Host Emulation Test Fixture: Hardware enclosure with a slot on top
for accommodating a PCI Express card.
Data Cable Connector (To Exerciser): To connect to the PETrainer ML and/or PETracer
ML Analyzer.
Bus Reset button: Reset asserts PERST # for > 250 ms
Signal Level switch:
•
Hi = PCI Express compliant (0.9V - 1.2V)
•
Low = Testing (0.45V - 0.65V)
Power Switch: Selects between the internal power supply and the banana jacks on the
front panel of the unit. When External power is selected, both 3.3V and 12V supplies
must be provided by the user.
Reference Clock: Selects between the internal supplied 100 MHz reference or the user
supplied reference via the RefCLK SMA connector.
Teledyne LeCroy
35
Chapter 3: Installation
PETracer ML User Manual
Installing the Device Emulation Interposer
To install the Interposer into the DUT, perform the following steps.
Step 1 If not already powered off, power off the PETrainer/UPAS 10K system
and the DUT.
Step 2 Insert the edge connector on the Device Emulation Interposer into a
PCI Express slot in the DUT. The Interposer is designed to fit tightly into
any standard x4, x8, or x16 PCI Express slot.
Step 3 The slot Interposer is shipped from Teledyne LeCroy with a metal face
plate for attachment to a PC case. If you are working with a motherboard
that is not in a PC case, you may prefer to remove the metal face plate
so the Interposer can sit flat with the motherboard. To remove the face
plate, unscrew the two screws that hold it onto the Interposer.
Step 4 Attach probe data cable as described below in “Probe Data Cable
Description” on page 32.
Installing the Host Emulation Test Fixture
Figure 3.3
Host Emulation Test Fixture with DUT Card on Top
Step 1 If not already powered off, power off the PETrainer/UPAS 10K system
and the DUT.
Step 2 Insert the male edge connector of the DUT into the PCI Express slot on
top of the Host Emulation Test Fixture.
Step 3 Attach probe data cable as described in the next section.
36
Teledyne LeCroy
PETracer ML User Manual
Chapter 3: Installation
Probe Data Cable
The probe data cable is used to transfer x1 and x4 link PCI Express data to and from the
Exerciser. The cable has a single wide connector on one end for connecting to the
Interposer or the Host Emulation Test Fixture. At the cable’s other end are four smaller
connectors labeled A, B, C, and D. These connectors attach to ports on the front of a
PETrainer ML or PETracer ML system.
Each of the small connectors can only transmit in one direction. This means that at a
minimum, two connectors are needed: one to transmit and one to receive.
Each connector transmits four physical lanes of unidirectional traffic. The lanes and port
assignments are shown in the illustration below.
Cable A, for example, transmits Lanes 0, 1, 2, and 3.
Teledyne LeCroy
37
Chapter 3: Installation
PETracer ML User Manual
Attaching the Probe Data Cable to PETrainer ML
Connector A on the probe data cable goes to port Tx Cable A and connector C goes to
port Rx Cable C on the Exerciser.
Figure 3.4
38
PETrainer ML Front Panel showing where Connectors A and C
Attach
Teledyne LeCroy
PETracer ML User Manual
Chapter 3: Installation
Add a PETracer ML to Device Emulation Test Setup
To add a PETracer ML to the above setup:
Step 1 Attach connectors A and C to the Exerciser as described above.
Step 2 Attach connectors B to Port 1 and connector D to Port 2 on the PETracer
ML Analyzer.
Figure 3.5
Teledyne LeCroy
PETracer ML Front Panel showing where Connectors B and D Attach
39
Chapter 3: Installation
PETracer ML User Manual
Add a PETracer ML to Host Emulation Test Setup
To add a PETracer ML to a Host Emulation setup:
Step 1 Attach connectors A and C to the Exerciser as described above.
Step 2 Attach connectors D to Port 1 and connector D to Port 2 on the
PETracer ML Analyzer.
Figure 3.6
PETracer ML Front Panel showing where Connectors B and D Attach
Final Steps: Connect USB Cable and Power On the Exerciser and
DUT
Step 1 Connect the provided USB cable between the UPAS 10K/PETrainer ML
and the host machine that runs the PETracer software.
Step 2 Power on the PCI Express system under test.
Step 3 Power on the UPAS 10K/Exerciser. The Exerciser's green power LED
lights, and the red status LED turns on for approximately 20 seconds
while the Exerciser performs self-diagnostics.
40
Teledyne LeCroy
PETracer ML User Manual
Section 2
Section 2. PETracer Analyzer Software
Teledyne LeCroy
41
Section 2
42
PETracer ML User Manual
Teledyne LeCroy
PETracer ML User Manual
Chapter 4: Software Overview
Chapter 4: Software Overview
4.1 The PETracer Software
The PETracer™ software administers Analyzer platforms and handles all CATC Trace
analysis and display. When a PETrainer™ Exerciser is present, the software generates
PCI Express™ traffic. The core software is thus the same for all of Teledyne LeCroy's
PCI Express products.
The software runs on a Windows®-based host machine that is attached to the Analyzer
via an Ethernet connection or a USB 2.0 connection (USB 1.0 is also supported).
PETracer software can be used without the Analyzer as a CATC Trace viewer for viewing,
analyzing and printing CATC Traces.
The PETracer software operates in Microsoft® Windows® XP and Vista environments.
Teledyne LeCroy
43
Chapter 4: Software Overview
PETracer ML User Manual
4.2 Application Layout
The PETracer application contains the following components:
Title bar: The title bar is at the top of the application window and displays the CATC Trace
file name or generation script name.
Menu bar: The menu bar is located below the title bar, by default. The menu bar can be
moved by clicking a blank area of the bar and then dragging the menu to a new position.
It can be docked in another part of the application window or moved outside of the window
to become a floating menu.
Toolbar: The toolbar is composed of buttons that represent the commonly used
commands. The toolbar divides into smaller toolbars that can be moved and docked in a
new position or made to float outside of the window.
Display area: The display area is the main part of the application window in which CATC
Traces are displayed.
Status bar: The status bar is located at the bottom of the application window. The left end
of the status bar displays descriptions of buttons and menu items when the mouse is
positioned over them. The right end of the bar shows the search direction.
44
Teledyne LeCroy
PETracer ML User Manual
Chapter 4: Software Overview
4.3 Using the Toolbar
You can use the PETracer application Toolbar as a shortcut to most of the operations
supplied by the menus.
Opens a previously recorded
CATC Trace file.
Edit as text.
Script Editor. Opens a text editor for editing traffic
generation files (*.peg)
Save As
Allows the open file to be saved
with a new name.
Setup Recording Options
Opens the Recording Options
dialog box.
Setup Display Options
Opens the Display Options dialog box.
Setup Generation Options
Opens the Generation Options
dialog box.
Start Recording.
Real Time Statistics monitor
Opens a window that displays real-time
information.
Stop Recording.
Disconnect/Connect Link.
Click once to break and momentarily later restore
link. Open menu to select either Connect or
Disconnect.
Repeat Upload.
Opens a dialog box that allows you
to select a portion of memory to
upload from memory, then causes
the Analyzer to re-send the
CATC Trace from the Analyzer
buffer to the host machine.
Teledyne LeCroy
45
Chapter 4: Software Overview
Zoom in display.
PETracer ML User Manual
Wraps display information.
Zoom out display.
Hide Training Sequence.
Hide Downstream traffic/recording.
Hide SKIP and Update FC
packets.
Advanced Hiding Options
Opens a dialog box that allows you to select
items to hide from view.
Hide Upstream recording/traffic.
Compact View
Toggles compacting of training sequences to
analyze CATC Trace data faster, or no
compacting to display more data.
Find
Opens a dialog box that allows you
to select one or more items to find
in the recording, then searches to
that point.
Find Next. Repeats last Find or Search action.
View Packet Level data.
View Link Transaction Level data.
46
View Split Transaction Level data
Teledyne LeCroy
PETracer ML User Manual
Chapter 4: Software Overview
File Information
Lists the conditions under which
the recording was made.
Bus Utilization
Opens a window that graphically represents
various information about the recording.
Error Report
Opens a window that lists all errors
identified in the recording.
Link Tracker
Opens a window that displays symbol information
per lane.
Traffic Summary
Opens a window that lists all
events that occurred during the
recording
Opens the Data Flow window.
Shows recorded data in a compressed tabular
format.
Navigator. Shows/hides the
Navigator bar - a utility that lets you
easily navigate the CATC Trace.
LTSSM Flow Graph
Shows a state diagram of the LinkTraining
and Status State machine.
Displays the Data/Payload
window for the current packet.
Displays the Packet Header bar.
Opens a window that displays the header
information in the current packet, as it would be
viewed in the specification.
Opens the Timing and Bus Usage
Calculations window.
Running Verification Scripts
Opens a dialog that allows you to select and run
verification scripts.
Multi-Segment Toolbar
First Segment. Open first segment
in the multisegment CATC Trace.
Index file. This button becomes active if a
multisegment CATC Trace file is open and
displays the index file for the recording.
Previous segment. Open previous
segment in the multisegment
CATC Trace.
Next Segment. Open next segment in
multisegment CATC Trace.
Last segment. Open last segment in
multisegment CATC Trace.
Teledyne LeCroy
47
Chapter 4: Software Overview
PETracer ML User Manual
Traffic Generation Toolbar
These buttons appear on the status bar at the bottom of the screen if a PETrainer™
Exerciser is attached. The buttons are explained below.
Start traffic generation
Resume traffic generation.
Stop traffic generation
Trainer Connect. Attempts to establish a G1
connection between PETrainer and the DUT.
Trainer Disconnect. Breaks the connection
between PETrainer and the DUT.
Read Address Space
Uploads information currently held
in the Exerciser memory space.
48
Write Address Space
Downloads information into Exerciser memory.
Teledyne LeCroy
PETracer ML User Manual
Chapter 4: Software Overview
Toolbar Hide Buttons
The PETracer application toolbar has five buttons related to show/hide of CATC Trace file
contents. The buttons allow you to quickly adjust the CATC Trace display to your needs.
Hide Training: Brings up a drop-down menu that lets you to hide all or a portion of the
packets in the training portion of the CATC Trace.
Hide SKIP and Update FC: Brings up a drop-down menu that lets you hide SKIP or
Update FC packets in a CATC Trace.
Hide Upstream: Hide all traffic from endpoint devices to the root complex.
{
Hide Downstream: Hide all traffic from the root complex to endpoint devices.
Teledyne LeCroy
49
Chapter 4: Software Overview
PETracer ML User Manual
Advanced Hiding Options: Brings up the Level Hiding pane of the Display Options
window. Use this pane to tune the show/hide options within the CATC Trace display.
50
Teledyne LeCroy
PETracer ML User Manual
Chapter 4: Software Overview
4.4 Using the Menus
The PETracer application main display includes the following set of pull-down menus:
File Menu
New PETrainer Script
Creates a new Traffic Generation file.
Open
Opens a file.
Close
Closes the current file.
Save as
Saves all or a specified range of packets to a uniquely named file.
Convert Old Files
Convert CATC Trace files made in previous versions of PETracer to the new format for
PETracer version 6.5x and higher.
Print
Prints part or all of the current traffic data file.
Print Preview
Produces an on-screen preview before printing.
Print Setup
Setup your current or new printer.
Edit Comment
Create or edit the comment field in a CATC Trace file.
Export
>> to Text
>> Packets to CSV Text
>> to Generator
File Format
Saves all or part of a CATC Trace to a text file or traffic generation file. This text file
summarizes the traffic in the CATC Trace.
Saves the CATC Trace to a text file in Comma Separated Value (CSV) format.
Saves the CATC Trace to a generation file.
Exit
Exit the PETracer application.
Teledyne LeCroy
51
Chapter 4: Software Overview
PETracer ML User Manual
Setup Menu
Display Options
Allows you to customize display options such as field colors, field formats and level
hiding.
Recording Options
Allows you to customize control and setup features associated with recording,
triggering, and filtering recorded events.
Generation Options
The Generation Options dialog box is used to set configuration settings in a traffic
generation script (*.peg). This dialog provides a convenient alternative means of
editing a traffic generation file.
Generation Macros
Opens a dialog for creating buttons on the status bar that can be used to run traffic
generation macros.
Update Device
Opens a dialog box that lets you update the BusEngine™ and Firmware.
Calibrate Device
Opens a dialog box that lets you calibrate the BusEngine™ and Firmware.
Analyzer Network
Displays the list of host machines with connected analyzers or exercisers that
you want to use for recording or traffic generation.
All Connected Devices
Opens a dialog box with a list of locally or remotely connected devices. Allows you to
update the BusEngine, Firmware, and your licensing information.
Record Menu
Start
Causes the Analyzer to begin recording traffic.
Stop
Causes the Analyzer to stop recording traffic.
Reupload
Causes the Analyzer to re-send all, or selected portions, of the CATC Trace from the
Analyzer buffer to the host machine.
Disconnect/Connect
Causes the Analyzer to momentarily break, and then establish the PCI Express link
connection in both link directions.
Reset Link Configuration
Causes the Analyzer to reset the Serdes and thereby reset the Analyzers current link
configuration. This command is needed when lane width or other lane settings are
changed. Otherwise, the old link configuration is used and errors are generated in the
CATC Trace.
52
Teledyne LeCroy
PETracer ML User Manual
Chapter 4: Software Overview
Generate Menu
Connect
Initializes the link between PETrainer and the device under test.
Disconnect
Disconnects the link between PETrainer and the device under test.
Write Address Space
Reads PETrainer internal memory used for address space mapping.
Read Address Space
Loads PETrainer internal memory used for address space mapping.
Report Menu
Report Menu operations are only available when you are working with a CATC Trace file.
File Information
Displays information about the file contents and describes the conditions of the file’s
recording (Recording Options, hardware information, and so on).
Error Summary
Displays an error summary of the current CATC Trace file and allows you to go to a
specific packet, and save the error file to a uniquely named file.
Traffic Summary
Details the number and types of packets that were transferred during the recording.
You can hide, save, send, text, print, and view.
Bus Utilization
Opens a window with graphs of bus usage for the open CATC Trace.
Link Tracker
Opens a window for displaying a detailed chronological view of traffic. The window
provides view and navigation options.
Data Flow
Opens the Data Flow Window, providing a tabular view of transactions and their
payload.
Trace Navigator
Shows the Navigator bar for navigating a CATC Trace. Shows a snapshot of the
recording and allows you to adjust the memory area for the view.
LTSSM Flow Graph
Shows a state diagram of bus activity. Also allows you to navigate through
the LTSSM, based on the current recording.
Packet Header
Opens the Packet Header bar, showing the Packet Header information as it would be
veiwed in the specification.
Packet Data/View Data
Opens the Data Window for the current packet, with the options: Hide, Save,
Hexadecimal, ASCII, Decimal, Binary, MSB Format, LSB Format, Big Endian, and
Little Endian. Format Line allows you to enter the number of bytes, words, or dwords
per line.
Configuration Space
Presents a list of Configuration Spaces. Clicking an item displays the selected
Configuration Space in a Configuration Table format.
Teledyne LeCroy
53
Chapter 4: Software Overview
PETracer ML User Manual
Search Menu
Search Menu operations are only available when you are working with a CATC Trace file.
Go to Trigger
Repositions the display to show the first packet following the trigger event.
Go to Packet
Repositions the display to a specific packet, Link Transaction, or Split Transaction
number.
Go to Time
Repositions the display to specific timestamp.
Go to Marker
Repositions the display to a previously marked packet, Link Transaction, or
Split Transaction.
Go to
Allows searching for specific link events: TLP Type, DLLP Type, .Ordered Set,
Link Event, Traffic Class, DLLP Virtual Channel, TLP Virtual Channel, Direction,
Speed, Link Width, Requester ID, Completer ID, Data Lengths, Errors.
Find
Displays the Find dialog to allow searching for various events within a CATC Trace.
You can search by Display Level: Packets, Link Transactions, Split Transactions.
You can search packets by Event Group: TLP Type, TLP Header, TLP Requester ID,
TLP Completer ID, TLP Data Pattern, TLP Data Lengths, TLP Tag,
TLP Sequence Number, DLLP Type, DLLP Header, DLLP Virtual Channel,
ACK/NAK Seq Number, Ordered Sets, Link Event, Direction, Errors.
You can search link transactions by Event Group: TLP Type, Traffic Class,
Virtual Channel, Direction, Requester ID, Completer ID, Status, Tag.
You can search split transactions by Event Group: TLP Type, Traffic Class,
Virtual Channel, Direction, Requester ID, Completer ID, Status, Tag.
Find allows you to create complex searches based on numerous criteria.
Find Next
Repeats the previous Find or Search operation.
Search Direction
Allows you to specify a forward or backward search of a CATC Trace file.
54
Teledyne LeCroy
PETracer ML User Manual
Chapter 4: Software Overview
View Menu
Toolbars>>
Displays available toolbars: Standard, Frequently Used, Analysis, and Transaction
Level. Use Customize to display the Windows Customize window.
Script Editor
Displays the Script Editor (only appears if a .peg file is open).
Analyzer Network
Chat Bar
Opens a chat window for communicating with persons working with networked
Analyzers. This command requires that your host machine be attached to a LAN. The
Chat window broadcasts messages to whatever host machines have been connected
to via the Analyzer Network command (under Setup in the menu).
Status Bar
Switches display of the Status Bar on or off.
Real Time Statistics
Opens the Real Time Statistics monitor dialog and displays a real-time graph of link
activity.
Zoom In
Zoom in increases the size of the displayed elements.
Zoom Out
Zoom out decreases the size of the displayed elements.
Wrap
Allows the display to wrap.
FC Credits
Toggles a display for tracking Flow Control Credit update and consumption on a PCI
Express link.
FC Credits Setup
Allows you to customize the display for tracking Flow Control Credits.
Compact View
Toggles compacting of the Link Training sequence to analyze CATC Trace
data faster or no compacting to display more data.
Packet Level
View the current recording at the Packet Level.
Link Transaction Level
View the current recording at the Link Transaction Level.
Split Transaction Level
View the current recording at the Split Transaction Level.
Teledyne LeCroy
55
Chapter 4: Software Overview
PETracer ML User Manual
Tools Menu
Configuration Space
Editor
Opens the Configuration Space Editor, allowing you to either create or modify the
Configuration Space of the Exerciser.
Memory/IO Space Editor
Opens the Memory/IO Space Editor, allowing you to either create or modify memory
spaces within the Exerciser.
TC to VC Mapping
Allows Traffic Classes to be mapped to Virtual Channels for purposes of simplifying
navigation (for example, Search > Go to > TLP Virtual Channel) and changing the way
the CATC Trace is displayed (for example, in Split Transactions).
Timing Calculations
Starts the mode-less calculator dialog for calculating various timing and bandwidth
parameters in the recording file.
Run Verification Scripts
Presents a list of verification scripts, from which you can run a verification script.
Window Menu
New Window
Opens a copy of the current CATC Trace window.
Cascade
Displays all open CATC Trace windows in an overlapping arrangement.
Tile
Displays all open CATC Trace windows as a series of strips across the display.
Arrange Icons
Arranges minimized CATC Trace windows at the bottom of the display.
Synchronize Traces
Synchronizes the CATC Trace View windows so that a move in one window
repositions the other window of the same recording.
Help Menu
Help Topics
Accesses the PETracer application's Online Help.
Register Product Online
Register at the Teledyne LeCroy website registration page.
Check for Updates
Check whether a new software version is available. If so, you can download
from the Teledyne LeCroy web site.
You can select to Check for updates at application startup
Update License
Displays a dialog box for entering updated license information.
Display License Information
Opens an information box describing the current license information.
About
Displays version information about the attached Analyzer and its Firmware and
BusEngine™.
56
Teledyne LeCroy
PETracer ML User Manual
Chapter 4: Software Overview
4.5 Tool Tips
Tool tips provide details about fields within the CATC Trace. To see a tool tip, position your
mouse pointer over a field within the CATC Trace.
You can turn off this capability in the Display Options menu.
4.6 Keyboard Shortcuts
Teledyne LeCroy
Keystrokes
Operation
Ctrl + N
New PETracer script
Ctrl+O
Open file
Ctrl+P
Print
Ctrl+S
Save file
Ctrl + R
Start Analyzer recording
Ctrl + T
Stop Analyzer recording
Ctrl+Home
Jump to first packet
Ctrl+End
Jump to last packet
Ctrl + G
Go to packet ...
Ctrl+F
Search forward
F3
Find next
F6
Next pane
Shift+F6
Previous pane
Ctrl+B
Search backward
57
Chapter 4: Software Overview
PETracer ML User Manual
4.7 Status Bar
The Status Bar is a gray bar that runs along the bottom of the application window.
From left to right:
PETracer SN:309: Analyzer Serial Number
Ready: Analyzer Status
Recording Progress Bar: The colored bar to the right of the serial number represents
how much traffic has been recorded. The trigger point is indicated by the black line at the
left side of the bar. In this example, the trigger occurred at the very beginning of the CATC
Trace. If the trigger is set in the middle of the CATC Trace, the line is positioned in the
middle of the bar. Additionally, the color of the bar is different on each side of the trigger
point. For examples, see “Recording Progress Bar” on page 60. The white strip along the
top edge of the color bar indicates how much traffic has been uploaded from the Analyzer
buffer to the host machine.
Uploading and 20%: Indicates the Analyzer's recording status, what part of the
recording process the Analyzer is now in. In this example, the Analyzer is in the upload
stage and has completed 20% of the upload from the Analyzer to the host machine. See
“Recording Status” on page 60 for details on other status messages.
Activity: The colored bar moves to indicate that the Analyzer is currently recording.
Search: Fwd: Indicates search direction. The direction can be toggled to Search: Bwd
by double-clicking the search direction or by selecting Search Direction from the Search
menu.
PETrainer Status Bar
When a PETrainer is attached, a Generation Status bar is displayed at the bottom of the
screen. This bar has buttons to start and stop generation and to break and re-establish
connection with the DUT. In addition, status info is displayed. See “Using the Toolbar” on
page 45 for an explanation of these buttons.
From left to right:
Buttons: Start Generation, Stop Generation, Resume Generation,
Start/Establish Connection, Break Connection, Write Address Space,
Read Address Space
Status: Link State, InitFC State, Trainer Status
58
Teledyne LeCroy
PETracer ML User Manual
Chapter 4: Software Overview
Link State Messages on PETrainer Status Bar
When running PETrainer, the status bar displays PETrainer buttons and status
information. The buttons allow you to start and stop traffic generation and to create and
break links between PETrainer and the DUT.
The Status bar has a section labeled Link State that displays messages about the
Trainer link. The following list shows what types of messages can be displayed:
•
Detect.Quiet
•
Detect.Active
•
Polling.Active
•
Polling.Compliance
•
Polling.Configuration
•
Polling.Speed
•
Configuration.Linkwidth.Start
•
Configuration.Linkwidth.Accept
•
Configuration.Lanenum.Wait
•
Configuration.Lanenum.Accept
•
Configuration.Complete
•
Configuration.Idle
•
L0
•
L0s.Idle
•
L0s.FTS
•
L1
•
L2
•
Recovery.RcvrLock
•
Recovery.RcvrCfg
•
Recovery.Idle
•
Loopback
•
Hot Reset
•
Disabled
InitFC State Messages on PETrainer Status Bar
The Status bar has a section labeled InitFC State that displays messages about the
Trainer InitFC State.
The following list shows what types of messages can be displayed:
Teledyne LeCroy
•
Not initialized
•
Pending
•
Complete
59
Chapter 4: Software Overview
PETracer ML User Manual
Recording Progress Bar
This indicator bar changes color to reflect the recording progress.
•
•
•
•
Black vertical line is at the location of Trigger position.
Black vertical line wiggles when Trigger Position is nearly reached.
Field to right of Trigger Position changes color to indicate post-trigger activity.
Upper half of progress indicator turns white when recording is complete.
Recording Status
The second segment from the left in the Status Bar indicates recording status.
During recording, this status flashes one of the following messages:
• Trigger?
• Triggered!
• Uploading
After recording stops, the message changes to
• Uploading data - x% done (where x equals the percent that has been uploaded.)
As uploading progresses, the percent increases to 100. You can abort this upload if you
wish by pressing the <escape> button on your keyboard or
clicking
in the Tool Bar.
Recording Activity
The third segment displays recorded activity. Activity is indicated in blue:
Search Direction Indicator
The fourth segment in the status bar indicates search direction. The direction can be
changed by selecting Search Direction from the Search menu.
60
Teledyne LeCroy
PETracer ML User Manual
Chapter 4: Software Overview
4.8 Making a PCI Express Recording
After connecting the Analyzer to the device(s), you must configure the
Recording Options. Then you can test the Analyzer by creating a 16-MB snapshot
recording.
To make this recording, follow these steps:
Step 1 From the Setup menu, select Recording Options.
Step 2 Select the General tab.
The following window displays the factory PETracer ML default settings in
Simple Mode, such as Snapshot and 16-MB buffer size. For your first recording,
you can leave these settings unchanged.
Step 3 In the Link section, specify the lane width of the PCI Express link to be
analyzed. The rest of the settings in this section can be left at the factory
defaults for most PCI Express systems.
Step 4 For multi-lane PCI Express links, the Analyzer needs to observe
link training in order to record link traffic correctly. If link training (or
re-training) is not easily controllable for the devices under test, the
Analyzer includes the capability to force link training by disconnecting
and reconnecting the PCI Express link.
Clicking the Connect/Disconnect
button disconnects the PCI Express
link for one second in both directions, then re-establishes the link.
Note: For x1 PCI Express links, it is not necessary for the Analyzer to observe
link training in order to record link traffic; this step may be skipped.
Teledyne LeCroy
61
Chapter 4: Software Overview
PETracer ML User Manual
Step 5 Click OK at the bottom of the Recording Options dialog box to apply the
Analyzer recording settings specified.
Step 6 Click the Record
button.
Stopping a Recording
You can stop the recording process at any time by pressing the Stop button
. This
causes the Analyzer to stop the recording and upload the CATC Trace to the host
machine. If you press the Stop button again, the Analyzer temporarily halts the upload
process and opens the following dialog box:
This dialog presents options for stopping, continuing, or aborting the upload:
•
Stop: Aborts further CATC Trace upload and displays whatever CATC Trace data
that has already been uploaded.
• Continue: Resumes the upload. This command tells the Analyzer to finish
uploading whatever CATC Trace data is still in its buffer.
• Flush: Flushes the CATC Trace without saving or displaying it.
If you allow the traffic data to be uploaded, it is automatically saved on the host machine’s
hard drive as a file named data.pex or the name you assign as the default filename in the
recording options.
Saving a Recording
Step 1 To save a current recording for future reference, select Save As from the
File menu.
Step 2 Give the recording a unique name, then save it to the appropriate
directory.
62
Teledyne LeCroy
PETracer ML User Manual
Chapter 4: Software Overview
4.9 Recording Multi-Segmented CATC Traces
If Save as Multisegment trace is enabled, PETracer divides the CATC Trace as it
records it into segments and stores them on the host machine's hard drive.
This option is useful for very large recordings and for host machines with limited memory.
In the latter case, multi-segmenting gives a host machine with limited memory a way to
open recordings that are otherwise too large to open.
The only downside to multi-segmenting is that limits the scope of reports such as
Traffic Summary, Bus Utilization, and Error Summary to each of the segments. You
cannot perform summary statistics on the full recording.
The default segment size is 10 MB. Before attempting large recordings, it is
recommended that you play with this number to see what value best suits your needs.
How to Create a Multisegment Recording
To create a Multisegment recording:
Step 1 Select Setup > Recording Options to open the Recording Options
dialog at the General tab. Click Switch to Advanced Mode.
Step 2 Check the box marked Save as Multisegment trace.
Step 3 In the box marked MB Segments, enter a value of 4 to 128 MB.
What Gets Created
Multisegmenting produces an index file and segmented CATC Trace files. The default
name of the index file is data.pem.
The index file and the segmented CATC Trace files are stored in a directory named after
the index file. The directory is named data_pem_files. Below this directory additional,
sequentially numbered sub-directories (up to 100,000) hold the segmented CATC Trace
files. These sub-directories bear simple numerical names: 00000 to 00999. Each of these
subdirectories can hold up to 100 sequentially numbered segment files. Collectively, the
entire directory structure can hold up to 10 million files.
Teledyne LeCroy
63
Chapter 4: Software Overview
PETracer ML User Manual
Example
If you create a 1010 MB recording using 10 MB segments, the following files and
sub-directories are created:
data.pem (This is the index file.)
data_pem_files\00000\segment_00000.pex
data_pem_files\00000\segment_00001.pex
...
data_pem_files\00000\segment_00099.pex
data_pem_files\00001\segment_00100.pex
data_pem_files\00001\segment_00101.pex
Note:
64
An additional index file is created called segments.col. This is an internal
system file that users should not modify.
Teledyne LeCroy
PETracer ML User Manual
Chapter 4: Software Overview
4.10 PETracer Files
The PETracer software creates and uses different kinds of files:
•
•
•
Trace Files: Recorded traffic
Recording Options Files: Configuration file that contains the various options
selected in the Recording Options dialog box to configure the recording
Display Options Files: Configuration file that contains the options selected in the
Display Options dialog box to configure how traffic is displayed
CATC Trace Files
PETracer records PCI Express traffic into a CATC Trace file with the default name
data.pex or any other that you specified in the Recording Options. This file is overwritten
with new data each time PCI Express traffic is recorded. If recording an x8 link using two
PETracer ML™ units, the CATC Trace files from the separate Analyzer units are merged
into a single file with the default name data.pex.
When Multisegment CATC Traces are created, a special index file is also created called
<filename>.pem. This index file provides a high level view of the CATC Trace segments
created in the recording session.
If you want to save a CATC Trace, use the File > Save As function. This option allows
you to save the current CATC Trace to a unique file name, thereby ensuring that it is not
overwritten. This option also allows you to save a range of packets in a CATC Trace file.
You can pre-define the name of the recorded CATC Trace file using the Trace Filename
and Path option in Recording Options.
Recording Options Files
Recording Options files are created when you set recording options. These files use the
.rec extension and contain recording option information.
Display Options Files
Display Options files are created when you set display options. These files use the .opt
extension and contain the display options information.
Teledyne LeCroy
65
Chapter 4: Software Overview
PETracer ML User Manual
4.11 Opening CATC Trace Files
To open an existing CATC Trace file, click File > Open or
.
If the file was made in a previous version of PETracer, the application presents the
Convert dialog box:
You must convert CATC Trace files made in previous versions of PETracer for them to
open in PETracer version 6.5x or higher. The converted file has all the information that
was in the original file.
You can:
Note:
66
•
Convert & Backup old file: Convert the file, open it in PETracer version 6.5x
or higher, and save it with the original name. Save the original file with the
same name plus the extension .bak.
•
Convert: Convert the file, open it in PETracer version 6.5x or higher, and save
it with the original name.
After you convert a CATC Trace file, you cannot open the converted file in a
previous PETracer version.
Teledyne LeCroy
PETracer ML User Manual
Chapter 4: Software Overview
4.12 Saving CATC Trace Files
Using the Save As Function
When you record a CATC Trace file, the Analyzer software provides a pre-defined name
to the CATC Trace file (data.pex or any other that you specified in the Recording
Options). If you do consecutive recordings, each time the previous recording is
overwritten. If you see a recording you want to analyze later, you need to give a unique
name to the CATC Trace file, so it is not overwritten with the next recording.
Also, when you analyze a recorded CATC Trace file, you might be interested in
preserving just a part of the PCI Express traffic that was recorded. If you save a portion
of a CATC Trace file, it can get significantly smaller, allowing you to attach it to an e-mail.
To save a portion of a CATC Trace file or the whole file to a unique name, select Save As
from the File menu.
If you want to give a unique name to the CATC Trace file, select the All option and keep
Rename original file checked. This is the default setting for the dialog.
Saving a Portion of a CATC Trace
If you want to save a portion of a CATC Trace file, select Save packet range. Enter
starting and ending packet numbers in the From Packet and To Packet fields. By default,
it has the numbers of the first and the last packets in the file. The software is going to save
all the packets in specified range to the new file, unless you have Do not save hidden
packets checked. In this case it is going to save all packets in the range, EXCLUDING
the currently hidden packets.
Teledyne LeCroy
67
Chapter 4: Software Overview
PETracer ML User Manual
4.13 Exporting a CATC Trace File
By default, PETracer saves CATC Trace files in the .pex format. However, you can export
a CATC Trace to a file in any of the following other formats:
•
Text
•
Comma Separated Value (CSV)
•
Generator file format
Exporting to Generator file format is a simple way to create a script file from your CATC
Trace.
To export a CATC Trace file, select File > Export:
68
Teledyne LeCroy
PETracer ML User Manual
Chapter 4: Software Overview
4.14 Printing Data Files
To print all or part of the open CATC Trace:
Step 1 Select File > Print from the menu or
click the Printer
button on the toolbar.
The Print Packets dialog opens:
Step 2 To select a range of packets, enter values in the From packet # and To
packet # fields and click Print.
Step 3 To print an entire file, leave the From and To fields empty and click Print.
The specified traffic information is printed as currently displayed, in color or gray scale as
supported by your printer. Any CATC Trace File comments you entered are printed
following the current document name at the top of each page.
Note: CATC Trace File comments can be created by using Edit Comment on the File
menu.
Teledyne LeCroy
69
Chapter 4: Software Overview
PETracer ML User Manual
4.15 Analyzer Chat Window
PETracer has a Chat window that allows you to communicate with users on remote host
machines. For Chat to work, two conditions must be met:
1. The host machines must have PETracer software installed and running.
2. The host machines must be listed in each other's Network Browse list. This means that
your host machine must have the remote host machine listed in its Network Browse
window and the remote host machine must have your host machine listed in its Network
Browse window.
If the above conditions are met, a Chat session is initiated by running the command:
View > Analyzer Network Chat Bar. The following dialog opens.
Enter some text, then press Send. The message is then broadcast to all host machines
listed in your network browse window. If a target host machine also lists your host
machine in its Network Browse window, then it can receive your message. When the
message arrives, the Chat window automatically opens.
70
Teledyne LeCroy
PETracer ML User Manual
Chapter 5: Reading CATC Traces
Chapter 5: Reading CATC Traces
5.1 Viewing PCI Express CATC Traces
PETracer™ displays traffic as labeled, color-coded, and time-stamped rows.
Tool tips provide details about fields within the CATC Trace. Hold the mouse cursor over
a field to see a tool tip.
Additional information is available from pop-up menus. For example, if you click the left
mouse button on the first cell in a packet a menu appears with an option to view
Raw 10b Codes.
5.2 Expand and Collapse Data Fields
Packet data fields are displayed in a short format by default.
You can view a data field’s long format by performing one of the following three actions:
•
Click the small triangle in the left corner.
•
Double-click anywhere in the data field.
•
Click once in the Data Field with the left mouse button, then choose
Expand Data from the pop-up menu.
A repeat of any above methods causes the display to return to a Short Data format.
5.3 Resizing Cells
Data cells can be resized by pointing the mouse pointer on the edge of a data cell,
depressing and holding the left mouse button, and then repositioning the mouse pointer
while keeping the mouse button depressed.
Teledyne LeCroy
71
Chapter 5: Reading CATC Traces
PETracer ML User Manual
5.4 Pop-up Menus
The Analyzer software makes extensive use of pop-up menus. In some instances,
pop-up menus provide the only means of accessing dialog boxes that contain detailed
information about cells within the CATC Trace, for example, the Show Configuration
Space dialog box.
To see a pop-up menu, left-click or right-click a cell within the CATC Trace. Right-click or
left-click behavior depends on the Display Options setting. For default left-click, the
right-click menu is not cell-dependent. For other left-click behavior, the type of menu that
opens varies depending on the type of cell that is selected. Take some time to explore
CATC Traces and the various pop-up menus.
5.5 View Data Block
To view the raw bits that make up the data in a data field, left-click a data field, then click
or select View Data Block from the pop-up menu to display the Data Block window.
You can display data in Hexidecimal, ASCII, Decimal, or Binary formats.
Bit Order is Most Significant Bit or Least Significant Bit.
You can display data in Big Endian or Little Endian.
Format lets you display data as BYTEs, WORDs, or DWORDs.
Columns lets you select the number of columns.
You can enter hexidecimal offset values.
You can go to or search Previous or Next.
72
Teledyne LeCroy
PETracer ML User Manual
Chapter 5: Reading CATC Traces
5.6 Show Raw 10b Codes
You can view the raw bits that make up the data field by left-clicking the field and selecting
View Data Block from the pop-up menu.
To view Raw 10b Codes:
Step 1 Left-click the first cell in a packet.
Step 2 Select Show Raw 10b Codes from the pop-up menu to display the
Raw 10b Codes window.
Step 3 To change the format of the data, use the options along the right side of
the dialog.
Step 4 To navigate the CATC Trace, use the Prev and Next buttons.
Teledyne LeCroy
73
Chapter 5: Reading CATC Traces
PETracer ML User Manual
5.7 Show Header Fields
You can view details about header fields by opening the Show Header Fields dialog box.
Step 1 Click a header. A pop-up menu appears.
Step 2 Select Show Header Fields. The following dialog box opens.
Step 3 Use the Prev and Next buttons to navigate to other headers.
74
Teledyne LeCroy
PETracer ML User Manual
Chapter 5: Reading CATC Traces
5.8 Packet Cell Popup Menus
The Packet cell has a left-click pop-up menu that includes the Show Raw 10b Codes
command:
The right-click pop-up menu from Packet cell is:
Packet Header R-> Cell Popup Menu
The Packet Header R-> cell has a pop-up menu with the Swap Upstream/Downstream
command, which changes the directionality of the packets in the CATC Trace.
Teledyne LeCroy
75
Chapter 5: Reading CATC Traces
PETracer ML User Manual
Packet Header G1 Cell Popup Menu
The Packet Header G1 cell has a pop-up menu with the Show Header Fields command
(see “Show Header Fields” on page 74), which exposes a detailed view of the selected
Header field.
76
Teledyne LeCroy
PETracer ML User Manual
Chapter 5: Reading CATC Traces
5.9 Set Marker
A marker is a unique label for a packet that allows you to go to that packet and also serves
as a comment string for a specific packet. When you select a marker, the identified
packet appears at the top of the screen. Packets that have been marked have a red bar
on the left edge.
To set a marker, perform the following steps:
Step 1 Left-click the Packet field of the packet you want to mark.
Step 2 Click Set Marker.
Step 3 When the Edit Marker for Packet # pop-up appears, enter a unique
identifier for the packet in the Comment field.
Later, you can go directly to this packet using the Go To Marker operation in the Search
Menu.
Teledyne LeCroy
77
Chapter 5: Reading CATC Traces
PETracer ML User Manual
5.10 Edit or Clear Marker
To change a markers identifier, or clear (delete) the marker:
Step 1 Left-click the Packet field of the desired packet to display a pop-up
menu:
Step 2 Choose Edit Marker and enter a new identifier into the
Edit Marker for Packer # pop-up, or
Choose Clear Marker. When you choose Clear Marker, the marker is
removed and the red line disappears.
78
Teledyne LeCroy
PETracer ML User Manual
Chapter 5: Reading CATC Traces
5.11 Decoding Traffic
The PETracer software has three decode levels:
Packet
Packet level decode
includes all TLP packets, DLLP packets, and all ordered sets.
Link
Link level decode
is composed of TLP packets matched with a corresponding ACK
or NAK coming from the opposite direction.
Split
Split level decode
is composed of two Link transactions, the Request TLP and the
Completion TLP from the other direction.
Teledyne LeCroy
79
Chapter 5: Reading CATC Traces
80
PETracer ML User Manual
Teledyne LeCroy
PETracer ML User Manual
Chapter 6: Searching CATC Traces
Chapter 6: Searching CATC Traces
This chapter describes how to search for CATC Trace events.
6.1 CATC Trace Search Overview
Several search commands let you navigate a CATC Trace view to search for key events,
such as errors and triggers.
To view the search options, click Search in the Menu bar.
6.2 Go to Trigger
To position a trigger packet at the top of the screen:
•
Select Search > Go to Trigger.
6.3 Go to Packet
To position a packet at the top of the screen:
Step 1 Select Go to Packet from the Search menu. A pop-up menu prompts
you for the packet number, marker, or time.
Step 2 Enter the packet number, marker, or time.
Step 3 Click OK.
Teledyne LeCroy
81
Chapter 6: Searching CATC Traces
PETracer ML User Manual
6.4 Go to Time
To position a specific time at the top of the screen:
Step 1 Select Go to Time from the Search menu. A pop-up menu prompts you
for the time in Seconds or Clocks.
Step 2 Enter the time and format (seconds or clocks).
Step 3 Click Go.
6.5 Go to Marker
Use this operation to go directly to a specific packet that has been marked with a unique marker by the Set Marker operation. To go to a marker: 1. Select Go To Marker from the Search Menu.
2. Select the marker you want from the fly‐out menu.
Alternatively, select All Markers to display the All Markers window, then select a marker and click Goto.
82
Teledyne LeCroy
PETracer ML User Manual
Chapter 6: Searching CATC Traces
The packet you want appears at the top of the screen. Marked packets have a red bar on the left edge.
Markers
This section explains the features of Markers. A marker is an entity that flags a physical or logical item of interest within a trace file. A marker contains one or more attachments. You can add a marker to a trace file or unmark a trace file by removing the marker.
Markers are represented graphically in a different way in the application.You can not only add markers to the packets but it is granular enabling you to also add markers to individual cells.
Markers Overview
This functionality provides the user an easy way to navigate through attachments which is a discrete piece of information or data added to a marker, for example, a text description or file, an attachment of a trace file by a predefined order, video or audio files, URL links or any other files. Teledyne LeCroy
83
Chapter 6: Searching CATC Traces
PETracer ML User Manual
Functionality of Markers
The markers functionality allows you to add markers to: •
Whole packets or frames
•
Specific Cells
•
Specific values within a cell: Bytes, words, etc.
You can add attachments to markers.
Right‐click on any cell of a packet and select Set Marker from the menu as shown below.
select an option. The Create Marker dialog displays (see Figure on page 85).
84
Teledyne LeCroy
PETracer ML User Manual
Chapter 6: Searching CATC Traces
Create Marker for Packet Dialog
As shown above you can:
Add icon. Click on this icon to add any file. See “Adding an Attachment” on page 86.
Record icon. Click on this icon to record audio. See “Recording an Audio File” on page 87.
Export icon. Click on this icon to export an attachment.
Delete icon. Click on this icon to delete an attachment
New URL icon. Click on this icon to add any URL.
Teledyne LeCroy
85
Chapter 6: Searching CATC Traces
PETracer ML User Manual
Attaching Markers
You can attach a discrete piece of information/data to a marker, for example, a text description or file, an attachment of a trace file by a predefined order, video or audio files, URL links or any other files. You can also remove an attachment from a Marker.
Adding an Attachment
Perform the following steps to add an attachment to a marker:
1. Right‐click on any cell in the trace and select Set Marker.
The Create Marker window displays.
2. Click on the Add icon.
The Add File to the Marker dialog displays.
3. Go to the file and select it to add it to the marker as an attachment.
4. Click Open.
The file will appear in the Create Marker for Transfer... dialog as shown below. The Marker # appears in the top panel, the icons are displayed in the second panel and you can click on the icon on the third panel to view the file you are about to attach.
5. Click OK to add the attachments.
86
Teledyne LeCroy
PETracer ML User Manual
Chapter 6: Searching CATC Traces
Create Marker for Transfer Dialog
Recording an Audio File
The audio quality supports voice attachment and is not designed for high‐quality audio Playback of audio content is not limited and depends on the formats supported by the installed playback engine.
Click the record icon and speak into the microphone to record an audio file.
Note: This functionality is disabled if a microphone is not installed.
Video Files supported
The user can attach video clips to the trace file (“add to the marker”). The playback of the Video clips is limited to the formats that are supported by the video codecs installed in the system. Teledyne LeCroy
87
Chapter 6: Searching CATC Traces
PETracer ML User Manual
Attachment Types and Visualization
The markers are represented graphically by a yellow triangle at the top right of the marked item and a red vertical bar at the left‐most cell of a packet as shown below. Marked Cell
A marker may comprise any number of attachments of any types.
Embedded Attachments to a Marker
Embedded files are attached to the item marked and transported with the trace. You can embed the following types of files to a marker:
•
Audio Files
•
Video Files
•
Image Files
•
YouTube Files
•
Web Pages
•
Text Attachments
•
Other Attachments
Attachments are embedded in the marker and saved in the trace file. Once attachments are placed in a marker, the marker can then be presented to a user in a story structured form. On opening the marker the window resembles the marker editing dialog.
Note: The use of Audio and Video markers is limited to the file types supported on a user’s system. CATC Walk has been tested with .mp3 and .wmv files, which are supported by Windows as installed. If additional codecs are installed, they should also work, but it is the user’s responsibility to choose formats that will work for whomever they intend to exchange CATC trace files (no different than email attachments in this regard). Because of this dependency on installed codecs, there are situations where bugs in the codecs supplied by Microsoft or third‐party applications can prevent proper operation of the Teledyne LeCroy PETracer application. See the Teledyne LeCroy PETracer Application 88
Teledyne LeCroy
PETracer ML User Manual
Chapter 6: Searching CATC Traces
Read‐Me file for more information if you have problems with application crashes, etc.
Viewing Attachments of a Marker
If you hover over the marked cell (yellow triangle at the top right of the marked item), refer to “Attachment Types and Visualization” on page 88, a window pops up displaying the contents of the marked cell as shown below. To view an attachment you can click on any of the icons in the attachment bar and or you can double‐click on the icon itself to open the attachment.
Pop-up Displaying Marker Contents
Text
The text attachment is displayed in the icon bar and in the main pop‐up window. Text attachments are always shown at the top. The attachment file name is displayed in the field as shown below.
Teledyne LeCroy
89
Chapter 6: Searching CATC Traces
PETracer ML User Manual
Text Attachment Pop-up Window
If there is no attachment, No Attachments displays in the status bar at the bottom.
No Attachments Pop-up Window
If there are attachments, the status bar is hidden. You can move the cursor to an attachment icon in the list view and a preview of the attachment starts.
Preview Attachments Pop-up Window
90
Teledyne LeCroy
PETracer ML User Manual
Chapter 6: Searching CATC Traces
Audio
Audio snippets that are recorded and attached to certain point of interest in a trace can be played. The basic Play, Start, Stop, Pause buttons are displayed to listen to the audio file.
Teledyne LeCroy
91
Chapter 6: Searching CATC Traces
PETracer ML User Manual
Video
Video clips that are recorded and attached to certain point of interest in a trace can be played. The video is embedded in the tooltip with simple playback controls.
File Attachment
You can attach any kind of file, including images, PDFs, documents, media files, etc. URL Link
You can specify a URL that links to a web page (i.e., YouTube), a network location, or a local file‐system location.
Web Link
Due to the small size, the web page is not embedded in the callout. You can use the Open button to open the web link in the default web browser.
92
Teledyne LeCroy
PETracer ML User Manual
Chapter 6: Searching CATC Traces
YouTube Video
YouTube’s video player is embedded for YouTube Video playback.
Teledyne LeCroy
93
Chapter 6: Searching CATC Traces
PETracer ML User Manual
Images
The image is embedded in the trace.
Other Attachments
Click the Open button to open the attachment file with the system’s default application for that file type. Edit Marker
To edit a marker, right‐click on the marked item and select Edit marker from the menu. The Edit Marker dialog displays. This Edit Marker window can be used to edit one marker at a time.
You can do the following in the Edit Marker dialog:
94
•
Edit text attachment.
•
Record audio attachment.
•
Add URL link attachment
Teledyne LeCroy
PETracer ML User Manual
Chapter 6: Searching CATC Traces
•
Add a file attachment. Click on File and click the Open button
or drag and drop the file.
•
Preview audio/video/image/URL/YouTube attachment or open
other files with system default application.
•
Save an attachment to a file.
•
Remove attachment.
EDIT Marker for Packet Dialog
All Markers Window
Select Search > Go to Marker > All Markers or press Ctrl + M to display a list of all the markers in the file. The window uses a tree structure to show packets, fields and markers. The features of the Markers window are:
Teledyne LeCroy
•
All Markers are displayed
•
All attachments within the marker are displayed
•
You can collapse or expand the item marked to view the
attachments
•
The Time and size of audio and video files are displayed
•
You can edit Playlists from this window
95
Chapter 6: Searching CATC Traces
PETracer ML User Manual
•
You can edit or remove a marker from this location
•
You can filter attachments within the marker
Edit Marker Dialog
96
Teledyne LeCroy
PETracer ML User Manual
Chapter 6: Searching CATC Traces
You can filter to show or hide text, image, audio, video, URL, YouTube videos and other files.
Filter Dialog
6.6 CATC Walk Playlist
This feature allows users to configure sequences of attachments into playlists. Any arbitrary order of attachments are allowed, and there are no limits on the number of playlists supported. This feature can be used for collaborating among developers as well for training, support and marketing purposes.
To access a playlist click on the View menu in the top toolbar of application, select CATC Walk and then select Manage Playlists as shown below.
Teledyne LeCroy
97
Chapter 6: Searching CATC Traces
PETracer ML User Manual
Edit CATC Walk Playlists Dialog
Playlist Functionality
You can do the following to manage playlists:
•
Remove or edit current playlists
•
Edit the playlist name
•
Edit the playlist description
•
List the sequence of attachments in current playlist
•
List of all available attachments and drag/drop to a playlist.
As shown in the previous figure the Playlist window lists the markers with their attachments on the left and the playlist on the right.
98
Teledyne LeCroy
PETracer ML User Manual
Chapter 6: Searching CATC Traces
Edit CATC Walk Playlists Dialog
You can drag and drop and item or attachment from the Marker panel into the Playlist panel and build a story. Give a description of the playlist in the Description field and you can give a name to the playlist in the Name field.
You can add a new playlist by clicking on the green plus sign (+) on the right top corner of the Playlist panel, or delete a playlist by clicking the red (x) button.
If you have more than one playlist saved click on the Name drop‐down arrow to select it. The drop‐down menu lists all the available playlists
Teledyne LeCroy
99
Chapter 6: Searching CATC Traces
PETracer ML User Manual
Playback Window
To playback a playlist, click on the View menu in the top toolbar of application, select CATC Walk and then select Play > Playlist 1 as shown below.
View Dialog
The attachment item starts to play in the playback window as shown below.
Playback Window
The playback window is resizable. The close button at the top right corner and the size grip for resizing at the bottom right corner will hide automatically when moving the cursor out of the window.
Users can provide commentary to a captured trace, converting it into a script or a story and can transfer this meta‐information to others. Playlist Playback Controls.
100
Teledyne LeCroy
PETracer ML User Manual
Chapter 6: Searching CATC Traces
Playlist Playback Controls
The playlist playback control buttons are:
•
Play/Pause
•
Stop
•
Jump to Next attachment
•
Jump to Previous attachment
•
Seek slider for seeking to positions in media streams
•
Volume slider
•
Playback speed slider (for text attachments)
As a playlist is played back, the playback window is displayed in close proximity to the marked area, just like a regular tooltip window.
As the playback progresses, the view jumps to the element corresponding to the current attachment being played and the marked element is highlighted. During playback the user is prevented from interacting with the trace. To reinforce this restriction, the trace view is grayed‐out visually, and only the packet with the item corresponding to the current attachment is colorized.
Playback Window
Teledyne LeCroy
101
Chapter 6: Searching CATC Traces
PETracer ML User Manual
6.7 Go To Menu
The Go To menu in the Search menu provides a quick way to search for a packet based
on a simple condition. You can search for the following types of events:
102
•
TLP Type
•
DLLP Type
•
Ordered Set
•
Link Event
•
Traffic Class
•
DLLP Virtual Channel
•
TLP Virtual Channel
•
Direction
•
Speed
•
Link Width
•
Requester ID
•
Completer ID
•
Data Lengths
•
Errors
Teledyne LeCroy
PETracer ML User Manual
Chapter 6: Searching CATC Traces
6.8 Search Direction
Search direction can be toggled back and forth by using the command under the Search
menu. Search Direction controls the direction of the search. Each time Search Direction
is selected, the search order is reversed. For example, if the previous search was
forward, choosing Search Direction toggles the current search to backward.
To verify the direction of a search look at the lower right corner of the screen.
Search: Bwd or Search: Fwd should appear. If a direction is not indicated, it means that
the status bar is turned off.
To turn on the Status bar, select from the menu View > Status Bar.
Keyboard shortcuts can also be used to control search direction:
Teledyne LeCroy
•
Control-f means Search Forward.
•
Control-b means Search Backward.
103
Chapter 6: Searching CATC Traces
PETracer ML User Manual
6.9 Find
Find allows you to conduct complex searches in a CATC Trace. You can search by
protocol level (Packets, Link Transactions, Split Transactions).
You can search packets by Event Group: TLP Type, TLP Header,
TLP Prefix (Summit T2-16 only), TLP Requester ID, TLP Completer ID,
TLP Data Pattern, TLP Data Lengths, TLP Tag, TLP Sequence Number, DLLP Type,
DLLP Header, DLLP Virtual Channel, ACK/NAK Seq Number, Ordered Sets, Link Event,
Direction, Errors.
You can search link transactions by Event Group: TLP Type, Traffic Class,
Virtual Channel, Direction, Requester ID, Completer ID, Status, Tag.
You can search split transactions by Event Group: TLP Type, Traffic Class,
Virtual Channel, Direction, Requester ID, Completer ID, Status, Tag.
The options Union, Intersection, and Exclusion allow you to create complex searches
such as "Find x OR y" or "Exclude all x or y."
To find a item:
Step 1 Open a CATC Trace.
Step 2 Open Find by selecting Search > Find from the menu or clicking
.
Step 3 From the Search For menu, select a display level such as Packets.
To search multiple levels, finish steps 3 to 9, and then repeat 3 to 9 for
each additional display level.
104
Teledyne LeCroy
PETracer ML User Manual
Chapter 6: Searching CATC Traces
Step 4 From the Event Groups menu, select an Event Group. The menu in the
far right of the dialog box is context sensitive and changes to reflect the
options for that group.
Step 5 In the menu in the far right, select one or more items.
Step 6 Repeat Step 5 for each Event Group of interest for the selected display
level.
Step 7 Under Direction, select Forward or Backward to select a search
direction.
Step 8 Under Origin, select a starting point for the search.
Step 9 Under Combining Specified Event Groups, select
The options Union, Intersection, and Exclusion let you set conditions on your
searches:
•
Union: To search for any of the selected criteria.
Example: "Find packets with ANY of the following characteristics …"
•
Intersection: To search for all of the selected criteria.
Example: "Find packets with ALL of the following characteristics …"
•
Exclude: To exclude items from a search. This option works in conjunction
with Union and Intersection. You select Union and Exclude to exclude any of
the specified traffic. You select Intersection and Exclude to exclude all of the
specified traffic.
Example: "Exclude packets with ANY of the following …" or
"Exclude packets with ALL of the following …"
Step 10 Repeat Steps 3 through 9 for additional display levels.
Step 11 Find All displays all matching packets or transactions in a separate
view.
Step 12 Search in Hidden includes hidden packets or transactions in the
search.
Step 13 Click OK.
Teledyne LeCroy
105
Chapter 6: Searching CATC Traces
PETracer ML User Manual
Event Groups
The Event Groups for Packets are:
•
TLP Type
•
TLP Header
•
TLP Prefix (Summit T2-16 only)
•
TLP Requester ID
•
TLP Completer ID
•
TLP Data Pattern
•
TLP Data Lengths
•
TLP Traffic Class
•
TLP Tag
•
TLP Sequence Number
•
DLLP Type
•
DLLP Header
•
DLLP Virtual Channel
•
ACK/NAK Seq Number
•
Ordered Sets
•
Link Event
•
Direction
•
Errors
The Event Groups for Link Transactions and Split Transactions are:
•
TLP Type
•
Traffic Class
•
Virtual Channel
•
Direction
•
RequesterID
•
CompleterID
•
Status
•
Tag
6.10 Search for the Next Packet Type
Use Find Nextor click
106
to search for the next packet meeting the search criteria.
Teledyne LeCroy
PETracer ML User Manual
Chapter 7: Display Options
Chapter 7: Display Options
7.1 Setting Display Options
Display Options allow you to customize the colors and formats of displayed traffic.
To open the Display Options dialog at the General tab, Select Setup > Display Options
from the menu or
click the Display Options button
on the toolbar.
Teledyne LeCroy
107
Chapter 7: Display Options
PETracer ML User Manual
7.2 Specifying General Display Options
The Display Options General tab allows you to specify:
Zoom Level: Defines the size of packet fields in the packet view. Zoom level is adjustable
as 10, 20, 40, 60, 80, 100, 120, 140, 160, 180 and 200 percent.
Enable Tool tips: Allows information to be displayed on a packet by resting your mouse
pointer over it.
Wrap: Allows packets, Link Transactions, and Split Transactions to wrap within the
display.
Right click cell context menu: Swaps mouse functions.
Hierarchy Lines: Adds lines to the trace view indicating relations between packets,
Link Transactions, and Split Transactions.
Timestamp position: Moves timestamp location from end of packet to beginning of
packet, or merges it with the packet number.
Trace Viewing Level: Allows the CATC Trace to be displayed in different hierarchical
levels: Packets, Link Transactions, and Split Transactions.
Time Stamp: Gives you options for setting the timestamp to zero for either the first CATC
Trace packet or the trigger packet or for leaving the stamp unchanged as it was originally
recorded.
Analysis Tools Checkboxes
Error Report: Opens Traffic Summary window and displays list of errors that occurred in
the CATC Trace.
Timing Calculator: Opens Timing Calculator dialog for calculating timing between
events.
Traffic Summary: Displays a table of events that occurred in the CATC Trace.
Bus Utilization: Opens a graph of bus usage in the open CATC Trace.
Link Tracker: Opens window that displays traffic on a per lane basis in a strictly
chronological view.
Navigator: Displays/Hides Navigation bar. The Navigation bar lets you see in a glance
the position of errors and triggers in a CATC Trace and narrow the range of traffic
displayed in the CATC Trace window.
Data: Displays packet payload information in various formats.
Real-Time Statistics: Opens a dialog that displays a graph of bus activity on the DUT in
real-time, as well as other statistical information.
Fonts
Fonts: Allows the appearance of field text and/or data text to be defined.
108
Teledyne LeCroy
PETracer ML User Manual
Chapter 7: Display Options
Configuration Name
Display Configuration Name: This field is used to enter a text string to be associated
with the current set of Display Options. This name is saved with the Display Options file,
and appears as part of the title of the packet view window that uses this set of Display
Options.
7.3 Color, Format, and Hiding Options
The Color/Format/Hiding tab allows you to customize the colors and formats associated
with each field in the CATC Trace and to selectively hide fields or packets. You access
these display options by selecting Setup > Display Options > Color/Format/Hiding
tab.
The Color/Format/Hiding property page lets you set how fields display in a CATC Trace.
This property page lets you set field color and data format (binary, hex, decimal, ASCII),
and lets you hide selected fields from the display.
Teledyne LeCroy
109
Chapter 7: Display Options
PETracer ML User Manual
Setting Field Colors
The Field Colors tab allows you to customize the colors associated with each field used
in the packet view.
You may experiment with this option to achieve a color combination that suits you.
Select or change the trigger color using the color buttons labeled - Packet # and
+ Packet # (before and after trigger) found under the Packet# section of the Field Colors
window.
You select or change a color by clicking the appropriate color button. This action causes
a color palette to pop up. Select the desired color and press OK.
Step 1 Click View > Set Display Options to open the Display Options dialog
box.
Step 2 Select the Color/Format/Hiding property page.
Step 3 Under the Group and Colors column, click the plus symbol (+) next to
the group you want to reformat. The group expands to show the
individual fields within the group. Each field has a color, as shown below:
Step 4 Click the colored cell that you want to change. A color palette appears.
Step 5 Click a color in the palette, then click Apply or OK.
Note: The colors of the following Frame types cannot be changed:
110
•
Invalid Data (frame error) field (red)
•
Softbit Errors (yellow)
Teledyne LeCroy
PETracer ML User Manual
Chapter 7: Display Options
You can also change color by left-clicking a field in the CATC Trace and selecting Color
from the pop-up menu.
Teledyne LeCroy
111
Chapter 7: Display Options
PETracer ML User Manual
Changing Field Formats
The Field Formats tab allows you to define the way various numeric fields are shown in
the packet display. You can select Hexadecimal, Decimal, Binary, or ASCII for certain
fields or groups of fields.
To change a field's format, click the plus sign (+) next to a field in the list. This causes the
selected item to expand so you can see its constituent sub-fields. Select a sub-field, and
then choose the format from the formatting choices that appear at the bottom of the
window.
To change the format of alphanumeric characters in a field:
Step 1 Under the Group and Colors column, click the plus symbol (+) next to
the group you want to reformat. The group expands to show the
individual fields within the group (as shown above).
Step 2 Click the row representing the field that you want to reformat. If the field
can be reformatted, the format options at the top of the dialog box
become active, as shown below:
Step 3 Select a format.
112
Teledyne LeCroy
PETracer ML User Manual
Chapter 7: Display Options
Step 4 Specify the bit order in the displayed fields by checking/unchecking the
MSB > LSB checkboxes.
Step 5 Click Apply or OK.
Hiding Fields
To hide a field:
Step 1 Under the Group and Colors column, click the plus symbol (+) next to
the group that has the field(s) you want to hide. The group expands to
show the individual fields within the group (as shown above).
Step 2 Click the checkbox in the row representing the field that you want to
hide.
Step 3 Click Apply or OK.
Teledyne LeCroy
113
Chapter 7: Display Options
PETracer ML User Manual
Hiding Levels
The Level Hiding page lets you hide traffic by Event Group. If you select one or more
event types from the Event Group list, the selected types are hidden from the CATC
Trace.
To hide a level:
Step 1 Select an Event Group.
Step 2 Select whether to Hide or Show selected items.
Step 3 Select Upstream, Downstream, or Any Direction.
Step 4 (optional) Select Compact EIEOS packets.
Step 5 Click OK.
114
Teledyne LeCroy
PETracer ML User Manual
Chapter 7: Display Options
The Event Groups for Packets are:
•
TLP Type
•
TLP Header
•
TLP Requester ID
•
TLP Completer ID
•
TLP Data Pattern
•
TLP Data Lengths
•
TLP Traffic Class
•
TLP Tag
•
TLP Sequence Number
•
DLLP Type
•
DLLP Header
•
DLLP Virtual Channel
•
ACK/NAK Seq Number
•
Ordered Sets
•
Link Event
•
Direction
•
Errors
The Event Groups for Link Transactions and Split Transactions are:
Teledyne LeCroy
•
TLP Type
•
Traffic Class
•
Virtual Channel
•
Direction
•
RequesterID
•
CompleterID
•
Status
•
Tag
115
Chapter 7: Display Options
PETracer ML User Manual
7.4 Load a Previously Saved Display Options File
If you have previously saved Display Options, you can load them by opening the Display
Options dialog and clicking the Load button. A dialog box opens to let you load a
previously saved display options file.
Step 1 Click Load to use a previously defined display options file.
Step 2 When you see the Open File pop-up window, enter the name of the file
you want to load and click Open.
Step 3 When the PETracer™ software returns you to the Recording Options
menu, click OK to activate the display options you selected.
7.5 Saving Display Options
If you have customized the Display Options and wish to save them, you can do so by
clicking the Save button, then entering a unique file name. The .opt extension is added
by default.
Setting the Defaults: Save the currently specified Display Options to the file name:
default.opt by clicking Save As Default. When the Analyzer software begins execution,
it automatically loads the default.opt file, if one exists.
116
Teledyne LeCroy
PETracer ML User Manual
Chapter 8: Recording Options
Chapter 8: Recording Options
8.1 Setting Recording Options
The Recording Options dialog is used to configure a recording.
To open the Recording Options window, click
Setup > Recording Options.
Note:
or select the command
There are separate sets of Recording Options for each Analyzer type. To set
the Analyzer type, select the appropriate platform from the Target Analyzer
menu in the General page of the Recording Options.
PETracer ML in Simple Mode:
Teledyne LeCroy
117
Chapter 8: Recording Options
PETracer ML User Manual
8.2 General Tab
The General Page presents options that affect all recordings:
Recording Type: Sets the trigger mechanism for the recording: Snapshot, Manual
Trigger, and Event Trigger.
Target Analyzer: Presents a menu with options for selecting an Analyzer platform:
•
PETracer Edge
•
PETracer ML
•
PETracer ML (2 Units)
•
PETracer EML
•
PETracer Summit
•
Summit T2-16
Buffer Size: Causes the Analyzer to record traffic to its buffer and then upload the CATC
Trace to the host machine. Recordings are limited in size to the size of the Analyzer's
buffer (4 GB per direction).
Trigger Position: Controls the percentage of buffer allocated for pre- and post-buffer
recording.
Trigger On (Simple Mode): Error, Link Up/Link Down. TS1, TS2, FTS, Any TLP, Config
Rd, Config Wr, IO Rd, IO Wr, Mem Rd, Mem Wr, Message, Completion, InitFC1, InitFC2,
ACK, NAK, and/or PM.
Filter Out (Simple Mode): SKIP Ordered Sets and/or UpdateFC DLLP are provided.
Trace Filename & Path: Sets the path and CATC Trace name for the recording.
Options Name: Sets a descriptive label for the Recording Options so you can more
easily recall what settings are in the Recording Options file.
Link: Settings: For link width, inhibiting recording, polarity, external reference clock,
swapping recording channels, inverting link polarity, and descrambling.
Upload Size (Advanced Mode): Causes the Analyzer to upload a portion of the
Analyzer's buffer. This option lets you look at part of the CATC Trace. Half of the uploaded
CATC Trace is pre-buffer and half post-trigger.
Save As MultiSegment Trace (Advanced Mode): Divides the recording into segments
so as to make very large recordings more easily uploaded and viewed. If you are planning
to create a large recording, you might want to test this option to see how it affects
performance. Large CATC Trace files are easier to navigate but slower to open.
Misc (Advanced Mode): Turns on trigger beep, sets external clocking (EML only), allows
external interface signals to be saved into the CATC Trace, and tells the Analyzer to use
whatever TC to VC mapping was used in the last recording (to re-use previously
discovered Configuration Space data) in all future recordings. Also presents a button for
manually mapping the Traffic Classes to Virtual Channels.
118
Teledyne LeCroy
PETracer ML User Manual
Chapter 8: Recording Options
Recording Type
Recording Type lets you to specify the type of recording you want to make:
•
•
•
Snapshot: A recording of a pre-determined length. You set the recording length in
the Buffer Size box. Recording begins when you click the Rec button on the toolbar
and ends when the selected buffer size is filled or when you press the Stop button.
Manual Trigger: A recording that switches between the pre-trigger buffer and the
post-trigger buffer when you push the Trigger button on the front of the Analyzer.
Recording begins when you select Start in the application. Pressing the Trigger
button causes the Analyzer to begin to finish recording. Recording continues until
the post-trigger buffer has been filled. You can also end the recording by pressing
the Stop button in the application.
Event Trigger: A recording that switches between the pre-trigger buffer and the
post-trigger buffer when it is triggered by an event in the CATC Trace. An Event
Trigger begins when you select Start in the application and ends when the specified
triggering event occurs in the CATC Trace or you press Stop. If an event triggers the
end of the recording, the Analyzer records a predefined amount of post-trigger data
(specified by Trigger Position and Buffer Size.)
Note: You can also terminate an Event Trigger recording by pressing the Manual
Trigger button on the front of the Analyzer. When the Manual Trigger button is
pressed, the Analyzer continues to record until the specified post-trigger buffer has
been filled.
Buffer Size
The Buffer Size slide-bar allows you to set the size of the recording buffer.
For PETracer ML, the size of this buffer is adjustable from 1.6 MB to 2 GB.
Note:
Size selection is per direction. For example, selecting 32 MB creates two
memory areas of that size.
After you have set the Buffer Size, you must set the Recording type and Trigger position
options. These options determine how the buffer is used.
Note:
Teledyne LeCroy
The Buffer Size slide-bar does not precisely portray the buffer size because
of the way the packets are stored in the Analyzer’s memory.
119
Chapter 8: Recording Options
PETracer ML User Manual
Target Analyzer
Target Analyzer presents a menu with these choices:
•
PETracer Edge: Displays the options for the PETracer Edge Analyzer.
•
PETracer ML: Displays the options for the PETracer ML Analyzer.
•
PETracer ML (2 Units): Displays the same options as PETracer ML but lists
Unit 1 and Unit 2 in the Link Section on the right. In a two-unit setup, Unit 1
and Unit 2 are two separate Analyzers linked together by BNC on the back of
the units to form a single, logical Analyzer. The cabling for a two-unit setup is
described in “Connecting the PETracer ML Analyzer to the Device Under
Test” on page 31.
•
PETracer EML: Displays the options for the PETracer EML Analyzer.
•
PETracer Summit and Summit T2-16: Displays the options for the PETracer
Summit or Summit T2-16 Analyzer.
Selecting an Analyzer platform changes the options presented in the Link and Events
pages within the Recording Options dialog.
Trigger Position
This Trigger Position slide-bar lets you to adjust the amount of recording buffer allocated
to recording pre-trigger and post-trigger traffic.
For example, if you set the Trigger Position to 90% Post-Triggering Traffic, the Analyzer
records 10% pre-trigger traffic and 90% post-trigger traffic.
Trigger Position is only available when Manual Trigger or Event Trigger is selected.
Trigger On
In Simple Mode, Trigger On allows you to select: Error, Link Up/Link Down. TS1, TS2,
FTS, Any TLP, Config Rd, Config Wr, IO Rd, IO Wr, Mem Rd, Mem Wr, Message,
Completion, InitFC1, InitFC2, ACK, NAK, and/or PM.
Trace Filename and Path
The Trace Filename and Path button on the Recording Options General panel allows you
to change the default file name and path for the recorded CATC Trace file. The
pre-defined name is data.pem.
Step 1 Select the Recording File Name button.
Step 2 When you see the Save As menu, navigate to the directory you want.
Step 3 Enter the new file name in the File name field.
Step 4 Click the Save button.
This action does not do any immediate save operation. It just changes the default name
and uses it in subsequent recordings.
120
Teledyne LeCroy
PETracer ML User Manual
Chapter 8: Recording Options
Options Name
The Options Name is a descriptive, supplemental label that you can assign to a
Recording Options file.
For example, if your Recording Options file were named StandardSettings.rec, your
Options Name could be a long descriptive label such as Standard Record Options used
for all normal Recordings.
Teledyne LeCroy
121
Chapter 8: Recording Options
PETracer ML User Manual
Save As MultiSegment Trace
This option causes the Analyzer to segment the CATC Trace into 4 MB to 128 MB files
and to create an index file that summarizes the starting and finishing frame for each
segment.
The index file has a default name of data.pem.
The index file and segmented CATC Trace files are stored in a directory named
data_pem_files. The directory is named after the index file. Below this directory
additional, sequentially numbered sub-directories (up to 10,000) hold the segmented
CATC Trace files. These sub-directories bear simple numerical names: 00000 to 00999.
Each of these subdirectories can hold up to 100 sequentially numbered segment files.
Example
A 1010 MB recording using the default file names creates the following sub-directories
and files:
data.pem (This is the index file.)
data_pem_files\00000\segment_00000.pex
data_pem_files\00000\segment_00001.pex
...
data_pem_files\00000\segment_00099.pex
data_pem_files\00001\segment_00100.pex
data_pem_files\00001\segment_00101.pex
The index file looks something like a CATC Trace file but contains packet-like entities that
summarize each segment.
Viewing Multisegmented Files
If Save As MultiSegment Trace is enabled in the General page of the Recording Options,
PETracer divides the CATC Trace into segments and stores them on the host machine's
hard drive. Segment size is set in the MB Segments box. Enter a value from 4 MB to 128
MB.
PETracer also creates an index file that provides a brief summary of each segment and
hyperlinks to each of the segments. Double-clicking a segment summary in the index file
causes PETracer to open that segment.
You can also navigate through the segments by clicking the buttons on the Multisegment
toolbar.
122
Teledyne LeCroy
PETracer ML User Manual
Chapter 8: Recording Options
Misc
Allows you to specify the following parameters for recording and uploading traffic:
•
•
•
•
Teledyne LeCroy
Beep When Trigger Occurs: Causes the Analyzer to beep when a trigger event is
detected.
Save External Interface Signals: If selected, causes the Analyzer to save signals
from a Breakout Board as fields in the CATC Trace.
Preserve TC to VC mapping across the channels: Causes the Analyzer to use
whatever TC to VC mapping it established in the last recording.
Default TC to VC mapping button: Lets users manually configure the default
mapping.
123
Chapter 8: Recording Options
PETracer ML User Manual
Link for PETrainer ML
The Link section allows you to manage links:
PETracer ML
Link Width: Sets the physical width of the link.
Port 1 (Unit1) and Port 2 (Unit 2): Gives you low-level control over each link direction.
The heading for these boxes indicates the port and/or unit to which the following options
are applied based on the current Analyzer configuration:
124
•
Inhibit Channel: Prevents recording on the selected link direction.
•
Reverse Lanes: Causes the Analyzer to reverse the lane order for this link
direction. For example, if you are working with a PCI Express™ device that
uses a 3 2 1 0 lane order instead of a 0 1 2 3 order or uses a 0 to 15 lane
order instead of a 15 to 0 order, you select this option to enable the Analyzer
to match the order of the device. Note: If reversing lanes for a PETracer ML
x8 link, the Port 1 and Port 2 cable connections for the link must also be
swapped.
•
Invert Polarity: Inverts the d+ and d- polarity for each specified lane. If for
some reason the d+ on one side of a link is wired to the d- on the other side
(or vice versa), then selecting Invert Link Polarity corrects for that condition.
Teledyne LeCroy
PETracer ML User Manual
Chapter 8: Recording Options
Use External Reference Clock: If the PCI Express link under analysis uses
spread-spectrum clocking, then the Analyzer must use the external reference clock from
the host machine. If host machine does not supply a reference clock, the internal
reference clock in the Analyzer module is used instead for link analysis.
Disable Descrambling: If checked, causes the Analyzer to assume that none of the
PCI Express traffic is scrambled. By default, the Analyzer determines the scrambling
state of the devices under test.
Auto-Configure Lane Polarity: Lets the Analyzer determine lane polarity.
Base Spec 1.0 Rev Compatibility Mode (Advanced Mode): This option causes the
Analyzer to conform to the PCI Express 1.0 Specification.
Swap Recording Channels (Advanced Mode): Swaps upstream/downstream
assignments. Normally, the software makes upstream and downstream assignments
based on Configuration Requests within the CATC Trace. Sometimes these requests are
not captured. You can manually re-assign channels using this checkbox.
Teledyne LeCroy
125
Chapter 8: Recording Options
PETracer ML User Manual
Saving and Loading Previously Saved Recording Options
The options are:
Save: Saves the current options to whatever file name you provide.
Save As Default: Saves the current options into the default options file. This file is called
default.rec or whatever other name you have assigned to the default options file.
Whenever the Teledyne LeCroy PETracer software begins execution, it automatically
loads the default file, if one exists.
Load: Loads a previously saved set of recording options.
OK: Applies changes and closes the Recording Options dialog box.
Cancel: Cancels changes and closes the Recording Options dialog box.
Loading Recording Options
In the Recording Options menu, you can load a previously saved recording options file.
To load Recording Options:
Step 1 Select Setup > Recording Options from the menu.
Step 2 Click the Load button from the Recording Options dialog box. The Load
dialog opens and lists previously saved options files (*.rec).
Step 3 Select a file and click OK. The options file loads.
Saving Recording Options
Recording Options settings can be saved and later reused. Recording options settings
are stored in *.rec files.
Step 1 Open the Recording Options dialog by selecting
Setup > Recording Options.
Step 2 Set your options, then click Save.
Step 3 Enter a unique file name. The .rec extension is added by default.
Step 4 (optional) To add a descriptive label to this file to help you remember
what options were set, use the Options Name box.
Setting Default Recording Options
To save the current recording options into the default Recording Options file:
•
Click Save As Default.
The default file for the options is default.rec.
When the PETracer software begins execution, it automatically loads the
default.rec file, if one exists.
126
Teledyne LeCroy
PETracer ML User Manual
Chapter 8: Recording Options
8.3 Recording Rules Overview
The Recording Rules page lets you to set triggers and filters.
The page divides into three areas:
Toolbar: Contains buttons such as the New Events button for issuing commands.
Available Events area: A part of the screen where you can park buttons that you intend
to use in the Main display area.
Main display area: The part of the screen where you create trigger and filter conditions.
You create conditions by dragging buttons onto the Main display area from the Available
Events area. You then create additional conditions by right-clicking a button and selecting
options from a pop-up menu. See Creating Recording Rules.
Teledyne LeCroy
127
Chapter 8: Recording Options
PETracer ML User Manual
Global State vs. Sequences
The Main Display area in the center of the Recording Rules page has two cells that affect
events differently.
Global State: Events dragged into the Global State cell are searched for throughout the
recording. For example, if you place an Error in the Global State cell and assign a Trigger
to it, the Analyzer searches for errors from the start of the recording until the end.
Sequence State: The cell marked Drag an event here to create a new sequence is a
Sequence Cell. Sequence cells are used to event sequences, which are chains of events
culminating in a trigger or other action. One sequence (i.e., a separate chains of events)
can be created with up to 32 states. A state is an event condition plus some action within
a sequence.
128
Teledyne LeCroy
PETracer ML User Manual
Chapter 8: Recording Options
8.4 Recording Rules Buttons
The Recording Rules toolbar allows you to create and edit recording rules:
New Event. Opens a
drop-down menu with a list of
events.
Zoom in
Delete. Delete selected
event.
Zoom out
Undo. Undoes last action.
Show/Hide Channels.
Shows/hides the channel
buttons.
Redo. Undoes last Undo
command.
Show properties.
Opens the Properties dialog
box for the selected item.
8.5 Creating Recording Rules
The Recording Rules page is used to set triggers and filters. To access this page, select
Setup > Recording Options > Recording Rules.
There are three steps to creating a recording rule:
1) Select events.
2) Place the events in the Global State or Sequence cells.
3) Assign actions to the events.
Note:
Teledyne LeCroy
There are limits to the types of rules that can be created. See “Recording
Rule Limits” on page 132 for details.
129
Chapter 8: Recording Options
PETracer ML User Manual
Step 1 Click
and select one or more events from the menu.
Selecting an event automatically places it in the Available Events area.
This area serves as a parking lot where you can place event buttons
without them having any effect on the Analyzer.
Step 2 Drag the selected events from the Available Events area into one of
either the Global State cell or the Sequence cell (see “Global State vs.
Sequences” on page 128):
Global State Cell: If you want the Analyzer to always search for the event, place
it in the cell marked Global State.
Sequence Cell: To create an event sequence, place two or more events in the
faintly marked cell that reads Drag an event here to create a sequence. At this
point, the selected events have no effect because an action has not been
assigned.
Step 3 To select a sub-set of your selected event, right-click it and choose
Properties. A Properties dialog box opens that presents additional
options. For example, if you open the Properties dialog for Errors, you
can set the specific types of errors the Analyzer should look for.
130
Teledyne LeCroy
PETracer ML User Manual
Chapter 8: Recording Options
Step 4 Assign an action to the selected events by right-clicking each of the
events, selecting Specify Action from the pop-up menu, and assigning
an action such as Trigger, Filter, or Count. Be sure to click the event
itself and not the State cell that it is sitting in (which produces a different
pop-up menu.)
Note:
You can also assign actions to events by double-clicking the event and
selecting the Actions page when the Properties dialog box opens.
Step 5 Click OK to close the dialog box. At this point, assuming that the other
options in the Recording Options dialog box have been set (such as the
General page), you can begin the recording by pressing the
Start Recording
button.
Teledyne LeCroy
131
Chapter 8: Recording Options
PETracer ML User Manual
8.6 Recording Rule Limits
PETracer ML has finite buffer resources that limit the number of actions and events that
can be assigned for each recording channel. When creating complex event sequences,
it is possible to hit the limits of these resources and get an error message like the ones
shown in the screenshots below.
In addition to the following limitations, you should also be aware of how PETracer handles
user-created contradictory rules. See “Recording Rules Logic: How Contradictory Rules
are Resolved” on page 134 for an explanation.
In order to maximize the buffer allocation for recordings, Teledyne LeCroy has imposed
the following configuration limitations into PETracer ML.
Configuration Limitations in PETracer ML
•
132
Up to four actions per state: No more than four actions can be assigned per state
or the error message shown below appears and the Status Indicator in the top right
of the dialog generates an Invalid Configuration status.
Example: Too many Actions per State. In this example, the actions are: three Filter
Outs, an Advance the Sequence, and a Count.
Teledyne LeCroy
PETracer ML User Manual
•
Up to two sets of Link Conditions or Ordered Sets per channel: If you place a
combination of three Link Conditions and Ordered Sets into three separate state
cells and then assign three different actions to each, an error results.
Example: Place TS1 in the Global State cell and select Filter Out. Then place TS2
in Sequence 1, State 1 and select Advance the Sequence. Then add Link Active
to Sequence 1, State 2 and select Trigger. When you attempt to apply Trigger to
Link Active, an error message appears.
Example: Too many Link Conditions and Ordered Sets. In this example, the user
attempted to create a rule with three Link Conditions and Ordered Sets. The
maximum allowable Link Conditions and Ordered Sets is two.
•
In two-unit setups, no cross-box sequencing is allowed: For example, you
cannot configure the first Analyzer to advance sequence on TLP and then configure
the second to trigger on a DLLP-ACK for this TLP. Actions apply to both Analyzers.
Four different DLLPs per channel
Three different TLPs per channel
Four payload DWORD-checkers per channel
One set of errors per channel
One Timer event per channel
Two Counters per channel
•
•
•
•
•
•
Teledyne LeCroy
Chapter 8: Recording Options
133
Chapter 8: Recording Options
PETracer ML User Manual
8.7 Recording Rules Logic: How Contradictory Rules
are Resolved
When creating rules in the Recording Rules page, it is possible to create contradictory
instructions such Filter Anything Out and Filter Anything In. To resolve such conflicts,
the Recording Rules page implements three internal rules that are described here:
•
•
•
Rules created in Sequence cells have a higher priority than rules created in the
Global State cell: If a rule is placed in a Sequence cell, and a contradictory rule is
placed in Global State cell, the rule in the Sequence cell applies.
Filter-In has a higher priority than Filter-Out, so when a Filter-In rule is placed inside
the same state as Filter-Out rules, only the Filter-In rule applies.
Filter-In Anything and Filter-Out Anything have the highest priority and override any
other filtering rules, so when Filter-In Anything or Filter-Out Anything are placed in
the same state cell as other Filter rules, only the Filter-In Anything or Filter-Out
Anything rules apply.
Recording Rules Examples
Read through the following examples to better understand how the three rules apply.
Note:
In addition to these three rules, the Recording Rule Limitations define the
upper limits of rule creation. These limitations should not affect you, but you
should be aware of them.
Example 1
Result: Only TLP:Mem,Read is in the CATC Trace.
Reason: The Sequence rule Filter out TLP:Completion is not contradicting the global
state rule to filter in TLP:Memory. Both rules are applied.
134
Teledyne LeCroy
PETracer ML User Manual
Chapter 8: Recording Options
Example 2
Result: Only TLP:Completion is in the CATC Trace.
Reason: The sequence rule to filter in TLP:Completion is not contradicting the global
state rule to filter out TLP:Memory. Both rules are applied.
Example 3
Result: TLP:Completion and TLP:Memory are filtered out.
Reason: The Sequence rule to filter out TLP:Completion is not contradicting the global
state rule to filter out TLP:Memory. Both rules are applied.
Example 4
Result: Only TLP:Completion and TLP:Memory are in the CATC Trace.
Reason: The sequence rule to filter in TLP:Completion is not contradicting the global
state rule to filter in TLP:Memory. Both rules are applied.
Teledyne LeCroy
135
Chapter 8: Recording Options
PETracer ML User Manual
Example 5
Result: Only TLP (any type) is in the CATC Trace.
Reason: The sequence rule to filter in TLP:Completion is not contradicting the global
state rule to filter in Any TLP. Both rules are applied.
Example 6
Result: Only TLP (any type) is in the CATC Trace.
Reason: The sequence rule to filter in Any TLP is not contradicting the global state rule
to filter in TLP:Completion. Both rules are applied.
Example 7
Result: All TLP are filtered out.
Reason: The sequence rule to filter out Any TLP is not contradicting the global state rule
to filter out TLP:Completion. Both rules are applied.
136
Teledyne LeCroy
PETracer ML User Manual
Chapter 8: Recording Options
Example 8
Result: All TLP are filtered out.
Reason: The sequence rule to filter out TLP:Completion is not contradicting the global
state rule to filter out Any TLP. Both rules are applied.
Example 9
Result: Only TLP:Completion is in the CATC Trace.
Reason: The sequence rule to filter in TLP:Completion is overwriting the global state rule
to filter out Any TLP.
Example 10
Result: Only TLP (any type) is in the CATC Trace.
Reason: The sequence rule to filter in Any TLP is overwriting the global state rule to filter
out TLP:Completion.
Teledyne LeCroy
137
Chapter 8: Recording Options
PETracer ML User Manual
Example 11
Result: Only TLP (any type) is in the CATC Trace.
Reason: The sequence rule to filter in Any TLP is overwriting the global state rule to filter
out Any TLP.
Example 12
Result: Empty CATC Trace.
Reason: The sequence rule to filter out Any TLP is not contradicting the global state rule
to filter in Any TLP. Both rules are applied. (The global rule filters out DLLPs and Ordered
Sets, and the sequence rule filters out TLPs.)
Example 13
Result: Only TLP (any type) is in the CATC Trace.
138
Teledyne LeCroy
PETracer ML User Manual
Chapter 8: Recording Options
Reason: Filter out rules in the global state cell and in the sequence state cell are ignored.
The Filter-In Any TLP rule is used.
Example 14
Result: Only DLLP:UpdateFC is in the CATC Trace.
Reason: The Filter out rules are ignored. Filter in DLLP:updateFC rule is used.
Example 15
While in state 1: Only DLLP:UpdateFC is in the CATC Trace.
Reason: The Filter out rules are ignored. Filter in DLLP:updateFC rule is used.
While in state 2: Only Ordered Sets are in the CATC Trace.
Teledyne LeCroy
139
Chapter 8: Recording Options
PETracer ML User Manual
Reason: Both the sequence state and the global state rules are used, and all TLPs and
DLLPs are filtered out.
While in state 3: Nothing is recorded.
While in state 4: Everything is recorded.
Reason: The sequence state rule to filter in anything overwrites global state rule.
Example 16
Result: Only TLP (any type) is in the CATC Trace.
Reason: In both states, the rule is to keep only TLP.
Example 17
Result: Only TLP (any type) is in the CATC Trace.
Reason: The Filter-out rule is ignored because there is a filter-in rule with a higher
priority.
140
Teledyne LeCroy
PETracer ML User Manual
Chapter 8: Recording Options
Example 18
Result: Empty CATC Trace.
Reason: Filter Anything has the highest priority and overwrites filter-in rule.
8.8 Properties Dialog Boxes
Properties dialog boxes provide additional settings for Events, States, Actions, and other
objects in the Recording Rules page. You can access a Properties dialog by
double-clicking an Event, State, Action or other object.
Teledyne LeCroy
141
Chapter 8: Recording Options
PETracer ML User Manual
8.9 Event Properties Dialog
The Event Properties dialog presents options for refining triggers and filters. For
example, to set a trigger on a specific type of error, you open the Properties dialog
Accessing the Properties Dialog
To see the Properties dialog, first create an event button by clicking the New Events
button and choosing an event from the menu. Afterwards, open the Event Properties
dialog by doing one of the following:
•
•
•
Double-click an event.
Right-click an event and select Properties from the pop-up menu.
Click the Properties button on the toolbar.
Dialog Settings and Features
Event Icon Preview: This icon shows you which event properties you are editing. The
Icon Preview looks exactly like the icon in the Main Display area.
Icon Label: A text box for labeling the button. Whatever you type here appears on the
button.
Channels: These controls allow you to select the channel(s) that the Analyzer should
search when it is looking for the event.
Count: A counter tells the Analyzer to search for x instances of the selected event. For
example, if you enter 10, the Analyzer counts 10 instances of the selected event before
it performs whatever action you assign. There are only two counts available in the
hardware so if you try to assign more than two, you get a warning. Counters cannot be
applied to events with Filter Actions. The maximum counter value is 65,535.
Pin Button: Allows you to pin the Properties dialog box to the application so that it does
not go away when another object appears such as an event, state or action.
Description String: This area contains a textual description of the event.
142
Teledyne LeCroy
PETracer ML User Manual
Chapter 8: Recording Options
Event-specific Settings: The largest part of the Event Properties dialog box. The
settings in this area vary for different events. Some events do not have any additional
settings (for example, Basic Link Services, Extended Link Services). The Events that do
have settings are: Error Event, Data Frame Event, Primitive Event, Advanced Primitive
Event, SCSI Command Event, Breakout Board Event, and Timer Event.
Error Properties Dialog
The Error Properties dialog box lets you select specific error types for performing an
action. There are two sets of Error types: Packet Errors and Idle Errors.
Actions Properties Dialog
The Actions Properties dialog box.
Teledyne LeCroy
143
Chapter 8: Recording Options
PETracer ML User Manual
TLP Header Properties Dialog
The TLP Header Properties dialog box.
Note: TLP Prefix is available only on Summit T2-16.
TLP Prefix Properties Dialog
The TLP Prefix Properties dialog box.
Note: TLP Prefix is available only on Summit T2-16.
144
Teledyne LeCroy
PETracer ML User Manual
Chapter 8: Recording Options
Payload Properties Dialog
The Payload Properties dialog box.
Note: TLP Prefix is available only on Summit T2-16.
DLLP Packet Properties Dialog
The DLLP Packet Properties dialog box.
Teledyne LeCroy
145
Chapter 8: Recording Options
PETracer ML User Manual
Ordered Set Properties Dialog
The Ordered Set Properties dialog box.
8.10 Counting Events
Triggers can be set on multiple instances of an event. For example, you can set a trigger
to occur following five instances of any DLP. To configure the Analyzer to look for multiple
events, you enable Counters. Counters tell the Analyzer how many occurrences of an
event it should wait for before triggering.
For example, Trigger following the 16th occurrence of an error.
Counters enable triggers to be set that are based on a count of events. For example, you
could use a counter to Trigger following the 16th occurrence of a DLLP message
To use a counter, follow these steps:
Step 1 Click an event. This causes an arrow to appear.
Step 2 Click one of the two counters (it does not matter which you use). This
causes the counter to attach itself to the bottom of the event (shown
above). An arrow automatically connects the counter to the Trigger
button.
To change the counter value:
Step 1 Click the small blue dot in the upper-left corner of the counter button. A
menu appears.
Step 2 Select Change Counter Value.
Step 3 Enter a new value in the pop-up dialog box. This causes the new value
to appear in the counter button.
146
Teledyne LeCroy
PETracer ML User Manual
Chapter 8: Recording Options
How to Set a Counter
To set a counter:
Step 1 Open the Recording Rules page, select an event, and drag it to the
Global State or Sequence cells. For details on these steps, see
“Creating Recording Rules” on page 129.
Step 2 Counts can only be set on a per channel basis, so press the Up or Down
channel buttons to select the channel on which the count is performed.
Step 3 Right-click the selected event and select Add Counter from the menu to
open the Properties dialog.
Step 4 In the text box to the right of the label Count enter a value. Make sure
the checkbox to the left of the word Count is checked.
Step 5 Click the X in the top right corner of the dialog box to close the dialog. A
counter button should appear just below your selected event.
Teledyne LeCroy
147
Chapter 8: Recording Options
PETracer ML User Manual
8.11 Creating a Payload Match
You can configure PETracer to trigger, count, and restart on a specific payload pattern
within a Transaction Layer Packet (TLP). In Recording Rules, create a New event of the
desired TLP type. An icon appears that represents that event type in the Available Events
area. Right-click the icon and select Properties to bring up the Properties dialog box for
the event.
Select the Payload tab to bring up the pane that lets you configure payload pattern. You
can match up to four patterns, labeled 0 through 3.
For each pattern, you specify the following:
Offset dword: Indicates the DWORD you want to match within the payload (range is 0
through 1024). For example, if you want the Analyzer match a pattern in the first DWORD
of the payload, enter 0. If you want the Analyzer to match a pattern in the thirty-fifth
DWORD, enter 35.
Bitmask: Indicates which bits you want to match for the DWORD indicated. You can
enter any of the following in the bitmask area:
148
•
X (bit not relevant)
•
1 (present)
•
0 (bit not present)
Teledyne LeCroy
PETracer ML User Manual
Chapter 8: Recording Options
Note: The Mask (hex) and Match (hex) entries represent bitmask in hex format. As you
type entries in the bitmask, corresponding values appear in fields in the hex Mask and
Match. Alternately, you can type values in the hex Mask and Match, and corresponding
values appear in the bitmask.
Example 1
To tell the Analyzer to trigger on any payload with the binary pattern 1111111 in the third
DWORD:
Step 1 Create an Any TLP event in the Available Events area of Recording
Rules. Drag the event to the Global State cell.
Step 2 Open the Properties dialog box for the event and bring up the Payload pane.
Step 3 Enter 3 in the Offset dword area of any of the four patterns (0 to 3). For
purposes of this example, we choose pattern 2.
Step 4 Enter the following in pattern 2: 1111111.
Teledyne LeCroy
149
Chapter 8: Recording Options
PETracer ML User Manual
Example 2
To tell the Analyzer to trigger on any payload with the binary pattern 1111111 in the third
DWORD, OR to trigger on any occurrence of Memory Write:
Step 1 To set up the first condition, do steps 1 through 4 in Example 1.
Step 2 Create a Memory Write event in the Available Events area of Recording
Rules. Drag the Memory Write icon to the same cell as the Any Event
icon from Example 1. The Analyzer now is set to trigger on either of the
two conditions.
8.12 Trigger
A trigger is one of five actions that can be assigned to an event. (The other four actions
are Filter In, Filter Out, Advance the Sequence, and Restart the Sequence.)
To enable a trigger, place an event button into either the Global State cell or the
Sequence cell, then right-click the button and choose an Action.
From the sub-menu, select Trigger.
150
Teledyne LeCroy
PETracer ML User Manual
Chapter 8: Recording Options
The exact end of the recording depends on how you have set the Trigger Position slider
in the General page of the Recording Options dialog. This setting determines whether the
recording terminates immediately following a trigger, or some time afterwards. See
“General Tab” on page 118 for further explanation.
8.13 Filter In and Filter Out
A filter causes the Analyzer to filter in or out specified events from the recording. If events
are filtered out of the recording, they are excluded from the Analyzer's buffer and not
simply hidden from the CATC Trace. The purpose of filtering is to preserve recording
memory so you conduct longer recording sessions and exclude events that do not
interest you.
A filter causes the Analyzer to filter in or out specified events from the recording so you
can preserve recording memory and thereby increase the duration of your recording.
Filtering also lets you exclude unwanted data so your CATC Trace displays only the traffic
that interests you.
To enable or disable filtering, place an event button into either the Global State cell or
the Sequence cell, then right-click the button and choose an Action (see previous topic).
From the sub-menu, select Filter In or Filter Out.
Teledyne LeCroy
151
Chapter 8: Recording Options
152
PETracer ML User Manual
Teledyne LeCroy
PETracer ML User Manual
Chapter 9: Reports and Tools
Chapter 9: Reports and Tools
Reports assist you in analyzing traffic recorded by the Analyzer. The available reports
are:
•
File Information: To view general information about the CATC Trace file.
•
Error Summary: To view a count of errors in a CATC Trace file.
•
Traffic Summary: To view a summary of protocol-related information in the
CATC Trace file summary information about a selected group of items in the
CATC Trace file (such as a count of particular frame or packet types).
•
Bus Utilization: To display information on bandwidth usage for the transmit and
receive channels.
•
Link Tracker: Displays a detailed chronological view of events.
•
Data Flow: Shows marker, packet, direction, type, length, address, payload, handshake, and timestamp information.
•
Trace Navigator: Navigates within the CATC Trace to view the location of errors
and triggers, narrow the range of traffic on display, and jump to any point in the
CATC Trace.
•
LTSSM Flow Graph: Shows a state diagram of bus activity.
•
Packet Header: Shows packet header information
•
Packet Data: Shows packet information.
•
Configuration Space: To display a Configuration Space (see “Configuration Space” on
page 241).
•
Metrics: Measures key operating parameters.
•
Real Time Statistics: To display statistical information for the channels.
•
TC to VC Mapping: To display how Traffic Classes are mapped to Virtual Channels (to
simplify navigation) and how the CATC Trace display was changed (for example, in Split
Transactions).
•
Timing Calculations: To view timing measured between two events set within the
CATC Trace file.
•
Run Verification Scripts: Allows you to check errors, link transactions, split transactio“Configuration Space” on page 241ns, metrics, ordered sets,replays, DLLPs,
and TLPs.
Reports are available from the Report menu and buttons on the Tool bar. Tools are
available from the Tools menu.
Teledyne LeCroy
153
Chapter 9: Reports and Tools
PETracer ML User Manual
9.1 File Information
The File Information window provides a summary on the currently displayed file.
Select Reports > File Information
154
to obtain the File Information window.
Teledyne LeCroy
PETracer ML User Manual
Chapter 9: Reports and Tools
9.2 Error Summary
The Error Summary dialog box displays the number of errors for each event and the
packet containing the errors.
Select Reports > Error Summary to obtain the Error Summary dialog box.
Teledyne LeCroy
155
Chapter 9: Reports and Tools
PETracer ML User Manual
9.3 Traffic Summary
The Traffic Summary window summarizes the traffic in the current CATC Trace. The left
side of the window displays a tree of protocol levels. The right side displays a summary
of traffic for the displayed levels.
Select Reports > Traffic Summary or click
to display the Traffic Summary window.
Buttons at the top of the Traffic Summary window change the display format and enable
data to be exported to email, file, or the printer.
Using the Traffic Summary Window to Search the
CATC Trace
You can use the Traffic Summary window to move the CATC Trace to packets of interest:
Step 1 Click one of the numbers in the right side of the Traffic Summary window.
The CATC Trace jumps to the first instance of the selected protocol.
156
Teledyne LeCroy
PETracer ML User Manual
Chapter 9: Reports and Tools
Step 2 Click the up or down arrows
. The CATC Trace jumps forward or
backward through the display to the next instance of selected protocol
level.
Traffic Summary Buttons
Buttons at the top of the Traffic Summary dialog box provide options for exporting the
data or formatting its appearance:
Save. Saves Traffic Summary results into an HTML format.
Email. Attaches an HTML file of the results to a new email.
Print. Prints results.
Text. Displays results in HTML format.
Options. Opens a drop-down menu with the following options:
• Grid Lines: Displays/Hides grid lines
• Row Selection: Allows entire rows to be selected
• Tight Columns: Reformats column widths to match data
• Event Navigation:
Skip Hidden Items
Show Hidden Items
Prompt each time
Teledyne LeCroy
157
Chapter 9: Reports and Tools
PETracer ML User Manual
9.4 Bus Utilization
Select Report > Bus Utilization from the menu or press
window.
to open the Bus Utilization
The Bus Utilization window displays information on bandwidth use for the transmit and
receive channels.
158
Teledyne LeCroy
PETracer ML User Manual
Chapter 9: Reports and Tools
Bus Utilization Pop-up Menu
You can reformat the display by right-clicking a graph and making a selection from the
Bus Utilization pop-up menu.
Go to Packet #: Relocates the CATC Trace to the selected packet number.
Undo Zoom: If you have zoomed in, this command undoes the zoom.
Zoom to Trace View: Zooms in on graph to show traffic currently displayed in the
CATC Trace screen.
Fit to Graph Area: Redisplays graph so that the entire CATC Trace fits inside graph area.
Y Scale Type:
•
Linear: Converts display to linear format
•
Logarithmic: Converts display to logarithmic format
Hide: Hides the selected graph
Remove: Allows you to remove any graph that you created via the New
Teledyne LeCroy
command
159
Chapter 9: Reports and Tools
PETracer ML User Manual
Properties: Opens a dialog box with options for changing the Title, Type, Appearance,
and Color of the graphs.
160
Teledyne LeCroy
PETracer ML User Manual
Chapter 9: Reports and Tools
Bus Utilization Buttons
The Bus Utilization window buttons allow you to reformat the display and export data.
Button
Function
Save. Saves Bus Utilization data to a bitmap file (*.bmp).
Email. Opens an email and attaches a bitmap file of the Bus Utilization data.
Print. Prints the Bus Utilization data.
Full Screen. Maximizes the Bus Utilization window.
View Settings. Opens a sub-menu with the following choices:
• Orient Horizontally
• Tile Vertically
• Show Markers
• Show Plumbline
• Status >>
Bar
Tool tips
None
• Grid Lines >>
Both Axes
X Axis
Y Axis
No Grid
• Grid on Top
• Fonts & Colors
Horizontal zoom in
Horizontal zoom out
Teledyne LeCroy
161
Chapter 9: Reports and Tools
PETracer ML User Manual
Vertical zoom in
Vertical zoom out
Click and Drag zoom. Click and drag to zoom in on a part of the graph.
Select Range. Displays a dialog box for selecting a packet range.
Synchronize Graph Areas. If two or more graphs are displayed, this button
synchronizes the graphs to one another. Once synchronized, the positioning slider of
one graph moves the other graphs.
Graph Areas. Provides options for creating and displaying additional graphs of data
lengths, packet lengths, and percentage of bus used.
162
Teledyne LeCroy
PETracer ML User Manual
Chapter 9: Reports and Tools
9.5 Link Tracker
The Link Tracker window displays a detailed chronological view of events. Events are
shown on a channel-by-channel basis in columns within the window.
Each time slot in the vertical axis represents the minimum time that a DWORD requires
to traverse the bus.
Toolbar: Presents buttons for changing the format of the Link Tracker window.
Main Display Area: Displays traffic chronologically as it occurred in the recording. The
window divides into columns: the first column shows time and traffic is shown on a
channel-by-channel basis in the columns on the right.
Teledyne LeCroy
163
Chapter 9: Reports and Tools
PETracer ML User Manual
Using the Link Tracker Window
The Link Tracker window can be reformatted in several ways.
Zooming In and Out
Zooming out can give you a quick, high-level view of a CATC Trace. A fully zoomed out
CATC Trace only shows columns and colored lines. Using the colors, you can see what
types of traffic run through the CATC Trace.
Further information can be obtained on any point of interest in the CATC Trace by
positioning your mouse pointer over it. Tool tips provide detailed description of events.
Note: When fully zoomed out, the smallest graphical unit is the DWORD, represented by
a single line. Zooming out makes the CATC Trace appear smaller and increases the time
scale in the first column.
164
Teledyne LeCroy
PETracer ML User Manual
Chapter 9: Reports and Tools
Collapsing Idle Time, Enabling Tool tips, and Resetting Column
Widths
Click the View Options button
to open a menu with options for formatting the
display. Three options are presented:
Collapsible Idle Time: Opens a dialog box for setting the Idle time value. Setting a value
tells the Analyzer when to collapse Idle times and display them as grayed out strips within
the Bus View window.
Tooltip Display: Opens a menu with options for adding content to Tooltips. Tooltips
display when you position the mouse pointer over an item in the Bus View window. The
options are:
•
Tooltips Display Values
•
Tooltips Display Scrambled Values
•
Tooltips Display 10-bit Codes
•
Tooltips Display Symbols
Time Format: Seconds or Clock
Reset Column Widths: This option resets column widths to their defaults and enables
columns to resize themselves automatically any time the application window is resized.
Normally, columns automatically resize themselves if the application window is made
larger or smaller. However, if you manually resize any columns in the Bus View window,
column widths become static. Thereafter, if you resize the application window, the
Bus View columns do not adjust automatically. Reset Column Widths re-enables the
automatic resizing capability.
Reset Columns Order: Return to default column sequence.
Docking and Undocking the Window
You can undock the Link Tracker window by double-clicking the blue title bar along the
left side of the window. Once undocked, the window can be dragged anywhere in the
application. To redock, double-click again on the title bar.
Teledyne LeCroy
165
Chapter 9: Reports and Tools
PETracer ML User Manual
Setting Markers
Markers can be set on any event within the Link Tracker window.
To set a marker, right-click an event, then select Set Marker from the pop-up menu.
Once marked, you can navigate to events with the Go to Marker command in the Search
menu.
Markers set in the Link Tracker window display the packet number and DWORD number.
In contrast, markers set in the CATC Trace window just show the packet number.
Calculating Time between DWORDs
You can calculate time between DWORDs by clicking an event and then positioning your
mouse pointer over a second event and reading the ensuing Tool tip.
Click the time value for the first event. Scroll down through the CATC Trace to the second
event and position the mouse pointer above its time value. A Tool tip appears showing
the time interval between the first and second events.
Hiding Traffic
You can hide Idles and other data from the Link Tracker window by clicking the Hide
buttons on the toolbar.
166
Teledyne LeCroy
PETracer ML User Manual
Chapter 9: Reports and Tools
Link Tracker Buttons
The Link Tracker window has a row of buttons for changing the format of the displayed
data and for exporting data: The buttons have the following functions:
Full Screen. Expands the Link Tracker window to fill the entire screen.
View Options. Opens a menu with three options:
• Collapsible Idle Time (Collapse Idle Bigger Than n nanoseconds.
Note: Does not affect Collapse Idle Plus.)
• Tooltip Display (Values, Scrambled Values, 10-bit Codes, Symbols)
• Time Format (Seconds, Clock)
• Reset Columns Widths (return to default widths)
• Reset Columns Order (return to default column sequence)
See “Using the Link Tracker Window” on page 164 for further details.
Synchronize Trace View. Synchronizes the Trace View and Link Tracker windows
so that a move in one window repositions the other.
Because of the differences in scale and logic between the Link Tracker and Trace
view window, scrolling produces different effects depending on which window is
being scrolled.
Scrolling in the CATC Trace window causes the Link Tracker window to rapidly
jump from event to event. Long periods of idle time are thus skipped.
Scrolling in the Link Tracker window, in contrast, produces modest movements
within the CATC Trace window.
Scrolling in the Link Tracker window causes the CATC Trace window to pause until
the beginning of a packet is displayed. At that point, the CATC Trace window
repositions itself. While scrolling long Idle periods or through the contents of a
packet, the CATC Trace window does not move.
Zoom In
Zoom Out
Continuous Time Scale. No collapsing.
Collapse Idle. Do not show some periods of Link being idle.
Collapse Idle Plus. Do not show periods of Link being idle.
Teledyne LeCroy
167
Chapter 9: Reports and Tools
PETracer ML User Manual
Show Values
Show Scrambled Values
Show 10b Codes
Show Symbols
Show Text
168
Teledyne LeCroy
PETracer ML User Manual
Chapter 9: Reports and Tools
9.6 Data Flow Window
The Data Flow window shows marker, packet, direction, type, length, address, payload,
handshake, and timestamp information.
To obtain the Data Flow window, select Report > Data Flow
or click the
Data Flow toolbar icon.
The toolbar allows you to:
•
•
•
•
Teledyne LeCroy
Expand the window to full screen or Collapse to a smaller window.
Synchronize.
Save.
Select Data Flow columns to display and their widths:
•
Marker
•
Packet
•
Direction
•
Type
•
Length
•
Address
•
Payload
•
Handshake
•
Time Stamp
169
Chapter 9: Reports and Tools
PETracer ML User Manual
9.7 Using the Trace Navigator
The trace Navigator is a tool for navigating within the CATC Trace. It allows you to view
the location of errors and triggers in a CATC Trace and to narrow the range of traffic on
display. It also allows you to quickly jump to any point in the CATC Trace.
Displaying the Navigator
Click
in the toolbar to display the Navigator. The Navigator appears on the right side
of the Main window. It has a two-button toolbar and a vertical slider bar. It also has colored
panes for navigating the CATC Trace in different ways. You set which panes are
displayed through Navigator pop-up menus.
170
Teledyne LeCroy
PETracer ML User Manual
Chapter 9: Reports and Tools
Navigator Toolbar
The Navigator toolbar lets you quickly set Navigator features. The toolbar has two
buttons.
Navigator Ranges: This button brings up a pop-up menu that lets you reset the
Navigator range. The range determines what packets are viewable in the CATC Trace
display.
Navigator Panes: This button has two purposes: To select which Navigator panes
appear and to bring up the Navigator legend. The legend determines how information is
shown in the panes.
Navigator Ranges
You set the viewing range by dragging the yellow range delimiters along the slider.
To set the lowest packet viewable, drag the top delimiter up. As you do so, a tool tip
appears to indicate the current range. Stop dragging when you reach the desired lowest
packet.
To set the highest packet viewable, drag the bottom delimiter down. Stop when the tool
tip indicates you are at the desired highest packet.
To Determine Current Position
In addition to the two range delimiters, the slider has a blue current-position indicator
(see above). The current-position indicator shows where you are in the CATC Trace
display with respect to the possible viewing range.
Teledyne LeCroy
171
Chapter 9: Reports and Tools
PETracer ML User Manual
For example, suppose you set viewing range to packet 0 through packet 500 (the top
range delimiter is at packet 0, and the bottom range delimiter is at packet 500). If you then
move the current-position indicator on the slider to midway between the top and bottom
delimiters, then packet 250 appears in the middle of the CATC Trace display.
To Reset Navigator Range
You can reset the Navigator range using the toolbar Navigator Range button. Press the
button to bring up the Navigator Range drop-down menu.
The menu has the following options:
•
•
•
172
Set Range to Whole Trace: Allows you to reset the range to include the entire
CATC Trace file contents. The top range delimiter is placed at the lowest packet
number in the CATC Trace. The bottom range delimiter is placed at the highest
packet number in the CATC Trace.
Set Range Near Packet xxx: Allows you to collapse the range so that only the
packets immediately above and below the xxx packet are displayed. The xxx packet
is whatever packet is currently at the top in the CATC Trace display.
Recently Used Ranges: Allows you to reset the range to any of a number of
recently used (previously set) ranges.
Teledyne LeCroy
PETracer ML User Manual
Chapter 9: Reports and Tools
Navigator Panes
You can display any combination of CATC Trace Navigator panes.
From left to right, the panes are: Pre/Post Trigger, Errors, Traffic Type, Traffic Speed, and
Link Width. Each pane represents the entire CATC Trace with respect to different types
of information. The top of each pane represents the start of the CATC Trace file, and the
bottom represents the end of the CATC Trace file.
•
•
•
•
•
Pre/Post Trigger: To view the trigger event in the CATC Trace and the relative size
of pre-trigger and post-trigger portions of the CATC Trace. The two portions are set
apart as different colors. The trigger event occurs at the point the two colors meet.
Errors: To view any errors in the CATC Trace. A thin red line represents each error
in the pane.
Traffic Type: To view the types of packets that occur in the CATC Trace. A different
color represents each packet type in the pane. The relative size of colored portions
in the pane corresponds to the amounts of the various packet types in the
CATC Trace. As described below, you can use the Navigator legend to change the
types of packets that take precedence in the display.
Traffic Speed: To view the speed that occurs in the CATC Trace.
Link Width: To view the link width that occurs in the CATC Trace.
To Show/Hide Navigator Panes
You can show/hide any of the panes using pop-up menus accessible through left-click the
Navigator Panes button or by right-click anywhere in any CATC Trace Navigator pane.
Teledyne LeCroy
173
Chapter 9: Reports and Tools
PETracer ML User Manual
Navigator Slider
The Navigator slider appears at the left of Navigator panes. The slider has yellow upper
and lower range delimiters and a blue current-position indicator.
The Navigator slider lets you to set the range of packets viewable in the CATC Trace
display. In other words, it sets scrolling range of the display. You can scroll the display up
to the lowest packet number in the viewing range. You can scroll the display down to the
highest packet number in the viewing range.
Trace Navigator Legend
The Navigator legend lets you control the display of content in Navigator panes.
You bring up the legend through the Navigator Panes drop-down menu. Press the toolbar
Navigator Panes button to access the menu. Select the Legend option to bring up the
Navigator Legend dialog box.
The Navigator Legend dialog box has areas corresponding to each of the panes. Each
area has check boxes that allow you to hide/display information in the pane. You can set
the priority of information displayed in the panes using the up and down triangles on the
right.
Using the Legend to Show/Hide Navigator Panes
To use the legend to show/hide an entire pane, use the checkbox next to the name of
each pane in the legend.
In the case of the Pre/Post Trigger and Errors areas, the action of show/hide in the legend
is identical to that provided by Trace Navigator pop-up menus.
In the case of the Traffic Types pane, there is no equivalent show/hide available through
the pop-up menus.
174
Teledyne LeCroy
PETracer ML User Manual
Chapter 9: Reports and Tools
Using the Legend to Set the Priority of Information Display
You can use the legend to set the priority of information displayed in the Pre/Post Trigger
Traffic Type panes. This is a two-step process.
Step 1 For a particular item in a pane, click the column next to the checkbox
for the item. That labels the item as currently active.
Step 2 Next, use the up-down at the lower-right of the area to move the item
higher or lower in priority.
In the case of the Traffic Type pane, priority determines display priority of each packet
type. For portions of the CATC Trace that are dominated by a particular packet type, this
setting no effect: only the color corresponding to that packet type is displayed in that
portion of the pane. Suppose, however, that part of the CATC Trace includes equal or
near equal numbers of several types of packets. In that case, you can use the legend to
select which among those types is represented in that portion of the Traffic Types pane.
This allows you to view only packets of interest in crowded portions of the CATC Trace
display.
Teledyne LeCroy
175
Chapter 9: Reports and Tools
PETracer ML User Manual
9.8 LTSSM Flow Graph
The LTSSM Flow Graph shows link state transitions that the link goes through, as
recorded in the CATC Trace file.
To obtain the LTSSM Flow Graph, select View > LTSSM Flow Graph.
You can display the following directions:
•
•
•
Upstream
Downstream
Both
You can Show Number of Transitions.
176
Teledyne LeCroy
PETracer ML User Manual
Chapter 9: Reports and Tools
9.9 Packet Header Bar
The Packet Header bar shows packet header information.
To obtain the Packet Header bar, select Report > Packet Header
or click the
Packet Header toolbar icon.
The toolbar allows you to Save, go to Previous or Next, display Hexadecimal or Binary, and show
the Packet Data window.
Teledyne LeCroy
177
Chapter 9: Reports and Tools
PETracer ML User Manual
9.10 Packet Data Window
The Packet Data window shows packet information.
To obtain the Packet Data window, select Report > Packet Data
or click the
toolbar icon.
The toolbar allows you to Save; go to Previous or Next; display Hexadecimal, ASCII, Decimal,
or Binary; use MSB Format or LSB Format; and use Big Endian or Little Endian.
Format and Columns allows you to enter the number of bytes, words, or dwords per line.
You can enter an Offset and scroll to it.
You can enter text and Search Previous or Search Next.
178
Teledyne LeCroy
PETracer ML User Manual
Chapter 9: Reports and Tools
9.11 Configuration Space View
The Configuration Space View displays information about the Configuration Space state
as of the current packet of the currently selected device. The view shows the
Configuration Space Header and the PCI-compatible or PCI Express
Capability Structures.
To display the Configuration Space View for a device at a packet:
Step 1 Open a CATC Trace, such as the sample file cfg_pci_express.pex.
Step 2 Scroll to a packet with a Configuration header.
Step 3 Select Report > Configuration Space > <device> to display the
Configuration Space View.
or
Teledyne LeCroy
179
Chapter 9: Reports and Tools
PETracer ML User Manual
Click a CompeterID or DeviceID field. A pop-up menu opens.
Select Show Configuration Space for xxxx from the menu, where xxxx is the
device number. The Configuration Space View opens.
On the left, the view displays the Configuration Space for the selected CompleterID or
DeviceID at the current packet. You can select Configuration Space Header or a
Capability Structure.
The right displays the decoded data of the selected Configuration Space Header or a
Capability Structure, up to the current packet. (The decoding builds while navigating
through the next packets.)
The Configuration Space View toolbar allows you to Save, go to First, go to Previous,
go to Next, go to Last, go to Previous Access to Selected Configuration Space Register,
go to Next Access to Selected Configuration Space Register, and display Hexadecimal or Binary.
Note: See Appendix A “Configuration Space Decoding” on page 249.
180
Teledyne LeCroy
PETracer ML User Manual
Chapter 9: Reports and Tools
9.12 Using Unit Metrics
For every protocol unit at the Link or Split transaction level, PETracer™ calculates and
displays a set of metrics. Metrics are measurements of key operating parameters. You
can use metrics to evaluate performance of traffic in the CATC Trace stream.
You can view metrics information in the CATC Trace display, the Traffic Summary
window, and the Bus Utilization window.
PETracer defines different metrics for Link and Split transactions.
Metrics Defined for Link Transactions
Number of Packets: The total number of packets that compose this Link transaction.
Payload: The number of data payload bytes this Link transaction transferred.
Response Time: The time it took to transmit this Link transaction on the PE link, from the
beginning of the first packet in the transaction to the end of the last packet in the
transaction.
Data Throughput: The payload divided by response time, expressed in megabytes per
second.
Note:
Usually, the Number of Packets metric for a link transaction is two (in case of
explicit acknowledge) or one (in case of implicit acknowledge). However if
Naks/link level retries are involved, this metric might be higher. As a result,
the Number of Packets metric is useful in highlighting unusual link
transactions.
Metrics Defined for Split Transactions
The following types of metrics currently are defined for Split transactions:
Number of Link Transactions: The total number of Link transactions that compose this
Split transaction.
Payload: The number of payload bytes this Split transaction transferred.
Response Time: The time it took to transmit this Split transaction on the PE link, from
the beginning of the first packet in the Split transaction to the end of the last packet in the
Split transaction;
Data Throughput: The transaction payload divided by response time, expressed in
megabytes per second.
Latency Time: The time measured from the end of the request transaction to the first
completion transmitted in response to the request within this Split transaction.
Note:
Teledyne LeCroy
The Number Of Link Transactions metric for a Split Transaction usually is two
for a Configuration or IO request. It can be bigger then two for a Memory
Read request.
181
Chapter 9: Reports and Tools
PETracer ML User Manual
Show Metrics in the CATC Trace Display
In the CATC Trace view display of Link Transaction or Split Transaction levels, all metrics
information applicable to a specific protocol unit is displayed in a Metrics header. The
header is located close to the end of the unit, in front of the Time cell. You can expand
and collapse the header to show or hide the metrics information.
Collapsed Metrics Header Display
Following is a collapsed metrics display for a unit of Link Transaction. The collapsed
header display shows only the metrics cell representing the Number of Packets.
Following is a collapsed metrics display for a unit of Split Transaction. The collapsed
header display shows only the metrics cell representing Number of Link Transactions.
Metrics Tool Tip Display
In both CATC Trace level views, you can view the summary of all the unit metrics in the
Metrics header tool tip. To view the tool tip, simply place the mouse cursor over the
Metrics header. Following is the tool tip for a unit in the Link Transaction view.
Note:
182
The tool tip also presents information for time passed from the start of the
recording till the beginning of this Link or Split Transaction.
Teledyne LeCroy
PETracer ML User Manual
Chapter 9: Reports and Tools
Expanded Metrics Header Display
When you expand the Metrics header, the display creates a separate cell for each
applicable metric:
Following is the expanded Metric header for a unit in the Split Transaction view.
Following is the expanded Metric header for a unit in the Link Transaction view.
Note: Each of the metric cells pops up a tool tip window with the explanation of what the
metric means.
Teledyne LeCroy
183
Chapter 9: Reports and Tools
PETracer ML User Manual
Show Metrics in the Traffic Summary Window
Some of the Traffic Summary reports at the Link and Split Transaction levels are based
on metrics collected for the corresponding protocol units in the CATC Trace.
Reports at Split Transaction Level
Split Transaction Performance: This report table groups the Split Transactions by
Requester-Completer pair and displays Minimum/Average/Maximum data for Number Of
Link Transactions and Response Time metrics.
Read Requests Performance: This report table includes only the Split Transactions that
present Read Requests (Configuration, IO and Memory). It groups them by the
combination of Requester-Completer pair, request type, and Traffic Class and displays
Minimum/Average/Maximum data for Throughput, Response Time, and Latency metrics.
Write Requests Performance: This report table includes only the Split Transactions that
present Write Requests (Configuration and IO). It groups them by the combination of
Requester-Completer pair, request type, and Traffic Class and displays
Minimum/Average/Maximum data for Throughput, Response Time, and Latency metrics.
184
Teledyne LeCroy
PETracer ML User Manual
Chapter 9: Reports and Tools
Reports at the Link Transaction Level
The following metric-based reports are displayed at the Link Transaction level:
Link Transaction Performance: This report table groups the Link Transactions by TLP
Type and displays Minimum/Average/Maximum data for Number Of Packets, Response
Time and Payload Bytes metrics.
Memory Writes: This report table includes only the Link Transactions that present
Memory Write Requests. Memory Writes are the only (posted) requests that don't get
promoted to the Split transaction level, therefore their performance should be viewed at
the Link transaction level. The table groups Memory Writes by the combination of
Requester ID and Traffic Class and displays Minimum/Average/Maximum data for
Response Time, Payload and Throughput metrics.
Following features apply to all of the report tables described above for the Split
Transaction and Link Transaction levels:
•
•
Teledyne LeCroy
Each report row for the defined tables contains the total number of units in this
group for the CATC Trace (total number of units for Split Transaction performance,
Read Requests performance, Memory Writes, and so on).
In many cases, the Maximum and Minimum values in the report tables are
navigable. By clicking table cells, you reposition the corresponding CATC Trace
view to the Split or Link Transaction that has yielded this maximum or minimum
value. This can help you to find specific units in the CATC Trace, such as
transactions that produced spikes in Response Time or Throughput.
185
Chapter 9: Reports and Tools
PETracer ML User Manual
Show Metrics in the Bus Utilization Window
The Bus Utilization window provides graphs for packet-level information in the
CATC Trace. The window also provides graphs for information on Split and Link
Transaction levels, plotted over time. The graphs for Split and Link Transaction levels are
based on metrics collected for the transactions throughout the CATC Trace.
The seven graphs related to Split and Transaction levels are:
1. Pending Requests at Split Transaction level.
2. Response Time at Split Transaction level.
3. Latency Time at Split Transaction level.
4. Throughput Per Transaction at Split Transaction level.
5. Response Time and Latency Time at Split Transaction level (combined graph).
6. Response Time at Link Transaction level, for Memory Writes only.
7. Throughput at Link Transaction level, for Memory Writes only.
The following is an example of Bus Utilization window display of graph numbers 1, 4, 5,
6 and 7:
186
Teledyne LeCroy
PETracer ML User Manual
Chapter 9: Reports and Tools
Unit-Based Averaging
The Analyzer builds metric graphs using unit-based averaging (as opposed to
time-based averaging). For the total duration of a certain request (or Memory Write
transaction), the graph value is assumed equal to the corresponding metric for this
request (transaction). If there are overlapping operations for a certain time period, then
the value is calculated as an average of metric values for all the overlapped requests
(transactions).
It is important to remember that the Analyzer uses unit-based averaging rather than
time-based averaging. Time-based averaging can be misleading in some situations. For
example, consider the Throughput Per Transaction graph. Sometimes, while many
outstanding requests are in progress, latency (and response time) grows for each of the
transactions, resulting in a lower throughput per transaction over time (which is reflected
in the graph). This happens even though aggregated throughput across all the
transactions is constant.
Bus Utilization Window Features
For the seven Split- and Transaction-level graphs listed, all Bus Utilization window
features are available, such as zooming in/out, changing scale type, scrolling,
context-sensitive status, and graph synchronization. See Bus Utilization and Bus
Utilization Buttons for more on these features.
Note: Clicking a certain place within a graph area repositions the CATC Trace display at
the Link or Split transaction level to the transaction that was in progress at that time.
Split Transaction Level Graphs
Transactions at the Split level combine all the non-posted requests with corresponding
completions. This includes Configuration and IO Read and Write requests, as well as
Memory Read requests.
The following shows the graphs for the Split level:
Teledyne LeCroy
187
Chapter 9: Reports and Tools
Note:
PETracer ML User Manual
The Pending Requests graph is not directly defined by metrics, but it is useful
when considering metrics. The Pending Requests graph presents the
unit-averaged number of requests that were pending (in progress) at any
moment of time. It allows you to correlate the number of requests posted to
a completer with other performance metrics.
Link Transaction Level Graphs
Memory Writes are the only (posted) requests that do not get promoted to the Split
transaction level. Therefore, Memory Write performance should be viewed at the Link
Transaction level. That is the reason graphs at the Link level only present the Memory
Write-related metrics and are titled Writes: Response Time: and Writes: Throughput.
188
Teledyne LeCroy
PETracer ML User Manual
Chapter 9: Reports and Tools
9.13 Real-Time Statistics Window
The Real-Time Statistics Window displays Link Utilization, performance measurements,
and statistical values for a PCI Express link plotted in real time.
Click
to open the Real-Time Statistics window.
Start PCI Express™ link activity.
To start the monitor, press
.
To stop the monitor, press
.
The remaining Real-Time Statistics buttons provide options for changing the format of the
display.
Additional formatting options are available through the Real-Time Statistics pop-up menu
and the Real-Time Statistics toolbar.
Teledyne LeCroy
189
Chapter 9: Reports and Tools
PETracer ML User Manual
Real-Time Statistics Buttons
Additional formatting options are available through the Real-Time Statistics toolbar.
Button
Function
Save. Saves Real-Time Statistics data to bitmap file (*.bmp).
Email. Opens an email and attaches a bitmap file of the Real-Time Statistics data.
Print. Prints the Real-Time Statistics data.
Full Screen. Maximizes the Real-Time Statistics window.
View Settings. Opens a sub-menu with the following choices:
• Orient Horizontally
• Tile Vertically
• Show Markers
• Show Plumbline
• Status >>
Bar
Tool tips
None
• Grid Lines >>
Both Axes
X Axis
Y Axis
No Grid
• Grid on Top
• Fonts & Colors
Horizontal zoom in
Horizontal zoom out
190
Teledyne LeCroy
PETracer ML User Manual
Chapter 9: Reports and Tools
Vertical zoom in
Vertical zoom out
Click and Drag Zoom. Click and drag to zoom in on a part of the graph.
Synchronize Graph Areas. If two or more graphs are displayed, this button
synchronizes the graphs to one another. Once synchronized, the positioning slider of
one graph moves the other graphs.
Graph Areas. Allows you to hide or display the graphs and the counters. You can
toggle Statistics Accumulation, Link Utilization, Data Payload Throughput, and
Data Packet Count.
Start real-time statistics. Starts the real-time statistical monitor.
Stop real-time statistics. Stops the real-time statistical monitor.
Reset Graphs. Resets the graphs.
Teledyne LeCroy
191
Chapter 9: Reports and Tools
PETracer ML User Manual
Real-Time Statistical Monitor Pop-up Menu
Additional formatting options are available through the Real-Time Statistics pop-up
menu. Right-click a graph in the Real-Time Statistical Monitor window to display a pop-up
menu with options for changing the format of the display.
Undo Zoom: If you have zoomed in, this command undoes the zoom.
Fit to Graph Area: Redisplays graph so that the entire CATC Trace fits inside graph area.
Y Scale Type:
•
Linear: Converts display to linear format.
•
Logarithmic: Converts display to logarithmic format.
Hide: Hides the selected graph
Properties: Opens a dialog box with options for changing the Title, Appearance, and
Color of the graph.
192
Teledyne LeCroy
PETracer ML User Manual
Chapter 9: Reports and Tools
Real-Time Statistics Graph Areas
The Real-time Statistics window has three graph areas:
•
Link Utilization
•
Data Payload Throughput
•
Data Packet Count
Each graph area has Upstream and Downstream graphs for a PETracer device (if
connected to a host machine), plus as many graphs as PETrainer™ devices connected
to the host machine.
The Statistics Accumulation area shows the PETracer statistics tab, plus as many tabs
as PETrainer devices connected:
Teledyne LeCroy
193
Chapter 9: Reports and Tools
PETracer ML User Manual
For each PETrainer device the following information displayed:
194
•
Number of data packets
•
Payload size
•
InitFC complete status: Yes/No
•
Link State: Possible states are:
•
DETECT_QUIET
•
DETECT_ACTIVE
•
POLLING_ACTIVE
•
POLLING_CONFIG
•
CONFIG_LINKWIDTH_START
•
CONFIG_LINKWIDTH_ACCEPT
•
CONFIG_LANENUM_WAIT
•
CONFIG_LANENUM_ACCEPT
•
CONFIG_COMPLETE
•
CONFIG_IDLE
•
L0
•
L0S_IDLE
•
L0S_FTS
•
L1
•
RECOVERY_RCVRLOCK
•
RECOVERY_RCVRCFG
•
RECOVERY_IDLE
•
HOT_RESET
•
DISABLED
Teledyne LeCroy
PETracer ML User Manual
Chapter 9: Reports and Tools
9.14 TC to VC Mapping
TC to VC Mapping displays how Traffic Classes are mapped to Virtual Channels (to simplify
navigation) and how the CATC Trace display was changed (for example, in Split Transactions).
Teledyne LeCroy
195
Chapter 9: Reports and Tools
PETracer ML User Manual
9.15 Timing and Bus Usage Calculations
The Timing and Bus Usage Calculator allows you to calculate time between packets.
Select Reports > Timing Calculations to obtain the Timing Calculator dialog box.
Total Time: Total time from beginning of the first unit to beginning of the second unit.
196
Teledyne LeCroy
PETracer ML User Manual
Chapter 9: Reports and Tools
Bus Utilization
This portion of the Timing Calculator window gives values that are cumulative for all
packets during the timing period. For example, throughput is combined throughput of all
packets during the timing period.
Upstream is from endpoint devices to the root complex. Downstream is from the root
complex to endpoint devices.
Link Utilization: Percentage of non-idle symbols in total number of symbols transferred.
Time Coverage: Percentage of non-idle symbol times in total number of symbol times.
(Non-idle symbol time occurs when at least on one of the lanes there were non-idle
symbols transferred.)
Bandwidth: Number of non-idle symbol bits transferred per second.
Data Throughput: Number of TLP payload bytes transferred per second.
Packets/second: Number of packets transferred per second.
Split Transaction Performance
This portion of the Timing Calculator window gives minimum, maximum, and average
values for all Split transactions during the timing period. For example, minimum
throughput is throughput of the Split transaction that passes the least amount of data.
Maximum throughput is throughput of the Split transaction that passes the most amount
of data. Average throughput is the average calculated for all Split transactions during the
timing period.
Response Time: The time it took to transmit this Split transaction on the PE link, from
the beginning of the first packet in the Split transaction to the end of the last packet in the
Split transaction.
Latency: The time measured from the end of the request transaction to the first
completion transmitted in response to the request within this Split transaction.
Throughput: The transaction payload divided by response time, expressed in
megabytes per second.
Memory Writes Performance
This portion of the Timing Calculator window gives minimum, maximum, and average
values for all Memory Write transactions during the timing period. For example, minimum
throughput is throughput of the Memory Write transaction that passes the least amount
of data. Maximum throughput is throughput of the Memory Write transaction that passes
the most amount of data. Average throughput is the average calculated for all Memory
Write transactions during the timing period.
Response Time: The time it took to transmit this Memory Write on the PE link, from the
beginning of the first packet in the Memory Write to the end of the last packet in the
Memory Write.
Throughput: The Memory Write payload divided by response time, expressed in
megabytes per second.
Teledyne LeCroy
197
Chapter 9: Reports and Tools
PETracer ML User Manual
9.16 Running Verification Scripts
You can run verification scripts to check errors, link transactions, split transactions,
metrics, ordered sets,replays, DLLPs, and TLPs.
To obtain the Verification Script dialog box, select Tools > Run verification scripts
or click the
icon.
The available verification scripts are in the Verification script section.
To run a script, select it, then click the Run Scripts button
.
The results appear in the bottom window. You can expand or collapse this window. You
find a view related to the CATC Trace and place this window under or to the right of it.
You can Save the results.
198
Teledyne LeCroy
PETracer ML User Manual
Chapter 9: Reports and Tools
Click the Settings button to display the Settings window.
You can choose the editor, display settings, and saving settings.
Teledyne LeCroy
199
Chapter 9: Reports and Tools
200
PETracer ML User Manual
Teledyne LeCroy
PETracer ML User Manual
Section 3
Section 3. PETrainer Exerciser
Traffic Generation
Teledyne LeCroy
201
Section 3
202
PETracer ML User Manual
Teledyne LeCroy
PETracer ML User Manual
Chapter 10: Traffic Generation
Chapter 10: Traffic Generation
PETrainer™ is a traffic generator that can emulate PCI Express™ root complexes and
endpoint devices. Traffic generation can be used to transmit known errors, allowing you
to observe how your device handles faulty link conditions.
After the PETrainer™ ML™ and DUT have been cabled and powered on, you can test
the setup by generating some traffic. The following steps show how to configure the
Exerciser to generate a Link Training sequence.
10.1 Theory of Operation
Overview
PETrainer offers two mechanisms for implementing traffic generation: scripts, in which
any type of traffic can be defined and executed, and the Generation Options dialog box,
which offers a collection of PCI Express specific behaviors that can be enabled for
automatic generation of traffic.
Using scripts, packets can be transmitted one after another or with certain timing or
event-based pauses between them. This allows the PETrainer to act as a pattern
generator with PCI Express-specific formatting and transmission rates. However,
creating traffic that emulates real devices with relatively complex protocol behaviors
using a simple pattern generator is quite complicated. Certain behaviors such as ACK
policies, and flow control require concurrent processing. This is where the automated
features of the PETrainer ML™ products become useful.
The PETrainer includes a collection of automated traffic generation circuits that
commonly exist in other PCI Express devices. These circuits include ACK/NAK
generation, flow control management, a Link Training and Status State machine
(LTSSM), replay buffers, and transaction timers. What makes the PETrainer unique and
so useful is that each of these behaviors can be individually modified or disabled. This
allows the user to perform operations that might not otherwise be possible using an off
the shelf PCI Express device. This can be particularly useful when doing compliance or
fault recovery testing.
Starting Point
When the PETrainer first powers up, it is at electrical idle on all lanes. The link is not
trained, but the Link Training and Status State Machine (LTSSM) is enabled and waiting
for a command to train the link. To begin communication with a PCI Express device, the
Link training must occur, but first the generation settings must be set. This involves
setting the Link parameters such as link width, polarity inversion, and lane reversal,
through the Generation Options dialog.
Note:
Setting the options in the Generation Options dialog has no effect on the
PETrainer behavior until the first script is executed. In fact, each time a script
is executed, these behaviors are reprogrammed to the PETrainer and the
behaviors are modified accordingly.
The Link Connect toolbar button can then be pressed to signal to the LTSSM to initiate
Link training. Alternatively, a script can executed with the Link=L0 command.
Teledyne LeCroy
203
Chapter 10: Traffic Generation
PETracer ML User Manual
The PETrainer Status bar at the bottom of the screen shows the current state of the
PCI Express Link. When the Link is down, it shows Detect. When it is up, it shows L0.
All of the intermediate link states, such as Polling and Configuration, are handled
automatically. In fact, after the Link=L0 command is executed and the LTSSM is alive,
the PETrainer attempts to keep the Link active just as any other PCI Express device
does. This includes handling of Recovery states and subsequent retraining events.
The next step is to enable flow control. This is done by executing the Link=InitFC
command. This causes PETrainer to perform flow control initialization and, if enabled,
begin periodic transmission of Update_FC DLLP's. If the Link connect toolbar button was
used, the flow control initialization happens automatically.
By using these basic commands, the complicated process of link training is managed
automatically. The Link is now trained and the script execution can now focus on sending
TLP packets.
Script Execution
As mentioned above, each time a script is executed, the configuration settings for the
PETrainer are reprogrammed. When the Start generation button is pressed, the script
is uploaded to the PETrainer hardware and executed immediately. Progress of the script
can be tracked in the status bar at the bottom of the screen. Subsequent executions of
the same script do not require upload of the script to the PETrainer, however, as
mentioned above, the generation options are still reprogrammed.
Script execution can be throttled using Wait commands inserted directly into the script.
Waits can be time based, require receipt of certain packet types, or can even require
User input from the GUI.
After the script is complete, any enabled PCI Express behaviors, such as SKIP insertion,
Flow control, and ACK generation, continue. This allows you to run multiple scripts, one
after another, without interrupting the Link state.
204
Teledyne LeCroy
PETracer ML User Manual
Chapter 10: Traffic Generation
10.1 Traffic Generation Files
The .peg traffic generation files are text files consisting of a series of commands from a
scripting language (see Chapter 12), and optionally, one or more Include statements
linking other generation files into the current file.
Note:
To edit a generation file, use the Script Editor, a specially designed text editor
tool. See “Editing Generation Files with the Script Editor” on page 210.
To generate traffic, open a traffic generation file (*.peg) and then run it.
Teledyne LeCroy
205
Chapter 10: Traffic Generation
PETracer ML User Manual
When the file is opened, it appears in the CATC Trace window looking like a CATC Trace
file.
To run the file, press
.
To create or edit a .peg file, use the Script Editor.
The Script Editor is a text-editing tool that can be opened by clicking
.
Alternatively, the traffic generation file can be created by exporting the data from a
CATC Trace into a traffic generator file.
206
Teledyne LeCroy
PETracer ML User Manual
Chapter 10: Traffic Generation
10.2 Creating a Traffic Generation File
There are four ways to create PETrainer™ traffic generation script file:
•
Export an existing PETracer™ trace to a PETrainer script file
•
Save an existing PETrainer script to a new file
•
Select File > New to create a new and empty script file that contains no text.
•
Create an empty file using an OS shell (with .peg extension) and open it with
PETracer software.
Exporting a CATC Trace to a Traffic Generation File
A simple way to create a script file is to open a CATC Trace and then to export the
CATC Trace data to a generation file:
Step 1 Open a CATC Trace file.
Step 2 Select File > Export > to Generator File Format.
Step 3 Select the desired options from the File Export dialog box:
Direction: Selects the direction of the traffic to be exported.
From and To: Selects a range for exporting. You can export all or part of the CATC Trace.
Do not export hidden packets: Ignores any packets hidden through the various hide
options.
Do not export Idle packets: Excludes Idles from the export.
Teledyne LeCroy
207
Chapter 10: Traffic Generation
PETracer ML User Manual
Export "Wait for Cpl" from upstream: Exports all Wait for Completions from the
opposite direction. Wait = TLP is a PETrainer script command.
Export "Wait for ACK" from upstream: Exports all Wait for ACK DLLPs from the
opposite direction.
Saving a PETrainer Script to a New File
To save a script file as a generation file:
Step 1 Open an existing PETrainer script file.
Step 2 Select File > Save As… or click
on the toolbar.
Step 3 Navigate to the desired folder and type a new file name where you want
to save the current script, then click the Save button:
When the Save As command completes, the newly created script is displayed.
Note:
208
The Save As dialog box includes the option Save all included files. This
option causes the software to save any Include files that have included into
the script. The Included files are saved to the same directory as the traffic
generation file.
Teledyne LeCroy
PETracer ML User Manual
Chapter 10: Traffic Generation
Creating a New Empty Generation File
To create a generation file from scratch:
Step 1 Select File > New PETrainer Script or use the shortcut Ctrl+N.
An empty PETrainer traffic generation file appears. You can also view the Script
Editor.
Teledyne LeCroy
209
Chapter 10: Traffic Generation
PETracer ML User Manual
10.3 Editing Generation Files with the Script Editor
The Script Editor is an editing tool for PETracer traffic generation files (<filename>.peg).
The generation script is presented in the Script Edit window. Parameters are presented
in menus and text boxes in the Command Properties window in the right-hand portion of
the Script Editor.
To launch the Script Editor: click the Script Editor button
on the toolbar or
right-click the CATC Trace window and choose Edit as Text from the pop-up menu.
The Script Editor window displays in the lower portion of the CATC Trace window.
Layout: The Script Editor divides into four areas:
•
Script Editor toolbar: Presents options for printing, saving, bookmarking,
and other options.
•
Script Edit window: Main window where the script is displayed and edited.
Text in this window behaves as in most text editors. Text can be copied,
pasted, and searched.
•
Command Properties window: Presents editable parameters. Many
parameters have menus. Click the parameter in the Command Properties
window to see if a down-arrow appears.
•
File tabs: Lists the name of the traffic generation file and any open Include
files that are associated with the generation file. If the generation file has
Include statements, the Include files automatically open and display as tabs
in the File tabs section of the Editor window.
Error Log: An error log opens automatically at the bottom of the window any time a script
error occurs. The window closes automatically whenever the error is corrected, after you
save the script.
210
Teledyne LeCroy
PETracer ML User Manual
Chapter 10: Traffic Generation
Script Editor Toolbar
The toolbar contains buttons for saving your edits, navigating, searching and other
functions.
Save. Saves your edits and
immediately updates the setting
bars and Frames shown in the
CATC Trace window.
Go to Trace View.
Causes trace view to bring the
currently selected script line to the
top of the screen.
Toggle Bookmark. Allows markers
to be set or removed to aid in
navigation.
View Options. Opens a menu with
three options:
• Enable Outlining
Next Bookmark.
• Toggle Outlining
• Line Numbers.
See “View Options Menu” on page
216 for descriptions.
Teledyne LeCroy
Cut.
Previous Bookmark.
Copy.
Clear All Bookmarks.
Paste.
Find.
Undo.
Replace. Find and replace.
Redo.
Print.
211
Chapter 10: Traffic Generation
PETracer ML User Manual
Script Edit Window
The Script Edit Window offers several features to simplify the process of editing.
Syntax Highlighting
All known commands and parameters are highlighted in blue.
All predefined values and command modifiers are highlighted in brown.
Intellisense prompts for known predefined values/literals. This functionality is invoked
when you type = after a known key or select List values from the Context menu.
Tooltips
The Tooltips look like the following:
Outlining
When outlining is enabled user have the option to collapse/expand code blocks:
Text Editing Commands
The Script Editor supports standard editor commands:
212
•
Copy/Paste
•
Undo/Redo
•
Find/Replace
•
Bookmarks
Teledyne LeCroy
PETracer ML User Manual
Chapter 10: Traffic Generation
Synchronized Scrolling with the CATC Trace Window
You can navigate from the generation code window to the corresponding place in the
CATC Trace representation, and visa versa.
From the CATC Trace window, right-click the first cell in a packet in the CATC Trace
window and select Go to Script Editor from the pop-up menu. The Script Editor window
then repositions to the corresponding code.
From the script editor, right-click some code within the Script Editor window and select
Position Trace view on packet x from the pop-up menu (where x is a packet number).
The CATC Trace window repositions to the corresponding packet number.
Teledyne LeCroy
213
Chapter 10: Traffic Generation
PETracer ML User Manual
Command Properties Window
The Command Properties window lists all possible parameters for the current script
command and all values for the parameters currently defined in this command. Entering
parameters/values within the Edit window causes the Command Properties window to
automatically update. Parameters/values can be changed by entering text into the text
boxes or by selecting items from pull-down menus as shown in the example below.
In this case, the edit window is updated automatically. If the current script command does
not have parameters or the current cursor position is outside of any script command, then
a generic prompt is displayed in the window:
214
Teledyne LeCroy
PETracer ML User Manual
Chapter 10: Traffic Generation
Script Editor File Tabs
At the bottom of the Script Editor window is the name of the open generation file.
If there are Include statements in the generation file that link it to other generation files,
these files automatically open and display as tabs at the bottom of the window. You can
click the tabs to toggle between the open generation files.
Script Editor Error Log
Whenever you create a scripting error, a log opens at the bottom of the application
window. When the error is corrected, the window automatically closes.
Errors: Marked by red squares.
Warnings: Marked by yellow squares.
Double-clicking an error in the error log causes the cursor in the edit window to move to
where the error was detected.
Note:
Teledyne LeCroy
You cannot run the script if it has syntax errors.
215
Chapter 10: Traffic Generation
PETracer ML User Manual
View Options Menu
The View Options button displays a menu with these options:
Enable Outlining: Adds an expandable/collapsible tree structure to the left side of the
Script Editor showing the hierarchical relationships of the script lines.
Show Line Numbers: Adds line numbers to the left side of the Script Editor window.
Show Tooltips: Allows tooltip popups, which provide descriptions of script keywords
when cursor mouses over a keyword.
Toggle Outlining: Toggles the outline tree between collapsed and expanded states.
216
Teledyne LeCroy
PETracer ML User Manual
Chapter 10: Traffic Generation
10.4 Generation Options Dialogs Overview
The Generation Options dialog box is used to set Config settings in a traffic generation
script (for example, Config = General or Config = Link). This dialog duplicates the
Config script command and is provided as a convenient alternative means of setting this
command in the script.
Note:
The Generation Options dialog is subordinate to the script itself, so script
commands override options selected in this dialog box.
Opening the Dialog
To open the Generation Options dialog, select Setup > Generation Options or click
the Generation Options button
.
PETrainer ML
Dialog Layout
The Generation Options dialog is organized into five pages: General, Link, Integrity, Flow
Control, and Transactions.
Teledyne LeCroy
217
Chapter 10: Traffic Generation
PETracer ML User Manual
10.5 Generation Options for PETrainer ML
General
218
Teledyne LeCroy
PETracer ML User Manual
Parameter
Chapter 10: Traffic Generation
Values
Default
Comment
Specifies the generation platform.
The choice affects some of the options
presented in the Generation Options dialog.
Target
LinkWidth
1
2
4
8
16
1
Ignored if AutoDetect is set.
DisableScrambleTx
Yes
No
No
Ignored if AutoDetect is set.
DisableDescrambleRx
Yes
No
No
Ignored if AutoDetect is set.
ReverseLanesTx
Yes
No
No
Ignored if AutoDetect is set.
ReverseLanesRx
Yes
No
No
Ignored if AutoDetect is set.
InvertPolarityTx
(X,X,X,X)
Ignored if AutoDetect is set.
InvertPolarityRx
(X,X,X,X)
Ignored if AutoDetect is set.
SkewTx
(X,X,X,X)
Interposer
Host
Device
Host
BaseSpec10
Yes
No
No
UseExtRefClock
Yes
No
Yes
Use external reference clock.
(PETrainer ML only)
AutoDetect
Yes
No
Yes
Automatically detects Link Width (PETrainer ML only),
Polarity Inversion, Lane Reversal, and Scrambling.
Teledyne LeCroy
Host = Host Emulation
219
Chapter 10: Traffic Generation
PETracer ML User Manual
Link
Parameter
Values
Default
Comment
SkipTimer
In ns
(rounded to nearest 8)
Off
4720
Periodic timer that controls sending of SKIP ordered
sets at specific intervals. Timer’s value is measured in
1us units. The SKIP timer should be 4720 ns <-> 6152
ns per the spec.
FTSCount
0 to 255
255
Number of FTS ordered sets required (as sent in TS)
ExtendedSynch
Yes
No
Yes
Forces LTSSM to send 4096 Fast Training Sequences
when leaving LOs state. The value entered in the text
box sets the NUM_FTS field in training patterns TS1,
TS2 as generated by LTSSM.
220
Teledyne LeCroy
PETracer ML User Manual
Chapter 10: Traffic Generation
Integrity
The Integrity page sets the parameters for two Config commands: Config = TLP and
Config = AckNak
Teledyne LeCroy
221
Chapter 10: Traffic Generation
PETracer ML User Manual
Parameter
Values
Default
Comment
AckNak Policy
Auto
Ack
Nak
Disable
Auto
Auto: Automatic ACK/NAK DLLP generation for
received TLP packets (default).
Ack: Always ACK received TLP packets
Nak: Always NAK received TLP packets
Disable: Disable automatic ACK/NAK DLLP
generation.
AckNak Policy
AckNak Delay
In ns
(rounded to
nearest 8)
0
Timer that controls how much delay is added to
AckNak DLLP response after TLP reception.
Valid if AckNak is Auto, Ack, or Nak.
Used to delay AckNak, thereby allowing customers to
test their replay mechanisms and replay timer.
TLP Policy
AutoSeqNumber
Yes
No
Yes
If not set, overrides automatic generation of the TLP
sequence number and uses user-defined value of the
field in the Packet=TLP commands.
This option overrides any sequence numbers
specified in the script.
TLP Policy
AutoGenerate LCRC
Yes
No
Yes
If not set, overrides automatic generation of LCRC
and uses user-defined value of the field in the
Packet=TLP commands.
This option overrides any LCRC specified in the script.
TLP Policy
ReplayTimer
In ns
(rounded to
nearest 8)
Off
4200
Timeout in TLP transmitter path that counts time since
last Ack or Nak DLLP is received.
If set, automatically retransmit TLPs that were NAKed
or on replay timer expiration.
TLP Policy
AutoRetrain
Yes
No
Yes
If set, enable automatic retraining of the link in case
the number of retransmitted TLP is 4.
Valid only when AutoRetransmission is set.
222
Teledyne LeCroy
PETracer ML User Manual
Automatic Tag
Generation
Chapter 10: Traffic Generation
Yes
No
No
Disable automatic tag generation.
Prevents PETrainer from automatically inserting a tag.
Tags are a sub-field of the transaction ID field.
When auto tag insertion is enabled, the tag field is
only modified for non-posted transactions such as
CfgRd, CfgWr, and MemRd.
Options are:
Use lower 5-bit of Tag field. Zero out higher 3 bits.
Use 8-bit of Tag field.
Use 1 most significant bit of Function field
and use 8-bit of Tag field.
Use 2 most significant bits of Function field
and use 8-bit of Tag field.
Use 3 bits of Function field and
use 8-bit of Tag field.
Flow Control
The Flow Control page sets parameters for Config = FCTx and Config = FCRx.
Teledyne LeCroy
223
Chapter 10: Traffic Generation
PETracer ML User Manual
FCRx Parameter
Values
Default
Comment
Enable Tx Flow Control
Yes
No
Yes
When not set, the TLPs are being sent without
the regard of how many credits are available.
This option prevents TLP transmission if
insufficient credits are available.
Enable Rx Flow Control
In ns
(rounded to nearest 8)
Off
4200
When enabled, allows automatic updating of
these DLLPs.
This option enables a periodic timer that
controls sending of UpdateFC DLLPs. You
should leave timer and credit values to
defaults for correct behavior.
PH
0 to 255
1
Posted Request Headers
NPH
0 to 255
1
Non-Posted Request Headers
CplH
0 to 255
1
Completion Headers
PD
0 to 4095
1024
Posted Request Data Payload
NPD
0 to 4095
1
Non-Posted Request Data Payload
CplD
0 to 4095
1024
Completion Data Payload
224
Teledyne LeCroy
PETracer ML User Manual
Chapter 10: Traffic Generation
Transactions
Parameter
Values
Default
Comment
Automatically handle
Configuration Read and
Write TLP transactions
Yes
No
No
If set, automatically handles Configuration Read and Write
TLP transactions.
For Configuration Read transaction, Completion TLP
contains the data read from the internal Configuration
Space according to specified register address.
For Configuration Write transaction, internal Configuration
Space is updated at the address with the data taken from
Configuration Write TLP, and Configuration Write
Completion is returned.
This option enables Read and Write access to 4 KB
configuration space.
Teledyne LeCroy
225
Chapter 10: Traffic Generation
PETracer ML User Manual
10.6 Generating Traffic: Set Generation Options
Before beginning generation, set options in the Generation Options dialog box:
Step 1 Open the Generation Options dialog box by selecting
Setup > Generation Options from the menu. The Generation Options
dialog opens.
By default the General page displays.
Step 2 To test 1.0 devices, check the box next to
Base Spec Rev. 1.0 Compatibility Mode to select 1.0 compatibility
mode.
To test 1.0A devices, leave this box unchecked.
Step 3 Set the generation direction based on type of device you are emulating.
Step 4 Select one of the two Interposer options:
•
Host Emulation: Select Host
•
Device Emulation: Select Device
Step 5 Select the Link tab. The Link page opens.
Step 6 Select Enable Automatic Skip Generation, but leave the setting at the
default value: 4720 ns.
Step 7 Select the Integrity tab. The Integrity page opens.
Step 8 Check to enable Automatic ACK/NAK DLLP generation for received
TLP packets.
Step 9 Enable all four TLP policies.
Step 10 Select the Flow Control tab. The Flow Control page opens.
Step 11 Check the checkbox to enable Do not send TLP packet if credit
amount is insufficient.
Step 12 Check the checkbox to enable
Periodically schedule UpdateFC DLLP.
Step 13 Use the defaults for all other boxes.
Step 14 Click OK to apply all changes and close the Generation Options dialog.
226
Teledyne LeCroy
PETracer ML User Manual
Chapter 10: Traffic Generation
10.7 Generating Traffic: Prepare Traffic Generation
To prepare for traffic generation, follow these steps:
Step 1 If it is not running, start the PETracer™ software.
Step 2 Open an existing script file or create a new script. For example, open the
traffic generation file Linkup.peg by selecting File > Open from the
menu. The following packets display in the main window.
The CATC Trace window shows the type of traffic that is to be generated in the
current generation session.
Step 3 If needed, make changes to the script file,
then save the file by clicking the Save button
Teledyne LeCroy
.
227
Chapter 10: Traffic Generation
PETracer ML User Manual
10.8 Generating Traffic: Begin Traffic Generation
To begin traffic generation:
Step 1 Start generation by clicking the Start Traffic Generation
on the Status bar.
button
This action causes the software to download the script to the PETrainer device.
After the download completes, the device starts executing the script.
As the script executes, the Status bar displays the script's progress.
The Current script position field displays the command description and
CATC Trace packet number currently being generated.
Note:
Script execution can be terminated at any time by clicking the
Stop Generation
button on the toolbar.
If a Wait command is executed where the Display parameter is specified, the
user-defined text is displayed.
If a wait=user script command is executed, the script pauses until you click the
Resume Generation button
on the toolbar.
228
Teledyne LeCroy
PETracer ML User Manual
Chapter 10: Traffic Generation
Step 2 Open the Real-Time Statistics window by clicking
.
To the right is a Statistics Accumulation area. In this area look for two
messages:
•
InitFC State: Complete (shown in the example above)
•
Link State: LO
If the messages appear, then it means that the Exerciser successfully completed
the Link training.
Note: Link training can also be performed by clicking the Trainer Connect
button on the Status bar.
Teledyne LeCroy
229
Chapter 10: Traffic Generation
230
PETracer ML User Manual
Teledyne LeCroy
PETracer ML User Manual
Chapter 11: Macros
Chapter 11: Macros
11.1 Macros
PETrainer™ ML allows you to add buttons to the Status bar at the bottom of the window
(and add commands to the Generate menu) to run traffic generation macros on the
Exerciser.
After a macro script has been defined and assigned to a button the on the Status bar, the
macro can be run by clicking the macro button with the mouse or selecting the macro
name from the Generate menu.
Default Macros: Connect and Disconnect
By default, the PETracer™ software includes two macros, Connect and Disconnect.
These buttons execute macros for creating and breaking a connection between the
Exerciser and a DUT.
The buttons are on the Status bar when Exerciser hardware is present.
The commands are also on the Generate menu:
Connect Macro
The default code for this macro is the following:
Config
Link =
Wait =
Link =
Wait =
Link =
= General {TrainerReset = 1}
Detect
500
L0
500
InitFC
Disconnect Macro
The default code for this macro is the following:
Config = General {TrainerReset = 1}
Link = Detect
Teledyne LeCroy
231
Chapter 11: Macros
PETracer ML User Manual
11.2 Adding New Script Macros
There are two ways to add script macros:
•
Using the Generation Macros dialog
•
Adding script files to the GenScriptMacros directory.
Using the Generation Macros Dialog
Step 1 Open the Generation Macros dialog by selecting
Setup > Generation Macros from the menu.
Step 2 In the Generation Macros dialog box, click the New button.
Step 3 Within Script properties area specify script name, script comment,
script icon, and whether or not to show script icon on a toolbar.
232
Teledyne LeCroy
PETracer ML User Manual
Chapter 11: Macros
Step 4 Create a new icon for the script by clicking Edit Icon... button. The Edit
Generation Macro Icon dialog appears.
Step 5 Using the tools provided, paint the icon for new script macro and then
press OK.
Step 6 Edit the script code by clicking the Edit code... button. The dialog closes
and an empty script editing window appears (see Section 10.3, “Editing
Generation Files with the Script Editor” on page 210).
Step 7 Type the script code and press the Save button. The script macro and
icon are saved in the GenScriptMacros directory located under the
PETracer directory (for example,
Program Files\CATC\PETracer\GenScriptMacros).
Step 8 Close the script window. The new macro script button automatically
appears on the Status bar at the bottom of the window. Clicking this
button causes PETrainer to execute the script.
Adding Script Files to the GenScriptMacros Directory
The second way to add a new PETrainer script macro is to copy an existing PETrainer
script file in the GenScriptMacros directory.
Step 1 Copy a script file into the GenScriptsMacros directory located under the
PETracer directory (for example,
Program Files\CATC\PETracer\GenScriptMacros).
Step 2 Switch to the PETracer application. You see that a new icon has been
automatically added for the script file to the Status bar at the bottom of
the window. The default icon is assigned to the new script macro and the
file name is used as a script name.
Teledyne LeCroy
233
Chapter 11: Macros
PETracer ML User Manual
11.3 Modifying Script Macros
To modify a macro assigned to a button:
Step 1 Select Setup > Generation Macro from the menu.
The Generation Macros dialog opens for modifying, creating, and deleting macros:
Name: Name of Macro
Comment: Descriptive comment so you can remember what the macro does
Icon: Currently assigned button for the macro.
Show icon on the toolbar: If checked, places the icon on the Status bar.
Edit Code: Opens a dialog for editing the macro script.
Step 2 Select the macro to be modified.
Step 3 Within the Script properties area, modify the script name, script
comment, script icon, and whether or not to show script icon
Step 4 To edit script code, press the Edit code... button. The Generation
Macros dialog closes and the Script Editing window appears, showing
current code for the selected script macro.
Note:
If the Generation Script Editor pane does not appear, click
Step 5 Modify the script code and press the Save button
.
.
Step 6 Close the script window. The macro has now been modified.
11.4 Changing the Order of Macro Icons on the Status
Bar
To change the order of script macro icons on the Status bar:
Step 1 Open Generation Macro Scripts dialog by selecting
Setup > Generation Macros.
Step 2 Click the Up and Down buttons to change the order of the script macros.
Step 3 Close the dialog. The button order is changed.
234
Teledyne LeCroy
PETracer ML User Manual
Chapter 11: Macros
11.5 Deleting User-Defined Script Macros
To delete a script macro:
Step 1 Open the Generation Macro Scripts dialog by selecting
Setup > Generation Macros.
Step 2 Select the macro you want to delete and press the Delete button:
All deleted scripts and icons are removed from GenScriptMacros directory. A
backup copy is stored in the GenScriptMacros\Deleted directory.
Note:
You cannot delete the Connect and Disconnect script macros.
11.6 Restoring the Default Appearance of the Connect
and Disconnect Icons
You can restore the default appearance of the Connect and Disconnect icons by clicking
the Restore button.
Step 1 Open the Generation Macro Scripts dialog by selecting
Setup > Generation Macros.
Step 2 Select the macro you want to restore and press the Restore button.
Teledyne LeCroy
235
Chapter 11: Macros
236
PETracer ML User Manual
Teledyne LeCroy
PETracer ML User Manual
Chapter 12: Address Space
Chapter 12: Address Space
12.1 Address Space Toolbar Buttons and Dialogs
On the PETrainer™ toolbar at the bottom of the application window are two buttons:
•
Write Address Space
•
Read Address Space
Clicking these buttons opens a dialog for selecting, creating, or editing Address Space
settings used by PETrainer. The dialog can also be accessed from the menu:
Generate > Write Address Space and Generate > Read Address Space.
Teledyne LeCroy
237
Chapter 12: Address Space
PETracer ML User Manual
Write Address Space Button
The Write Address Space button brings up a dialog.
Write Address Space Dialog for PETrainer ML
PETrainer ML supports only the Configuration Address Space.
You can open a browse dialog for selecting a configuration space file.
You can open the Configuration Space Editor for editing or creating configuration space
files.
Note:
The Configuration Address Space cannot be written to PETrainer ML when
a generation script is running.
Read Address Space Button
This Read Address Space button brings up a dialog.
PETrainer ML Read Address Space Dialog
PETrainer ML supports only Configuration Address Space.
Note:
238
The Configuration Address Space cannot be read from PETrainer ML when
a generation script is running.
Teledyne LeCroy
PETracer ML User Manual
Chapter 12: Address Space
12.2 Memory/IO Space Editor
The Memory/IO Space Editor lets users write address space memory into PETrainer™
and read address space memory from PETrainer.
To access the Memory/IO Space Editor, select Tools > Memory/IO Space Editor. The
following dialog opens:
•
•
Create new Address Space File: Opens the Memory/IO Space Editor and displays
an empty address space with the size specified.
Open existing Address Space File: Activates the list of recently used
Memory/IO Address Space files and enables the Select... button. After you have
selected a file and then clicked Select, the Memory/IO Space Editor opens.
The Memory/IO Address Space editor is implemented as a standard hex editor.
The address space memory must be saved to a file so that it can be downloaded to the
PETrainer hardware using PETracer™ application.
If you prefer, you can write address space memory into PETrainer and read address
space memory from PETrainer directly using the
and
toolbar buttons or using the menu File > Write Address Space or
File > Read Address Space.
Teledyne LeCroy
239
Chapter 12: Address Space
240
PETracer ML User Manual
Teledyne LeCroy
PETracer ML User Manual
Chapter 13: Configuration Space
Chapter 13: Configuration Space
13.1 Configuration Space Editor
The Configuration Space Editor allows the Configuration Space to be modified on a
field-by-field basis using hexadecimal or binary format.
The editor supports PCI-compatible Configuration Spaces and PCI Express enhanced
Configuration Spaces.
13.2 Launching the Configuration Space Editor
Selecting Tools > Configuration Space Editor displays the following dialog:
•
•
Create new Configuration Space File: Opens the Configuration Space Editor with
the default (empty) configuration space.
Open existing Configuration Space File: Activates the list of recently used
configuration space files and enables the Select... button. After you select a file and
click OK, the Configuration Space Editor opens.
Configuration Space Files
You can save configuration space files in the Configuration Space View (see
“Configuration Space View” on page 179). Open a trace file, select a packet, and then
select Reports > Configuration Space View. Click the Save button to display the Save
As dialog and enter a file name (which has no special file extension).
You can save configuration space files in the Configuration Space Editor. Click the Save
button to display the Save As dialog and enter a file name (which has no special file
extension).
You can open saved configuration space files in the Configuration Space Editor and
optionally edit them. You can then use them for generation.
Teledyne LeCroy
241
Chapter 13: Configuration Space
PETracer ML User Manual
Editing
When a new file is created, a blank PCI Configuration Space Header is loaded for
editing. However, its position is not configurable, and the offset always starts at 000h.
In the Configuration Space View, at the left, you can add and define PCI-compatible or
PCI Express Configuration-Space Capability Structures.
The toolbar allows you to create a New configuration space, Open a configuration-space
file, Save a file, Write Configuration Space, and Read Configuration Space.
242
Teledyne LeCroy
PETracer ML User Manual
Chapter 13: Configuration Space
Click + Add and then choose a Capability Structure from the context menu. You can also
select Edit > Add PCI Capability or Edit > Add PCI Express Capability.
Available PCI Capability Structures are:
• Message Signaled Interrupts
• Accelerated Graphics Port
• Vital Product Data
• Vendor-Specific
• PCI Express
• Hyper Transport
• Generic
Available PCI Express Capability Structures are:
• Virtual Channel
• Virtual Channel for MFVC
• Device Serial Number
• Power Budgeting
• Root Complex Link Declaration
• Root Complex Internal Link Control
• Root Complex Event Collector Endpoint Association
• Vendor-Specific
• RCRB
• ACS
• MFVC
• Resizable Bar
• Multicast
• DPA
• ARI
• LTR
• SR IOV
• Generic
Selecting a structure displays a dialog in which you can define the structure.
Enter an integer Offset.
Position the structure in the linked list of capabilities by selecting the Previous and Next
capability structures.
Teledyne LeCroy
243
Chapter 13: Configuration Space
PETracer ML User Manual
Note: The Configuration Space View, from the Reports menu, reflects any added
structures (see “Configuration Space View” on page 179).
After you click OK, the center column displays the Capability Structure View, with the
register layout. You can modify the selected Capability Structure by selecting registers
and editing in binary or hex. The toolbar allows you to select Binary or Hexadecimal for
editing.
Alternatively, after selecting a register, you can modify the register in the Field View in the
right column.
The Field View allows you to override field attributes. By default, attributes are assigned
according to the specification. The available options are:
•
•
•
RO: Read Only
RW: Read-Write
RW1C: Write-1-to-Clear
Note: See Appendix A “Configuration Space Decoding” on page 249.
244
Teledyne LeCroy
PETracer ML User Manual
Chapter 13: Configuration Space
13.3 BARs Setup
The BARs Setup dialog helps set up Base Address Registers. It provides a more
convenient way of defining BARs than setting up the BARs manually. In addition, it
provides the mapping of BARs to PETrainer and Summit Z2-16 memory regions.
To open the BARs Setup, select Edit > BARs Setup.
BAR1 and BAR2 are assigned to 64-bit memory address space and mapped to Mem64
PETrainer memory region. BAR4 is assigned to 32-bit memory address space and
mapped to Mem32A PETrainer memory region.
You can specify Prefetch and Address Space Size. The sizes for each address space are
limited to the values supported by PETrainer hardware.
BAR and Prefetch fields affect the Hexadecimal/Binary in the middle column of the
Configuration Space Editor.
Size field affects Field View in the right column of the Configuration Space Editor.
The mapping of BARs to PETrainer memory regions is discussed at the
AddressSpace Command in the Help section of the PETrainer Script Language.
The BAR settings are used for Memory and IO completer.
Teledyne LeCroy
245
Chapter 13: Configuration Space
PETracer ML User Manual
13.4 Configuration Read and Write
PETrainer™ can automatically handle Configuration Read and Write TLP transactions:
•
For a Configuration Read transaction, the Completion TLP contains the data
read from the internal Configuration Space according to specified register
address.
•
For a Configuration Write transaction, the address for the internal
Configuration Space is updated with the data taken from Configuration Write
TLP, and Configuration Write Completion is returned.
You can specify the initial Configuration Space by editing the AddressSpace=Write
command directly in the script or by using the UI provided in the Generator toolbar.
The PETracer™ software provides a special editor for editing this file called the
Configuration Space Editor (see “Launching the Configuration Space Editor” on page
241).
246
Teledyne LeCroy
PETracer ML User Manual
Chapter 14: Updates and Licensing
Chapter 14: Updates and Licensing
14.1 Updating the Analyzer
BusEngine™ and/or Firmware updates are now automatic processes that run anytime a
new version of the PETracer™ software is installed that is incompatible with the currently
installed BusEngine or Firmware. The update process generates onscreen instructions.
If, however, you need to manually perform BusEngine or Firmware updates, follow these
steps:
Step 1 Select Setup > Update Device … from the menu to display the
Update Analyzer dialog box for PETracer ML™:
Step 2 Select the appropriate file locations for the Firmware and/or BusEngine,
using Browse, if necessary.
Step 3 Check the appropriate options (if in doubt, check all options).
Step 4 Click Update to initiate the updating of the Analyzer.
Updating the Exerciser
To manually update the BusEngine and/or Firmware for PETrainer ML, follow the same
steps as above.
Teledyne LeCroy
247
Chapter 14: Updates and Licensing
PETracer ML User Manual
14.2 License Keys
A License Key is necessary to enable software maintenance. If you attempt to record with
the Analyzer without an installed License Key, a message appears to indicate that a
License Key is necessary in order to record traffic.
A License Key must be obtained from Teledyne LeCroy for each Analyzer.
After you obtain the License Key, follow these steps to install it:
Step 1 Select Help > Update License… from the menu bar. to display the
Update License dialog box.
Step 2 Enter the path and filename for the License Key or use the Browse
button to navigate to the directory that contains the License Key.
Step 3 Select the .lic file, and then click Update Device.
You can also update your licensing information by selecting
Setup > All Connected Devices …, then clicking Update License.
14.3 License Information
You can view Licensing information for your Analyzer by selecting
Help > Display License Information... from the menu bar. The License Information
window displays data about the maintenance expiration and purchased features.
248
Teledyne LeCroy
PETracer ML User Manual
Appendix A: Configuration Space Decoding
Appendix A: Configuration Space
Decoding
The decoded capability structures in the Configuration Space Viewer and Editor are
based on programmed definitions in the PETracer software and on Configuration Space
Decode Scripts.
Configuration Space Decode Scripts are tools to define capability structures and instruct
the Configuration Space Viewer or Editor how to decode them. These scripts are in the
\CfgSpaceScripts sub-directory below the \Scripts directory in the application directory.
You can write Configuration Space Decode Scripts using the CATC Scripting Language
(CSL). See the Teledyne LeCroy Analyzers File Based Decoding Manual for reference.
PCI Express Configuration Space Decode Scripts have the file extension .pecfgdec.
A.1 Mandatory Definitions
Configuration Space Decode Scripts must set the following reserved variables.
•
•
•
CapabilityName: Name of the capability structure
CapabilityID: ID of the capability structure
ExtAddSpace: Set to 1 if Extended Configuration Space.
Otherwise, set to 0 for PCI.
A.2 Mandatory Module Functions
Modules are collections of functions and data dedicated to decoding a specific capability
structure. Each module has one primary Configuration Space Decode Script file
(extension .pecfgdec) and optionally has include files (.inc).
A module function is an entry-point into a decoding module. To help display a
capability structure, the application calls a module function.
The Configuration Space Editor and Viewer support only the DecodeRegister( offset )
and GetSize( ) functions.
DecodeRegister( offset )
The application calls this function while decoding a specific DWORD offset of the
specified CapabilityID. The offset is the decoding entry point, where the decoding path
starts.
The Configuration Space Editor calls this function to determine how to decode the
assigned configuration space. The offset parameter is the DWORD to decode.
An offset of 0 indicates bytes 00h-03h, an offset of 1 indicates bytes 04h-07h, and so on.
Note: The Configuration Space Editor can only decode one DWORD at a time.
GetSize()
This function returns the size of the capability structure specified by CapabilityID.
Teledyne LeCroy
249
Appendix A: Configuration Space Decoding
PETracer ML User Manual
A.3 Configuration Register Types
The following reserved variables are defined global constants.
• CFGREG_UNDEFINED
• CFGREG_HWINIT
• CFGREG_RO
• CFGREG_RW
• CFGREG_RW1C
• CFGREG_ROS
• CFGREG_RWS
• CFGREG_RW1CS
• CFGREG_RSVDP
• CFGREG_RSVDZ
Note: These reserved variables match the Configuration Register Types of Table 7-2 in
Section 7.4 of the PCI Express Base Specification, Rev. 2.1.
A.4 Primitives
Decoding uses the following primitives.
GetRegisterField( dword_offset, bit_offset, field_length )
This function returns a register field of length field_length, starting at bit position
bit_offset in DWORD dword_offset.
•
•
•
dword_offset: DWORD offset of the register field location
bit_offset: Bit offset of the register field location
field_length: Length of the register field
For example, GetRegisterField( 1, 9, 2 ); means: Go to DWORD 1, bit offset 9, and
returns 2 bits.
250
Teledyne LeCroy
PETracer ML User Manual
Appendix A: Configuration Space Decoding
AddField( field_name, field_length, configuration_reg_type, tooltip,
encoding_table = NULL )
This function adds a register field to the Capability View and returns a pointer to the field,
for adding subfields.
•
•
•
•
•
•
field_name: Name of the register field to display in the Capability View
field_length: Length of the register field
configuration_reg_type: Configuration register type of the register field.
Note: If subfields are defined, their configuration register types override this setting
for their specified bits.
tooltip: Tooltip displayed for the register field in the Capability View
encoding_table: Optional. Displays encodings as lists for select values.
For example, user input becomes a combo box for the field in the Field View.
As examples:
AddField( "PCI Express Extended Capability ID", 16, CFGREG_RO, "" );
means: Add the field "PCI Express Extended Capability ID" with length 16 and cfg
register type CFGREG_RO.
capability_reg = AddField( "Capability Register", 32, CFGREG_RW, "" );
means: Added the field "Capability Register" with length 32 and cfg register type
CFGREG_RW and stored a pointer to this field in variable capability_reg, which can be
used to add subfields to this field.
AddSubField( parent_field, subfield_name, subfield_length,
configuration_reg_type, tooltip, encoding_table = NULL );
This function adds a subfield to a register field in the Capability View. Subfields are
modifiable and visible in the Field View and appear in the tooltips of register fields.
•
•
•
•
parent_field: Pointer to a register field in the Capability View
subfield_name: Name of the subfield, displayed in the Field View
subfield_length: Length of the subfield
configuration_reg_type: Configuration register type of the subfield field.
Note: This overrides the configuration_reg_type of the parent field.
• tooltip: Tooltip displayed for the subfield in the Capability View
• encoding_table: Optional. Displays encodings as lists for select values.
• For example, user input becomes a combo box for the field in the Field View
.
For example,
AddSubField( capability_reg, "Mode Supported", 4, CFGREG_RO, "Indicates the
Function modes," ), ModeEncodings );
means: Add the subfield "Mode Supported" to the parent field "capability_reg" with length
4, type CFGREG_RO, a tooltip in the Capability View, and a combo box displaying "mode
encodings" for input in the Field View.
A.5 Helper File
ConfigSpaceCommon.inc include file contains useful functions for script decoding.
Teledyne LeCroy
251
Appendix B: China Restriction of Hazardous Substances Table
PETracer ML User Manual
Appendix B: China Restriction of
Hazardous Substances Table
The following tables are supplied in compliance with China's Restriction of Hazardous
Substances (China RoHS) requirements:
252
Teledyne LeCroy
PETracer ML User Manual
How to Contact Teledyne LeCroy
How to Contact Teledyne LeCroy
Type of Service
Call for technical support…
Contact
US and Canada:
1 (800) 909-7112
Worldwide:
1 (408) 653-1260
Fax your questions…
Worldwide:
1 (408) 727-6622
Write a letter…
Teledyne LeCroy
Protocol Solutions Group
Customer Support
3385 Scott Blvd.
Santa Clara, CA 95054-3115
USA
Teledyne LeCroy
Send e-mail…
[email protected]
Visit Teledyne LeCroy’s
web site…
teledynelecroy.com/
253
How to Contact Teledyne LeCroy
PETracer ML User Manual
[This page is intentionally blank]
254
Teledyne LeCroy
PETracer ML User Manual
Index
Symbols
.lic files 248
.opt files 116
.peg files 210
.peg traffic generation files 205
.pem file 65
.pem files 65
.pex files 65, 67
.rec files 65
+ Packet # button 110
Numerics
100 ohm series resistor 21
25-pin Data Output Connector 16
40-pin Data Input/Output Connector 16
5-volt pin 21
A
AC Connector 17
Actions Properties dialog box 143
Activity 58
Add Analyzer dialog box 30
Add Counter command 147
adding
PETracer 40
Adding an Attachment 86
adding PETracer 39
add-on cards 34
address 253
Address Space settings 237
Address Space Size field 245
Advanced Hiding Options 50
All Connected Devices command 248
All Markers Window 95
Analyzer 7
license 248
networked 30
setting up 27
update 247
analyzer
testing 61
Teledyne LeCroy
Index
Analyzer Network Chat Bar command 70
Analyzer Network command 30
Analyzer Network dialog box 30
Any Event 150
Any TLP event 149
application 25
Attaching Markers 86
Auto-Configure Lane Polarity 125
Automatic ACK/NAK DLLP generation for received
TLP packets 226
automatic generation 203
Available Events area 130
127
averaging 187
B
Bandwidth 197
BAR field 245
BAR settings 245
Bars Setup dialog box 245
BARs Setup... button 245
Base Spec 1.0 Rev Compatibility Mode 125
Base Spec Rev. 1.0 Compatibility Mode 226
Beep When Trigger Occurs 123
Bitmask 148
blue current-position indicator 174
blue highlight 212
BNC Connectors 17
Both directions 176
Breakout Board 21
brown highlight 212
browsing network 30
Buffer Size 118, 119
Bus Reset button 35
Bus Utilization 158, 197
buttons 161
features 187
metrics 186
pop-up menu 159
BusEngine update 247
C
cable
probe data 37
Cable A 15
Cable C 15
Cable Connector 35
cables 31
calculating time between DWORDs 166
Capability Structure View 244
255
Index
Capability Structures 243
CATC Technical Support 253
CATC Trace 6
cells 72
resizing 71
states 128
Change Counter Value command 146
changing
markers 78
channeling input signals 23
Channels 142
Chat session 70
Chat window 70
circuits 22
Clear Marker command 78
Clocks radio button 82
collapse 212
Collapse Idle 167
Collapse Idle Plus. 167
Collapsible Idle Time 165
collapsing 71
Color Format Hiding tab 109
Color pop-up menu 111
colors 110
Combining Specified Event Groups 105
Combo box 180
Comma Separated Value files 68
Command Properties window 210, 214
Comment 234
Comment field 77
comment string 77
CompeterID field 180
Completion TLP 246
components 11
configuration limitations 132
Configuration Read 246
Configuration Space 179, 241, 246
editing 242
Header 242
Configuration Space dialog box 179
Configuration Space Editor 241, 246
command 241
Configuration Space Header 180
Configuration Space View 179, 180
Configuration Write 246
configuring
Exerciser 203
Recording Options 61
conflicts 134
Connect LED 15
Connect macro 231
restoring 235
256
PETracer ML User Manual
Connect/Disconnect button 61
connecting 31
interposer data cable 33
Probe Data cable 32
USB cable 33, 40
Connector A 38
connector C 38
connectors 31
DB-25 8
receptacles and cables 19
contact 253
Context menu 212
Continue option 62
Continuous Time Scale 167
Control-b command 103
Control-f command 103
controls
Analyzer ML 14
Exerciser ML 15
Count action 131
Count field 147
Counter 142
Counters 146
counters
setting 147
counting 146
Create new Address Space File 239
Create new Configuration Space File 241
creating
script 207, 209
CSV files 68
ctcupa10.sys driver 25
Ctrl+N command 209
Current script position field 228
current-position indicator 174
custom circuits 22
D
Data cable 31, 32
data cable 37
Data Cable Connector 35
data cells 71
Data connector 31
Data Field 71
Data Flow command 169
Data Flow window 169
Data In/Out connector 21, 22
Data Input/Output Connector 16
Data Output Connector 16
Data Throughput 181, 197
data_pem_files directory 63
Teledyne LeCroy Corporation
PETracer ML User Manual
data.pem file 63
data.pex file 62, 65
dataXYZ.pem files 122
DB-25 connector 8
decode levels 79
decoding 79
default options file 126
default.opt file 116
default.rec file 126
delimiters 174
Description String 142
descriptive label 126
Device Emulation 226
Device Emulation Interposer
installing 36
device emulation interposer 34
DeviceID field 180
devices
connecting to 34
Direction 207
Direction field 105
Disable Descrambling 125
Disconnect macro 231
restoring 235
Display area 44
Display Configuration Name 109
Display License Information command 248
Display Options 107
command 107
dialog box 107
fFiles 65
loading 116
saving 116
Display Options button 107
DLLP Packet Properties dialog 145
Do not export hidden packets 207
Do not export Idle packets 207
Do not save hidden packets option 67
Do not send TLP packet if credit amount is
insufficient 226
Downstream direction 176
Drag an event here to create a new sequence 128
drive strength 23
dual analyzer system 29
DWORD 148
DWORDs
timing 166
Teledyne LeCroy
Index
E
Edit as Text command 210
Edit Code 234
Edit code... button 233, 234
Edit Comment command 69
Edit Generation Macro Icon dialog box 233
Edit Icon... button 233
Edit Marker 94
Edit Marker command 78
Edit Marker for Packet # pop-up 77
editing
macros 234
script 212
electrical idle 203
e-mail 253
Email CATC Support 253
Emulation Interposer
installing 36
emulation interposer 34
Emulation Test Fixture 35
installing 36
emulation test fixture 34
Enable Automatic Skip Generation 226
Enable Outlining 216
Enable Tool tips 108
environmental conditions 18
Error Log 210, 215
Error Properties dialog box 143
Error Summary dialog box 155
error types 143
Errors 215
Errors pane 173
event
counting 146
Event Groups menu 105
Event Icon Preview 142
Event Navigation 157
Event Properties dialog box 142
Event Trigger recording type 119
events
searching 81
Event-specific Settings 143
Exclude option 105
executing 228
Exerciser 9, 13
configuring 203
setting up 28
expand 212
Expand Data command 71
Export Wait for ACK from upstream 208
257
Index
Export Wait for Cpl from upstream 208
exporting 68
Trace to a Traffic Generation File 207
Ext. In Connector 17
Ext. Out connector 17
External Interface Breakout Board 21
external signals 23
F
fax number 253
field
hiding 113
Field Colors tab 110
Field Formats tab 112
Field View 244
File Export dialog box 207
file formats 68
File Information window 154
File Menu 51
File Tabs 215
File tabs 210
filter 151
Filter action 131
Filter In button 151
Filter Out button 151
Find command 104
Find dialog box 104
Find Next command 106
finding 104
Firmware update 247
First, Prev, Next, and Last buttons 180
Fit to Graph Area 159, 192
flow control 204
Flow Control tab 226
Flush option 62
Fonts 108
format
field 112
From 207
From packet # field 69
From Packet field 67
front panel 14, 15
Functionality of Markers 84
fuse 17
G
General page 226
General tab 61, 107, 118, 218
Generate Menu 53
Generate menu 231
258
PETracer ML User Manual
generating 203, 228
theory 203
Generation Macro command 234
Generation Macros command 232
Generation Macros dialog box 232, 234
Generation Options command 217, 226
Generation Options dialog box 217, 226
Generation Status bar 58
Generator file format 68
GenScriptMacros directory 233
Global State 128
Global State Cell 130
Go To Marker command 82
Go to Marker command 166
Go To menu 102
Go to Packet # 159
Go to Packet command 81, 82
Go to Script Editor 213
Go to Trigger command 81
Grid Lines 157
ground pins 21
Group and Colors column 110, 112
H
hardware 3, 5
specifications ML 18
hardware failure 27
hardware wizard 27
header fields 74
Help Menu 56
Hexadecimal vs. Binary tabs 180
Hide 159, 192
Hide buttons 49, 166
Hide Downstream button 49
Hide SKIP and Update FC button 49
Hide Training button 49
Hide Upstream button 49
hiding 113, 114
Idles 166
Hiding tab 114
Hierarchy Lines 108
host controllers 34
Host Emulation 226
adding PETracer 40
Host Emulation Test Fixture 35
installing 36
host emulation test fixture 34
host machine 11
host machine software requirements 20
humidity 18
Teledyne LeCroy Corporation
PETracer ML User Manual
I
Icon 234
Icon Label 142
idle 203
Idle errors 143
Include files 208
Include statement 205
Include statements 215
information
priority 175
Inhibit Channel 124
InitFC complete status 194
InitFC State 229
InitFC State segment 59
input signals 23
Install Software command 25
installation 25
installing interposer 32
Integrity tab 221, 226
Intellisense 212
interface 25
internal rules 134
interposer 34
installing 32, 36
interposer data cable
connecting 33
Interposer options 226
Interposer probe 31
Intersection option 105
Invalid Configuration status 132
Invert Polarity 124
IP LAN 29
K
Key
License 248
keyboard shortcuts 57
keystrokes 57
L
label 126
LAN 29
Latency 197
Latency Time 181
Latency Time at Split Transaction level 186
Layout 210
layout 44
LeCroy PETracer command 25
LEDs
Teledyne LeCroy
Index
Analyzer ML 14
Exerciser ML 15
Legend option 174
level hiding 114
Level Hiding tab 114
levels 79
license files 248
License Information window 248
License Key 248
licensing information 248
limits 132
Linear 159, 192
Link Connect toolbar button 203
Link level decode 79
Link section 61, 124
Link Settings 118
Link State 194, 229
link state messages 59
Link State segment 59
Link tab 220, 226
Link Tracker
buttons 167
toolbar 163
Link Tracker window 163
docking 165
markers 166
reformat 164
link training 61, 204
Link Training sequence 203
Link Transaction
metrics 185
Link Transaction Level graphs 188
Link Transaction Performance 185
Link Up LED 15
Link Utilization 197
Link Width 124
Link Width pane 173
Linkup.peg file 227
List values 212
Load button 116, 126
Load command 116, 126
loading 116, 126
log 215
Logarithmic 159, 192
logic analyzers 21
long format 71
loop 29
LTSSM Flow Graph 176
LTSSM Flow Graph command 176
LV TTL output and input signals 21
259
Index
M
macros 231
changing order 234
creating 232
deleting 235
editing 234
Main Display Area 163
Main display area 127
manual
trigger switch 18
Manual Trigger
recording type 119
Manual Trigger push-button 14, 15
Markers 83
Adding an Attachment 86
Attachment Types and Visualization 88
Embedded Attachments to a Marker 88
Recording an Audio File 87
Video Files supported 87
markers 77
deleting 78
editing 78
setting 77, 166
Markers Overview 83
Mask (hex) entry 149
Match (hex) entry 149
MB Segments field 63
memory requirements 19, 20
Memory Write event 150
Memory Writes 185
Memory Writes Performance 197
Memory/IO Space Editor 239
Menu bar 44
menus 51
pop-up 72
metrics 181
Bus Utilization 186
Link Transaction 185
Link Transactions 181
Split Transaction 184
Split Transactions 181
trace 182
Traffic Summary 184
unit-base averaging 187
Metrics Header 182
Metrics Tooltip 182
Misc 118, 123
motherboards 34
Msb -> Lsb checkboxes 113
Multi-Lane verification system 3
260
PETracer ML User Manual
Multisegment
viewing 122
Multisegment recording 63
Multi-Segment Toolbar 47
multi-segmenting 63
N
Name 234
navigating 170
Navigator 170
displaying 170
legend 174
panes 171, 173
range 171, 172
ranges 171
slider 174
toolbar 171
Navigator Legend dialog box 174
Navigator Panes button 174
Navigator Range button 172
Network Browse list 70
networked Analyzer 30
networking 29
New button 232
New Event button 130
New Events button 142
New PETrainer Script 209
Number of data packets 194
Number of Link Transactions 181
Number of Packets 181
O
Offset dword 148
Offset field 243
Open existing Address Space File 239
Open existing Configuration Space File 241
opening
program 26
operating temperature 18
options files 126
Options Name 118, 121
Options Name box 126
Ordered Set Properties dialog box 146
Origin field 105
outlining 212
overview 3
P
package contents 18
Teledyne LeCroy Corporation
PETracer ML User Manual
Packet # 110
Packet # field 77
Packet Data command 178
Packet Data window 178
Packet Directionality Cell 75
Packet errors 143
Packet Header bar 177
Packet Header Cell 76
Packet Header command 177
Packet Heading Cell 75
Packet level decode 79
Packets/second 197
pane checkbox 174
Payload 181
payload pattern match 148
Payload Properties dialog box 145
Payload size 194
Payload tab 148
PC 25
PCI Configuration Space Header 242
PCI Express
adapter card 34
PCI Express Multi-Lane advanced verification
system 3
Pending Requests at Split Transaction level 186
Periodically schedule UpdateFC DLLP 226
PETracer
options 118, 120
setting up 27
PETracer EML
opening 26
PETracer ML 7, 11, 12
opening 26
PETracer SN message 58
PETrainer
setting up 28
PETrainer ML 9, 11, 13
petranx4.sys driver 25
petrcrml.sys driver 25
Pin Button 142
pin-outs 22
pins 23
Playback Window 100
Playlist Functionality 98
Playlist Playback Control 100, 101
Plug-and-Play instructions 27
plus symbol 110, 112
pop-up menus 72
Port 1 39, 124
Port 2 39, 124
Position Trace view on packet x 213
Teledyne LeCroy
Index
power
requirements 18
switch 18
power LED 15
power on/off switch 17
power socket 17
Power Switch 35
Pre/Post Trigger pane 173
Prefetch field 245
Preserve TC to VC mapping across the channels
123
Print command 69
Printer button 69
printing 69
Probe Data Cable
attaching 38
Probe Data cable 31, 32
connecting 32
probe data cable 37
Probe Data Connector 14
Probe Data connector 31
probing characteristics 19
product
overview 3
program
opening 26
progress 204
Properties 160, 192
Properties button 142
Properties command 130
Properties dialog 142
Properties dialog box 130, 141
protocol unit 181
prototype rework area 22
PWR indicator LED 14, 15
R
range delimiters 174
Raw 10b Codes 73
Read Address Space button 237
Read Address Space dialog box 238
Read Requests Performance 184
reading 71
Ready message 58
Real-Time Statistical Monitor window 192
Real-Time Statistics
buttons 190
pop-up menu 192
toolbar 190
Real-Time Statistics window 189, 229
261
Index
Real-time Statistics window 193
rear panel 16
REC (recording) LED 14
Recently Used Ranges 172
Record button 62
Record Menu 52
recorded activity 60
recording 61, 117
memory size 19
multi-segment 63
stopping 62
Recording button 131
Recording LED 14
Recording Options
command 117
configuring 61
dialog box 117
files 65
loading 126
saving 126
settings 126
Recording Options command 61
recording progress 60
Recording Progress Bar 58
Recording Rules
buttons 129
examples 134
limits 132
logic 134
toolbar 129
Recording Rules tab 127
recording status 60
Recording Type 118, 119
Reference Clock 35
remote operation 29
Remove 159
Report Menu 53
Report menu 153
reporting 20
reports 153
Reset button 35
Reset Column Widths 165
resizing 71
Response Time 181, 197
Response Time and Latency Time at Split
Transaction level 186
Response Time at Link Transaction level 186
Response Time at Split Transaction level 186
restoring
icons 235
Resume Generation button 228
262
PETracer ML User Manual
Reverse Lanes 124
Right click cell context menu 108
Row Selection 157
RS-232 25-pin Data Output Connector 16
RS-232 40-pin Data Input/Output Connector 16
rules
internal 134
Run LED 15
Run verification scripts command 198
Rx Cable C 15, 38
S
Save all included files 208
Save As command 67
Save As Default 116, 126
Save As Default. 126
Save As MultiSegment Trace 118, 122
Save as Multisegment trace 63
Save button 116
Save External Interface Signals 123
Save packet range command 67
saving 67, 116, 126
script 208
script 228
creating 207, 209
editing 212
executing 204
macros 231, 232
running 227
saving 208
script comment 232
Script Edit Window 212
Script Edit window 210
Script Editor 206, 210
toolbar 211
tooltips 212
Script Editor button 210
Script Editor toolbar 210
script icon 232
script name 232
Script properties area 232, 234
scripts 203
memory size 20
Search 58
command 81
Search Bwd message 103
search direction 60
Search Direction command 103
Search For menu 104
Search Fwd message 103
Teledyne LeCroy Corporation
PETracer ML User Manual
Search Menu 54
searching 81
Seconds radio button 82
segmenting 63
segments
viewing 122
segments.col file 64
Select command 30
self-diagnostic testing 27
Send command 70
Sequence Cell 130
Sequence State 128
servicemarks ii
Set Display Options command 110
Set Marker command 77, 166
Set Range Near Packet xxx 172
Set Range to Whole Trace 172
setting markers 77
Settings button 199
Settings window 199
Setup Menu 52
short format 71
shortcuts 57
Show Configuration Space for xxxx 180
Show Header Fields command 74
Show Header Fields dialog box 74
Show icon on the toolbar 234
Show Line Numbers 216
Show Number of Transitions checkbox 176
Show Raw 10b Codes command 73
Show Tooltips 216
signal descriptions 22
Signal Level switch 35
Size field 245
Slot Interposer probe 31
small triangle 71
Snapshot recording type 119
software 43
installation 25
update 247
specifications
ML 18
Specify Action command 131
Split level decode 79
Split Transaction
metrics 184
Split Transaction Level graphs 187
Split Transaction Performance 184, 197
StandardSettings.rec file 121
Start generation button 204
Start menu 25
Teledyne LeCroy
Index
Start Traffic Generation button 228
statistics 20
Statistics Accumulation area 193, 229
status
LEDs 19
Status Bar 58
macros 231
Status bar 44, 204
Status indicator LED 14, 15
Status LED 14
Status segment 58
Stop button 62
Stop Generation button 228
Stop option 62
stopping recording 62
storage temperature 18
support 253
Swap Recording Channels 125
switches 18
Synchronize Trace View 167
T
Target Analyzer 118, 120
Technical Support 253
telephone number 253
temperature range 18
Test Fixture 35
installing 36
test fixture 34
testing 61, 203
text files 68
theory 203
Throughput 197
Throughput at Link Transaction level 186
Throughput Per Transaction at Split Transaction
level 186
Tight Columns 157
time between DWORDs 166
Time Coverage 197
Time Stamp 108
time value 166
time-based averaging 187
Timestamp at the beginning 108
Timing and Bus Usage Calculator 196
Timing Calculations command 196
Timing Calculator dialog box 196
Title bar 44
TLP Header Properties dialog box 144
TLP Prefix Properties dialog box 144
TLP transactions 246
263
Index
TLP type 148
To 207
To Exerciser 35
to Generator File Format 207
To packet # field 69
To Packet field 67
Toggle Outlining 216
Tool tip Display 165
Toolbar 45, 127
44
Tools Menu 56
Tools menu 153
Tooltips 57
trace
cells 72
exporting 68
files 65
metrics 182
saving 67
Trace Filename & Path 118
Trace Filename and Path 120
Trace Viewer 26
Trace Viewing Level 108
traces
searching 81
trademarks ii
traffic 71
analyzing 153
generating 203, 228
traffic generation
macros 231
traffic generation files 207, 210
traffic generation prep 227
Traffic Generation Toolbar 48
Traffic Speed pane 173
Traffic Summary
buttons 157
metrics 184
Traffic Summary window 156
moving to packets 156
Traffic Type pane 173
Trainer links 59
TRG (triggered) LED 14
triangle 71
trigger
basic events 19
Trigger action 131
Trigger Position 118, 120
Trigger push-button 14, 15
Triggered LED 14
triggers
264
PETracer ML User Manual
count 146
TTL output and input signals 21
Tx Cable A 15, 38
U
Undo Zoom 159, 192
Union option 105
unit 181
unit-based averaging 187
Universal Protocol Analyzer System 12
UPAS 12, 14
UPAS 10K 12
Update Analyzer dialog 247
Update command 247
Update Device command 247, 248
Update License command 248
Update License dialog box 248
updates 247
UPLD (Upload) LED 14, 15
Upload LED 14, 15
Upload Size 118
Uploading 58
Uploading data message 60
Upstream direction 176
USB cable
connecting 33, 40
USB drivers 25
USB Type B Host Machine Connector 16
Use External Reference Clock 125
User input 204
V
Verification Script dialog box 198
View Data Block command 72, 73
View Menu 55
View Options 167, 211
View Options button 165, 216
View Settings 161
Viewer 26
Viewing Attachments of a Marker 89
W
Wait commands 204
wait conditions 20
Warnings 215
web site 253
Website, CATC 253
whether or not to show script icon 232
Window Menu 56
Teledyne LeCroy Corporation
PETracer ML User Manual
Index
Windows hardware wizard 27
Wrap 108
Write Address Space button 237
Write Address Space dialog box 238
Write Requests Performance 184
Writes Response Time 188
Writes Throughput 188
Y
Y Scale Type 159, 192
yellow range delimiters 174
Z
zoom 164
Zoom Level 108
Zoom to Trace View 159
Teledyne LeCroy
265
Index
PETracer ML User Manual
266
Teledyne LeCroy Corporation