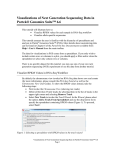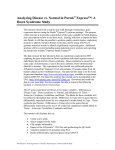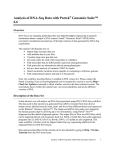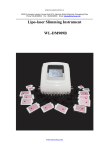
1
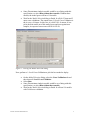
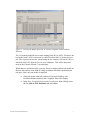
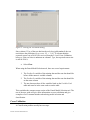
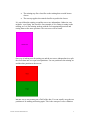
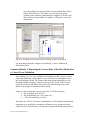
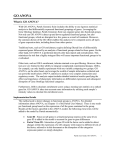
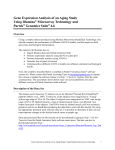
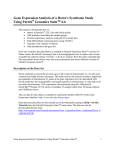
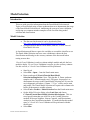
Model Selection Introduction This user guide provides information about the Partek Model Selection tool. Topics covered include using a Down syndrome data set to demonstrate the usage of the Partek Model Selection tool, introducing the concept of cross-validation, and giving two common mistake examples to look for when doing model selection and classification. Model Selection The data used in the tutorial can be downloaded from http://www.partek.com/~devel/modelSelectionTutorial.zip Unzip the tutorial data to a local folder, such as C:\Partek Tutorial Data\Model Selection A classification model has two parts: the variables to use and the classifier to use. The Partek Model Selection tool uses cross-validation to choose the best classification model and give the accuracy estimate of the best model when testing on new data. 1-Level Cross-Validation is used to evaluate multiple models and pick the best model to deploy. 2-Level Cross-Validation is used to give the accuracy estimate. For this exercise, a 2-Level Cross-Validation will be performed. Start Partek Select File > Open… from the Partek main menu Browse and open C:\Partek Tutorial Data\Model Selection\trainingSet.fmt. Note: This data has 11 Down syndrome samples and 11 Normal samples and ~22K genes. Its purpose is to demonstrate the usage on the Partek Model Selection tool. It is not for use in diagnostic procedures. Column “2. Type” will be used to train and predict. The Partek Model Selection tool requires this column to be before all the numeric variable columns. Select Tools > Predict > Model Selection from the Partek main menu On the Model Selection dialog, select Load Spec and choose C:\Partek Tutorial Data\Model Selection\tutorial.pcms. This is a saved specification that uses ANOVA as the Variable Selection method; K-Nearest Neighbor, Nearest Centroid, and Discriminant Analysis as the Classification methods. 152 models define this model space; a 2-Level 5x5 Cross-Validation will be performed with this model space Select Run Partek User Guide: Model Selection 1 Some Discriminant Analysis models would be over fitting with this specification, so select Run without those models. Without those models, the model space will have 116 models Wait for the Model Selection dialog to finish. It will do 25 inner and 5 outer cross-validations. The output from a 2-Level Cross-Validation is the Accuracy Estimate. In this case, it is 86.8314%. It means, if one picks the best model out of this model space and tests against new samples, its expected correct rate will be 86.8314%. Figure 1: Viewing the Model Selection dialog Next, perform a 1-Level Cross-Validation to pick the best model to deploy. On the Model Selection dialog, select the Cross-Validation tab and then choose 1-Level Cross-Validation Select Run Some Discriminant Analysis models would be over fitting with this specification, so select Run without those models Wait for the Model Selection dialog to finish. It will run 116 models with 5-fold cross-validation Partek User Guide: Model Selection 2 Figure 2: Viewing the Model Selection, K-Nearest Neighbor with Euclidean Distance The 116 models produced correct rates ranging from 40% to 100%. Of course, the best model with a 100% correct rate is wanted, but here 100% is a biased correct rate. The expected correct rate, when testing on new samples, will not be 100%, it should be 86.8314% from the 2-level cross-validation. This will be discussed more in the Common Mistake 2 section below. When there are tied best models, you may choose to deploy and test all models on the new data and use some kind of voting mechanism when their predictions do not agree. Here, only one model is deployed. Select the model with 100 variables, K-Nearest Neighbor with Euclidean distance measure and 1 neighbor, then select Deploy In the Save Variable Selection and Classification Model dialog, name the file 100var-1NN-Euclidean and select Save Partek User Guide: Model Selection 3 Figure 2: Saving the Variable Selection and Classification Model Next, this deployed model will be tested on an independent test set. Select File > Open… from the Partek main menu, browse and open C:\Partek Tutorial Data\Model Selection\testSet.fmt. This data has 3 samples, and will be used to demonstrate the usage of the Partek Model Selection tool; it is not for use in diagnostic procedures. Column “2. Type” will be used for the prediction. The Partek Model Selection tool requires this column to be the same as in the training data and to be placed before all the numeric variable columns, but it is not required that the test data have a real class. For example, the test data may have “unknown” on column 2 “Type” Select Tools > Predict > Run Deployed Model from the Partek main menu. On the Load Model File dialog, choose 100var-1NNEuclidean.pbb and select Open On the Test Model dialog, select Model Info, this will invoke an HTML page. Make sure the test data contains variables listed in the Variables Used table and are in the same order On the Test Model dialog, select Test Partek User Guide: Model Selection 4 Figure 3: Viewing the Test Model dialog Since column 2 Type of the test data has the real class (gold standard), the test result shows the prediction Correct rate: 3/3 = “1.00”. It is better than the expected correct rate of 86.8314% received from the 2-Level Cross-Validation; however, if the real class is unknown on column 2 Type, the expected correct rate is still 86.8314%. Select Close When using the Partek Model Selection tool, there are several requirements: 1. The Predict On variable of the training data and the test data should be before all the numeric variable columns 2. The Predict On variable of the training data and the test data should be on the same column 3. The test data must have all the variables listed on the Variable Used table and must be in the same order as on the table This concludes the common usage section of the Partek Model Selection tool. The rest of the user guide will give more information on cross-validation and give examples of two common mistakes when doing model selection and classification. Cross-Validation A Classification problem usually has two steps: Partek User Guide: Model Selection 5 The training step fits a classifier on the training data set with known classes The test step applies the trained classifier to predict the classes It is crucial that the training set and the test set are independent. Otherwise, one might be ‘over fitting’ the classifier. One example of over fitting is testing on the training set. It is like training students with the real examination questions and testing them on the same questions. The test scores will be biased. One way of making sure the training set and the test set are independent is to split the whole data into two equal sized partitions. Use one partition as the training set and the other partition as the test set. But this way is only making use of half of the data. You can actually swap the two partitions to do training and testing again. This is the concept of cross-validation: Partek User Guide: Model Selection 6 You can actually split the data into more partitions. Here’s an example of 5-fold cross-validation: Common Mistake 1: Variable Pre-filtering The Partek Model Selection tool does the cross-validation data partition first. Variable selection and classification happen inside of cross-validation. One common mistake of doing classification is to do variable selection with all the data, filter the data with selected variables, then split the data into training and test set. This approach is called variable pre-filtering. The test set is being used together with the training set to choose ‘good’ variables. Those two data sets are no longer independent. Here, a data set with random numbers will be used to demonstrate the “danger of pre-filtering”. Start Partek Select File > Open… from the Partek main menu Browse and open C:\Partek Tutorial Data\Model Selection\random.txt The data has 11 Down syndrome samples and 11 Normal samples. There are ~22K genes, but the numbers have been randomized. Partek User Guide: Model Selection 7 Select View > Scatter Plot from the Partek main menu. There is no clear separation between Down Syndrome and Normal samples (Figure Figure 4: Viewing the Scatter Plot of Down syndrome vs. Normal. Notice there is no clear separation between Type Select Stat > ANOVA from the Partek main menu. On the ANOVA of Spreadsheet 1 dialog, select 2. Type Select Add Factor >, and then OK (Figure 5) Figure 5: Configuring the Experimental Factors within the ANOVA dialog On the resulting spreadsheet, <right-click> on the header of row 1, and select Dot Plot (Orig. Data). The dot plot shows a good separation between the 2 groups. So if the data is filtered to only use this gene, Partek User Guide: Model Selection 8 you will probably get a good classifier even on random data. This is called “false discovery”. By chance, you will get some “good” variables with a relatively small number of samples (22 in this case) and a relatively large number of variables (~22K genes), even with random data Figure 6: Invoking the Dot Plot from the resulting ANOVA spreadsheet For more details about the “danger of pre-filtering”, refer to Ambroise & McLachlan (2002). Common Mistake 2: Reporting the Correct Rate of the Best Model after a 1-Level Cross-Validation After running 1-Level Cross-Validation with multiple models, you may want to deploy the model that got the highest correct rate; however, the highest correct rate itself might be biased. The reason is that with multiple (hundreds or even thousands) models running, by chance you may pick a “good” model. Do not expect this model to still achieve that correct rate when testing on new data. Below is an example to demonstrate this concept. Suppose a class of students is given a quiz with 10 Yes/No questions. The 1st student gives 10 Yes’s The 2nd student gives 9 Yes’s and 1 No… …The last student gives 10 No’s Since there are 1024 (2^10) answer combinations, if 1024 students systematically enumerate every possibility, one student will answer every question correctly, which will give a biased result, or if instead of systemically enumerating answers, Partek User Guide: Model Selection 9 the students randomly pick answers, some students will answer more questions correctly, but the scores will still be biased. With 1-level cross-validation (10fold, 10 questions), the highest score, 100%, is biased. In the same way, with the 116 models mentioned above, you will get some “good” models by chance. But if you do a 10x9 2-Level Cross-Validation on all of the students, each pass of the inner Cross-Validation will pick the 2 best students that got 9 questions correct, and test them on the validation question, the 10th question. Of the two best students, one would pick yes, the other would pick no. After averaging them, you would get a 50% accuracy estimate. So no matter how the students learn/cheat/randomly pick/systemically pick the answers, 2-level Cross-Validation will give you unbiased accuracy estimate. End of User Guide This concludes the User Guide. For more information on how to use the Partek Model Selection tool, select Help > User’s Manual > Chapter 12 Diagnostic & Predictive Modeling from the Partek main menu. References Ambroise, C., and McLachlan, G. “Selection bias in gene extraction on the basis of microarray gene-expression data." PNAS, 2002; 99(10): 6562-6566. Copyright 2010 by Partek Incorporated. All Rights Reserved. Reproduction of this material without express written consent from Partek Incorporated is strictly prohibited. Partek User Guide: Model Selection 10