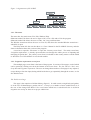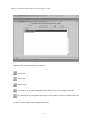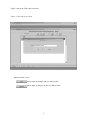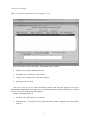
1
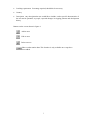
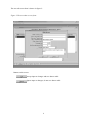
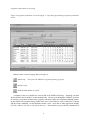
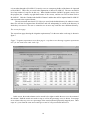
WORKING PAPER 82
Estimating Water
Requirements and Water
Storage Requirements for
Farms, Community and
Backyard Gardens, and for
Large Irrigation Systems
A User Manual for
PLANWAT Version 1.2.3b
and a CD-ROM to install
this program
Pieter van Heerden
International
Water Management
I n s t i t u t e
Working Paper 82
Estimating Water Requirements and Water Storage
Requirements for Farms, Community and Backyard
Gardens, and for Large Irrigation Systems
A User Manual for PLANWAT Version 1.2.3b and a CD-Rom to
install the program
Pieter van Heerden
International Water Management Institute
IWMI receives its principal funding from 58 governments, private foundations, and international
and regional organizations known as the Consultative Group on International Agricultural Research
(CGIAR). Support is also given by the Governments of Ghana, Pakistan, South Africa, Sri Lanka
and Thailand.
The author: Pieter van Heerden is an independent consultant from Bloemfontein, South Africa. He has
extensive experience in extension and water management in various eco-regions of the country.
Acknowledgements: To Charles Crosby, that Wise Old Man of Irrigation, for ideas, encouragement,
criticism (always positive!) and for acting as program tester.
Willie Bruwer of Orange-Vaal Water Users’ Association, and indirectly his predecessor, Louis Wilken,
whose approaches to irrigation water management influenced the development of this program.
Marna de Lange and MmaTshepo’s garden (shown in the cover picture) that influenced the approach
to the water-harvesting module of this program.
van Heerden, P. 2004. Estimating water requirements and water storage requirements for farms,
community and backyard gardens, and for large irrigation systems: A user manual for PLANWAT
version 1.2.3b and a CD-Rom to install the program. Working Paper 82. Colombo, Sri Lanka:
International Water Management Institute.
computer model / water requirement / irrigation system / water user association / cropping system /
water harvesting / irrigation requirement / water storage / water management / backyard gardens /
smallholder irrigation / PLANWAT / SAPWAT /
ISBN: 92 9090 574 3
Copyright © 2004, by IWMI. All rights reserved.
Please send inquiries and comments to: iwmi @cgiar.org
Contents
Foreword .............................................................................................................................
v
Installation ...........................................................................................................................
vii
1. Introduction .....................................................................................................................
1
2. Estimating Irrigation Requirements ...................................................................................
1
3. Running PLANWAT ........................................................................................................
2
3.1. PLANWAT—overview ..............................................................................................
2
3.2. PLANWAT —how to use it .......................................................................................
2
3.2.1. The menu ...........................................................................................................
3
3.2.2. Irrigation requirement screen form ......................................................................
3
3.2.3. The water harvest module ...................................................................................
12
3.2.4. Country screen form...........................................................................................
15
References ...........................................................................................................................
17
Appendix A: Specifications ...................................................................................................
19
iii
Foreword
IWMI requested Pieter van Heerden (the author) to develop PLANWAT for use in its research projects
and in collaborative action research projects with other organizations. In particular, the ‘Intensification
of Rain-fed Agriculture’ and ‘Smallholder Modeling Toolbox’ projects require this modern tool. It is
expected that this computer program will be useful for those who manage irrigation water on farms
and in irrigation systems, and for those who design water storage facilities for farms. We thank Pieter
very much for his efforts to produce and document PLANWAT.
PLANWAT is a computer model that uses the single crop outputs of SAPWAT, combines them
into a cropping system and calculates irrigation requirements for that system. It is suitable for use on
a range of systems, from 10 m2 to several million hectares. For small areas, it links to a water-harvesting
module that estimates required runoff areas and minimum storage volumes.
There are already several computer programs that help irrigators determine how much water a
particular crop type needs at a particular location and time of the year. In many small- and large-scale
irrigation systems, however, a number of different crop types are grown and planted at different times.
Water requirements are, therefore, more cumbersome to predict. In addition, the water needed is often
not available from a running source, like a river, but needs to be ‘harvested’ in the rainy season and
stored for later use. In such cases, the calculation of the requirement for storage capacity for a particular
cropping system, land use pattern and weather becomes rather complex. PLANWAT was developed to
assist those who are managing water in cropping systems to quantify explicitly their water needs and
to compute the corresponding capacity for water storage.
The standard data present in the program make it suitable for use across South Africa. Principles
of the program, however, are valid in many more countries and environments. We intend to develop
versions of PLANWAT that are even more universal in their application.
D. Merrey
Regional Director, IWMI-SA
July 2004
v
Installation
PLANWAT is supplied on a CD from which installation takes place.
The install program runs three install modules consecutively and automatically. That is: PLANWAT,
the Borland Database Engine (BDE) and then SAPWAT. *
The user is advised to accept default installation settings for all the programs, otherwise errors
might occur during running of the programs.
If the BDE is already loaded onto the user’s computer, a choice is given on whether the BDE must
be installed or not. Unless the user’s BDE is a very old version, selecting skip or re-install will make
no difference to the running of PLANWAT or other database programs.
If the user has an older version of SAPWAT installed (this version: 2.6, dated April 2003), please
erase the old version completely, otherwise the data files will not be overwritten with the newer data
files; SAPWAT and PLANWAT might not be able to communicate. Incorrect program references have
been experienced in the past where older versions of SAPWAT were loaded under different directories.
Installation of the BDE might take some time, depending on the characteristics of the computer,
during which time no apparent action is seen on screen. Please wait for the process to run its full
course.
The data files of SAPWAT are transferred to the program directory as a zip file, which needs to be
unpacked before SAPWAT can be run. This is done automatically the first time that SAPWAT is run.
A DOS window opens and files that are unzipped are shown on screen. When completed, the user has
to close the DOS window and SAPWAT closes down. When restarted, the program will run normally.
These programs will run on Windows 95 or Windows NT or any later versions of these operating
systems. Problems might be experienced when running under older operating systems (such as Windows
3.1).
Technical support for PLANWAT and SAPWAT is available from: Pieter van Heerden at
[email protected]. For further developments of PLANWAT through IWMI, contact Frits Penning de
Vries at [email protected].
*
Copyright: Water Research Commission, Pretoria, South Africa
vii
1 Introduction
PLANWAT is a user-friendly computer model that uses the single crop outputs of SAPWAT, combines
them into a cropping system and calculates irrigation requirements for the system. It is suitable for
use on a range of irrigation systems, from 10 m2 to more than a million hectares. For small areas, it
has a water-harvesting module that estimates required runoff areas and minimum storage volumes.
SAPWAT is started from PLANWAT and its output is used as input for PLANWAT. PLANWAT
can handle any number of crops, in any combination required, and for areas that can vary from 10 m2
to many thousands of hectares per crop. SAPWAT crop data is stored in data tables of water
requirements which enables the user to estimate water requirements of a river system, a water user
association, a farm, a community garden or a small home garden. The user can alter crop combinations
to simulate different crop growing patterns in an area or to see what the effect of a change in cropping
pattern could have on irrigation water requirement.
A water harvest module is included, specifically for the small farmer context where the harvesting
of some water to sustain the small farmer through a dry season is required. This module calculates the
area required to harvest sufficient water for storage, as well as the minimum storage volume required.
Default runoff percentage is taken as the runoff percentage from a roof or paved area, but the user can
change this to reflect local conditions. Similarly, storage efficiency is taken as that of an impervious,
fully enclosed container. The user can also alter this efficiency to reflect the local situation.
There are two main reasons for the development of PLANWAT. First, SAPWAT does not store its
information and every time a user of SAPWAT wants to compare irrigation strategy scenarios, the user
has to build his scenarios from scratch. Also, any output required for use in other computer programs
had to be transferred manually. Second, a real need exists to estimate water requirements and develop
water storage scenarios for the rural poor, including pumping times required to get water from storage
to fields by making use of low-level technology, such as treadle pumps.
Users can refer the following Water Research Commission Reports for more information on the
application of SAPWAT as a planning tool for the estimation of irrigation requirements for WUA areas:
WRC Report TT163/01: “Using SAPWAT to estimate water requirements of crops in selected areas
managed by the Orange-Vaal and Orange-Riet Water Users Associations.”
WRC Report 624/1/99: “A computer program for establishing irrigation requirements and scheduling
strategies in South Africa.”
The author hopes that PLANWAT, as a modeling tool, will create a better understanding of area/
system irrigation water planning and management and of the concept of water harvesting and its
management.
2. Estimating Irrigation Requirements
It is necessary that reliable and accurate estimates of irrigation requirements be made for the planning
of irrigation water use. SAPWAT was developed to address this need, based on the FAO CROPWAT
model, and can be considered an improvement of CROPWAT, as many of FAO 56 approaches have
also been incorporated in SAPWAT. SAPWAT has already proved itself as being an accurate predictor
of irrigation water requirements, but with one serious shortcoming—irrigation scenarios cannot be saved
for future reference and, linked to this, if the user wanted to use this generated data, he/she had to
transfer that data to a spreadsheet program manually. This manual transfer also leaves room for mistakes.
One objective of developing PLANWAT was the collection and storage of SAPWAT-generated data for
future use.
1
A need that developed out of SAPWAT was to calculate—especially for small scale farmers—the
quantity of water needed for irrigation against the background of cheap technology pumps, such as the
treadle pump, and the harvesting and storage of water, or a source of water, close to a small-scale
garden. This was a major consideration in the development of PLANWAT.
PLANWAT can also handle river systems that run through a variety of climatic zones as a single
unit. The need to do similar planning for large areas also exists. For instance,. the Lower Orange
River Management Study (LORMS), where water requirement for the whole of the Orange River had
to be estimated, so that some agreement with Namibia could be reached for the subdivision of Orange
River water between Namibia and South Africa.
Calculated irrigation requirements are given as total cubic metres for the area for which the
calculations are done. All data are stored for later use and hard copies can be printed.
3. Running PLANWAT
3.1. PLANWAT—overview
PLANWAT takes the output of SAPWAT and stores it in a data file. It then uses that data to calculate:
•
Crop water requirement in mm per month and total (that which we are used to)
•
Crop water requirement in m3 per month and total for the area planted with the crop
•
Total water requirement for the area being studied (garden or farm or WUA or river system)
•
The area to be water-harvested to supply enough water for the needs of a home or small community
garden
•
The size of storage required for storing harvested water, once again for a home garden or for a
small community garden
Because the data is stored the user can recall a previous dataset and recalculate, e.g., what would
the effect on total water requirement for an area be, if the total area cultivated changes, or if the crop
composition changes. For more major comparisons, such as different irrigation strategies, the user
will have to revert back to SAPWAT and import new data based on different irrigation strategies—this
is now easy because of PLANWAT.
3.2. PLANWAT—how to use it
The program is menu-driven. It has a hierarchical structure, shown in figure 1. Each level can
contain as many records as the computer hardware can handle.
To prevent inadvertent changes in data, (which changes might be impossible to identify and correct
later) all data screens are read-only and can only be edited through an editing screen, which is called
up when required.
The opening screen shows the main form of the program.
2
Figure 1. Organisation of PLANWAT.
3.2.1. The menu
The menu has four main items: File, Edit, Window, Help.
Submenus under File allows the user to Open a file, Close a file and to Exit the program.
Submenus under Edit allows the user to Undo, Cut, Copy and Paste data.
The Window menu-item allows the user to Close all, and shows the standard Window menu-item—
which file is open.
The Help menu tells the user that there is a Users’ Manual in the PLANWAT directory and also
shows information about this version of the program.
A user has to open the “File menu” to open the “Country screen form”. The main screen form,
“Irrigation requirement”, is already open and takes one through the whole process of inputting and
managing irrigation data. The country screen form is included so that country names could be added
or edited for use of PLANWAT in cross-border studies.
3.2.2. Irrigation requirement screen form
This multiple page screen form is the heart of the program. It consists of four pages, each of which
can be opened by clicking on a tab at the bottom of the screen form. The four tabs are: Task, Area,
Crop data and Irrigation requirement. The user can change between these screen pages in any sequence,
except during a first-time input, during which he/she has to go sequentially through the screens, or else
face blank screens.
The Task Screen Page
This page is the container of all that follows (figure 2). It could contain a single backyard garden,
as in the case of MmaTshepo’s garden (220 m2, 11 crops), or a number of areas (subdivisions) as is
the case of the Orange-Vaal Water Users’ Association which has six subdivisions for its 8,100 ha
irrigation area and up to about 30 crops per subdivision.
3
Figure 2. Irrigation requirement screen form page 1, Task.
Buttons on the screen form page are as follows:
Add a task
Edit a task
Delete a task
mm Print crop irrigation requirement (mm) tables for all areas included in the task
m3 Print actual crop irrigation requirement (m3 total) tables for all areas included in the task
And the × (close) button at the top right hand corner
4
Figure 3 shows the Task edit screen form.
Figure 3. Task edit screen form.
Buttons on this screen:
Accept input or changes and save data to table
Ignore input or changes; do not save data to table
5
The area screen page
Figure 4. Irrigation requirement screen form page 2, Area.
This screen shows an area description. Information shown includes:
•
Primary river or Water Management Area
•
Secondary river or Water User Association
•
Tertiary river or Water User Association subarea
•
Quaternary river or farm
The user is free to use any other hierarchical structure that suits his purposes and can be
accommodated within this four-level hierarchy. Not all fields need to be filled in, but the user is advised
to fill in at least one field for indexing purposes.
Further information shown is:
•
Licensed water allocation (m3 ) for the area
•
Cultivated area. The physical area irrigated (ha) that could be mapped on an aerial photo,
map, etc.
6
•
Leaching requirement. Percentage required, should this be necessary
•
Country
•
Description. Any description the user would like to include, such as specific characteristics of
the area and its potential, its people, expected changes in cropping patterns and development
history
Buttons on the screen shown in figure 4:
Add an area
Edit an area
Delete an area
Show weather station data. This function is only available once crops have
been added.
7
The area edit screen form is shown in figure 5:
Figure 5. The area editor screen form.
Buttons on this screen:
Accept input or changes and save data to table
Ignore input or changes; do not save data to table
8
Irrigation requirements screen page
Figure 6. Irrigation requirement screen form page 3—crop data page showing irrigation requirements
in mm.
Buttons on the screen form page shown in figure 6:
Add a crop.
This opens the SAPWAT irrigation-planning program.
Delete a crop
Print the table shown on screen
A manual for the use of SAPWAT can be found in the SAPWAT directory. Importing crop data
from SAPWAT into PLANWAT is done automatically. The user goes through the SAPWAT processes
of selecting a crop and its characteristics, irrigation efficiencies and to the irrigation-scheduling module.
In this module, the irrigation strategy found in the area, or most likely to occur in that area, is entered
and the result is tabulated. On the tabulated window, select “Save data to other application-friendly
CSV file” and save the data in the default directory. The name the user gives the file is immaterial as
9
it is not taken through to PLANWAT, it merely serves as a temporary holder of the data to be imported
to PLANWAT. These files are erased after importation of data to PLANWAT. The user can build a
list of any number of crop files in this way. When finished with the SAPWAT program, merely close
the program (the × button, top right hand corner of the screen), and the user will be taken back to
PLANWAT. Click the “Finished with SAPWAT button” and the data will be imported into PLANWAT
and converted to the required format.
The user must take note that if CSV files were saved in the default directory for whatever reason,
these files will also be imported into PLANWAT and will subsequently be erased in the directory in
which they were stored. The user is warned to save or move any such files into a different directory.
The screen form page
The screen form page showing the irrigation requirement (m3 for the area under each crop) is shown in
figure 7.
Figure 7. Irrigation requirement screen form page 4—crop data screen showing irrigation requirements
in m3 for the actual area under each crop.
In this screen, the month columns can be moved left or right to enable the user to see the content of
all columns. Both the actual area under a crop as well as the percentage cover is shown. Percentage
cover relates to the crop cover as a percentage of the actual cultivated (physically mapped) area. Three
crops in 2 years from the same area would give a total of 150 percent total land cover.
10
The user should also note the use of a “multiplier” field on this screen. In order to keep the figures
in the irrigation requirement columns to manageable (and more easily readable) strings, large irrigation
water quantities are expressed as multiples of 103 .
Buttons on the screen shown in figure 7:
Edit a crop. The only column that can be edited is the actual area covered by the crop
Opens a screen in which monthly total irrigation water requirements are shown (seen
in figure 8)
Opens the water harvest screen form (figure 9)
Figure 8 shows the monthly total irrigation requirement (m3 ) screen form.
Figure 8. Sum of monthly irrigation requirement screen form.
11
3.2.3. The water harvest module
The water harvest module is designed for application in small irrigation areas only, it is doubtful whether
meaningful answers will be generated for areas bigger than about 3 hectares.
Theory
It is hypothesized that the approach followed in this module is practically applicable in marginal areas
with an annual rainfall of around 400 to 600 mm. Therefore, it is applicable in areas where
supplementary irrigation would normally be required for successful continuous crop production. It is
theorized that the application of this approach to areas of lower rainfall might indicate that the size of
the water-harvest area and/or the water storage capacity could be so large that application might not
be feasible.
The approach in the design of this module is that a shortage of water due to a shortage of rain
could be made up for by harvesting water through run-on from a roof, a paved or hard-packed area, or
from an adjoining natural veldt area, and then storing some of that water for times of water shortage.
A further hypothesis is that one should plan the planting of crops so that the time of maximum
water use should take place during the rainy season, or overlap towards the end of the season. Planting
could also be planned for winter in summer rainfall areas, as this would reduce maximum water demand.
These practices should reduce the size of the storage and in that way save on cost, as storage is perhaps
the most expensive construction necessary for water harvesting.
It is also possible to apply this module for situations where water is added by run-on only and
where no storage is available. By limiting the storage capacity to zero on the screen form and by testing
different runoff scenarios, one can emulate a situation where enough water for run-on only could be
harvested. This might then be expressed as a ratio of planted area to harvest area, which could also
lead to another scenario where planting density or spacing between rows could be estimated on the
basis of the calculated ratio.
12
The water harvest screen
Figure 9. The water harvest screen form.
Fields on the screen form are: task name, rainfall season, rainfall harvest area, storage requirement
and pumping times required. Each harvest area needed and the storage capacity required could be
made up of any combination of three different areas or types of storage.
The user is advised to only select the rainy season applicable for his/her area and then press the
calculation button so that a first round calculations could be done on program default values so that
he/she could form and idea of the size of the runoff area and capacity of storage required. If storage
is required, pumping times based on default pump delivery rate are also calculated. The user can then
change default values to suit the local situation and do a recalculation.
If the water harvest area or storage capacity is restricted, the user must indicate this by changing
the content of the relevant combo-boxes on the screen form to “Yes” and then input the restricted area
or capacity. If the combo-box values are “No”, any number the user might input in the size or capacity
entry-fields will be ignored and calculations will be done as if no restrictions exist. Changes made to
the efficiency entry-fields will be adopted.
Please keep in mind that the calculations of these harvest areas and storage capacities always work
from left to right! Data input to the right of an unchanged box, especially if the combo-box value is
“No” will be ignored and will be erased.
If the area of water harvesting or the capacity of the storage is restricted, an overflow to the next
set of fields on the screen form takes place. In this case the efficiency levels indicated in the previous
set of fields are carried over to the next one. The user could alter these, if required, and then repeat the
calculation.
13
If restrictions are set in all three sets of entry fields for each harvest area and the storage capacity,
a message will be shown on screen, informing the user whether the harvest area and/or storage capacity
is sufficient or not.
The author suggests the following efficiencies, at the same time warning that there is a lot of guessing
involved, because very little information can be found for water harvesting efficiencies and storage
efficiencies at this level. It must also be kept in mind that water harvesting from an area is influenced
by:
•
Moisture content of soil: the wetter the soil, the higher the runoff
•
Gradient: steeper slopes have a higher runoff
•
Surface characteristics: the smoother the surface, the higher the runoff
•
Vegetation: denser vegetation leads to less runoff
•
Nature of rainfall: high intensity thunder showers result in increased runoff
•
Mean annual precipitation: the higher the MAP, the higher the total runoff
The user is advised to adapt the recommended values to values that would closer reflect the situation
in his or her area.
Water harvest:
•
Roofs and paved areas 85%
•
Hard packed earth
50%
•
Natural veldt
8%
Storage:
•
Impervious, totally enclosed
90%
•
Impervious, open
75%
•
Pond
60%
Buttons on the screen shown in figure 9:
Rainfall map of South Africa showing mean annual rain
Runoff map showing mean annual runoff as a percentage of MAP
Runoff table showing expected runoff per quaternary in which a weather station is
located
Shows a graph of monthly water balances and the water balance table
14
Shows a graph of cumulative water balances and the water balance table
Calculate button. The rain harvest module allows the user to set up a scene and
then to allow calculation by pressing this button
3.2.4. Country screen form
This screen form allows the user to add countries to the data table. On the area page of the irrigation
requirement screen form, the user can select a country from a drop-down list which is taken from the
countries data table. Figures 10 and 11 show the country screen from and the country editor screen
form.
Figure 10. Country screen form.
Buttons on this screen:
Add a country
Edit a country name
Delete a country
The × (close) button at the top right hand corner closes this screen form.
15
Figure 11. Country edit screen form.
Buttons on this screen:
Accept input or changes and save to data table
Ignore input or changes; do not save to data table
16
References
Allen, R.G.; Pereira, L.S., Raes, D; Smith, M. 1998. Crop Evapotranspiration. Guidelines for Computing Crop Water
Requirements. FAO Irrigation and Drainage Paper 56. Rome: Food and Agriculture Organization of the United Nations
(FAO).
Crosby, C.T.; Crosby, C.P. 1999. SAPWAT: A Computer Program for Establishing Irrigation Requirements and Scheduling
Strategies in South Africa. Water Research Commission Report No 624/1/99. Pretoria, South Africa: Water Research
Commission.
Smith, M. 1992. CROPWAT: A Computer Program for Irrigation Planning and Management. FAO Irrigation and Drainage
Paper 46. Rome: FAO.
van Heerden, P.S.; Crosby, C.T.; Crosby, C.P. 2001. Using SAPWAT to Estimate Water Requirements of Crops in Selected
Irrigation Areas Managed by the Orange-Vaal and Orange-Riet Water Users’ Associations. Water Research Commission
Report No TT163/01. Pretoria, South Africa: Water Research Commission.
17
Appendix A: Specifications
19
Postal Address
P O Box 2075
Colombo
Sri Lanka
Location
127, Sunil Mawatha
Pelawatta
Battaramulla
Sri Lanka
Tel.
+94-11 2787404
Fax.
+94-11 2786854
E-mail
[email protected]
Website
http://www.iwmi.org
SM
International
Water Management
I n s t i t u t e
IWMI is a Future Harvest Center
supported by the CGIAR
ISBN: 92-9090-574-3