1
SWAN: A Student-Controllable
Data Structure Visualization System
Clifford A. Shaffer, Lenwood S. Heath
and Jeffrey M. Nielsen
Department of Computer Science
Virginia Tech
Blacksburg, VA 24061
{shaffer,heath,jnielsen}@cs.vt.edu
Jun Yang
Hughes Network Systems
11717 Exploration Lane
Germantown, MD 20876
[email protected]
Abstract: Swan is a data structure visualization system. Its main purpose is to allow the user to
visualize the data structures and the basic execution process of a C/C++ program. Swan views a
data structure as a graph or a collection of graphs. By “graph,” we include both general directed
and undirected graphs and special cases such as trees, lists and arrays. As a part of Virginia
Tech’s NSF Educational Infrastructure Grant, Swan will be used in two ways: by instructors as
a teaching tool for data structures and algorithms, and by students to animate their own programs
and to understand how and why their programs do or do not work.
1 Introduction
Students in Computer Science are constantly asked to understand dynamic processes in the form of computer
algorithms. Aside from a pseudocode or computer program implementation, a higher order description for the
algorithm is usually conveyed in words, perhaps with a well-chosen picture or two. Unfortunately, computer code,
words and individual pictures present only static descriptions, specific views or instances of a dynamic process.
Perhaps the reason why some otherwise good students have trouble understanding code examples is that they are
unable to translate such static descriptions to a dynamic process in their imagination.
Many of the algorithms studied in undergraduate computer science courses operate on fundamental data structures such as lists, trees and graphs. Thus, a natural visual component to the workings of many algorithms is the
series of changes that take place to the corresponding data structure. A well organized presentation of these
changes in the form of a graphical visualization can help to bridge the “concept gap” encountered by many students when studying algorithms.
In recent years there has been much interest in algorithm animation and data structure visualization systems
(generically referred to below as program visualization systems). In general, the goal of such systems is to provide
visualizations of the dynamic processes embodied in computer algorithms. Several successful program visualization systems exist, see [Roman & Cox 1993, Tamassia & Tollis 1994] for examples. Program visualization
systems have been used for teaching, presentation, and debugging purposes.
This paper describes the use of Swan, a data structure visualization system, as an aid to computer science
education. Swan allows users to visualize data structures and the basic execution process of a C or C ++ program.
Swan views a data structure as a graph or a collection of graphs. In Swan, a graph may be either a general directed
or undirected graph, and may be restricted to special cases such as trees, lists and arrays.
As a part of Virginia Tech’s NSF Educational Infrastructure Grant, Swan will be used in two ways: by
instructors as a teaching tool for data structures and algorithms, and by students to animate their own programs
and to understand how and why their programs do or do not work. This paper describes the design features of
Swan that make it particularly useful as an instructional aid.
A program visualization is the result of interactions among three participants: the programmer who develops
the original program, the animator who defines and constructs the mapping, and the viewer who observes the
graphical representation. Swan visualizations start with a program that implements some data structure to be
visualized. The annotator (who may be, but need not be, the original programmer) adds calls to the Swan Annotation Interface Library (SAIL), resulting in an annotated program. This program is compiled, and the viewer
runs the resulting executable, which provides the functions of the original program plus a Swan visualization of
the selected data structures.
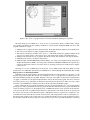
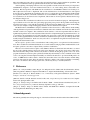
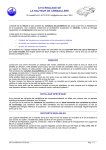
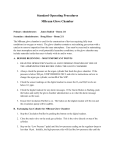
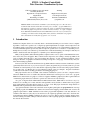
Figure 1: Two views of a graph created in an annotated minimum spanning tree algorithm
The main design goal for Swan was to create an easy-to-use annotation library combined with a simple,
yet powerful, user interface for the resulting visualization. Several features distinguish Swan from most other
program visualization systems:
1. Swan provides a compact annotation interface library. Fewer than 20 library functions are frequently used.
2. The viewer’s user interface is simple, straightforward and uniform.
3. The annotator decides the semantics of the views, i.e., with which variables the graphical elements in the
views are associated, and also controls the progress of the annotated program in a straightforward way.
4. Swan provides automatic layout of a graph so the annotator need only concentrate on its logical structure.
5. Swan allows the viewer to modify the data structure.
6. Swan was built on the GeoSim Interface Library [Hines, et al. 1994], a user interface library developed at
Virginia Tech that allows Swan to be easily ported to X Windows, MS-DOS and Macintosh computers. It is
crucial for educational software to run on the variety of operating systems that are widely used in computer
science classes.
Currently, two versions of Swan have been developed: one for UNIX systems with the X Window system
installed and one for MS-DOS. Information about Swan can be obtained through the World Wide Web at URL
http://geosim.cs.vt.edu/Swan/Swan.html.
Visualization can be applied either to the physical implementation for data structures in a program or to the
abstraction represented by the data structure. For example, two views of a graph can be provided as part of an
annotated minimum spanning tree algorithm. In Figure 1, the view on the right is an adjacency list representation
of a graph, a visualization of the physical implementation used by the annotated program. The view on the left
shows the logical topology of the graph, an abstraction represented by the adjacency list. These two views of data
structures coexist in Swan in a consistent form, since both are represented by Swan as graphs.
In the standard model for program visualization systems, program visualization is a one-way information
passing process: The programmer first writes a program, the annotator then annotates the program, and finally the
viewer can run the program to see the graphical views. In Swan, information can be passed from the annotator
to the viewer in the form of a graphical representation for data structures. Information can also be passed from
the viewer to the annotator via modification requests. Although this cannot be regarded as a complete two-way
communication between the annotator and the viewer because of the unequal status of the two participants (i.e.,
the annotator has complete control of the views to be constructed while the viewer can only modify the program’s
data structures under the restrictions imposed by the annotator), it provides a powerful mechanism to encourage
the viewer to be more active in exploring the program and gaining new insights. This capability makes Swan
different from most program visualization systems in which the viewer can only watch the animation passively.
We believe it not only makes Swan more suitable as an instructional tool, but also shows the potential for Swan
to be used as a graphical debugging tool at the abstract level.
2 The Swan System
Swan has three main components: the Swan Annotation Interface Library (SAIL), the Swan Kernel, and the
Swan Viewer Interface (SVI). SAIL is the library used by the annotator to create visualizations. SVI allows a
viewer to explore a Swan annotated program. The Swan Kernel is responsible for constructing, maintaining, and
rendering all the views generated through SAIL library functions. It accepts viewer’s requests through SVI and
takes appropriate actions, and is the intermediary through which an annotator communicates with a viewer.
Because Swan is a data structure visualization system designed to support algorithms in which graph-like
objects are frequently referenced, it is natural that graphs are chosen as the basic elements in Swan. All views
in Swan are composed of Swan graphs. A Swan graph has a set of nodes and edges. A graph is defined by the
annotator via its nodes and edges. Graphs have default display attributes for their nodes and edges, which are used
by Swan to render the corresponding graphical objects. Nodes and edges can have their own individual display
attributes that override the graph’s default values.
The logical structure for a graph built by the annotated program is stored in the Swan Logical Layer. A
standard adjacency list representation is used to store the graph’s nodes and edges. After appropriate layout
algorithms are applied, a physical representation of the layout is kept in the Swan Physical Layer. Every Swan
graph has physical attributes that affect its graphical display. The most important attribute is the position of the
graph and the positions of all of the nodes and edges in this graph, that is, the layout of the graph. To decide these
positions is to layout the graph. Several graph layout algorithms have been implemented in Swan to deal with
different graphs types so that the annotator does not need to spend much time on layout himself.
The separation of a graph’s representation into logical and physical layers makes Swan adaptable to changes
in its graphics display toolkit and also portable to other graphics platforms. Graph layout algorithms used in Swan
only specify topology without concern for the many details of visual attributes of the graphs.
Events generated by SVI due to the interactions between the viewer and Swan are sent to the Swan Event
Handler. A Swan annotated program runs as a single thread process. The events generated from SVI are stored in
an event queue. Initially the annotated program has control of the process. Whenever a SAIL function is invoked,
Swan will process all events in the event queue (e.g., button presses). At this point, the Swan Event Handler takes
control. After the SAIL function completes, control is returned to the annotated program.
There are three basic states in Swan when it is active: Run, Step and Pause. The process may run continuously (i.e., in Run state) or step by step (i.e., in Step state). “Step” here refers to the execution of a code segment
ending at the next breakpoint set by the annotator. Swan lets the annotator decide the size of the step because it is
impossible for Swan to identify the interesting events in the annotated program.
The viewer interacts with an annotated program through the Swan Viewer Interface (SVI) as shown in Figure 1. The SVI main window contains a control panel and three child windows: the display window, the I/O
window and the location window. The display window contains the graphs output by Swan. The I/O window
is used by the annotator and the Swan system to display one-line messages and get input from the viewer. The
coordinates of the current position of the cursor in the display window are shown in the location window.
The viewer can pick a node or an edge in the Swan display window to get more information about it. The
viewer can pan and zoom over the graph view; can switch between Run and Step states; and can modify graphical
attributes of a graph, such as default graphical attributes for its nodes and edges and its layout method. For a node,
attributes include type, color, size and line thickness. For an edge, attributes include color and line thickness.
The viewer can interactively modify the logical structure of a Swan graph, specifically by inserting or deleting
nodes or edges. The annotator can enable or disable any of these editing functions. If the annotator enables an
editing function, he must provide the action that occurs in response to the selected function (i.e., the annotator
must define what it means to insert a new node).
There are several algorithms implemented in Swan to lay out different kinds of graphs automatically. Linked
lists and arrays (in both horizontal and vertical forms) are examples of Swan layout components. Layout com-
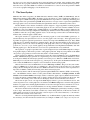
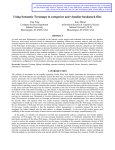
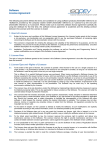
Figure 2: Visualization of a Huffman coding tree tree.
ponents allow an annotator to build a more complicated structure than the simple linked list or array. In Swan,
a node in a layout component may be a parent node of another layout component. Therefore, a simple linked
list can be recursively expanded to represent relatively complex structures. Swan also supports trees and general
graphs as layout components.
3 Swan in the Classrooom
A number of design features make Swan an ideal tool for creating program visualizations for educational use.
The most important is ease of use. Throughout the project, our main goal was to create an annotation library
that would be easy to use. Swan is not nearly so extensive as many other program visualization systems, and in
particular Swan has no support for animation. However, most existing program visualization systems are quite
difficult to learn, and require extensive programming to create visualizations. In contrast, a motivated instructor
or student can learn most of Swan and program a complete visualization for a simple algorithm in an afternoon.
Thus, Swan is a practical tool for use by instructors and students, rather than by visualization experts.
Just as important as ease of use for the annotator is ease of use for the viewer. Swan has a straightforward
viewer interface. Once the program is invoked, the basic visualization requires only that the viewer press the
“STEP” or “RUN” buttons. More sophisticated interface activities, such as making changes to a data structure,
require only a handful of different actions by the viewer.
Swan’s approach to program visualization through program annotation makes it appropriate for classroom
use, since existing algorithm descriptions can be annotated with only additions, not modification. This allows
the instructor to easily add in a visualization for an algorithm that she already uses in an existing course. (This
assumes that the original code example is in C or C++ .) For example, if a particular implementation for inserting
a value into a binary search tree is presented in a textbook, the instructor can annotate that precise algorithm,
rather than create a variation suitable for visualization purposes.
Swan has the uncommon feature that the annotator can provide functions that allow the viewer to modify the
data structure under study. This means that a student can actively use an existing Swan visualization to create his
own examples. Again using the binary search tree as an example, the student can watch the effects of inserting
various values into the tree, testing his own assumptions and hypotheses about the algorithm’s behavior.
Swan has a simple, built-in method for presenting commentary about the current state of an algorithm via the
I/O window at the bottom of the screen. The annotator can present a brief text description for each step of the
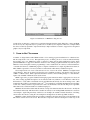
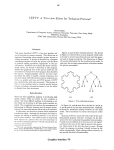
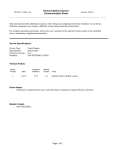
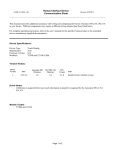
Figure 3: Visualization of a Red-black tree.
algorithm as it happens. Thus, not only will the viewer see the changes to the data structure as they take place,
but ongoing commentary as well.
Note that the speed of the visualization, and the commentary, are completely controlled by the viewer, who
advances to the next step of the visualization by pressing the “STEP” button. This is an important feature in an
instructional tool, allowing each student to absorb information at her own speed.
4 Experiences and Future Plans
We currently have developed a small number of visualizations for testing purposes. Three are illustrated in this
paper. Figure 1 shows two views of a graph as part of a Minimal Spanning Tree algorithm. Figure 2 shows a
Huffman coding tree. Figure 3 shows a Red-black tree.
To test the ease of use of the annotation system, a group of three graduate students volunteered to work with
the system. None had prior experience with Swan. Each was asked to provide an annotation for the Heapsort
algorithm. The original C source code for the algorithm was provided to the subjects, and they were allowed to
create a visualization in any way they desired.
Our testing showed that the Swan annotation system can be learned and the first simple visualization produced
in an afternoon. Each of the subjects successfully produced visualizations of Heapsort. However, we also observed
that producing good visualizations requires a degree of creativity. Just as creating a good lecture or a good
homework exercise is difficult (even when the physical activity required is made easy by a document processor),
it is difficult to create a good program visualization.
In Spring, 1996, Swan visualizations are being incorporated into homework assignments in our senior algorithms course. The current plan is to use Swan visualizations to review and extend the class discussion of the
following algorithms:
•
•
•
•
•
•
•
Red-black trees;
Huffman codes;
Topological sort;
Network flow (Ford-Fulkerson method);
String matching; and
Approximating vertex cover.
A visualization of the lower-bounds proof for finding a minimum and a maximum element from a list.
These algorithms represent a diverse selection that can benefit from Swan’s graph visualization capabilities. The
vertex cover visualization will be programmed and annotated by the students themselves.
At the beginning of the Spring Semester, 1996, a new graduate research assistant who had no prior experience
with Swan was assigned to create the visualization listed above. As of this writing, he has created three visualizations. His first experience with Swan was the visualization for the Min/Max element lower bounds proof.
This required about 4-6 hours to implement. The second visualization was for the Red-black tree, and required
about four hours to implement the visualization (this does not count the time spent implementing the Red-black
tree algorithms themselves). The third visualization was for the Huffman coding tree. The basic tree construction visualization took about three hours to implement, with another two hours required to illustrate the message
encoding/decoding process.
Note that the three visualizations described above were created for instructional purposes. The implementor
reported that about 2/3 of his time was spent setting appropriate pause points in the algorithm, and devising the
tutorial messages that go along with the visualization. If he had been using Swan only to gain an understanding
of the code (for example, to help in debugging), much less effort would have been required.
The Red-black tree and Huffman coding tree visualizations have been used to solidify students’ understanding
of the algorithms developed in class and in the text. Students retrieve the visualizations from the class Web site and
run them on their own computers. The visualizations allow students to create and experiment with trees that are
significantly larger than can be created by hand, without the effort of implementing the algorithms themselves. As
a consequence, the assignments are more elaborate than were previously possible. The assignments also benefit
from a common graphical interface in all the visualizations. Students have reported only two small problems with
actually using the visualizations. In all cases, they were able to accomplish the assigned Swan tasks without any
training in the Swan interface itself.
We also expect to produce a series of visualizations in the coming year for our sophomore level data structures
class. These visualizations will include illustrations of several standard sorting algorithms; fundamental list, stack
and queue operations; and a more complete binary search tree visualization.
There are a few extensions that we plan to add to Swan to enhance its educational value. The first is to extend
the size of the comment window at the bottom of the screen. Presently, only one line of text can be visible at any
time. This should be enlarged. The other necessary feature is a window showing the program’s source code. Some
program visualization systems are quite sophisticated in that they automatically associate visualization views with
source code. Our plans are much simpler. Essentially, we will allow the annotator to provide an ASCII pseudocode
source. A SAIL function will be added to indicate the current line in the source that should be marked during
execution of the actual program. Thus, the annotator will have complete control and responsibility for matching
the source code window to the current program view, controlled by an easy to use library function.
5 References
[Hines et al. 1994] D.T. Hines, J.M.A. Begole, C.A. Klipsch and C.A. Shaffer, The GeoSim Interface Library
(GIL): Programmer’s Manual, Computer Science TR 94-31, Virginia Tech, Blacksburg, VA, December 1994.
[Roman & Cox 1993] G.-C. Roman and K.C. Cox, “A Taxonomy of Program Visualization Systems”, IEEE
Computer, Vol. 26, No. 12, 1993, pp. 11-24.
[Tamassia & Tollis 1994] R. Tamassia and I.G. Tollis, Eds., Graph Drawing’94, Lecture Notes in Computer
Science 894, Springer, Berlin, 1994.
[Yang et al. 1995a] J. Yang, C.A. Shaffer and L.S. Heath, “Swan – A Data Structure Visualization System”, in
Proceedings of Graph Drawing’95, Passau, Germany, September, 1995, pp. 520–523.
[Yang et al. 1995b] J. Yang, C.A. Shaffer and L.S. Heath, “The Swan User’s Manual”, Computer Science TR
95-14, Virginia Tech, Blacksburg, VA, May, 1995.
Acknowledgements
The authors gratefully acknowledge the support of the National Science Foundation under Grant CDA-9312611.