1
This article has been accepted for publication in a future issue of this journal, but has not been fully edited. Content may change prior to final publication. Citation information: DOI
10.1109/TPDS.2014.2370045, IEEE Transactions on Parallel and Distributed Systems
1
Patient Infusion Pattern based Access Control
Schemes for Wireless Insulin Pump System
Xiali Hei, Student Member, IEEE, Xiaojiang Du, Senior Member, IEEE, Shan Lin, Senior Member, IEEE,
Insup Lee, Fellow, IEEE, and Oleg Sokolsky, Member, IEEE
Abstract—Wireless insulin pumps have been widely deployed in hospitals and home healthcare systems. Most of them have limited
security mechanisms embedded to protect them from malicious attacks. In this paper, two attacks against insulin pump systems via
wireless links are investigated: a single acute overdose with a significant amount of medication and a chronic overdose with a small
amount of extra medication over a long time period. They can be launched unobtrusively and may jeopardize patients’ lives. It is very
urgent to protect patients from these attacks. We propose a novel personalized patient infusion pattern based access control scheme
(PIPAC) for wireless insulin pumps. This scheme employs supervised learning approaches to learn normal patient infusion patterns
in terms of the dosage amount, rate, and time of infusion, which are automatically recorded in insulin pump logs. The generated
regression models are used to dynamically configure a safe infusion range for abnormal infusion identification. This model includes two
sub models for bolus (one type of insulin) abnormal dosage detection and basal abnormal rate detection. The proposed algorithms are
evaluated with real insulin pump. The evaluation results demonstrate that our scheme is able to detect the two attacks with a very high
success rate.
Index Terms—wireless insulin pump, implantable medical devices, access control, infusion pattern, patient safety.
F
1
I NTRODUCTION
To help 25.8 million Americans [1] with diabetes, a
growing number of wireless and wired insulin pumps
have been used by diabetic patients to deliver insulin
into their circulatory systems. Wired insulin pumps are
used by nurses directly without wireless USB. In 2005,
there were about 245,000 wireless pump users, with this
market expected to grow 9% annually between 2009 and
2016 [2, 3]. It is very important that these wireless insulin
pumps are reliable, secure, and safe.
Unfortunately, most of the existing wireless insulin
pumps lack sufficient security mechanisms to protect
patients from malicious attacks and overdose incidents.
For example, a pump malfunction has caused a patient’s
death [4], where the pump went into the PRIME function
when the patient was asleep and delivered the entire cartridge of insulin. Insulin pumps have preset minimum
and maximum dosage levels as well as infusion rates,
which is required by the FDA [5]. However, researchers
have shown that these levels could be remotely disabled
by attackers [6]. Without this basic protection mechanism, the insulin pump is vulnerable to several attacks.
In this paper, we investigate two new fatal attacks that
are specifically targeted at wireless insulin pumps. The
first type of attack is a single acute overdose attack: the
attacker can issue a one-time overdose (underdose) con• X. Hei, X. Du and S. Lin are with the Department of Computer and
Information Sciences, Temple University, Philadelphia, PA, 19122, USA.
E-mail: {xiali.hei, dux, slin}@temple.edu.
• I. Lee and O. Sokolsky are with the Department of Computer and
Information Science, University of Pennsylvania University, Philadelphia,
PA, 19104 USA e-mail: {lee, sokolsky}@cis.upenn.edu.
taining a significant amount of medication to a patient.
For diabetic patients, the effects of the insulin overdose
can include dizziness, drowsiness, and nausea, ultimately leading to seizures, coma, and in the worst case
death [7]. The second type of attack is chronic overdose
(underdose) with an insignificant amount of medication
being delivered over a long period, e. g. months. The
chronic overdose of insulin can directly cause low blood
glucose (BG), which leads to various complications and
is extremely difficult to detect. Given that this attack can
be performed even without modifying the insulin pump
settings, it is exceptionally challenging to defend against.
For patients’ safety, it is necessary to defend against
these two types of attacks on insulin pumps. Many
wireless insulin pumps, e. g. Medtronic MiniMed 512,
automatically record detailed information about each
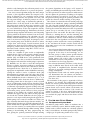
infusion in its log file. Figure 1 shows an insulin dosage
example in a day. We consult 10 patients and several doctors, analyze 10 patients’ data. The detailed information
includes the infusion rate, dosage, BG level, patient id,
and time of day for each infusion. Given this information, we observe normal infusion patterns for home care
diabetic patients. Thus, we propose a novel access control mechanism using a supervised learning method. To
learn these normal patterns, the regressions are designed
to analyze infusion dosage history and predict future
infusion dosages. Once data collected and analyzed after
3 months, our scheme can generate a safety range for a
specified time interval. The automatically recorded log
data are raw data, which are encrypted and stored on
the pump. The encryption key is applied to standard
authentication. An attacker needs to encrypt the data
and decode the raw data to get meaningful records,
1045-9219 (c) 2013 IEEE. Personal use is permitted, but republication/redistribution requires IEEE permission. See
http://www.ieee.org/publications_standards/publications/rights/index.html for more information.
This article has been accepted for publication in a future issue of this journal, but has not been fully edited. Content may change prior to final publication. Citation information: DOI
10.1109/TPDS.2014.2370045, IEEE Transactions on Parallel and Distributed Systems
2
which is costly. During the data collection period, we use
the naive solution in Section 7.1 to protect the patient.
Our access control algorithm design has three unique
features: 1) this algorithm utilizes the temporal correlation of infusions for any particular patient. Patient
specific infusion patterns are captured over time, and
the long term changes of infusion patterns can also be
detected; 2) a safety range is dynamically updated at
different times of the day based on the online model,
(the safety range counts for the in-situ variations of the
insulin injection); and 3) this algorithm doesn’t require
any extra information, all the data required is already
present in the insulin pump logs. Furthermore, the linear
regression design requires little memory and computing
capacity, which can be done in real-time even on resource
limited computing platforms. Our algorithm can also
identify infusion mistakes made by doctors or patients,
such as an erroneous dosage input. In emergency situations, insulin pump users should be allowed to infuse
a larger than usual dosage. Several bio-metric based
solutions have been proposed to address this problem in
emergency, which is not the focus of this paper. Several
bio-metric based solutions using EKG or ECG are not
suitable for insulin pumps.
There are a number of prior works on implantable
medical devices. These works provide valuable research
results for our study. For example, with a pump serial
number (SN) and USB device easily purchased from
eBay, Radcliffe was able to track data transmitted from
the computer and control the insulin pump’s operations
[9]. Radcliffe was also able to cause BG management
devices to display inaccurate readings by intercepting
wireless signals sent between the sensor device and the
management device. Kevin Fu et al. detailed how to
reprogram an implantable cardiac defibrillator remotely,
causing the victim to receive a malicious shock [10].
Measurements in another paper [31] show that in free
air, intentional EMI under 10 W can inhibit pacing and
induce defibrillation shocks at distances up to 1 - 2 m
on implantable cardiac electronic devices. Additionally,
harvesting patient data in the region is easily executed
via an eavesdropping attack. Previous literature [8] has
analyzed these possible attacks and has proposed using
a traditional cryptographic approach (rolling code) and
body-coupled communication to protect the wireless link
and insulin pump system. However, these proposed
solutions do not address the overdose attacks that are
studied in this paper. Also, the authors of this paper did
not decode the Carelink USB driver. In this paper, we
present a novel supervised learning based approach for
insulin pump access control. It includes two bolus (one
type of insulin) abnormal dosage detection models, one
updated basal (another type of insulin) abnormal rate detection model and one algorithm to combine them. Note
that, to save the resource, we assume all the near optimal
parameters are obtained through offline learning. Offine
learning is downloading the data, preprocessing the
data, getting the optimal parameters through running
the generic algorithms on the laptop or PC instead of
pumps, and building the normal dosage model. Then we
use these parameters in online regression and detection.
We also update the parameters according to the update
policies in Section 5.2.3 and 5.3.2. To do this, we redo
the pattern learning and get the optimal parameters and
update the detection models running on the pumps.
Our solution is evaluated with real insulin pump logs
obtained from Medtronic pumps including MiniMed
511, 512, 522 and Paradigm Revel 723 in home care
systems for diabetic patients. Several log files are tested.
Each log file contains the infusion records of a particular
patient for up to 6 months. We use a cross-validation
approach to tune our model. The first 80% of logs are
selected as a training data set, and the remaining 20%
are used for testing. Malicious attacks are simulated
in combination with the normal infusions. Evaluation
results show that our algorithm can effectively identify
the single overdose attack with a success probability up
to 98% and detect the chronic overdose attack with an
about 100% success rate. Our contributions are summarized as follows:
• A novel personalized patient infusion pattern based
access control scheme for wireless insulin pump is
proposed. To the best of our knowledge, we are
the first group to utilize patient specific infusion
patterns to identify malicious overdose attacks on
insulin pumps. Our work is able to prevent the
malfunction of nurses and patients as well. Also,
our scheme has close-loop properties.
• Our solution dynamically calculates a safety dosage
range at different times based on the online learning model. A simplified bolus abnormal dosage
detection is presented, with high efficiency and low
energy consumption.
• Experimental results with real insulin pump data
sets demonstrate that our solution can defend against the overdose attacks effectively with a success
rate above 98%.
The remainder of this paper is organized as follows:
In Section 2 we describe the background and attack
models. We analyze patient infusion patterns in Section
3. In Section 4 we present the detailed patient infusion
pattern based access control scheme. We describe our
real experimental results in Section 5. We extend our
scheme in Section 6. We show related discussions in
Section 7. In Section 8, we review the related work, and
we conclude the paper and discuss the future work in
Section 9.
2
S YSTEM
AND
ATTACK M ODELS
2.1 Background and System Model
An infusion pump infuses fluids or medicine into a
patient’s circulatory system. Wireless insulin pumps are
widely used to deliver insulin into a diabetic patient’s
body to treat diabetes. An insulin pump usually delivers
a single type of rapid-acting insulin in two ways:
1045-9219 (c) 2013 IEEE. Personal use is permitted, but republication/redistribution requires IEEE permission. See
http://www.ieee.org/publications_standards/publications/rights/index.html for more information.
This article has been accepted for publication in a future issue of this journal, but has not been fully edited. Content may change prior to final publication. Citation information: DOI
10.1109/TPDS.2014.2370045, IEEE Transactions on Parallel and Distributed Systems
3
2.2
Fig. 1. Daily insulin dosage example of patient A
•
•
A bolus dose that is pumped to cover food eaten or
to correct a high BG level.
A basal dose that is pumped continuously at an adjustable basal rate to deliver insulin needed between
meals and at night.
It is the responsibility of the pump user to start a
bolus or change the basal rate manually. The patient
set the bolus dosages according to the algorithm builtin the pump and basal rate suggested by the doctors.
The bolus dosages and basal rates could be changed
through Carelink USB by doctor or nurses or attackers.
The times of delivering bolus in a day depend on the
patient’s behavior. Figure 1 shows the insulin infusion
record for a diabetic patient over 24 hours. As illustrated
in the figure, the insulin basal rates are slightly different
during different time periods within one day. The basal
rate is a continuous infusion that lasts for 24 hours.
The infusions with the bolus dosages are discrete and
occur around 7am, 10am, 12pm, 5pm, and 7pm each day.
The bolus dosages have three categories: normal, square,
and dual. Patients choose a type of bolus with specified
amounts of dosages. The diabetic individual usually
delivers a square bolus or a normal bolus at a fixed time
interval that accounts for breakfast, lunch, dinner, and
other cyclical events throughout the day. Factors such as
carbohydrate (carb) ratio, insulin sensitivity, and target
high BG are typically unique to each patient.
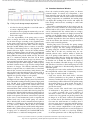
Figure 2 shows the components of a Medtronic
Paradigm real-time insulin pump system. The OneTouch
meter obtains BG readings from the patients’ finger prick
tests. The BG level is transmitted from the OneTouch
meter to the insulin pump via the wireless link 2. The
sensor tests the glucose trend (up or down)in patients’
interstitial fluid. And send the trend to continuous glucose monitor system via wireless link 3 and to pump via
wireless link 6. Wireless links 2 and 6 use similar protocol
and suffer the same attacks. The insulin pump delivers
insulin to the patient. The remote control unit is operated
by the user to send instructions (such as suspend and
resume basal rate) to the insulin pump via wireless
link 1. Wireless link 4 and 7 transmit historical glucose
readings to a USB device that uploads the information
to a web service. Wireless link 5 allows the Carelink
USB device to gather reports on BG trends and patterns.
Wireless link 6 sends current glucose levels to the pump.
A laptop or PC is utilized by the Carelink USB device
to upload data to a web-based management system.
Overdose Attack over Wireless
Given the wireless insulin pump system, we discuss
potential attacks. To connect two components, a user
must manually enter the SN of that component being
wirelessly connected. Once all of the wireless connections among components are established, the insulin pump
can display BG readings from sensors and adjust the
bolus dosage and basal rate according to control unit
commands.
The wireless communication in the system is not encrypted. As a result, attackers can easily compromise the
wireless links in this system. Various malicious actions
can be conducted after the wireless links are compromised. For example, attackers can display incorrect BG
readings on the insulin pump via link 2. We refer to
this attack as Radcliffe’s attack. Another attack is that
an attacker suspends the basal rate delivery using link
1. We do not discuss this attack in our paper because it
can be easily noticed by patients.
Insulin pump users can modify the pump settings
using the Carelink Pro software on a computing device,
such as a laptop. The new settings are uploaded to
the pump using the attached Carelink USB device via
wireless link 5. In this case, attackers may use customized software and a wireless sniffer to obtain the
SN of all pumps within 300 feet, and can, therefore,
compromise wireless link 5 to change the settings of the
pump without being noticed. Using this security flaw,
an attacker can 1) disable the alarms of the pump, 2)
change the maximum allowable dosage of the pump,
and 3) deliver a fatal dose to the insulin pump user. The
delivery of a lethal dose is life-threatening and must be
defended against.
In this paper, we focus on the attacks that are based on
the compromised wireless link 5. Particularly, we focus
on two types of attacks related as follows,
•
•
Single acute overdose. This attack issues a one-time
overdose (underdose) to the patient. A significant
amount of medication that is larger (less) than the
normal dosage will be delivered to the patient using
the insulin pump in a short period. Given that a
dosage of this magnitude is fatal, it is critical to
prevent this attack.
Chronic overdose. This attack issues extra portions
of medication to the patient over a long period,
e. g. weeks or months. One or two instances of
the small overdose are not critical; however, such
overdose for a long period can put the patient’s life
in danger. It is the attack could not be identified
by one-time check. The clinicians and patients may
not notice the small amount of overdose, since it
does not cause obvious symptoms until the dosages
have accumulated to a dangerous level. This can
also cause various complications to the patient. It
can be defend against because we use blood glucose
as a parameter. It works as a close-loop feedback
to another parameter such as EB (expected bolus).
1045-9219 (c) 2013 IEEE. Personal use is permitted, but republication/redistribution requires IEEE permission. See
http://www.ieee.org/publications_standards/publications/rights/index.html for more information.
This article has been accepted for publication in a future issue of this journal, but has not been fully edited. Content may change prior to final publication. Citation information: DOI
10.1109/TPDS.2014.2370045, IEEE Transactions on Parallel and Distributed Systems
4
Fig. 2. A real time insulin pump system
When there is a chronic underdose attack, the blood
glucose will be higher and the EB will be larger.
So the increased EB will correct such a chronic
underdose attack.
The authentication scheme is crucial. However, the
existing authentication with a code is not secure if an
attacker can get close enough. Right now, there are
no authentication schemes over wireless link 5. In this
paper, we assume the wireless link 5 has a standard
authentication scheme and the patient’s parameters can
only be changed manually. The devices only provide
the interface to set the parameters manually. The system
utilizes standard authentication protocol ISO 9798-2.
3
DATA
ANALYSIS
Our study is based on real insulin pump records provided by anonymous diabetic patients. Over the last
year, several patients used Medtronic wireless insulin
pumps at their homes for at least three months. All those
patients were able to upload their infusion log data to
the Carelink online management system.
3.1
Infusion Record Analysis
Since the dataset was real patient data in a format
proprietary to Medtronic Inc., a substantial effort was
required to clean the data. First of all, many of the
recorded events are not directly related to the delivered
patients’ dosages. Secondly, there is a time difference
between the time of recording features that we used
in Section 3.3 and 3.5 and the programming of doses.
We preprocess this data by an automation tool to make
it suitable for analysis. This tool retrieves the feature
set for each record related to the basal rate and bolus,
adds a label, and normalizes the feature, and classifies it
into basal rate logs and bolus logs. Then, we count the
occurrences of each bolus according to the time label
on each day. We also calculate the total dosage of bolus
during each period ∆, which starts when the patient
requires a bolus. The mean E and standard deviation
σ of daily total insulin were calculated, as well.
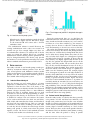
Fig. 3. The histogram of patient A’s daily bolus dosage in
3 months
From the preprocessed data set, we find that the
estimated bolus dose and other nine variables (BG level,
active insulin and insulin sensitivity etc.) were correlated. There are a few other variables (e.g. the amount of
exercise) that are known to affect the estimated bolus
level. Unfortunately, we do not have access to this data.
We explore the infusion records of patient A over the
course of several days. We observe that, during breakfast
time, there are 1-2 bolus doses; during lunch time, there
are 1-3 bolus doses; during dinner time, there are also
only 1-2 bolus doses. Figure 3 is a histogram of patient
A’s daily bolus dosage in 3 months. It shows that the
bolus delivery was highly aligned with the time of the
day. We also perform the Shapiro-Wilk test for all the
patients’ total daily insulin. The test result shows that
they all obey normal distribution because all of the ps
of them are greater than 0.05. These results suggest that
the mean of daily total insulin dosage of a patient was
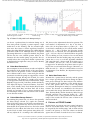
stable over the treatment period. For example, Figure
4.a is a histogram of patient A’s total daily insulin for 3
months, which indicated to us it may follow the normal
distribution. In Fig. 4.a, the y-axis is the number of days
having a special total daily insulin. Figure 4.b shows
the mean E and 2-standard deviation 2σ of patient A’s
total daily insulin in 3 months. We can see that they are
bounded within [E − 2σ, E + 2σ]. We plot the histogram
and probability of the 3-month total daily insulin dose.
In Figure 4.c, the number represents the number of days
having a special total daily insulin. The unit of the above
subfigure is percent. And it shows that the 99.5% of daily
total insulin falls in the range [22-44].
3.2 Patient Insulin Dosage Pattern 1
From the study results, we observe that there generally
exist patterns of bolus and basal rate infusions, even
though each patient may have his/her own circadian
rhythm. A patient’s eating habits can be manifested from
various factors, including their profession, diet, exercise
routine, degree of insulin sensitivity, or a host of other
factors. However, there are five main periods related to
the infusion. These are breakfast, lunch, dinner, evening,
and the time when the patient is asleep. A patient
1045-9219 (c) 2013 IEEE. Personal use is permitted, but republication/redistribution requires IEEE permission. See
http://www.ieee.org/publications_standards/publications/rights/index.html for more information.
This article has been accepted for publication in a future issue of this journal, but has not been fully edited. Content may change prior to final publication. Citation information: DOI
10.1109/TPDS.2014.2370045, IEEE Transactions on Parallel and Distributed Systems
5
(a) The histogram of patient A’s daily total (b) The 2σ-errorbar of patient A’s daily total (c) The histogram and probability of patient A’s
insulin dosage in 3 months
insulin dosage
daily total insulin dosage in 3 months
Fig. 4. Patient A’s daily total insulin dosage analysis
can choose a preferred time for infusion during one of
these time periods. Typically, a patient requires a high
insulin dose in the morning, and less around 4-6pm,
then more after 12am to counter regulatory hormones
during the night. Different patients also exhibit different
peak times of BG levels. Although there are exceptions
preventing adherence to a rigorous schedule, the patient
still has his/her own schedule pattern based on the
functions that the insulin pump can provide. We reasonably believe that each patient exhibits a pattern that
is distinguished enough that it may be used to identify
abnormal events.
3.3 Bolus Data Feature Set 1
Our assumption is that the history records are helpful in
the prediction of the insulin dosage of the same patient.
This is true for 10 patients we have consulted because
that a diabetes tends to have a strict meal plan and the
parameters stored in the pump are suggested by a doctor
and seldom changed. Having this in mind, we extract
related features. The features we consider to be relevant
to our regression model are: Time, Estimate Bolus, Target
High BG, Target Low BG, Carb Ratio, Insulin Sensitivity,
Carb Input, BG Input, Correction Estimate, Food Estimate, Active Insulin, Daily Total Insulin, Basal Pattern
Name, Index, Basal Rate, and Start Time. All of these
features are expected to have a strong correlation with
the timestamps of the records. We will use some of them
in our detection models.
3.4 Patient Bolus Dosage Pattern 2
Reexamining the patient data, we observe that generally
the bolus dosage selected (Bo) equals the estimated
bolus (EB) if the patient uses the bolus wizard function,
even though each patient may have his/her own circadian rhythm. If the patient doesn’t use the bolus wizard
function, he/she seldom has bolus doses or the dosage
he/she selects is stable. Some patients using bolus wizard may adjust the Bo according to the estimated bolus
EB; however, the adjustment behavior has patterns. The
total number of adjustments in a day is less than 2
times. Also, if the patient makes a positive (Bo − EB)
several times continually, he/she usually makes another
negative (Bo − EB) to balance the increasing insulin
behavior.
As we observed, the total adjustment dosage
P
(Bo − EB) in a day has a threshold unless the patient
eats a lot during an event, exercises a lot or is sick. Based
on the functions that the insulin pump can provide, the
patient has no way to avoid the algorithm embedded
and control the time a dosage used. If the bolus type is
not “Normal”, the total (Bo − EB) in a small window
is supposed to be 0 because the patient wants to split a
big EB into several small bolus dosages. Otherwise, we
think the total (Bo − EB) in a small window is not 0 is
an adjustment event. Besides, the adjustment range has
a threshold.
3.5 Bolus Data Feature Set 2
We find that a patient knows his body and the patient
has a unique psychological behavior during the adjustment process through our data analysis. This information is helpful in the prediction of the insulin dosage
of the same patient. This is true for the 10 patients
we analyzed. Having this in mind, we extracted related
features. The features we considered to be relevant to
our second bolus dosage abnormal detection model are
Time, Estimate Bolus, Insulin Sensitivity, Bolus Dosage
Selected, and Date. The composite feature (Bo − EB)
is expected to have a strong correlation with the timestamps of the records. We will use some of them in our
detection models.
4 D ETAILS OF PIPAC S CHEME
In this Section, we present our access control scheme in
detail. If our model returns “Fail”, the dosage will not
be accepted by the insulin pump, and an alarm will be
issued to the patient, as well. Our scheme can defend
against the two kinds of attacks that we have outlined.
1045-9219 (c) 2013 IEEE. Personal use is permitted, but republication/redistribution requires IEEE permission. See
http://www.ieee.org/publications_standards/publications/rights/index.html for more information.
This article has been accepted for publication in a future issue of this journal, but has not been fully edited. Content may change prior to final publication. Citation information: DOI
10.1109/TPDS.2014.2370045, IEEE Transactions on Parallel and Distributed Systems
6
TABLE 1
Notations description in PIPAC scheme
Notation
Description
Bolusp , Basalp
CB, Bo
Predicted Bolus and Basal rate
Cumulative bolus dosage from ∆st ,
Bolus dosage to be checked
Time window, Start Time of each ∆
Lower bound and upper bound of safety range
Time label, Estimate bolus,
Basal rate to be checked
Target high BG, Target low BG,
Carb ratio, Insulin sensitivity
Time, Carb input, BG input
Correction estimate, Food estimate
Active insulin, Operation type
Pattern name, Index in pattern
Basal rate, Start time of one rate
Dosage, Total daily insulin
Temp Basal Amount, Temp Basal Type
Temp Basal Duration
∆, ∆st
SRl , SRu
TL, EB, Ba
BGh , BGl ,
CR, IS
T, CI, BGi ,
CE, FE
AI, OT
PN, Index
R, ST
D, TDI
TBA, TBT
TBD
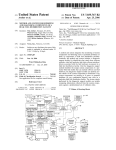
Fig. 5. Abnormal dosage detection process
4.1 Overall Detection Model
The goal of our scheme is to identify abnormal infusions
of bolus dosage, basal rate, and total daily insulin. Table
1 summarizes the notations used in the rest of the paper.
Our scheme includes two bolus abnormal dosage detection models, one updated basal abnormal rate detection
model and one algorithm to combine them. Figure 5
illustrates the total abnormal dosage detection process.
Firstly, at reset time (generally at 0am), we check whether
the total daily insulin falls in the safety range. If it
falls out safety range, we send alarm to the patients.
Otherwise, we check the operation type. If it is bolus
dosage, we check whether the vector has EB feature. If
“Yes”, we can choose bolus abnormal dosage detection
model 1 or 2 to monitor the bolus dosage. Otherwise, we
can use abnormal dosage detection model 1 to detection
the abnormal bolus dosage. If it is a basal rate, we adopt
the abnormal basal rate detection model to monitor it in
real time. For all above detections, if the dosage pass the
detection, we will continue the safe dose. Otherwise, we
block the dose and alarm the patient.
We use the Mean Squared Error (M SE) to measure the
performance, which is given in equation (1). The error is
the difference between the estimated value and the real
value, where m̄ is the test sample size.
M SE =
1 Pm̄
(f (ui − vi ))2 .
m̄ i=1
(1)
SCC 2 = P
Pm̄
Pm̄
2
(m̄ m̄
i=1 (f (xi )yi ) −
i=1 f (xi )
i=1 (yi ))
Pm̄
P
P
Pm̄
m̄
m̄
2
2
2
(m̄ i=1 f (xi ) − ( i=1 f (xi )) )(m̄ i=1 yi − ( i=1 yi )2 )
explained by the input. If the SCC value is between 70%
to 100%, it is considered to have a strong relationship.
By any regression method, we only can predict a value.
Instead, we want to obtain a safety range. According to
the definition of M SE, we define the safety range SR
for bolus dosage and basal rate as follows.
Definition 1:
√
SR = [SRl ,√SRu ], where SRl = Y − 2 M SE, the
SRu = Y + 2 M SE, and Y is the regression output
for an input vector.
Regardless of the values of bolus dosage and basal
rate, we will use the above safety range SR instead.
4.2 The Detection Model 1 for Abnormal Bolus
Dosage
As illustrated in Fig. 1, the bolus doses
(blue dotted lines) are discrete. A patient’s
records can be denoted as a vector: x
=<
T L(x), EB(x), BGh (x), BGl (x), CR(x), IS(x), CI(x),
BGi (x), CE(x), F E(x), AI(x), T (x) >, representing
Time label, Estimate Bolus, Target High BG, Target Low
BG, Carb Ratio, Insulin Sensitivity, Carb Input, BG Input,
Correction Estimate, Food Estimate, Active Insulin and
Time, respectively. For T L(x), we may represent one
day as [1-24], [1-12], or [1-8]. For other features, we
use the original values from the patient’s records.
The main types of insulin are bolus and basal. Many
patients calculate their estimated bolus using bolus
wizard function. Bolus wizard function determines the
estimated bolus according to the following rule:
• If BGi (x) > BGh (x),
EB(x) =
(2)
The squared correlation coefficient (SCC) is the predictive percent of behavior in the output that can be
•
BGi (x)−BGh (x)
IS
+
CI
CR
− AI(x);
(3)
+
CI
CR
− AI(x);
(4)
If BGi (x) < BGl (x),
EB(x) =
BGi (x)−BGl (x)
IS
1045-9219 (c) 2013 IEEE. Personal use is permitted, but republication/redistribution requires IEEE permission. See
http://www.ieee.org/publications_standards/publications/rights/index.html for more information.
This article has been accepted for publication in a future issue of this journal, but has not been fully edited. Content may change prior to final publication. Citation information: DOI
10.1109/TPDS.2014.2370045, IEEE Transactions on Parallel and Distributed Systems
7
•
Otherwise,
EB(x) =
CI
CR
− AI(x).
(5)
These rules come from the insulin absorption curve
[36] in human body and are embedded in the insulin
pump as a bolus wizard function. So a patient needs the
pump to help them to calculate an estimated bolus for
reference.
To deliver one bolus, a patient has to enter “BG Input”
and “Food Estimate” values. Considering “BG Input”
as a feature, our scheme has the close-loop property.
Based on the patient pattern, we choose the support
vector machine (SVM)[24] regression model to predict
bolus dosages. We choose SVM and feature set according
to the formula 3, 4, 5 in Section 4.2 and experimental
results analysis. After comparisons, we chose SVM. In
this paper, we only list and compare the results using
linear regression and SVM regression in Section 5. An
SVM model is a representation of the examples as points
in space, mapped so that the examples of the separate
categories are divided by a clear gap that is as wide as
possible. New examples are then mapped into that same
space and predicted to belong to a category based on
which side of the gap they fall on.
In our SVM based design, we select the best hyperplane representing the largest gap between the two classes [24]. Hence, we choose the hyperplane such that the
distance from it to the nearest data point on each class is
maximized. The optimization problem to maximize the
margin with a kernel trick is formulated as follows:
Pl
1
min{ wT w + C i=1 ξi }
2
subject to : qi (wT ϕ(pi ) + b) ≥ 1 − ξi , ξi ≥ 0.
(6)
where qi is either 1 or -1, indicating the class to which
the point pi belongs. Each pi is a n-dimensional real
vector. The training vector pi is mapped into a higher
dimensional space by the function ϕ. Then the SVM finds
a linear separating hyperplane with the maximal margin
in this higher dimensional space. C(>0) is the penalty
parameter of the error term. In equation
P (6), w is also
in the transformed space, and w =
i ai qi ϕ(pi ). Dot
products with w for classification can again
P be computed
by the kernel trick, i.e., w • ϕ(p) =
i ai qi k(pi , pj ).
Hence, once we obtain C and γ that maximize the
margin, we obtain the SVM of normal behavior. The
kernel function k(pi , pj ) = ϕ(pi )T ϕ(pj ). In our work,
we use a radial basis function as the kernel function:
k(pi , pj ) = exp(−γkpi − pj k2 ), γ > 0.
The use of SVM requires the user-defined penalty
parameter C for error and kernel specific parameters γ.
We use a genetic algorithm (GA) ([25]) to get the
optimal C and γ. After we obtain the optimal parameters
(i.e., the best model), we test it using additional data and
get M SE. After having the M SE and the Y = Bolusr for
an input vector x, we can calculate the safety range SR of
bolus dosage within a time window ∆. Then, we check
whether EB(x) is 0 or not. If “No”, we record the T (x)
Algorithm 1 Abnormal Bolus Dosage Detection Model
1
1: Input: Vector x to predict, Bo(x) to be checked, ∆st ,
CB;
2: Output: Pass or Fail;
3: Get best C and γ through GA method off-line;
4: Get SVM model using best C and γ;
5: Predict Bolusp (x) for Vector x using SVM regression
and get M SE;
6: Calculate the SR for ∆;
7: if EB(x) is not 0 then
8:
∆st = T (x), CB = Bo(x);
9:
for each x when T (x) is in [∆st , ∆st + ∆] do
10:
CB = CB + Bo(x);
11:
if CB falls in SR then
12:
RETURN PASS;
13:
else
14:
RETURN FAIL;
15: else
16:
if Bo falls in SR then
17:
RETURN PASS;
18:
else
19:
RETURN FAIL;
as ∆st and initiate CB = Bo(x). Then we check each x
when T (x) is in [∆st , ∆st +∆], we update the cumulative
bolus dosage CB from the start time of ∆st by adding
the bolus dosage Bo(x). If the updated CB falls out of
SR, it is an abnormal bolus dosage and an alarm will
be sent to the patient. Otherwise, it is considered as a
normal bolus dosage. If EB(x) is 0, we check whether
Bo falls in SR. If “Yes”, it is a normal bolus dosage.
Otherwise, it is an abnormal bolus dosage. The detection
model is presented in Algorithm 1.
4.3 The Detection Model for Abnormal Basal Rate
As we can see in Fig. 1, the basal rates (black solid
line) are slightly different during different time periods
of the day. In addition, the basal rate follows the rules
in Section 3.2. Because the basal rate within one day
is a piecewise function, we choose the SVM to predict
the basal rate. For basal rate prediction, we only needs
a small record set that includes all the patterns since
the patterns are seldom changed. Here, we slightly
change our model showed in [27]. We add Temp (temporary) Basal Amount, Temp Basal Type, Temp Basal
Duration as features. Temp Basal Amount represents
the ratio of it to the initial setting. The Temp Basal
Duration represents the time the temporary basal rate
will last. The data can be denoted as a vector: w =<
T L(w), P N (w), Index(w), R(w), ST (w), T BA(w),
T BT (w), T BD(w) >, representing Time label, Pattern
Name, Index, Rate, and Start Time, Temp Basal Amount,
Temp Basal Type, Temp Basal Duration, respectively.
Regarding T L(w), we label the Time according to the
time interval of the pattern. For example, if the time is
1:00pm and it falls in the fifth interval of the pattern;
1045-9219 (c) 2013 IEEE. Personal use is permitted, but republication/redistribution requires IEEE permission. See
http://www.ieee.org/publications_standards/publications/rights/index.html for more information.
This article has been accepted for publication in a future issue of this journal, but has not been fully edited. Content may change prior to final publication. Citation information: DOI
10.1109/TPDS.2014.2370045, IEEE Transactions on Parallel and Distributed Systems
8
Algorithm 2 Abnormal Basal Rate Detection
1: Input: Vector w to predict, Basal rate Ba(w) to check;
2: Output: Pass or Fail;
3: Get best C and γ through GA method off-line;
4: Get SVM model using best C and γ;
5: Predict Basalp (w) for Vector w using SVM regression
and get M SE;
6: Calculate the SR(w);
7: if Ba(w) falls in SR(w) then
8:
RETURN PASS;
9: else
10:
RETURN FAIL;
we label the time as 5. ST (w) should be divided by
3600000, which changes its unit from millisecond to hour.
We use the generic algorithm to get optimal parameters
and M SE. After we obtain the M SE at the testing phase
and the Y = Basalr (w) at the detection phase, we can
calculate the safety range SR(w) of basal rate at this time.
If the basal rate Ba(w) to be checked falls out of the
SR(w), it is an abnormal basal rate, and we will send
an alarm to the patient. Otherwise, it is considered as a
normal basal rate. We present our model in Algorithm
2.
4.4 The Daily Total Insulin Dosage Monitoring Model
Before we design the detection scheme, we have verified
that the total insulin dose follows the normal (Gaussian)
distribution by Shapiro-wilk test [39]. Thus, we can
determine the normal total daily insulin dose region
according to the properties of Gaussian distribution. For
example, for the confidence of 99.7%, the safety range
of total daily insulin dose is [E − 3σ, E + 3σ], where E
is the mean of the total daily insulin dose in 3 months,
and σ is the standard deviation of the total daily insulin
dose in 3 months.
4.5 Combining The Three Models Together
To combine the three models together, we use a vector
s =< OT (s), T (s), ∆(s), D(s), T DI(s) >.
OT (s), T (s), ∆(s), D(s), and T DI(s) represent Operation Type, Time, Time Interval, Dosage, and Total Daily
Insulin, respectively. Operation Type includes bolus or
basal, and Time is the event time. ∆ is a fixed time
window. Dosage is the actual dosage. Total Daily Insulin
is the actual value. If the BGi is higher than 250 (mg/dl),
it is an emergency requiring deactivation PIPAC scheme.
If the BGi is lower than 40 (mg/dl), deliver an alarm to
the patient. Otherwise, choose either Algorithm 1 or 2
by the Operation Type OT (s). After this, we check the
T DI every 24 hours (at personal reset time). Algorithm
3 implements this scheme.
4.6 Abnormal Bolus Detection Model 2
All the thresholds in this subsection are determined
through data analysis or data mining. Different patients
have different thresholds.
Algorithm 3 Abnormal Dosage Detection Process
1: Input: Vector s;
2: Output: Pass or Fail or Deactivation;
3: if BGi (s) ≥ 250 then
4:
RETURN Deactivation;
5: else
6:
if BGi (s) ≤ 40 then
7:
deliver an alarm to the patient;
8:
else
9:
if PASS Algorithm 1 or 2 by OT (s) and Time is
not reset time then
10:
RETURN PASS;
11:
else
12:
if Time is reset time then
13:
if T DI is in safety range then
14:
RETURN PASS;
15:
else
16:
RETURN FAIL;
As discussed in Section 3.4. the features that
we used are: Date, Time, Bolus Volume Selected
(Bo), Bolus Type (BT ), Estimate Bolus (EB), Insulin Sensitivity (IS). Then we have vector u =<
D(u), T (u), Bo(u), BT (u), EB(x) >. T htotal represents
the threshold of total bolus adjustment amount in a day.
T hd represents the threshold of bolus adjustment range
per dosage, which depends on Insulin Sensitivity (IS)
of the patient. T htimes represents the threshold of total
adjustment in a small time window ∆. The larger the
IS, the larger T hd , and T htotal . T htimes = 2 or 3.
At the beginning of the day, we set the total bolus
adjustment amount in a day (representing as T otalDif )
to 0, the total number of adjustment event (representing
as T otalDif T imes ) to 0, and the total bolus adjustment
amount in a small time window (representing as SubDif )
to 0.
If BT (u)!=“Normal”, check whether SubDif is 0. If
“YES”, it is safe. Otherwise, the total number of adjustment event increases by 1 and the total bolus adjustment
amount increases by SubDif , then reset the SubDif to 0.
If BT (u)==“Normal”, check whether (Bo(u) −
EB(u)) > T hd . If “YES”, it is unsafe. Otherwise, check
whether the number of (Bo(u) − EB(u)) is 0 > T htimes .
If “Yes”, it is unsafe. Otherwise, it is safe. At the end of
the day, we check whether the total bolus adjustment
amount is less than the T htotal . If “YES”, it is safe.
Otherwise, it is unsafe and an alarm is sent to the
patient. Algorithm 4 implements this scheme.
5
P ERFORMANCE E VALUATION
We conduct experiments using real patient data to evaluate the performance of our scheme.
5.1 Experimental Setup for Support Vector Machines
SVM is a form of supervised learning, which provides
an effective way to predict bolus dosage and basal rate.
1045-9219 (c) 2013 IEEE. Personal use is permitted, but republication/redistribution requires IEEE permission. See
http://www.ieee.org/publications_standards/publications/rights/index.html for more information.
This article has been accepted for publication in a future issue of this journal, but has not been fully edited. Content may change prior to final publication. Citation information: DOI
10.1109/TPDS.2014.2370045, IEEE Transactions on Parallel and Distributed Systems
9
Algorithm 4 Abnormal Bolus Dosage Detection Model
2
1: Input: Vector u to predict, Bo(u) to be checked, OldT;
2: Output: Pass or Fail;
3: Get T hd , T htotal , and T htimes through off-line analysis;
4: OldT=11:59;
5: if T (U ) < OldT then
6:
T otalDif = 0, T otalDif T imes = 0, SubDif = 0;
7:
if (Bo(u) − EB(u)) == 0 then
8:
RETURN PASS;
9:
else
10:
∆st = T (u);
11:
if BT (u) !==“Normal” then
12:
for each T (u) in [∆st , ∆st + ∆] do
13:
SubDif = SubDif + (Bo − EB);
14:
if SubDif == 0 then
15:
RETURN PASS;
16:
else
17:
T otalDif T imes
=
T otalDif T imes + 1,
T otalDif = T otalDif + SubDif , SubDif = 0;
18:
if T otalDif T imes > T htimes then
19:
RETURN Fail;
20:
else
21:
if BT (u) ==“Normal” then
22:
if (Bo(u) − EB(u)) > T hd then
23:
RETURN Fail;
24:
else
25:
T otalDif = T otalDif + (Bo(u) − EB(u)),
T otalDif T imes = T otalDif T imes + 1;
26:
if T otalDif T imes > T htimes then
27:
RETURN Fail;
28:
else
29:
RETURN PASS;
30: else
31:
if T otalDif > T htotal then
32:
RETURN FAIL;
33:
else
34:
RETURN PASS;
In this work, we design an efficient dosage prediction
scheme using multiple SVMs. The use of SVMs requires
setting user-defined parameters such as C, type of kernel, and γ. The SCC and M SE values were compared to
choose a suitable time label methods. In our experiment,
we choose the radial basis function as the kernel function. In addition, we use a GA in combination with kfold (k=5) cross validation scheme [26] to get the optimal
parameters C and γ for a non-linear SVM regression
using kernel function. After obtaining the best model
using the optimal parameters, we test it using additional
data. All computations were carried out using a desktop
computer with 2.6GB of RAM and a 2.27GHz of Intel(R)
Core(TM) 2 Duo CPU.
TABLE 2
Bolus dosage test results using non-linear SVM
regression
Add missing
data?
Time label
bestC
bestγ
M SE
SCC
Yes
48
5.4062
0.0009
0.0006
0.9990
Yes
12
6.9513
0.0134
0.0022
0.9988
Yes
8
44.05
0.0029
0.0011
0.9995
No
48
3.5472
0.0334
0.0079
0.9953
No
12
9.43
0.1345
0.0407
0.9758
No
8
7.65
0.014
0.0033
0.9980
TABLE 3
Bolus dosage test results using linear SVM regression
Add missing data?
Time label
M SE
SCC
Yes
48
0.0022
0.9988
Yes
12
0.0198
0.9894
Yes
8
0.0280
0.9866
No
48
0.0383
0.9767
No
12
0.0394
0.9761
No
8
0.0409
0.9751
5.2 Experiments for Abnormal Bolus Dosage Detection
5.2.1 Experimental Results of Bolus Abnormal Detection Model 1
In our experiments, we first preprocess the patient’s
records. The total sample size of each patient varies. It is
close to 500. We use 80% of the samples to train the SVM
model, and the remaining 20% to test it. After we use a
GA to get the optimal parameters C and γ, we use them
to obtain the optimal SVM model for each patient. Then
we test it. Table 2 shows the best parameters and the test
results including the M SE and SCC for patient A. We
then use a linear SVM model to repeat our experiments
after we obtain the best C.
Table 2 lists the M SE and SCC of patient A using the
linear SVM regression scheme. Comparing Table 2 and
3, we can see that a non-linear SVM is more suitable
for Bolus dosage prediction because the MSE of a nonlinear SVM is smaller than a linear SVM. In addition, the
real time labeled as [1-48] within a day gives a better
result for patient A. We choose the non-linear SVM to
predict the Bolus dosage for patient A, and the best
M SE that we get by using the near optimal linear
√ SVM
regression is
0.0006.
We
find
that
[Bolus
−
2
0.0006,
p
√
Bolusp + 2 0.0006] is the safety range for that time
window ∆. Recall that SCC = 70% to 100% is considered
as a strong relationship. In our scheme, the best SCC is
greater than 99%. This means that we can use the SVM
regression to predict a patient’s bolus dosage in real time,
according to their previous bolus dosage pattern. We
also repeat these experiments for other patients. Table
4 shows the results. Table 5 shows the test results using
linear regression.
1045-9219 (c) 2013 IEEE. Personal use is permitted, but republication/redistribution requires IEEE permission. See
http://www.ieee.org/publications_standards/publications/rights/index.html for more information.
This article has been accepted for publication in a future issue of this journal, but has not been fully edited. Content may change prior to final publication. Citation information: DOI
10.1109/TPDS.2014.2370045, IEEE Transactions on Parallel and Distributed Systems
10
TABLE 4
Bolus dosage test results using non-linear SVM
regression
TABLE 7
Basal rate test results using non-linear SVM regression
Patient label
bestC
bestγ
M SE
SCC
Patient A
83.73
26.8
0.0004
0.9682
0.9874
Patient B
25.14
705.43
0.0001
0.9999
0.8976
Patient C
74.78
967.87
0.0003
0.9261
0.0005
0.9983
Patient D
34.4
5.5
0.0001
0.9999
N/A
N/A
Patient label
best M SE
best SCC
A
0.0011
B
0.0887
C
D
TABLE 8
Basal rate test results using linear SVM regression
TABLE 5
Bolus dosage test results using Linear regression
M SE
SCC
Patient A
3.03487
0.010829
Patient label
best M SE
A
0.0108
Patient B
0.0100
1.0000
0.0002
Patient C
1.0914
0.3744
C
0.0105
Patient D
1.0801
0.3909
D
N/A
B
TABLE 9
Basal rate test results using Linear regression
TABLE 6
Bolus dosage test results using model 2
Patient label
T hd
T htotal
T htimes
M SE
A
0.3
0.5
2
0.0000
B
1.5
3
2
0.0056
C
0.2
0.5
1
0.000
D
N/A
N/A
N/A
N/A
Patient label
5.3
5.2.2 Experimental Results of Bolus Abnormal Detection Model 2
This model achieves the similar results as the non-linear
SVM regression method. At the same time, it saves a lot
of computation and memory. We don’t need to get the
best parameters using the GA method offline, while we
can do a simple data mining process to get the three
thresholds. Table 6 shows the test results using bolus
abnormal dosage detection model 2. We can see that
model 2 can achieve similar M SE level as non-linear
SVM regression method while keeping low cost. Thus,
we prefer to the bolus abnormal dosage detection model
2 when the patient applies bolus wizard. If the patient
does not have an EB at all, we still chose the non-linear
SVM regression model or linear SVM regression model
in real time.
5.2.3
Patient label
Parameter Update Policy
Our scheme can monitor the “Raw-Type” data in logs
and capture changed settings. If there is no configuration
change to insulin sensitivity, carb ratio, target low BG
and target high BG, the SVM regression model is adjusted every 90 days to handle patient dynamics. A subset of
the previous 90-day history is used for training, and the
new regression is used for the next 90-day interval. After
the adjustment, the corresponding parameters C and γ
are also changed. When the patient is sick, the parameter
adjustment cycle can be changed from 90 days to one
week.
5.3.1
best M SE
A
N/A
B
0.2335
C
0.0100
D
0.0101
Experiments for Abnormal Basal Rate Detection
Experimental Results
In our experiments, we first preprocessed the patients’
records. The total sample size is about 600 for each
patient. We use 80% of the samples to train the SVM
model, and the remaining 20% to test it. We use a similar
approach as the previous subsection. For the patient A,
the best C=83.73 and the best γ =26.8. After we obtain
the best model using the optimal parameters, we run
tests. Table 6 shows the best parameters and test results
including the M SE and SCC for four patients. We then
use a linear SVM model to repeat the experiments.
Table 7 lists the M SE and SCC of 4 patients using
the non-linear SVM regression scheme. Table 8 lists the
M SE and SCC of 4 patients using the linear SVM
regression scheme. Table 9 lists the M SE and SCC of 4
patients using the linear regression scheme. Comparing
Table 7, 8 and 9, we can see that non-linear SVM regression is more suitable for Basal rate prediction. When
we use the non-linear SVM to predict the Basal rate, for
patient A, the
We determine that
√ M SE is close to 0.0004.
√
[Basalp − 2 0.0004, Basalp + 2 0.0004] is safety range
for the Basal rate. In our scheme, the SCC is greater than
95%, indicating that we can use this SVM-based scheme
to predict patient basal rate in real time, according to
their previous basal rate pattern.
5.3.2
Parameter Update Policy
Our scheme can monitor the “Raw-Type” and capture
changed settings that have. If the “ChangeBasalProfile”
is not actively used, the linear SVM regression is adjusted every 90 days if the patient is not sick. When the
1045-9219 (c) 2013 IEEE. Personal use is permitted, but republication/redistribution requires IEEE permission. See
http://www.ieee.org/publications_standards/publications/rights/index.html for more information.
This article has been accepted for publication in a future issue of this journal, but has not been fully edited. Content may change prior to final publication. Citation information: DOI
10.1109/TPDS.2014.2370045, IEEE Transactions on Parallel and Distributed Systems
11
TABLE 10
Accuracy of the system of four patients
Patient label
Accuracy
Patient A
99.43%
Patient B
99.12%
Patient C
99.99%
Patient D
98.89%
patient is sick, the parameter adjustment cycle can be
set to one week.
The parameter update policy of the Total Daily Insulin
Prediction Model is similar to the one in the previous
subsection.
5.4 Experiments using All Data
Using the datasets of all patients, we obtain a number
of abnormal vectors (including time, bolus dosage, basal
rate, etc.) and use these abnormalities to test our PIPAC
scheme. Here, we choose the time window ∆ = 15mins.
Table 10 shows the accuracy of detecting abnormal
dosages when we choose the best suitable model for the
bolus dosage and basal rate. At last, we use synthetic
data (including the real data and abnormal data) to test
the algorithm 3. We test all the synthetic data instead of
20% testing data in the real data. Less than 2% dosages in
the whole synthetic data were mis-classified. That is the
false rejection rate plus the false acceptance rate. There
are abnormal data generated by us. It means that there
will be at most 1 false alarms every 10 days (we assume
5 dosages per day).
6 E XTENSION
6.1 Communication Range of Wireless Link 5 Tests
We tested the maximum successful data exchange range.
It is 3.45m, while it ranges from 0.23m-23m in the Carelink USB manual. 3.45m is a protective communication
range when the patient is indoor.
6.2 Off-line Detection of Settings Change through
USB
When we examined the patient csv logs off-line, we find
that logs with ”ACTION REQUESTOR=rf diagnostic”
are related to the USB’s application. So we can check
the events adjacent to such logs. If the event is related
to the setting changes and the patient does not visit the
doctors at that time, it is suspicious according to our
assumption. This event may be caused by the attackers.
6.3 Energy Adjustment
As we can see from Fig. 8, the PC user application
needs to detect the signal strength before continuing the
communications. So if we adjust the output power, we
can limit the access of unauthorized Carelink USB. √
According to the user manual of Carelink USB, d = 2.3 P
holds. Here, d represents transmission distance. If we
want to make sure the communication range is 1-3m,
the maximum output power rating of the transmitter P
should be less than 1.701w by adjusting the resistance.
7 D ISCUSSIONS
7.1 Naive Solution
A simple public key pair can be applied for authentication over wireless link 5 because each device is certified
by the vendor. Both pump and read/controller can have
a certificate installed to solve the authentication issue.
The problem with this scheme is that there may not
be a trusted third party available all of the time. A
simple public-key authentication is needed only once
to authenticate the pump and the reader/control. All
remaining operations can be done with a shared secret
via symmetric encryption. A user code can be used
as another parameter to set up a shared secret. In the
meantime, we can encrypt the wireless control link
easily. Another concern is that if every device needs to
maintain a public key pair, it is a burden for patients
that possess several devices. Also, the patients do not
want the vendor (knowing all the SN) to have that sort
of power and control over their devices and data.
7.2 Safety Analysis
Under our scheme, for
error
√
√ one patient, the maximum
of Bolus dosage is 2 M SE. For patient A, 2 M SE =
0.048, suppose the total number of safety ranges we
counted is 10, then the total error of insulin is 10 ×
0.048 = 0.48(u). This is less than 1u and therefore
is
√
negligible. For basal rate, the maximum error is 2 M SE,
and the maximum number dose hours that may be
administered
√ in one day is 24. Hence, the
√ total insulin
error is 2 M SE × 24. For patient A, 2 M SE = 0.04,
hence the total insulin error is 24 × 0.04 = 0.96(u). It is
less than 1u and is also negligible. In summary, it is safe
to use our scheme.
7.3 Overhead Analysis
A Medtronic insulin pump operates at 916.5 MHZ. It requires approximately 0.5ms to finish the non-linear SVM
regression. The energy consumed is negligible compared
with ordinary therapy or communication. However, if
we use non-linear SVM regression, it may require several
minutes to obtain the optimal C and γ via the GA
method when we update the model every 3 months.
From this point of view, the linear SVM regression for
bolus prediction still has its advantage. Furthermore, the
verification time of our scheme is short, which is very
important in regards to the patient’s convenience. Our
scheme needs to store two small records for Basal rate
and Bolus dosage detection. In addition, we need to
store the PIPAC program in the insulin pump. All the
storage requirements are acceptable given the computing
resources of today’s insulin pumps.
7.4 Energy Consumption
√
For wireless insulin pump d = 2.3 P holds. Here, d
represents transmission distance. If we want to make
sure the communication range is 1m, the maximum
output power rating of the transmitter P should be
less than 0.189w by adjusting the resistance. The P is
lowered significantly.
1045-9219 (c) 2013 IEEE. Personal use is permitted, but republication/redistribution requires IEEE permission. See
http://www.ieee.org/publications_standards/publications/rights/index.html for more information.
This article has been accepted for publication in a future issue of this journal, but has not been fully edited. Content may change prior to final publication. Citation information: DOI
10.1109/TPDS.2014.2370045, IEEE Transactions on Parallel and Distributed Systems
12
7.5 Security Analysis
7.5.1 Defending Against the First Attack
The first attack is to deliver one large overdose
in one
√
shot.√
Since the upper bound of SR is Y + 2 M SE, and
the 2 M SE = 0.048 is far less than 1u, it is impossible to
deliver (in one shot) a dose 1u larger than the estimated
dosage. Hence, we can defend against this attack. Since
the error of BG measurements is far less than insulin
sensitivity, according to Equations (3)(4), the error of
calculated insulin is small, then we ignore it.
7.5.2 Defending Against the Second Attack
If the attacker gradually increases the dose over a period
of several days, our system can still defend against this
attack. First, BGi is one of the features being monitored.
If the attack happens, BGi will be lowered. Correspondingly, the predicted bolus SR will be decreased. Hence,
the attack will be detected due to the detection of bolus
(or basal rate) out-of-range. Second, we monitor the
cumulative bolus dosage CB within a time window. It is
impossible for an attacker to deliver total bolus greater
than SRu unless BGi is greater than 250 mg/dl. For
basal rate, this kind of attack does not affect the total
insulin a lot. Third, our scheme verifies the T DI daily.
A suspicious dose can be identified if the T DI falls out
of the corresponding safety range. The patient can then
check the history log and discover the attack.
7.5.3 Defending Against the Radcliffe’s Attack
We can monitor: (1) the BG reading from the sensor; and
(2) patient’s BGi input. As the BG testing technology
may have some errors, we use the following approach:
if the difference between (1) and (2) is more than 20%,
then we consider that there may be intercepting attack
between the sensor and the pump. The above approach
cannot defend against the Radcliffe’s attack 100% but can
mitigate it.
7.6 Emergency Situations
It is an orthogonal problem to allow easy access to medical devices when emergencies arise. Many researchers
suggested utilizing open access operated by clinical staff
during emergencies, e.g., in [12], [13], and [15]. To handle
an emergency situation, we can deactivate the PIPAC
scheme. Some literatures (e.g. in [17] and [19]) focus
on the emergency case. Also since a large dose has
a high probability of causing hypoglycemia, doctors
and patients try to avoid this from happening. For a
patient with elevated body mass, the maximum dose
may be set to a larger dose. These patients’ safety ranges
are also set to a larger value. If the patient becomes
hypoglycemic, our scheme issues an alarm to the patient,
and the patient can an emergency food ration that is
high in sugar to relieve this situation. What’s more, in
emergency situations, i.e. the BG is over 250(mg/dl)
or lower than 50(mg/dl), the safety range will vary
accordingly because our scheme is an online prediction
scheme rather than a classification scheme. Thus, our
PIPAC scheme can cover this case. When the expected
dose is larger than the maximal dose limit, the doctor can
change the settings. Also, the patients can split a large
dose into several small doses. We observe this method
in the patients’ medical records. Even though, in this
paper we still deactivate the PIPAC scheme to allow
open access to wireless insulin pumps.
8
R ELATED
WORK
A hacker showed how to deliver a 80-volt shock to an
ICD [40]. Using an easily obtained USB device, Radcliffe [9] was able to capture data transmitted from the
computer and control the insulin pump’s operations.
Barnaby Jack was able to deliver fatal doses to diabetic
patients [6]. Thankfully this attack was only hypothetical
and did not result in any actual deaths. Literature [8]
[30] propose a traditional cryptographic solution (rolling
code) and body-coupled communication to protect the
wireless link. However, Jack’s attack exploits a vulnerability between the Carelink USB and the pump, neither of which can utilize body-coupled communication.
Paper [11] establishes a safety-assured implementation
of Patient-Controlled Analgesic insulin pump software
based on the generic PCA reference model provided
by the U.S. FDA. Paper [38] builds a generic insulin
infusion pump model architecture and presents a has
corresponding hazard analysis document to help later
software design. Paper [37] identifies a set of safety
requirement that can be formally verified against pump
software. Measurements in paper [31] show that in free
air, intentional EMI under 10 W can inhibit pacing and
induce defibrillation shocks at distances up to 1 - 2 m
on implantable cardiac electronic devices.
There are also many solutions proposed to address
the security issues of IMDs during non-emergency situations. Literatures [10], [32] and [33] tried to design and
develop energy-aware security techniques to reduce the
induced energy overhead. The authors of [32] proposed
a lightweight security protocol based on a static secret
key implemented on ultra-low power ASIC. Authors
of [12], [13] and [18] proposed using an additional
external device. However, these external devices may
become stolen, lost, or forgotten by the patient. The
device also discloses the patient’s status. Most importantly, this kind of solution adds another device that
must be managed by the patient, making it an inconvenient solution for patients, especially when diabetic
patients already have to wear many devices. Certificatebased approaches have been proposed in [14], but it
requires the device to access the Internet and verify
certificates. Rasmussen et al. proposed allowing IMDs
to emit an audible alert when engaging in a transaction
[15]. However, this approach may consume scarce power
resources. Our previous work [16] proposed to utilize
the patient’s IMD access pattern and designs a novel
SVM-based scheme to address the resource depletion
attack. It uses a classification scheme rather than the
1045-9219 (c) 2013 IEEE. Personal use is permitted, but republication/redistribution requires IEEE permission. See
http://www.ieee.org/publications_standards/publications/rights/index.html for more information.
This article has been accepted for publication in a future issue of this journal, but has not been fully edited. Content may change prior to final publication. Citation information: DOI
10.1109/TPDS.2014.2370045, IEEE Transactions on Parallel and Distributed Systems
13
regression scheme used here. It is very effective in nonemergency situations. In another previous work [17],
we proposed a novel Biometric-Based two-level Secure
Access Control scheme for IMDs when the patient is in
emergency situations (such as a coma). Literature [27]
proposed a novel patient infusion patterns based access
control scheme (PIPAC) for wireless insulin pumps. This
scheme employs a supervised learning approach to learn
normal patient infusion patterns and calculates a safety
range for the total dose in a time window. Then, it detects
the abnormal infusions using safety range. The proposed
algorithm is evaluated with real insulin pump logs used
by several patients for up to 6 months. The evaluation
results demonstrate that our scheme can reliably detect
the single overdose attack with a success rate up to 98%
and defend against the chronic overdose attack with
a very high success rate. Our book [28] gave several
defense methods for the wireless insulin pump systems.
Our new paper [29] proposed a new near field communication base access control scheme for wireless medical
device systems. [20] proposed using friendly jamming
to prevent an adversarial access to IMDs. In addition,
literature [21] deals with jamming attacks, which can
be used to handle the Radcliffe’s attack in our paper.
Literatures [22] [23] [34] [35] focus on security of health
care systems.
9 C ONCLUSIONS
For wireless insulin pump systems, there are two kinds
of harmful attacks that are related to dosages, and the
vulnerability comes from no authentication on wireless
link 5. In this paper, we proposed a PIP based access
control scheme that can defend against these attacks. Our
scheme leverages the patient dosage history to generate
several detection models, and then we determined the
safety ranges for each input vector. We employed real
patient data to test our scheme, and the results show that
our scheme works well and exhibits good performance.
Our scheme can be generalized to other infusion systems
as well.
ACKNOWLEDGMENTS
We would like to Min Xiao for comments. This work
was supported in part by the US NSF under grants CNS0963578, CNS-1022552, CNS-1065444, IIS-1231680, CNS1239108, as well as CNS-1035715.
R EFERENCES
[1] “2007 national diabetes fact sheet,”
http://www.cdc.gov/diabetes/pubs/pdf/ndfs 2011.pdf.
[2] “US healthcare equipment and supplies - diabetes.”
http://www.research.hsbc.com.
[3] “Insulin pumps - global pipeline analysis, opportunity
assessment and market forecasts to 2016, GlobalData,”
http://www.globaldata.com.
[4] http://www.tudiabetes.org/forum/topics/more-interesting-factson.
[5] FDA, “Medical Devices: Infusion Pumps,” 2010,
http://www.fda.gov/infusionpumps.
[6] http://www.theregister.co.uk/2011/10/27/fatal insulin pump attack.
[7] National Diabetes Information Clearinghouse,
http://www.diabetes.niddk.nih.gov/dm/pubs/hypoglycemia/index.aspx.
[8] C. Li, A. Raghunathan and N. K. Jha, “Hijacking an Insulin Pump:
Security Attacks and Defenses for a Diabetes Therapy System”, in
Proc. of the 13th IEEE Intl. Conf. on e-Health NAS, pp. 150-156, 2011.
[9] J, Radcliffe.
https://media.blackhat.com/bh-us-11/Radcliffe/BH US 11
Radcliff Hacking Medical Devices WP.pdf
[10] D. Halperin, T. S. Heydt-Benjamin, B. Ransford, S. S. Clark, B. Defend, W. Morgan, K. Fu, T. Kohno, and W. H. Maisel, “Pacemakers
and implantable cardiac defibrillators: software radio attacks and
zero-power defenses,” in Proc. of the 2008 IEEE Symp. on SP’08, pp.
129-142, 2008.
[11] B. G. Kim, A. Ayoub, O. Sokolsky, I. Lee, P. Jones, Y. Zhang, and R.
Jetley, “Safety-Assured Development of the GPCA Infusion Pump
Software,” in Proc. of the Intl. Conf. on EMSOFT’11, Taipei, 2011.
[12] P. Inchingolo, S. Bergamasco, and M. Bon, “Medical data protection with a new generation of hardware authentication tokens,” in
Proc. of Mediterranean Conf. on Medical and Biological Engineering and
Computing, 2001.
[13] T. Denning, K. Fu, and T. Kohno, “Absence makes the heart grow
fonder: new directions for implantable medical device security,” in
Proc. of the 3rd Conf. on Hot topics on security, pp. 1-7, 2008.
[14] E. Freudenthal, R. Spring, and L. Estevez, “Practical techniques
for limiting disclosure of RF-equipped medical devices,” in Proc.
of Engineering in Medicine and Biology Workshop, pp. 82-85, 2007.
[15] K. B. Rasmussen, C. Castelluccia, T. Heydt-benjamin, S. Capkun,
“Proximity-based access control for implantable medical devices,”
in Proc. of ACM CCS ’09, pp. 410-419, 2009.
[16] X. Hei, X. Du, J. Wu, and F. Hu, “Defending Resource Depletion
Attacks on Implantable Medical Devices,” in Proc. of IEEE Globecom’10, pp. 1-5, 2010.
[17] X. Hei and X. Du, “Biometric-based Two-level Secure Access
Control for Implantable Medical Devices during Emergencies,” in
Proc. of IEEE INFOCOM’11, pp. 346-350, 2011.
[18] S. Gollakota, H. Hassanieh, B. Ransford, D. Katabi, and K. Fu,
“They can hear your heartbeats: Non-invasive security for implantable medical devices,” in Proc. ACM Conf. SIGCOMM’11, pp.
2-13, 2011.
[19] J. Sun, X. Zhu, C. Zhang, and Y. Fang, “HCPP: Cryptography
Based Secure EHR System for Patient Privacy and Emergency
Healthcare,” in Proc. of ICDCS’11, pp. 373-382, 2011.
[20] F. Xu, Z. Qin, C. C. Tan, B. Wang, and Q. Li, “IMDGuard: Securing
implantable medical devices with the external wearable guardian,”
In Proc. of IEEE INFOCOM’11, Shanghai, China, Apr. 2011.
[21] C. Popper, M. Strasser, and S. Capkun, “Jamming-resistant broadcast communication without shared keys,” In Proc. of USENIX
Security Symp.’09, 2009.
[22] O. Chipara, C. Lu, T. C. Bailey, and G. Roman, “Reliable Clinical
Monitoring using Wireless Sensor Networks: Experience in a Stepdown Hospital Unit,” in Proc. of ACM Conf. on SenSys’10, Zurich,
Switzerland, 2010.
[23] X. Liang, X. Li, R. Lu, X. Lin, and X. Shen, “Enabling Pervasive
Healthcare with Privacy Preservation in Smart Community”, in
Proc. of IEEE ICC’12, Ottawa, Canada, 2012.
[24] C. Cortes and V. Vapnik, “Support-vector networks”, J. of Machine
Learning, vol. 20, no. 3, pp. 273-297, 1995.
[25] http://en.wikipedia.org/wiki/Genetic algorithm.
[26] http://en.wikipedia.org/wiki/Cross-validation (statistics).
[27] X. Hei, X. Du, S. Lin, and I. Lee, “PIPAC: Patient Infusion Pattern
based Access Control Scheme for Wireless Insulin Pump System,”
in Proc. of IEEE INFOCOM 2013, Turin, Italy, Apr. 2013.
[28] X. Hei and X. Du, “Emerging Security Issues in Wireless Implantable Medical Devices”, Springer, 2013.
[29] X. Hei, X. Du, and S. Lin, “Poster: Near Field Communication
based Access Control for Wireless Medical Devices”, in Proc. of
ACM MobiHoC 2014.
[30] Ch. Li, “System design and verification methodologies for secure
computing”, PhD Thesis, 2012.
[31] D. F. Kune, J. Backes, S. S. Clark, D. B. Kramer, M. R. Reynolds,
K. Fu, Y. Kim, and W. Xu, “Ghost Talk: Mitigating EMI Signal
Injection Attacks against Analog Sensors”, in Proc. of the 34th IEEE
Symp. on SP’13, pp. 1-15, May. 2013.
1045-9219 (c) 2013 IEEE. Personal use is permitted, but republication/redistribution requires IEEE permission. See
http://www.ieee.org/publications_standards/publications/rights/index.html for more information.
This article has been accepted for publication in a future issue of this journal, but has not been fully edited. Content may change prior to final publication. Citation information: DOI
10.1109/TPDS.2014.2370045, IEEE Transactions on Parallel and Distributed Systems
14
[32] S. Hosseini-Khayat, “A lightweight security protocol for ultralow power asic implementation for wireless implantable medical
devices”, in Proc. of IEEE ISMICT’11, pp. 6-9, 2011.
[33] C. Beck, D. Masny, W. Geiselmann, and G. Bretthauer, “Block Cipher Based Security for Severely Resource-constrained Implantable
Medical Devices”, in Proc. of ACM ISABEL’11, pp. 62:1-62:5, 2011.
[34] Q. Pan, P. Yang, R. Zhang, C. Lin, S. Gong, L. Li, J. Yan, and G.
Ning, “A mobile health system design for home and community
use,” in Proc of BHI’12, 2012, pp. 116-119.
[35] R. H. Wouhaybi, M. D. Yarvis, P. Muse, C.-Y. Wan, S. Sharma,
S. Prasad, L. Durham, R. Sahni, R. Norton, M. Curry, H. Jimison,
R. Harper, and R. Lowe, “A Context-Management Framework for
Telemedicine: An Emergency Medicine Case Study,” in Proc. of
Wireless Health’10, pp. 167-173, 2010.
[36] E. D. Lehmann, C. Tarłn, J. Bondia, E. Teufel, and T. Deutsch, “
Incorporating a generic model of subcutaneous insulin absorption
into the AIDA v4 diabetes simulator: 2. preliminary bench testing,”
J. Diabetes Sci. Technol., vol.1, no.5, pp.780-93, 2007.
[37] R. Jetley and P. Jones, “Safety Requirements based Analysis of
Infusion Pump Software,” in Proc. of the Workshop on Software
and Systems for Medical Devices and Services, pp. 21-24, 2007.
[38] Y. Zhang, P. Jones and R. Jetley, “A Hazard Analysis for a Generic
Insulin Infusion Pump,” J. of Diabetes Sci. and Technol., vol. 4, no.
2, pp. 263-283, 2010.
[39] http://en.wikipedia.org/wiki/Shapiro%E2%80%93Wilk test.
[40] http://www.computerworld.com/article/2492453/malwarevulnerabilities/pacemaker-hack-can-deliver-deadly-830-voltjolt.html.
Xiali Hei is a 5-year Ph.D. candidate in the Department of Computer and Information Sciences
at Temple University, Philadelphia, USA. Her research interests include wireless network security, security of implantable medical devices and
security in cloud computing. She is a Technical
Program Committee (TPC) member of premier
IEEE conference GLOBECOM, ICC, CyberC,
and ICCVE. Xiali Hei is a Student Member of
IEEE and ACM.
Dr. Xiaojing (James) Du is currently an associate professor in the Department of Computer
and Information Sciences at Temple University. Dr. Du received his M.S. and Ph.D. degree
in electrical engineering from the University of
Maryland College Park in 2002 and 2003, respectively. Dr. Du was an Assistant Professor in
the Department of Computer Science at North
Dakota State University between August 2004
and July 2009, where he received the Excellence in Research Award in May 2009. His
research interests are security, cloud computing, wireless networks,
computer networks and systems. He has published over 120 journal
and conference papers in these areas. Dr. Du has been awarded more
than $3M research grants from the US National Science Foundation
(NSF), Army Research Office, Air Force Research Lab, NASA, the Commonwealth of Pennsylvania, and Amazon. He serves on the editorial
boards of four international journals. Dr. Du will serve as the Lead
Chair of the Communication and Information Security Symposium of the
IEEE ICC 2015, and a Co-Chair of the Mobile and Wireless Networks
Track of the IEEE WCNC 2015. He was the Chair of the Computer and
Network Security Symposium of the IEEE/ACM International Wireless
Communication and Mobile Computing conference 2006 - 2010. He is
(was) a Technical Program Committee (TPC) member of several premier
ACM/IEEE conferences such as INFOCOM (2007 - 2015), IM, NOMS,
ICC, GLOBECOM, WCNC, BroadNet, and IPCCC. Dr. Du is a Senior
Member of IEEE and a Life Member of ACM.
Shan Lin received his PhD in computer science
under the guidance of John Stankovic at University of Virgina in 2010. He is an Assistant
Professor of the CIS department, Temple University. His primary funded research areas are in
the areas of cyber physical systems, networked
information systems, and wireless sensor networks. In recent years, he has published papers
in major conferences and journals in these areas. He is currently a PI of three NSF research
grants.
Insup Lee is Cecilia Fitler Moore Professor of
Computer and Information Science and Director
of PRECISE Center at the University of Pennsylvania. He also holds a secondary appointment
in the Department of Electrical and Systems
Engineering. He received the Ph.D. in Computer
Science from the University of Wisconsin, Madison. His research interests include cyber physical systems (CPS), real-time embedded systems, formal methods and tools, high-confidence
medical device systems, and software engineering. He has served on many program committees and chaired many
international conferences and workshops. He has also served on various steering and advisory committees of technical societies, including
CPSWeek, ESWeek, ACM SIGBED, IEEE TC-RTS, RV, ATVA. He has
served on the editorial boards of the several scientific journals and is a
founding co-Editor-in-Chief of KIISE Journal of Computing Science and
Engineering (JCSE). He was Chair of IEEE Computer Society Technical
Committee on Real-Time Systems (2003-2004) and an IEEE CS Distinguished Visitor Speaker (2004-2006). He with his student received
the best paper award in RTSS 2003. He was a member of Technical
Advisory Group (TAG) of Presidents Council of Advisors on Science
and Technology (PCAST) Networking and Information Technology (NIT),
2006-2007. He is IEEE fellow and received IEEE TC-RTS Outstanding
Technical Achievement and Leadership Award in 2008.
Oleg Sokolsky is a Research Associate Professor of Computer and Information Science at the
University of Pennsylvania. His research interests include the application of formal methods to
the development of cyber-physical systems, architecture modeling and analysis, specificationbased monitoring, as well as software safety
certification. He received his Ph.D. in Computer
Science from Stony Brook University.
1045-9219 (c) 2013 IEEE. Personal use is permitted, but republication/redistribution requires IEEE permission. See
http://www.ieee.org/publications_standards/publications/rights/index.html for more information.