1
Model 1928-C
Optical Power Meter
User’s Manual
ii
Preface
iii
Preface
EU Declaration of Conformity
We declare that the accompanying product, identified with the
mark,
complies with the requirements of the Electromagnetic Compatibility Directive,
2004/108/EC and the Low Voltage Directive 73/23/EEC.
Model Number: 1928-C
Year
mark affixed: 2009
Type of Equipment: Electrical equipment for measurement, control and
laboratory use in industrial locations.
Manufacturer: Newport Corporation
1791 Deere Avenue
Irvine, CA 92606
Standards Applied:
Compliance was demonstrated to the following standards to the extent
applicable:
BS EN61326-1: 2006 “Electrical equipment for measurement, control and
laboratory use – EMC requirements”
This equipment meets the CISPR 11:2006+A2 Class A Group 1 radiated and
conducted emission limits.
BS EN 61010-1:2001, 2nd Edition “Safety requirements for electrical
equipment for measurement, control and laboratory use”
Bruno Rety
Group Director of PPT Instrument and Motion Europe
Zone Industrielle
45340 Beaune-la-Rolande, France
Sean E. LeCave
Sr. Manager Quality
1791 Deere Avenue
Irvine, CA USA
iv
Preface
Firmware and User Manual Updates
Dear Customer,
In an effort to keep the 1928-C Optical Power Meter
optimized for your applications, Newport will on occasion
update existing, and add new features to this instrument.
To utilize this new functionality will require an update to the
instrument's firmware, which can be easily accomplished by
the user, as described in this User Manual. As required,
Newport will also generate a new version of this User
Manual, reflecting updates to the instrument.
Please check the Newport website (www.Newport.com)
for newer versions of the firmware and the User Manual,
which can be downloaded as a PDF file. Call your local
Newport application specialist if you need support with
locating or downloading these files.
Enjoy your new instrument!
v
Preface
Warranty
Newport Corporation warrants that this product will be free from defects in
material and workmanship and will comply with Newport’s published
specifications at the time of sale for a period of one year from date of shipment.
If found to be defective during the warranty period, the product will either be
repaired or replaced at Newport's option.
To exercise this warranty, write or call your local Newport office or
representative, or contact Newport headquarters in Irvine, California. You will
be given prompt assistance and return instructions. Send the product, freight
prepaid, to the indicated service facility. Repairs will be made and the
instrument returned freight prepaid. Repaired products are warranted for the
remainder of the original warranty period or 90 days, whichever first occurs.
Limitation of Warranty
The above warranties do not apply to products which have been repaired or
modified without Newport’s written approval, or products subjected to unusual
physical, thermal or electrical stress, improper installation, misuse, abuse,
accident or negligence in use, storage, transportation or handling. This warranty
also does not apply to fuses, batteries, or damage from battery leakage.
THIS WARRANTY IS IN LIEU OF ALL OTHER WARRANTIES,
EXPRESSED OR IMPLIED, INCLUDING ANY IMPLIED WARRANTY OF
MERCHANTABILITY OR FITNESS FOR A PARTICULAR USE.
NEWPORT CORPORATION SHALL NOT BE LIABLE FOR ANY
INDIRECT, SPECIAL, OR CONSEQUENTIAL DAMAGES RESULTING
FROM THE PURCHASE OR USE OF ITS PRODUCTS.
First printing 2009
© 2009 by Newport Corporation, Irvine, CA. All rights reserved. No part of
this manual may be reproduced or copied without the prior written approval of
Newport Corporation.
This manual has been provided for information only and product specifications
are subject to change without notice. Any change will be reflected in future
printings.
Newport Corporation
1791 Deere Avenue
Irvine, CA, 92606
USA
Part No. 90022689, Rev. B
Firmware version 1.1.0
vi
Preface
Confidentiality & Proprietary Rights
Reservation of Title:
The Newport programs and all materials furnished or produced in connection
with them ("Related Materials") contain trade secrets of Newport and are for
use only in the manner expressly permitted. Newport claims and reserves all
rights and benefits afforded under law in the Programs provided by Newport
Corporation.
Newport shall retain full ownership of Intellectual Property Rights in and to all
development, process, align or assembly technologies developed and other
derivative work that may be developed by Newport. Customer shall not
challenge, or cause any third party to challenge the rights of Newport.
Preservation of Secrecy and Confidentiality and Restrictions to Access:
Customer shall protect the Newport Programs and Related Materials as trade
secrets of Newport, and shall devote its best efforts to ensure that all its
personnel protect the Newport Programs as trade secrets of Newport
Corporation. Customer shall not at any time disclose Newport's trade secrets to
any other person, firm, organization, or employee that does not need (consistent
with Customer's right of use hereunder) to obtain access to the Newport
Programs and Related Materials. These restrictions shall not apply to
information (1) generally known to the public or obtainable from public
sources; (2) readily apparent from the keyboard operations, visual display, or
output reports of the Programs; 3) previously in the possession of Customer or
subsequently developed or acquired without reliance on the Newport Programs;
or (4) approved by Newport for release without restriction.
Service Information
This section contains information regarding factory service for the source. The
user should not attempt any maintenance or service of the system or optional
equipment beyond the procedures outlined in this manual. Any problem that
cannot be resolved should be referred to Newport Corporation.
Copyright and Trademark Information
WINDOWSTM is a registered Trademark of Microsoft Corporation
LabVIEW is a registered Trademark of National Instruments INC.
Visual Basic is a registered Trademark of Microsoft Corporation.
Visual C++ is a registered Trademark of Microsoft Corporation.
vii
Preface
Technical Support Contacts
North America & Asia
Europe
Newport Corporation Service Dept.
1791 Deere Ave. Irvine, CA 92606
Telephone: (949) 253-1694
Telephone: (800) 222-6440 x31694
Newport/MICRO-CONTROLE S.A.
Zone Industrielle
45340 Beaune la Rolande, FRANCE
Telephone: (33) 02 38 40 51 56
Asia
Newport Opto-Electronics
Technologies
253 Aidu Road, Bld #3, Flr 3, Sec C,
Shanghai 200131, China
Telephone: +86-21-5046 2300
Fax: +86-21-5046 2323
Newport Corporation Calling Procedure
If there are any defects in material or workmanship or a failure to meet specifications,
promptly notify Newport's Returns Department by calling 1-800-222-6440 or by
visiting our website at www.newport.com/returns within the warranty period to obtain
a Return Material Authorization Number (RMA#). Return the product to Newport
Corporation, freight prepaid, clearly marked with the RMA# and we will either repair
or replace it at our discretion. Newport is not responsible for damage occurring in
transit and is not obligated to accept products returned without an RMA#.
E-mail: [email protected]
When calling Newport Corporation, please provide the customer care representative
with the following information:
•
•
•
Your Contact Information
Serial number or original order number
Description of problem (i.e., hardware or software)
To help our Technical Support Representatives diagnose your problem, please note the
following conditions:
•
•
•
•
Is the system used for manufacturing or research and development?
•
Can you identify anything that was different before this problem occurred?
What was the state of the system right before the problem?
Have you seen this problem before? If so, how often?
Can the system continue to operate with this problem? Or is the system nonoperational?
viii
Preface
IMPORTANT NOTE
Before plugging the instrument into a PC via a USB communication port, please make
sure that the USB Drivers are installed. Run Setup.exe from the Software CD that
came with your product. The installation program will configure the PC with the 1928-C
USB drivers.
ix
Preface
Table of Contents
EU Declaration of Conformity ............................................................... iii
Warranty ...................................................................................................v
Technical Support Contacts....................................................................vii
Table of Contents ....................................................................................ix
List of Figures....................................................................................... xiii
List of Tables .........................................................................................xiv
1
Safety Precautions
1.1
1.2
1.3
2
2.4
2.5
2.6
2.7
2.8
2.9
2.10
3
Definitions and Symbols.............................................................15
1.1.1 General Warning or Caution ........................................... 15
1.1.2 Electric Shock ................................................................. 15
1.1.3 Protective Conductor Terminal....................................... 15
1.1.4 European Union CE Mark .............................................. 16
1.1.5 Alternating voltage symbol............................................. 16
1.1.6 ON................................................................................... 16
1.1.7 OFF ................................................................................. 16
1.1.8 Fuses ............................................................................... 16
1.1.9 Frame or Chassis............................................................. 17
1.1.10 USB Connector Symbol.................................................. 17
1.1.11 Waste Electrical and Electronic Equipment (WEEE)..... 17
Warnings and Cautions ...............................................................18
1.2.1 General Warnings ........................................................... 18
1.2.2 General Cautions............................................................. 19
1.2.3 Summary of Warnings and Cautions .............................. 19
Location of Labels ......................................................................20
1.3.1 Rear Panel ....................................................................... 20
General Information
2.1
2.2
2.3
21
Introduction.................................................................................21
Calibration...................................................................................22
Specifications ..............................................................................22
2.3.1 Physical Specifications: .................................................. 22
2.3.2 Electrical Specifications.................................................. 23
Unpacking and Handling ............................................................24
Inspection for Damage ................................................................24
Available Options and Accessories.............................................25
Parts List .....................................................................................25
Choosing and Preparing a Suitable Work Surface......................25
Electrical Requirements ..............................................................25
Power Supply ..............................................................................26
System Overview
3.1
3.2
15
27
Startup Procedure........................................................................27
Front Panel Layout......................................................................27
3.2.1 Front Panel Elements ...................................................... 28
x
Preface
3.3
4
System Operation
4.1
4.2
4.3
4.4
4.5
4.6
4.7
4.8
4.9
4.10
4.11
4.12
5
5.9
31
Front Panel Power Standby Key................................................. 31
4.1.1 Standby Key ................................................................... 31
Front Panel Keys ........................................................................ 32
4.2.1 Setup/Enter Key.............................................................. 32
4.2.2 Esc Key........................................................................... 33
4.2.3 Navigation and Selection Keys....................................... 33
4.2.4 Soft Keys ........................................................................ 34
4.2.5 Dedicated Keys............................................................... 34
Measurement Settings................................................................. 38
4.3.1 Changing the Measurement Settings .............................. 38
4.3.2 Detector Information ...................................................... 40
Trigger Setup .............................................................................. 41
4.4.1 Trigger Start.................................................................... 41
4.4.2 Trigger Stop.................................................................... 41
Wavelength Setting..................................................................... 42
Display Color.............................................................................. 42
USB Address .............................................................................. 43
Statistics...................................................................................... 44
4.8.1 Graph .............................................................................. 45
Math Functions ........................................................................... 45
Measurement Correction Settings .............................................. 46
Display Modes............................................................................ 47
4.11.1 Numeric Display............................................................. 47
4.11.2 Min-Max Bar .................................................................. 48
4.11.3 Analog Needle ................................................................ 49
4.11.4 Vertical Chart ................................................................. 50
4.11.5 Analog Gauge ................................................................. 51
Optical Power Meter Firmware Upgrade Procedure .................. 52
Performing Basic Measurements
5.1
5.2
5.3
5.4
5.5
5.6
5.7
5.8
6
3.2.2 Understanding the Main Screen ..................................... 28
Rear Panel Layout ...................................................................... 28
3.3.1 Rear Panel Elements....................................................... 29
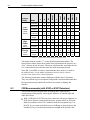
53
Introduction ................................................................................ 53
Measurement Modes and Units .................................................. 53
CW Measurements (with 918D or 818P Detectors)................... 54
Peak-to-Peak Power Measurements (918D Detectors) .............. 55
Power Ratio and Power Reference measurements ..................... 56
Pulse Energy Measurements (818E Detectors) .......................... 56
Signal Integration Measurements (918D or 818P Detectors)..... 57
Measuring Laser Pulse Energy with an 818P Thermopile Detector
(Single Shot)............................................................................... 57
RMS Measurements ................................................................... 59
Software Application
61
xi
Preface
6.1
6.2
6.3
6.4
7
Computer Interfacing
7.1
7.2
7.3
8
9.11
97
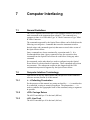
Introduction.................................................................................97
Analog Signal Flow ....................................................................97
Digitized Signal Flow .................................................................98
Typical Detector Signals.............................................................99
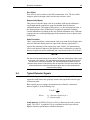
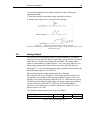
Thermopile Detector Signals ....................................................100
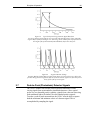
Pulse Energy Detector Signals..................................................100
Peak-to-Peak (Photodiode) Detector Signals............................101
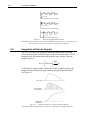
Integration of Detector Signals .................................................102
Analog Output...........................................................................103
Measurement Considerations....................................................104
9.10.1 Detector Calibration and Uncertainty ........................... 104
9.10.2 Quantum Detector Temperature Effects ....................... 104
9.10.3 Thermopile Detector Temperature Effects ................... 105
9.10.4 Energy Detector Temperature Effects........................... 105
9.10.5 Ambient and Stray Light............................................... 105
9.10.6 Signal Filtering.............................................................. 106
Common Measurement Errors ..................................................107
10 Troubleshooting
10.1
10.2
10.3
65
1928-C Optical Power Meter Remote Interface Commands ......65
Command Overview ...................................................................65
Optical Power Meter Command Description..............................66
8.3.1 Command Glossary......................................................... 66
8.3.2 Display Commands ......................................................... 68
8.3.3 Optical Power Meter Commands.................................... 69
Principles of Operation
9.1
9.2
9.3
9.4
9.5
9.6
9.7
9.8
9.9
9.10
63
General Guidelines......................................................................63
Computer Interface Terminology................................................63
7.2.1 <…> Delimiting Punctuation.......................................... 63
7.2.2 <CR> Carriage Return .................................................... 63
7.2.3 <LF> Line Feed .............................................................. 63
7.2.4 (;) Semicolons ................................................................. 64
7.2.5 <number> Numerical Types ........................................... 64
7.2.6 <string> String Types ..................................................... 64
USB Communication ..................................................................64
Communication Command Reference
8.1
8.2
8.3
9
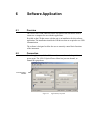
Overview.....................................................................................61
Connection ..................................................................................61
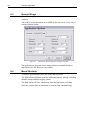
General Usage .............................................................................62
Menu Structure............................................................................62
109
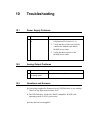
Power Supply Problems ............................................................109
Analog Output Problems...........................................................109
Questions and Answers.............................................................109
xii
Preface
11 Maintenance and Service
11.1
11.2
11.3
Enclosure Cleaning................................................................... 111
Obtaining Service ..................................................................... 111
Service Form............................................................................. 112
12 Appendix A – Syntax and Definitions
12.1
12.2
113
Definition of <string>............................................................... 113
Definition of <number>............................................................ 114
13 Appendix B – Error Messages
13.1
13.2
13.3
13.4
111
117
Introduction .............................................................................. 117
Command Errors....................................................................... 117
Execution Errors ....................................................................... 118
Device Errors............................................................................ 119
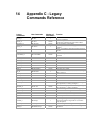
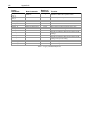
14 Appendix C - Legacy Commands Reference
121
15 Appendix D – Sample Programs
123
15.1
15.2
15.3
15.4
15.5
Programming Samples.............................................................. 123
LabVIEW.................................................................................. 123
Microsoft® Visual Basic .......................................................... 123
Microsoft Visual C++............................................................... 123
Microsoft .NET......................................................................... 123
16 Appendix E – Disassembly Instructions
16.1
125
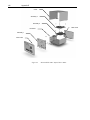
Disassembly instructions .......................................................... 125
xiii
Preface
List of Figures
Figure 1
Figure 2
Figure 3
Figure 4
Figure 5
Figure 6
Figure 7
Figure 8
Figure 9
Figure 10
Figure 11
Figure 12
Figure 13
Figure 14
Figure 15
Figure 16
Figure 17
Figure 18
Figure 19
Figure 20
Figure 21
Figure 22
Figure 23
Figure 24
Figure 25
Figure 26
Figure 27
Figure 28
Figure 29
Figure 30
Figure 31
Figure 32
Figure 33
Figure 34
Figure 35
Figure 36
Figure 37
Figure 38
Figure 39
Figure 40
Figure 41
Figure 42
Figure 43
General Warning or Caution Symbol .............................................15
Electrical Shock Symbol ................................................................15
Protective Conductor Terminal Symbol .........................................15
CE Mark .........................................................................................16
Alternating Voltage Symbol...........................................................16
On Symbol......................................................................................16
Off Symbol .....................................................................................16
Fuse Symbol ...................................................................................17
Frame or Chassis Terminal Symbol ...............................................17
USB connector Symbol ..................................................................17
WEEE Directive Symbol................................................................17
Locations of labels on the rear panel ..............................................20
Front Panel Layout .........................................................................27
Rear panel .......................................................................................28
Standby Key ...................................................................................31
Front Panel keys .............................................................................32
Navigation/Selection and Setup/Enter keys ...................................32
Main screen.....................................................................................33
Measurement Settings screen .........................................................33
Soft keys .........................................................................................34
Dedicated keys................................................................................34
Manual Range mode.......................................................................35
Auto Range mode ...........................................................................35
This screen is displayed after pressing the Config soft key ...........35
Mode selection screen ....................................................................36
Measurement is on hold..................................................................36
Filter selection screen .....................................................................36
Filter configuration screen..............................................................37
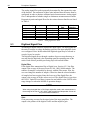
Digital Filter editing .......................................................................37
Wavelengths screen ........................................................................37
Zero Selection.................................................................................38
Measurement Settings screen .........................................................38
Accessing the Trigger Setup screen................................................41
Predefined color schemes ...............................................................42
Setup screen....................................................................................43
System Settings screen ...................................................................43
About screen ...................................................................................43
Statistics screen...............................................................................44
Graph screen ...................................................................................45
Math field .......................................................................................45
Math configuration screen ..............................................................46
Measurement Settings.....................................................................46
Correction Settings .........................................................................47
xiv
Preface
Figure 44
Figure 45
Figure 46
Figure 47
Figure 48
Figure 49
Figure 50
Figure 51
Figure 52
Figure 53
Figure 54
Figure 55
Figure 56
Figure 57
Figure 58
Figure 59
Figure 60
Figure 61
Figure 62
Figure 63
Figure 64
Mode selection screen .................................................................... 47
The Numeric display ...................................................................... 47
Analog Bar ..................................................................................... 48
Auto Zoom ..................................................................................... 48
Analog Needle display ................................................................... 49
Vertical chart with 10 measurements per line................................ 50
Vertical chart with 1 measurement per line ................................... 50
Analog Gauge Display ................................................................... 51
Analog Gauge Display with Maximum Value marker................... 51
Analog Gauge Display at 50x Zoom.............................................. 51
Measuring Laser Pulse Energy via a Thermopile in CW Integrate
Mode .............................................................................................. 58
Application front panel................................................................... 61
Application Advanced Options (Configuration Tab)..................... 62
1928-C Optical Power Meter Analog Signal Flow Diagram ......... 97
Thermopile Signals exhibit 1 to 10 second time constants. ......... 100
Typical Newport Energy Detector Signal Waveform .................. 101
Negative Baseline Voltage. .......................................................... 101
Time Varying Signal Measurements............................................ 102
Integrated Energy Via a Trapezoid Approximation..................... 102
Measuring Laser Pulse Energy with a Thermopile. ..................... 103
Disassembled 1928-C Optical Power Meter ................................ 126
List of Tables
Table 1
Table 2
Table 3
Table 4
Table 5
Table 6
Table 7
Available Measurement Modes and Valid Units. .......................... 54
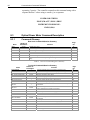
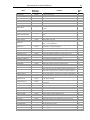
Root level Commands/Queries Summary ...................................... 66
Tree Level Commands/Queries Summary ..................................... 68
Analog Signal Flow Paths. ............................................................. 98
Analog Output Range Table......................................................... 103
Common Measurement Errors ..................................................... 107
Legacy Commands Reference...................................................... 122
1
Safety Precautions
1.1
Definitions and Symbols
The following terms and symbols are used in this documentation and also
appear on the 1928-C Optical Power Meter where safety-related issues occur.
1.1.1
General Warning or Caution
Figure 1
General Warning or Caution Symbol
The Exclamation Symbol in the figure above appears in Warning and Caution
tables throughout this document. This symbol designates an area where
personal injury or damage to the equipment is possible.
1.1.2
Electric Shock
Figure 2
Electrical Shock Symbol
The Electrical Shock Symbol in the figure above appears throughout this
manual. This symbol indicates a hazard arising from dangerous voltage.
Any mishandling could result in irreparable damage to the equipment, and
personal injury or death.
1.1.3
Protective Conductor Terminal
Figure 3
Protective Conductor Terminal Symbol
The protective conductor terminal symbol in the above figure identifies the
location of the bonding terminal, which is bonded to conductive accessible
parts of the enclosure for safety purposes.
16
Safety Precautions
1.1.4
European Union CE Mark
Figure 4
CE Mark
The presence of the CE Mark on Newport Corporation equipment means that
it has been designed, tested and certified as complying with all applicable
European Union (CE) regulations and recommendations.
1.1.5
~
Alternating voltage symbol
Figure 5
Alternating Voltage Symbol
This international symbol implies an alternating voltage or current.
1.1.6
ON
I
Figure 6
On Symbol
The symbol in the figure above represents a power switch position on the
Model 1928-C Optical Power Meter. This symbol represents a Power On
condition.
1.1.7
OFF
Figure 7
Off Symbol
The symbol in the figure above represents a power switch position on the
Model 1928-C Optical Power Meter. This symbol represents a Power Off
condition.
1.1.8
Fuses
Safety Precautions
17
Figure 8
Fuse Symbol
The fuse symbol in the figure above identifies the fuse location on the Model
1928-C Optical Power Meter.
1.1.9
Frame or Chassis
Figure 9
Frame or Chassis Terminal Symbol
The symbol in the figure above appears on the 1928-C Optical Power Meter.
This symbol identifies the frame or chassis terminal
1.1.10
USB Connector Symbol
Figure 10
USB connector Symbol
The USB connector symbol in the above figure identifies the location of the
USB communications connector.
1.1.11
Waste Electrical and Electronic Equipment (WEEE)
Figure 11
WEEE Directive Symbol
This symbol on the product or on its packaging indicates that this product
must not be disposed of with regular waste. Instead, it is the user
responsibility to dispose of waste equipment according to the local laws. The
separate collection and recycling of the waste equipment at the time of
disposal will help to conserve natural resources and ensure that it is recycled
in a manner that protects human health and the environment. For information
about where the user can drop off the waste equipment for recycling, please
18
Safety Precautions
contact your local Newport Corporation representative. See Section 16 for
instructions on how to disassemble the equipment for recycling purposes.
1.2
Warnings and Cautions
The following are definitions of the Warnings, Cautions and Notes that are
used throughout this manual to call your attention to important information
regarding your safety, the safety and preservation of your equipment or an
important tip.
WARNING
Situation has the potential to cause bodily harm or death.
CAUTION
Situation has the potential to cause damage to property or
equipment.
NOTE
Additional information the user or operator should consider.
1.2.1
General Warnings
Observe these general warnings when operating or servicing this equipment:
• Heed all warnings on the unit and in the operating instructions.
• Do not use this equipment in or near water.
• This equipment is grounded through the grounding conductor of the
•
•
•
•
•
•
power cord.
Route power cords and other cables so they are not likely to be damaged.
Disconnect power before cleaning the equipment. Do not use liquid or
aerosol cleaners; use only a damp lint-free cloth.
Lockout all electrical power sources before servicing the equipment.
To avoid fire hazard, use only the specified fuse(s) with the correct type
number, voltage and current ratings as referenced in the appropriate
locations in the service instructions or on the equipment. Only qualified
service personnel should replace fuses.
To avoid explosion, do not operate this equipment in an explosive
atmosphere.
Qualified service personnel should perform safety checks after any
service.
Safety Precautions
1.2.2
19
General Cautions
Observe these cautions when operating or servicing this equipment:
• If this equipment is used in a manner not specified in this manual, the
•
•
•
•
•
•
•
•
•
protection provided by this equipment may be impaired.
To prevent damage to equipment when replacing fuses, locate and correct
the problem that caused the fuse to blow before re-applying power.
Do not block ventilation openings.
Do not position this product in such a manner that would make it difficult
to disconnect the power cord.
Use only the specified replacement parts.
Follow precautions for static sensitive devices when handling this
equipment.
This product should only be powered as described in the manual.
There are no user-serviceable parts inside the 1928-C Optical Power
Meter.
To prevent damage to the equipment, read the instructions in the
equipment manual for proper input voltage.
Adhere to good laser safety practices when using this equipment.
1.2.3
Summary of Warnings and Cautions
The following general warning and cautions are applicable to this instrument:
WARNING
Before operating the Model 1928-C Optical Power Meter, please
read and understand all of Section 1.
WARNING
Do not attempt to operate this equipment if there is evidence of
shipping damage or you suspect the unit is damaged. Damaged
equipment may present additional hazards to you. Contact
Newport technical support for advice before attempting to plug
in and operate damaged equipment.
WARNING
To avoid electric shock, connect the instrument to properly
earth-grounded, 3-prong receptacles only. Failure to observe
this precaution can result in severe injury.
WARNING
Before cleaning the enclosure of the Model 1928-C Optical Power
20
Safety Precautions
Meter, the AC power cord must be disconnected from the wall
socket.
CAUTION
There are no user serviceable parts inside the Model 1928-C
Optical Power Meter. Work performed by persons not authorized
by Newport Corporation will void the warranty. For instructions
on obtaining warranty repair or service, please refer to Section
11.
1.3
Location of Labels
1.3.1
Rear Panel
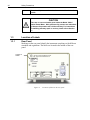
Markings on the rear panel identify the instrument compliance with different
standards and regulations. The labels are located in the middle of the rear
panel.
Location of
Labels
Figure 12
Locations of labels on the rear panel
2
General Information
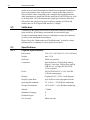
2.1
Introduction
The 1928-C Optical Power Meter is designed to provide a powerful
combination of features to measure optical power and energy of nearmonochromatic or monochromatic sources. The instrument is powered by an
AC wall-plug.
Use of the extensive measurement modes and features has been simplified
with an intuitive menu driven structure that provides quick access to all
modes, features and settings. Some of the prominent specifications and
features that will simplify your calibrated measurement applications are the
following:
•
•
•
•
•
•
•
Compatibility with Photodiode, Thermopile and Pyroelectric detectors.
(Low-Power (Semiconductor) Family, High-Power (Thermopile)
Family, Energy (Pyroelectric) Family, PMT, GaN, PbS, PbSe, and
HgCdZnTe)
Measurement rate up to 4 kHz with internal signal sampling rate of
250 kHz.
Multiple measurement modes for power and energy measurements:
Single, Continuous, Integrated, and Peak-to-Peak.
Software suite, including LabVIEW drivers and Windows application.
250,000 internal data point storage.
External USB flash-memory compatibility.
USB Device interface.
The full color TFT 4” LCD renders excellent visibility both with the naked
eye and laser goggles for single screen rendering of plotted and enumerated
results. Measurements can be displayed in Watts, Joules, Amperes, Volts,
dBm, dB, Sun or relative units, either directly or as relative ratio
measurements from present or stored values. Statistical capabilities include
the computation of Min, Max, Max-Min, Mean and Standard Deviation.
Additional features such as digital and analog filtering, and data storage of up
to 250,000 readings per channel are also offered.
Newport’s experience with calibration, together with N.I.S.T. calibration
traceability and high precision Optical Power Meters provide users with
accurate measurements and exceptional inter-instrument correlation. In R&D,
QA/QC, and manufacturing environments, the 1928-C Optical Power Meters
22
General Information
enable users to benefit from high correlation between multiple locations at a
price-to-performance ratio second to none. Among all the other practical
tools provided, remote controlling with a computer and synchronization to
other instruments are simplified with the inclusion of LabVIEW drivers, tools
to develop in the .NET environment and a high-speed software utility that
fully utilizes the optical power meter’s ability to sample at 250 kHz and
transfer data via a Full-Speed USB interface (11 Mbps).
2.2
Calibration
Calibration of the optical power meter is done at the factory by defining a
slope and offset, for all ranges as determined for each detector type.
Newport recommends annual factory re-calibration to ensure the continued
accuracy of the instrument measurements.
Please refer to the “Maintenance and Troubleshooting” section for contact
information for re-calibration of your optical power meter.
2.3
Specifications
2.3.1
Physical Specifications:
Dimensions:
5.24 x 8.5 x 8.07 inch (133 x 216 x 205 mm)
Weight:
max. 5.5 lb
Enclosure:
Metal case, painted
Connectors:
Optical Detector 15-Pin D-Sub, Analog
Output 3.5 mm Jack, USB-A Host, mini-B
USB Device, AC Input IEC/EN 603201/C14 receptacle.
Power:
100/120/220/240VAC ± 10%, 50/60 Hz,
35 Watts (autoranging)
Display:
Graphical LCD ¼ VGA, 4 inch diagonal
Display Update Rate:
up to 20 Hz for selected graphical modes
Operating Environment:
5°C to 40°C; < 70% RH non-condensing
Storage Environment:
-20°C to 60°C; < 90% RH non-condensing
Altitude
< 3000m
Installation Category
II
Pollution Degree
2
Use Location
Indoor use only.
General Information
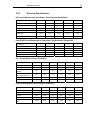
2.3.2
23
Electrical Specifications
DC Current Measurement (Low-Power, Semiconductor Photodiode)
Signal Range
2,3
0
1
2
3
4
2.50 µA
25.0 µA
250 µA
2.50 mA
25 mA
10 pA
100 pA
1.00 nA
10.0 nA
100 nA
480 Hz
4 kHz
43 kHz
170 kHz
500 kHz
Accuracy (Filtered)
0.2%
0.2%
0.2%
0.2%
0.2%
Accuracy (Maximum Measurement
Rate=4 kHz)
1.0%
1.0%
1.0%
1.0%
1.0%
120 dB
120 dB
120 dB
120 dB
120 dB
Full-Scale Current
Resolution (Filtered)
1
6
Bandwidth (Unfiltered)
1
Signal to Noise Ratio
1
Peak-Peak Current Measurement (Low-Power, Semiconductor Photodiode)
2,3
0
1
Full-Scale Current
2.50 µA
Resolution
76.3 pA
Signal Range
Accuracy
Bandwidth
6
Maximum Pulse Repetition Rate
4
2
3
4
25.0 µA
250 µA
2.50 mA
25 mA
763 pA
7.63 nA
76.3 nA
763 nA
1.0%
1.0%
1.0%
1.0%
1.0%
480 Hz
4 kHz
43 kHz
170 kHz
500 kHz
480 Hz
4 kHz
4 kHz
4 kHz
4 kHz
D.C. Voltage Measurement (Thermopile)
2,3
0
1
2
3
4
5
Full-Scale Voltage
2.5mV
25.0 mV
250 mV
2.50 V
25.0 V
130 V
Resolution
76.3 nV
763 nV
7.63 µV
76.3 µV
763 µV
3.96 mV
Accuracy
1
(Filtered)
0.2%
0.2%
0.2%
0.2%
0.2%
0.2%
Accuracy (Maximum
Measurement Rate=2 kHz)
1.0%
1.0%
1.0%
1.0%
1.0%
1.0%
600 kHz
1000 kHz
1000 kHz
1000 kHz
400 kHz
1000 kHz
100dB
120dB
130dB
130dB
130dB
120dB
Signal Range
Bandwidth
6
Signal to Noise Ratio
1
Pulse Voltage Measurement (Energy, Pyroelectric)
Signal Range
2,3
0
1
2
3
4
5
Full-Scale Current
2.5mV
25.0 mV
250 mV
2.50 V
25.0 V
130 V
Resolution
76.3 nV
763 nV
7.63 µV
76.3 µV
763 µV
3.96 mV
1.0%
1.0%
1.0%
1.0%
1.0%
1.0%
600 kHz
1000 kHz
1000 kHz
1000 kHz
400 kHz
1000 kHz
2 kHz
2 kHz
2 kHz
2 kHz
2 kHz
2 kHz
Accuracy
Bandwidth
6
Maximum Pulse Repetition
5
Rate
24
General Information
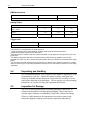
RMS Measurement
Maximum Pulse Repetition Rate
2 kHz
4 kHz
Accuracy
1.0%
2.0 %
Analog Output
Output Range
0
1
2
1V
2V
5V
Accuracy
1.0 %
1.0 %
1.0 %
Linearity
0.3%
0.3%
0.3%
Full Scale Voltage
(Load > 100 kΩ)
Trigger Level
Programmable Level
Resolution
0…100 % Full Scale
0.39 % Full Scale
1
With 5Hz filter on and Digital Filter of 10000 samples on.
Listed signal ranges specify meter capability. Available signal ranges are detector dependent.
3
Maximum measurable signal is detector dependent.
4
While the maximum repetition range may equal the bandwidth, it really depends on the signal duty-cycle or the
signal shape.
5
The Maximum Repetition Rate refers to the meter pulse-by-pulse measuring capability. Due to its high
bandwidth, the 1928-C can take in signals with higher repetitive rates and outputs them undistorted at the Analog
Output.
6
The instrument bandwidth is determined by the detector used. Please refer to Newport Corporation’s complete
offering on detector type. The specified bandwidth is measured from the instrument input (detector) to the Analog
Output BNC.
2
2.4
Unpacking and Handling
It is recommended that the 1928-C Optical Power Meter be unpacked in a lab
environment or work site. Unpack the system carefully; small parts and
cables are included with the instrument. Inspect the box carefully for loose
parts before disposing of the packaging. You are urged to save the packaging
material in case you need to ship your equipment in the future.
2.5
Inspection for Damage
The 1928-C Optical Power Meter is carefully packaged at the factory to
minimize the possibility of damage during shipping. Inspect the box for
external signs of damage or mishandling. Inspect the contents for damage.
If there is visible damage to the instrument or accessories upon receipt,
inform the shipping company and Newport Corporation immediately.
General Information
25
WARNING
Do not attempt to operate this equipment if there is evidence of
shipping damage or you suspect the unit is damaged. Damaged
equipment may present additional hazards to you. Contact
Newport technical support for advice before attempting to plug
in and operate damaged equipment.
2.6
Available Options and Accessories
Newport Corporation also supplies temperature controlled mounts, lenses,
and other accessories. Please consult with your representative for additional
information.
2.7
Parts List
The following is a list of parts included with the 1928-C Optical Power
Meter:
1. A CD-ROM containing the User’s Manual, Software Drivers and Utilities.
(A PDF version of the manual can also be downloaded from the Newport
website at www.newport.com).
2. Power cord
If you are missing any of these items or have questions about the items you
have received, please contact Newport Corporation.
2.8
Choosing and Preparing a Suitable Work Surface
The 1928-C Optical Power Meter may be placed on any reasonably firm table
or bench during operation. The front legs of the unit can be pulled out to tilt
the unit at an angle, if desired.
Provide adequate distance between the 1928-C Optical Power Meter and
adjacent walls for ventilation purposes. Approximately 2-inch spacing for all
surfaces is adequate.
2.9
Electrical Requirements
Before attempting to power up the unit for the first time, the following
precautions must be followed:
WARNING
To avoid electric shock, connect the instrument to properly
earth-grounded, 3-prong receptacles only. Failure to observe
this precaution can result in severe injury.
26
General Information
• Have a qualified electrician verify the wall socket that will be used is
properly polarized and properly grounded.
• Verify the correct rated fuses are installed according to the fuse marking
on the rear panel.
2.10
Power Supply
AC power is supplied through the rear panel input power connector that
provides in-line transient protection and RF filtering. The input power
connector contains the fuses for operation at 100VAC, 120VAC, 220VAC or
240VAC.
CAUTION
Do not operate with a line voltage that is not within 90-264 VAC.
3
System Overview
3.1
Startup Procedure
WARNING
To avoid electric shock, connect the instrument to properly
earth-grounded, 3-prong receptacles only. Failure to observe
this precaution can result in severe injury.
Provided that the Optical Power Meter has been installed in an appropriate
environment and its external power supply power cord is connected to a
working electrical outlet, power-up the Optical Power Meter by pressing the
power button on the back panel.
For the highest precision and accuracy, the 1928-C Optical Power Meter
should be allowed to warm up for one hour before being used for
measurements.
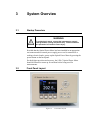
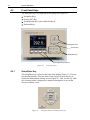
3.2
Front Panel Layout
Figure 13
Front Panel Layout
28
System Overview
3.2.1
Front Panel Elements
The front panel of the 1928-C features the following elements:
•
•
•
•
A faceplate with a 4” active color liquid crystal display
Setup/Enter and Esc keys
Rubberized horizontal (left/right) and vertical (up/down) arrow keys
Four rubberized blank keys below the display (referred to as “soft keys”
later in the manual, as their function depends on the text on the screen
above the key.) The leftmost key is also the Standby key.
• Six rubberized buttons with dedicated functions – Range, Mode, Hold,
Filter, Lambda (λ), and Zero.
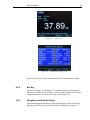
3.2.2
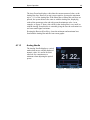
Understanding the Main Screen
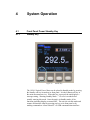
The main screen is displayed after startup (Figure 13). The middle portion of
the main screen is a real-time display of power measured in last used units, and
the lower half of the main screen is a row of four labels for actions that the
keys below them will activate.
When an annunciator label is visible, its function is enabled. If the
annunciator appears on the display as an unlabeled key, the function it
represents is currently disabled. Annunciators loosely correspond to keypad
keys, which are used either alone or in combination with the navigation and
selection keys to control annunciator functions.
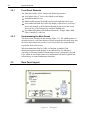
3.3
Rear Panel Layout
Figure 14
Rear panel
System Overview
3.3.1
29
Rear Panel Elements
The rear panel of the 1928-C features the following elements (Figure 14):
Main Power Switch
The Main Power Switch is located on the rear panel. It is part of the AC
power input connector. When the power is on, the meter can go in Standby
mode by pushing the Standby key on the front panel.
Input Connectors
The input connectors are on the rear panel. The 1928-C power meter supports
input from external detectors through DB15 detector connectors.
Output Connectors
The power meter 1928-C supports an analog output. This is a 3.5 mm Jack
Output and enables direct monitoring of a detector through an oscilloscope or
voltmeter. The monitoring channel is analog. Because of that, the signal is
visualized in real time.
Mini USB Connector labeled PC
This connector is used for sending remote commands to the Optical Power
Meter from a PC. The connection to a computer is done via a USB cable
Type "A" Male Connector to Type "Mini-B" Male Connector.
USB “A” connector labeled FLASH DRIVE
This connector is used for saving the data on a USB flash drive and for
firmware upgrades.
CAUTION
There are no user-serviceable parts inside the Optical Power
Meter.
Work performed inside the Optical Power Meter by persons not
authorized by Newport may void the warranty.
WARNING
To avoid electrical shock hazard, connect the instrument to
properly earth-grounded, 3-prong receptacles only. Failure to
observe this precaution can result in severe injury.
30
System Overview
This page is intentionally left blank
4
System Operation
4.1
Front Panel Power Standby Key
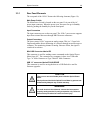
4.1.1
Standby Key
Figure 15
Standby Key
The 1928-C Optical Power Meter can be placed in Standby mode by pressing
the Standby soft key located on its front panel. It is the leftmost soft key in
the main measurement view. When this key is pressed, the unit displays a
message stating, “Entering Standby Mode…” for a few seconds before
actually entering this mode. Once the unit is in Standby mode, all its
functions including display are turned OFF. The unit can exit this mode and
resume all functions either by pressing any key on its front panel or by
sending commands to it from a host PC via USB communication interface.
32
System Operation
4.2
Front Panel Keys
The front panel keys are organized in four groups (see Figure 16).
•
•
•
•
Navigation Keys
Escape (ESC) Key
Reconfigurable Keys (also called Soft Keys).
Dedicated Keys
Navigation Keys
Escape Key
Dedicated Keys
Reconfigurable (Soft) Keys
Figure 16
4.2.1
Front Panel keys
Setup/Enter Key
The Setup/Enter key is placed to the right of the display (Figure 17). This key
has dual functionality. From the main screen (Figure 18) press this key to
display the Measurement Settings screen (Figure 19). Also, use this key while
any secondary menu is displayed to complete entering data, or to exit the
current secondary screen.
Figure 17
Navigation/Selection and Setup/Enter keys
System Operation
33
Figure 18
Figure 19
Main screen
Measurement Settings screen
Refer to Section 4.3 for more information about the measurement settings.
4.2.2
Esc Key
The Esc key (Figure 16 and Figure 17) is used to cancel the current action.
When in a secondary screen or menu, it will close the current screen or menu
and the instrument will return to the main screen (Figure 18).
4.2.3
Navigation and Selection Keys
Navigation through and selection of data in the display is done with the top
right group of four arrows keys and with the Setup/Enter key (Figure 17).
34
System Operation
If the instrument is in Setup mode or in any configuration screens, pressing
the arrow keys will select different setup modes as displayed by the current
screen.
4.2.4
Soft Keys
Below the screen are a group of four keys (Figure 20). Their function varies,
depending on the measurement mode or the setup screen. They are designed
to provide context sensitive functionality to the user. The label displayed
above each key indicates their function.
Figure 20
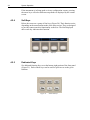
4.2.5
Soft keys
Dedicated Keys
Six dedicated function keys are at the bottom right portion of the front panel
(Figure 21). Each of these keys can be used for quick access to the given
function.
Figure 21
Dedicated keys
System Operation
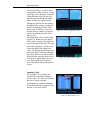
35
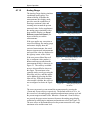
Range
Pressing this key reconfigures the
Soft keys at the bottom of the
screen as in Figure 22.
From this screen the user has two
options.
• One is to toggle Auto/Manual
Range mode. This is accomplished
by pressing the left-most Soft key.
If the meter current configuration
is Manual mode the left-most Soft
key is labeled Auto to allow the
user to change the Range selection
in Auto Range Mode. This can be
seen in Figure 22, where the range
is 110.0 µW indicating a manual
mode.
If the instrument is in Auto Range
Mode, the left most key is labeled
Manual. The user may return to
the main screen by pressing the
ESC key (see Figure 23).
• The other option is to press the
right-most Soft key, which is
labeled Config. This action
displays the Range Configuration
screen. Here the user can select a
certain range or even Auto Range
with the Navigation/Enter keys.
The number of ranges depends
on the detector used (see
Section 2.3.2). Once a range is
selected the instrument returns to
the main screen. While in Range
Configuration screen, the user
may cancel the selection by
hitting the ESC key.
Figure 22
Figure 23
Manual Range mode
Auto Range mode
Figure 24 This screen is displayed after
pressing the Config soft key
36
System Operation
Mode
The Mode key displays a screen as in
Figure 25. Using Navigation/Enter
keys, the user can select different
measurement modes or display modes
according to his/her application. The
ESC key cancels the selection and
brings the instrument back to the main
screen.
Figure 25
Mode selection screen
Hold
The Hold key toggles between holding
the current measurement and updating
regularly. When in Hold mode the
numeric display freezes and the upper
left corner of the display reads Hold
(see Figure 26).
The display starts updating when the
Hold key is pressed again. The ESC
key has no effect on Hold status.
Figure 26
Measurement is on hold
Filter
The Filter key allows the user to apply
Analog and/or Digital filters to the
detector signal. Pressing this key
reconfigures the Soft keys at the
bottom of the screen as in Figure 27.
Counting from left to right, the first
key applies only the analog filter to the
detector signal, the second applies only
the digital filter, and the third applies
both filters. When the filters are
selected, the corresponding label above
the soft key has a highlighted
background and the filter name is
displayed in the upper left corner.
Figure 27 Filter selection screen
System Operation
The fourth Soft key is used for filter
configuration. When selected, a screen
as in Figure 28 is displayed. Using the
Navigation/Enter keys the user can
select the desired analog and digital
filters. If Enter key is pressed after
making the selection, the new analog
and digital filter settings are applied,
and the instrument goes back to the
main screen. If ESC key is pressed
instead, the new settings are ignored
and the instrument goes back to the
main screen.
The digital filter values can be edited
(Figure 29). When one of the digital
filter values is selected, the right most
soft key becomes Edit Value. Pressing
this Soft key displays a cursor on top
of the first digit of the edited filter
value. The Navigation Up/Down keys
modify the digit, while the Left/Right
keys move the cursor to the next digit.
When finished, press the Enter key to
store the new digital filter value and
press Enter again to select the new
value and exit the Filter configuration
screen.
37
Figure 28
Filter configuration screen
Figure 29
Digital Filter editing
Lambda (λ) Key
The Lambda (λ) key displays the
Default and Custom Wavelengths
screen (Figure 30). This screen allows
the user to choose a default
wavelength or a custom wavelength
for the measurement in progress. See
Section 4.5 for more details.
Figure 30 Wavelengths screen
38
System Operation
Set Zero Offset (Zero Key)
The Zero Offset key, or short, Zero
key is used to temporarily zero the
instrument for the measurement in
progress. When the user presses this
key, the instrument takes the displayed
numeric value as offset and subtracts it
from all the subsequent measurements.
When the instrument is zeroed the
offset value is displayed on the main
screen above the numeric value (see
Figure 31).
The Zero key toggles the offset on or
off. The ESC key has no effect on the
Zero function.
4.3
Figure 31 Zero Selection
Measurement Settings
The Measurement Settings screen has
dual functionality:
• One is the convenience the user has
to change all the measurement
settings within one screen.
• The other is information presented
to the user about the detector used.
From the main measurement screen,
pressing the Setup/Enter key causes
the 1928-C to display the
Measurement Settings screen as in
Figure 32.
4.3.1
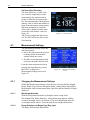
Figure 32
Measurement Settings
screen
Changing the Measurement Settings
Within the Measurement Settings screen the user can select the Wavelength,
Range, Range Type, Detector Attenuator Status, Analog Filter, Digital Filter,
Measurement Units, Measurement Mode, Spot Size and the Number of Digits
displayed.
4.3.1.1
Wavelength Selection
With the Navigation/Selection keys bring the cursor on top of the
Wavelength field. Hit the Enter key. A drop-down menu appears with the
custom wavelength values (see Section 4.5 for more information about the
wavelength custom values). Select the desired wavelength and hit Enter.
4.3.1.2
Range Selection and Range Type (Rng. type)
The Range field has dual functionality:
System Operation
39
• One is to display the current selected range whether it was selected by the
user, in Manual Range Mode, or by the system, in Auto Range Mode.
• The other is to allow the user to change the range.
With the Navigation/Selection keys bring the cursor on top of the Range
field. Hit the Enter key. A drop-down menu appears with the available ranges
in the selected units. Select the desired range and hit Enter.
If the unit was in Auto Range mode, once a range is selected here, it will
switch the system to Manual Range Mode. To bring it back to Auto Range
Mode, navigate to Range Type (Rng. type) and change the range to Auto
Range Mode. Also, the user has another option to bring the Optical Power
Meter back into the Auto Range Mode. This can be done from the default
screen where the user can change the Range to Auto Range Mode with the
Range Dedicated key (see Section 4.2.5).
4.3.1.3
Attenuator On/Off
If the detector is equipped with an integrated attenuator (e.g. 918D Series),
the 1928-C detects its status (ON or OFF) and displays it in the Attenuator
field.
The user has the option to manually set the attenuator to ON or OFF for
detectors that have attenuators that can be manually mounted on the detector
(e.g. 818 Series).
To change the attenuator status, bring the cursor on top of the Attenuator
field. Hit the Enter key. A drop-down menu appears with the ON/OFF option.
Select the setting and hit Enter.
4.3.1.4
Analog and Digital Filter Selection
With the Navigation/Selection keys bring the cursor on top of the Analog or
Digital field. Hit the Enter key. A drop-down menu appears with the
available filter settings. Select the desired filter and hit Enter.
The Analog and Digital filter configuration can be accessed any time with the
Filter dedicated key. Refer to Section 4.2.5 for details.
4.3.1.5
Units Selection
With the Navigation/Selection keys bring the cursor on top of the Units field.
Hit the Enter key. A drop-down menu appears with the available units. Select
the desired units and hit Enter.
4.3.1.6
Mode Selection
This setting allows the user to change the measurement mode. The available
modes are as follows:
• Continuous Wave Continuous Run (CW Cont.)
40
System Operation
•
•
•
•
•
•
•
Continuous Wave Single Shot (CW Single)
Continuous Wave Integral (CW Integ.)
Peak-to-Peak Continuous Run (Pk-Pk Cont.)
Peak-to-Peak Single Shot (Pk-Pk Single)
Pulse Mode Continuous Run (Pulse Cont.)
Pulse Mode Single Shot (Pulse Single)
RMS Measurements (RMS)
Refer to Section 5, Performing Basic Measurements, for detailed information
regarding these modes.
4.3.1.7
Spot Size
This setting allows users to change the spot size. The default spot size is set
to be same as the detector size. The spot size can be modified by navigating
the cursor to this setting, and pressing the Setup/Enter key. The value then
becomes editable; each digit in the value can be changed by pressing
Up/Down arrow keys, and different digits can be selected by pressing
Left/Right arrow keys. The desired value can be accepted by pressing
Setup/Enter key.
4.3.1.8
Number of Digits Setting
The default number of digits displayed by 1928-C is 4. To change this
setting, bring the cursor on top of the Num. Digits field. Hit the Enter key. A
drop-down menu appears with the option of 3, 4 or 5 digits. Select the desired
number of digits and hit Enter.
4.3.1.9
Offset Field
On the right column of the Measurement Settings the unit displays the Offset
stored when the user hits the Zero dedicated key. This value can be cleared or
updated if the unit is in the main measurement screen and Zero is pressed
(see Section 4.2.5 for more information).
4.3.2
Detector Information
The Measurement Settings screen displays information about the detector
used based on the data available in the detector calibration module or detector
internal memory.
The available data are the detector model number (Detector), the detector
serial number (S/N), the detector temperature (Det. temp.) if the detector has
an internal temperature sensor, and the detector responsivity (Responsivity).
System Operation
4.4
41
Trigger Setup
The Trigger Setup screen can be
accessed from the Measurement
Settings (Figure 33). Pressing the
Trigger soft key gives the user a few
choices to setup the trigger according
to the measurement needs.
The 1928-C Optical Power Meter has
an advanced Trigger set that allows the
user to synchronize the measurements.
Synchronization can be achieved with
Trigger Start and Trigger Stop which
can both be set from the trigger setup
screen.
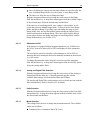
4.4.1
Figure 33
Accessing the Trigger Setup
screen
Trigger Start
The Trigger Start is an event that tells the system when to take a
measurement or a group of measurements. It can be set in different ways.
• None: The system is always triggered.
• Soft Key: The system can be triggered with a Soft Key that appears in the
main measurement screen.
• Command: The system is triggered with an external command,
PM:TRIG:STATE (Section 8.3.3).
The Trigger Start can also be set with an external command
PM:TRIG:START (Section 8.3.3).
4.4.2
Trigger Stop
The Trigger Stop is an event that tells the system when to stop taking
measurements. In the case of a single measurement, a trigger stop event
arms the system for the next measurement. It can be set in different ways.
• None: The system measures continuously.
• Soft Key: The system stops measuring when a Soft Key is pressed. This
key appears on the main measurement screen.
• Command: The system stops measuring when an external command,
PM:TRIG:STOP (Section 8.3.3) is sent via USB.
• Value. The system stops measuring when the measured signal crosses a
user programmed value in CW Integrate mode.
• Time. The system stops measuring when a user programmed time passed
between the Start event and the current measurement.
The Trigger Stop can also be set with an external command PM:TRIG:STOP
(Section 8.3.3).
42
System Operation
4.5
Wavelength Setting
Newport detectors have a calibration module or internal memory which
stores the Responsivity versus Wavelength Table. If the Lambda key is
pressed, a wavelength screen is displayed with the most common values in
nanometers (nm) (see Figure 30 on page 37).
The screen has two columns. The left column displays the common
wavelength values used in the industry, while the right column has custom
values.
When the user selects one of the predefined wavelengths in the left column,
the 1928-C looks up the wavelength in the responsivity table in the detector
calibration module. If that exact value is found, the system will use the
corresponding responsivity for that particular wavelength. If the value is not
found, the system will calculate the responsivity using interpolation.
The right column in the Wavelength screen gives the user the option to set
custom wavelengths. To do so, with the Navigation keys bring the cursor on
top of one of the numbers. The rightmost Soft key becomes Edit Value. Hit
this key to edit the custom number. A white cursor appears on the first digit.
Press the Up/Down navigation keys to change the number and the Left/Right
keys to move to the next digit. When finished, hit Enter. The new custom
wavelength will be stored. Press Esc to return to the main measurement
screen
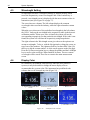
4.6
Display Color
In a laboratory environment, and especially when one uses protective
eyewear, it may be desirable to change the meter display color to
accommodate the eyewear color. The instrument has predefined color
schemes that can be changed any time (Figure 34).
a. Negative black and white
screen
b. Positive black and white
screen
c. Red screen
d. Green screen
e. Blue screen
f. Color/Blue screen
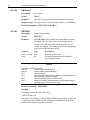
Figure 34
Predefined color schemes
System Operation
43
To change the display colors first press
the Enter/Setup key. This will bring the
Setup screen and reconfigure the Soft
keys (Figure 35).
Figure 35
Pressing the System soft key will bring
a secondary setup screen. Navigate to
the Color Selection to change the
screen color (Figure 36). Also,
navigate to the Brightness field and hit
Enter to change the screen brightness.
The default value is 80%. Press the
Measure soft key to go back to the
Measurement Settings screen, or press
ESC to go back to the main
measurement screen.
Figure 36
Setup screen
System Settings screen
Pressing the About soft key will bring
another screen with information about
the unit’s firmware version, serial
number, calibration date. In addition,
the attached detector’s data is
displayed (Figure 37). From here, one
can navigate back to the Measurement
Settings or back to the System Settings.
Figure 37 About screen
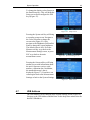
4.7
USB Address
The USB Address can be changed in the System Settings screen (Figure 36).
Navigate to the USB Address and hit Enter. In the drop-down menu select the
desired USB address.
44
System Operation
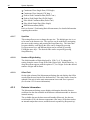
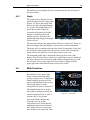
4.8
Statistics
The 1928-C can display statistics for
the measurement in progress. From
the main measurement screen press
the Soft key labeled Statistics. The
Statistics screen is displayed as in
Figure 38.
The left column shows the current
statistics setup. The Statistics
function has two modes: Fixed and
Continuous.
Figure 38
Statistics screen
When in Fixed mode the Statistics engine calculates the minimum (Min),
maximum (Max), Range, Mean, Standard Deviation (Std. Dev.) for a fixed
number of samples and displays them in the right column.
The number of samples is displayed in the left column on the Samples line.
As Figure 38 shows, the number of samples is 10000 with a time interval
between samples of 100 µs. This means that, for this example, the statistics
values are calculated over 1 second time interval.
Pressing Clear Stats soft key clears current statistics, enables data
collection and starts computation of new statistics values. Once the desired
number of samples are collected (10000 in this case), the data collection is
automatically disabled and statistics computation is stopped. The statistics
shown at this point are representative of the collected data collected and
available for download. This soft key can be pressed at any time to restart
the whole process again.
The data collected can be saved to a flash drive attached to the rear panel of
the unit by pressing Save soft key.
The user can change the mode using the Navigation keys. Use the
Up/Down navigation keys to highlight the Mode choices. Press the Enter
key to view a drop-down menu that allows users to select Fixed or
Continuous Mode. Use the Up/Down navigation keys followed by Enter, to
change the mode to Continuous.
Pressing Clear Stats soft key in Continuous mode clears current statistics,
enables data collection and starts computation of new statistics values. In
this mode, the unit does not disable data collection when the number of
samples specified is collected. Instead, it continues to collect data and place
them in a data buffer on a first-in-first-out (FIFO) basis. The statistics
shown are representative of data collected since the time Clear Stats was
last pressed. As in Fixed mode, the Clear Stats soft key can be pressed at
any time to restart the whole process again.
The Graph soft key (Section 4.8.1) can be used for the visualization of the
measured values on a time graph.
System Operation
45
The Statistics screen displays also the current measured value at the top of
the right column.
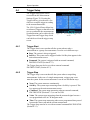
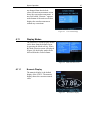
4.8.1
Graph
The Graph soft key displays the last
10000 measurements on a time graph
(Figure 39). Due to the sample time
interval of 100µs, the graph duration
is 1 second. The graph width is 270
pixels and, because of that, the
system has to decimate the 10000
samples to fit them in this fixed
number of pixels. Therefore, the
graph might look choppy if the graph
zoom is set on 1.
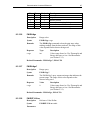
Figure 39
Graph screen
The user can zoom into the graph with the Soft keys +Zoom and –Zoom. As
the zoom changes the graph displays a finer picture of the measurements.
The zoom value is retained at the top of the screen. Pressing the +Zoom soft
key will zoom in the graph 2 times the previous zoom value. Pressing the –
Zoom soft key will zoom out ½ times the previous zoom value.
The maximum graph value is displayed in the upper left corner of the
display. If the Cursor soft key is pressed, a vertical line (cursor) is displayed.
The user can direct the cursor left or right with the Navigation Keys to read
the measured values on the graph. The current value is displayed in the
upper right corner and marked on the screen with a red dot.
4.9
Math Functions
The Math function is displayed on
the math field, at the upper right
corner of the main measurement
screen (see Figure 40). To display the
Math field the user must select the
soft key labeled Math on this screen.
This in turn displays a math
configuration screen (see Figure 41).
The Math function can be used to
add, subtract, multiply or divide the
current measurement Ch. A with a
reference Ref. A in real time.
Once in the Math configuration
screen the user can use the
Navigation keys to build a desired
mathematical expression. From the
first column the user can select the
first variable in the expression, from
Figure 40
Math field
46
System Operation
the second column, the operator, and
from the third column, the second
variable. After making the selections,
the user can press Enter key to
confirm the choices and to return to
the main measurement screen.
Figure 41
Math configuration screen
The Ref. value is assigned a default value of 0.001 when the system is first
turned on. The reference value is stored and displayed in the selected units.
The user can change the reference value by navigating to the reference value
and units fields and modifying them using the Up/Down/Left/Right keys.
If the displayed units change, then the user needs to update the stored
reference value so that the system will store the new units in the reference.
The Math field can be turned off from the math configurations screen. The
second Soft key is labeled Display OFF. If this key is pressed the system
returns to the main measurement screen and the Math field disappears.
4.10
Measurement Correction Settings
The 1928-C Optical Power Meter provides users the capability to correct
actual measurements taken by it through a “Correction Settings” screen. This
screen can be accessed by pressing the “Correction” soft-key in
“Measurement Settings” screen (Figure 42). The “Measurement Settings”
screen, as described earlier, can be accessed by pressing the Setup key from
main measurement screen.
The Correction Settings screen
(Figure 43) allows users to enter two
(2) multiplier values, labeled
“Multiplier 1” (M1) and “Multiplier
2” (M2), besides an “Offset” value.
The corrected measurement is arrived
at using the formula shown below:
Corrected measurement = [(Actual
measurement * M1) – Offset] * M2.
The default value for the two
multipliers is 1.0, and the offset is
0.0. If any of these three parameters
Figure 42
Measurement Settings
System Operation
47
are changed from their default
values, the main measurement screen
shows the corrected measurement. A
new field called “Detector:” appears
at the bottom of the main screen that
displays the actual measurement
without any corrections.
4.11
Figure 43
Correction Settings
Figure 44
Mode selection screen
Figure 45
The Numeric display
Display Modes
The selection of various display modes
can be done from the default screen,
by pressing the Mode soft key. When
the Mode selection screen is displayed
(Figure 44), the display mode can be
selected from the second column.
4.11.1
Numeric Display
The numeric display is the default
display of the 1928-C. The numeric
display shows the current measured
value.
48
System Operation
4.11.2
Min-Max Bar
The Analog Bar display mode shows a
bar graph below the numeric display.
The bar graph is white and follows the
value showed by the numeric display.
The minimum and maximum labels
displayed just below the bar graph
represent the input range the unit is
currently set on. For example, if the
unit is set on 109.99 µW range, then
the bar graph shows the same range of
0 to 109.99 µW. In the middle of the
bar graph the displayed number is the
middle of the range.
Figure 46
Analog Bar
The major ticks represent 10% of the range, and the minor ticks represent 5%
of the range.
If the Soft key labeled Show Max is selected, the maximum value is retained
and displayed in the bar graph with red color. The red bar is updated with
each measurement, if the current measured value is larger than the largest of
the previous measurements. Besides the maximum value being displayed
with a red bar, the actual value is displayed above the bar graph where
“Max=” shows the value. If the Soft key labeled Show Min is selected, the
minimum value is retained and displayed in the bar graph with green color.
The green bar is updated with each measurement, if the current measured
value is smaller than the smallest of the previous measurements. Besides the
minimum value being displayed with a green bar, the actual value is
displayed above the bar graph where “Min=” shows the value.
The maximum and minimum bars can be reset with the Reset m/M soft key.
For users who would like to fine
adjust a maximum or a minimum, the
1928-C offers the Auto Zoom
function. When the Auto Zoom soft
key is pressed another bar appears
above the Analog Bar. The bar length
is 2% of the Analog Bar. It is a display
of the region around the end of the
analog bar.
Figure 47
Auto Zoom
System Operation
49
The Auto Zoom bar displays with white the current measured value, as the
Analog Bar does. However its trip is more sensitive, because the maximum
trip is +/-1% of the Analog Bar. If the Show Max or Show Min soft keys are
pressed, the system behaves the same as with the Analog Bar, displaying
with red the maximum value and with green the minimum value. As an
example, as Figure 47 shows, the red bar in the Analog Bar is very small, so
with the Analog Zoom this bar is extended giving the user the convenience to
see better small signal variations.
Pressing the Reset m/M soft key, clears the minimum and maximum bars
from both the Analog Bar and the Auto zoom graphs.
4.11.3
Analog Needle
The Analog Needle displays a vertical
marker that moves with the displayed
numeric value. It is useful for users
who look for a maximum or a
minimum when adjusting the optical
power.
Figure 48
Analog Needle display
50
System Operation
4.11.4
Vertical Chart
When the Vertical Chart is selected
the numeric display is moved in the
upper right corner. The vertical chart
scrolls down, representing a snapshot
of the last measurements. The chart
can be cleared with the Clear soft key.
The maximum peak value of the chart
is the maximum measurement of the
entire chart, since the last clear.
Below the chart, there is a line with
the chart maximum and minimum in
major units. On the same line in the
middle, there is information about the
chart zoom level, e.g. 2x, and the
number of samples processed per
chart line, e.g. 10 Avg (Figure 49).
Figure 49
Vertical chart with 10
measurements per line
The chart has 100 lines, each line
having a white and red color. When
the system fills up a line, it looks at a
number of samples defined by the
number displayed below the chart.
Figure 50 Vertical chart with 1
measurement per line
Figure 49 shows 100x -- 10 Avg, which means that, while painting a line, the
system looks at the previous 10 measurements. It displays with white the
minimum value in the 10- measurement list and with red the maximum value
in the same list.
The user can change the number of measurements by selecting the Average
soft key and then pressing the Right or Left Navigation keys, to increase,
respectively decrease the number of measurements. If one measurement is
selected, the chart color is white, because the maximum and minimum per
line are the same (Figure 50). Due to one measurement display per line, the
chart speed increases.
If the Zoom soft key is pressed the user can zoom into the chart with the Up
and Down Navigation keys
System Operation
4.11.5
51
Analog Gauge
The Analog Gauge display simulates
a traditional analog gauge. For
enhanced ability to monitor the
measurements, this display mode
provides users the capabilities of
showing a maximum value and
zooming in/out around the present
measured value. It also supplements
the analog gauge simulation with a
large numeric display (see Error!
Reference source not found.) for
improved ability to read the
measurements.
Figure 51
Analog Gauge Display
If the user applies any correction or
zero offset settings, the analog gauge
and numeric display show the
corrected measurements; the actual
detector (uncorrected) measurements
and zero offset value are displayed at
the right top corner of the screen.
If the user presses Show Max soft
key, a maximum value marker (a
thinner and longer needle than the
measurement needle) is shown as in
Figure 52. The soft keys available
now are also modified as shown in
this figure. The maximum value
captured can be reset by pressing the
Reset Max soft key, and this marker
can be hidden by pressing the Hide
Max soft key. When the maximum
value marker is hidden, the soft keys
are reconfigured as shown in Figure
51.
Figure 52
Analog Gauge Display with
Maximum Value marker
Figure 53
Analog Gauge Display at
50x Zoom
The users can zoom in or out around the measurements by pressing the
+Zoom and -Zoom soft keys respectively. The default zoom level is 1x. At
this zoom level, the analog gauge minimum and maximum settings are 0 and
the present range maximum value. When the +Zoom and –Zoom soft keys
are pressed, the power meter increases/decreases the analog gauge display
resolution by modifying its minimum and maximum values (see Figure 53).
The new values are determined based on the present measured value, range
maximum value and the zoom level.
52
System Operation
4.12
Optical Power Meter Firmware Upgrade Procedure
Firmware Upgrade is an easy, straight-forward process. Simply copy
firmware files (PM1928APP.EXE and XMLFILE5.XML) to a WinCE
compatible USB Flash Drive and then plug it into the USB connector on the
rear panel of the instrument. Then wait a few seconds for the instrument to
recognize the USB Flash Drive. The Optical Power Meter will detect the new
firmware files and will ask if you want to download the files. Press the “Yes”
softkey to start the upgrade process. The Optical Power Meter will instruct
you to restart once the upgrade is successful. Disconnect the flash drive from
the instrument and restart it by turning it OFF and back ON. The instrument
will restart running the new firmware.
New firmware files may be available either through the Newport web site
(http://www.newport.com) at the product page or through your local Newport
application specialist.
5
Performing Basic Measurements
5.1
Introduction
Many different types of optical measurements are possible using the 1928-C
Optical Power Meter. Most of these possible measurements are selected from
within the MODE menu. This chapter discusses these measurements.
5.2
Measurement Modes and Units
The 1928-C provides a number of measurement modes for acquiring data. At
power on, the meter checks the detector’s calibration EEPROM to determine
the available measurement modes supported by the detector.
Measurements can be displayed in various units. The detector type and the
measurement mode determine the set of units available at any given time.
Table 1 illustrates the measurement modes and units available for each detector
family. The measurement modes are grouped naturally into three categories:
CW, Peak-to-Peak (Pk-Pk), and Pulsed. Each will be discussed in the sections
below.
The 1928-C sets the measurement to a detector specific default mode
depending on the detector used. All Newport detectors have internal logic or
calibration modules. Based on the data stored in detectors, the instrument
knows to auto configure itself and sets up the mode, range, filter, rate, etc.
The user, in the setup screen, can change the detector specific default mode.
The basic measurement techniques for using the 1928-C are covered in the
following sections. Refer to Table 1 for a review of the 1928-C’s functions
and measurement capabilities.
(918DSeries)
HighPower
(818PSeries)
dB
REL / %
X
X
X
X
X
X
X
X
X
X
X
X
X
CW
Integrate
Pk-Pk
Continuous
Pk-Pk
Single
CW
Continuous*
CW Single
Energy
CW
Integrate
Pulse
Continuous*
(818ESeries)
Pulse
Single
X
X
Sun
dBm
X
CW Single
J/cm2
CW
*
Continuous
Mode
J
W/cm2
LowPower
W
Detector
Family
A
Performing Basic Measurements
V
54
X
X
X
X
X
X
X
X
X
X
X
X
X
X
X
X
X
X
X
X
X
X
X
X
X
X
X
X
X
X
X
X
X
X
X
X
X
X
X
X
Table 1 Available Measurement Modes and Valid Units.
The modes with the symbol “*” are the default measurement modes. The
Optical Power Meter enters these modes when it determines the presence of a
“new” detector for the first time. The meter will, thereafter, remember the last
five connected detectors and enter their last used measurement mode.
Since dB, % and REL are relative measurements, these units are available in
the math field only. Use the Math Configuration screen to specify a desired
reference value and to select a desired operation.
The following instructions assume familiarity with the meter’s functions.
They also include steps to incorporate background correction and assume that
the experimental setup under-fills and does not saturate or damage the
detector.
5.3
CW Measurements (with 918D or 818P Detectors)
This section describes the procedure for making basic optical power
measurements while properly removing the influence of ambient light and
other drift effects.
• With a 918D (also 818-XX lower power detectors with proper adapters) or
818P-Series Detector connected to the meter, turn the meter on. Press the
Mode key and then select CW Continuous with the Navigation keys. Use
the ESC key to return to the Main screen. Set Range to Auto and press the
Lambda (λ) key to set the measurement wavelength to the desired value.
Performing Basic Measurements
55
• Cover or otherwise block the light source being measured and then press
the Zero key to turn the Offset on. This effectively removes any
background signal from subsequent measurements.
• Uncover the source so that it illuminates the detector and note the
displayed value. This reading is the optical power observed by the detector
due to the source.
This process assumes that the ambient signal is not changing between the
time when the Zero key is pressed and when the measurement is made. The
user should remember that, if he/she can see the detector active area as he/she
moves around, then the detector registers this as a changing ambient DC
signal!
• For the 918D series detectors (also 818-XX lower power detectors with
proper adapters) you can decide whether to use the attenuator for your
measurement or deactivate (or physically remove on 818 low power
series) the attenuator.
a. For very low power measurements, below µW range in various
ambient light environments, you can elect to use the detector with
no physical attenuator in the optical path. This will increase the
sensitivity and hence accuracy of the measurement.
b.
In case of higher power measurement, the attenuator should be used
to avoid damage or saturation of the detector. The attenuator use is
recommended in mW to low Wattage range incident power. Please
refer to the specifications of the particular detector to make sure you
do not exceed the saturation levels of the detector.
For the 918D series detectors with integrated (non-removable) attenuators,
there is a switch built into the detector head, sensing the position of the
attenuator. The Optical Power Meter will then automatically use proper
calibration data for presence or absence of the attenuator in front of the
photo diode. For models such as 818 low power series detectors which
have a removable attenuator, there is no switch built into the detector
head, hence the user will have to manually select attenuator option status
on the meter to obtain the proper power or signal readings.
5.4
Peak-to-Peak Power Measurements (918D Detectors)
This section describes the procedure for making basic optical peak-to-peak
power measurements.
• With a 918D Low Power Detector connected to the meter, turn the meter
on. Set the Mode to Pk-Pk Continuous. Set Range to Auto and press the
Lambda (λ) key to set the measurement wavelength to the desired value.
• Illuminate the detector and note the displayed value. This reading is the
peak-to-peak optical power observed by the detector.
• Accurate peak-to-peak power measurements can be made for pulse
repetition rates up to 20 kHz.
56
Performing Basic Measurements
5.5
Power Ratio and Power Reference measurements
This section describes how to use the mathematical functions in the Optical
Power Meter to obtain a power or signal comparison to a previously saved
value. The readout can be displayed as a linear ratio, a percentage or in dB.
Refer to Section 4.9 for information on setting the reference values.
• Example 1 – In order to select dB ratio versus a stored reference value:
a. While in the Math function screen, select channel A by using the up
or down arrow keys. There will remain a black border around the
highlighted/selected channel as you leave the column for the next
selection.
b. Move to the next column by using the right arrow key, and select
“/(dB)” option.
c. Move to the last column by using the right arrow key and use the up
or down keys to select Ref. A.
d. Press the Menu/Enter key to accept the selections and exit the Math
function screen.
e. The result of Ch. A/Ref. A in units of dB will appear in the
designated window on the screen.
• Example 2 – In order to get the difference between channel A and a stored
reference value:
a. From the main screen of the meter, select soft key labeled “Math” to
enter the math function screen. If you cannot see the label “Math”,
press the “ESC” key.
b. Use the direction keys to highlight channel A in the first column
c. Using the direction keys, navigate to the “-“ symbol in the center
column.
d. Using the direction key, move the final column such that Ref. A is
highlighted.
e. Press the Menu/Enter key to retain the settings and exit the screen at
the same time.
f. The result of Ch. A- Ref. A will be displayed in the designated
window of the main display screen.
5.6
Pulse Energy Measurements (818E Detectors)
This section describes the procedure for making basic optical pulse energy
measurements.
• With an 818E Energy Detector connected to the meter, turn the meter on.
Set the Mode to Pulse Continuous. Set the Range to Manual Mode and
press the Lambda (λ) key to set the measurement wavelength to the
desired value.
Performing Basic Measurements
57
• Illuminate the detector and note the displayed value as the meter measures
each laser pulse. These readings represent the energies of the incident laser
pulses. The meter will display the last pulse energy measured until a new
pulse arrives.
• Accurate measurements can be made for pulse repetition rates up to 10 kHz,
depending on the limitation of the specific detector in use, of course.
5.7
Signal Integration Measurements (918D or 818P
Detectors)
This section describes the procedure for making a basic signal integration
measurement while properly removing the influence of ambient light and
other drift effects. The 1928-C begins and ends the signal integration every
second.
• With a 918D or 818P Detector connected to the meter, turn the meter on.
Set the Mode to CW Continuous. Set the Range to Auto and press the
Lambda (λ) key to set the measurement wavelength to the desired value.
• Cover or otherwise block the light source being measured, turn Zero on
and then set the Mode to CW Integrate. Immediately upon entering the
integration mode, the meter will begin to acquire and integrate data. The
display value may reflect the integration of noise due to ambient
temperature fluctuations (when using the 818P detectors) or light
fluctuations (when using the 918D detectors).
• Uncover or trigger the source. The displayed value should now reflect the
detector signal integration value.
NOTE
This process assumes that ambient signals are not changing between the moments
when the user zeros the display and when the measurement is made.
5.8
Measuring Laser Pulse Energy with an 818P Thermopile
Detector (Single Shot)
This application makes use of the 1928-C’ CW Integrate mode (see Section
5.7 above). When an optical pulse with energy E(λ) is incident on a
thermopile (818P Series), a voltage signal is generated at the detector input as
the heat pulse flows out to the cooling fins. The sum of a series of integrated
signals (each one second long) resulting from this heat pulse is a measure of
the optical pulse energy, see Figure 54.
58
Performing Basic Measurements
Figure 54
Measuring Laser Pulse Energy via a Thermopile in CW Integrate Mode
A recommended procedure is:
• With an 818P High Power Detector connected to the meter, turn the meter
on. Set the Mode to CW Continuous. Set the Range to Auto and press the
Lambda (λ) key to set the measurement wavelength to the desired value.
Set Zero on and then change Mode to CW Integrate.
• Before the optical pulse arrives, the display may reflect the integral of
detector noise due to ambient temperature fluctuations.
• Trigger the laser pulse. The display will display a new integrated energy
measurement every second. The readings will start decreasing rapidly
after the first couple of measurements due to the decline in heat flow from
the relatively slow thermopile detector.
• When the displayed reading drops again to the point of essentially
displaying the detector’s noise component, the individual stored readings
may be retrieved via the USB interface. Summing these readings will
yield the pulse energy.
NOTE
This method works best if the integrated result of the pulse signal is much larger
than the integral of the detector’s noise component. If the integrated result of the
pulse is not much larger, then error in the measurement will arise due to the
uncertainty generated by integration of the noise component terms.
NOTE
The time constant of a thermopile detector determines the amount of time that one
should expect to wait when making an integrated energy measurement of an optical
pulse. Typically, an accurate value will be at 5 time constant after the arrival.
Performing Basic Measurements
5.9
59
RMS Measurements
This section describes the procedure for making a basic signal RMS (Root
Mean Square) measurement while properly removing the influence of
ambient light and other drift effects. The 1928-C begins and ends the signal
RMS every second.
• With a 918D or 818P Detector connected to the meter, turn the meter on.
Set the Mode to RMS. Set the Range to Auto and press the Lambda (λ)
key to set the measurement wavelength to the desired value.
• Cover or otherwise block the light source being measured, turn Zero on.
Immediately upon entering the RMS mode, the meter will begin to acquire
and calculate RMS value of the data. The display value may reflect the
RMS of noise due to ambient temperature fluctuations (when using the
818P detectors) or light fluctuations (when using the 918D detectors).
• Uncover or trigger the source. The displayed value should now reflect the
detector signal RMS value.
• The RMS value is calculated based on data acquired over a one second
time period. The formula used to calculate the RMS value is given below:
n
y=
∑x
i =0
2
i
n
Where xi is the signal measured, n is the number of samples acquired over a
one second period, and y is the RMS value.
NOTE
This process assumes that ambient signals are not changing between the moments
when the user zeros the display and when the measurement is made.
60
Performing Basic Measurements
This page is intentionally left blank
6
Software Application
6.1
Overview
The 1928-C has a USB connector on the rear panel of the unit that is used to
connect to a computer for use with this application.
Provided on the CD that comes with the unit is an installation for this software
application. The installation installs the USB drivers that are required to use USB
communication.
The software is designed to allow the user to remotely control basic functions
of the instrument.
6.2
Connection
Start the application, which will detect and connect the attached optical
power meter. The 1928-C Optical Power Meter has just one channel, so
channel B is grayed out.
Connect Button /
Indicator
Figure 55
Application front panel
62
Software Application
6.3
General Usage
This software application allows the user to setup and monitor the instrument
remotely.
The controls on the instrument are available in the software in a very easy to
read and change format.
Figure 56
Application Advanced Options (Configuration Tab)
The application is designed to have menus similar to standard Windows
applications like MS Word, to ease usability.
6.4
Menu Structure
To Exit the application go to the File menu and select Exit.
The Edit/Advanced Options menu has additional property settings, including
channel settings and data logging options.
The Help/About will show information about the application, including
firmware version when an instrument is connected and communicating.
7
Computer Interfacing
7.1
General Guidelines
The 1928-C Optical Power Meter has a USB computer interface port used to
send commands to the instrument from a host PC. The connection to a
computer is done via a USB cable Type "A" Male Connector to Type "MiniB" Male Connector.
The commands supported by the Optical Power Meter can be divided into the
following two categories: commands that cause the instrument to take a
desired action, and commands (queries) that return a stored value or state of
the Optical Power Meter.
Query commands are always terminated by a question mark (?). It is
recommended that when a query command is sent, the response to that
command from the Optical Power Meter be read before issuing any other
command.
Set commands, on the other hand, are used to configure/setup the Optical
Power Meter for a desired mode of operation. These commands take at least
one parameter. The subsequent sections in this chapter detail the USB
communication protocols supported by the Optical Power Meter.
7.2
Computer Interface Terminology
Listed below are the key abbreviations and concepts used in the command
reference section (Section 8) of this manual.
7.2.1
<…> Delimiting Punctuation
For the purposes of this manual, any string enclosed by <…> is considered to
be a command, a string or numerical argument. The punctuation <…> is
used to symbolize the typographic limits of the command, string or argument
in question.
7.2.2
<CR> Carriage Return
The ASCII encoded byte 13 in decimal. (0D hex)
7.2.3
<LF> Line Feed
The ASCII encoded byte 10 in decimal. (0A hex)
64
Computer Interfacing
7.2.4
(;) Semicolons
Semicolons are used to separate commands within a single transmission
(concatenation).
7.2.5
<number> Numerical Types
Numerical parameters are passed and returned as the actual ASCII characters
in the string representation of the number. See section 12.2 for more detailed
information.
7.2.6
<string> String Types
See the section 12.1 for a detailed description of <string>.
7.3
USB Communication
The instrument is designed to communicate with standard USB interfaces.
Before connecting the instrument to the USB interface the user should install
the application included in the software CD that accompanies the Optical
Power Meter. The application automatically installs the right USB drivers.
Communication can be done through this interface by using the application
or by developing software in the user’s preferred programming language.
The software CD contains drivers and example programs in the following
programming languages: LabVIEW, Visual Basic, and Visual C++.
8
Communication Command
Reference
8.1
1928-C Optical Power Meter Remote Interface
Commands
A complete listing of the commands supported by the 1928-C Optical Power
Meter is provided below.
8.2
Command Overview
There are two types of commands: commands that cause the Optical Power
Meter to take a desired action, and queries that return a stored value or state
of the instrument. Queries must end with a question mark (?), while
commands may require parameter(s) to follow:
PM:Lambda 810
For example, the value “810” in the command PM:Lambda 810 sets the
wavelength to 810nm. The table below summarizes all the commands and
queries supported by the 1928-C Optical Power Meter. The command/query
MUST contain all of the letters, which are shown in upper case in this table.
The lower case letters shown with the commands are optional, and may be
used for clarity. If any of the optional letters are used, then all of the optional
letters are required for the command.
The commands may be sent to the instrument in either upper or lower case or
in any combination. For example, the following commands are equal:
PM:Lambda 810
PM:L 810
pm:L 810
Pm:L 810
COMMAND EXECUTION:
The controller interprets the commands in the order they are received and
execute them sequentially. If a set of commands have to be executed closer
to each other, these commands can be sent to the controller simultaneously
by creating a command string with semicolon (;) used as a command
separator. The command string length should not exceed 50 characters. In
the example shown below, a command string was created with semicolon
66
Communication Command Reference
separating 5 queries. The controller responds to this command string with a
response that has 5 values using a comma (,) as a separator.
COMMAND STRING:
PM:P?;PM:ATT?;PM:L?;ERR?
INSTRUMENT RESPONSE:
1.2450,1,810,0
8.3
Optical Power Meter Command Description
8.3.1
Command Glossary
Root level Commands/Queries Summary
Name
Number of
Parameters
*IDN?
*RCL
*SAV
ADDRess
ADDRess?
ERRors?
NONE
1
1
1
NONE
NONE
ERRSTR?
NONE
Function
Identification query
Recall configuration settings
Save configuration settings
Sets the instrument’s USB address
Returns the instrument’s USB address
Returns errors generated since the last query.
Returns errors and their corresponding error text generated since the last
query.
Table 2
Page
No.
69
69
69
70
70
70
71
Root level Commands/Queries Summary
Tree level Commands/Queries Summary
Name
DISP:BRIGHT
DISP:BRIGHT?
PM:ANALOGFILTER
PM: ANALOGFILTER?
PM:ANALOG:IMP
PM:ANALOG:IMP?
PM:ANALOG:OUT
PM:ANALOG:OUT?
Number of
Parameters
1
NONE
1
NONE
1
NONE
1
NONE
PM:ATT
1
PM:ATT?
NONE
PM:ATTSN?
PM:AUTO
PM:AUTO?
PM:CALDATE?
NONE
1
NONE
NONE
PM:CALTEMP?
NONE
PM:CORR
PM:CORR?
PM:DETMODEL?
PM:DETSIZE?
PM:DETSN?
PM:DIGITALFILTER
3
NONE
NONE
NONE
NONE
1
Function
Sets the backlight level of the display and the keypad
Returns the backlight level of the display and the keypad
Sets the analog filter to desired value
Returns the analog filter setting
Sets the analog input impedance to desired value
Returns the analog input impedance value
Sets the analog output range to desired level
Returns the analog output range
Selects if the attenuator’s calibration data is included for power
calculation.
Returns setting if attenuator data should or should not be used
when calibrating the Optical Power Meter.
Gets the attenuator serial number.
Sets the Optical Power Meter ranging to manual or automatic.
Returns 1 if automatic Optical Power Meter ranging is selected.
Returns the calibration date of the detector.
Returns the temperature at which the calibration was
performed.
Sets the power measurement correction settings.
Power measurement correction settings query
Returns the model number of the detector.
Returns the detector surface area
Returns the serial number of the detector.
Sets the digital filter to desired value
Page
No.
68
68
71
71
72
72
72
73
73
73
74
74
74
74
75
75
75
76
76
76
77
Communication Command Reference
Name
PM: DIGITALFILTER?
PM:DPower?
PM:DS:BUFfer
PM:DS:BUFfer?
PM:DS:Clear
PM:DS:Count?
PM:DS:Enable
PM:DS:Enable?
PM:DS:GET?
PM:DS:INTerval
PM:DS:INTerval?
PM:DS:SAVEBUFER
PM:DS:SIZE
PM:DS:SIZE?
PM:DS:UNITs?
Number of
Parameters
NONE
NONE
1
NONE
NONE
NONE
1
NONE
1
1
NONE
1
1
NONE
NONE
PM:FILTer
1
PM:FILTer?
NONE
PM:Lambda
PM:Lambda?
PM:MAX:Lambda?
PM:MAX:Power?
PM:MIN:Lambda?
PM:MIN:Power?
PM:MEAS:TIMEOUT
PM:MEAS:TIMEOUT?
PM:MODE
PM:MODE?
PM:Power?
PM:PWS?
1
NONE
NONE
NONE
NONE
NONE
1
NONE
1
NONE
NONE
NONE
PM:RANge
1
PM:RANge?
PM:REF:VALue
PM:REF:VALue?
NONE
1
NONE
PM:REF:STOre
NONE
PM:RESPonsivity?
NONE
PM:RUN
PM:RUN?
PM:SPOTSIZE
PM:SPOTSIZE?
PM:STAT:MAX?
PM:STAT:MEAN?
PM:STAT:MIN?
PM:STAT:MAXMIN?
PM:STAT:SDEViation?
PM:Temp?
PM:TRIG:START
PM:TRIG:START?
PM:TRIG:STOP
PM:TRIG:STOP?
PM:TRIG:STATE
PM:TRIG:STATE?
1
NONE
1
NONE
NONE
NONE
NONE
NONE
NONE
NONE
1
NONE
1
NONE
1
NONE
67
Function
Returns the digital filter setting
Detector Power query
Set data store behavior select.
Returns data store behavior select.
Clear data store.
Returns data store count of items stored.
Set data store enable.
Returns data store enable.
Returns data store data. {1,1-10,-5,+5} – value, range, oldest 5,
newest 5
Set data store interval.
Returns data store interval.
Saves the data store buffer to a WinCE compatible USB flash
disk
Sets the size of the Data Store buffer
Returns the sizes of the Data Store buffer
Returns data store units.
Selects the filtering operation: no filtering, analog filter, digital
filter, or analog and digital.
Returns the filtering operation: no filtering, analog filter,
digital filter, or analog and digital.
Sets the wavelength for use when calculating power.
Gets the selected wavelength in nanometers.
Returns the longest calibrated wavelength in nanometers.
Returns the maximum readable power in present range
Returns the shortest calibrated wavelength in nanometers.
Returns the minimum readable power in present range
Sets the measurement timeout period
Returns the measurement timeout period
Acquisition mode select
Returns the currently selected acquisition mode.
Returns the power in the selected units.
Returns the power with status.
Selects the gain stage when making readings with the detector
head within a range from 0 to 6 (with zero being the highest).
Returns an integer indicating the current range.
Sets the user reference value for use in relative or dB readings.
Returns the user reference value.
Sets the user reference value for use in relative or dB readings
as the present reading.
Gets the responsivity currently used for making power
calculations.
Disables or enables the acquisition of data.
Returns the present acquisition mode.
Sets the detector spot size
Returns the detector spot size
Returns statistics buffer maximum value.
Returns statistics buffer mean value.
Returns statistics buffer minimum value.
Returns statistics buffer maximum-minimum value.
Returns statistics buffer standard deviation value.
Returns the 918 detector's temperature in degrees Celsius.
Set the optional start event
Returns optional start event
Set the optional stop event
Returns optional start event
Set the trigger state
Returns the trigger state
Page
No.
77
77
77
78
78
78
79
79
79
80
80
80
81
81
81
82
82
82
83
83
83
83
84
84
84
85
85
86
86
87
87
87
88
88
87
89
89
89
89
89
90
90
90
91
91
91
92
92
92
92
93
68
Communication Command Reference
Name
PM:UNITs
PM:UNITs?
PM:ZEROSTOre
PM:ZEROVALue
PM:ZEROVALue?
Number of
Parameters
1
NONE
NONE
1
NONE
Function
Selects the units for readings.
Returns an integer indicating the selected units.
Sets the zeroing value with the present reading.
Sets the zeroing value.
Gets the zeroing value.
Table 3
Page
No.
93
94
94
94
95
Tree Level Commands/Queries Summary
8.3.2
Display Commands
8.3.2.1
DISP:BRIGHT
Description
Display brightness command
Syntax
BRIGHT brightness
Remarks
The BRIGHT command controls the brightness of the
instrument display.
Argument
Type
Description
Brightness
int
Brightness, in levels from 0 to 7
Related Commands: DISP:BRIGHT?
8.3.2.2
DISP:BRIGHT?
Description
Display brightness query
Syntax
DISP:BRIGHT?
Remarks
The BRIGHT? query returns the display brightness setting.
Response
Type
Description
Brightness
int
Display brightness, in levels from 0 to 7
Related Commands: DISP:BRIGHT
Communication Command Reference
69
8.3.3
Optical Power Meter Commands
8.3.3.1
*IDN?
Description
Identification Query
Syntax
*IDN?
Parameters
None
Function
Remarks
This query will cause the Optical Power Meter to return an
identification string.
Model
name
Firmware
version #
Firmware
date
Controller
Serial #
NEWPORT XXXX vYYY mm/dd/yy SNZZZZ
Examples:
NEWPORT 1928-C v2.0.0 11/07/06 SN0001
8.3.3.2
*RCL
Description
Recall Configuration Settings
Syntax
*RCL bin
Remarks
The *RCL command restores the power meter to the setup
state saved in its non-volatile flash memory.
Argument
Value
Description
bin
0
Reserved
1 to 5
Valid configuration settings
Related Commands:
8.3.3.3
*SAV
*SAV
Description
Save Configuration Settings
Syntax
*SAV bin
Remarks
The *SAV command saves the present state of the power
meter in its non-volatile flash memory. A particular state is
then recalled using the *RCL command. If any one of
these parameters are changed, the present state of the power
meter will automatically be saved in configuration setting
#1. When the power meter is reset, the state of the meter
defaults to configuration setting #1. The setup parameters
saved include:
Display brightness level
70
Communication Command Reference
USB address
Color scheme
Measurement display mode
Custom wavelengths
Argument
Value
Description
bin
0
Reserved
1 to 5
Valid configuration settings
Related Commands:
8.3.3.4
ADDRess
Description
USB address command.
Syntax
ADDRess value
Remarks
The ADDRess command sets the Optical Power Meter
USB address. After changing USB address, the
communication with the Optical Power Meter has to be reinitialized.
Argument
Value
Description
Value
0
Reserved
1 to 31
Valid USB address range
Related Commands:
8.3.3.5
*RCL
ADDRess?
ADDRess?
Description
USB address query.
Syntax
ADDRess?
Remarks
The ADDRess query returns the Optical Power Meter’s
USB address.
Response
Value
address
0
1 to 31
Related Commands:
8.3.3.6
ERRors?
Description
Error query
Syntax
ERRors?
Description
Reserved
Valid USB address range
ADDRess
Communication Command Reference
71
Remarks
The ERRors? query returns a single error number that has
occurred since the last query. This error is indicated by a
number that corresponds to the type of error that occurred.
This command also clears the read error from the Error
buffer .
Response
Type
Description
Error code
int
Error code number per Appendix B, 0 if no
errors
Related Commands: ERRSTR?
8.3.3.7
ERRSTR?
Description
Error string query
Syntax
ERRSTR?
Remarks
The ERRSTR? query returns a single error number
along with the corresponding error text string that have
occurred since the last error query.
Response
Error code,
Type
string
Related Commands:
8.3.3.8
Description
Error code number and text for error code
as"text"per Appendix B, 0 if no errors
ERRors?
PM:ANALOGFILTER
Description
Analog filter select command
Syntax
PM:ANALOGFILTER value
Remarks
The PM:ANALOGFILTER command selects the analog
filter setting.
Argument
Value
Analog Filter
0
None
1
250 kHz
2
12.5 kHz
3
1 kHz
4
5 Hz
Related Commands: PM:ANALOGFILTER?
Value
8.3.3.9
PM: ANALOGFILTER?
Description
Analog filter query
Syntax
PM:ANALOGFILTER?
Remarks
The PM:ANALOGFILTER? query returns an integer
indicating the present analog filter setting.
72
Communication Command Reference
Argument
Value
Analog Filter
0
None
1
250 kHz
2
12.5 kHz
3
1 kHz
4
5 Hz
Related Commands: PM:ANALOGFILTER
Value
8.3.3.10
PM:ANALOG:IMP
Description
Analog input impedance select command
Syntax
PM:ANALOG:IMP value
Remarks
The PM:ANALOG:IMP command selects the analog
input impedance.
Argument
Value
Input Impedance
0
50 Ω
1
100 kΩ
2
1 MΩ
Related Commands: PM:ANALOG:IMP?
Value
8.3.3.11
PM:ANALOG:IMP?
Description
Analog input impedance query
Syntax
PM:ANALOG:IMP?
Remarks
The PM:ANALOG:IMP? query returns an integer
indicating the present analog input impedance.
Argument
Value
Input Impedance
0
50 Ω
1
100 kΩ
2
1 MΩ
Related Commands: PM:ANALOG:IMP
Value
8.3.3.12
PM:ANALOG:OUT
Description
Analog output range select command
Syntax
PM:ANALOG:OUT range
Remarks
The PM:ANALOG:OUT command selects the analog
output range.
Communication Command Reference
Argument
Value
Max. Output
0
1V
1
2V
2
5V
3
Reserved
Related Commands: PM:ANALOG:OUT?
Range
8.3.3.13
PM:ANALOG:OUT?
Description
Analog output range query
Syntax
PM:ANALOG:OUT?
Remarks
The PM:ANALOG:OUT? query returns an integer
indicating the present analog output range.
Response
Value
Max. Output
0
1V
1
2V
2
5V
3
Reserved
Related Commands: PM:ANALOG:OUT
Range
8.3.3.14
PM:ATT
Description
Attenuator enable command
Syntax
PM:ATT enable
Remarks
Indicates whether or not the attenuator for the 818 Series
power detector is on the detector.
Argument
Type
Description
Enable use of detector responsivity with
attenuator available in the calibration
module for 818 detectors.
Related Commands: PM:ATT?
8.3.3.15
Enable
int
PM:ATT?
Description
Attenuator enable query
Syntax
PM:ATT?
Remarks
The PM:ATT? query returns 1 when using attenuator
calibration, 0 when calculating power without attenuator
data.
Response
Value
Description
attenuator
0
1
Calibrating power without attenuator
Calibrating power using attenuator
73
74
Communication Command Reference
Related Commands: PM:ATT
8.3.3.16
PM:ATTSN?
Description
Attenuator serial number query
Syntax
PM:ATTSN?
Remarks
The PM:ATTSN? query returns the serial number of the
attenuator. When no detector is found the Optical Power
Meter responds with "no detector".
Response
Type
Description
serial number
string
Serial number of the attenuator
Related Commands: PM:DETMODEL?, PM:DETSN?
8.3.3.17
PM:AUTO
Description
Auto range enable command
Syntax
PM:AUTO mode
Remarks
The PM:AUTO command sets the power ranging to either
manual or automatic.
Argument
Value
Description
0
Manual Optical Power Meter ranging
1
Automatic Optical Power Meter ranging
Related Commands: PM:AUTO?, PM:RANge
mode
8.3.3.18
PM:AUTO?
Description
Auto range mode query
Syntax
PM:AUTO?
Remarks
The PM:AUTO? query returns a value to indicate if auto
ranging is enabled or not.
Response
Value
Description
0
Manual Optical Power Meter ranging
1
Automatic Optical Power Meter ranging
Related Commands: PM:AUTO, PM:RANG
mode
8.3.3.19
PM:CALDATE?
Description
Detector calibration date query
Syntax
PM:CALDATE?
Remarks
The PM:CALDATE? query returns the calibration date of
the detector.
Communication Command Reference
8.3.3.20
8.3.3.21
For example:
21JUN1999.
Response
Type
Description
Date
string
DDMMMYYYYY
75
PM:CALTEMP?
Description
Temperature at which detector was calibrated query
Syntax
PM:CALTEMP?
Remarks
The PM:CALTEMP? query returns the temperature
(degrees Celsius) at which the detector was calibrated.
When no detector is present, "no detector" is returned.
Response
Type
Description
temperature
float
Returns the temperature at which the
detector was calibrated.
PM:CORR
Description
Power measurement correction settings
Syntax
PM:CORR value1, value2, value3
Remarks
The PM:CORR command sets the power measurement
correction settings. These settings are used by the power
meter to correct the actual power measurement. The
corrected power is calculated using the formula provided
below:
Corrected Measurement =
((Actual Measurement * value1) + value2) * value3
Argument
Type
Description
value1
float
Multiplier 1 (default = 1.000)
value2
float
Offset (default = 0.000)
value3
float
Multiplier 2 (default = 1.000)
Related Commands: PM:CORR?, PM:Power?, PM:DPower?
8.3.3.22
PM:CORR?
Description
Power measurement correction settings query
Syntax
PM:CORR?
Remarks
The PM:CORR? command returns the power
measurement correction settings. These settings are used by
the power meter to correct the actual power measurement.
The corrected power is calculated using the formula
provided below:
76
Communication Command Reference
Corrected Measurement =
((Actual Measurement * value1) + value2) * value3
Response
Type
Description
value1
float
Multiplier 1 (default = 1.000)
value2
float
Offset (default = 0.000)
value3
float
Multiplier 2 (default = 1.000)
Related Commands: PM:CORR, PM:Power?, PM:DPower?
8.3.3.23
8.3.3.24
8.3.3.25
PM:DETMODEL?
Description
Detector model query
Syntax
PM:DETMODEL?
Remarks
The PM:DETMODEL? query returns the model number
of the detector.
For example:
818-SL.
Response
Type
Description
model
string
Detector model number
PM:DETSIZE?
Description
Detector surface area
Syntax
PM:DETSIZE?
Remarks
The PM:DETSIZE? query returns the surface area of the
detector in cm2.
Response
Type
Description
Area
float
Detector surface area
PM:DETSN?
Description
Detector serial number query
Syntax
PM:DETSN?
Remarks
The PM:DETSN? query returns the serial number of the
detector.
For example:
0001
Response
Type
Description
serial number
string
Detector serial number
Communication Command Reference
8.3.3.26
77
PM:DIGITALFILTER
Description
Digital filter select command
Syntax
PM:DIGITALFILTER value
Remarks
The PM:DIGITALFILTER command specifies the digital
filter setting.
Argument
Type
Description
Value
int
digital filter size between 0 and 10000
Related Commands: PM:DIGITALFILTER?
8.3.3.27
PM:DIGITALFILTER?
Description
Digital filter query
Syntax
PM:DIGITALFILTER?
Remarks
The PM:DIGITALFILTER? query returns the present
digital filter setting.
Argument
Type
Description
Value
int
digital filter size between 0 and 10000
Related Commands: PM:DIGITALFILTER
8.3.3.28
PM:DPower?
Description
Detector power query
Syntax
PM:DPower?
Remarks
The PM:DPower? returns the actual power measurement.
This measurement does not include any correction settings
specified using “PM:CORR” command. When the
correction settings are set to default values, the power
measurement returned by this command is same as the
measurement returned by “PM:P?” command.
Response
Type
Description
Power
float
Power in Watts
Related Commands: PM:Power?
8.3.3.29
PM:DS:BUFfer
Description
Data Store buffer behavior selection
Syntax
PM:DS:BUFfer behavior
Remarks
The PM:DS:BUFfer command selects the behavior mode
for control of the Data Store buffer.
78
Communication Command Reference
Argument
Value
Description
Mode
0
Fixed Size
1
Ring Buffer
The behavior of the ring buffer is to allow continual data collection after the
buffer is full where the oldest values will be overwritten when new
measurements are taken.
Related Commands: PM:DS:BUFfer?
8.3.3.30
8.3.3.31
8.3.3.32
PM:DS:BUFfer?
Description
Data Store buffer behavior selection query
Syntax
PM:DS:BUFfer?
Remarks
The PM:DS:BUFfer? query returns the value of the Data
Store buffer behavior.
Argument
Type
Description
Behavior
int
See PM:DS:BUFfer for a definition of
the behavior status.
PM:DS:CLear
Description
Clear the Data Store of all data
Syntax
PM:DS:CLear
Remarks
The PM:DS:CLear command resets the data store to be
empty with no values.
Argument
Type
none
-
Description
PM:DS:Count?
Description
Data Store data item count query
Syntax
PM:DS:Count?
Remarks
The PM:DS:Count? query returns the number of
measurements that have been collected in the Data Store.
Argument
Type
Description
int
The number of measurements that have been
collected.
count
Communication Command Reference
8.3.3.33
79
PM:DS:ENable
Description
Enable Data Store Collection
Syntax
PM:DS:ENable enable
Remarks
The PM:DS:ENable enables or disables the collection of
measurements in the Data Store.
Argument
Value
Description
0
Disabled
1
Enabled
Data will be collected after the PM:DS:ENable command has been called
with a parameter of 1. Data collection will stop when the PM:DS:ENable
command has been called with a parameter of 0 or when a fixed size data
buffer is full.
enable
Related Commands: PM:DS:ENable?
8.3.3.34
8.3.3.35
PM:DS:ENable?
Description
Enable Data Store Collection query
Syntax
PM:DS:ENable?
Remarks
The PM:DS:ENable? query returns the enabled status of
the Data Store.
Argument
Type
Description
enable
int
See PM:DS:Enable for a description of the
enable argument
PM:DS:GET?
Description
Retrieve Data Store data query
Syntax
PM:DS:GET? num
Remarks
The PM:DS:GET? command returns a number of
measurements that have been collected in the Data Store.
Argument
Type
“1” – returns the single value specified
“1-10” – returns values in the range from 1-10
“-5” – returns the oldest 5 values (same as 1-5)
“+5” – returns the newest 5 values
Note: depending on the number of data points requested, there may be several
read operations required on the USB interface.
selection
string
Description
80
Communication Command Reference
8.3.3.36
PM:DS:INTerval
Description
Data Store Interval Select
Syntax
PM:DS:INTerval <interval>
Parameters
The parameter <interval>is of type <number>that is an integer. The
parameter represents the interval in milliseconds for storing one measurement
in the data buffer.
Function
This command sets the interval in milliseconds to be used for data storing.
For example if DSINT = 100 and DSSIZE = 100 it will take 100 x 100ms to
fill the buffer.
Related Commands: PM:DS:SIZE,PM:DS:SIZE?,PM:DS:INTerval?
8.3.3.37
PM:DS:INTerval?
Description
Data Store Interval Query
Syntax
PM:DS:INTerval?
Parameters
None
Function
This query returns the interval in milliseconds currently used for data storing.
Related Commands: PM:DS:SIZE,PM:DS:SIZE?,PM:DS:INTerval
8.3.3.38
PM:DS:SAVEBUFFER
Description
Save the current Data Store data to a file
Syntax
PM:DS:SAVEBUFFER filename
Remarks
The PM:DS:SAVEBUFFER command saves the current
user Data Store to a file on the WinCE compatible USB
Flash Disk plugged into the USB Host port on the front of
the Optical Power Meter.
Argument
Type
Description
Filename
string
The filename that will be created or
overwritten on the USB Flash Disk
containing the measurments stored in the
Data Store.
Communication Command Reference
8.3.3.39
81
PM:DS:SIZE
Description
Size of the Data Store query
Syntax
PM:DS:SIZE <size>
Parameters
The parameter <size>is of type <integer> in the range 1 to 250000.The
parameter represents the size of the data buffer to be used for data storing.
Function
This command sets the size of the buffer used for data storing.
NOTE
The data buffer is cleared automatically when this command is used and all
previously stored data will be gone.
Related Commands: PM:DS:SIZE?,PM:DS:INTerval,PM:DS:INTerval?
8.3.3.40
PM:DS:SIZE?
Description
Data Store Buffer Size Query
Syntax
PM:DS:SIZE?
Parameters
None
Function
This query returns the data store buffer size.
Returns
<size> is of type <number>and represents an integer of the
range 1 to 250000.
Related Commands: PM:DS:SIZE,PM:DS:INTerval,PM:DS:INTerval?
8.3.3.41
PM:DS:UNITs?
Description
Data store units query
Syntax
PM:DS:UNITS?
Remarks
The PM:DS:UNITS? query returns an integer indicating
the units selected.
Response
Value
Description
units
0
1
2
3
4
5
6
7-10
11
Amps
Volts
Watts
Watts/cm2
Joules
Joules/cm2
dBm
Reserved
Sun
82
Communication Command Reference
Related Commands: PM:UNITS,PM:UNITS?
Note: The UNITs selection depends on the detector used. Refer to Table 1 for
the relationship between the detector type and units.
8.3.3.42
PM:FILTer
Description
Filter select command
Syntax
PM:FILT filter type
Remarks
The PM:FILT command select the filtering operation to be
performed on power readings.
Argument
Value
Description
0
No filtering
1
Analog filter
2
Digital filter
3
Analog and Digital filter
Related Commands: PM:FILT?
Filter type
8.3.3.43
PM:FILTer?
Description
Filter type query
Syntax
PM:FILT?
Remarks
The PM:FILT? query returns an integer indicating the
present filter mode.
Response
Value
Description
0
No filtering
1
Analog filter
2
Digital filter
3
Analog and Digital filter
Related Commands: PM:FILT
Filter type
8.3.3.44
PM:Lambda
Description
Wavelength set command
Syntax
PM:Lambda value
Remarks
The PM:Lambda command selects the wavelength to use
when calculating power. The value must fall within the
calibrated wavelength of the detector.
Argument
Type
Description
Value
int
Wavelength in nanometers (nm)
Related Commands: PM:Lambda?, PM:MAX:Lambda?,
PM:MIN:Lambda?
Communication Command Reference
8.3.3.45
83
PM:Lambda?
Description
Wavelength query
Syntax
PM:Lambda?
Remarks
The PM:Lambda? query returns the selected wavelength
in nanometers. This is the wavelength used to look up the
responsivity from the calibration data.
Response
Type
Description
Wavelength
int
Wavelength in nanometers (nm)
Related Commands: PM:Lambda, PM:MAX:Lambda?,
PM:MIN:Lambda?
8.3.3.46
PM:MAX:Lambda?
Description
Maximum wavelength query
Syntax
PM:MAX:Lambda?
Remarks
The PM:MAX:Lambda? query returns the longest
calibrated wavelength in nanometers. If no detector is
preset, the max lambda for the last read detector is returned.
Response
Type
Description
Wavelength
int
Wavelength in nanometers (nm)
Related Commands: PM:MIN:Lambda?
8.3.3.47
8.3.3.48
PM:MAX:Power?
Description
Maximum power query
Syntax
PM:MAX:Power?
Remarks
The PM:MAX: Power? returns current range’s maximum
readable power.
Response
Type
Description
Power
float
Power in Watts
PM:MIN:Lambda?
Description
Minimum wavelength query
Syntax
PM:MIN:Lambda?
Remarks
The PM:MIN:Lambda? query returns the shortest
calibrated wavelength in nanometers. If no detector is
preset,min lambda for the last read detector is returned.
84
Communication Command Reference
Response
Type
Description
Wavelength
int
Wavelength in nanometers (nm)
Related Commands: PM:MAX:Lambda?
8.3.3.49
PM:MIN:Power?
Description
Minimum power query
Syntax
PM:MIN:Power?
Remarks
The PM:MIN: Power? returns current range’s minimum
readable power.
Response
Type
Description
Power
float
Power in Watts
Related Commands: PM:MAX:Power?
8.3.3.50
PM:MEAS:TIMEOUT
Description
Measurement timeout set command
Syntax
PM:MEAS:TIMEOUT value
Remarks
This command sets the measurement timeout period. This
value is used for making the following measurements:
1. Peak-to-peak measurements: These measurements are
updated once every timeout period when the power meter is
in Peak-Peak Continuous mode.
2. Auto-ranging in Pulse Continuous mode: The power
meter automatically shifts to a lower range once every
timeout period when it determines that no pulse
measurements could be taken in the existing range. Users
must set this timeout value to 250ms or larger than their
pulse repetition rate in order to be able to perform
measurements accurately.
Argument
Type
Description
Value
int
Timeout value (milliseconds)
Related Commands: PM:MEAS:TIMEOUT?
8.3.3.51
PM:MEAS:TIMEOUT?
Description
Measurement timeout query
Syntax
PM:MEAS:TIMEOUT?
Remarks
The PM:MEAS:TIMEOUT? query returns the selected
measurement timeout value in milliseconds.
Communication Command Reference
Response
Type
Description
Timeout
int
measurement timeout in milliseconds
85
Related Commands: PM:MEAS:TIMEOUT
8.3.3.52
PM:MODE
Description
Acquisition mode select
Syntax
PM:MODE mode
Remarks
The PM:MODE command selects the acquisition mode for
acquiring subsequent readings.
Argument
Value
Description
0
DC Continuous
1
DC Single
2
Integrate
3
Peak-to-peak Continuous
4
Peak-to-peak Single
5
Pulse Continuous
6
Pulse Single
7
RMS
Related Commands: PM:MODE?
Mode
Note: The MODE selection depends on the detector used. Refer to Table 1
for the relationship between the detector type and MODE.
8.3.3.53
PM:MODE?
Description
Acquisition mode query
Syntax
M:MODE?
Remarks
The PM:MODE? query returns an integer indicating the
present acquisition mode.
Response
Value
Description
0
DC Continuous
1
DC Single
2
Integrate
3
Peak-to-peak Continuous
4
Peak-to-peak Single
5
Pulse Continuous
6
Pulse Single
7
RMS
Related Commands: PM:MODE
Mode
Note: The UNITs selection depends on the detector used. Refer to Table 1 for
the relationship between the detector type and units.
86
Communication Command Reference
8.3.3.54
PM:Power?
Description
Power query
Syntax
PM:P?
Remarks
The PM:P? query returns the power in the selected units.
Response Type Description power exp Exponential form (i.e. 9.4689E-04)
Related Commands: PM:UNITS?, PM:PWS?
8.3.3.55
PM:PWS?
Description
Read with status query
Syntax
PM:PWS?
Remarks
The PM:PWS? query returns two values that are comma
delimited: The first value is the power reading and the
second value is the status. The status should be used to
validate the reading. The reading is in units corresponding
to the units field in the status word.
Response
Type
Description
Power reading
Status
exp
int
Power in present units
A bitfield in hexadecimal defining the
current channel status
NOTE
The bitfield is defined as follows:
Bits 10-7
Channel Units. See PM:UNITS?
Bits 6-4
Channel Range, See PM:RANge?
Bit 3
Detector Present
Bit 2
Channel range change status. Indicates if a measurement has
been taken while the unit is ranging
Bit 1
Detector Saturated (reserved, follows bit 0)
Bit 0
Channel overrange. Indicates that the current measurement is
overrange for the current channel range
Related Commands: PM:MODE?
Example
If the query returns the following values
1.862153E-004, 118
then the Power reading is 1.862153E-004 and the Status is the hex value 118
or the binary value 00100011000b. Taking into consideration the bitfield
definition, the status is decoded as follows:
Communication Command Reference
Bits
10 - 7
6-4
3
2
1
0
8.3.3.56
Binary
0010
001
1
0
0
Decimal
2
1
1
0
0
87
Function
units = Watts
range # 1
detector present
instrument not ranging during measurement
reserved
measurement is not over-range
PM:RANge
Description
Range select
Syntax
PM:RANge range
Remarks
The PM:RANge command selects the gain stage when
making readings from the detector head. The range of this
value depends on the detector being used.
Response
Type
Description
Values range from 0 to 5 for Thermopile and
Energy detectors or 0 to 4 for Photodiodes
(see Section 2.3.2).
Related Commands: PM:RANge?, PM:AUTO
8.3.3.57
range
int
PM:RANge?
Description
Range query
Syntax
PM:RANge?
Remarks
The PM:RANge? query returns an integer that indicates the
present range. The range of this value depends on the
detector being used.
Response
Value
Description
Values range from 0 to 5 for Thermopile and
Energy detectors or 0 to 4 for Photodiodes
(see Section 2.3.2).
Related Commands: PM:RANge, PM:AUTO
range
8.3.3.58
0
PM:REF:VALue
Description
Reference Value Define
Syntax
Parameters
PM:REF:VALue <val>
88
Communication Command Reference
The parameter <val>is of type <number>.
Function
This command provides a means of directly storing a reference value to be
used in linear and logarithmic (dB) relative measurements. The units of this
value are the current units being used by the instrument.
Related Commands: PM:REF:STOre,PM:REF:VALue?
8.3.3.59
PM:REF:VALue?
Description
Reference Value Query
Syntax
PM:REF:VALue?
Parameters
None
Function
This query returns the user defined reference value. The units of this value
are the current units being used by the instrument.
Returns <refval>
<refval> is of type <number>
Related Commands: PM:REF:STOre,PM:REF:VALue
8.3.3.60
PM:REF:STOre
Description
Reference Value Store
Syntax
PM:REF:STOre
Parameters
None
Function
This command takes the latest reading and stores it as a reference reading to
be used when making relative linear and dB measurements. The units of this
value are the current units being used by the instrument.
Related Commands: PM:REF:VALue,PM:REF:VALue?
8.3.3.61
PM:RESPonsivity?
Description
Responsivity query
Syntax
PM:RESP?
Remarks
The PM:RESP? query returns the responsivity currently
used in making power calculations.
Response
Type
Description
Responsivity
float
Optical Power Meter responsivity
Related Commands: PM:UNITS?, PM:PWS?
Communication Command Reference
8.3.3.62
89
PM:RUN
Description
Run command
Syntax
PM:RUN mode
Remarks
The PM:RUN command disables or enables the acquisition of data.
Argument
Value
Description
0
Stop
1
Run
Related Commands: PM:RUN?, PM:MODE?
Mode
8.3.3.63
PM:RUN?
Description
Run query
Syntax
PM:RUN?
Remarks
The PM:RUN? query returns an integer indicating the
present run mode.
Response
Value
Description
Mode
0
Stopped
1
Running
Related Commands: PM:RUN, PM:MODE?
8.3.3.64
PM:SPOTSIZE
Description
Set detector spot size
Syntax
PM:SPOTSIZE value
Remarks
This command sets the detector spot size. By default, the
spot size is same as a detector’s surface area. This value is
used to when measurement units are set to W/cm2, J/cm2 or
Sun.
Argument
Type
Description
Value
float
Spot size (cm2)
Related Commands: PM:SPOTSIZE?, PM:DETSIZE?
8.3.3.65
PM:SPOTSIZE?
Description
Detector spot size query
Syntax
PM:SPOTSIZE?
Remarks
The PM:SPOTSIZE? query returns the detector spot size
in cm2.
90
Communication Command Reference
Response
Type
Description
Spot size
float
detector spot size in cm2
Related Commands: PM:SPOTSIZE, PM:DETSIZE?
8.3.3.66
PM:STAT:MAX?
Description
Statistics Maximum Value Query
Syntax
PM:STAT:MAX?
Parameters
None
Function
This query returns the maximum value in the statistics buffer.
Returns
<max>
<max>is of type <number>in exponent notation.
8.3.3.67
PM:STAT:MEAN?
Description
Statistics Mean Value Query
Syntax
PM:STAT:MEAN?
Parameters
None
Function
This query returns the mean or average of all the values in
the statistics buffer.
Returns
<mean>
<mean>is of type <number>in exponent notation.
8.3.3.68
PM:STAT:MIN?
Description
Statistics Minimum Value Query
Syntax
PM:STAT:MIN?
Parameters
None
Function
This query returns the minimum value in the statistics
buffer.
Returns
<min>
<min>is of type <number>in exponent notation.
8.3.3.69
PM:STAT:MAXMIN?
Description
Statistics Max-Min Query
Syntax
PM:STAT:MAXMIN?
Parameters
None
Communication Command Reference
Function
This query returns the difference between the maximum
and minimum readings in the statistics buffer.
Returns
<mxmn>
91
<mxmn>is of type <number>in exponent notation.
8.3.3.70
PM:STAT:SDEViation?
Description
Statistics Standard Deviation Query
Syntax
PM:STAT:SDEViation?
Parameters
None
Function
This query returns the standard deviation of the readings in
the statistics buffer.
Returns
<stddev>
<stddev>is of type <number>in exponent notation.
8.3.3.71
PM:Temp?
Description
918 detectors temperature query
Syntax
PM:Temp?
Remarks
The PM:Temp? query returns the 918 detector's
temperature as a float in degrees Celsius.
Response
Type
Description
temp
float
Detector temperature in degrees Celsius (°C)
Related Commands: PM:ATT?
8.3.3.72
PM:TRIG:START
Description
This command sets the optional start event.
Syntax
PM:TRIG:START option
Parameters
The parameter <option> is of type <number> and is an integer from 0 to 3.
Argument
Value
Description
option
0
Continuous measurement
1
Reserved
2
Measurement starts when a designated
Soft key is pressed
3
Measurement starts when
PM:TRIG:STATE 1 command is issued.
92
Communication Command Reference
Related Commands: PM:TRIG: START?
8.3.3.73
PM:TRIG:START?
Description
Trigger START Query
Syntax
PM:TRIG:START?
Parameters
None
Function
This query returns the TRIGGER START condition.
Related Commands: PM:TRIG: START
8.3.3.74
PM:TRIG:STOP
Description
This command sets the optional stop event.
Syntax
PM:TRIG:STOP <option>
Parameters
The parameter <option> is of type <number> and is an integer from 0 to 6.
Argument
Value
Description
option
0
The measurement never stops
1
Reserved
2
Measurement stops when a designated Soft
key is pressed
3
Measurement stops when PM:TRIG:STATE
0 command is issued.
Related Commands: PM:TRIG: STOP?
8.3.3.75
PM:TRIG:STOP?
Description
Trigger STOP Query
Syntax
PM:TRIG:STOP?
Parameters
None
Function
This query returns the TRIGGER STOP condition.
Related Commands: PM:TRIG: STOP
8.3.3.76
PM:TRIG:STATE
Description
This command sets the trigger state
Syntax
PM:TRIG:STATE <option>
Communication Command Reference
93
Parameters
The parameter <option> is of type <number> and is an integer 0 or 1.
Argument
Value
Description
option
0
Trigger is armed. The system waits for a trigger
start event to occur in order to make a
measurement.
1
System is triggered and at least one
measurement occurred.
Related Commands: PM:TRIG: STATE?
8.3.3.77
PM:TRIG:STATE?
Description
Trigger STATE Query
Syntax
PM:TRIG:STATE?
Parameters
None
Function
This query returns the TRIGGER STATE condition.
Related Commands: PM:TRIG: STATE
8.3.3.78
PM:UNITs
Description
Units select
Syntax
PM:UNITS units
Remarks
The PM:UNITS command selects the units for readings.
Argument
Value
Description
units
0
1
2
3
4
5
6
7-10
11
Amps
Volts
Watts
Watts/cm2
Joules
Joules/cm2
dBm
Reserved
Sun
Related Commands: PM:MODE?
Note: The UNITs selection depends on the detector used. Refer to Table 1 for
the relationship between the detector type and units.
94
Communication Command Reference
8.3.3.79
PM:UNITs?
Description
Units query
Syntax
PM:UNITS?
Remarks
The PM:UNITS? query returns an integer indicating the
units selected.
Response
Value
Description
0
Amps
1
Volts
2
Watts
3
Watts/cm2
4
Joules
5
Joules/cm2
6
dBm
7-10
Reserved
11
Sun
Related Commands: PM:UNITS
units
Note: The UNITs selection depends on the detector used. Refer to Table 1 for
the relationship between the detector type and units.
8.3.3.80
PM:ZEROSTOre
Description
Zero value set command
Syntax
PM:ZEROSTO
Remarks
The PM:ZEROSTO command sets the zeroing value with
the present reading.
Argument
Type
none
-
Description
Related Commands: PM:ZEROVAL?
8.3.3.81
PM:ZEROVALue
Description
Zero value set command
Syntax
PM:ZEROVAL value
Remarks
The PM:ZEROVAL command sets the zeroing value.
When enabled, zeroing subtracts the stored zero value from
readings before making measurement calculations.
Argument
Type
Description
Value
float
Zeroing value
Related Commands: PM:ZEROSTO
Communication Command Reference
8.3.3.82
PM:ZEROVALue?
Description
Zero value query
Syntax
PM:ZEROVAL?
Remarks
The PM:ZEROVAL? query returns the zero value.
Response
Type
Description
value
float
Zero exponent
Related Commands: PM:ZEROVAL
95
96
Communication Command Reference
This page is intentionally left blank
9
Principles of Operation
9.1
Introduction
The 1928-C Optical Power Meter electronics adapt to a number of signal
measurement tasks: DC current or voltage, AC peak-to-peak current or pulse
voltage, or integrated DC current or voltage signals. This versatility is
required to handle the various signals that Newport’s Low Power, HighPower, Energy and other detector families generate. These detector families
are based on semiconductor, thermopile and pyroelectric. The detector data is
introduced to the 1928-C by way of a calibration module specific to the
detector in use. At power up (and RESET), the 1928-C downloads
information about the detector from the calibration module or the detector
internal memory. Based on the calibration module preprogrammed data, the
meter learns the set of operating states available to the detector. The user then
selects among the available operating states when using the meter. Front
panel control and the operating states of the 1928-C Optical Power Meter are
discussed in Section 3.
9.2
Analog Signal Flow
The detector signals can follow many different paths through the 1928-C
input amplifier chain. A block diagram of analog signal flow is shown in
Figure 57. The actual flow path depends upon the detector type and the mode
of measurement.
Figure 57
1928-C Optical Power Meter Analog Signal Flow Diagram
98
Principles of Operation
The analog signal flow path is primarily determined by the responsivity units
of the detector. The numerator of these units indicates how the meter must be
configured in order to obtain a calibrated optical measurement. Analog signal
flow is independent of whether single or continuous measurements are made.
Responsivity units and signal flows for the various detector families are listed
in Table 4.
Detector Family
Low-Power
Low-Power
Low-Power
High-Power
High-Power
Energy
Resp. Units
Mode
A/W
A/W
A/W
V/W
V/W
V/J
DC
Peak-Peak
Integral
DC
Integral
Pulse
Table 4
9.3
Amplifier
Path
I
I
I
V
V
V
PeakBaseline
No
No
No
No
No
Yes
Analog Signal Flow Paths.
Digitized Signal Flow
An analog-to-digital converter captures the input signal. The input signal has
the units of current or voltage depending upon how the input amplifier chain
was configured. Note: In this manual the digitized signal may be referred as
sampled signal or samples.
This digitized signal moves through a number of process steps that may or
may not alter the digitized value depending upon the operating state of the
meter. Each of these possible-processing steps is discussed further.
Digital Filter
If the digital filter annunciator Dig or Digital is on, Section 4.2.5, the filter
output is the average of the most recent 10, 100, 1000, 10000 samples. The
number of samples is selectable by the user with the Filter menu. Also, the
user can change the number of samples. When less than the selected number
of samples has been acquired since the last reset of the digital filter, the
output is the average of all the values received. The digital filter is reset when
the 1928-C Optical Power Meter is turned on and whenever the UNITS or the
range changes or when the MODE of operation changes.
NOTE
When using the digital filter in CW Single acquisition mode, each measurement is
the average of the last 10, 100, 1000, 10000 acquisitions independent of how old
any of the measurements are.
Gain
Gain processing accounts for the signal gain of the input amplifiers. The
output is the product of the digitized value and the amplifier gain.
Principles of Operation
99
Zero Offset
Zero offset is active whenever the Offset annunciator is lit. The zero offset
output is equal to the input value less the zero reference value.
Responsivity Map(s)
This process scales the input value in accordance with current calibration
wavelength and the responsivity map downloaded from the detector
calibration module. The output of this process, i.e. the measurement value, is
the digitized input value divided by the responsivity associated with the
current calibration wavelength or the user defined calibration value. Different
responsivities are used depending upon if the attenuator is on as shown in the
Setup Menu.
Units Correction
Unit’s correction adjusts a measurement value to account for the display units
selected. When the display units are equal to the detector signal units, i.e.
equal to the numerator of the responsivity units, Table 1, the measurement
value is not adjusted. Otherwise the digitized value is adjusted to account for
detector responsivity and/or additional unit conversions such as W-to-W/cm2.
NOTE
Per area unit conversions such as W-to-W/cm2 divide the measurement value by the
active area of the detector. This calculation assumes that the entire active area of
the detector is uniformly illuminated. Per area measurements where the entire
detector active area is not uniformly lit are not accurate. The user must insure that
these conditions are met before utilizing per area units or make measurement
corrections accordingly.
9.4
Typical Detector Signals
The flexibility of the 1928-C Optical Power Meter analog signal flow is
required in order that it may properly measure the signals that various types
of detectors make.
Basic optical power or energy measurements are related to a measured
detector signal, S, in the following way:
P or E =
Where:
S
Rλ
Rλ = Detector responsivity at λ
S = Detector signal
Semiconductor (918D/818 Series Low-Power) detectors provide a current
signal. The 1928-C is capable of 10 pA resolution in order to provide the
highest sensitivity performance with these detectors.
100
Principles of Operation
Thermopile (818P Series High-Power) detectors, provide a small voltage
signal.
The 1928-C is capable of 76.3 nV resolution in order to reach the sensitivity
limits of thermopile detectors.
Pyroelectric (818E Series Energy) detectors, deliver a peak voltage signal.
The1928-C is capable of capturing 2 µsec rise time voltage spikes so that it
may be operated with the fastest of these detectors.
9.5
Thermopile Detector Signals
Thermopile detectors respond with a voltage signal that slowly changes in
incident optical power. The time constant of most thermopile detectors is on
the order of 1 to 10 seconds.
Figure 58
9.6
Thermopile Signals exhibit 1 to 10 second time constants.
Pulse Energy Detector Signals
A Newport Energy detector will respond to a single radiant energy pulse with
a voltage pulse at its BNC output. This pulse exhibits a sharp voltage rise to a
peak followed by slower voltage decay that “undershoots” zero volts before
settling back to zero volts. When a detector is operated within its proper
limits, the voltage difference from immediately before the sharp rise to the
peak is linearly proportional to the radiant energy.
If a second pulse arrives before the “undershoot” rises back to zero volts, the
voltage rise from this pulse will start from an initial negative value. At
sufficient energy pulse repetition rates, a negative “baseline” voltage will
develop from which the voltage rise must now be measured to achieve
accurate energy readings. The 1928-C contains baseline capture circuitry that
maintains its accuracy specifications over rep-rates ranging from single pulse
to 10 kHz.
Principles of Operation
101
Figure 59
Typical Newport Energy Detector Signal Waveform
An energy detector signal sharply rises to a peak value and then decays going somewhat
negative before finally returning to zero. The energy in the radiant pulse is proportional to
the height of the peak measured from immediately before the sharp rise.
Figure 60
Negative Baseline Voltage.
Negative Baseline Voltage Due to a Pulse Train shown. If a laser pulse arrives before the
previous Energy detector signal has fully decayed, the detector signal rises from the present
decay point of the previous signal.
9.7
Peak-to-Peak (Photodiode) Detector Signals
The 1928-C enables one to make peak-to-peak measurements of time
varying signals from semiconductor photodiode detectors. Since optical
power is a zero bounded positive quantity, signals from a detector observing
such modulated light will similarly be zero bounded positive signals.
To make a peak-to-peak measurement, the 1928-C must be able to capture
both the maximum and minimum values of a detector signal. This is
accomplished by sampling the signal.
102
Principles of Operation
Figure 61
Time Varying Signal Measurements.
Many different measurements can be made on different portions of a time varying signal. The
most common are: DC power, peak power, and peak-to-peak power.
9.8
Integration of Detector Signals
The 1928-C provides for making measurements that integrate incoming
power detector signals to obtain energy via the CW Integrate mode. In CW
Integrate mode, the display units indicate Joules since energy is the time
integral of power:
t1
∫
E(λ) = P(λ)dt =
t0
t1
∫
t0
S( t )
dt
R (λ )
As the detector signal actually consists of a stream of digitized values, the
integral becomes a numerical approximation using the trapezoid method.
See Figure 62.
Figure 62
Integrated Energy Via a Trapezoid Approximation.
The INTG measurement mode performs a discrete integration at a 400 Hz sample rate.
Principles of Operation
103
Two common applications are natural extensions of the CW Integrate
measurement mode:
3. Pulse laser energy measurement using a thermopile detector
4. Energy from exposure over a period of time (dosage)
Figure 63
Measuring Laser Pulse Energy with a Thermopile.
Thermopiles are often used to measure pulsed laser energy by integrating the response of the
detector to the pulse.
9.9
Analog Output
The 1928-C provides an analog output for signal monitoring. The analog
output is the actual amplified detector signal and is uncorrected for the effects
of the detector’s responsivity, calibration, and ZERO. The analog output
signal is a representation of what the meter “sees” at its input. However, the
analog output signal may be filtered if the user selects the 5Hz filter (see
paragraph 4.2.5). Also, the analog output signal is amplified and scaled to the
selected analog output level (see Table 5).
The user can select the analog output level with a command,
PM:.ANALOG:OUT (see Section 8.3). The analog output maximum level
corresponds to the maximum full-scale input range the meter is set on. For
example, if one selects the analog output level at 1 V, and the meter is set on
250 mW maximum full-scale input range, the analog output signal will have
a transfer function of 250 mW/1 V. Therefore, if the analog output is
connected to an oscilloscope or voltmeter and the user reads 0.125 V, the
detector power is 125 mW.
The selectable analog output levels are given in Table 5.
Output Range
0
1
2
Full Scale Voltage (Load ≥ 1 MΩ)
1V
2V
5V
Table 5 Analog Output Range Table.
104
Principles of Operation
9.10
Measurement Considerations
This section describes detector characteristics, optical and electrical
considerations, and environmental influences on optical measurements. In
general, measurement accuracy is limited by the accuracy of the detector
calibration.
Accurate measurements, however, are also dependent upon proper set-up,
control of temperature and illumination conditions and understanding the
factors that affect optical measurements.
9.10.1
Detector Calibration and Uncertainty
Newport Corporation calibrates its detectors using secondary standards directly
traceable to the United States National Institute of Science and Technology
(NIST), to Great Britain’s National Physical Laboratory (NPL), or to National
Research Council (NRC) of Canada.
The details and uncertainty of the calibration procedure vary with each
detector model but a detailed description of the calibration results is supplied
with each individually calibrated detector. In general, detector calibration
uncertainty varies from 1% to 8% and varies with wavelength. Each detector
will also have some variation in response over its surface. Therefore, for the
most reproducible measurements, light should illuminate the detector as
uniformly as possible over as large an area as practical.
CAUTION
Avoid focusing a light source onto the detector surface.
Inaccurate readings and possible detector damage may result.
Consult the detector manual for saturation or damage
thresholds.
NIST trace ability requires that detectors be recalibrated on one-year intervals.
As individual detector responses change with time, especially in the
ultraviolet, recalibration is necessary to assure confidence in the uncertainty
of the measurement. For the most reproducible measurements, the same
detector should always be used for measurements that are to be directly
compared.
9.10.2
Quantum Detector Temperature Effects
Semiconductor (Newport Low-Power) detectors are affected by temperature.
At long wavelengths, quantum detectors typically lose sensitivity with
increasing temperature. Additionally, detector dark current increases
exponentially with temperature. Observed dark current is often dominated by
the interaction between the detector and a meter’s amplifier and is typically
larger than the theoretical dark current limit. Silicon detectors are inherently
quieter than germanium detectors due to their higher internal resistance and
Principles of Operation
105
lower capacitance. The noise or drift in the dark current sets a lower bound
on the measurement resolution that can be achieved with any given detector.
Cooling a detector significantly lowers its dark current and dark current
noise.
The observed dark currents can also be zeroed at any moment via the ZERO
function. Since dark currents drift with temperature, the ZERO should be
adjusted just prior to taking any measurements. If the detector temperature is
constant, sensitivity changes and dark current drifts are significantly reduced.
The 1928-C Optical Power Meter can measure the detector temperature and
correct the power readings accordingly. The power correction happens
automatically only for those detectors which are equipped with a thermistor
(Newport offers detectors with thermistors for temperature compensation.
See Newport web-site www.newport.com for more details.)
The thermistor signal is read via the detector DB-15 connector and the
displayed power is adjusted continuously depending on the detector
temperature. The analog output signal shows the detector signal and is not
corrected for temperature.
9.10.3
Thermopile Detector Temperature Effects
Thermopile (Newport High-Power) detectors are significantly affected by
temperature fluctuations arising from airflow disturbances. As the detector is
a temperature-measuring device, airflow disturbances set a practical lower
limit on the power that a detector can measure. In order to get the most out of
any thermopile detector, be careful to shield the detector from airflow
disturbances. Common sources of disturbance are: air conditioners and
people walking past.
9.10.4
Energy Detector Temperature Effects
Pyroelectric (Newport Energy) detectors are AC coupled devices and thus are
not susceptible to temperature induced DC signal offsets or noise floor
changes.
One generally does not need to take much precaution with pyroelectric
detectors except to make sure that their damage threshold is not exceeded.
9.10.5
Ambient and Stray Light
Ambient and stray light striking the detector should be considered when
making a measurement. Ambient light can be distinguished from dark current
(or the detector/meter noise floor) by either turning off or blocking the source
and covering the detector face with opaque material such as a piece of black
rubber.
Using the human hand to cover the detector is not advised because it emits a
significant amount of infrared radiation and radiates a temperature
significantly different from ambient. With the detector covered, a reading of
the dark current may be made. Next, remove the material that is covering the
detector and take another reading. The difference is the ambient light level.
106
Principles of Operation
NOTE
Changes in ambient light levels can occur from such factors as turning room lights
on or off, or by moving people or equipment. Remember, if you can see your
detector element, then your detector can see the light bouncing off you.
The effects of ambient light are greatly reduced when using a fiber-connectorized
signal input to the detector. If free-space beam measurements are desired, using an
attenuator will often improve the signal to ambient signal noise level.
Wavelength-specific filters, such as optical cutoff, band pass, or spike filters can be
used if the signal wavelength spectrum permits. Other techniques to reduce stray
light include using apertures, placing the detector in a box or other housing to shield
the surface from light (or air currents) and turning off room and other polluting light
sources.
9.10.6
Signal Filtering
The 1928-C Optical Power Meter offers the user the option to filter the
detector signal. There are two programmable filters that can be used
individually or together to condition the detector signal: the Analog Filter and
the Digital Filter.
The Analog Filter is a hardware based, programmable low-pass filer. The
user can select the following settings: 5Hz, 1kHz, 12.5kHz, and 250kHz.
This flexibility is offered to the user to improve the measurement precision
for different detectors.
It is well known that white noise has large spectrum. The noise level
increases with bandwidth. The higher the noise, the higher the minimum
signal that can be measured. The quality of the measurement can be linked to
the signal-to-noise ratio (SNR): the higher the SNR, the better the
measurement precision of very small signals. In order to increase the SNR the
user may choose to cut the bandwidth of the power meter, depending on the
detector signal.
For example, if the detector is modulated with a sine wave of 800Hz, the user
may choose to set the Analog filter to 1kHz to increase the SNR and be able
to measure very small signals. Also, cutting the bandwidth at 1kHz does not
affect the measurement. However, if the modulation frequency is 800Hz, but
the signal is a square, the user may opt to cut the bandwidth higher, at
12.5kHz, to let the signal harmonics be unfiltered and minimize the
distortion. Of course, in this case, the noise in the system will increase with
the square root of the bandwidth. The user needs to asses the tradeoffs in his
measurement, taking advantage of the 1928-C high flexibility in setting the
proper filters for the measurement.
Generally, the 5Hz filter is used for CW Cont. measurements. However, the
1928-C Optical Power Meter can measure the amplitude of AC signals down
to 0.01Hz, so the 5Hz filter can be used for any modulating signal below
5Hz.
Principles of Operation
107
The Digital Filter is a moving average filter that can be set at 10, 100, 1000,
or 10000 measurements. These values can be changed by the user. If the
digital filter is set on 10, the average value is computed on 10 measurements,
in a First In First Out (FIFO) fashion. The Digital Filter helps the SNR the
same way as the Analog Filter does. With both filters on, low level,
continuous signals can be measured with a high degree of accuracy.
The Analog Filter is always applied to the entire amplifier chain of the meter.
Therefore, the user will see the detector signal filtered at the Analog Output
BNC. The Digital Filter is a digital signal-processing filter and is only
applied to the calculated measured values that are displayed on the meter
screen. While the displayed values may have both filters applied (An+Dg) the
Analog Output can only have the Analog Filter applied to the signal. Because
of that, the user may see a difference in the way the signal is filtered between
the displayed values and the Analog Output values.
9.11
Common Measurement Errors
The most common sources of optical measurement error are listed in Table 6
below. Other common errors are discussed in the preceding subsections of
Measurement Considerations.
Type of Error
What should be done?
Radiometry
Check that all of the light is actually hitting the
detector
Ambient light
Check that any ambient light was ZEROed before
the measurement was made.
Wavelength calibration
Check that the calibration factor for the
measurement wavelength is properly set.
Detector saturation or
damage
Check that the optical power density remains below
the detector’s saturation or damage
Table 6 Common Measurement Errors
108
Principles of Operation
This page is intentionally left blank
10
Troubleshooting
10.1
Power Supply Problems
Problem
Solution
1 The unit does not turn
on.
1. Verify that the power switch is in the
ON position (See Section 1.1.6.).
2. Verify that the AC line cord is firmly
connected to both the unit and the
MAINS power outlet.
3. Verify that there is power to the
MAINS power outlet.
10.2
Analog Output Problems
1
10.3
Problem
Solution
There is no AC signal at
the analog output
Check if the 5 Hz Analog Filter is on.
Questions and Answers
Q. I am trying to update the firmware but my USB flash drive is not working.
I don’t see any light on the memory stick.
A. The USB flash drive needs to be WinCE compatible. WinCE is the
operating system of 1928C power meter.
Q. Is the detector hot swappable?
110
Troubleshooting
A. Yes, you can swap the detector without having to turn off the power
meter.
Q. Is it possible to write the measurement data into Spreadsheet?
A. Yes, you can plug in a USB flash drive into the power meter and save the
data from the Statistics screen.
Q. Is it possible to use a third party detector with the 1928-C Optical Power
Meter?
A. It may be possible for some measurements by purchasing a special
adaptor. Contact Newport Corporation for availability and details.
Q. I would like to change the configuration back to the factory default
setting. How can I do that?
A. Turn off the Power Meter. Hold down both “ZERO and “HOLD” buttons
and turn on the Power Meter. A message window appears. Choose YES or
NO for reset by using the left-right arrow keys and press enter.
Q. The display shows some noise and fluctuation when I measure my CW
light source. Any suggestions?
A. Turn on the analog/digital filter. Check whether the meter and detector
calibration is up-to-date.
Q. Can I measure peak power or energy of a single pulse with a Newport low
power detector (918D, etc.) and 1928-C?
A. No. There is no energy or peak power mode measurement with the 1928-C
when using a low power detector.
11
Maintenance and Service
CAUTION
There are no user serviceable parts inside the 1928-C Optical
Power Meter. Work performed by persons not authorized by
Newport Corporation will void the warranty.
Calibration accuracy is warranted for a period of 1 year. After
1 year, the unit should be returned to Newport Corporation for
recalibration and NIST traceability re-certification.
11.1
Enclosure Cleaning
WARNING
Before cleaning the enclosure of the 1928-C Optical Power
Meter, the external power supply must be disconnected from the
unit.
The enclosure should only be cleaned with isopropyl alcohol or a mild soapy
water solution applied to a damp lint-free cloth.
11.2
Obtaining Service
The 1928-C Optical Power Meter contains no user serviceable parts. To
obtain information regarding factory service, contact Newport Corporation or
your Newport representative. Please have the following information
available:
1. Instrument model number (on the rear panel).
2. Instrument serial number (on rear panel).
3. Description of the problem.
If the instrument is to be returned to Newport Corporation, you will be given
a Return Number, which you should reference in your shipping documents.
Please fill out a copy of the service form, located on the following page, and
have the information ready when contacting Newport Corporation. Return
the completed service form with the instrument.
112
Maintenance and Service
11.3
Service Form
Newport Corporation
U.S.A. Office: 800-222-6440
FAX: 949/253-1479
Name _______________________________
Return Authorization #__________________
(Please obtain RA# prior to return of item)
Company ________________________________________________________________________
(Please obtain RA # prior to return of item)
Address ________________________________ ____________________Date _________________
Country _______________________ Phone Number ______________________________________
P.O. Number ___________________ FAX Number _______________________________________
Item(s) Being Returned:
Model # _______________________ Serial # __________________________
Description _______________________________________________________________________
Reason for return of goods (please list any specific problems):
12
Appendix A – Syntax and
Definitions
12.1
Definition of <string>
For convenience, the 1928-C recognizes double quoted, single quoted, and
unquoted strings with certain restrictions as detailed below. Any of these
forms may be used where a <string> parameter is required.
1. <string>,using double quotes
“this is a string”
2. <string>,using single quotes.
‘this is a string’
3. <string>,using no quotes.
thisisastring
A description of each type of <string follows:
1. <string> defined using double quotes.
A double quote indicates that a string follows, and the string is terminated
by another double quote. A double quote may be embedded within the
string by using two double quotes together:
Example: “this string contains a “”double quote”
All characters within the two outer double quotes are considered part of
the string. It is an error if the string does not terminate with a double
quote. The string cannot contain the <CR>(ASCII decimal 13),
<LF>(ASCII decimal 10), or End or Identify characters.
2. <string> defined using single quotes.
This form is similar to double quoted string. A single quote indicates that
a string follows, and the string is terminated by another single quote. A
single quote may be embedded within the string by using two single
quotes together:
Example: ‘this string contains a‘’single quote’
All characters within the two outer single quotes are considered part of the
string. It is an error if the string does not terminate with a single quote.
The string cannot contain the <CR>(ASCII decimal 13), <LF>(ASCII
decimal 10), or End or Identify characters.
3. <string> defined using no quotes.
114
Appendix A
All strings using this format must start with an alphabetic character (A
through Z, a through z). All other characters must be either alphabetic, digit
(0 through 9)or the ‘_’ character. Any other character will delimit the string.
Some examples are shown below:
Sent: this is a string
Interpreted:
this
(1st string)
is
(2nd string)
a
(3rd string)
string
(4th string)
Sent: this,isastring
Interpreted:
this
(1st string)
,
(separator character)
isastring
(2nd string)
Sent: w/cm
Interpreted:
12.2
w
(1st string)
ERROR
(unrecognized character)
cm
(2nd string)
Definition of <number>
The 1928-C recognizes four types as <number> ,thus any format may be
used.
1.
<number> defined as floating point.
2.
<number> defined as binary.
3.
<number> defined as octal.
4.
<number> defined as hexadecimal.
Where necessary, integers are converted to floating point numbers. In all
cases, a number is terminated by any of the below characters:
<NL> <EOI> <SPACE>
Any non-valid characters detected in any number received are considered an
error in format, and an error condition will be generated in the system.
A description of each type of <number> follows:
1.
<number> defined as floating point.
Appendix A
Any of the following characters, as the first character of an ASCII sequence,
indicates that a number is being defined:
+-.0 1 2 3 4 5 6 7 8 9
A floating point number is defined as follows:
1. Optional +-sign. This defines the sign of the number. If missing, positive
is assumed.
2. Optional 0-9 digits. These digits define the integer portion of the
mantissa.
3. Optional . decimal point. This defines the end of the integer portion of the
mantissa, and indicates that the fractional portion of the mantissa follows.
4. Optional 0 -9 digits. These digits define the fractional portion of the
mantissa.
5. Optional exponent indicator, an ASCII ‘E ’ or ‘e ’,followed by a ‘+’ or ‘-’
(optional), followed by decimal digits.
Examples:
The numbers below all represent the value “1.2 ”
1.2
1.2e0
+01.2E+00000
120E-2
.12e1
The numbers below all represent the value “-1.2 ”
-1.2
-1.2e+00
-0001.2e+0
-120e-2
.12E1
2. <number>defined as binary.
The 1928-C recognizes unsigned binary numbers in the range of 0 to 65535,
decimal, or 0 to 1111111111111111 binary. Binary numbers are represented
using only the digits 0 and 1.A binary number has the following format:
#B<binary>
Where
#B = mandatory binary number header
<binary> = binary digits (0’s or 1’s)
116
Appendix A
Example:
All numbers below represent the decimal value 129.
#B10000001
#b010000001
#b10000001
3. <number> defined as octal.
The 1928-C recognizes unsigned octal numbers in the range 0 to 65535
decimal, or 0 to 177777 octal. Octal numbers are represented using digits
from 0 to 7.An octal number has the following format:
#Q<octal>
Where
#Q =mandatory octal number header
<octal> =octal digits (0 to 7)
Example:
All numbers below represent the decimal value 129.
#Q201
#q0201
#q201
4. <number>defined as hexadecimal.
The 1928-C recognizes unsigned hexadecimal numbers in the range 0 to
65535 decimal, or 0 to FFFF hexadecimal. Hexadecimal numbers are
represented using the digits 0 -9 and the characters A -F.A hexadecimal
number has the following format:
#H<hexadecimal>
Where
#H =mandatory octal number header
<hexadecimal> =hexadecimal digits (0 -9 and A -F)
Example:
All numbers below represent the decimal value 127.
#H7f
#H007F
#h7f
13
Appendix B – Error Messages
13.1
Introduction
The communication errors can be retrieved with the following commands:
*ERR? or ERRSTR?. The descriptions of the returned errors are detailed in
the next sections.
13.2
Command Errors
Command Errors are associated with the conversion of the data received into
the commands and their parameters (parsing). Incorrect syntax, incorrect
parameters, and improper command format will generate these errors. Any
command error will cause the Command Error bit (bit 5) in the Standard
Event Status Byte to be set.
104, Numeric Type Not Defined
Generated during the parsing of a number and an undefined number type is
encountered.
106, Digit Expected
Generated during the parsing of a number and the parser encounters a nonnumber when a number is expected.
107, Digit Not Expected
Generated during the parsing of a number and the parser encounters a number
when a different character is expected.
115, Identifier Not Valid
Generated when a parameter is not valid or not properly formed.
116, Syntax Error
Occurs when an error in command structure or parameter type is detected.
Some typical causes are:
• Using a number as a command mnemonic.
• Using the wrong parameter type.
• Using ASCII characters outside of a string constant that are not defined by
the command language syntax.
• Missing or too many parameters.
The above list in not exhaustive but does give the basic idea of what to look for.
118
Appendix B
126, Too Many Or Few Arguments
Generated when command arguments are missing or too many.
13.3
Execution Errors
Execution Errors are associated with the interpretation of the converted
commands and parameters received. Incorrect parameter values and
numerical range errors are types of execution errors. Any execution error
will cause the Execution Error bit (bit 4) in the Standard Event Status Byte to
be set.
1, Out of memory
This error is caused by an internal program fault, and may be followed by an
automatic instrument reset.
201, Value Out Of Range
This error will occur if a parameter is out of a valid range or not in the set of
valid parameters for a given command.
214, Exceeds Maximum Length
Generated when the command exceeds the maximum command length. Try
shortening the command string.
217, No saved information in recalled bin
Generated when the user attempts to recall a bin which has no previous stored
data.
301, Query Error
The Query Error occurs when the instrument is in the midst of transmitting a
message over a communication bus and the instrument exits remote mode.
303, Input Buffer Overflow
Error generated when the system parser runs out of space during reception of
command. It may occur if commands are not terminated correctly. Input
buffer is 1,024 characters long.
304, Output Buffer Overflow
Error generated when the system parser runs out of space for query results. It
may occur if query results in too much data to be returned in a single
response, or if multiple command queries are issued but not read. Output
buffer is 4,096 characters long.
305, Parser Buffer Overflow
Error generated when the system parser runs out of space for commands. A
command is received into the input buffer then transferred to the parser buffer.
This error is generated if the command in the input buffer is too large to fit into
the available space in the parser buffer. It is usually generated when commands
Appendix B
are sent to the instrument faster than it can process. Parser buffer is 2,048
characters long.
13.4
Device Errors
Device Errors are associated with some system condition that affects the
operation of the meter. Errors associated with data reading will set the
appropriate bit but will not generate an error message to avoid jamming the
error queue or the interface.
701, Detector Calibration Read or Write Failed.
An error was encountered during a read/write operation to the calibration
EPROM in the detector. If problem persists, contact the factory.
703, Optical Power Meter set to defaults due to Firmware update
After upgrading the firmware, in some cases the changes are significant
enough to require resetting the instrument to factory defaults.
704, User reference cannot be changed/stored while you are in units of
Watts or dBm. Change to dB or Rel to set the user reference value.
User reference can only be stored in dB or Rel mode.
705, Illegal data store parameter change. Queue cleared.
An action that affects the data store caused the data store queue to be cleared.
706, Digital Filter Interval changed, must not be greater than Data Store
interval.
The digital filter interval cannot be greater than the data store interval.
707, Digital Filter Disabled with External Trigger.
Digital filter must be disabled during external trigger mode.
708, There is no new data for a statistics update.
No new data has been stored in the data store since the last statistics update.
709, Statistics are not calculated while Data Store is running.
User attempted to compute statistics while data store was active. Turn off
data store and compute.
120
Appendix B
This page is intentionally left blank
14
Appendix C - Legacy
Commands Reference
Legacy
Commands
New Commands
ATTN_n
PM:ATT
1
ATTN_n?
PM:ATT?
NONE
ATTNSN_n?
PM:ATTSN?
NONE
AUTO_n
PM:AUTO
1
AUTO_n?
PM:AUTO?
NONE
CALDATE_n?
PM:CALDATE?
NONE
CALTEMP_n?
PM:CALTEMP?
NONE
DETMODEL_n?
DETSN_n?
DSBUF_n
DSBUF_n?
DSCLR_n
DSCNT_n?
DSE_n
DSE_n?
PM:DETMODEL?
PM:DETSN?
PM:DS:BUFfer
PM:DS:BUFfer?
PM:DS:CLear
PM:DS:Count?
PM:DS:ENable
PM:DS:ENable?
NONE
NONE
1
NONE
NONE
NONE
1
NONE
DS_n?
PM:DS:GET?
SFREQ
SFREQ?
DSSIZE_n
DSSIZE_n?
DSUNITS_n?
PM:DS:INTerval
PM:DS:INTerval?
PM:DS:SIZE
PM:DS:SIZE?
PM:DS:UNITs?
FILTER_n
PM:FILTer
1
FILTER_n?
PM:FILTer?
NONE
LAMBDA_n
LAMBDA_n?
MODE_n
MODE_n?
R_n?
RWS_n?
PM:Lambda
PM:Lambda?
PM:MODE
PM:MODE?
PM:Power?
PM:PWS?
1
NONE
1
NONE
NONE
NONE
RANGE_n
PM:RANge
1
RANGE_n?
PM:RANge?
NONE
RESP_n?
PM:RESPonsivity?
NONE
Number of
Parameters
1
1
NONE
1
NONE
NONE
Function
Selects if the attenuator's calibration data is included
for power calculation.
Returns setting if attenuator data should or should not
be used when calibrating the Optical Power Meter.
Gets the attenuator serial number.
Sets the Optical Power Meter ranging to manual or
automatic.
Returns 1 if automatic Optical Power Meter ranging is
selected.
Returns the calibration date of the detector.
Returns the temperature at which the calibration was
performed.
Returns the model number of the detector.
Returns the serial number of the detector.
Set data store behavior select.
Return data store behavior select.
Clear data store.
Return data store count of items stored.
Set data store enable.
Return data store enable.
Return data store data. {1,1-10,-5,+5} – value, range,
oldest 5, newest 5
Set data store interval.
Return data store interval.
Set data store max size.
Return data store max size.
Return data store units.
Selects the filtering operation: no filtering, analog
filter, digital filter, or analog and digital.
Returns the filtering operation: no filtering, analog
filter, digital filter, or analog and digital.
Sets the wavelength for use when calculating power.
Gets the selected wavelength in nanometers.
Returns the currently selected acquisition mode.
Returns the power in the selected units.
Returns the power with status.
Selects the gain stage when making readings with the
detector head within a range from 0 to 5 (with zero
being the highest).
Returns an integer indicating the current range.
Gets the responsivity currently used for making power
calculations.
122
Appendix C
Legacy
Commands
RUN_n,
STOP_n
RUN_n?,
STOP_n
STMAX_n?
STMEAN_n?
STMIN_n?
STMXMN_n?
STSDEV_n?
UNITS_n
UNITS_n?
Number of
Parameters
New Commands
Function
PM:RUN
1
PM:RUN?
NONE
Returns the present acquisition mode.
PM:STAT:MAX?
PM:STAT:MEAN?
PM:STAT:MIN?
PM:STAT:MAXMIN?
PM:STAT:SDEViation?
PM:UNITs
PM:UNITs?
NONE
NONE
NONE
NONE
NONE
1
NONE
Return statistics buffer maximum value.
Return statistics buffer mean value.
Return statistics buffer minimum value.
Return statistics buffer maximum-minimum value.
Return statistics buffer standard deviation value.
Selects the units for readings.
Returns an integer indicating the selected units.
Sets the user reference value for use in relative or dB
readings.
Returns the user reference value.
Sets the user reference value for use in relative or dB
readings as the present reading.
Sets the zeroing value with the present reading.
Sets the zeroing value.
Gets the zeroing value.
USRREF_n
PM:REF:VALue
1
USRREF_n?
PM:REF:VALue?
NONE
STOREF_n
PM:REF:STOre
NONE
STOZERO_n
ZEROVAL_n
ZEROVAL_n?
PM:ZEROSTOre
PM:ZEROVALue
PM:ZEROVALue?
NONE
1
NONE
Disables or enables the acquisition of data.
Table 7 Legacy Commands Reference
15
Appendix D – Sample Programs
15.1
Programming Samples
The CD will install some simple programming samples to get computer
interfacing started. These are minimal samples and provided only for
reference.
15.2
LabVIEW
LabVIEW programming samples separated in folders based on version of
LabVIEW compiled with. SampleQuery.vi demonstrates the use of the
drivers.
15.3
Microsoft® Visual Basic
A zip file in the application folder contains a simple Visual Basic project for
communicating with the meter.
15.4
Microsoft Visual C++
A zip file in the application folder contains a simple Visual C++ project for
communicating with the meter.
15.5
Microsoft .NET
A zip file in the application folder contains a simple .NET project for
communicating with the meter.
124
Appendix D
This page is intentionally left blank
16
Appendix E – Disassembly
Instructions
NOTE
These disassembly instructions are intended only for recycling at the end of the
product lifetime.
For troubleshooting or servicing, users should contact the local Newport Corporation
representative. There are no user serviceable parts inside the equipment.
Attempting to self-service the unit will void the warranty.
16.1
Disassembly instructions
Figure 64 shows an exploded version of the 1928-C.
For recycling purposes only, the disassembly steps are as follows:
1. Make sure the unit power cord is removed.
2. Remove any other cables: detectors, Analog Output monitor cables, USB,
and ground cables.
3. Remove the bottom screws of the cover.
4. Remove the cover.
5. Remove all the screws on the rear panel.
6. Remove the rear panel.
7. Remove the screws and posts of each assembly and unplug each assembly
from the enclosure.
8. Remove the front panel screws.
9. Remove Assembly 1 from the front panel.
126
Appendix E
Cover
Assembly 3
Assembly 2
Rear Panel
Enclosure
Assembly 1
Front Panel
Figure 64
Disassembled 1928-C Optical Power Meter
End User License Agreement for Embedded Software Components
You have acquired a device (“DEVICE”) that includes software licensed by Newport Corporation (“Newport”) from an affiliate of Microsoft
Corporation (“MS”). Those installed software products of MS origin, as well as associated media, printed materials, and “online” or electronic
documentation (“SOFTWARE”) are protected by international intellectual property laws and treaties. Manufacturer, MS and its suppliers
(including Microsoft Corporation) own the title, copyright, and other intellectual property rights in the SOFTWARE. The SOFTWARE is
licensed, not sold. All rights reserved.
This End User License Agreement (“EULA”) is valid and grants the end-user rights ONLY if the SOFTWARE is genuine Certificate of
Authenticity for the SOFTWARE is included. For more information on identifying whether your software is genuine, please see
http://www.microsoft.com/piracy/howtotell.
IF YOU DO NOT AGREE TO THIS EULA, DO NOT USE THE DEVICE OR COPY THE SOFTWARE. INSTEAD, PROMPTLY
CONTACT NEWPORT FOR INSTRUCTIONS ON RETURN OF THE UNUSED DEVICES(S) FOR A REFUND. ANY USE OF THE
SOFTWARE, INCLUDING BUT NOT LIMITED TO USE ON THE DEVICE, WILL CONSTITUTE YOUR AGREEMENT TO THIS
EULA (OR RATIFICATION OF ANY PREVIOUS CONSENT).
GRANT OF SOFTWARE LICENSE. This EULA grants you the following license:
•
•
•
•
•
•
•
•
•
•
•
You may use the SOFTWARE only on the DEVICE.
Restricted Functionality. You are licensed to use the SOFTWARE to provide only the limited functionality (specific tasks or processes)
for which the DEVICE has been designed and marketed by Newport. This license specifically prohibits any other use of the software
programs or functions, or inclusion of additional software programs or functions that do not directly support the limited functionality on the
DEVICE. Notwithstanding the foregoing, you may install or enable on a DEVICE, systems utilities, resource management or similar
software solely for the purpose of administration, performance enhancement and/or preventive maintenance of the DEVICE.
If you use the DEVICE to access or utilize the services or functionality of Microsoft Windows Server products (such as Microsoft Windows
Server 2003), or use the DEVICE to permit workstation or computing devices to access or utilize the services or functionality of Microsoft
Windows Server products, you may be required to obtain a Client Access License for the DEVICE and/or each such workstation or
computing device. Please refer to the end user license agreement for your Microsoft Window Server product for additional information.
NOT FAULT TOLERANT. THE SOFTWARE IS NOT FAULT TOLERANT. NEWPORT HAS INDEPENDENTLY DETERMINED
HOW TO USE THE SOFTWARE IN THE DEVICE, AND MS HAS RELIED UPON NEWPORT TO CONDUCT SUFFICIENT
TESTING TO DETERMINE THAT THE SOFTWARE IS SUITABLE FOR SUCH USE.
NO WARRANTIES FOR THE SOFTWARE. The SOFTWARE is provided “AS IS” and with all faults. THE ENTIRE RISK AS TO
SATISFACTORY QUALITY, PERFORMANCE, ACCURACY, AND EFFORT (INCLUDING LACK OF NEGLIGENCE) IS WITH
YOU. ALSO, THERE IS NO WARRANTY AGAINST INTERFERENCE WITH YOUR ENJOYMENT OF THE SOFTWARE OR
AGAINST INFRINGEMENT. IF YOU HAVE RECEIVED ANY WARRANTIES REGARDING THE DEVICE OR THE
SOFTWARE, THOSE WARRANTIES DO NOT ORIGINATE FROM, AND ARE NOT BINDING ON, MS.
No Liability for Certain Damages. EXCEPT AS PROHIBITED BY LAW, MS SHALL HAVE NO LIABILITY FOR ANY
INDIRECT, SPECIAL, CONSEQUENTIAL OR INCIDENTAL DAMAGES ARISING FROM OR IN CONNECTION WITH
THE USE OR PERFORMANCE OF THE SOFTWARE. THIS LIMITATION SHALL APPLY EVEN IF ANY REMEDY FAILS
OF ITS ESSENTIAL PURPOSE. IN NO EVENT SHALL MS BE LIABLE FOR ANY AMOUNT IN EXCESS OF U.S. TWO
HUNDRED FIFTY DOLLARS (U.S. $250.00).
Restricted Uses. The SOFTWARE is not designed or intended for use or resale in hazardous environments requiring fail-safe performance,
such as in the operation of nuclear facilities, aircraft navigation or communication systems, air traffic control, or other devices or systems in
which a malfunction of the SOFTWARE would result in foreseeable risk of injury or death to the operator of the device or system, or to
others.
Limitations on Reverse Engineering, Decompilation, and Disassembly. You may not reverse engineer, decompile, or disassemble the
SOFTWARE, except and only to the extent that such activity is expressly permitted by applicable law notwithstanding this limitation.
SOFTWARE as a Component of the DEVICE – transfer. This license may not be shared, transferred to or used concurrently on
different computers. The SOFTWARE is licensed with the DEVICE as a single integrated product and may only be used with the
DEVICE. If the SOFTWARE is not accompanied by a DEVICE, you may not use the SOFTWARE. You may permanently transfer all of
your rights under this EULA only as part of a permanent sale or transfer of the DEVICE, provided you retain no copies of the SOFTWARE.
If the SOFTWARE is an upgrade, any transfer must also include all prior versions of the SOFTWARE. This transfer must also include the
Certificate of Authenticity label. The transfer may not be an indirect transfer, such as a consignment. Prior to the transfer, the end user
receiving the SOFTWARE must agree to all the EULA terms.
Consent to Use of Data. You agree that MS, Microsoft Corporation and their affiliates may collect and use technical information gathered
in any manner as part of product support services related to the SOFTWARE. MS, Microsoft Corporation and their affiliates may use this
information solely to improve their products or to provide customized services or technologies to you. MS, Microsoft Corporation and their
affiliates may disclose this information to others, but not in a form that personally identifies you.
Links to Third Party Sites. You may link to third party sites through the use of the SOFTWARE. The third party sites are not under the
control of MS or Microsoft Corporation, and MS or Microsoft are not responsible for the contents if any third party sites, any links
contained in third party sites, or any changes or updates to third party sites. MS or Microsoft Corporation is not responsible for webcasting
or any other form of transmission received from any third party sites. MS or Microsoft Corporation are providing these links to third party
sites to you only as a convenience, and the inclusion of any link does not imply an endorsement by MS or Microsoft Corporation of the
third party site.
128
•
•
•
•
•
•
•
•
•
•
Notice Regarding Security. To help protect against breaches of security and malicious software, periodically back up your data and
system information, use security features such as firewalls, and install and use security updates.
No Rental/Commercial Hosting. You may not rent, lease, lend or provide commercial hosting services with the SOFTWARE to others.
Separation of Components. The SOFTWARE is licensed as a single product. Its component parts may not be separated for use on more
than one computer.
Additional Software/Services. This EULA applies to updates, supplements, add-on components, product support services, or Internetbased services components (“Supplemental Components”), of the SOFTWARE that you may obtain from Newport, MS, Microsoft
Corporation or their subsidiaries after the date you obtain your initial copy of the SOFTWARE, unless you accept updated terms or another
agreement governs. If other terms are not provided along with such Supplemental Components and the Supplemental Components are
provided to you by MS, Microsoft Corporation or their subsidiaries then you will be licensed by such entity under the same terms and
conditions of this EULA, except that (i) MS, Microsoft Corporation or their subsidiaries providing the Supplemental Components will be
the licensor with respect to such Supplemental Components in lieu of Newport for the purposes of the EULA, and (ii) TO THE
MAXIMUM EXTENT PERMITTED BY APPLICABLE LAW, THE SUPPLEMENTAL COMPONENTS AND ANY (IF ANY)
SUPPORT SERVICES RELATED TO THE SUPPLEMENTAL COMPONENTS ARE PROVIDED AS IS AND WITH ALL FAULTS.
ALL OTHER DISCLAIMERS, LIMITATION OF DAMAGES, AND SPECIAL PROVISIONS PROVIDED BELOW AND/OR
OTHERWISE WITH THE SOFTWARE SHALL APPLY TO SUCH SUPPLEMENTAL COMPONENTS. MS, Microsoft Corporation or
their subsidiaries reserve the right to discontinue any Internet-based services provided to you or made available to you through the use of
the SOFTWARE.
Recovery Media. If SOFTWARE is provided by Newport on separate media and labeled “Recovery Media” you may use the Recovery
Media solely to restore or reinstall the SOFTWARE originally installed on the DEVICE.
Backup Copy. You may make one (1) backup copy of the SOFTWARE. You may use this backup copy solely for your archival purposes
and to reinstall the SOFTWARE on the DEVICE. Except as expressly provided in this EULA or by local law, you may not otherwise make
copies of the SOFTWARE, including the printed materials accompanying the SOFTWARE. You may not loan, rent, lend or otherwise
transfer the backup copy to another user.
End User Proof of License. If you acquired the SOFTWARE on a DEVICE, or on a compact disc or other media, a genuine Microsoft
“Proof of License”/Certificate of Authenticity label with a genuine copy of the SOFTWARE identifies a licensed copy of the SOFTWARE.
To be valid, the label must be affixed to the DEVICE, or appear on Newport’s software packaging. If you receive the label separately other
than from Newport, it is invalid. You should keep the label on the DEVICE or packaging to prove that you are licensed to use the
SOFTWARE.
Product Support. Product support for the SOFTWARE is not provided by MS, Microsoft Corporation, or their affiliates or subsidiaries.
For product support, please refer to the Newport support number provided in the documentation for the DEVICE. Should you have any
questions concerning this EULA, or if you desire to contact Newport for any other reason, please refer to the address provided in the
documentation for the DEVICE.
Termination. Without prejudice to any other rights, Newport may terminate this EULA if you fail to comply with the terms and conditions
of this EULA. In such event, you must destroy all copies of the SOFTWARE and all of its component parts.
Export Restrictions. You acknowledge that SOFTWARE is subject to U.S. and European Union export jurisdiction. You agree to comply
with all applicable international and national laws that apply to the SOFTWARE, including the U.S. Export Administration Regulations, as
well as end-user, end-use and destination restrictions issued by U.S. and other governments. For additional information, see
http://www.microsoft.com/exporting/.
Newport Corporation
Worldwide Headquarters
1791 Deere Avenue
Irvine, CA 92606
(In U.S.): 800-222-6440
Tel: 949-863-3144
Fax: 949-253-1680
Internet: [email protected]
Visit Newport Online at: www.newport.com