1
ProCop 3.5 Monitoring and Visualisation System
ProCop 3.5
User's Guide
R
© ALFA Mikrosystémy, s.r.o.
Ostrava 2015
ProCop 3.5
User's Guide
ALFA Mikrosystémy, s.r.o.
ProCop 3.5 Monitoring and Visualisation System is specialized
software for monitoring technological processes, user
management of technologies, archiving of historical trends,
technological quantities and alarm states.
It includes experience from previous system versions, which
began back in 1993, when the first predecessor of the current
monitoring system was first deployed. Many years of experience
in the field of monitoring technology, primarily in the heating
industry, thanks to the experience and requests of customers and
the system operators themselves, have helped us to develop the
product which you now have in your hands.
Copyright © 2015 ALFA Mikrosystémy, s.r.o. Ostrava
M icrosoft, Windows, Windows 7, Windows Vista, Windows XP, Windows 2000 and Internet Explorer are registered trademarks of
M icrosoft Corporation, Intel is a registered trademark, Pentium is a trademark of Intel Corporation. ProCop is the registered trademark of
ALFA M ikrosystémy, s.r.o.
Printed: 2015
Obsah
Prope rtie s of..................................................................
the graphic display
46
Table of Contents
1 Introduction
1.1 ProCop 3.5 ..................................................................
..................................................................
1.2 Program Software
Requirements
.................................................................. 46
4.7 Text Trends Browser
7
8
9
Installation type
.................................................................. 9
Lowe ring ProCop
..................................................................
use r privile ge s
10
1.4 Uninstalling ..................................................................
the ProCop System
11
2 ProCop Toolbar
2.1
2.2
2.3
2.4
2.5
2.6
2.7
2.8
..................................................................
Description of
Toolbar Functions
..................................................................
Advanced Menu
Changing the..................................................................
Toolbar Appearance
Connecting to..................................................................
a Data Server
Working on a..................................................................
Project
..................................................................
Project Archiving
..................................................................
Stopping Work
with the Program
..................................................................
Designer Mode
3 Display Browser
13
13
15
17
17
17
18
19
19
21
3.1 Description of the Display Browser
.................................................................. 21
Window
Buttons for browsing
..................................................................
displays
21
List of displays
.................................................................. 22
History of displays
..................................................................
visite d
22
Inte rconne cting
..................................................................
groups of displays
22
Dialogue te chnological
..................................................................
display
23
..................................................................
3.2 Technological
Schemes
23
State me nts of
..................................................................
value s, te xt colours, se nsors
24
Aggre gate s - ..................................................................
pumps, valve s
26
Ve ntilation syste
..................................................................
ms
27
O pe rating te..................................................................
chnology
28
Information ..................................................................
about variable s, displaying tre nds
29
3.3 Dialogues of ..................................................................
Operator Controls
31
Dire ct se tting..................................................................
of the value
31
Dialogue for..................................................................
e ntry of a value
31
Dialogue with
..................................................................
pre se t constants
32
Dialogue for..................................................................
e ntry of date and time
32
Dialogue with
..................................................................
a table of value s
32
Time Program
..................................................................
Dialogue
32
Initiating floating
..................................................................
me nus
36
Switching the
..................................................................
display
37
4 Trend Browser
4.1
4.2
4.3
4.4
..................................................................
Description of
the trend browser window
..................................................................
Groups of settings
..................................................................
Selection of trends
for display
..................................................................
Selection of time
interval
De scription of
..................................................................
the te xt tre nds window
47
Table of te xt ..................................................................
tre nds
47
Time axis of ..................................................................
te xt tre nds
48
Prope rtie s of..................................................................
te xt tre nds
48
7
Locale
.................................................................. 8
Coope ration with
..................................................................
othe r programs
8
1.3 Installation of..................................................................
the ProCop System
5
39
39
39
40
41
Absolute range
.................................................................. 41
Re lative range
.................................................................. 41
Floating range
.................................................................. 41
Filte r of sample
..................................................................
s in te xt tre nds
42
..................................................................
4.5 Selection of displayed
set
43
..................................................................
4.6 Graphic Trends
Browser
43
De scription of
..................................................................
the window of graphic tre nds
43
Are a for plotting
..................................................................
tre nds
44
Time axis of ..................................................................
tre nds
44
Value axis of..................................................................
tre nds
45
Value and time
..................................................................
me asuring cursors
46
4.8 Trends key .................................................................. 48
.................................................................. 49
4.9 Printing trends
.................................................................. 50
4.10 Exporting trends
5 Alarm Browser
5.1
5.2
5.3
5.4
5.5
5.6
5.7
5.8
5.9
5.10
5.11
..................................................................
Alarms, Events,
System Events
Unconfirmed..................................................................
& Current Alarms, Service
..................................................................
Description of
Alarm Browser Window
..................................................................
Selection of the
Displayed Set
..................................................................
Accpeting Alarms
Cancellation ..................................................................
of Alarms
..................................................................
Deletion of Alarms
..................................................................
Filtration of Alarms
..................................................................
Sorting Alarms
..................................................................
Printing Alarms
..................................................................
Export Alarms
6 Module Control
51
51
51
52
53
53
54
54
54
56
56
57
59
.................................................................. 59
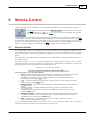
6.1 Module Update
6.2 Advanced Functions in the Module Local
.................................................................. 60
Menu
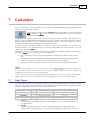
7 Calculator
7.1
7.2
7.3
7.4
7.5
7.6
Data Types ..................................................................
..................................................................
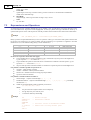
Expressions and
Operators
..................................................................
Conversion Functions
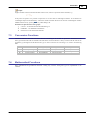
Mathematical..................................................................
Functions
Functions for..................................................................
Date and Time
Link to Value..................................................................
of Other Cells
8 Access Privileges
61
61
62
63
63
64
65
67
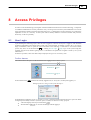
8.1 User Login .................................................................. 67
.................................................................. 68
8.2 Password Change
8.3 Management of Users, Groups and
Permissions .................................................................. 68
Pe rmission list
.................................................................. 69
Group list .................................................................. 70
Use r list
.................................................................. 70
List of logge d..................................................................
in use rs
71
Dialogue De scriptions
.................................................................. 71
We b acce ss pe
..................................................................
rmissions
74
9 Trend Server Management
77
9.1 Built-in tasks..................................................................
of the trend server
77
10 Alarm Server Management
79
10.1 Built-in tasks..................................................................
of the alarm server
79
11 Toolbar Options
11.1
11.2
11.3
11.4
11.5
11.6
11.7
11.8
..................................................................
Automatic Login
Applications ..................................................................
..................................................................
Access Permissions
..................................................................
Other Settings
Data Server ..................................................................
Trend Server..................................................................
Alarm Server..................................................................
..................................................................
Toolbar Identity
81
81
81
82
82
82
83
83
84
© 2015 ALFA Mikrosystémy, s.r.o.
5
ProCop 3.5
6
11.9
11.10
11.11
11.12
Web: Access..................................................................
Privileges
..................................................................
Web: WebView
..................................................................
Web: WebTrends
..................................................................
Web: WebAlarms
Index
84
84
85
85
87
© 2015 ALFA Mikrosystémy, s.r.o.
Introduction
1
Introduction
This manual describes the operation of monitoring parts for the visualisation system ProCop 3.5, which allows staff to
monitor and operate the technological process using technological schemes (displays) 21 , notify of alarm states and
situations 51 , trend values of quantities 39 in time, retain and transfer data for further processing and analysis, and
more.
The specific job description is the contents of the so-called application (monitoring) project, the design of which is made
using designer parts of the ProCop program. This forms a further, configuration part of the visualisation system ProCop
3.5. A description of the creation of a monitoring project is not included in this manual.
Since the ProCop system is created as an application for the M icrosoft Windows environment, work with it requires
basic knowledge of work in this operating system, primarily operation of the user interface. A description of this
operation, however, is beyond the job of this publication. If necessary, you can find the information required in your
reference manual and the Help for M icrosoft Windows.
1.1
ProCop 3.5
ProCop 3.5 Monitoring and Visualisation S ystem is divided into several collaborating parts. The user (client) part is
called ProCop Toolbar 3.5 13 and brings together all the necessary tools for monitoring and visualisation of the
technology 21 , notification of alarm states, viewing alarms, events and system events 51 , historical trends 39 and
archives, their administration, administration of access rights 68 to the system and more. This manual will, from now on,
only be concerned with this user part.
Tip!
ProCop Toolbar 3.5
Start
13
can be launched with the icon of the same name on the desktop, or by selecting it from Windows
ProCop 3.5 Monitoring and Visualisation System
ProCop T oolbar 3.5.
ProCop Toolbar
Monitoring works without user login
Actual communication with industrial controllers, the collection and archiving of data, creation of historical trends and
evaluation of alarm states and events is implemented using several servers for the ProCop monitoring system. These
servers run as services in the background of the Windows operating system, and work, communicate and collect data
even when there is no user logged in to the computer.
The ProCop Toolbar accesses all communication with the user, such as displaying data, alarms and trends, locally
(on the same computer), or remotely (from another computer in a 100M bps LAN network). If the ProCop Toolbar
application is exited, monitoring continues, but the user does not see the realtime state and is not notified of newly arising
alarm states.
Note
The ProCop Toolbar can be exited at any time and relaunched without losing any data. A computer with the ProCop
monitoring system can be restarted at any time; it is set up implicitly to launch everything automatically. After the restart,
there may be a short-term drop of data from the historical trends.
Main components of the ProCop monitoring system
For completeness let us introduce the basic components of the ProCop monitoring system. These components work
together to collect technological data and alarms, their archiving and presentation to the user, whose access permissions
© 2015 ALFA Mikrosystémy, s.r.o.
7
8
ProCop 3.5
are checked and verified according to the settings. Usually, all the components are located on a single monitoring
computer, but there are cases, primarily for performance reasons, where several parts are divided and work together on a
local network on several computers.
A typical reason for dividing the monitoring application among several computers into the user and data parts is the
simultaneous access by multiple users to the given visualisation. Using the ProCop Toolbar, it is possible to connect
from the client computer to a remote data server on a local 100M bps network, i.e. a network workstation.
Note
Remote access from network workstations is restricted by licensing conditions. Restrictions are calculated according to
the number of simultaneously connected workstations, not applications installed. Licences can be shared amongst users.
We can divide the ProCop system into several parts:
ProDat data server
The data server provides communication with individual controllers and renewal of technological
variables. It checks alarm states of technological variables and sends alarm reports to the alarm server,
implements archiving of selected technological variables on the trend server. Contains a list of visual
designs, which, however, it does not interpret, it only provides them for user consoles.
ProAlarm alarm server
Archives the alarms, events and system events received in the appropriate files. It provides a list of alarm
reports to the user interface.
ProTrend trend server
Archives values of selected technological variables in the appropriate trend files. It provides data of
historical trends to the user interface.
ProAcs access permissions server
Administers user lists, user groups and their access permissions. It implements authorisation of access to
individual parts of the monitoring system.
ProCop toolbar
The main user console, which serves as access to individual parts for monitoring from administration of
data, alarm, trend server and the access permission server to viewing displays, alarms and trends. Entry/
exit modules allow the ProCop system to be connected to various technical media (type of programmable
automatic machines, controllers, etc.) and to communicate with them.
1.2
Program Software Requirements
ProCop 3.5 M onitoring and Visualisation System is a suite of object-oriented programs, which was created as the original
application for the M icrosoft Windows operating system. Currently, Windows XP, Windows 2000 Server and Windows
2003 Server, from ProCop 3.2 Windows Vista Business and Ultimate, and from ProCop 3.3, Windows 7 Professional
and Ultimate, and Windows 2008 R2 Server are supported.
When we speak about the Windows operating system or environment, due to the similar or same method of work in the
environments mentioned, we mean any of the options given, unless explicitly stated otherwise.
1.2.1
Locale
In order to avoid problems with locales, concerning screen and print fonts, system reports, dialogues, captions and help,
we recommend working with the corresponding localised (EN) versions of the operating system.
Language versions ProCop 3.5
Currently, there are other language versions of the ProCop 3.5 application also available, such as English and from
version 3.3 also a Slovak version. You can check which languages the system has been translated into with the system
manufacturer or on the website http://www.alfamik.cz.
1.2.2
Cooperation with other programs
The Windows environment is designed for applications to run in parallel. It therefore provides users with much more
opportunities in regard to tasks working with each other in collaboration, data exchange, or usage of joint system
resources, such as computing performance, memory, etc. Sharing computer resources, however, puts greater demand on
the correct running of tasks and their seamless integration. In the event of an error, some applications tasks may cause
conflicts or even other tasks to collapse.
To make it possible to ensure the reliable and correct functioning of the ProCop monitoring system, it is appropriate to
© 2015 ALFA Mikrosystémy, s.r.o.
Introduction
use the monitoring computer exclusively for this program only. If you do not keep to this condition, it is not possible to
guarantee the flawless running of the ProCop system due to possible overload and disruption of the system integrity by
other tasks.
If using other communications software, conflicts when accessing individual communications devices (COM ports, LON,
modem, etc.) are also possible.
1.3
Installation of the ProCop System
If ProCop 3.5 M onitoring and Visualisation System is not yet installed on the computer, just insert the installation CD in
the CD/DVD drive and wait for the installation to launch. Any request for an automatic launch should be confirmed. If
the installation program does not launch on its own, open Windows Explorer and find the folder ProCop System on
the CD/DVD drive, and launch Setup.exe . Continue according to the instructions in the installation program.
If for any reason (e.g. accidentally erased or corrupted files on the drive, etc.) the ProCop monitoring system needs
reinstalling, just open the Control Panels, using Start Control Panel . In the window of the Control Panel shown
select Programs (Add or remov e programs for XP). In the list select the row Monitoring system ProCop 3.5
and click Uninstall or c hange (Change or remov e in Windows XP). In the menu that appears select Repair/
Reinstall new v ersion . Continue according to the instructions in the installation program.
Note
If it is also necessary to install the monitoring project, just copy the Projec t folder using Explorer from the CD/DVD
drive to the C or D hard drive. This will only need to be done when installing to a clean computer, to which the project has
not yet been copied. In the application ProCop Toolbar 3.5 just select Open in the advanced menu 15 and select the
appropriate file in the Projec t directory on the hard drive, or restart the computer. See Working on a project 17 .
Installation procedure
After launching the installation program on a computer that has not had the monitoring system installed on it previously,
these steps will occur:
Information about the customer - It is necessary to enter information about the user and the company
that will be using the monitoring system and leave the option to install for all users.
Type of installation - Selection of the type of installation allows the system to install in different
operating modes, as is explained in more detail in the sub-chapter Type of installation 9 . The
installation procedure can vary according to the type chosen.
Destination folder - The monitoring system can be installed in a selected hard drive folder. It is
convenient to leave the predefined one.
Various options according to type of installation 9 .
Installation and restart - After setting the parameters the actual installation will run and if necessary
you will be asked to restart the computer.
Note
If the installation requires the computer to be restarted, this option will be offered automatically. If you choose not to
restart the computer, you may find that some parts of the system do not work correctly until a restart is done.
1.3.1
Installation type
Given the multiple possible uses of the monitoring system, the installation program allows you to select the installation
type. In relation to this, depending on the selected installation type, further required settings and parameters can be
required.
Installation types, related settings:
A) S tandard monitoring
Installs ProCop as the main monitoring system with a hardware key, to which the necessary
communications channels are brought. This installation is also utilised for branch control centres via a
slow communications line with its own hardware key. Upon selection of the installation folder, an
identity request is made (the user) to know who the monitoring system is to be working with:
Username - If the username does not exist in the domain entered below, it will be created, if
sufficient permissions are available.
Password - The user will be authenticated by entering a password (Windows); if the user does not
© 2015 ALFA Mikrosystémy, s.r.o.
9
10
ProCop 3.5
exist, it will be created with the password entered. If the field is left blank, the system will generate
a very complex password that will never be published, which is not needed (recommended option).
Domain - The user domain shall remain unchanged for the local user. If we use a previously created
account of the domain user, we enter the appropriate domain.
B) Network workstations
The installation type for simple network workstations connected to the main control centre via a fast
LAN at least 100M b). After selecting the installation folder, you must enter (or confirm):
User identity - The username and password must match, as when installing standard
monitoring at the main control centre; in the event of the domain user the domain name should
also match. If there has been no interference with the identity when installing the main control
centre, even with installation of a network workstation it is enough to leave the default values
and a blank password.
Network name, or static IP address - A further required option when installing a network
workstation is entering the network name of the computer at the main control centre, or its IP
address. This of course must be static - it cannot be changed..
C) Web server
This option installs monitoring for publishing monitored data using a web server. Installation is the same
as in version A, Standard monitoring, expanded to include the parts needed for publishing on the web and
configuration of the web server. The web server must be installed in the computer prior to the ProCop
M onitoring System.
D) Developers
Practical configuration for project developers is offered by this installation. For example, automatic
launching is not implemented when the computer starts, and the system runs without the identity of the
user who launches it, etc.
E) User installation
The user selects installation of individual components and system settings. We only recommend using
this in the event of detailed knowledge of the system or after consultation with the manufacturer.
Incorrect choices may result in failure of the monitoring, or non-functioning of some subsystems. After
selecting the installation folder, you must enter (or confirm):
Installed components of the monitoring system - The system component tree allows users
to choose which parts of the monitoring system, input-output modules, tools, examples,
documentation and advanced options will be installed.
Program folder in the S tart menu - Users can select in which folder on the Start menu the
shortcuts will be located for launching the ProCop M onitoring System and various tools.
User identity - The username and password must match, as when installing standard
monitoring at the main control centre; in the event of the domain user the domain name should
also match. If there has been no interference with the identity when installing the main control
centre, even with installation of a network workstation it is enough to leave the default values
and a blank password.
Installation of drivers and adaptation for Windows - The final steps prior to the actual
installation is the selection of installation of hardware key drivers, user manufacturing,
registration and settings of components and services, configuration of Windows and the web
server. Only the events that have been selected will be implemented. During configuration
changes, it may lead to non-functioning of the whole monitoring system or parts and functions
within it.
Note
For applications with OPC (server/client), E) User installation must be selected and installation of OPC components
ticked. If support for web monitoring is not necessary, it is advisable to deselect the components..
1.3.2
Lowering ProCop user privileges
ProCop 3.5 M onitoring and Visualisation System runs after default installation with the identity of the locally created
ProCop user, who is assigned administrator permissions within the local computer. The user's password is machine
generated by default, extremely complex and not published.
The need may arise where it is necessary to restrict permissions even to this user. This is possible assuming that certain
manual settings are fulfilled. We explicitly grant read and write permissions to the ProCop user for the following files and
folders, including subfolders:
C:\PDOXUS RS .NET - or the entire C:\BDE\ directory
© 2015 ALFA Mikrosystémy, s.r.o.
Introduction
C:\ProCop 3.5
- or other folder where the system is installed
C:\Projekt
- or other folder where the monitoring project has been copied
In the administration of users and groups, it is possible to remove ProCop users' membership of the Administrators
group and add membership to the Users group.
11
After these settings are implemented, the computer must be restarted and the correct functioning of the entire monitoring
system checked.
Important warning!
For adjustment of user permissions, it is necessary to have administrator permissions for the computer and sufficient
knowledge of the issue. Mis-setting permissions can result in entirely non-functional monitoring.
After each change of this type, we recommend restarting the computer and re-checking the required system functionality.
1.4
Uninstalling the ProCop System
ProCop 3.5 M onitoring and Visualisation System can be uninstalled using Start Control Panel . In the window of the
Control Panel shown select Programs Remov e program (Add or remov e programs for XP). In the list select
the row Monitoring system ProCop 3.5 and select Remov e program (Add/ Remov e for XP). In the menu that
appears select Remov e . Continue according to the instructions in the installation program.
When uninstalling, files and directories are gradually removed that were created on the drive during installation. Shortcuts
and registration database entries are also removed.
If it is also necessary to remove the monitoring project and collected data, just remove the Projec t folder in Explorer
from the hard drive (C or D). It is also possible to remove the installation package C:\Program Files\ProCop 3.5 Install
Files.
© 2015 ALFA Mikrosystémy, s.r.o.
ProCop Toolbar
2
ProCop Toolbar
The ProCop Toolbar is a client application combining an environment for creating and editing a monitoring project
(Designer) with an environment for the operating part of a monitoring and visualization system (M onitor). The ProCop
Toolbar can switch between these two modes.
Monitor mode
13
The operating part allows staff to monitor and manage the technological process via technological schemes (displays) 21
, notify of alarm states and situations, view and process alarm lists 51 and view and analyse historical trends 39 of
technological quantities.
Switching from Designer to M onitor modes can be done by selecting View
Monitor , or pressing Ctrl+Alt+M .
Designer mode
The developers' part of the monitoring system provides access to the project editor and alarm server, administration of
the server for access permissions, etc.
Switching from M onitor to Designer modes can be done by selecting View
pressing Ctrl+Alt+D .
2.1
Designer from the advanced menu 15 , or
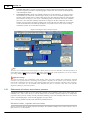
Description of Toolbar Functions
The environment of the actual ProCop application in the monitoring mode is very simple. It is made up of just the
toolbar at the top of the screen. This panel allows access to individual parts of the monitoring system. Displaying
individual buttons can be selected according to need.
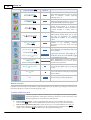
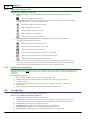
Meanings of ProCop Toolbar buttons
The ProCop Toolbar displays buttons for quick access. By right-clicking certain buttons or selecting Spec ial
any of the following buttons can be displayed or hidden:
© 2015 ALFA Mikrosystémy, s.r.o.
Buttons
13
14
ProCop 3.5
Advanced Menu
View
Displays
Display Browser
View
21
T rends
Trend Browser
View
39
Alarms
Alarm Browser
View
Keyboard
shortcut
15
Module c ontrol
View
59
Calc ulator
Calculator
Ac c ess rights
Ac c ess rights
Login
Logout
Permission M anagement
Help
Exit
ALT +L
CT RL+ALT +L
Logout of the current user. After logging out, a
pseudo-user "Everyone" is automatically logged
in with minimum access rights.
Shows administration of access permissions.
CT RL+ALT +R Allows administration of lists of users, groups
67
Full sc reen
Help
ALT +M
Shows alarms, events and system events. In the
window showing alarms it is possible to
implement confirmation, deletion and filtration
of alarms according to a whole variety of
criteria.
Shows the window for module control. The
module control window allows you to stop,
start and set parameters for separate
communications modules in the monitoring
system.
Shows the window for the calculator. The
calculator is for
evaluating numerical
expressions in a way users know from table
calculators.
User login. The name of the currently user is
always displayed in the notification field of the
ProCop Toolbar.
67
View
Permission
management
Spec ial
Shows a window of historical trends. Trends for
selected technological quantities. Can be shown
in both table format and clear linear graphs.
ALT +K
61
Access Permissions
ALT +T
ALT +A
51
M odule Control
ALT +D
Shows displays of the display technologies
using technological schemes with listed current
values of quantities, symbols expressing
technology states, etc.
and their access permissions.
F11
Shows the active window in full screen mode.
You can exit this mode only by pressing the
F11 key.
F1
Shows the help for the ProCop monitoring
system. The contents of this help correspond to
this user manual.
ALT +F4
Exits the "ProCop Toolbar" application.
Button selection
Implement selection of buttons in the taskbar by right-clicking the mouse on any button (e.g. "Displays") and in the local
menu select the button you want to continue displaying or hide.
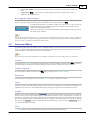
Toolbar notification area
The ProCop Toolbar contains a notification area on the right-hand side in monitoring mode.
The following indicators, which express the state of certain parts of the system and possess
the following functions, are located in this notification area:
Icons to minimise and exit - in the top right-hand corner there are icons to minimise the Toolbar and
exit the toolbar 19 (this does not end communication or data collection, it only closes the user interface).
Bells for unaccepted alarms and events - if there are any new, as yet unaccepted alarms or events, red
and green bell symbols appear in the notification area. By clicking on the bell, the Alarm browser 51
appears. After confirmation 53 of all alarms/events, the appropriate bell disappears.
© 2015 ALFA Mikrosystémy, s.r.o.
ProCop Toolbar
S ystem date and time - the current date and time of the local computer is displayed in the notification
field.
Logged-in user 67 - the name of the user currently logged in to the ProCop monitoring system is
displayed under the date and time.
15
Accessing the advanced menu
Given that the main menu in the taskbar is freely configurable and does not contain all the functions from the monitoring
mode, it is possible to right-click in the left part of the taskbar to access the advanced menu 15 .
Using this advanced menu, it is possible to connect to any data server, or to open or close the
required monitoring project, change the appearance of toolbars and select other functions
which are not part of the main menu.
You can access the ProCop Toolbar advanced menu by right-clicking the mouse anywhere in
the toolbar except on buttons.
Note
The specific job of the monitoring system is the contents of the application (monitoring) project, which is obtained as
output of the designer part of the ProCop application. However, knowledge of the design part of the ProCop application is
not necessary for work with the monitoring part of the system.
2.2
Advanced Menu
Given that the main menu in the taskbar is freely configurable and does not contain all the functions from the monitoring
mode, it is possible to right-click in the left part of the taskbar to enable the advanced menu. This menu provides access
to functions that are not included in the main menu on the taskbar.
Note
The menu may provide only certain functions, for simplicity - it depends on the system settings and user permissions.
Connect
Using the menu Connec t you can connect to the data server on the local computer. The data server 7 is an operative
part which interprets the data part of the monitoring project and provides a visual project of the user console.
Connect remotely...
It is also possible to connect to the data server
7
remotely, using the option Connec t remotely .
Disconnect
You can disconnect from the given server with the Disc onnec t option on the ProCop Toolbar.
Open...
This option opens or closes the monitoring project on the data server to which ProCop is connected. If other users are
connected to the data server at that moment, the opening or closing project appears on all connected user consoles.
Archive
With this option, or the keyboard shortcut CT RL+ALT +B , you can open the tool for project archiving. It is possible to
archive an open project or other selected project. In the middle part, there are options on the left for source files for
archiving (it is a good idea to leave them all selected), and on the right there are options for data, alarm trends and external
files. Alarms and trends cannot be archived while the project is running. At the bottom, there is an actual list of archived
files. By pressing Arc h i v e archiving is implemented in the default directory, while the button Arc h i v e a s allows
you to select the target for archiving.
View
Home - displays the browser of technological displays and switches to the main display
© 2015 ALFA Mikrosystémy, s.r.o.
16
ProCop 3.5
Displays - displays the browser of technological displays
T rends - displays the trend browser
Alarms - displays the alarm browser
Module c ontrol - displays module control
Calc ulator - displays the calculator
Permission management - displays the console for the access rights server
T rend management - displays the console for the historical trends server
Alarm management - displays the console for the alarm server, events and system logging
System trac er - launches the application for monitoring the running of the ProCop system
Adv anc ed mode - switches the ProCop Toolbar to separate windows mode, and can display several
browsers and consoles at the same time
Designer - switches ProCop Toolbar to Designer mode - requires designer permissions
... - a list of currently opened windows is also displayed, in the Advanced mode CT RL+ALT +X allows to
switch windows
Access rights
Login - opens a dialogue window for the user login
Logout - logs out the user currently logged in
Change password - opens a dialogue window for changing the password of any user
Special
Options - opens the settings of all the installed parts of the ProCop monitoring system, requiring ProCop
Options rights
View - shows the ProCop Toolbar selection view
Buttons - shows the list of buttons on the ProCop Toolbar and allows them to be displayed or hidden
Full sc reen - shows the current browser in full screen; to return to the original view, press F11
T ile v ertic aly - organises windows (only in expert or Designer modes)
Help
Allows you to display and search the help. The final option is information about the manufacturer and program version.
Connect network printers
If you use printers directly connected to a local computer, you must secure access of ProCop users for printing on the
necessary printers. After installation, users are authorised to print on local printers, as long as they do not have lower
permissions, then access to printers in printer security must be permitted to ProCop users.
If it is necessary to print on a network printer, it is necessary to search for these network printers using the option
Connec t network printers and by entering the appropriate network permissions allow the ProCop users on these
printers. If the printer is not displayed in the list, the full printer name must be filled in via the input window, usually in
the format
\\server\printer
Printer setup
By selecting Printer setup it is possible to select the printer used for printing and set up its parameters. Printing
switches automatically from portrait to landscape depending on which part of the system is being printed. These
parameters can be set when printing specific output.
If the operating system reports that a default printer has not been set, you must assign permissions to the ProCop user
for printing on local printers, or connect a network printer with the appropriate network permissions.
List of previously opened projects
In this part of the menu a list of several of the last opened projects is displayed. This list automatically updates
according to when the projects were last opened or if they still exist.
© 2015 ALFA Mikrosystémy, s.r.o.
ProCop Toolbar
Exit
17
Closes ProCop Toolbar - monitoring does not finish this way, it continues on the servers, which work as operating
system services. However, no information is available for users. M onitoring can be finished either in Designer mode or by
stopping the relevant services.
Exiting ProCop Toolbar requires "ProCop Exit" permissions and can also be implemented with the cross in the top righthand corner of the toolbar, or with the Exi t button on the toolbar, if displayed.
2.3
Changing the Toolbar Appearance
The appearance of the toolbar can be changed depending on user requirements. In the various operating systems, the
appearance differs in colour, to correspond with the style of the operating system.
Functions available from the toolbar
Out of the range of all functions that can be displayed in the toolbar, it is only possible to select those users need for
their work. The selection of the functions displayed can be done by right-clicking the mouse on any icon, or from the
advanced menu 15 by selecting Spec ial Buttons . In the list displayed, only tick the buttons which are to be
displayed in the toolbar.
Toolbar background appearance
The ProCop Toolbar application allows various backgrounds to be set for the toolbar in M onitor mode 13 . The image
with the background must be saved as a Windows Bitmap (bmp) file. Several predefined toolbar views are saved in the
directory ProCop 3.5 Sk ins . M ore competent users can create the own background image with the same dimensions
and resolution in any image editor by adapting any of the predefined views.
Changing the view can be done in the advanced menu 15 by selecting Spec ial
select one of the files of views offered and the toolbars will immediately change.
View . In the submenu displayed, just
Advanced mode
In normal display mode, separate windows to view displays, trends, alarms, etc. are displayed across the entire remaining
free space of the screen. In this mode it is therefore impossible to have several windows displayed at the same time.
When switching the mode in the expanded menu 15 from View Adv anc ed mode , or using the keyboard shortcut
Ctrl+Alt+X the window being viewed is closed and the windows that are then opened in the display, alarm, trend
browsers, etc. behave as standard windows in the Windows operating system, so you can handle them in any way, i.e.
change the position and size, cover them by each other, move to another monitor, etc.
2.4
Connecting to a Data Server
So that ProCop Toolbar can make separate parts of the monitoring system available, it must be connected to a data server
7 . This data server provides the ProCop Toolbar the appropriate visual project. If the data project is launched in the
data server, the current values of technological quantities are displayed in the visual project and the dynamic elements
correspond to the state according to the current technological values.
The data server may run on the same computer as the user console (local data server), or on any of the computers in the
local computer network (remote data server – network workstation). For connection to a local data server go to the
option in the advanced menu 15 Connec t . For connection to a remote data server there is the option Connec t
remotely... , which requires the name of the computer with the remote data server to be entered.
Disconnecting from the data server can be done using the option from the advanced menu 15 Disc onnec t .
Disconnecting from the data server does not cause the data server to stop running. The data server remains in operation
and continues to provide all monitoring functions from data collection to archiving of historical trends, to evaluating alarm
states and sending them to the alarm server.
2.5
Working on a Project
The specific job of the monitoring system is part of the monitoring project. This project must be opened on the data
server to which we connect. Opening the project is possible from the ProCop Toolbar by selecting Open from the
© 2015 ALFA Mikrosystémy, s.r.o.
18
ProCop 3.5
advanced menu
15 .
Note
Closing the project is only possible if the user logged in has been assigned the right to exit monitoring. If the staff member
does not have this right, the system does not allow the project to close.
2.6
Project Archiving
Project archiving can be done in the advanced menu
CT RL+ALT +B .
15
by selecting Arc hiv e , or at any time with the keyboard shortcut
A dialogue window will open with the preset of the currently open project and automatic inspection of the project is
implemented with a search of files for archiving.
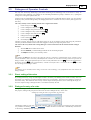
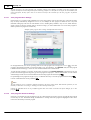
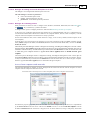
Dialogue window for project archiving
After opening the dialogue window, analysis of the currently selected project and a search of all files selected for
archiving is implemented automatically. If it is necessary to archive a project other than the open one, it is necessary to
switch the project selection switch and find the required project for archiving.
A note is automatically attached to the archive with the optional path for default project expansion.
Archiving is done in a folder with the project name, by the connected archiving date (optional) to the selected directory.
Tip!
Using the Bro w se button it is possible to simply select the appropriate path or file.
In the dialogue window, the separate parts of the project can be selected for archiving. The left part of the options is for
selecting the source files for the project. The right part contains the files with collected data, which is not necessary to
archive in this way, and they are usually quite large. After changing the selection it is necessary to refresh the file list by
pressing the U p d a t e button.
A full list of archived files is displayed below, and using the buttons I n se rt , R e mo v e and D e l e t e a l l it is possible
to modify this list according to need.
Using the Arc h i v e button, archiving into the default directory is launched. The Arc h i v e a s. . . button allows the
archive to be saved according to the following file selection. The archive is a standard compressed ZIP file.
© 2015 ALFA Mikrosystémy, s.r.o.
ProCop Toolbar
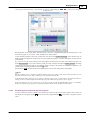
Dialogue window for project archiving
Tip!
By default, archiving is set so that after opening the dialogue window, you just press the button Arc h i v e . Upon
completion of the archiving, just close the dialogue by pressing Cl o se .
2.7
Stopping Work with the Program
If you want to stop work with the monitoring program, use the usual combination Alt+F4 to end a program in Windows,
or select Exit from the advanced menu 15 .
ProCop Toolbar can also be exited by pressing the optional button Exi t , or the cross button in the
top right-hand corner of the Toolbar.
Note
Exiting the ProCop Toolbar application does not stop the data server from running The data server remains in operation
and continues to provide all monitoring functions from data collection to archiving of historical trends, to evaluating
alarm states and sending them to the alarm server.
2.8
Designer Mode
Designer mode is designed to create and edit the monitoring project. In Designer mode, all the functions we know from
M onitor mode are available, along with functions available in this mode that are necessary for editing the database of
variables, displays, alarms, historical trends, etc. The description of the designer part of the ProCop monitoring system is
not however necessary for monitoring needs so is not included in this documentation.
Note
To enter Designer mode, it is necessary to have sufficient access permissions, specifically "Visual Designer" permissions.
© 2015 ALFA Mikrosystémy, s.r.o.
19
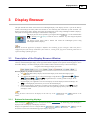
Display Browser
3
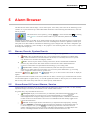
Display Browser
21
This part describes the control of the browser for technological displays. The display browser is part of the ProCop
Toolbar, which simply and clearly makes the functions of the monitoring and visualisation system accessible. The
display browser allows staff to monitor and control the technological process using technological schemes (displays).
The specific list and appearance of displays is defined in the visual project.
The display browser can be opened by pressing the button D i sp l a ys, or in the advanced menu
15 by selecting View
Displays . Trends can also be enabled at any time using the keyboard
shortcut ALT +D
The display browser allows staff to monitor and control the technological process using
technological schemes (displays).
Note
A specific list and the appearance of displays is defined in the monitoring project in designer mode. This forms a
configuration part of the ProCop visualisation system. However, working on the program in monitoring mode does not
require knowledge of this designer part.
3.1
Description of the Display Browser Window
The display browser window is made up of toolbars and the window desktop. The window desktop displays the
currently selected technological display, and its appearance therefore depends on the specific monitoring project. Above
the window desktop is a toolbar. The display browser toolbar contains controls necessary to browse the displays.
Navigation and technological display print buttons
Browsing displays is possible in various ways
The
H o me button always displays the first main display of the whole technological project
The simplest and quickest way is to browse the displays using the buttons
Pre v i o u s
21 ,
N e xt
Ma st e r 21 and
Sl a v e 21 . Using these button, it is usually possible to display all the
monitoring project displays one by one.
Separate displays are organized in a tree list. This display tree can be displayed via the item Display list
22 . By selecting display from the list you can view the selected display.
When browsing displays, the displays viewed are saved in the history of displays visited 22 . Using the
Previous and Forward buttons, you can browse and view separate displays one by one from the history
of displays visited.
21 ,
Tip!
Turning the mouse wheel browses the displays in the same way as the
toolbar.
3.1.1
Pre v i o u s and
N e xt buttons on the
Buttons for browsing displays
After selecting the
H o me button or the keyboard shortcut CT RL+Home the monitoring project homepage is
displayed. This is the display in the display tree as first.
Displays are organised in a tree list. Using the buttons
Pre v i o u s,
browse this tree and view all the monitoring project displays one by one.
© 2015 ALFA Mikrosystémy, s.r.o.
N e xt ,
Ma st e r and
Sl a v e you can
22
ProCop 3.5
Keyboard shortcuts for movement between displays are based on the cursor arrows on the appropriate buttons. For
movement in the tree the following combinations are available Ctrl+Home , Ctrl+ , Ctrl+ , Ctrl+ and Ctrl+ .
To move in the history, there are the combination keyboard shortcuts Alt+
and Alt+
.
Note
When browsing the tree on several levels, the method of browsing using the buttons
Pre v i o u s,
N e xt ,
Ma st e r and
Sl a v e is governed by the type of connection settings for the given group of displays. The method of
browsing depends on the specific visualisation project.
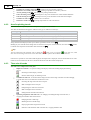
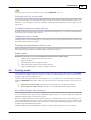
3.1.2
List of displays
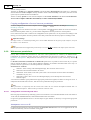
Displays are organised in a tree list. The whole displays tree can be viewed using the item List of displays. By selecting
the display in the list of displays the given display is shown.
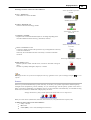
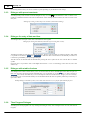
In the list of displays, the level of integration 22 of the group of displays is shown simultaneously.
group without interconnections
group with interconnection of the first display
group with interconnection of all displays
Example of two-level tree of displays
Note
A multi-level tree architecture is usually only used for large control centres with many substations, which links the levels
geographically, or using other organisational structures.
3.1.3
History of displays visited
When browsing displays, the displays shown are saved to the history of displays visited. Using the button
Ba c k
you can return to the previous display in the display history at any time. The button
Fo rw a rd allows us to go
through this history forward to the latest visited displays. The whole history of visited displays in the given direction
can be viewed by pressing the cursor for the appropriate button; clicking the appropriate display from the history shows
the given display.
Tip!
History is useful particularly in order to go back to a display quickly from which you switched using a button or a field
(e.g. map) in a technological display.
3.1.4
Interconnecting groups of displays
Displays are organised in a tree list. Each group of displays has a defined level of integration. The level of integration of
the group of displays is determined in the design of the visual project in Designer mode. The level of integration can be
thought of as the number of displays from the given group, which is displayed when browsing displays in the parent
group.
Displays without connecting to other groups of displays
A group of displays can be separated from the others. When browsing displays of a parent group using the buttons
Pre v i o u s,
N e xt etc. it is not possible to get to this separate group of displays. The only way of getting to the
browsing mode for this separated group of displays is by showing a display form this group using the list of displays, or
via a link to this display from another display of the monitoring project. Again, from such a group, it is not possible to go
© 2015 ALFA Mikrosystémy, s.r.o.
Display Browser
between other displays other than by a link or selecting it in the displays tree.
Connecting the first display to the parent group
Pre v i o u s and
The first display of this group will be displayed, when browsing with the buttons
parent group. If when showing this display you press the button
N e xt , in the
Sl a v e , the second display of this nested group is
shown. From this moment, you can browse all the displays of this nested group using the buttons
Pre v i o u s. You can get back to the parent group of displays by pressing the button
button the first display of this group is shown again and using the buttons
through the displays of the parent group.
N e xt and
Ma st e r. After pressing this
Pre v i o u s and
N e xt you can browse
Connecting all displays to the parent group
All the displays in the group are shown within the parent group. The group therefore does not have any impact on the
sequence of browsing displays and is only here for increased clarity or logical grouping of several related displays.
Note
The order of the displays is part of the specific technological project and cannot be changed by the user.
3.1.5
Dialogue technological display
Some technologies or their parts are usually displayed in a dialogue window. An example of this is detailed information
on individual parts of the technology, such as thermometers, queries for the user, information dialogue windows,
windows with incoming SM S messages, user parameters for communication and the like.
It is necessary to close this kind of window prior to displaying another technological display, or other monitoring parts,
with the Cro ss, or by pressing the button Cl o se . The Pri n t button allows the dialogue technological display to be
printed.
Note
Buttons may be hidden in relation to visualisation needs and replaced with buttons within the display.
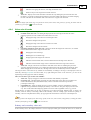
3.2
Technological Schemes
The basis of technology monitoring is the technology scheme with printing of current values of technological quantities,
with measuring devices, symbols expressing the states of the technology, etc. The specific scheme and the graphic
implementation depend on the specific application and the given technological project. The technological displays may
also contain photographs of objects, overview maps, tables of values, etc.
Important warning!
From now on, only general practices will be given which are used in the majority of cases when creating specific projects.
Scheme can be entirely different in regard to layout, colours and meanings depending on the specific technological project.
It is then necessary to request documentation and an explanation from the specific project creator.
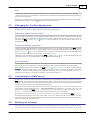
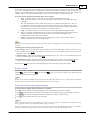
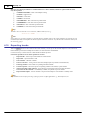
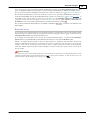
Layout of the technological scheme
Areas of technological screens:
Title - name of control centre, station name - two left fields at the top of the screen.
Date and time in the controller - shows the date and time in the industrial controller (during the last
refresh of values), can be); it is possible to set date and time setting dialogue 32 with a simple click.
Communication with the controller - displays the date and time of the last refresh of values communication with the controller, values on the technological screen are from this time. Clicking on the
communication state makes it possible to launch communication outside of the regular period or change
the refresh type 59 . It can display the fault (red) state of communication - it is not possible to connect
with the controller and obtain or set data. The problem is probably in the connection between the control
centre and the controller.
Fault area - displays faults which indicates the industrial controller. Usually related and general faults
are indicated here. Aggregate faults are displayed directly in the scheme.
© 2015 ALFA Mikrosystémy, s.r.o.
23
24
ProCop 3.5
Common control area - contains control buttons for setting common operating modes, time programs
and various regulation parameters. Individual aggregates can have their own controls and settings directly
in the technological scheme.
Technological scheme - displays the schematic diagram of a specific technology. Typically it displays
the scheme for pipe connections, ventilation pipes, rooms, pools, reservoirs and other equipment. The
scheme typically includes sensor symbols, which display the values measured, indicators of the setpoints
and corrections. On the pipes, servo-valves, solenoids and pumps are displayed, while on the ventilation
pipes, fans, valves and other ventilating components are displayed. All these components can be made
dynamic - their appearance can change according to the specific real-time state. Behaviour of components
will be described in detail in the following subchapters. It is possible to have service control or setting,
confirmation of faults, etc. for individual components.
Regular technological scheme with typical layout
Tip!
The mouse curser with the arrow symbol changes to a hand symbol over the areas that allow some kind of action to be
made. With a single or double left or right click of the mouse (depending on the specific application), you can, for example,
open settings dialogue 31 , open the local menu 36 , switch displays 37 , etc.
Important warning!
The ProCop monitoring and visualisation system displays values and states obtained from autonomous industrial
controllers. The specific behaviour of technology and regulation is dependent on the software of the controller software
itself, not the visualisation. This only shows the technological data of the scanned controllers and allows their parameters
to be set in a convenient way. Any unreliable states and faults must first be verified in reality and in the controller
diagnostics (floating or fixed control panels).
3.2.1
Statements of values, text colours, sensors
Technological schemes are made up of active and passive elements. Passive elements, such as pipes (steam, water, gas,
ventilation, etc.), walls, rooms, arrows, as well as manual valves or manually operated pumps, do not change their
properties (colour, position, visibility) and only indicate the technology. Pipes, heat exchangers and arrows are in various
colours. Non-managed pumps, valves and other aggregates are in grey-black.
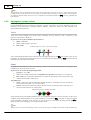
Active technology elements and their usual schematic representation follows.
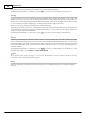
Measured values, setpoints and corrections
Sensors of measured values are usually displayed according to the schematic markings with a symbol value in a circle or
globe. Next to it is a value indicator.
© 2015 ALFA Mikrosystémy, s.r.o.
Display Browser
Meanings of colours of letters for value indicators:
25
Sensor of outside temperature,
invalid:
Grey = Invalid value
Value which is too old or unreliable.
Position of servo valve:
Yellow = Measured value
Valid real value from technology, reliable.
Thermometer, setpoint and
measured:
Turquoise = S etpoint
Required value to which the machine adjusts. It can change depending on the
controller calculations and its mode (e.g. attenuation, comfort).
Room temperature sensor with
correction:
Green = Correction of value
Correction is usually entered in the space device (by turning the knob or button),
or from the visualization.
Green may also be the measured value corrected by a constant or measured
correction.
Room temperature sensor with fault:
Red = Fault in sensor
Red text symbolises a fault with the sensor, converter or other fault in the given
input.
The fault is probably meaningless, imprecise, or neutral.
Note
The displayed values are from the time displayed in the top right-hand corner of the technological display
refresh".
23
as "Last
Sensors
Sensors are positioned schematically in places where they are in reality. The symbols represent the measured quantity.
Analogue sensors (temperature, pressure, humidity, etc.) are round and grey with the quantity symbol. If the sensor is
faulty or the limit is exceeded they can change the colour to red. If several limits and whether they are exceeded are being
monitored, text (max/min) is added which is displayed by the sensor.
Analogue thermometer, faulty (outside of limit). Thermostat with excessive temperature.
Binary two-state sensors (thermostats, manostats, level sensors, etc.) are symbolised with a square (cube).
A change in colour of the sensor colour indicates:
Gray = idle state
Red - fault
Green (Blue) = active state (flooding for level sensors)
© 2015 ALFA Mikrosystémy, s.r.o.
26
ProCop 3.5
Tip!
Some machines require confirmation of sensor faults. Even if the fault is removed, the sensor is still in fault mode. After
scrolling the mouse to the sensor, the cursor changes to the hand symbol and after pressing the button, a menu appears
for confirming the fault. It may also be necessary to confirm the associated fault (fault area 23 in the top right-hand part
of the display).
3.2.2
Aggregates - pumps, valves
For displaying aggregates, such as pumps and valves, they are usually displayed in the scheme with an appropriately
styled technological marking. The following description is general, used usually, but can be, depending on the given
technology and specific project, completely different. Similarly, compressors, boilers and other components are
displayed like pumps and valves.
Valves
Valves can be varied: analogue (servo valves), binary (solenoids), two-way, three-way, (four- or multi-way), with
indication of the position, manual, etc.
In general, we can say that a machine-operated valve is:
Black = closed, idle
Green = open, partially open, active
Red = faulty
Example of three-way valves - closed, open, faulty
Valves with analogue measuring of the position have the percentage displayed in text 24 of the opening. They can also
be manually set, then the hand symbol appears close by. In the chapter Operating technology 28 the general operating
technology will be described in more detail.
Pumps
For pumps (as with compressors, fans and ventilators), rotation is also used to indicate operation. If a pump is idle, a
triangular arrow shows the direction of flow.
In general, we can say that the pump background is:
Light grey = if it is idle
Green = the automatic machine has set command for the operation of the pump (or is in operation)
Red = faulty (e.g. the automatic machine has set a request for the pump operation, but the return report
indicates that the pump is still inactive)
The pump arrow:
Turns = return report from the technology indicates the pump is operating (does not have to mean the
real movement of the pump, e.g. if no return report)
S tands = return report indicates the pump is idle (does not have to mean the pump is really idle, e.g. if
the wire with the return report is interrupted)
Illustration of pumps: standing, idle, faulty
Pump performance may be managed in different ways (own management, frequency converter, controller). In the event of
availability of the measured quantity of the pump performance, a text indicator 24 by the pump is displayed with the
current performance, frequency of the converter, or level of operation. In the chapter Operating technology 28 the
general operation of the technology will be explained in more detail.
Note
Pumps can turn even when the technology seems to be idle. These properties should be described in the documentation for
© 2015 ALFA Mikrosystémy, s.r.o.
Display Browser
the regulation itself. Please note that it can usually mean slow down of the pumps after stopping the technology, or
automatic spinning of pumps in frost protection mode, to prevent freezing of the medium in certain cooler places.
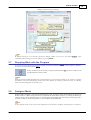
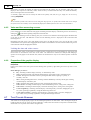
3.2.3
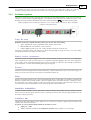
Ventilation systems
The ProCop monitoring system is equipped with components for the schematic display of the state and control of
ventilation systems and their individual aggregates. The individual usual components for ventilation systems, colour
meanings and states will then be described in more detail. Operating technology 28 is described in the next chapter.
Example of different states of ventilation components: vents, coolers, antifreeze thermostats, filters, humidifiers,
ventilators and ventilated space
Vents, fire vents
Regulation of air flow is implemented with various types of vents with colour coding:
Grey = Closed vent, usually perpendicular to the direction of the air flow
Red = Fault in the vent mechanism - state is unknown
Green = Open (partially open) vent - usually parallel to the direction of the air flow
Vents may be analogue or binary. For analogue ones, the opening percentage is displayed close by. Fire vents (usually
with the abbreviation FV) are displayed as red if closed.
Heaters, coolers, recuperators
Ventilation systems are usually equipped with water or electrical heaters, coolers and various types of recuperators.
These components are static from the perspective of regulation. Individual aggregates that serve these components
(vents, pumps, valves) are dynamic (change their state, can be controlled). In some cases the percentage of performance
by the recuperator, or level of electrical heating and cooling are displayed.
Freezers
Ventilation systems are equipped with protective thermostats - antifreeze thermostats. They can be in the air pipes, or
water pipes. In the case of active frost prevention, the snowflake symbol is red.
Filters
Filtration of supplied and removed air is done with technological filters. Clogged filters are checked by measuring the
difference in pressure before and after the filter. When the permitted limits are exceeded, the filter is displayed as red in
the visualisation (it is probably clogged). In some cases instead of the colour change of the actual filter, a bypass hose
with a manostat is drawn around the filter, which can indicate the filter is blocked when red.
Humidifiers, dehumidifiers
To adjust the relative humidity of the air, there are units which can display their working, current performance and fault
state. Grey shows idle state, green means the device is operating, and red is a fault. The percentage performance of the
device may be displayed close by.
Ventilators, fans
Ventilators and fans (and similarly pumps, compressors, etc.) can also use rotation to signify operation. M arks on the
ventilator show the air flow direction.
In general, we can say that the background for the ventilator or fan is:
Light grey = if idle
Green = automatic machine has set command for operation of the ventilator (or it is operating).
© 2015 ALFA Mikrosystémy, s.r.o.
27
28
ProCop 3.5
Red = faulty (e.g. automatic machine has set requirement for pump operation, but the return report
indicates that the pump is still)
Ventilator and fan blades:
Turn = return report from the technology indicates the ventilator is operating (does not have to mean the
real movement of the ventilator, e.g. if no return report)
S tand = return report indicates the pump is idle (does not have to mean the ventilator is really idle, e.g. if
the wire with the return report is interrupted)
Fans and ventilated space, idle, operating and faulty
Power of ventilators and fans can be managed in various ways (own management frequency converter, controller). In the
event of availability of the measured quantity of the ventilator performance, a text indicator 24 near by is displayed with
the current performance, frequency of the converter, or level of operation. In the chapter Operating technology 28 the
general operation of the technology will be explained in more detail.
Note
Usually the transfer to manual operation of the given device is also indicated with a hand symbol next to the symbol of the
given device.
3.2.4
Operating technology
M ethods and options for operating the technology can differ significantly depending on the specific technology, project
and access permissions. We will focus on the usual methods for operating technology.
Communication with the controller
In the top right-hand corner of the technological display is the time of the last refresh of values. This time tells us at what
time the values were refreshed that are displayed in the technological scheme.
Under this time the current communication state is shown, most often:
OK - last communication was successful, at the moment there is no refresh of values under way
Waiting for communication path - the system is going to communicate but is waiting for the
communication path to be released (another controller is communicating, the modem is dialling a
connection, connecting to GPRS)
Communicating - values from the controller are currently being refreshed
Communicating - CONTINUOUS LY - values from the controller are currently being refreshed continuous refresh is set, the data will be refreshed continually, until another refresh type 59 is selected,
or the maximum period of continual refresh expires (usually 1 hour, depending on the project)
Communication error - the last communication was unsuccessful, there was no connection established,
the cable is interrupted, or there is another communication error
Disabled - periodic communication with the controller has been disabled, the data will not be refreshed
until the communication type 59 is changed
Tip!
After clicking the mouse in the area with the communication state the local menu can display options for manual launch
and stopping communication, or changing the update type 59 .
Joint operations, parameters
In the right part of the technological display, you can usually find the area for joint operations 23 . In this part there are
buttons to display and set the operating mode, parameters, time programs, and other, e.g. servicing settings. Using the
mouse button, the local menu appears 36 , or the dialogue for setting values 31 , table for setting values 32 , or the
dialogue of the time program 32 .
If there is not a mode, time program or other settings in the automatic mode, on the button or near to it there is usually a
symbol for the manual mode from the controller - a green hand.
© 2015 ALFA Mikrosystémy, s.r.o.
Display Browser
Signalling manual mode from the controller
M anual mode means that the operating, mode, state or time program is converted to the manual fixed state not managed
by the controller. The controller will therefore not change the mode according to the set time program; it will not manage
the technology or individual aggregate according to need, they will remain in the set state.
Important warning!
All values set appear in the visualisation until the change can be set in the controller. Given the differing communications
paths, the intervention in the technology may be significantly delayed. If the settings are successful, they are displayed in
the notification area with the symbol of a green bell and in the events a record of the values is made. If the record is not
possible, an alarm occurs and is recorded.
Therefore if we convert the parameter with a dialogue window, and we reopen the window, the original value will stay
here, until the record can be implemented and confirmed in the controller. It does not mean that the record was not
successful or will not be implemented. In the top right-hand corner you can monitor whether after setting the values
communication has been established and made.
Operating aggregates in the technological scheme
It is possible directly in the technological scheme in individual aggregates by clicking the mouse to get the local menu for
setting the state and operating mode of the aggregate. In certain cases it is possible to set detailed service parameters for
the aggregate, such as the time of the run down for pumps, hysteresis and the required value for inlet solenoids, etc.
Signalling manual mode from the controller
If we remove the aggregate from automatic operation managed by a controller, for example setting the mode or state, a
green hand symbol appears there. This notifies us at a glance at the technological scheme that the aggregates the controller
is not directly managing are converted to the given mode or state manually by the user. You can switch back again to the
automatic aggregate in its local menu, and after a short time the hand symbol disappears.
Signalling manual mode from the switch on the switchboard
In some cases, technologies are equipped with manual mechanical switches and reports about their states. When
switching the actual switch a symbol of a red hand appears in the technological scheme, which informs of the switch of
the aggregate into manual mode. This mode cannot be changed in the visualisation, it must be manually switched on the
switchboard into automatic mode.
From the principle function, it can happen that the aggregate is switched on the switchboard and on the controller to
manual mode. Then both symbols are displayed there at the same time.
Important warning!
Switching aggregates to manual modes without sufficient knowledge of the technology can cause dangerous technological
states, or even damage to the equipment.
3.2.5
Information about variables, displaying trends
A joint function of all technological displays is the possibility to select variables, displaying detailed information about
variables and appropriate historical trends.
We select variables by pressing the CT RL key and left-clicking the mouse on dynamic parts of the display. The selected
parts of the display are denoted in a light colour. Selecting one area can be done in the same way as a selection. To select
all areas of the display just click the mouse anywhere in the display without pressing CT RL . The local menu with the
available functions is displayed by right-clicking the mouse on the entity.
Controls:
select - CT RL + Left mouse button on an unselected entity
deselect - CT RL + Left mouse button on a previously selected entity
local menu of functions - CT RL + Right mouse button on entity
© 2015 ALFA Mikrosystémy, s.r.o.
29
30
ProCop 3.5
select all - Left mouse button anywhere in the display without CT RL
Example of selected parts of the display with the local menu
Local menu of variables
After selecting variables and opening the local menu CT RL + the right mouse button displays the local menu.
Options in the local menu of variables:
Graphic trends of all variables - opens graphic historical trends with the selection of all available trends
of selected variables
Text trends of all variables - opens text historical trends with the selection of all available trends of
selected variables
Information about variables - opens a dialogue window with detailed information about variables
Dialogue window with information about variables
In the dialogue window with detailed information about variables, in the top part a list of variables from selected areas of
the technological display is shown.
The column for each variable then contains:
The name of the variable with icons of the direction and data type of the variable
- analogue
- binary
- counter
- discrete
- text
Description of the variable with indication of the active alarm
Value - Live value of the variable
Unit of the variable
Information that the variable is trending
Configuration - connection to the technological variable of the controller
Last update - the date and time of the last variable refresh
Note
If the variable is invalid, the texts are printed in grey. If the variable has an active alarm, the row is printed in red.
Tip!
By selecting the row with the variable, the lower part shows further details about the variable, alarm, limits, connected
trend and the like.
© 2015 ALFA Mikrosystémy, s.r.o.
Display Browser
3.3
Dialogues of Operator Controls
Not only does the ProCop monitoring system allow monitoring of the technology state, it also allows a variety of
interventions in the technology. An example can be controlling transmissions (pumps, ventilators, etc.), opening and
closing valves, setting the required values, etc.
All these events are implemented via dynamic actions using the mouse on individual display entities. You can recognise
the display entity that can undergo this by the changing mouse cursor. Instead of an arrow, a hand symbol appears over
this entity.
The entity usually reacts to clicking with the left or right mouse button:
Direct setting of values 31
Create a dialogue for entry of value 31
Create a dialogue with preselected constants 32
Create a dialogue for entry of date and time 32
Create a dialogue with a table of values 32
Dialogue of a time program 32
Create a floating menu 36
Switch displays 37
The entity, however, may also react to other mouse events. It can be, for example, setting values using the pull button.
The entity should be handled with the mouse and "dragged" to another place expressing the set value.
The value in the entry fields of the settings dialogue is written and entered in the national format setting in
Windows:
With the OK button confirm the set value.
With the Ca n c e l you end the dialogue without the set value being accepted.
The H e l p button takes you to this help section.
Note
After clicking the OK button, the requests for setting the value are ordered in a communications queue. Until the request
is dealt with and the value is back newly calculated from the controller, the value does not change when next opened in the
dialogue window. The record implemented for the value is usually indicated in the events 51 , a record not implemented is
declared as an alarm 51 (usually communications). Until the record of the value is recorded in the events 51 , the value
does not change in the dialogue window.
Tip!
Any dialogue can be cancelled, and no change is then sent to the technology, even if adjustments have been made in the
dialogue window.
3.3.1
Direct setting of the value
By clicking on the entity, the given technological variable is set directly. The meaning of this variable is usually clear from
the context, or is printed as a tip when resting the mouse cursor over the entity. The mouse curser changes to a hand over
this kind of entity. This method of control is only used for simple and safe operations, such as switching the display, etc.
For more complex settings, a dialogue window or local menu will usually be used.
3.3.2
Dialogue for entry of a value
During monitoring, it is sometimes necessary to change the value of a certain variable (e.g. required temperature, etc.). For
this purpose, clicking in the given place on the screen can create a dialogue for entry of the value.
Dialogue for setting the value (in given limits, of given unit).
The dialogue is made up of an entry row and set of buttons. The new value can simply be written in the entry field, while
it is possible to use the keys Delete and Bac k Spac e to delete old values. The old value is automatically rewritten if it
is selected (e.g. immediately after opening the dialogue).
© 2015 ALFA Mikrosystémy, s.r.o.
31
32
ProCop 3.5
For entering decimal values you can use a comma or point depending on your Windows local settings.
3.3.3
Dialogue with preset constants
The dialogue with preset constants is like the dialogue for entry of a value 31 , but the difference is that it contains a free
number of predefined constants in the form of radio buttons. After clicking a specific constant, the value is written in the
entry line.
Dialogue for setting a value with preset constants (with content checking).
3.3.4
Dialogue for entry of date and time
This dialogue allows the input of data, time or both date and time together.
Dialogue for entering date and time (alternatively for entering date or time).
The dialogue is made up of an entry row and set of buttons. The new value can simply be written in the entry field, while
it is possible to use the keys Delete and Bac k Spac e to delete old values. The old value is automatically rewritten if it
is selected (e.g. immediately after opening the dialogue).
The date can also be selected from the calendar after pressing the arrow symbol in the row with the date or calendar
symbol.
In special cases it is possible to enter a time higher than 24 hours - if it is in a technology with a time slot, not a time
within a day.
3.3.5
Dialogue with a table of values
The dialogue with a table of values allows you to set several values at once in one dialogue. These values are put in a
table. You can move the mouse between individual entry rows in the table, or use the T ab key (to move forward) or
Shift+T ab (move back). Individual entry rows can be complete with the set limit and unit. The grey rows are read only,
so you cannot enter a value in them and they are for information about the value of a quantity which may be necessary to
input other values.
Example dialogue with table of values; the second value cannot be set, it is just for informational purposes
3.3.6
Time Program Dialogue
The dialogue for a time program is for easy entering and editing of weekly time catalogues known as TSP (Time Switch
Program).
© 2015 ALFA Mikrosystémy, s.r.o.
Display Browser
In the weekly time program, you can designate up to six changes to the required value for each day. There can be three
types of time catalogues. Individual types are marked as TSP1, TSP2 and TSP3. The difference between individual time
catalogues is in the number and type of parameters. For this reason the method of managing only the most common time
catalogue, TSP3, will be described further. Parameters of the other time programs are only a subset of this.
In the general time program the following values can be changed:
Time - In the time column you can enter the required time for changing the entered value.
Level - In the level column you can select one of the offered values required (e.g. switched off, normal,
attenuated).
Act. - Selecting the field in the act column means the given row of the time catalogue is active. This way
you can delete or activate one of the changes of the required value for any day, without having to shift
individual rows in the time catalogue. This option is particularly interesting for temporary adjustments to
the time catalogue. The selection is available only in "Advanced settings".
S tage - In the stage column you can enter the required value for the specific technological variable.
Opt. - The parameter "Optimum Start/Stop" is part only of the TSP3 time program, and can be used, for
example, for optimising a change to the required value. You can find more information in the
documentation for the specific monitoring project.
S tage2 - Apart from the required value, it is possible in TSP3 to enter a second required value for a
specific technological variable in the column Stage 2.
Note
The majority of time programs only have some of the above options, depending on the controller type and time program
used in it.
The dialogue for a time program has three tabs:
Basic settings - It is only possible to edit previously defined rows of the time program, while the same days for the
time program are always automatically merged into one line. There is a more detailed description in the topic basic
settings for a time program 34 .
Advanced setting - In this tab you can define any time catalogue for any day. There is a more detailed description in
the topic advanced settings for a time program 34 .
Predefined level colours - If the colour scheme for individual groups is not suitable, you can assign any colour to
each level. There is a more detailed description in the topic predefined level colours for a time program 35 .
Graphic display
36
in the lower part of the dialogue displays the current settings of the time program.
Settings profiles
Setting time programs (profile) can be saved in the monitoring system under the selected name in the tab advanced
settings 34 , or deleted. In the basic 34 and the advanced 34 settings, you can select a profile at any time and redo the
whole time program for the saved scheme.
Note
Profiles can be used between different time programs, but only if they have the same level - a profile will not be offered in
the list if the time program that was saved with another number or level meaning.
Joint control of the time program dialogue
In all tabs, buttons with the following functions are available:
The OK button implements settings of changed values into the technology and closes the dialogue.
The Ap p l y button implements the settings of the changed values into the technology but the dialogue is not closed.
The Ca n c e l button closes the dialogue without the changed values being set in the technology.
The H e l p button displays the help for the relevant tab.
Notes
All tabs and graphic displays are only a different view of the same time program, if an adjustment is implemented in any
tab or graph; the others are also adjusted according to the given change.
In the time catalogue, you can, in some cases, set the time program not only for individual days of the week (MondaySunday), but also the time program for special days marked as Anniversaries, Holidays and Periodical.
© 2015 ALFA Mikrosystémy, s.r.o.
33
34
ProCop 3.5
The time program is set in the controller. The controller manages the technology according to the time program and
separate clock of the real time independent of the monitoring computer. It is therefore necessary for the time and date (and
where appropriate, the day of the week) to be entered correctly in the controller for the time programs to function
correctly.
3.3.6.1
Time program basic settings
In this display, it is possible to edit predefined rows in the time program, while for the same days of the time program,
they are always automatically merged into one row. If, for example, the time program is defined in such a way that
individual working days will have the same number of rows, including their parameters, only one row, called "MondayFriday" appears in the basic settings mode. In the basic settings, you cannot add further rows for the time program or
define a special time program for a certain day.
Example of time program basic settings with adjustable time and level:
On the right-hand side, the current operating mode of the time program can be displayed. If set to Au t o , the time
program is used and the controller is governed according to it by the technology. If in Ma n u a l mode, the time program
is disabled and the technology is still in one state and in the defined level in manual mode.
To reset the time program to a previously saved profile, just select it from Pro f i l e se t t i n g s. In the selection only the
profiles which can be applied to the given type of time program are displayed - with the same number of levels and the
same meanings. Profiles can be saved and deleted in the tab time program advanced settings 34 .
For predefining a time program in a larger scope, it is sometimes necessary to use time program advanced settings
Colours of individual levels can be predefined
34
.
35 .
Notes
The time catalogue can be switched to manual operation in the basic settings mode. With manual operation you can
manually set the values Level, Stage 1 and Stage 2 in the manual operations part.
Colours for individual levels can be predefined against their basic states in the third tab of the dialogue for a time
program 35 .
3.3.6.2
Time program advanced settings
In this tab you can define any time catalogue for any day. When selecting several days, the user can edit the time program
for these days at once. With batch editing, the differences in settings of the time program are highlighted with a colour
icon for the selected day in the time program.
© 2015 ALFA Mikrosystémy, s.r.o.
Display Browser
Time program advanced settings - when selecting several rows (while holding the Shift ,, Ctrl ) a colour icon is displayed
for differing rows.
35
Entering the time, levels, stages (TSP2, TSP3) and activity of the row, is implemented together for the selected rows. The
row does not appear - it is not active - unless the Act activity mark is ticked.
To reset the time program to a previously saved profile, just select it from Pro f i l e se t t i n g s. In the selection only the
profiles which can be applied to the given type of time program are displayed - with the same number of levels and the
same meanings.
If you want to save the current settings of the time program, just fill out the new name in the selection and press the
button Sa v e p ro f i l e . If you want to delete a profile, just select it and press the button D e l e t e p ro f i l e . Cancelling
a dialogue does not have an impact on the adjusted profiles; changes in the profiles are immediately adjusted by the
system without confirming the dialogue with the OK button.
Graphic display
36
at the bottom part of the dialogue displays the current settings of the time program.
Notes
The time catalogue can be switched to manual operation in the basic settings mode. With manual operation you can
manually set the values Level, Stage 1 and Stage 2 in the manual operations part.
In the advanced settings mode, the current settings of the time program can be saved under a specified name and these
settings can later be used and applied to another time program with the same parameters (levels, stages).
In the time catalogue, you can, in some cases, set the time program not only for individual days of the week (MondaySunday), but also the time program for special days marked as Anniversaries, Holidays and Periodical.
3.3.6.3
Predefining level colours for the time program
To unify it and better orientate yourself you can define user colours for the levels of time programs. These colours are
then displayed in the graph and key 36 in tabs for the time program dialogue 32 . The level text is assigned a specific
colour.
© 2015 ALFA Mikrosystémy, s.r.o.
36
ProCop 3.5
Example of setting level colours; each level of the time program can have any colour set.
When setting colours, by pressing Fe t c h level names from the open time program. The N e w button allows you to
create and name the row of the assigned level name and required colour. In the list the jointly predefined level colours of
all time programs are displayed. You can D e l e t e , or R e n a me t he selected row with assigned colour for the name level
using the buttons.
After selecting any level the added colour is shown on the right. By simply switching the colour, the required colour is
assigned, after clicking the arrow, the list of colours offered is expanded.
Note
Changes in colours and names of levels appear immediately; the buttons OK, Ap p l y and Ca n c e l have no effect on the
adjustments.
3.3.6.4
Graphic illustration of the time program
A graph of the time catalogue displays the time program and allows the changes to be implemented using the mouse.
Changes in TSP can be implemented in batches in the same interval or separately.
Adjustment of TSP on several days is implemented by dragging the mouse to the interface for changes or
by the whole time interval in the graph (the cursor changes appearance).
Adjustment of TSP is implemented jointly on days with the same time change or the same position for
the time interval.
Adjustment of TSP on one day is implemented the same way as in the previous case, but prior to
pressing the left mouse button, we hold the Ctrl key, thus adjusting only one day.
Note
Changes in the graphic illustration immediately appears in the text values in the top part of the dialogue, and vice versa.
By pressing OK the settings of the changed values are implemented into the technology and the dialogue is closed. Ap p l y
implements the settings of the changed value into the technology but the dialogue is not closed. The Ca n c e l button closes
the dialogue without setting the changed values into the technology.
3.3.7
Initiating floating menus
Buttons, aggregates and objects can initiate the local menu upon clicking the mouse button. It can be a single or double
click of any button, depending on the project. Usually, one click of either mouse button is used, and for special or service
settings the right mouse button, or double clicking either of the buttons.
Example of floating menu including button to initiate it
By clicking on a dynamic part of the technological display you can initiate the floating menu containing a variety of
commands. This floating menu can also be multilevel, i.e. after selecting from the first command level, the menu develops
to another level.
Some rows can be inactive (grey) in relation to the current state of the monitoring technology.
© 2015 ALFA Mikrosystémy, s.r.o.
Display Browser
Tip!
Objects and areas which implement some kind of event after pressing the mouse button are recognised through the mouse
cursor changing the appearance from an arrow to a hand symbol when scrolling the mouse cursor in this area.
3.3.8
Switching the display
By clicking on a dynamic part of the technological display, another display is shown. Usually, its name or description is
written directly in the display as the button name, or the dynamic area, e.g. H VAC1 , CH , Bo i l e r, or the arrow or
double arrow symbol can be seen here to navigate displays.
Tip!
Using the
Ba c k button, you can return to the previous display in the display history
© 2015 ALFA Mikrosystémy, s.r.o.
22
at any time.
37
Trend Browser
4
Trend Browser
The trend browser allows the historical development of scanned quantities to be displayed in the form of graphs and
tables. The trend browser is part of the ProCop Toolbar, which makes the functions of the monitoring and visualisation
system available in a clear and simple way.
The trend browser can be opened by pressing the button T re n d s, or, in the advanced menu 15 ,
by selecting View T rends . You can also initiate trends at any time with the keyboard shortcut
ALT +T .
The trend browser allows staff to browse historical trends of technological variables in the form of clear graphs and
tables. The specific scope of trending technological variables is defined in the monitoring project in Designer mode. This
forms a configuration part of the ProCop visualisation system. For work with the program in the monitoring mode,
however, knowledge of this designer part is not necessary.
In the browser for historical trends we can display several graphic 40 histories at the same time, we can set the the
properties of what is shown 46 , deduct values scanned at a certain time and if desired print 49 and export 50 the
results. It is also possible to create consumption overviews 42 for the given period, even within monthly archiving of
historical trends.
4.1
Description of the trend browser window
The trend browser window is made up of a toolbar and the window desktop. The window desktop displays the selected
trends in the selected time interval, either in the form of a table or a graph. There is a taskbar above the desktop.
The toolbar of historical trends: selection of settings templates, selection of trends, date and time, trend archive, displays,
properties, etc.
The toolbar contains operating components necessary for browsing trends.
Groups of settings 39 - allows the current trend browser settings (displayed trends, time interval, etc.)
to be saved and these settings to be viewed quickly at any time; by clicking on the arrow by the name, the
local menu is displayed with a list of trend templates and other functions
S election of trends 40 - allows you to select the list of currently displayed trends from the list of all
trends
S election of time interval 41 - allows you to select the type of time interval (absolute, relative,
floating) and the extent of this time interval for displaying trends
S election of displayed set 43 - switching between the current trends displayed and the archive of
trends for a specific month and year
Text 47 /Graphic view 43 - this option allows you to switch between a graphic and text view of trends
Properties of graphic 46 / text view 48 - settings for a variety of properties of the browser for graphic
and text trends, such as the background colour of the window, grids, value and time markings, measuring
cursors, the type and extent of left and right value axes, etc.
Trends key 48 - description of the key for graphic and text trends, row meanings
Print 49 - print of selected text or graphic trends
Export 50 - allows the displayed trends to be exported to a file in the relevant format
4.2
Groups of settings
Settings for the graphic and text trends window including the selection of displayed trends and the time interval can be
saved at any time and later launched quickly. In the toolbar of the trend browser, on the far left, the current group of
settings is displayed. By default, the group with the name (Default settings) opens, which can be freely adjusted by
© 2015 ALFA Mikrosystémy, s.r.o.
39
40
ProCop 3.5
changing the trend properties, selection of trends and the time scope and, if wished, saved. When opening the browser of
historical trends, these settings open automatically.
By clicking in the toolbar on the name of the template settings, by right-clicking the button on the trend desktop, and by
selecting Setting groups in the local menu, or the Enter key, a dialogue window opens to manage groups of settings.
Groups of settings may be organised in a tree. With the Fi l e button, you can create and name a new file, and with the
T e mp l a t e button create new blank settings with the same template (Default settings).
Tip!
Templates can be moved individually between files using the mouse. Just grab the template with the left-mouse button and
drag it to the group, where it should be moved.
You can select and open any group of settings with the Op e n button. Files and templates can be renamed using the
N a me button, or deleted with the D e l e t e button. You can copy the selected template with the Co p y button and then
name it or move it elsewhere.
All changes implemented in the way described above are saved using the Sa v e button or Op e n after selecting a newly
displayed template. Ca n c e l then returns all the adjustments to the original state. For selecting a group of settings the
system user who last modified the group is given at the top.
Saving settings
After setting the displayed trends, time interval, or other properties, by right-clicking the mouse on the graphs or table
you can open the menu with the option Sav e template , CT RL+S , or Sav e template as SHIFT +CT RL+S . This
option saves the settings in the selected group, or opens a dialogue window with the newly created group of settings,
where you can enter their name.
Refreshing settings
By clicking in the toolbar on the arrow by the template settings name, a tree menu is expanded with quick selection of all
previously saved groups of settings, the option to save the current settings in the groups and opening the dialogue
window for management of the groups of settings.
Tip!
After deleting the template (Default settings) and reopening the browser of historical trends, a template is created with
the default settings in the original state after installation.
4.3
Selection of trends for display
The dialogue for the selection of trends can be initiated from the toolbar via Se l e c t i o n o f t re n d s, or with the same
selection from the local menu, which opens after right-clicking the mouse anywhere on the desktop of the window for
graphic or text trends. The same option can be implemented using the keyboard shortcut CT RL+Enter.
The dialogue contains an expanded tree of all groups of trends. After selecting the group of trends, a list of trends from
this group is shown in the right part of the dialogue. Under the list of trends of the selected group, there is a list of
displayed trends.
Adding trends to the list of displayed trends - M ark the trends you want to display and press the
dialogue button Ad d or the Insert , key or drag the selected trends with the mouse to the list of trends
displayed. Another option is tapping the left mouse button on the trend you want to add.
Removing trends from the list of displayed trends - M ark the trends you want to remove and press
the button R e mo v e or the Delete .key. Another option is tapping the left mouse button on the trend
you want to remove.
In the dialogue, you can also influence the order of displayed selected trends using the buttons U p and D o w n , or using
the keyboard shortcuts Ctrl+Arrow up and Ctrl+Arrow down .
Tip!
The order of the trends displayed can be changed by dragging the names of trends in the key to the necessary location.
© 2015 ALFA Mikrosystémy, s.r.o.
Trend Browser
4.4
Selection of time interval
The dialogue for selection of the time interval can be opened from the toolbar using Se l e c t d a t e a n d t i me , or by
selecting from the same menu from the floating menu initiated by clicking the left mouse button anywhere on the desktop
of the window for graphic or text trends. An extremely quick method of initiating this dialogue is also clicking the left
mouse button anywhere on the time axis of the window for graphic or text trends, or pressing the Spac ebar.
The dialogue contains three tabs for the definition of the time range:
Absolute time range 41 - Fixed time range defined by the time and date of the start and end of the time
interval.
Relative time range 41 - Time range defined relatively against the start of the day, week, month, year,
etc.
Floating time range 41 - Time range defined relatively against the actual time.
Under the definition of the time interval, the currently displayed time range is shown for checking purposes. In the case
of relative or floating time intervals, this range can change.
At the bottom of the dialogue it is possible to switch off the displayed time axis and set the time to finish reading the
data from the trend server and the time delay for portraying trends.
Tip!
To enlarge a cutout of the trend area, you can drag the mouse on the trends desktop, on the time or value axes. You can
go back with the
button in the bottom right-hand corner by the time axis. The whole range of the given axis can then
be displayed by pressing
4.4.1
by the given axis.
Absolute range
The absolute time range is defined with a fixed start and end of the time interval.
In entering the start and end of the time interval, the procedure is exactly the same.
Entering the date can be implemented either directly by entering a specific data using the keyboard, or more conveniently
by opening the calendar by clicking the expansion button and selecting the specific date. If necessary, you can use the
T o d a y button to return to the current day, or the scroll button to change the date to the previous or next day.
Entering the time can again be implemented either by entering the specific time using the keyboard, or using the scroll
button next to the field for entering the time. If necessary, you can use the button Mi d n i g h t for setting the time to
0:00:00, or the buttons for changing the time in hours.
4.4.2
Relative range
The relative time range allows you to enter the time period relatively to the important calendar point in relation to the
current date, e.g. against the start or end of the day, week, month, year, etc.
When defining the relative time interval you can select some of the preset relative time intervals, or define your own.
When defining your own relative time interval, you can proceed from a predefined interval. Editing the range is done by
clicking Ad j u st .
The start and end of the interval are edited at the same time, by selecting the default moment and any time shift. When
selecting the time shift, you can select both positive and negative time shifts.
Note
The resulting entered time interval that corresponds to the current date and time is displayed in the field Current time
range .
4.4.3
Floating range
A floating time range, in comparison with a relative time interval, is always defined against the current time. It is a time
period of the specified length, shifted against the current time by the defined value and rounded off to the selected unit,
e.g. hour, day, month, etc.
When selecting the floating time interval, you can select either one of the predefined intervals, or define your own, while
when defining your own floating range, you can start from one of the predefined time ranges.
Edit your own time range by pressing the Ed i t button.
© 2015 ALFA Mikrosystémy, s.r.o.
41
42
ProCop 3.5
The actual floating time range is thus defined by:
Length range - unlike the absolute and relative time interval, the floating time range is not defined as the
time of the start and end, but the length of the time axis. The time of the end is always the current time
(plus any shift – see below)
Rounded to whole nr. – by rounding off the interval, we actually define after what period the time axis is
automatically shifted. When setting the rounding off to seconds, the time axis displayed will change every
second, when rounding off to whole minutes, the time axis will change every minute, etc.
Offset by ... back towards current time – the offset of the whole displayed interval against the current
time. It is usually a good idea to set the time axis shift as a certain percentage of the interval displayed. In
this way you can ensure that the current time is not exactly the same as the right edge of the displayed
cutout but is far enough from it, which creates a much clearer impression overall.
Note
The resulting specified time interval, which corresponds to the current date and time, is displayed in the area Current
time range .
4.4.4
Filter of samples in text trends
In the middle part of the dialogue for setting the date and time, there is a filter for samples in text trends. This allows the
user to set the period samples are displayed in the text trends, independent of the actual trending of values by the
system.
It is possible to select from these filters:
All samples – displays all samples from the database, no filters applied
With period; shift – allows the user period with which individual samples are displayed to be entered.
Then the shift of the period against midnight also. Entering is accepted in the format when the period and
its semi-colon (;) is first introduced and then it is possible to introduce the shift of the period and its unit.
Units can be used as follows: s - second, m - minute, h - hour, d - day.
Example: 1 h; 15 m
Every day – displays one sample per day in the hour entered.
Every week – displays one sample per week, at midnight on the selected day.
Every S . in the month – displays one sample per month, at midnight on the entered day.
Tolerance of the time for samples
Tolerance of the time for samples allow a sample to be displayed that does not have a precise time according to the
selected period, shift (not functioning when selecting "All samples"). The value tolerated of the time deviation is relative
against the entered period and is entered in percent of the period (max. 50%).
Consumption
In the filter of samples it is possible to select the option "Consumption". This option displays the difference of the value
following from the current one in place of the actual measured values of trends. Therefore, if we select a filter, e.g. "Every
day", we get a table of daily consumptions, i.e. the differences between values of the current and following day. With this
option, the time is displayed as an interval (December 2006) or the start of an interval, to which the consumption
pertains. The end is the time of the next row.
Let us give some examples of usage. For each, we first select the required time period for which we want to
calculate the consumption, tick "Consumption" and set a filter:
Hourly consumption – we select the filter W ith period; shift and enter in the period
1h; 0 s
Daily consumption – we select the filter Ev ery day at and enter the hour of the reading.
Weekly consumption – we select the filter Ev ery week and enter the day of the reading.
Monthly consumption – we select the filter Ev ery month and enter the day of the reading.
Selection of tolerance allows the approximate consumption to be displayed even when at the given moment the sample
was not available. If we cancel this option, in places where there is no sample available, the sample with the precise
period does not display any data.
© 2015 ALFA Mikrosystémy, s.r.o.
Trend Browser
4.5
Selection of displayed set
The trend server provides the option for automatic archiving and backup of trends.
When browsing trends you can switch from browsing current trend files to browsing trend archives for the given month
and year, at any time. The selection of the displayed set of trends can be done by changing the selection in the list of
available sets of trends. This option is still available in the historical trends toolbar 39 .
Setting the displayed trends does not change when changing the trend set. If the selected set of trends does not contain
the chosen trend, the trend is not depicted.
When there is a change to the displayed set the time axis automatically switches to the relevant range of the archive.
When returning to the current trends, the range of the time axis switches to the current day.
4.6
Graphic Trends Browser
Individual quantities are displayed in graphic trends in the form of linear graphs. This display method gives the user a
very good idea about the behaviour of values of the monitored quantities.
In the graphic trends it is possible to differentiate curves by colour, thickness and type of line. It is possible to roughly
subtract values directly from the graph, according to the set grids, or more precisely measure the values using the value
and time measuring cursors, or ascertain the values directly in the table.
Tip!
If we pause the cursor over the graph of the trends, a bubble with a name of the close trends and precise values and units
at the given time is displayed.
4.6.1
Description of the window of graphic trends
The window for the browser of graphic trends is made up of several parts. The description of individual parts of the
window for the browser for graphic trends is described in separate chapters.
Preview of the window of graphic trends
Toolbar 39 - joint operating components for graphic and textual display of trends
Key 48 - Name of the trend and its most important parameters
S crollbar for primary value axis 45 - scrollbar to move in primary value axis
Parameters of primary value axis 45 - operating components for primary value axis
© 2015 ALFA Mikrosystémy, s.r.o.
43
44
ProCop 3.5
S crollbar for secondary value axis 45 - scrollbar to move in secondary value axis
Parameters of secondary value axis 45 - operating components for secondary value axis
Area for plotting trends 44 - area with grid for plotting selected trends
Value measuring cursors 46 - measuring cursors for precise calculation of values and their differences
Time measuring cursors 46 - measuring cursors for precise calculation of time and interval lengths
S crollbar for time axis 44 - scrollbar to move in time axis
Parameters of time axis 44 - operating components for work with time axis
4.6.2
Area for plotting trends
The selected trends are portrayed in the central part of the graphic trends window.
The values are illustrated in the graph in relation to the type of variable in several ways:
Trend type
Illustration method
ANALOG
Polyline joining the measured values
BINARY
Stepwise rectangular function (binary variables are always displayed above each other)
COUNTER Stepwise rectangular function in several phases and the change of gradient exactly at the measured value
DIS CRETE Stepwise rectangular function in several phases and the change of gradient exactly at the measured value
TEXT
Not displayed in graphic trends
Along with the trends displayed, this space contains a grid and cross-hair cursors
46 .
M arking any area with the mouse enlarges this area to the full viewing area. At the same time, the value axis
to manual scale and pauses the automatic shift of the time axis 44 .
45
switches
Tip!
You can switch back to the automatic scale by clicking the
button, or the green square
by the value axis, which
also removes the enlargement and sets to the whole axis scale. This option is also available with the time axis.
If the cursor is paused over one of the trends displayed, the sample time is displayed, with the trend name and its value.
If there are several trends near the cursor, the names and values of all these trends are displayed.
4.6.3
Time axis of trends
The time axis is composed of several parts
Rapid access buttons - for quick switching of the display mode and switching displayed measuring
cursors:
Switching to textual display of trends
Switches off/on display of measuring cursors
S crollbar for time axis - for the shift of the displayed cutout in the range of the time axis when enlarging
a specific time area. The scrollbar also contains these icons:
Increasing the range of the time axis to the past
Shift of enlarged cutout to the past
Enlarged range of value axis to the future
Shift of enlarged cutout to the future
Setting the time start/end of the time axis
Operating components of the time axis - for enlarging or shrinking the range of the time axis, or
stopping the automatic shift of the time axis.
Enlarging the area to half range
Shrinking the area to double range
Displaying the whole range of the time axis
Indication of the automatic shift of the time axis, stopping automatic shift
© 2015 ALFA Mikrosystémy, s.r.o.
Trend Browser
Indication of stopping the time axis, switching off automatic shift
Return to the previous range of the time and value axes
Time axis - Displays the current time mark on the time axis. By marking the part of the time axis with
the mouse it is possible to enlarge the selected area to the whole width of the display area. When enlarging
the area of the time axis the automatic shift of the time axis is stopped at the same time.
Tip!
Back to the display of the whole range it is possible to switch (cancel cutout, enlargement) by pressing the button with the
symbol of a green square
4.6.4
for the relevant axis.
Value axis of trends
The value axis is composed of several parts.
S crollbar of the value axis - for shifting the displayed cutout in the range of the value axis when
enlarging a specific area. The scrollbar also contains these two icons:
Enlarging the range of the value axis towards higher values
Shift of the enlarged cutout upwards
Enlarging the range of the value axis towards lower values
Shift of the enlarged cutout downwards
Operating components of the value axis - enlarges or shrinks the range of the value access, or switches
between manual and automatic range of the value axis.
Enlarging the area to half range
Shrinking the area to double range
Displaying the whole range of the value axis
Indication of the automatic shift, switch to manual mode of the range of the value axis
Indication of the automatic range, switch to automatic mode of the range of the value axis
Value axis - Displays the current value and the value mark on the value axis. M arking the part of the
value axis with the mouse allows you to enlarge the selected area to the whole height of the display field.
When enlarging the area of the value axis, the range of the value axis automatically switches to manual.
The range of values of the value axis by default sets automatically according to the range of the displayed values of
trends. By choosing Properties from the toolbar, or by right-clicking the mouse on the value axis, you can set the
required range of the appropriate value axis manually.
There are also three types of value axis available:
Value axis - displays the graphs of all trends in absolute values mutually comparable.
Percentage axis - individual graphs are displayed in the whole range of the value axis according to the
actual local maximum (100%) and minimum (0%). Values on the axis are therefore expressed in
percentages of this range.
Logarithmic axis - graphs are displayed only in positive numbers, values are recalculated as a decimal
logarithm of the given number and displayed similarly to the value axis. The grid is displayed in the same
way. This can be useful when displaying quantities of sensors with a logarithmic course, e.g. pressure.
Graphic display of trends allows for the case of displaying two trends with lineally different range, to display the
secondary value axis and any trend simply added to this secondary value axis. Adding a given trend to the primary or
secondary value axis is implemented in the key by tapping the left mouse button on the arrow in the example line.
Tip!
You can go back to the display of the whole range quickly on the axis (cancel cutout, enlargement) by clicking the button
with the symbol of the green square
for the relevant axis.
Primary and secondary value axis
In the trend key next to the example line there is an arrow displayed which goes towards the values axis to which the
© 2015 ALFA Mikrosystémy, s.r.o.
45
46
ProCop 3.5
given trend is associated. By default, all trends are associated with the primary axis, the secondary (right) axis is not
displayed. The exception is with binary trends, which are always associated with the binary axis, which automatically
shows on the right next to the trends field.
A secondary (right) value axis acts exactly the same as the primary axis (left). Its type, ranges, etc. can be set by
selecting Pro p e rt i e s.
Tip!
The association of trends to the value axis can be changed in the properties, or quickly with a double click on the example
line of the trends. The secondary axis is automatically displayed or hidden if at least one trend is associated with it.
4.6.5
Value and time measuring cursors
The window for the browser of graphic trends can contain value and time measuring cursors. These cursors serve for
precise subtraction of values and times from graphs. Switching on/off the display of measuring cursors can be done by
clicking the
symbol in the operating components of the time axis.
Time and value measuring cursors are made up partly of a cross-hair cursor and from a box displaying the calculated value
on the time or value axis. The difference in values of both measuring cursors is displayed in the box between both
measuring cursors.
Dragging the cross-hair cursor or the value indicator of the cursor can shift the cursor to any place in the time or value
axis and subtract the required value. Dragging behind the indicator of the difference can shift with both measuring cursors
at the same time without changing their distance.
Locking the time and value cursors
The time and value cursor can be locked in a selected position. Locking the cursor is implemented by tapping the left
mouse button on the indicator of the value of the cursor. The locked cursor remains (for example when enlarging a
specific area of the graph) on the selected value, whereas an unlocked cursor stays in the selected position within the
screen.
4.6.6
Properties of the graphic display
The properties of the display of graphic trends can be set in a dialogue window, which can be initiated by pressing the
Pro p e rt i e s
button in the toolbar or the same option from the floating menu opened by right-clicking the mouse anywhere on the
desktop.
In this dialogue you can set:
Key - Switching on/off the display of the key, or individual key items.
Grid - Switching on/off the value and time marks and lines, setting their colours, width and spacing.
Trends - Setting colour and width of line for plotting individual trends, assigning to a primary or
secondary value axis.
More - Setting the background colour, switching on/off the bubble help in the key and the grid, switching
on/off the display of the binary axis.
Print - Setting the title, headers and footers when printing graphic and text trends.
Value cursors - Switching on/off the display of the value measuring cursors, setting colour, setting locks.
Time cursors - Switching on/off the display of the time measuring cursors, setting colour, setting locks.
Y axis left (primary) - Switching on/off the display of the left (primary) value axis, changing the type of
axis (value, percentage, logarithmic), setting the manual range of the axis.
Y axis right (secondary) - Switching on/off the display of the left (primary) value axis, changing the
type of axis (value, percentage, logarithmic), setting the manual range of the axis.
4.7
Text Trends Browser
Text trends are for displaying the progress of the technological quantities in table format. After selecting the displayed
trends and time interval, the values are shown organised in a table, where the columns correspond to individual trends,
and the table rows represent values taken at the given time.
© 2015 ALFA Mikrosystémy, s.r.o.
Trend Browser
4.7.1
Description of the text trends window
47
The window for the browser of text trends is made up of several parts. The description of individual parts of the window
for the browser of text trends is described in the separate chapters.
Toolbar 39 - joint operating components for graphic and text display of trends
Key 48 - name of trend and its most important parameters
Table with times and values of samples 47 - table containing trending values
Time axis scrollbar 48 - scrollbar for moving in the time axis
Operating components of the time axis 48 - operating components for work with the time axis
Textual display of historical trends
The window for the browser of text trends is made up of several parts. The description of individual parts of the window
of the browser for text trends is described in separate chapters.
4.7.2
Table of text trends
In this part of the window of text trends the select trends are listed. The list format in the text trends is governed by
setting the list format of the given technological variable. This list format is set in the configuration part of the ProCop
visualisation system, it is not user adjustable. Optionally in the properties you can set whether the unit for each
quantity is displayed. This is also not adjustable by the user, it is defined in the technological project.
If invalid samples are displayed, they are listed in red and the sample value is followed by the symbol ~. Invalid
samples arise when saving an invalid value of a technological variable. The value of the technological variable is invalid,
for example, when there is a communication failure for a longer period of time than the set validity period for these
technological variables, etc.
Each data block is separated by a green tinged line. The data block is understood to be a related area without setting
monitoring. Data blocks in trends start, for example, during a monitoring failure (ending the monitoring by the user,
computer restart, power supply failure, stopping or closing the monitoring project, etc.). A grey line separates
individual days.
On the left, the sample times are displayed. In the event of calculating consumption, time periods may also appear here.
© 2015 ALFA Mikrosystémy, s.r.o.
48
4.7.3
ProCop 3.5
Time axis of text trends
The time axis is composed of several parts.
Rapid access buttons - for quick switching of the display mode and switching displayed measuring
cursors:
Switching to graphic display of trends
S crollbar for time axis - for the shift of the displayed cutout in the range of the time axis when enlarging
a specific time area. The scrollbar also contains these icons:
Increasing the range of the time axis to the past
Shift of enlarged cutout to the past
Enlarged range of value axis to the future
Shift of enlarged cutout to the future
Setting the time start/end of the time axis
Operating components of the time axis - for enlarging or shrinking the range of the time axis, or
stopping the automatic shift of the time axis.
Enlarging the cutout to half the current cutout
Shrinking the cutout to double the current cutout
Displaying the whole range of the time axis
Indication of the automatic shift of the time axis, stopping shift
Indication of stopping the time axis, switching off automatic shift
Return to the previous range of the time and value axes
Time axis - Displays the current time mark on the time axis. By marking the part of the time axis with
the mouse it is possible to enlarge the selected area to the whole width of the display area. When enlarging
the area of the time axis the automatic shift of the time axis is stopped at the same time.
4.7.4
Properties of text trends
Properties of the display of text trends can be set in a dialogue window, which can be initiated by pressing the button
Pro p e rt i e s in the toolbar 39 or by the same selection from the floating menu opened by right-clicking the mouse on
the desktop.
In this dialogue you can set:
Key - Switching on/off the display of the key, or individual key items.
Trends - Setting colour and width of line for plotting individual trends, assigning to a primary or
secondary value axis.
More - Switching on/off the bubble help in the key. Other selections in this menu are related to the
graphic display.
Print - Setting the title, headers and footers when printing graphic and text trends.
4.8
Trends key
The trends key contains a list of all the currently displayed trends.
In the key it is possible to display these parameters:
Trend name - Item containing descriptive name of trend.
Example line - Example line which is plotted by the trend. The arrow at the end signifies to which value
axis the trend relates. By double clicking you can associate the trend from the secondary axis and back.
Trend period - Current period of sampling the given trend.
Maximum trend - M aximum value of trend from currently displayed interval.
Minimum trend - M inimum value of trend from currently displayed interval.
Measured values - Trend value in points where time measuring cursors are positioned.
© 2015 ALFA Mikrosystémy, s.r.o.
Trend Browser
Tip!
A list of items for trends can be switched on or off by selecting Pro p e rt i e s, More tab.
Left panel of the key in text trends
In the left part of the key in the text trends additional information about filtration of displayed samples is shown, with
period of filtered samples and maximum time tolerance of samples from required periods during their absence. Also
information, if the consumption is displayed - difference between the following from the previous sample, not the
original value.
Assigning to primary/secondary value axis
By double-clicking the left mouse button on the left or right end of the example line, you can switch the trend assignment
to the primary (left) or secondary (right) value axis.
Changing the order of trends
Clicking on the key to any trend and dragging to a new position on the left or right can influence the order of trends in the
key and also orders the trends for plotting.
Displaying detailed information about a trend
When stopping the mouse cursor over a trend in the key, further detailed information about the trend such as data type,
trend variable, trend file, minimum and maximum number of samples, hysteresis, etc.
Further options
Right-clicking on the key for a selected trend displays the floating menu with the options:
adjust properties of displayed trend (colour, type, lines)
adjust key properties
add another trend to the list of displayed trends
remove the selected trend from the list of displayed trends
switch the trend assignment to primary or secondary value axis
4.9
Printing trends
The displayed text or graphic trends can be printed at any time on the selected printer. Start printing by clicking Pri n t
on the toolbar. In the dialogue displayed you can select a printer other than the default one to print, or set further print
parameters (page orientation, print quality, etc.).
The letter size for printing text trends is set in the dialogue Properties under the More tab. This dialogue is opened by
clicking the Pro p e rt i e s button in the toolbar. You can print all the rows in the table of trends or just the ones you
select.
Print all rows in table of trends - all displayed rows are printed if one or no table row is selected
Print selected rows in table of trends - selected rows are printed if their number is greater than one
User- defined headers, title and footers
In the trend properties in the Print tab, you can define two rows of user-defined headers, among them the title and one
row of user-defined footers. In the case of modification compared with basic or blank settings these setting for
adjustment are displayed prior to each specific print run.
Each row is composed of three pairs of texts. The first of the pairs is printed in bold. The texts are positioned in pairs on
the left, middle and right on the page. The title is located in the centre of the page between two rows of headers. The
footer is positioned at the bottom. If only one text from a pair is completed, the whole thing is aligned to the left, centred
or aligned to the right depending on the position.
In the text trends the title and second header is printed only on the first page. The footer is only on the last page.
© 2015 ALFA Mikrosystémy, s.r.o.
49
50
ProCop 3.5
Each row can contain predefined text combined with one or more variables, which are replaced with the value
only when printed:
%TEMPLATENAME% - name of the template setting
%US ER% - logged-on user
%DATE% - current date
%TIME% - current time
%DATEFROM% - date of the start of printed trends
%TIMEFROM% - time of the start of printed trends
%DATETO% - date of the end of printed trends
%TIMETO% - time of the end of printed trends
Tip!
Variables can be used on the row several times, added to with any text, e.g.
Printed on %DATE% .............
Note
Print settings are saved in a template. It is possible therefore to define and save the required template, for example, for the
calculation of monthly consumption with the descriptions and name and in this way document the subtracted values from
the measuring gauges.
4.10
Exporting trends
With the Exp o rt button in the toolbar of the trends window you can export the selected samples to a file, which can
then be further processed, for example in text editors, or table calculators and databases.
It is first necessary to select a file into which the data should be exported.
It is further possible to select various parameters such as:
Export header - allows export of the header for trend columns
Export date - exports the date as well
Unit in header - adds unit in header
Unit for each value - a unit given for each value (during import may interfere with calculations)
Prefixing columns - selects marks for prefixing individual columns
Column separator - allows the option of separating columns with commas, spaces and tabs
Numerical format of date and time - allow numeric processing after import into table calculators
Text format of date and time - is immediately readable, not possible to process further
Export invalid samples - chooses whether to export invalid samples as well and how to identify them
Tip!
Exported data can be used for processing in foreign systems or office applications, e.g. Microsoft Excel, etc.
© 2015 ALFA Mikrosystémy, s.r.o.
Alarm Browser
5
Alarm Browser
51
The alarm browser allows staff to display a list of alarm reports, events and system events for the monitoring system
("alarms"). It is a part of the ProCop Toolbar which makes the function of the monitoring and visualisation system clear
and easy to access.
The alarm browser can be opened by pressing Al a rms, or in the advanced menu 15 by selecting
View Alarms . You can also initiate trends at any time with the keyboard shortcut ALT +A .
Alarm reports arise mainly in the data server, which interprets the data part of the monitoring project. The data server
evaluates conditions for an alarm to be raised and in the event of fulfilling these conditions it generates an alarm report.
The specific list of alarm conditions is defined in the monitoring project in designer mode. This forms a configuration part
of the ProCop visualisation system. Working on the program in the monitoring mode does not, however, require
knowledge of the designer part.
5.1
Alarms, Events, System Events
Differences between alarms, events and data in the system record log are only significant:
Alarms - these are information about error or out-of-tolerance states of quantities or technical means;
signify states and situations for which the staff must be notified, or to which they must react in a specific
way, because if not it can lead to an emergency situation.
Events - these are reports without a warning or alert nature, but have informational and additional
functions; they make it known that certain states have been achieved or that a defined situation has
occurred or an intervention was implemented in the technology by a user setting values.
S ystem events - a summary of records from internal system states and reports from internal
diagnostics; for regular staff it has no importance, it is just for the systems administrator, e.g. for locating
errors or diagnostics of interventions by specific users.
The buttons
together.
Al a rms,
Ev e n t s and
Syst e m allow you to select which of the records are displayed
The operation and control of alarms, events and systems does not differ, so all three types of information will continue
to be described together. For greater brevity, we will talk together about alarms or alarm reports, but it should be noted
that we always mean events and system events too, unless expressly noted otherwise.
5.2
Unconfirmed & Current Alarms, Service
All alarms delivered to the alarm server can be displayed in the alarm service. However, for staff it is often extremely
important to display a list of newly arrived alarms, or a list of alarms which still exist.
For greater clarity, they are divided into three views:
Unaccepted - displays a list of alarms not yet confirmed by staff. With the button Ac c e p t , or the
option in the local menu you can accept one or several unaccepted alarms. An accepted alarm is
acknowledged and will no longer be displayed in the list of unaccepted alarms. Confirmation of alarms has
no effect on the list of Current alarms or the service. The confirmation time and currently logged-on user
is observed with the alarm.
Current - an alarm report that has occurred and not yet expired and can be displayed by switching
the view to Cu rre n t . If verified that the alarm no longer exists and has not yet expired despite that or it
is a known long-term state, you can Ca n c e l it with the appropriate button. The reason can be, for
example, removing a device, sensor or expiration of the alarm when monitoring is switched off (for some
devices). Cancelling an alarm has no effect on the record about an alarm in the service view.
© 2015 ALFA Mikrosystémy, s.r.o.
52
ProCop 3.5
S ervice - in the service view all alarms (events, system events) are always displayed unless some
other filters are active. The service is used for supervising any documented state which has occurred in
the monitoring system. If the list is already long, it is possible to D e l e t e it from the given alarm back.
You can only delete those alarms previously archived from the regular database. Alarms, events and
system events will be deleted from the regular database, but they are still available in the archive for an
individual month, which we can switch to by selecting the displayed set 43 .
Local menu with choice of view for alarms database
Note
An alarm, event or system event CANNOT be definitively deleted from the system; they are always archived, and archives
cannot be modified.
5.3
Description of Alarm Browser Window
The window with the list of alarms contains alarm reports matching the required filter. At the top of the alarm browser,
there is a set of buttons to work with the list of alarms.
The alarm toolbar allows:
Selection of displayed list of alarms 51
Button for acceptation 53 , cancellation 54 or deletion of alarms
Selection of alarm set 53
Filtration by alarm type 51
Filtration by occurrence time, source or priority of alarm 54
Printing 56 of alarms by the set parameters
54
Zoom for enlarging alarms to improve readability
Alarms bar: Display option, acceptation, displayed set, selection of alarm type, events, filtration, printing, export and
zoom to enlarge
Available information about the alarm
In the list of alarms, this information about the alarm is optionally displayed:
Type - type of alarm report (alarm, event, system event).
Id - alarm identifier - serial number entered into the alarm database.
Date - date of the alarm.
Time - time of the alarm.
S ource - source of the alarm (usually the name of the controller or part of technology).
Write date - date of arrival of the alarm at the alarm server.
Write time - time of arrival of the alarm at the alarm server.
Level - Alarm level (1-origin, 0-expiry).
Priority - One of five levels of the alarm priority (very low, low, medium, high, very high).
Text - Text describing the given alarm or event.
Accept date - Date of confirming the given alarm.
Accept time - Time of confirming the given alarm.
Accepted by - Name of the user who implemented the confirmation of the given alarm.
Note - Text entered when confirming alarm.
Alarm column headers
The header for alarm list columns allows:
Double clicking changes the classification
56
according to the selected column, and when repeated then
© 2015 ALFA Mikrosystémy, s.r.o.
Alarm Browser
reverses the order of classification
Right clicking the selection of displayed columns and the method of printing the column
Local menu of the "Source" column
Right clicking the mouse on any column header displays the local men which allows you to display/hide any column and
set the method of printing the column.
Printing columns
Methods of printing 56 columns:
Print automatically - the column is printed with the set width
Disable column printing - the column is not printed
Wrap column - wraps text within the width of the column in several rows, a further alarm will be
indented so that it does not cover the wrapped text
Multiline print - selected column will be printed as another row (not a column) under the appropriate
alarm
Multiline with note - selected column will be printed as another row under the appropriate alarm; at the
start of the row the original name of the column will be written - suitable for columns with long text
(alarm text, note)
5.4
Selection of the Displayed Set
The alarm server provides the option of automatic archiving and backup of alarms.
When browsing alarms you can switch at any time from browsing the current file of alarm reports to browsing the archive
of alarms for the given month and year. Selection of the displayed alarm set can be implemented by changing the selection
in the list of available alarm sets.
Note
If an alarm set other than the "Current" one is selected, it is not possible to implement any adjustments to the alarms,
such as confirmation, resetting, deletion, or changing the note.
5.5
Accpeting Alarms
Every alarm that arrives at the alarm server needs accepting. Confirmation of alarms is an event carried out by control
centre staff. With alarm confirmation, the staff indicate to the alarm server that the given alarm report has been
acknowledged.
© 2015 ALFA Mikrosystémy, s.r.o.
53
54
ProCop 3.5
Procedure for confirmation of alarms:
For confirmation of the given alarm it is first necessary to display the list of unaccepted alarms
alarm report window by choosing
51
in the
Unac c epted.
It is further necessary to mark all the alarms we want to confirm and then click the
Ac c e p t button.
When accepting alarms, for each accepted alarm the date and time of confirmation and the name of the
currently logged-on user who has confirmed it are recorded.
Notes
Confirmation of alarms can also be implemented by right-clicking the mouse on selected alarms and by choosing Ac c ept
or Ac c ept with note . When confirming with a note, it is possible to enter any text. This text is recorded in the "Note"
column for the confirmed alarms.
It is not possible to confirm alarms in the archive, only if the selection of the set of alarms is switched to "Current".
5.6
Cancellation of Alarms
For multi-level alarms, in exceptional situations it can happen that an alarm was sent to the alarm server, but despite the
alarm already having rung, a report about the alarm occurring does not reach the alarm server. In such a situation it can
happen, for example, when adjusting a monitoring project, etc. In such cases it is necessary to cancel the alarm manually.
When cancelling an alarm, a missing alarm report about the alarm finishing is sent to the alarm server, with information
that it is about "Resetting" an alarm. Cancellation of an alarm has no relation to deleting an alarm.
Procedure when cancelling an alarm:
To cancel a given alarm, it is first necessary to display the list of current alarms
Cu rre n t in the window of alarm reports.
51
Cancellation of an alarm is carried out in the list of existing alarms by pressing the
by selecting
Ca n c e l button.
When cancelling an alarm it is possible to enter text with more information. To this text the name of the
user currently logged in is added and it is recorded in the note column.
5.7
Deletion of Alarms
Due to securing the system against unwanted interventions, the alarm browser does not allow alarms to be deleted freely,
only all the alarms older than the selected alarm. Alarms which have not yet been archived cannot be deleted at all. An
alarm therefore cannot be definitively removed from the system. It will always be available in one of the monthly
archives.
Deletion of alarms is implemented in the
service list of alarms
51
by clicking the
D e l e t e button.
Notes
To prevent an unwanted increase in size of the alarm reports file, when filling the alarm reports database to the given
limit, the oldest alarms are automatically overwritten with new ones. To search for older alarms, there are the alarm
archives 53 .
It is not possible to delete alarms which have not yet been archived. The
5.8
D e l e t e button is inactive.
Filtration of Alarms
In the list of alarm reports, only alarms matching the required filter are displayed.
Apart from the basic filtration of alarms by alarm type 51 you can further filter alarms by:
Date and time occurred - only displays alarms with date and time of occurrence in the selected interval
S ource - only displays alarms from selected sources
S tyle - displays alarms in the given style (communication, alarms, warnings)
Priority and level - only displays alarms with the selected or higher priority
Filtration of alarms by these criteria can be switched on or off in the dialogue after clicking the
change the settings without switching a filter on or off with the
Fi l t e r button. You can
Se t t i n g s button.
© 2015 ALFA Mikrosystémy, s.r.o.
Alarm Browser
Tip!
Filters can be switched off individually by deselecting filters individually or in batches with the
Fi l t e r button. A
pressed button symbolises that filters are active. The normal button state then means that filters are dormant.
Filtration by time of alarm occurrence
Ticking the T ime option in the dialogue window Setting a c ustom filter turns on a filter by the time of the alarm and
displays the tab of the same name. It is possible in the tab to select one of the defaults scales set by the filter by time of
occurrence to the scale from several days back up until the present time, or a custom scale.
In this case it is necessary to enter the date and time of the start and end of the required interval in which the alarm
occurred. Alarms occurring outside of this interval will not be displayed.
Filtration by source
Ticking the Sourc e option in the dialogue window Setting a c ustom filter turns on a filter by the source of the alarm.
A tree of sources that an alarm (event, system event) has already reported is displayed. Alarms, with the ticked source in
the tree, are displayed in the list of alarms, while unselected ones are not.
The buttons Al l and N o n e can mark or cancel the marking of all available sources in the tree.
Filtration by alarm style
Each alarm, event and system event has an alarm style assigned to it. This style specifies how, in which colours and
when the alarm will be displayed, etc. Based on the alarm style, various events can be implemented upon occurrence or
expiration of an alarm. S tyles relating alarms with the same properties but with a different origin, such as
communications alarms, alarms that launch a siren, send to an SM S, events about setting values, etc. The name and
description of the style is introduced in the list. Only the styles which have already occurred in the alarms are displayed.
Ticking the option Style in the dialogue window Setting a c ustom filter turns on a filter by the style of alarm.
By ticking individual rows (styles) we define which alarms will be displayed with which style.
The buttons Al l and N o n e can mark or cancel the marking of all available sources in the tree.
Communications alarms are the kind of reports which do not come from the technology but can occur during faults in
data transfer between machines, measuring and the ProCop monitoring system. With the buttons you can permit or
forbid their display - marking or deselection of the appropriate styles is implemented.
Filtration by priority and levels
Ticking the option Priority and lev el in the dialogue window Setting a c ustom filter turns on a filter and displays
the appropriate tab with its setting.
Alarms currently have five priority levels and we can filter them according to the with intuitive settings of the filter
selection.
Alarms also have a level which defines their activity:
Activity = 0 - Alarm has rung, is inactive, return to normal, expiration
Activity >= 1 - Alarm has expired, changed level, exists still
Note that alarms can also take on higher values of the activity depending on the different controller types, but it always
refers to a serious fault, not a normal state.
With the OK button we confirm the change in the settings for filters and we switch on the filter and the dialogue window
closes. With the Ca n c e l button we cancel all the adjustments, and everything stays in the original state.
Tip!
At the same time as the above filters, filters for displaying alarms, events and system events 51 are also active, but also
Unaccepted existing and service alarms 51 . It also applies with the selected set (archive) 53 , from which the given
alarms are displayed. You should not forget to set these other filters correctly too, to get the correct result.
Tip!
If we want to get all the settings in the initial state, it is enough to display another browser (displays, trends) and go back
© 2015 ALFA Mikrosystémy, s.r.o.
55
56
ProCop 3.5
to the alarms.
5.9
Sorting Alarms
Alarms can be sorted in ascending and descending order by all columns. Just click on the header of the appropriate
column and the alarms are reordered according to the selected column. The column and direction of sorting is indicated
by a grey arrow on the left in the column header, by which the records are sorted. By clicking the mouse again, you can
reverse the order the alarms in the same column.
Filtration of alarms is retained when sorting changes, and pre-filtered records are sorted. Columns containing the date and
time only allow sorting by the date and time at the same time. The arrow is already indicated for the column with the
date.
Note
The column by which the list is sorted is marked in the header with an arrow, which also indicates ascending or
descending order.
Classifying new alarms
By default, sorting is set so that the alarms are classified by date and time of occurrence in descending order, so the
newest alarms are in the first row, then followed by the older alarms. The oldest ones are at the end of the list.
Due to the possible differing communication delays in transfer, it is possible that the alarm is delivered to the server later
than an alarm that occurred after it and is therefore sorted to the middle of the list. The Date and time of arrival at the
server column (may not be displayed) give the time of the server when the alarm was delivered and recorded in the
database.
Note
If an alarm has occurred in the technology a while ago and is only delivered to the visualisation now, it is sorted by the
date and time of occurrence. Alarms also have the time of write at the visualisation recorded, which can be displayed by
selection of the appropriate columns 52 .
Tip!
If we want to get all the settings in the initial state, it is enough to display another browser (displays, trends) and go back
to the alarms.
5.10
Printing Alarms
Printing alarms, events and system events can be carried out on printers which are available in the Windows operating
system to the ProCop user. The network printers can be connected in the advanced menu 15 of the ProCop Toolbar by
selecting Connec t network printers . For the printer settings then select Setup printers .
Methods of printing columns
In the header of individual columns, small icons can be displayed that signify the print format for individual columns. The
format option is carried out by right-clicking the header of the appropriate column. This procedure and meanings can be
found in the description of the alarm browser window 52 .
Selecting alarms for print
If we want to print just a restricted range of alarms, before clicking the Pri n t button, we first select the rows. We do this
by left-clicking the mouse and dragging it over individual rows, marking the first and last row while holding down the
Shift , button, or selecting individual rows with the mouse while holding down the Ctrl button.
Similarly, you can also select the range of the alarms for printing by using the keyboard cursors combined with the Shift ,
button in accordance with Windows operating system usage.
Preview and printing of alarms
In the bar over the name of the alarm columns there is a Pri n t button available, which displays the system dialogue
window to select the printer and setting print parameters (format of paper, orientation, quality, etc.) and displays the
© 2015 ALFA Mikrosystémy, s.r.o.
Alarm Browser
preview of individual pages of paper with alarms.
In the preview, you can select the size of the page display, browse individual pages, adjust printer settings and with the
Pri n t button print the required pages. Close the preview using the Cl o se button.
5.11
Export Alarms
With the Exp o rt button it is possible to save all the displayed or selected alarms in a CSV file. This can then be further
processed, e.g. in table calculators, or text editors.
If we want to export just a restricted rang of alarms, before clicking the Exp o rt button, we first select the rows. We do
this by left-clicking the mouse and dragging it over individual rows, marking the first and last row while holding down the
Shift , button, or selecting individual rows with the mouse while holding down the Ctrl button.
Similarly, you can also select the range of export alarms by using the keyboard cursors combined with the Shift , button
in accordance with Windows operating system usage.
© 2015 ALFA Mikrosystémy, s.r.o.
57
Module Control
6
Module Control
The ProCop Toolbar allows communications to be managed with individual devices with the appropriate permissions.
M odule control can be opened by pressing Mo d u l e c o n t ro l on the toolbar or in the advanced
menu 15 by selecting View Module c ontrol . You can also initiate the module control window
at any time with the keyboard shortcut ALT +M .
Communications paths and modules from the ProCop monitoring system display their current states, addresses, periods
for updating data, or volumes of transferred data and other information. It is also possible to force refresh of values 59 ,
download trends from the concentrator, and refresh their project even outside of the normal update period. It is also
possible to remove communications modules disconnected from the controllers or measuring gauges from the periodic
refresh, or, vice versa, include it in the permanent update 59 , for example, when starting up a station.
6.1
Module Update
For input and output of data to a monitoring system, special program blocks called "input/output modules" are used.
These modules communicate with the technological devices, usually via protocols and communications paths, by which
they ensure the supply of current values of technological quantities and in return allow staff to operate technological
devices.
For management of "input/output modules", ensuring the state of communication or setting their parameters, there is a
special service window.
The window contains a tree list of all connected communications modules and paths together with their names,
information about their state and several buttons. The buttons allow communications to be launched or stopped, the
module monitor to be opened and parameters of a selected module to be set.
Buttons for service of input/output modules
These buttons always cover the marked modules:
St a rt – Launching communication (refresh of values) with connected devices outside of the usual period
of making contacts. If the communication path is shared by several devices, this request for
communication has the highest priority. If "Disable update" is set, "Normal update" mode is set
automatically upon pressing the St a rt button.
St o p – Stopping communication with the device. A further connection will run during the next regular
period or upon pressing the St a rt button.
N o rma l u p d a t e – The normal mode establishing contact and refresh of values in regular predefined
intervals.
D i sa b l e u p d a t e – Forbidding communication with the given device. If at that point in time
communication with the given device is underway, the communication ends the same way as when
pressing the St o p button.
Pe rma n e n t u p d a t e – Refresh of values takes place continually without ending the connection with
the controller. If the device is not communicating at that point in time with the control centre, it starts
communication just as with pressing the St a rt button.
Fi n d - With this button you can search for modules by name, which can be useful in extensive
monitoring systems with hundreds of modules.
Any of the mentioned operating buttons can be inactive. This way the "input/output module" tells users that this
function is not necessary for their activities and the function is not supported.
© 2015 ALFA Mikrosystémy, s.r.o.
59
60
ProCop 3.5
Tip!
Modules can also be selected in batch format and the appropriate action such as St a rt can be performed in batch mode launching communications or changing the refresh of values.
Important warning!
Permanent update can result in higher fees for the transferred data, if they are paid.
Disable update entirely cancels all communication with the device and until the module is included back in the normal
update, no data (or trends or alarms) will be available.
6.2
Advanced Functions in the Module Local Menu
You can initiate the advanced menu upon selecting one or more modules and right clicking the mouse. If selecting several
modules, however, there are only basic functions available as described above.
Advanced functions from the local menu of certain modules:
Request for modules (import from other control centre) - implements refresh and addition of modules
from imported control centre (useful if automatic import of modules is forbidden).
Request for displays (import from other control centre) - implements refresh addition of modules
from imported control centre (useful if automatic import of modules is forbidden).
Disable/ Enable trends transfer (import, AlfaBox) - with further connections historical trends will
(not) be transferred - speeds up communication, significantly decreases amount of transferred data.
Request for trends (import, AlfaBox) - forces transfer of trends since last transfer of trends (trends
can be transferred with another period than the date).
Request for all trends (import, AlfaBox) - forces transfer of all available trends (large volume of data,
can take a long time).
Disable/ Enable alarms transfer (import, AlfaBox) - with further connections alarms will (not) be
transferred.
Request for alarms (import, AlfaBox) - forces transfer of alarms since last connection.
Request for all alarms (import, AlfaBox) - forces transfer of all available alarms (large volume of data,
can take a long time).
Remote reboot (AlfaBox) - forces remote restart of AlfaBox (AlfaBox may not respond for several
minutes depending on connection type).
Update projec t (AlfaBox) - implements update of the monitoring project in AlfaBox (useful if the
automatic update for the project is switched off in AlfaBox).
Important warning!
Advanced functions of the local menu for trends can have significant results on the transferred volume of data,
functionality of the monitoring part of the technology, availability of data, trends, alarms and displays. Without detailed
knowledge or recommendations, it is not advisable that you use it (nor is it necessary).
© 2015 ALFA Mikrosystémy, s.r.o.
Calculator
7
Calculator
ProCop Toolbar allows you to use the functions of a calculator, which allows calculations to be implemented over the
current values of the technological variables.
You can open the calculator using the Ca l c u l a t o r button in the toolbar, or in the advanced menu
15 by selecting View
Calc ulator . You can also initiate the calculator window at any time with
the keyboard shortcut ALT +K .
The calculator is for evaluating numerical expressions. It is formed with a window containing a table. Each cell in this
table can contain any mathematical expression made up of constants, operators, functions and technological variables.
Each cell in the table may also link to the result from another cell in the table. The entire contents of the table is
periodically recalculated with an optional period or on command by the staff.
The syntax used for the calculator operation is the same as the Bára syntax. Furthermore, it is possible to use
technological variables in the calculator whose list is initiated by double-clicking the mouse on the entry row of the
calculator or by pressing the Insert key.
Adjusting the formula or text of the cell can be done by pressing the F2 key. Deleting the contents of selected cells is
done with the Delete , key or by selecting Delete from the local menu.
If a row starts with a semi-colon or quotation mark, the text is regarded as a commentary and is printed in
blue.
If an expression is written wrong (when compiling an error is discovered in the Bára language expression),
or the entered variable is not found, the text is also printed in blue like the commentary.
If a displayed variable or expression is invalid, it is written in red and its value followed by the symbol
"~".
Tip!
The contents of the calculator can be saved at any time with the button Sa v e t a b l e under the chosen name for later
use. The calculator always opens automatically with the last saved settings. To download and save contents of the
calculator, there is a set of icons over the calculator desktop.
Using the right mouse button, you can initiate a floating menu containing in part the event for working with the Windows
clipboard, and then you can choose the format of the extract of the displayed expression or technological variable.
7.1
Data Types
To evaluate numerical expressions, the Bára process language is used. This language recognises four types of variables
which are closely linked to the types of database variables. Individual data types are mutually incompatible, therefore it
is necessary to implement type conversion using conversion function calls.
Data type
Bits
Description
Scope
ANALOG
BINARY
COUNTER
DIS CRETE
TEXT
32
1
32
8
-
real number
logical values
integer
whole positive number
text chain
3.4 x 10e-38 ~ 3.4 x 10e+38
TRUE, FALSE
-2 147 483 648 ~ 2 147 483 647
0 ~ 255
-
ANALOG
four-byte number with floating decimal point (in other languages, e.g. float or real) and with accuracy of 6
to 7 significant digits.
BINARY
represents only logical values 1 or 0. To record constants of this type there are dedicated keywords
'TRUE' – takes the value of "logic high" – and 'FALSE', which represents the value "logic low or you can
© 2015 ALFA Mikrosystémy, s.r.o.
61
62
ProCop 3.5
simply write 1 and 0.
COUNTER
signed integer, 32 bits long. Constants of this type must be written as a whole decimal or hexadecimal
number in the mentioned range.
DIS CRETE
unsigned integer, 8 bits long. This means its range is only 0 to 255.
TEXT
any text chain
7.2
Expressions and Operators
As mentioned previously, mutually changing the type of variables is only possible using "conversion" functions. These
will be described below. Expressions in the language that are strictly syntactic and type controlled are made up of
operands and operators. Parts of the expressions with the precedence in the evaluation can be enclosed in round brackets.
Example
NOT (PX.KLAPA_POL+5 > Counter2Analog(PX.KLAPA_TEST))
Binary operators are implemented that always have two operands: of this type: one in front of the operator and one after
the operator. The resulting type of operator together with the permitted types of operands are organised in the table
(abbreviations A, B, C & D mean Analog, Binary, Counter and Discrete):
Operator
Level of operands
Types of operands
Type of result
*, /
%
+, AND, OR
>, <, =, <>, <=, >=
1
1
2
3
4
A, C, D
C, D
A, C, D
B, C
A, B, C, D
same as operand
same as operand
same as operand
same as operand
B
For the level of operators these basic rules apply:
an operand between two operators of different levels is evaluated first by the operator with a higher level,
e.g. the expression 5+3*2 is evaluated as 5+(3*2) ,
an operand between operators of the same levels is transferred for evaluation to the left operator, e.g. the
expression 3+2+1 is the same as (3+2)+1 ,
the part of the expression enclosed in brackets is evaluated as a separate expression with the highest level.
It is possible to consider operands of expressions as:
constants – simple numeric constants
variables – identifiers of already declared variables
function call – identifier of function with appropriate parameters
expression enclosed in brackets
It is possible to consider numeric constants as:
decimal integers – sequence of decimal digits (0, 1, .., 9)
hexadecimal numbers – sequence of hexadecimal digits (0, 1, ..,9, A, B, .., F) , preceded by
the characters '0x ',
number in exponential format, which can generally be written as
[+|-]XX[.XX][E[+|-]XX]
where:
o
o
o
the parts enclosed in square brackets are not compulsory
the sign may always be used only once
'X' characters mean any decimal digit
Example
789
0xFFFF1111
0x01234
0xABCDEF
0xFG
-1.235E+24
0.01
+2E-02
// decimal integer
// hexadecimal numbers
// incorrect record of hexadecimal number
// number with floating decimal point
© 2015 ALFA Mikrosystémy, s.r.o.
Calculator
Example
Negative numbers must be enclosed in brackets in these cases, when two operators follow each other, e.g..:
63
* (-6)
5 - (-2)
In the places of operators it is possible in expressions to use the name of technological variables. At the moment of
evaluating the expression the momentary value of the variable is reached. We can access the tree of technological variables
and Bára function list by pressing Insert key while editing a cell.
Functions are split into three basic groups:
converse – for transfer between individual data types
mathematic – for mathematical calculations
functions for work with the data and time
7.3
Conversion Functions
Conversion functions ensure data conversion between individual types of variables or expressions. Conversions of all
data types between each other are available. The name of the conversion function is always created with the name of the
parameter type, the figure 2 and the name of the type of value to which we are converting, as is visible in the following
table.
7.4
Type
Analog
Binary
Counter
Discrete
A
B
C
D
Binary2Analog
Counter2Analog
Discrete2Analog
Analog2Binary
Counter2Binary
Discrete2Binary
Analog2Counter
Binary2Counter
Discrete2Counter
Analog2Discrete
Binary2Discrete
Counter2Discrete
-
Mathematical Functions
Basic mathematical and goniometrical functions working only with the Analog data type are implemented in the
calculator.
© 2015 ALFA Mikrosystémy, s.r.o.
64
ProCop 3.5
Function
Mathematical
Description
Pi
S qr
S qrt
Exp
Pow
Pow10
Log
Ln
Rad2Deg
Deg2Rad
S in
Cos
Tan
AS in
ACos
ATan
Abs
S ign
Round
RoundDown
RoundUp
Min
Max
S elect
3.1415
x2
x 1/2
ex
yx
10x
log10x
ln x, logex
Pi (no parameter)
square
square root
Exponential, e to the power x
y to the power x (two parameters)
10 to the power x
decimal logarithm
natural logarithm
conversion of radian no. to degrees
conversion of degrees to radian no.
sine x (parameter v rad)
cosine x (parameter v rad)
tangent x (parameter v rad)
arcsine x (result v rad)
Arccosine x (result v rad)
Arctangent x (result v rad)
absolute value x
signum (1 for positive number, -1 for negative number)
Rounding off
Always rounding down
Always rounding up
minimum from specified arguments
maximum from specified arguments
if the expression p of the value is TRUE, returns x, otherwise y
sin(x)
cos(x)
tg(x)
arcsin(x)
arccos(x)
arctg(x)
|x|
sign(x)
minimum(x, y)
maximum(x, y)
Select(p, x, y)
Example
Analog2Counter( 2 * Pi( ) ) - Time > 3
7.5
Functions for Date and Time
The last group of functions are those for processing the date and time. The Bára language uses the second date format, i.e.
the number of seconds, which have passed since 00:00:00 1st January 1980. The advantage of this method is the
possibility of adding and subtracting the date and time. All functions return the Counter type.
Function
Parameter
Description
Year
Month
Day
Hour
Minute
S econd
Time
Date
DateTime
GetS ecCount
GetTickCount
GetYear
GetMonth
GetDay
GetHour
GetMin
GetS ec
date
date
date
time
time
time
Returns current year
Returns current month
Returns current day
Returns current hour
Returns current minute
Returns current second
Returns current daily time in seconds since midnight
Returns current date in seconds since 1.1.1980
Returns current date and time
Returns number of seconds since start of Windows
Returns number of milliseconds since start of Windows
Returns year from date specified by parameter
Returns month from date specified by parameter
Returns day from date specified by parameter
Returns hour from hour specified by parameter
Returns minute from hour specified by parameter
Returns second from hour specified by parameter
If the specified parameter is the date or time, it is possible to also use the functions of returning date and time together,
e.g. DateTime(). Given the internal representation of date information (as number of seconds since 1st January 1980), it
is possible to freely add or subtract the date and time.
© 2015 ALFA Mikrosystémy, s.r.o.
Calculator
Example
If I want to get the date and time:
DateTime = Date + Time
If I want to get the number of tomorrow:
GetDay( Date( ) + 86400 )
If I want to get the time an hour after the immediate time:
Time( ) + 3600
7.6
Link to Value of Other Cells
In the calculator we can link to the resulting values of other rows on the spreadsheet, and indeed via the pseudovariables
with the name of the cell $XY, where X marks the letter from the column and Y the number of the row to which we want
to link.
Example
If we need to add double the result from cell A2 of the table with the resulting value in cell C12, we use the expression:
2*$A2 + $C12
The pseudovariables $XY take on the immediate value of the result in the give Xth column Yth row of the table and their
data type is the same as the data type of the result of the term of the given cell.
© 2015 ALFA Mikrosystémy, s.r.o.
65
Access Privileges
8
Access Privileges
In order to secure the monitoring system against unwanted unauthorized intervention with the technology, a component
is included for administration of access permissions. Every user can get access from the system administrator for a certain
range of information together with restricting operational power, i.e. defining those activities which they are permitted to
implement. For this, it is necessary for the system staff to identify themselves with their username and password,
known only to the user personally.
8.1
User Login
Upon launching the monitoring project, either no user is logged in, or the user "Everyone" is logged in, with minimum
permissions (depending on the settings of the system). The system therefore, for example, provides only a very narrow
range of information, with no option for active intervention in the technology. If staff want to use all the available
options, they must, via the advanced menu 15 by selecting Ac c ess rights Login , log in to the system using their
username and password, therefore getting access to information and permissions assigned to them by the system
administrator.
In the ProCop Toolbar, a fast select button may be displayed to log in to or out of the system.
Toolbar buttons
The toolbar buttons and options in the advanced menu for logging in and out of the system.
Advanced menu
Permissions
Permissions
In the notification area
13
15
Login
Logout
the name of the currently logged-in user, or "Everyone", if nobody has logged in yet.
Dialogue for the user to log in to the system ProCop 3.5
In the dialogue for logging the user in, it is necessary to write or select the username and enter the access password. When
writing the password only asterisks'*' (asterisks, points, commas) are shown for security purposes.
After entering the password press the button L o g i n .
With the button Ca n c e l you can close the dialogue without logging in.
© 2015 ALFA Mikrosystémy, s.r.o.
67
68
ProCop 3.5
Note
It is possible to log in anytime, without needing to log out, under the new username. Previous access rights are thus
cancelled and only the access rights pertaining to the newly entered user are valid.
8.2
Password Change
If necessary, every user can change their personal password at any time using the advanced menu 15 by selecting
Ac c ess rights Change password . Periodically changing your password is important for security reasons.
Dialogue for changing the password of any user:
This dialogue allows the user to change the password. To change your password, you must know the current password.
The procedure is as follows:
In the row User select your login name.
Write your current password in the Old password row for the selected user.
Write new password in the New password row.
Write your new password again for verification in the Password v erific ation row.
To change the password click OK.
To close the dialogue without changing the password click Ca n c e l at any time.
In the dialogue for changing the password it is necessary to enter your username, your original password and the new
password with verification, to prevent the password being changed by an unauthorised person or mistyping the new
password.
Note
You must remember your password, because otherwise you will not have access to operations defined by the system
administrator. Only the system administrator can provide the settings of a forgotten password for a new one in the
Permission management 68 .
Important warning!
When entering passwords in the ProCop system, for simplicity, it does not distinguish between upper and lower case
letters.
8.3
Management of Users, Groups and Permissions
This part describes the control of the administrator of access permissions, which is to define and edit access permissions
of users for individual parts of the monitoring project. The administrator of access permissions is part of the ProCop
Toolbar, which makes the functions of the monitoring and visualisation system clearly and simply available.
You can open the administrator of access permissions by clicking the Pe rmi ssi o n button (not
displayed by default, see selection of buttons 13 ), or in the advanced menu 15 by selecting View
Permission management . You can also initiate this management at any time using the
keyboard shortcut CT RL+ALT +R .
Note
User management is only available to users with Access Management permissions, by default User Administrator and
Designer.
The main window for the administrator of access permissions contains an expandable list of defined permissions
users 70 , user groups 70 and a list of currently logged-in users 71 .
69
,
© 2015 ALFA Mikrosystémy, s.r.o.
Access Privileges
The right of access to individual parts of the system is not assigned directly to individual users, but a group of users. So
that users have the given permissions, they must be a member of the group which has the given permissions assigned.
69
A newly created user has the password defined automatically as with the username. This initial number can be changed at
any time by initiating the advanced menu 15 Ac c ess rights Change password .
8.3.1
Permission list
Permissions in the ProCop 3.5 monitoring system can only be assigned to groups not individual users. A list of
permissions can be distributed with further items. In the current version of the system, however, it is not possible to
custom define the permissions to parts of the system or the technology.
8.3.1.1
Predefined access areas
In the current version the system differentiates these access areas:
Access Management - management of user permissions and accounts
Visual Designer - using the Visual Designer development tool
WebView - WWW display browser
WebControl - WWW control of technology
WebAlarms - WWW alarm browser
WebTrends - WWW trend browser
Change Trivial - setting values of unimportant technological variables
Change General - setting values of regular technological variables
Change Important - setting values of especially important technological variables
Alarm Accept - confirmation of received alarm reports and events (alarm confirmation)
Alarm S ervice - access and work in the service mode for alarms, resetting alarms, deleting alarms
Logbook S ervice - work with the archive of the system log, viewing, deleting or printing it
Alarm Management - access permissions for management of the alarm server - archiving, backup of
alarms
Module Control - control of communication with external technical means by managing input/output
modules
ProCop Options - permissions for adjusting settings in the ProCop system
Trend View - permissions for viewing graphic and textual historical trends including archives
Trend Management - access permissions for management of trend server - archiving, backup, saving and
exporting trends
ProCop Exit - right to exit the ProCop Toolbar client application
Debug S cripts - right to debug Bára scripts
Trace S ystem - right to monitor progress and debugging printouts of the ProCop system
8.3.1.2
Adding/removing privileges
Adding new permissions can be done upon selection of the folder Permissions with the Insert key. Removing
permissions can be done upon selection of the appropriate permission with the Delete key.
Note
In the current version of the system, it is not possible to use and assign user defined permissions in any way for parts of
the system or technology. All permissions concern the embedded access areas 69
8.3.1.3
Change permision name & description, assigning permisions to user groups
Changing the name and description of permissions, just as with adding or removing permissions to a group of users, is
possible in the dialogue displayed upon pressing the "Enter" key or upon right-clicking the mouse in the tree list.
In the dialogue displayed you can switch between the following using the tabs at the top:
editing of the name and description of the permission
adding permissions to groups
© 2015 ALFA Mikrosystémy, s.r.o.
70
8.3.2
ProCop 3.5
Group list
The tree of access permission management contains a Groups branch in which all the available groups in the ProCop 3.5
system are displayed. Several groups are embedded 70 , permissions are assigned to groups, not users, and users are
assigned membership in any number of groups.
8.3.2.1
Predefined user groups
Except for user defined groups, the list always contains these embedded groups:
Administrators – group of administrators (they have all rights except for Visual Designer permissions,
anyone can be a member)
Designers – group of system developers (they only have Visual Designer permissions, only designers
can be group members)
Users – group suitable for standard system users (by default the assigned rights can be freely changed)
Everyone – by default a logged-in user (the rights of this group can be freely changed, only the user
Everyone is a member)
You can add or remove freely from the defined permissions and define a list of their members (users) for each group.
8.3.2.2
Adding/removing user groups
In the list of user groups you can freely add or remove user groups.
Adding a new group can be done upon selecting the folder Gro u p s with the Insert key. Removing a group can be done
upon selecting the appropriate group with the Delete key.
8.3.2.3
Changing group name and description, adding group members
Changing the name and description of a group, as with adding or removing group permissions, or adding or removing a
user from the group, can be done in the dialogue displayed upon clicking the "Enter" key or upon right-clicking the mouse
in the tree list.
In the dialogue displayed, you can switch between the following, using the tabs at the top:
editing the name and description of the group
assigning group permissions
adding and removing members (users)
Adding or removing permissions is possible upon selecting the group using the Insert key and Delete in the list of
permissions (on the right in the main window for access permission management).
8.3.3
User list
Each user can be a member of any number of user groups. User permissions are then given as a summary of permissions
of all groups of which the user is a member. In the system, there are always predefined users 70 , who are necessary for
the system to operate and cannot be removed.
8. 3. 3. 1 P re de fi ne d use rs
Except for user-defined users, the system always contains these users:
Administrator – system administrator (belongs to the group of Administrators and Everyone, i.e. has all
rights except Visual Designer)
Designer – designer of the monitoring project (only a member of the Designers group, i.e. only has
Visual Design rights)
Everyone – default logged-in user (by default is the only member of the Everyone group; the rights of
this group can be freely changed)
Anonymous Internet User – anonymous internet user (by default has no rights, this use can be put in
any group and thus can be assigned any rights)
Data S erver 3.x – embedded user of the data server
Way S erver 3.x – embedded user of the access paths
ProCop 3.x – embedded user of the ProCop Toolbar 3.x
ProWeb 3.x – embedded user of the web extension of the ProCop application 3.x
These users cannot be removed from the system.
© 2015 ALFA Mikrosystémy, s.r.o.
Access Privileges
8.3.3.2
Adding/removing users
Adding a new user can be done upon selecting the folder U se rs with the Insert key. Removing users can be done upon
selecting the appropriate user with the Delete key.
8.3.3.3
Changing user name and description, assigning a user to a group
Changing the name and description of the user, just like adding or removing a user from a group, or putting a user in user
groups, can be done in the dialogue displayed upon pressing Enter or upon right-clicking the mouse in the tree list.
In the dialogue displayed you can switch between the following tabs at the top:
editing the name and description of a user
changing the groups in which the user is a member
Adding and removing a user to/from a group can also be done upon selecting the user via the Insert key and the Delete
key in the list of groups of which the user is a member (on the right of the main window of the access permissions
manager).
8.3.4
List of logged in users
In the list of logged in users there is a list of users who currently have made a connection with the access permissions
server. Apart from the user name it is also possible to find out the computer name (or computer IP address) and the name
of the application which made the connection with the access permissions server.
8.3.5
Dialogue Descriptions
This chapter contains descriptions of individual dialogue windows for user permission management. In general it can be
said that control corresponds to standard Windows usage controls.
Common meanings of buttons:
Clicking the OK button saves changes and closes the dialogue.
Clicking the Ap p l y button saves changes without closing the dialogue.
Clicking the Ca n c e l button leaves the dialogue without saving the implemented changes.
8.3.5.1
Dialogue for forced password change
If you have the right to administer the list of access permissions, you can change the access password of any user even
without knowledge of their current password.
The procedure is as follows:
In the row User select your user login name.
In the New password row, write your new user password.
In the row Verify password write the new password again for verification.
To change the password click the button OK.
To exit a dialogue without changing the password, press the Ca n c e l . button at any time.
8.3.5.2
Dialogue for connecting to the access privileges server
M anagement of the monitoring system permissions can also be done remotely. To connect to a remote server with access
permissions, it is necessary to select the name of the computer on which the access permissions server has been
launched. If you do not know the computer name, you can use the initiated dialogue to search for it by clicking the Fi n d
button.
8.3.5.3
Dialogue for logging on to the access privileges server
To connect to the access permissions server it is necessary to have "Access Management" permissions (management of
user permissions and accounts), i.e. to know the username and password of the user with these permissions. By default,
this user is "Administrator" with a blank password.
© 2015 ALFA Mikrosystémy, s.r.o.
71
72
8.3.5.4
ProCop 3.5
Dialogue for selecting privileges
The dialogue is for assigning permissions to a user group. In the list only the permissions that the user group does not
yet have assigned are displayed.
If you want to assign more permissions to the user group, select it from the list and click OK.
By clicking Ca n c e l you quit editing without saving changes (adding selected permissions).
8.3.5.5
Dialogue for adding privileges to groups
This dialogue is for assigning permissions to user groups. In the list, all the defined user groups are displayed. The list
contains the name and description of the group. If a group has given permissions assigned to it, the row containing the
given permissions is ticked. Adding or removing permissions can be done by clicking the mouse in the tick field or with
the Spac ebar key.
Note
By assigning the rights to a group gives rights to all members of the given group. If the permissions are removed from the
group, they are taken from all users who belong to this group and do not have these permissions assigned by another
group.
8.3.5.6
Dialogue for selecting a user group
This dialogue is for sorting users into user groups. In the list only the groups of users which the user is not yet a member
of are displayed.
If you want to include a user in another user group, select the name of the group from the list and click
OK.
By clicking Ca n c e l you quit the editing without saving changes (without including the user in the
group).
8.3.5.7
Dialogue with a list of user groups
The dialogue is for including a user in user groups. In the list all the defined user groups are displayed. The list contains
the name and description of the group. If the user is a member of the given user group, the row with the given group is
ticked. Including or removing a user in/from a group can be done by clicking the mouse on the ticking field or using the
Spac ebar .
Note
By adding a user to a group, all rights assigned to the group are assigned to the given user. If the user is a member of
several groups, then all the rights that are assigned to the individual group are also assigned to the user.
8.3.5.8
Dialogue with a list of members (users) belonging to a given group
The dialogue is for including members in user groups. In the list all the defined users are displayed. The list contains the
name and description of the user. If the user is a member of the given user group, the row with the given user is ticked.
Including or removing a user in/from a group can be done by clicking the mouse on the ticking field or using the
Spac ebar .
Note
By adding a user to a group, all rights assigned to the given group are assigned to the user. If the user is a member of
several groups, then all the rights that are assigned to the individual group are also assigned to the user.
8.3.5.9
Dialogue with a list of user groups with the given rights
The dialogue is for assigning rights to a selected user group. In the list all the defined permissions are displayed. The list
contains the name and description of the group. If the selected group is assigned the given rights,, the row with these
rights is ticked. Including or removing permissions in/from a selected user group can be done by clicking the mouse on the
ticking field or using the Spac ebar.
Note
By assigning the rights to a group gives rights to all members of the given group. If the rights are removed from the
group, they are taken from all users who belong to this group and do not have these permissions assigned by another
group.
© 2015 ALFA Mikrosystémy, s.r.o.
Access Privileges
73
8.3.5.10 Dialogue for editing name and description of an item
This dialogue is for setting the name and description of an item.
The same dialogue is used to set parameters:
user - name and description of user
groups - name and description of group
permissions - name and description of permissions
8.3.5.11 Dialogue for restricting access
Select permissions for which we want to configure access (WebView, WebAlarm, WebTrends) and select Edit
the Spac ebar, key or the blue key symbol in the toolbar.
Edit ,
A dialogue window opens to configure permissions. Select the tab Restric ting ac c ess by c omputer.
At the top is a list of computers and networks from which access is permitted/forbidden. This list is evaluated from top
to bottom and evaluation ends when the first condition is met (computer address, network, name of computer), with the
exception of the local computer from which access is always permitted.
If none of the conditions is met, access is denied. If the list is empty, access is always denied (with the exception of the
local computer).
In the list three types of records can occur with three types of access. Records are in the type Name (computer network
name), Address (computer IP address) and Network (IP address of the network and subnet mask). Accesses are Forbid,
Permit, Do not use.
The bottom part of the dialogue window is designed for entering, cancelling and editing these records. On the
right the buttons Up and Down, which allow items in the list to be moved and therefore determine the order of
evaluation. The list is always evaluated from top to bottom; the rules Do not use are left out and the first rule
to which the given computer matches is applied. If no rule is applied, access is denied from the given
computer.
The bottom part of the dialogue window is designed for entering, cancelling and editing these records. On the right the
buttons Up and Down, which allow items in the list to be moved and therefore determine the order of evaluation. The list
is always evaluated from top to bottom; the rules Do not use are left out and the first rule to which the given computer
matches is applied. If no rule is applied, access is denied from the given computer.
Access from computers and networks
The next image documents an example of access settings from the entire local network with the exception of several
computers and one computer from another network.
Permission and restriction of access to the ProCopWeb from various computers and networks:
For illustrative purposes, go gradually down the individual rows of the example from top to bottom, as is implemented
by the Access Server for browser access. The first row forbids us access, if we access from the computer with the
IP address 192.168.1.12 . The second row is skipped, it has no effect whatsoever, acting as temporarily deactivated
© 2015 ALFA Mikrosystémy, s.r.o.
74
ProCop 3.5
without needing to delete it.
The third row permits access from the computer with the IP address 207.46.197.101. The fourth row is interesting,
which forbids access from a computer with any IP address which is named S ecretary in the DNS system. We use this
option only for dynamic allocation of IP addresses.
The last row finally permits us access from all computers on the network 192.168.1.0 with subnet mask 255.255.255.0.
Access from a computer which does not match any record is automatically forbidden.
Copying configuration of access between permissions
For easier configuration of access from computers there are Co p y and Pa st e buttons in the dialogue Restric ting
ac c ess by c omputer .
The Co p y button saves the full list of accesses on the clipboard. The Pa st e button deletes the current list and enters
the list from the clipboard. In this way you can transfer configurations between permissions via the clipboard.
If it is useful to have the same or similar access configurations for all permissions, set one permission according to need
and copy it to the clipboard. Insert this permission into other permissions and if necessary adjust it according to need.
Important warning!
For safety reasons, we recommend permitting access to the module WebControls only from specific computers, not from
the network or even the internet.
Tip!
Detailed information about configuration permissions for web access
8.3.6
74
is available in the chapter of the same name.
Web access permissions
ProCop Web is available with permissions for web access. These permissions are verified by the Access S erver.
Configuration of permissions, groups and users is implemented from the ProCop Toolbar by selecting View
Permission management . Web permissions and users are part of the permissions system of the ProCop monitoring
system.
For WebView, WebControl, WebAlarms and WebTrends permissions it is possible to restrict access only to a specific
name or computer IP address, or to the range of addresses defined by an IP address and subnet mask. In this way it is
possible to restrict or grant access to the ProCopWeb web visualisation.
Permissions are as follows:
WebView - allows viewing of the technological display )does not allow values to be set)
WebTrend - allows historical trends to be viewed
WebAlarms - allows alarms, events and system events to be viewed (does not allow them to be modified,
confirmed in any way, etc.)
WebControl - allows values to be set in technological displays (users and computers must also have
WebView rights)
A user must be included in a group which has the appropriate permissions assigned, to be able to use the given service. A
computer from which the user accesses it, must have access permitted for the given permissions.
Note
These permissions are useful only when the control centre makes the web extension ProCopWeb available and it is
accessed via Internet Explorer. Otherwise these permissions will not be valid.
8.3.6.1
Configuration of access by web users
Each user group from the ProCop monitoring system can be entitled to access individual modules of the web extension.
To this end, the embedded WebView, WebTrends and Web Alarms are available.
If a given user group should have access to view the output of a given module, it is necessary to assign it the appropriate
permissions.
Anonymous access to all
For general unrestricted access to the web extension, the Anonymous Internet User. This user is logged in from the web
extension automatically, but has now default viewing rights.
© 2015 ALFA Mikrosystémy, s.r.o.
Access Privileges
If we want to allow viewing of all modules without authentication, we must put the Anonymous Internet User into a
group, e.g. Everyone and give this group rights to view the individual modules WebView, WebTrends and Web Alarms.
First we open the permission management from the ProCop Toolbar by selecting View Permission management .
We must know the administrator password for the ProCop system or a user password with administrator permissions.
Open the branch Groups, select the group Everyone and edit properties by selecting Edit Edit , or the Spac ebar, in
the toolbar the key with the blue key symbol. In the tab Members tick Anonymous Internet User putting the
anonymous internet user into this group. In the Permissions tab tick the rights WebView, WebTrends and
WebAlarms (or just the one which should be generally accessible) and confirm by clicking OK.
We can close permission management by, for example, switching to D i sp l a ys . Test the access from the web
functionality.
Restricted access
If it is necessary to have authenticated access to the website of the ProCop monitoring system, we will proceed in similar
fashion to the previous chapter, except the appropriate permissions are assigned to the user group to which however an
Anonymous Internet User cannot belong for general access.
If, for example, we want general access to be only for viewing technological displays, we again add the Anonymous
Internet User to the group Everyone with the difference that the group is only allocated WebView rights.
Similarly, for example, the group Users (or others we create ourselves) is assigned all web permissions. We then add
already an authenticated user (existing, or created for this purpose) to this group who has access to the entire web
extension. These will, on viewing the website, asked to enter a username and password when accessing generally
inaccessible modules. The user password cannot be changed via the web extension for security reasons, only from the
ProCop Toolbar.
Important warning!
For security reasons we recommend permitting access to the WebControls module only to certain authenticated users with
sufficiently complicated passwords and further limit access to be from specific computers, not from the network or even
from the internet, using the dialogue for restricting access 73 .
© 2015 ALFA Mikrosystémy, s.r.o.
75
Trend Server Management
9
Trend Server Management
This part describes management of the trend server, which is for saving historical trends, i.e. the progression of values of
technological variables in a time, usually with a defined period, their archiving, backup and export.
The trend server manager can be opened in the advanced menu 15 of the ProCop Toolbar by selecting View
management . Trends can also be initiated at any time with the keyboard shortcut CT RL+ALT +T .
T rend
The main window of the trend server manager contains a tree with the following groups:
Project - in the subtree a tree of continuous trends is displayed with parameters which is saved in the
trend server
Archive - in the subtree there are archives for individual months and year with trends and parameters
which are saved in the database
Backup - in the subtree a tree of continuous trends is displayed with parameters which were saved during
the last backup
S aved - in the subtree a tree is displayed of custom saved trends, according to the parameters that were
defined at the time of saving
Built-in tasks - individually built-in tasks and their parameters 77 , planning and the option to launch
them
Running tasks - currently running processes for processing trends, their state and progress; there is
always a process here for recording the trend queue in the database - Flush
Note
In trend management you cannot define trends or change periods of their sampling and other parameters. These are
included in the monitoring project and cannot be changed without Designer permissions. You can control functions of the
trend server here and define export scripts or set parameters for automatic archiving, saving and backup.
9.1
Built-in tasks of the trend server
Built-in task s of the trend server allow you to plan or custom implement a task directly in the trend server. Typical
processes are, for example, archiving, backup or export of trends.
Archive
An embedded process allow automatic archiving of trends to the subdirectory to be planned for individual months, which
are further accessible from the trend browser 39 . These directories can be custom archived on CD/DVD.
In the planning parameters, the day of the week and time are defined for when the process should be implemented, as
well as the number of days retroactively when they should pass. For example, for archiving a collection of data from the
stations with which there is only occasional communication (in the order of days or weeks - different measures). It is also
possible to set the appropriate path for archiving, or just launch archiving immediately.
After making the adjustments, it is necessary to press Ap p l y, in order to save the settings to the trend server.
Backup
The embedded process allows automatic backup of continuous trends to be planned for the subdirectory just as they are.
This backup is mainly for any renewal of the entire database of continuous trends, in the event that they are damaged.
Just stop the service ProTrend for the trend server, recopy data from backup to the directory with continuous trends,
and relaunch the service.
In the planning parameters, the day of the week and time are defined for when the process should be implemented. It is
© 2015 ALFA Mikrosystémy, s.r.o.
77
78
ProCop 3.5
also possible to set the appropriate path for backup, or just launch backup immediately.
After making the adjustments, it is necessary to press Ap p l y, in order to save the settings to the trend server.
Saving
This process allows you to save a specific section of historical trends under a name in the subdirectory, for a certain date
and time retroactively. This process can be useful to select and archive a phenomenon that occurred at a given time. It is
used especially when using monitoring for quick short-term measuring, where the whole length of the continuous trends
is very short due to the speed of sampling (e.g. just hours) and old records would be overwritten.
This process is usually launched dynamically from a technological display.
In the settings, the name of the process is defined under which it will be displayed in the trend browser, the length of the
section that will be retroactively saved from the defined date and time. It is also possible to set the appropriate path for
saving, or saving can be launched immediately.
After making the adjustments, it is necessary to press Ap p l y, in order to save the settings to the trend server.
Export
Automatic or custom exports of historical trends to a file is for saving values from a given time to a file in any format
which is defined with the appropriate script. The process can be planned and implemented automatically at a given time,
or launched manually dynamically in the technological display. The preview of the resulting export file is displayed in the
last tab. The format of the extract of values can be set from the settings or left as it is set in the monitoring project for
individual variables.
After making the adjustments, it is necessary to press Ap p l y, in order to save the settings to the trend server. To edit
the script or parameters you must Sa v e , or Sa v e a n d l a u n c h .
Note
The description of the scripting language is not part of this documentation. Scripts are added according to customer
requirements with the appropriate monitoring project.
Sleep
Pauses the performance of all other processes in the trend server for a defined period. This is for testing and diagnostic
purposes.
© 2015 ALFA Mikrosystémy, s.r.o.
Alarm Server Management
79
10 Alarm Server Management
This section describes management of the alarm server which is for saving alarms, events and system events ("alarms").
The alarm server allows the database of alarms to be archived after months and backed up.
The alarm server manager can be opened in the advanced menu 15 of the ProCop Toolbar by selecting View
management . Trends can also be initiated at any time with the keyboard shortcut CT RL+ALT +A .
Alarm
The main window of the alarm server management contains a tree with the following groups:
Archive - in the subtree there are archives for individual months and years with alarms which are saved in
the database
Backup - contains backup copy of the database of continuous alarms
Built-in tasks - individual built-in tasks and their parameters 79 , planning and the option to launch
them
Running tasks - processes currently running for processing alarms, their state and progression
Note
In alarm management you cannot define alarms or change their parameters. These are part of the monitoring project and
it is not possible to adjust them without Designer permissions. You can set parameters here for automatic archiving and
backup.
10.1
Built-in tasks of the alarm server
Built-in task of the alarm server, allow you to plan or custom implement a task directly in the alarm server. Typical
processes are archiving and backing up alarms.
Archive
An embedded process allow automatic archiving of alarms to the subdirectory to be planned for individual months, which
are further accessible from the alarm browser 51 . These directories can be custom archived on CD/DVD.
In the planning parameters, the day of the week and time are defined for when the process should be implemented, as
well as the number of days retroactively when they should pass for cases when alarms arrive at the server with a delay. It
is also possible to set the appropriate path for archiving, or just launch archiving immediately.
After making the adjustments, it is necessary to press Ap p l y, in order to save the settings to the alarm server.
Backup
The embedded process allows automatic backup of continuous alarms to be planned for the subdirectory just as they are.
This backup is mainly for any renewal of the entire database of continuous alarms, in the event that they are damaged.
Just stop the service ProAlarm for the trend server, recopy data from backup to the directory with continuous trends,
and relaunch the service.
In the planning parameters, the day of the week and time are defined for when the process should be implemented. It is
also possible to set the appropriate path for backup, or just launch backup immediately.
After making the adjustments, it is necessary to press Ap p l y, in order to save the settings to the trend server.
Sleep
Pauses the performance of all other processes in the alarm server for a defined period. This is for testing and diagnostic
purposes.
© 2015 ALFA Mikrosystémy, s.r.o.
Toolbar Options
11 Toolbar Options
You can open a dialogue window with settings for application parameters, logging in to Windows, setting servers and
extension in the advanced menu 15 of the ProCop Toolbar by selecting Spec ial Options .
Note
The majority of settings appear after exiting the ProCop Toolbar or after restarting the computer.
Tabs with the name beginning W eb: are only displayed if the installation type 9 Web server was selected during
installation. Settings only effect the access from the web extension of the monitoring system. It is not necessary in other
types of installation.
Important warning!
Incorrect changes to the settings of the functional monitoring system may result in the monitoring not working, which can
occur after the computer is restarted.
11.1
Automatic Login
In the tab Automatic login in the Settings 81 dialogue window you can permit Windows to launch on startup with the
username and password set, without having to enter this authenticating information every time. This parameter is
recorded in the registration database. The user, under whose name the monitoring system is launched, must have
sufficient access permissions to write this otherwise an error is displayed and automatic login will not be functional.
Important warning!
If automatic login to Windows is turned on, the computer will not be protected from unwanted interventions. The
password entered is then detectable using system resources.
11.2
Applications
In the Applic ations tab in the dialogue window Settings 81 you can define parameters for the ProCop Toolbar
application.
Parameters when starting the ProCop Toolbar:
Permit multiple launches - allow the Toolbar to be launched several times, which can be necessary during
network access on several monitoring systems
View full screen - launches the monitoring system in full-screen mode; no Windows operating
components are available, as the whole desktop is used
Forbid minimising of the Toolbar - the toolbar cannot be minimised, it will always be visible on the
desktop
View only basic functions in the monitor - in the advanced menu the Toolbar will only display basic or all
the advanced functions according to the currently logged in user
Display M onitor/M onitor separate windows/Designer on startup - upon launching the ProCop Toolbar
the appropriate preset mode is displayed
Other parameters:
Close the project when exiting in Designer mode - this option is suitable for developers who
automatically also close the project on the server when finishing monitoring in Designer mode
System language - allows the ProCop Toolbar language to be chosen, or Windows Auto, which
automatically selects the language of the closest language of the operating system
Tip!
The Ori g i n a l button allows you to set applications in the basic settings after installation.
© 2015 ALFA Mikrosystémy, s.r.o.
81
82
11.3
ProCop 3.5
Access Permissions
In the tab Ac c ess permissions in the dialogue window Settings 81 you can define parameters for ProCop Toolbar
access permissions.
S ettings for client behaviour with access permissions:
Login dialogue upon starting - after launching the ProCop Toolbar the login dialogue 67 is automatically
displayed to verify access permissions
Login dialogue with insufficient rights - switches on the option of automatic opening of the login dialogue
when selecting an event for which the user currently logged in does not have sufficient access permissions
Automatic login as the user Everyone - after logging out the user, or prior to the first login, the user
Everyone is automatically logged in
Automatic logout after being inactive for a defined period - if no actions are made after a defined period
(seconds, minutes, hours), then the user is logged out. Zero means that the automatic logout is not
implemented.
Use the user from Windows for monitoring - implements automatic login of the Windows user to the
monitoring system as well, if defined with the same name. If the user left in the system is an
Administrator without a password, the system does not implement login or leave the Administrator
logged in.
Tip!
If you use login to Windows under a username, define the same named user to the ProCop monitoring system and switch
on the option Use Windows user for monitoring. After logging in to the computer, you will be automatically logged in to
the monitoring system as well.
Tip!
The Ori g i n a l button allows you to set applications in the basic settings after installation.
11.4
Other Settings
In the tab Other in the dialogue window Settings 81 you can preset the directory for archiving the monitoring project.
This directory will be offered by default in the archiving window of the technological project.
The Se a rc h button allows you to select the folder using the system dialogue window.
Tip!
The Ori g i n a l button allows you to set applications in the basic settings after installation.
11.5
Data Server
In the tab Data serv er in the dialogue window Settings 81 you can set up automatic opening of the technological
project on starting monitoring and later opening the data project.
Options for settings of the data server:
Automatically open the last project (only for the service) - after opening the project from the ProCop
Toolbar, the given project is saved in the settings of the data server and will be automatically opened
again when the service is next launched. This option is not functional with installation for developers 9
Delay after startup (only for the service) - delays opening and launching of the project by a defined
amount of time, e.g. to wait for the drivers of the necessary devices, OPC servers, etc. to launch
Project - the whole path to the monitoring project which is to be opened (launched), the Se a rc h button
allows you to select the file using the system dialogue window
Important warning!
Incorrect changes to the settings of the functional monitoring system may result in the monitoring not working, which can
occur after the computer is restarted.
Tip!
The Ori g i n a l button allows you to set applications in the basic settings after installation.
© 2015 ALFA Mikrosystémy, s.r.o.
Toolbar Options
11.6
Trend Server
In the tab T rend serv er in the dialogue window Settings
Data files for the trend server, project and delay:
81
you can set parameters for the trend server.
Automatically open the last project - open the last project - after opening the project in the data server
the given project of the trend server saves the settings and it will be automatically opened again when the
trend server is next launched.
Delay after startup (only for the service) - delays opening and launching of the project by a defined
amount of time, e.g. due to decreasing the load on the computer when starting the system
Project - the whole path to the trend server project which is to be opened, the Se a rc h button allows
you to select the file using the system dialogue window
S etting server parameters:
Delete the trend tree on every launch - this option restricts accumulation of old trends which have already
been removed from the project; they will no longer be displayed in the trend browser 39 in the tree, but
trends existing in the data project will still be available
Save cache on exit - samples which have been added to the data server and have not yet been put in the
appropriate trends are saved in the temporary memory, i.e. the cache. This memory is suitable when
exiting the trend server to save to the hard drive and when the trend server is launched again with the
given project you can fetch it - there will be no loss of previously scanned samples, e.g. on restarting the
computer.
Save the cache every 5 minutes - samples in the cache are saved automatically to the hard drive with a
five-minute periodicity, to prevent their loss in the event of, for example, a power failure
Allocate files in the full length - database files of continuous historical trends are created in the maximum
length that can be needed even the first time it launches. This database will no longer grow, thereby
decreasing disk fragmentation and disk space cannot run out when recording trends during monitoring
Test files on startup - Never/Existence/Open/Read - on launching the trend server and opening the project
with the defined method, they test and repair the database which could be damaged, for example during a
power failure. With more detailed tests, reliability increases, but the time for testing increases
(unavailability of trends on system startup). Newly arriving samples are saved in the cache during the
testing.
Index block starts - this option adds an index database to speed up viewing of huge volumes of sample,
but increases demand on the disk space for trends to double.
Tip!
The Ori g i n a l button allows you to set applications in the basic settings after installation.
11.7
Alarm Server
In the tab Alarm serv er in the dialogue window Settings 81 you can set parameters for the alarm server.
Data files of the trending trend, project and delay:
Automatically open the last project - after opening the project in the data server the given project of the
alarm server saves the settings and it will be automatically opened again when the alarm server is next
launched
Delay after startup (only for the service) - delays opening and launching of the project by a defined
amount of time, e.g. due to decreasing the load on the computer when starting the system
Project - the whole path to the alarm server project which is to be opened, the Se a rc h button allows
you to select the file using the system dialogue window
S etting server parameters:
M aximum number of alarms - allows you to set the maximum number of continuous alarms; alarms are
archived daily and none can be lost
Delay when closing the database - the parameter defines the delay upon arrival of an alarm, after which
the database is automatically closed and saved to the hard drive. This eliminates loss of data during any
power failure.
Tip!
The Ori g i n a l button allows you to set applications in the basic settings after installation.
© 2015 ALFA Mikrosystémy, s.r.o.
83
84
11.8
ProCop 3.5
Toolbar Identity
In the tab Identity in the dialogue window Settings 81 you can set the user under whose permissions the ProCop
Toolbar will run. By default upon installation, a ProCop local user is created with administrator permissions, a machine
generated undisclosed password and an identity entered in this tab.
S etting identity in the ProCop Toolbar:
Launch ProCop as another user - this option allows you to change the identity of the toolbar process
when launching as below
Username - the ProCop Toolbar is launched under the set name of the local or domain user
Domain - the domain of the local computer, point, or blank text for a local user, or the domain name for a
domain user
Access password - the password for logging in the above user is entered here
Important warning!
Incorrect changes to the settings of the functional monitoring system may result in the monitoring not working, which can
occur after the computer is restarted.
Tip!
The Ori g i n a l button allows you to set applications in the basic settings after installation.
11.9
Web: Access Privileges
In the tab W eb: Ac c ess Permissions in the dialogue window Settings 81 you can set the computer name with
remote server access permissions (blank for the local computer), configure parameters for web access and logging access
from the web.
Remote server access rights:
Computer name - name of the computer where standard monitoring with the server of access permissions
is installed; this does not have to be on the same computer as the web server
Using Fi n d you can select a neighbouring computer
If monitoring and the web server are on the same computer, the computer name is not filled in
Configuration of access:
Period of maintaining the connection - the time set is reserved by settings for the connected user from the
web browser even after closing the website (min. 30 seconds)
Allow setting of values immediately upon startup - this option allows settings of values immediately
after starting the system; it is suitable to switch on when installing the WebControl extension
Logging directory:
File directory LOG - all access from the web browser can be recorded in the system in the files of a
selected directory. Using Fi n d you can select it easily
Setting logging
Further options allow you to switch on/off the record of access to a given type of web extension and set the values. The
actual value setting is also always recorded in the events of classic monitoring with the identity of the user who entered
the settings.
S etting logging:
Login and logout
Viewing technological screens
Setting technological variables
Viewing graphic trends
Viewing text trends
Viewing alarms
11.10 Web: WebView
In the tab W eb: W ebView in the dialogue window Settings 81 you can set the computer name with a remote data
server (blank for the local computer), configure access parameters from the web and set display validity.
© 2015 ALFA Mikrosystémy, s.r.o.
Toolbar Options
Remote data server:
Computer name - name of the computer where standard monitoring with the data server is installed; this
does not have to be on the same computer as the web server
If monitoring and the web server are on the same computer, the computer name is not filled in
Name of the visual project for the Web:
For the web extension, you can create a special visual project with other technological displays than in
standard monitoring. The name of such a project must be entered accurately into this item
If the web visualisation is supposed to match the standard one, the name of the visual project should be
left blank
S etting displays:
Display directory (cache) - all displays, provided to web browsers, are saved in a file, as an image into the
directory set here. Using Fi n d you can select it easily.
Period of display validity (cache) - all web browsers (users), which request the same technological
display by the set time after saving it in the file receive a pre-created image. After the display validity
period has expired, the image is created again with the current values. The longer the period, the lower the
strain on the monitoring computer and web server during concurrent access by a larger number of users.
The refresh period of the website (display) - each browser automatically requests the image of the
technological display once this period has expired. This period should always be larger than the period of
validity of the display, so the same user is not provided the same image again - an unnecessary transfer
11.11 Web: WebTrends
In the tab W eb: W ebT rends in the dialogue window Settings 81 you can set the computer name from the remote
trend server (blank for a local computer).
Remote trend server:
Computer name - name of the computer where standard monitoring with the trend server is installed; this
does not have to be on the same computer as the web server
Using Fi n d you can select a neighbouring computer
If monitoring and the web server are on the same computer, the computer name is not filled in.
11.12 Web: WebAlarms
In the tab W eb: W ebAlarms in the dialogue window Settings 81 you can set the computer name with the remote alarm
server (blank for a local computer).
Remote alarm server:
Computer name - name of the computer where standard monitoring with the alarm server is installed; this
does not have to be on the same computer as the web server
Using Fi n d you can select a neighbouring computer
If monitoring and the web server are on the same computer, the computer name is not filled in.
© 2015 ALFA Mikrosystémy, s.r.o.
85
Index
Index
-AAbsolute scale
41
access areas
69
Access Privileges
67
Access rights
15, 82
Add or remove programs
11
Adding/removing privileges
69
Adding/removing user groups
70
Adding/removing users
71
Administration of privileges
15
Administrator of access privileges
13
Advanced display
15, 17
Advanced menu
13
Aggregates
26
Alarm administration
15
alarm browser
52
Alarm server
83
alarm service
51
Alarms
15, 51
Allocate files in full length
83
ANALOG
61
Analogue thermometer
24
AND
62
Anonymous access to all
74
Anonymous Internet User
74
antifreeze thermostats
27
Applications
81
Archive
15, 18
Archive as
15
Archiving
18
archiving and backup of alarms
53
archiving and backup of trends
43
Area for plotting trends
44
assigning a user to a group
71
assigning group privileges
70
Automatic login
81
Automatic logout
82
Automatically open last project
83
Automatically open the last project
82
-BBack
21, 22
basic functions
81
BINARY
61
Binary sensors
24
Button selection
13
Buttons
13
© 2015 ALFA Mikrosystémy, s.r.o.
-CCalculator
15, 61
Cancellation of alarms
54
cells
65
Child
21
Column separator
50
Communicates
28
Communication with automated machine
Communication with the regulator
23
Computer name
84, 85
Confirmation of alarms
53
Confirmed by
52
Connect
15
Connect network printers
15
Connect remotely
15
Consumption
42
Continuous refresh
59
Conversion functions
63
cooler
27
correction
24
COUNTER
61
-DDaily consumption
42
Data server
82
Data types
61
Date and time in the regulator
23
Date of arrival
52
Date of confirmation
52
DateTime
64
Delay on startup
82, 83
Delay upon startup
83
Delete trend tree
83
Deletion of alarms
54
Demanded
24
Designer
15
Designer regime
13
Developers
9
Dialogue for entry of date and time
32
Dialogue for setting value
31
Dialogue technological display
23
Dialogue with a table of values
32
Dialogue with preset constants
32
Directory of files LOG
84
Disconnect
15
DISCRETE
61
Display
15
Display Browser
21
Display directory
84
Display validity period
84
displaying trends
29
28
87
88
ProCop 3.5
Displays
15, 21
Domain
9, 84
Drivers
9
Interconnection
Introduction
7
-J-
-E-
Joint control area
entering decimal values
31
entry of a value
31
events
51
existing
51
Exit
15, 19
Export alarms
57
Exporting trends
50
Expressions and operators
62
language
81
language version
8
Launch ProCop as another user
84
Level
24, 52
Link to value of other cells
65
List of previously opened projects
15
List of privileges
69
Local menu of variables
29
Locale
8
Locking the cursor
46
Logarithmic axis
45
logged in users
71
logical value
61
login
81
Login dialogue on starting
82
Lowering privileges
10
FALSE
61
fans
27
Fault area
23
Filter of samples
42
filters
27
Filtration of alarms
54
fire vents
27
floating menus
36
Floating range
41
Forbid/permit transfer of alarms
59
Forbit/permit trend transfer
59
forced password change
71
Forward
22
Full screen
15
Functions available from the toolbar
17
Functions for date and time
64
-M-
-GGraphic illustration of the time program
Groups of settings
39
-H-
23
-L-
-F-
Help
15
History
22
Home
21
Hourly consumption
humidifiers
27
22
36
Main display
15
manostats
24
manual mode
28
Matematical functions
63
Maximum number of alarms
83
Measured
24
measuring cursors
46
Mobile scale
41
Module Management
15, 59
Module refresh
59
Monitor regime
13
Monthly consumption
42
multiple launch
81
-N42
-II/O module
59
Identity
84
Information about variables
input/output modules
59
Installation type
9
integer
61
29
Name of the visual project for the web
Network name
9
network workstation
9, 17
Next
21
Normal refresh
59
Note
52
Notification area
13
numeric constants
62
84
© 2015 ALFA Mikrosystémy, s.r.o.
Index
required
24
Restricted access
Rounded to
41
-OOffset by
41
OPC
9
Open
15
operand
62
operands
62
Operating technology
OR
62
74
-S28
-PParent
21
password
10
Password change
68
Percentage axis
45
Period of maintaining a connection
84
Pi
63
Predefining level colours - time program
35
Predefining level colours for the time program
Prefixing columns
50
print
39
Printer setup
15
Printing alarms
56
Printing trends
49
Priority
52
ProAcs access privilege server
7
ProAlarm alarm server
7
ProCop
7
ProCop Toolbar
7, 13
ProDat data server
7
Program software requirements
8
Project
82, 83
Properties of graphic trends
46
Properties of text trends
48
ProTrend trend server
7
pumps
26
-Rreal number
61
Refresh project
59
Refreshing settings
39
Relative scale
41
Remote reboot
59
Remove the program
11
Removed from refresh
59
Request alarms
59
Request all alarms
59
Request all trends
59
Request displays
59
Request modules
59
Request trends
59
© 2015 ALFA Mikrosystémy, s.r.o.
35
Save table
61
Saving settings
39
Search
59
Selection of displayed set
39, 43
Selection of the displayed set
53
Selection of time interval
39, 41
Selection of trends
39, 40
sensors
24
Server trends
83
setting value
31
Settings
15
Settings identity
84
Sin
63
Sorting alarms
56
Source
52
Special
15
Sqr
63
Standard monitoring
9
Start
59
Statements of values
24
Static IP address
9
Stop
59
Switching display
37
system events
51
System language
81
System Tracer
15
-TTable of text trends
47
Table of values
32
Technological scheme
23
Technological schemes
23
Test files on startup
83
TEXT 61
text chain
61
text colours
24
Thermostat
24
Time axis
44, 48
Time of arrival
52
Time of confirmation
52
Time program
32
Time program - advanced settings
34
Time program - basic settings
34
Time program - graphic illustration
36
Time program advanced settings
34
Time program basic settings
34
Time program dialogue
32
89
90
ProCop 3.5
Time Switch Program
32
Tolerance of time of samples
42
Toolbar background appearance
17
Trend administration
15
Trends
15, 39
Trends key
39, 48
TRUE
61
TSP
32
Type
52
-UUnconfirmed
51
Uninstalling the ProCop system
User administration
68
user groups
70
User identity
9
User installation
9
User login
67
Username
84
users
70
11
-VValue axis
45
values
31
valves
26
ventilated space
27
Ventilation systems
27
ventilators
27
vents
27
Viewing alarm reports
13
Viewing historic trends
13
Viewing technological schemes
Visual project
84
13
-WWaiting for communication path
WDC
32
Web server
9
Web: Access rights
84
Web: WebAlarms
85
Web: WebTrends
85
Web: WebView
84
Website refresh period
84
Weekly consumption
42
whole positive number
61
Working on a project
17
28
© 2015 ALFA Mikrosystémy, s.r.o.