1
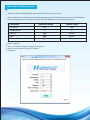
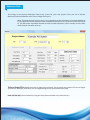
RODataXL Program Manual
January 2015
Hydranau cs is pleased to provide our Reverse Osmosis (RO) system performance data management and
normaliza on program. It is recommended that you “normalize” your logged opera ng data to determine if you
have a problem with your system. “Normaliza on” computer programs, such as RODataXL, graphically represent
normalized permeate flow, per cent salt rejec on and feed-to-reject pressure drop. These normalized
parameters are calculated by comparing a par cular day’s opera ons to the first day of opera on. Adjustments
are made for changes in major opera ng variables such as temperature, feed TDS, recovery, and pressures. In this
way, performance declines unrelated to opera ng parameters can be iden fied and treated.
Disclaimer
Hydranau cs makes no representa ons or warran es with regard to this so ware program, and
instruc onal and reference materials, including but not limited to the implied warran es of merchantability
and fitness for a par cular purpose. In no event shall Hydranau cs be liable for errors or omissions contained
in its so ware or manuals, any interrup ons of service, loss of business or an cipatory profits and/or
incidental or consequen al damages in connec on with the furnishing, performance or use of these
materials.
This normaliza on program is in compliance with ASTM Standard D 4516-85 "Standard Prac ce for
Standardizing Reverse Osmosis Performance Data".
Opera ng Notes: The most accurate normalized data is obtained by (1) holding the actual System
Opera onal Data condi ons as close as possible to the System Reference Data condi ons and (2) by
collec ng accurate RO data which includes properly calibrated instruments. The true value of
normalized data lies not in the calcula on of one set of data points but in the trended analysis of
these numbers which reflects the impact of fouling on system performance over an extended
period of me.
This so ware is licensed to the user at no charge. The program is not copy-protected, and may be copied and
distributed, at no charge to others. The so ware is copyrighted; the program and source code is proprietary
to Hydranau cs.
Quick Start: New Project Entry
When you open the RODataXL Microso Excel file for the first me, you will:
Select Display Units to be American or Metric engineering units. The Display Units can not be modified later
on in the program so save a copy of the original file. The table below lists the engineering units:
Parameter
American Units
Metric Units
Pressure
psi
bar
Temperature
°F
°C
Salinity
ppm
µS/cm
Flow
gpm
m³/hr
Element Permeate Flow
gpd
m³/day
Select Language
Select the number of trains or stages in the system
Select Date Format (10/27/14 or 27/10/14)
Click Apply
Reference Data
This brings up the System Reference Data entry screen for your new project. Only one set of System
Reference Data is allowed for each Train or Stage of a Project.
Note: The data entered in this screen is very important to the calcula on of normalized data as
it is the base point from which all other opera onal data points in the future will be referenced
to. The RO system should be allowed to reach a stable opera on, which usually occurs within
the first day or two a er start-up.
Train or Stage (XX): Iden fy the train or stage using numbers. You can have any number of Trains or Stages
you want for a Project, with each Train or Stage having its own System Reference Data.
Date (XX/XX/XX): Enter the date by using the drop-down calendar or by manual entry.
Hour (XX): Enter the hour the data point was logged using military me of 0 to 23 hours.
Note: The Reference Data sec on items listed below are used in the calcula on of system
Normalized Permeate Flow, Normalized % Salt Passage, and Normalized Delta P. The Element
sec on items listed a er the Reference Data sec on are used in the normaliza on calcula ons
of the Water Transport Coefficient and Salt Transport Coefficient. The Normalized Permeate
Flow and Normalized % Salt Passage in most cases is a be er indicator of actual system
performance as they are based on the actual "real-world" ini al opera on of the elements at
the site
Feed Temp (XXX.X): Enter the temperature of the RO feed. The temperature range allowed is 33 to 122°F or 1
to 50°C.
Note: The correct feed temperature is absolutely essen al for the genera on of meaningful
normalized data due to its significant impact on feed pressures and permeate quality.
Feed Salinity (XXXXX.X): Enter the salinity of the RO feed as it enters the 1st stage of the RO. The feed salinity
is a measurement of the TDS (Total Dissolved Salts) content and is reported as ppm (American) or µS/cm
(Metric). PPM (Parts per Million) is also known as mg/l (milligrams per liter). MicroSiemens/cm (µS/cm) is
also known as micromhos/cm (µmhos/cm) in parts of the world.
Perm Salinity (XXXXX.X): Enter the salinity of the RO permeate. The Permeate Salinity is a measurement of
RO permeate quality and is reported as ppm or µS/cm. The Permeate Salinity has to be a lower value than the
Feed Salinity.
Perm Back Pressure (XXXX.X): Enter the Permeate Back Pressure as it leaves the RO. American units are psi
(Pounds per Square Inch) and Metric units are bar.
Note: The Permeate Back Pressure reading is important in that it is subtracted from the Feed
Pressure and Concentrate Pressure for the calcula on of NDP (Net Driving Pressure). The Net
Driving Pressure is the remaining feed pressure available to force water through the membrane
once osmo c back-pressure and permeate back-pressure have been overcome.
Conc Flow (XXXX.X): Enter the concentrate flow of the RO. Concentrate flow is also known as Reject or Brine
flow. American units are gpm (Gallons Per Minute) and Metric units are m3/hr (Cubic Meters per Hour).
Perm Flow (XXXX.X): Enter the permeate flow of the RO. Permeate flow is also known as Product flow.
American units are gpm (Gallons Per Minute) and Metric units are m³/hr (Cubic Meters per Hour).
Note: The Feed flow is calculated by the program by adding up Concentrate flow plus Permeate
flow.
Feed Pressure (XXXX.X): Enter the Feed Pressure as it enters the 1st stage of the RO. American units are psi
(Pounds per Square Inch) and Metric units are bar.
Conc Pressure (XXXX.X): Enter the Concentrate Pressure as it exits the last stage of the RO. American units
are psi (Pounds per Square Inch) and Metric units are bar.
Note: The Concentrate Pressure is subtracted from the Feed Pressure by this program to
determine the Delta P (Pressure Drop) of the system. In the situa on where the user uses a
Delta P gauge to monitor the feed-to-concentrate pressure drop, it is recommended to log the
feed pressure gauge reading and that the concentrate pressure is logged by the operator by
deduc ng the Delta P from the feed pressure. An increase in the calculated Pressure Drop is an
indica on of fouling of the feed spacer.
Op onal Data: Feed pH, SDI, and Turbidity are op onal data. These data are not used in normaliza on
calcula ons; however, you may want to record these data for future trouble‐shoo ng purposes.
Feed pH (XX.X): Enter the pH of the RO feed as it enters the 1st stage of the RO. The pH range allowed for
entry is 1 to 14.
SDI (15) (XX.X): Enter the Silt Density Index value at 15 minutes of the RO feed.
Turbidity (XX.X): Enter the turbidity value in NTUs
Element Type: Select the model of the RO element from the drop down screen. The Standard Test Condi ons
screen will automa cally be filled in when an element is selected. The Standard Test Condi ons data for the
listed elements cannot be modified.
# of Elements/Vessel (XXX): Enter the Number of RO Elements per Pressure Vessel. Normally the maximum
is eight elements per vessel.
# of Pressure Vessels (XXX): Enter the total Number of RO Pressure Vessels for the en re Train or Stage. The
program calculates the system flux by mul plying the # of Elements/Vessel by the # of Pressure Vessels by
the available membrane area of each element.
Add: By clicking on the Add bu on, the System Reference Data is recorded and the file is formed for the new
Train or Stage of this Project. The user can proceed to entering System Opera onal Data once the System
Reference Data has been entered.
Con nue to add data by clicking the Data Entry bu on in the top le corner of the spreadsheet (Cell A1).
Normaliza on Calcula ons
Units for Calcula on: When only one unit is designated for a parameter, for example 0°C, then the
subsequent calcula ons require that only that unit be used to achieve the correct value. When two units are
designated, for example gpm or m³/hr, then American or Metric values can be used for subsequent
calcula ons but you must stay with either American or Metric to achieve the correct values.
The value of the RODataXL Normaliza on Program by Hydranau cs becomes apparent a er a review of the
calcula ons performed. However, the user should remember that the true value of normalized data lies not
in one set of data but in the trended values of the normalized data over me.
Equa ons used in the program are listed in the spread sheet under the “Help File” tab. These equa ons
match the code which can be viewed by entering visual basic and going to the main module “ModMain” and
going to the subrou ne “Formulas”
Graphs
The operator can choose to view a number of graphs of the system opera ng data and normalized data. The
graphs are automa cally generated and the data is plo ed rela ve to me. If there is more than one set of
data for a par cular day, the data set with the lowest Hour value will be plo ed. The graphs plot a straight line
between data points.
The graph types include:
Permeate Flow vs. Time: This graph plots the actual permeate flow in gpm or m³/hr.
Feed Pressure vs. Time: This graph plots the actual RO feed pressure in psi or bar.
Permeate Salinity vs. Time: This graph plots the actual permeate salinity (quality) in ppm or µS/cm.
Salt Passage vs. Time: This graph plots the actual per cent salt passage for the en re system. The
calculated value is the actual permeate salinity divided by the "average" salinity of the RO feed and
concentrate. The average feed salinity calcula on es mates the concentrate salinity based on system
recovery and then calculates the "arithme c average" of the feed and concentrate salinity.
Note: The % Salt Passage in this case is not simply permeate salinity divided by feed salinity.
Normalized Salt Passage vs. Time: This graph plots the normalized per cent salt passage of the system
rela ve to the System Reference Data at start-up.
Normalized Permeate Flow vs Time: This graph plots the normalized permeate flow in gpm or m³/hr,
rela ve to the System Reference Data at start-up.
Normalized Delta P vs. Time: This graph plots the normalized feed-to-concentrate pressure drop in psi
or bar rela ve to the System Reference Data at start-up. The normalized Delta P value reflects
adjustments to pressure drop due to varying feed and concentrate flows.
Salt Transport Coefficient vs. Time: This graph plots Salt Transport Coefficient (STC) for "membrane
technophiles". The importance of this number is that it measures the efficiency of the membrane in
how fast it allows the passage of salts. The value is reported as m/sec (meters per second). This number
allows the comparison of membranes from site to site, independent of what the on-site opera ng
condi ons are. This number will be affected by changes in the ionic makeup of the feed water. For
example, an increase in divalent ions (like hardness or sulfate) will result in a lower Salt Transport
Coefficient.
Water Transport Coefficient vs. Time: This graph plots the Water Transport Coefficient (WTC) for
"membrane technophiles". The importance of this number is that it measures the efficiency of the
membrane in how fast it allows the passage of water. The value is reported as m/sec‐kPa (meters per
second per kilopascal. This number allows the comparison of membranes from site-to-site,
independent of what the on-site opera ng condi ons are.
What Is Normaliza on?
The majority of Reverse Osmosis (RO) systems normally will operate under fairly steady condi ons over long
periods of me if opera ng parameters remain constant, fouling does not occur, and membrane damage is
avoided. Unfortunately, opera ng parameters (e.g. temperature, feed TDS, permeate flow, recovery) do
change and fouling of the membrane and element feed path can occur. Complica ng the issue of
determining whether the RO is performing as expected is that more than one opera ng parameter may
change. The value of a Normaliza on Program is the ability to recalculate the instantaneous system
performance at some point in me and compare its performance to the Reference Data opera ng
condi ons. Stated another way, if you were to remove the RO elements at some point in me (say 100 days
a er start-up) and replace the new RO elements you used on the day you started up, you could project what
the permeate flow and quality would have been using the aged elements. If these 100 day old elements
resulted in a lower flow or poorer quality permeate, you could draw the conclusion that they are fouled or
damaged in some fashion.
The following changes in opera ng parameters will decrease the actual permeate flow of a system:
A decrease in feed water temperature with no change in feed pump pressure.
A decrease in RO feed pressure by thro ling down the feed valve.
An increase in permeate back pressure with no change in feed pump pressure.
An increase in the feed TDS (or conduc vity) since this increases the osmo c pressure that has to be
overcome to permeate water through the membrane.
An increase in the system recovery rate. This increases the average feed/concentrate TDS which then
increases the osmo c pressure.
Fouling of the membrane surface.
Fouling of the feed spacer that results in an increase of feed-to-concentrate pressure drop (delta P)
which starves the back-end of the system of net driving pressure (NDP) to produce permeate water.
The following changes in opera ng parameters will result in actual lower quality permeate water, as
indicated by an increase in permeate TDS as ppm or conduc vity:
An increase in feed water temperature with the system adjusted to maintain the same permeate flow
(or flux).
An decrease in the system permeate flow, which reduces the water flux, and results in less permeate
water to dilute the amount of salts that have passed through the membrane.
An increase in the feed TDS (or conduc vity) since the RO will always reject a set percentage of the salts.
An increase in the system recovery rate since this increases the average feed/concentrate TDS of the
system.
Fouling of the membrane surface.
Damage to the membrane surface which allows more salts to pass.
The changes in opera ng parameters that were listed above that resulted in the reduc on of permeate flow
and quality are normal and would have been projected to occur with normalized data, except for changes
due to membrane fouling, membrane damage or fouling of the element's feed spacer.
Normalized data that is graphed will show not only the instantaneous condi on of the RO system at any given
me, but also shows the detailed opera ng history. These graphs can be a useful tool for troubleshoo ng.
The normalized data presented in the Hydranau cs RODataXL Normaliza on program are:
Normalized Salt Passage vs. Time: This graph plots the normalized per cent salt passage of the system
rela ve to the System Reference Data at start-up.
Normalized Permeate Flow vs Time: This graph plots the normalized permeate flow in gpm or m³/hr,
rela ve to the System Reference Data at start-up.
Normalized Delta P vs. Time: This graph plots the normalized feed-to-concentrate pressure drop in PSI
or Bar rela ve to the System Reference Data at start-up. The normalized Delta P value reflects
adjustments to pressure drop due to varying feed and concentrate flows.
Water Transport Coefficient vs. Time: This graph plots the Water Transport Coefficient (WTC) for
"membrane technophiles". The importance of this number is that it measures the efficiency of the
membrane in how fast it allows the passage of water. The value is reported as m/sec-kPa (meters per
second per kilopascal. This number allows the comparison of membranes from site-to-site,
independent of what the on-site opera ng condi ons are.
Salt Transport Coefficient vs. Time: This graph plots Salt Transport Coefficient (STC) for "membrane
technophiles". The importance of this number is that it measures the efficiency of the membrane in
how fast it allows the passage of salts. The value is reported as m/sec (meters per second). This number
allows the comparison of membranes from site to site, independent of what the on-site opera ng
condi ons are. This number will be affected by changes in the ionic makeup of the feed water. For
example, an increase in divalent ions (like hardness or sulfate) will result in a lower Salt Transport
Coefficient.
Ac on should be taken before the normalized data shows the following changes from start-up
Normalized permeate flow decrease is greater than 10%
Normalized permeate quality decrease is greater than 10%
Normalized pressure drop, as measured between the feed and concentrate headers, increase is greater
than 15%
Any one of these changes in normalized data may indicate membrane fouling. Hydranau cs recommends
troubleshoo ng by downloading our Technical Service Bulle n 107 – Foulants and Cleaning Procedures for
composite polyamide RO membrane elements (ESPA, ESNA, CPA, LFC, NANO, and SWC) from our website
www.membranes.com.