1
ECMO Simulation User Manual (v5.7)
© 2010 MSE (Australia) PL
ECMO Simulation System
A Component of the Modular Simulation Environment
by MSE (Australia) PL
All rights reserved. No parts of this work may be reproduced in any form or by any means - graphic, electronic, or
mechanical, including photocopying, recording, taping, or information storage and retrieval systems - without the
written permission of the publisher.
Products that are referred to in this document may be either trademarks and/or registered trademarks of the
respective owners. The publisher and the author make no claim to these trademarks.
While every precaution has been taken in the preparation of this document, the publisher and the author assume no
responsibility for errors or omissions, or for damages resulting from the use of information contained in this
document or from the use of programs and source code that may accompany it. In no event shall the publisher and
the author be liable for any loss of profit or any other commercial damage caused or alleged to have been caused
directly or indirectly by this document.
Under no circumstances must this computer application be used to guide the management of any living patient.
Printed: November 2010 in Sydney, Australia.
Contents
3
Table of Contents
Foreword
0
Part I Introduction
7
1 Overview
................................................................................................................................... 7
2 System...................................................................................................................................
Requirements
8
3 Installation
................................................................................................................................... 9
4 Getting
...................................................................................................................................
Started
10
5 Modes
...................................................................................................................................
of Operation
13
Maintenance Mode
.......................................................................................................................................................... 13
Supervised Sim
..........................................................................................................................................................
ulation Mode
14
Unsupervised..........................................................................................................................................................
Sim ulation Mode
14
6 Version
...................................................................................................................................
Differences
15
7 Configuring
...................................................................................................................................
Dual Displays
15
Part II Applications
19
1 Trainee
................................................................................................................................... 19
Menu Bars .......................................................................................................................................................... 19
Patient Monitor
.......................................................................................................................................................... 21
Inspector
.......................................................................................................................................................... 24
Therapeutic Interface
.......................................................................................................................................................... 25
Overview ......................................................................................................................................................... 25
Available Drugs
.........................................................................................................................................................
/ Fluids
27
2 Supervisor
................................................................................................................................... 27
Scenarios Page
.......................................................................................................................................................... 29
CVS/ECG Page.......................................................................................................................................................... 29
Lung Page
.......................................................................................................................................................... 31
Misc Page
.......................................................................................................................................................... 32
ECMO Page .......................................................................................................................................................... 33
Part III Devices
37
1 Nerve...................................................................................................................................
Stimulator
37
2 Veno-Venous
...................................................................................................................................
ECMO
37
3 Veno-Arterial
...................................................................................................................................
ECMO
40
4 Defibrillator
................................................................................................................................... 43
5 Ventilator
................................................................................................................................... 44
6 ACT Machine
................................................................................................................................... 45
7 Stethoscope
................................................................................................................................... 46
8 Data Recorder
................................................................................................................................... 46
Part IV Camera
50
1 System
...................................................................................................................................
Requirements
50
2 Camera
...................................................................................................................................
Overview
50
3 Compatible
...................................................................................................................................
Equipment
52
Part V Models
© 2010 MSE (Australia) PL
56
4
ECMO Simulation User Manual (v5.7)
1 Cardio-Respiratory
...................................................................................................................................
Model
56
2 Qs/Qt...................................................................................................................................
and Cardiac Output
58
3 Blood...................................................................................................................................
Gas Calculations
59
4 Pharmacokinetic
...................................................................................................................................
Model
59
5 Cardiovascular
...................................................................................................................................
Model
61
6 Oxygenator
...................................................................................................................................
Model
62
7 Cannula
...................................................................................................................................
Model
65
8 Centrifugal
...................................................................................................................................
Pump Model
68
9 Thermal
...................................................................................................................................
Model
68
10 ECG Model
................................................................................................................................... 70
Part VI Scenarios
73
1 Scenarios
...................................................................................................................................
- Overview
73
2 Scenarios
...................................................................................................................................
- File Formats
74
3 Scenarios
...................................................................................................................................
- Creating Resources
75
4 Scenarios
...................................................................................................................................
- Database Editor
76
5 Scenarios
...................................................................................................................................
- Required Files
79
6 Scenarios
...................................................................................................................................
- Changing the data source
80
7 Scenarios
...................................................................................................................................
- Database Structure
81
8 Scenarios
...................................................................................................................................
- ECG Editor
82
Part VII Tutorials
86
1 Scope...................................................................................................................................
Of Tutorials
86
2 Getting
...................................................................................................................................
Started
86
3 VV ECMO
...................................................................................................................................
(1)
91
4 VV ECMO
...................................................................................................................................
(2)
100
5 VV ECMO
...................................................................................................................................
(3)
107
6 VV ECMO
...................................................................................................................................
(4)
112
7 VA ECMO
...................................................................................................................................
(1)
117
8 VA ECMO
...................................................................................................................................
(2)
125
9 VA ECMO
...................................................................................................................................
(3)
131
10 VA ECMO
...................................................................................................................................
(4)
138
Part VIII MSE System
145
1 Overview
................................................................................................................................... 145
Part IX Trouble Shooting
148
1 FAQ................................................................................................................................... 148
2 Troubleshooting
................................................................................................................................... 150
3 Installing
...................................................................................................................................
a new license file
151
4 Error...................................................................................................................................
Messages
151
5 HDTV
...................................................................................................................................
Connection
153
6 Aberrant
...................................................................................................................................
Behaviour
153
7 Displaying
...................................................................................................................................
PowerPoint Files
154
© 2010 MSE (Australia) PL
Contents
5
8 APIPA
................................................................................................................................... 154
Part X References
157
1 References
................................................................................................................................... 157
Part XI License Agreement
Index
© 2010 MSE (Australia) PL
161
165
Part
I
Introduction
1
Introduction
1.1
Overview
7
The ECMO simulator is a screen-based implementation of a much larger, high-fidelity,
simulation system - 'The Modular Simulation Environment' (MSE).
It is intended for those working in the fields of Anaesthesia, Intensive Care and
Perfusion and has been designed for use by single users or small groups in a 'tutorial'
setting.
The simulator can be installed on computers running under the 32 or 64 bit versions of
the Microsoft 'Windows XP', 'Vista' or 'Windows 7' operating systems. It incorporates
various MSE components which include:
A 'virtual' patient consisting of about 20, real-time physiological models which can be
adjusted to reproduce a wide variety of clinical states.
A centrifugal pump-based ECMO system.
A hollow-fibre oxygenator.
A physiological monitor.
A ventilator.
A defibrillator.
A data recording system.
An armamentarium of drugs and fluids which can be used to treat the virtual patient
A 'scenario' database which can be used to provide a large variety of relevant clinical
data to the trainee.
The system can be used to simulate both veno-venous (VV) and veno-arterial (VA)
ECMO.
In VV mode, the system can be used to illustrate the effect of:
Variation in blood flow through the oxygenator.
Variation in gas flow through the oxygenator.
Heating or cooling of the patient.
Changing the position of the drainage cannula.
Insertion of a second drainage cannula.
Changing the size of the return cannula.
Changes in central venous pressure on venous drainage.
In VA mode, the system can be used to illustrate the effects of all of the above together
with:
The impact of VA ECMO on systemic blood flow.
Differential hypoxaemia.
Back flow through the system.
The simulation can be remotely-controlled by a supervisor using a separate application
© 2010 MSE (Australia) PL
8
ECMO Simulation User Manual (v5.7)
which runs on a second PC, Netbook or PDA. Using this application, the supervisor is
able to reproduce a wide variety of ECMO or patient crises including:
Oxygenator failure.
Inlet obstruction.
Outlet obstruction.
Fresh gas disconnection.
Massive blood loss.
Changes in lung function.
Changes in cardiac function.
In all, the system comprises about 30 separate models which execute synchronously.
The architecture and behaviour of some of the more significant models is outlined in the
'Models' section of this manual.
1.2
System Requirements
The system has been developed in the 'Windows XP' 32-bit environment. The hard- and
soft-ware requirements of the system are outlined below:
The Main Application ('MSEHDTV.exe') requires at least:
A Pentium Dual-Core E52xx series processor (or equivalent);
A WUXGA (1920 * 1200 pixels) or HDTV (1920 * 1080 pixels) display ** ;
Local Area Network Connectivity @ 100 mbits/sec (or greater);
Internet Connectivity at any speed;
1 GB disk space.
Windows XP with service pack 3;
Net Framework 3.5;
DirectX 9.0;
Adobe 'Acrobat Reader' 9.0.
The Supervisor Application ('MSESupervisor.exe') can be run on a second PC or
Netbook and requires at least:
An Intel 'Atom' processor;
An XGA (640 * 480) display;
Wired Local Area Network Connectivity @ 100 Mbps(or greater) or
Wireless Connectivity @ 54 Mbps;
Internet Connectivity at any speed;
100 KB disk space.
Windows XP with service pack 3;
Net Framework 3.5;
If you wish to perform Full HD video recording, you should read the section
entitled "Compatible Equipment" in the <Camera> section of this manual.
A second version of the supervisory application (which runs in the Windows 'Mobile'
environment) is available on request.
© 2010 MSE (Australia) PL
Introduction
9
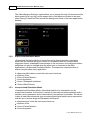
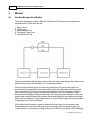
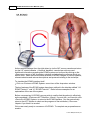
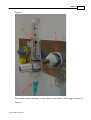
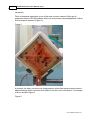
The system is primarily designed for small-group learning situations. The equipment
required for this environment is shown below. The communication between the
Supervisor and Trainee can be implemented over a wired or wireless LAN, or using a
direct Ethernet connection. The PC display is transmitted to the HDTV using the HDMI
ports of the devices.
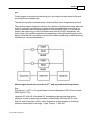
If a PC (rather than a notebook) is used by the trainee, the system also works well with a
hidden PC connected directly to the HDTV (as its primary monitor) and a 'Bluetooth'
wireless keyboard (such as the 'Microsoft' 'Wireless Entertainment 7000').
** The system can also be run on a conventional dual -display (second monitor) system
or a remote dual display system such as 'Maxivista'.
1.3
Installation
Administrative privileges are required in order for the installation to proceed.
To install the system, double-click on the Microsoft Installer File 'MSE ECMO.msi' which
can be found in the installation folder of the delivery medium (CD, DVD, FD, Memory
Stick or Unzipped 'Zip' file).
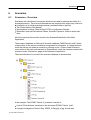
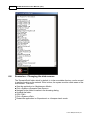
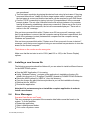
Follow the instructions of the Installer Wizard to complete the installation. At the
completion of the installation, 5 new items should have appeared on the <Start> menu:
© 2010 MSE (Australia) PL
10
ECMO Simulation User Manual (v5.7)
<Getting Started> describes how to use the system for the first time.
<MSE ECMO> runs the Main (Trainee) Application.
<MSE Supervisor> runs the Supervisor Application.
<Uninstall ECMO Simulator> completely removes the software from the computer.
<MSE User Manual> gives you access to this manual in 'pdf' format.
The 'Full' version can be installed without the protection Dongle in place, but the Main
Application will not run until it has been plugged in. The Dongle can be plugged into any
of the computer's USB ports and does not require the installation of any drivers. The
'Full' version of the system can be installed on any number of computers.
If you are intending to run the Supervisor Application on your Local Area Network (LAN),
the firewall / security settings must be set to permit incoming and outgoing TCP / IP
streams on the relevant connections of both computers.
1.4
Getting Started
Run the application by clicking ** on the <MSE ECMO> short cut on the <Start> menu or
the 'MSEHDTV.exe' file in the installation directory.
The first time you run the application it will take about 30 seconds to load.
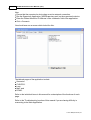
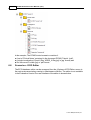
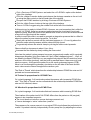
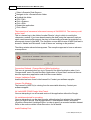
You will be given the opportunity to start the application in one of three modes:
© 2010 MSE (Australia) PL
Introduction
11
Choose <Unsupervised Simulation Mode> (the default selection) and click the <Start>
button.
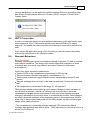
The system's three primary windows will appear. At the left-hand side of the screen is
the <Inspector> window, to the right-hand side is the <Patient Monitor> and below this is
the <Therapeutic Interface>.
Inspector Window:
The <Inspector> window is used to display textual or audio-visual information relating to
the scenario and to allow the user to manipulate the virtual devices which can be used in
the treatment of the patient.
Click the <Notes> menu item to view the notes which describe the patient in the current
scenario. Click the <Prev> and <Next> menu items of this window to navigate the
current document.
The <Investigations> menu item lists the investigations which are currently available for
the patient. (Oxygenator Blood Gas Analysis is only available if an ECMO system is in
use.)
The <Devices> menu item is used to visualise any of the 6 devices which are available
to the user. These devices are a:
Ventilator,
VV ECMO System,
VA ECMO System,
ACT Monitor,
Nerve Stimulator,
Defibrillator and
Stethoscope.
Click on <Devices><Nerve Stimulator> to display the nerve stimulator and then click on
the <TOF> button to see the patient’s current ‘Train of Four’.
If you want to reposition the <Inspector> window, place the mouse at the top right-hand
corner of the window's title bar and drag it while holding down the left mouse button. The
position of the window will be retained when you next start the application. Refer to the
section entitled 'Inspector' for a complete description of the functionality of this window.
© 2010 MSE (Australia) PL
12
ECMO Simulation User Manual (v5.7)
Patient Monitor:
The <Patient Monitor> is based on a modern physiological monitor and is used to
display the patient's current vital signs.
Click the <Display> button on the Patient Monitor and select the parameters which you
want to view (for example, ECG, Direct Arterial Pressure and Central Venous
Pressure). Click the <Display> button again to close the parameter selection window.
The parameters which can be displayed include:
ECG,
NIBP,
Direct Arterial Pressure
Central Venous Pressure,
SaO2,
SaO2 waveform,
BIS,
Temperature,
Capnographic Waveform and
Inspired and Expired Gas values.
If you want to reposition the <Patient Monitor>, place the mouse at the top right-hand
corner of the monitor and drag it while holding down the left mouse button. The position
of the window will be retained when you next start the application. Refer to the section
entitled 'Patient Monitor' for a complete description of the functionality of this window.
Therapeutic Interface:
The <Therapeutic Interface> window is used to administer drugs and or fluids to the
patient. The interface has four 'tabbed' pages:
Bolus Drug,
Infusion Drug,
Fluids and
History.
To explore the effect of giving adrenalin to a normal patient, click on the <Bolus Drug>
tab and select <Adrenalin (100mcg/ml)> by clicking on it. A new window will appear.
Slide the green slider until a dose of ~ 50 micrograms is indicated and click the <Give>
button. Observe the effect of the drug on heart rate, blood pressure and ectopic activity
over the ensuing minutes. Click on the <History> tab to review details of your therapeutic
interventions.
If you want to reposition the <Therapeutic Interface>, place the mouse at the top righthand corner of the window and drag it while holding down the left mouse button. The
position of the window will be retained when you next start the application. Refer to the
section entitled " Therapeutic Interface" for a complete description of the functionality of
this window.
**Throughout this document the terms 'Click' and 'Select' are used to refer to a
left mouse button click.
© 2010 MSE (Australia) PL
Introduction
1.5
13
Modes of Operation
The application can be used in one of three modes:
<Unsupervised Simulation Mode> (the default selection) is intended for use by
unsupervised trainees. In this mode, a variety of previously recorded scenarios and/or
tutorials can be undertaken, but no intervention by a supervisor is possible. The trainee
is able to load different patients (pre-recorded physiological states) and to experiment
with the use of various drugs and therapeutic techniques.
<Supervised Simulation Mode> is used when active interventions by a simulation
supervisor are required during the course of a simulation session. Events such as
oxygenator failure, catastrophic haemorrhage or the occurrence of a malignant cardiac
arrhythmia can only be initiated when the supervisor is connected to the Main
Application in <Supervised Simulation Mode>. The supervisor controls the flow of
events using the supervisory application.
<Maintenance Mode> is used to access the Scenario, ECG and Recorded Variable
editors and to allow the system administrator to move the location of the
<ScenarioData> folder.
1.5.1
Maintenance Mode
<Maintenance Mode> is used to access the Scenario, ECG and Recorded Variable
editors and to allow the system administrator to move the location of the
<ScenarioData> folder.
The menu options which are available in this mode are:
<System><Exit>
<System><Scenario Editor>
<System><Scenario Data Source>
<System><Recorded Variables Editor>
<System><ECG Editor>
<System><Help System>
<System><Miscellaneous Settings>
The <Help System> option opens this help file. The Help File is also made available in
'pdf' format from the Windows <Start> menu.
© 2010 MSE (Australia) PL
14
ECMO Simulation User Manual (v5.7)
The <Miscellaneous Settings> option allows you to change the units of measurement for
blood gases (kPa / mm Hg), set the aspect ratio of the Inspector Window to be used
when viewing 'PowerPoint' files and set the background colour of the main applications
desktop.
1.5.2
Supervised Simulation Mode
<Supervised Simulation Mode> is used when active interventions by a simulation
supervisor are required during the course of a simulation session. Events such as
oxygenator failure, catastrophic haemorrhage or the occurrence of a malignant cardiac
arrhythmia can only be initiated when the supervisor is connected to the Main
Application in <Supervised Simulation Mode>. The supervisor controls the flow of
events using the supervisory application.
In <Supervised Simulation> mode the main menu items are:
<System><Exit>
<View><Patient Monitor>
<View><Inspector>
<View><Therapeutic Interface>
<Tools><Save Patient>
1.5.3
Unsupervised Simulation Mode
<Unsupervised Simulation Mode> (the default selection) is intended for use by
unsupervised trainees. In this mode, a variety of previously recorded scenarios and/or
tutorials can be undertaken, but no intervention by a supervisor is possible. The trainee
is able to load different patients (pre-recorded physiological states) and to experiment
with the use of various drugs and therapeutic techniques.
In <Unsupervised> mode the main menu items are:
<System><Exit>
<View><Patient Monitor>
<View><Inspector>
© 2010 MSE (Australia) PL
Introduction
15
<View><Therapeutic Interface>
<Tools><Load Patient>
<Tools><Load Scenario>
1.6
Version Differences
The 'Evaluation' version of this software has been modified in various ways. In
particular:
The application will only run for 10 minutes,
Data Recording has been disabled,
The ECG Editor has been disabled,
The Scenario Editor has been disabled,
The Application will only function for a period of 30 days.
The 'Personal' version of the software:
Limits network connectivity between the Main (Trainee) application and the
Supervisor application. Communication between these applications is only permitted
if the applications are running on the same device, or if a direct connection between
two devices using Automatic Private IP Addressing (APIPA) has been implemented.
This restricts the range of IP addresses used by the two devices to 169.254.0.0 169.254.255.255.
Permits recording of a restricted dataset of system variables.
The 'Network' version of the software:
Has none of these restrictions, but
Requires a hardware key ('Dongle') to function.
1.7
Configuring Dual Displays
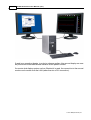
If the system is run on a dual monitor system, the second monitor should be configured
as a 1024 * 768 device and the <Patient><Monitor> window then dragged onto this
second display. The monitor will now completely fill the window.
© 2010 MSE (Australia) PL
16
ECMO Simulation User Manual (v5.7)
If used in an operating theatre, in order to enhance realism, this second display can now
be positioned on the anaesthesia machine as the patient monitor.
If a remote dual display system such as 'Maxivista' is used, the connection to the second
monitor can be made over the LAN (rather than via a DVI connection).
© 2010 MSE (Australia) PL
Introduction
17
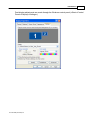
Dual display adjustments are made through the Windows control panel (<Start><Control
Panel><Display><Settings>).
© 2010 MSE (Australia) PL
Part
II
Applications
2
19
Applications
The system comprises two separate computer programs ('Applications'). The main ('
Trainee') application is contained within the executable file 'MSEHDTV.exe' and is
designed to be displayed on a computer with a single WUXGA (1920 * 1200 pixels) or
HDTV (1920 * 1080 pixels) display. This application comprises three modules (Patient
Monitor, Therapeutic Interface and Inspector).
The second ('Supervisor') application is used to control the behaviour of the simulation
system in real-time and is intended to be run on a second PC or Netbook which is in
communication with the Main Application using the IP4 implementation of the TCP/IP
protocol. The supervisory application can be run within a Local Area Network or over the
'Internet'.
2.1
Trainee
The Main (Trainee) Application is contained within the executable file ''MSEHDTV.exe'
and is designed to be displayed on a computer with a single WUXGA (1920 * 1200
pixels) or HDTV (1920 * 1080 pixels) display. This application comprises three
modules (Patient Monitor, Therapeutic Interface and Inspector).
2.1.1
Menu Bars
The Main Application itself and the 'Inspector' window both have menu bars. The items
on the menu bar of the main (Trainee) application vary according to the mode of
operation of the system.
In <Unsupervised> mode the main menu items are:
<System><Exit>
<View><Patient Monitor>
<View><Inspector>
<View><Therapeutic Interface>
<View><Camera>
<Tools><Load Patient>
<Tools><Load Scenario>
In <Supervised> mode the main menu items are:
<System><Exit>
<View><Patient Monitor>
<View><Inspector>
<View><Therapeutic Interface>
<View><Camera>
<Tools><Save Patient>
In <Maintenance> mode the main menu items are:
<System><Exit>
<System><Scenario Editor>
<System><Scenario Data Source>
<System><Recorded Variables Editor>
© 2010 MSE (Australia) PL
20
ECMO Simulation User Manual (v5.7)
<System><ECG Editor>
<System><Help System>
<System><Miscellaneous Settings>
The function of each of the respective main menu items is:
<System><Exit> To stop the application.
<System><Scenario Editor> To start the Scenario Editor.
<System><Scenario Data Source> To allow the user to change the location of the
ScenarioData folder.
<System><Recorded Variables Editor> To allow the user to select the variables
which are recorded by the data recorder.
<System><ECG Editor> To start the ECG Editor.
<System><Help System> To open this Help file.
<View><Patient Monitor> To show or hide the patient monitor.
<View><Inspector> To show or hide the inspector window.
<View><Therapeutic Interface> To show or hide the therapeutic interface.
<View><Camera> To show or hide the Camera.
<Tools><Load Patient> To load the patient with a new set of physiological data from a
'pat' file.
<Tools><Load Scenario> To load an entire scenario.
<Tools><Save Patient> to save the current physiological data in a 'pat' file.
The items on the menu bar of the 'Inspector' window vary according to the scenario
which has been loaded.
The consistently available menu items are:
<Notes>
<Investigations><Arterial Blood Gas Analysis>
<Investigations><Venous Blood Gas Analysis>
<Investigations><Oxygenator Blood Gas Analysis>
<Devices><Ventilator>
<Devices><ECMO System>
<Devices><ACT Monitor>
<Devices><Nerve Stimulator>
<Devices><Defibrillator>
<Devices><Stethoscope>
<Resources>
<Help><Help Manual>
<Help><Help About>
The function of each of the respective 'Inspector' window menu items is:
<Notes> To display the notes describing the current patient (or the conduct of a
tutorial if one has been loaded).
<Investigations><Arterial Blood Gas Analysis> To generate a current arterial blood
gas analysis report.
<Investigations><Venous Blood Gas Analysis> To generate a current venous blood
gas analysis report.
© 2010 MSE (Australia) PL
Applications
21
<Investigations><Oxygenator Blood Gas Analysis> To generate a current oxygenator
blood gas analysis report.
<Devices><Ventilator> To show the Ventilator.
<Devices><ECMO System> To show the ECMO System.
<Devices><ACT Monitor> To show the ACT Monitor.
<Devices><Nerve Stimulator> To show the Nerve Stimulator.
<Devices><Defibrillator> To show the Defibrillator.
<Devices><Stethoscope> To show the Stethoscope.
<Resources>
<Help><Help Manual> To open this Help file.
<Help><Help About> To display version information about the application.
If investigations (in the form of documents, static images,audio files or video files) have
been added to the scenario (using the scenario editor), these investigations will appear
as <Investigations> below the <Oxygenator Blood Gas Analysis> item.
Similarly, if resources (in the form of documents, static images,audio files, video files or
web-addresses) have been added to the scenario (using the scenario editor), these
resources will appear as items in the <Resources> drop-down list.
When viewing the <Notes>, <Resources> and <Help File>, the size of the viewing
window can be enlarged or reduced using the <Zoom><Zoom +> and <Zoom><Zoom > options.
2.1.2
Patient Monitor
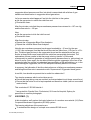
The <Patient Monitor> window represents a typical, modern, physiological monitor.
© 2010 MSE (Australia) PL
22
ECMO Simulation User Manual (v5.7)
<Display> Button:
The displayed parameters are selected by clicking on the <Display> button at the lefthand end of the toolbar.
The parameters which can be viewed include:
ECG,
SaO2,
BIS,
NIBP,
Invasive BP,
CVP,
Temperature,
Inspired Gases,
Expired Gases and
Capnography.
The <Scroll Graphs> check box turns waveform scrolling on and off.
Click the <Display> button again to close the parameter selection window.
© 2010 MSE (Australia) PL
Applications
23
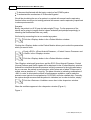
<Freeze> Button
Freezes / Unfreezes the graphical display.
<NIBP> Button:
The settings of the NIBP system are accessed by clicking on the <NIBP> button on the
toolbar. Click the button again to close the parameter selection window. NIBP
measurement turns off automatically if invasive blood pressure measurement is in use.
<Audio> Button:
The pulse oximeter tone can be turned on by clicking the <Audio> button on the toolbar.
Click the button again to turn it off. The tone is modulated by the current value of SaO2.
<Record> Button:
Data recording can be turned on by clicking the <Record> button on the toolbar. The
recorded data are stored in a Microsoft 'Excel' spreadsheet. Data are recorded every
2.5 seconds to a file which, by default is named 'MSEData.xls' and stored in the
'ScenarioData' folder. Click the button again to turn the recorder off.
<Network> Button:
Various network parameters are displayed when the <Network> button is clicked. Click
the button again to turn the panel off.
<Timer> Button:
© 2010 MSE (Australia) PL
24
ECMO Simulation User Manual (v5.7)
Clicking the <Timer> button starts a digital timer. Clicking it again stops it. Clicking it
again zeroes it and re-starts it.
The IP address of the monitor is shown at the top right of the monitor (just below the
digital timer display). This address is used to initiate communication between the
trainee and the supervisor. The IP address is in IP4 format.
The range of the invasive pressure channel can be adjusted using the <Up> and
<Down> arrows to the left of the pressure trace.
2.1.3
Inspector
The <Inspector> window gives the trainee access to documents, virtual devices,
images, videos and other resources relevant to the scenario or system.
Access to these resources is achieved by clicking on the menu at the top of the window.
The main menu items are:
Notes,
Investigations,
Devices,
Resources and
Help.
Clicking on the <Notes> menu item loads the patient's clinical notes into the window. If
the <Notes> have more than one page, two additional menu items (<Prev> and <Next>)
become active and can be used to navigate between pages of the document.
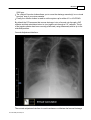
Clicking on the <Investigations> menu item allows the trainee to examine the
investigations which are available for the current scenario. Arterial, Venous and
Oxygenator Blood:Gas Analyses always appear as the first three items in the list. Other
investigations are listed if they appear in the database for the particular scenario which
has been selected.
The investigations may include:
Static Images (eg 12 Lead ECG, Chest X-Ray) in 'jpg', 'bmp', or 'pdf' format,
Video Images (eg Echo Loop) in 'wmv' or 'avi' format, or
Text Documents (eg Printed Laboratory Report) in 'pdf' format.
Clicking on the <Devices> menu item allows the trainee access to the 'virtual' devices
which are available in the environment. These devices are the:
© 2010 MSE (Australia) PL
Applications
25
Ventilator,
VV-ECMO System,
VA-ECMO System,
ACT Monitor,
Nerve Stimulator,
Defibrillator and
Stethoscope.
Note that the VA- and VV-ECMO systems are both accessed through
<Devices><ECMO System> menu item and that the ECMO system is switched
between these modes using the control at the bottom right-hand side of the
ECMO system interface.
The features of each of these devices are outlined in the <Devices> section of this
manual.
Clicking on the <Resources> menu item allows the trainee to examine the resources
which are available for the current scenario. The resources may include:
Static Images (eg Photographs) in 'jpg', 'bmp', or 'pdf' format,
Video Files (eg Training Videos, Lectures) in 'wmv' or 'avi' format,
Text Documents (eg Scientific Papers) in 'pdf' format, or
Web-Sites in 'url' format.
Powerpoint files in 'ppt' or 'pptx' format.
Clicking on the <Help><Help Manual> menu item allows the trainee to access this
document. Clicking the <Help><About> menu item displays Version and License
information relating to the installation.
2.1.4
Therapeutic Interface
2.1.4.1
Overview
The <Therapeutic Interface> is used for the administration of bolus / infusion drugs
and / or fluids. The main window (for bolus drugs) is shown below.
© 2010 MSE (Australia) PL
26
ECMO Simulation User Manual (v5.7)
Clicking on the <Bolus Drug>, <Infusion Drug> and <Fluids> tabs allows you to
administer drugs or fluids in any of these categories.
Clicking on the <History> tab lets you review your previous therapies.
If you initiate a drug infusion, it will be continued indefinitely or until the infusion rate is
set to 0 mls/hr.
If you initiate a fluid infusion it will be continued until the indicated volume had been
given, or the rate is set to 0 mls/hr.
To explore the effect of giving adrenalin to a normal patient, click on the <Bolus Drug>
tab and select <Adrenalin (100mcg/ml)> by clicking on it. A new window will appear.
Slide the green slider until a dose of ~ 125 micrograms is indicated and click the
<Give> button. Observe the effect of the drug on heart rate, blood pressure and ectopic
activity over the ensuing minutes. Click on the <History> tab to review details of your
therapeutic interventions.
The complete listing of the drugs and fluids which are available can be found in the
section entitled "Available Drugs / Fluids".
© 2010 MSE (Australia) PL
Applications
2.1.4.2
27
Available Drugs / Fluids
The drugs and fluids which are available through the <Therapeutic Interface> in this
release of the simulator are shown in the table below.
Bolus Drug:
Infusion Drug:
Fluid:
Adrenalin
Adrenalin
Albumen 4%
Atropine
Fentanyl
Dextrose 5%
CaCl2
GTN
Gelofusine
Fentanyl
Heparin
Hartmann's
Heparin
Isoprenalin
HetaStarch 6%
Isoprenalin
KCl
Normal Saline
KCl
Ketamine
Packed Cells
Ketamine
Lignocaine
Whole Blood
Lignocaine
Metaraminol
Mivacurium
Midazolam
Metaraminol
Morphine
Metoprolol
Noradrenalin
Midazolam
Propofol
Morphine
Remifentanil
Noradrenalin
SNP
Pancuronium
Propofol
Protamine
Thiopentone
Vecuronium
The current release of the system does not include a drug database editor.
2.2
Supervisor
The Supervisor Application is used to control the behaviour of the simulation system in
real-time. The program is intended to be run on a second PC or Netbook which is in
communication with the Main Application over a Local or Wide Area Network. The
application uses the IP4 addressing, but will function under both the 'Vista' and '7'
operating systems.
In order to start the application:
Run the Main Application in <Supervised Mode>.
Note the IP Address at the top right-hand corner of the <Patient Monitor>.
© 2010 MSE (Australia) PL
28
ECMO Simulation User Manual (v5.7)
Now:
Ensure that the supervisor's device has an active network connection.
Run the Supervisor Application ('MSESupervisor.exe') on the supervisor's device.
Enter the Patient Monitor's IP Address in the <Address> field of the application.
Click <Connect>.
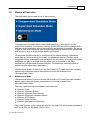
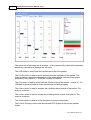
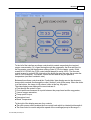
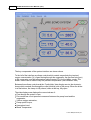
You should now see a screen which looks like this:
The tabbed pages of the application include:
Scenarios.
CVS/ECG.
Lung.
Misc. and
ECMO.
Refer to the individual items in this manual for a description of the functions of each
page.
Refer to the 'Troubleshooting' section of this manual if you are having difficulty in
connecting to the Main Application.
© 2010 MSE (Australia) PL
Applications
2.2.1
29
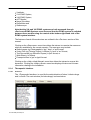
Scenarios Page
The <Scenarios> page of the supervisory application is used to load any of the
available scenarios into the Main Application and to provide access to the various
'distractions' which can be initiated during a simulation session.
To load a scenario:
Click on the desired scenario in the left-hand window.
Click on the <Load> button which has now appeared.
To provide a distraction:
Click on the desired distraction in the right-hand window:
Check the <Distractor On> box.
The distraction will be continued until the <Distractor On> box is unchecked. If you wish
to add a new distraction to the system, place a suitably annoying audio file (in 'wav'
format) in the <Distractions> sub-folder of the <ScenarioData> folder.
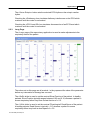
2.2.2
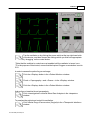
CVS/ECG Page
The <CVS/ECG> page of the supervisory application is used to make adjustments to
the ECG and circulation of the patient.
© 2010 MSE (Australia) PL
30
ECMO Simulation User Manual (v5.7)
The values set on this page are all nominal - ie they represent the value of the parameter
before any intervention or therapy has occurred.
The <HR> slider is used to set the nominal heart rate of the patient.
The <SVR> slider is used to set the nominal vascular resistance of the patient. The
scale is arbitrary (because manipulation of the control affects more than one system
parameter), but a value of 3 - 4 may be considered 'Normal'.
The <CI> slider is used to set the nominal Cardiac Index of the patient. A value of ~ 2.2
L/Min/M2 is typical of patients under anaesthesia and before bypass.
The <Gain> slider is used to increase the circulating blood volume of the patient. The
scale is in mls/min.
The <Loss> slider is used to reduce the circulating blood volume of the patient. The
scale is in mls/min.
The <Freq> slider is used to set the frequency of ectopic heart beats.
The <Set as Primary> button sets the selected ECG rhythm as the primary cardiac
rhythm.
© 2010 MSE (Australia) PL
Applications
31
The <Set as Ectopic> button sets the selected ECG rhythm as the ectopic cardiac
rhythm.
Checking the <Diathermy> box simulates diathermy interference on the ECG which
continues until the control is unchecked.
Checking the <ECG Lead Off> box simulates disconnection of an ECG lead which
continues until the control is unchecked.
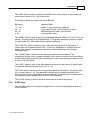
2.2.3
Lung Page
The <Lung> page of the supervisory application is used to make adjustments to the
respiratory state of the patient.
The values set on this page are all nominal - ie they represent the value of the parameter
before any intervention or therapy has occurred.
The <QsQt> slider is used to set the nominal Shunt Fraction of the patient. In healthy
patients, Shunt Fraction typically ranges between 0.03 and 0.10, whereas a patient in
severe respiratory failure may have a shunt fraction of > 0.5.
The <VdVt> slider is used to set the nominal 'Physiological' Dead Space of the patient.
In healthy patients, Dead Space is typically ~ 0.3, whereas a patient in severe
respiratory failure may have a dead space of > 0.6.
© 2010 MSE (Australia) PL
32
ECMO Simulation User Manual (v5.7)
The <Comp> slider is used to set the nominal Total Lung Compliance of the patient. The
Total Lung Compliance of a normal adult is around 100 ml/cm H20. Many disease
states (including Adult Respiratory Distress Syndrome (ARDS), pulmonary oedema,
pulmonary fibrosis, and pneumonia) result in a decreased Total Lung Compliance .
The <Raw> slider is used to set the nominal Airway Resistance of the patient. The
normal value for an adult is around 0.5 - 1.5 cm H20/L/sec.
The <FRC> slider is used to set the nominal Functional Residual Capacity of the
patient. The normal value for an adult is around 2.0 - 2.5L.
The <Rate> slider is used to set the nominal Respiratory Rate of the patient.
The <Vt> slider is used to set the nominal Tidal Volume (in litres) of the patient.
The <FiO2> slider is used to set the initial inspired oxygen of the patient.
2.2.4
Misc Page
The <Misc> page of the supervisory application is used to make adjustments to various
'Miscellaneous' parameters of the patient.
The values set on this page are all nominal - ie they represent the value of the parameter
before any intervention or therapy has occurred.
© 2010 MSE (Australia) PL
Applications
33
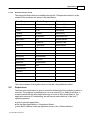
The <BIS> slider is used to set the nominal BIS score of the patient. A fully-conscious
person has a score of 98 - 100 (Glass et al).
According to Glass et al, typical values for BIS are:
BIS range
Hypnotic State
70 - 100
60 - 70
40 - 60
0 -40
Awake / Light to moderate sedation
Light hypnotic state. Low probability of recall
Moderate hypnotic state. Unconscious
Deep hypnotic state
The <BMR> slider is used to set the nominal Basal Metabolic Rate (VO2 at 37C) for the
patient. A typical value for an anaesthetised, 70 kg patient undergoing cardiac surgery
is in the range 180 - 220 ml/Min (Kirklin and Barratt-Boyes ).
The <CO2 SP> slider is used to set the carbon dioxide set-point for the patient. A
typical value for an awake patient is 38 - 42 mm Hg. Adjusting it to a higher value will
depress the patient's spontaneous respiration, whereas lowering it will increase
respiratory drive.
The <Temp> slider is used to set the starting temperature of the patient. The
temperature should not be changed markedly over a short time period as it will produce
unexpected blood gas results until re-equilibration of the respiratory gases has had time
to occur in all body pools.
The <K SP> slider is used to set the potassium set-point for the patient. A typical value
for a patient with normal renal function is 4.0 - 5.0.
The <Hct> slider is used to set the starting haematocrit for the patient. The typical value
for a normal male is ~ 45. The haematocrit should not be changed markedly over a
short time period as it will produce unexpected blood gas results until re-equilibration of
the respiratory gases has had time to occur in all body pools.
The <HCO3> slider is used to set the bicarbonate set-point for the patient.
2.2.5
ECMO Page
The <ECMO> page of the supervisory application is used to make adjustments to the
ECMO system.
© 2010 MSE (Australia) PL
34
ECMO Simulation User Manual (v5.7)
The <QsQt> slider is used to set the 'shunt fraction' of the oxygenator at a nominal blood
flow of 3.0 lpm. According to Segers et al, the best-performing oxygenators (in 2001)
had shunt fractions of ~ 0.08 at this flow rate. If you wish to simulate complete gas
transfer failure, push the <QsQt> slider to 1.0. Simulate partial failure by placing it
around 0.5. The system automatically varies shunt fraction according to blood flow rate.
The <VdVt> slider is used to set the 'Dead Space' of the oxygenator at a nominal blood
and gas flow of 3.0 lpm. Some work by Pybus et al suggest that a value of ~0.08 - 0.10
is representative. If you wish to simulate complete disconnection of the gas supply, push
the <VdVt> slider to 1.0. The system automatically varies dead space according to
blood and gas flow rate.
The <Mem Res> slider is used to set the Membrane Resistance of the oxygenator. The
scale represents the pressure drop across the oxygenator in mm Hg/L/min. Typically,
the value of this parameter is in the range 10 - 30 mm Hg/L/Min for a noramallyfunctioning oxygenator.
The <AL Res> slider is used to set the resistance of the arterial (return) line. The scale
represents the pressure drop across the 'Arterial' line in mm Hg/dL/min. Typically, the
value of this parameter is < 1 mm Hg/L/Min for unobstructed tubing. If you wish to
simulate more-or-less complete kinking of the 'arterial' line, set the <AL Res> slider to
20.
The <VL Res> slider is used to set the resistance of the venous (drainage) line. The
© 2010 MSE (Australia) PL
Applications
35
scale represents the pressure drop across the drainage line in mm Hg/dL/min. Typically,
the value of this parameter is < 1 mm Hg/L/Min for unobstructed tubing. If you wish to
simulate more-or-less complete kinking of the drainage line, set the <VL Res> slider to
20.
© 2010 MSE (Australia) PL
Part
III
Devices
3
Devices
3.1
Nerve Stimulator
37
The current version of the nerve stimulator can only be used for Train-of-Four
measurement. Click the <TOF> button to observe the response of adductor pollicis.
3.2
Veno-Venous ECMO
Note that the VA- and VV-ECMO systems are both accessed through
<Devices><ECMO System> menu item and that the ECMO system is switched
between these modes using the control at the bottom right-hand side of the
ECMO system interface.
The Veno-venous ECMO module is intended for use by those undergoing training in this
technique and is intended for use in a patient suffering from extreme respiratory failure.
(Qs/Qt > 50%; Vd/Vt > 50%). The module has three user interfaces:
The Pump Control Interface (PCI) is loosely-based on the Maquet 'CardioHelp'
perfusion system.
© 2010 MSE (Australia) PL
38
ECMO Simulation User Manual (v5.7)
To the left of the interface are three controls which control respectively the inspired
oxygen concentration (%) of gas flowing through the oxygenator; the flow rate (lpm) to
the oxygenator; and the temperature setting control (C) for the heater: cooler. In the
context of VV ECMO, the FiO2 control should always be set at 100%. The flow rate
control is used to control CO2 elimination (the higher the gas flow rate, the greater the
rate of CO2 clearance). The heater: cooler can be used to vary the patient’s
temperature (and their metabolic rate).
Between these three controls and the ‘CardioHelp’ data display area is the electronic
clamp which controls flow through the outlet (‘Arterial’) side of the pump. When the slider
is at the bottom, the clamp is fully closed, when at the top, fully open.
The data display area displays the current values of:
Flow through the system in lpm,
Circuit pressure measured at a point between the pump head and the oxygenator,
Venous oxygen saturation,
Pump speed in rpm,
Haematocrit and
Blood Temperature.
To the right of the display area are four controls:
The main power switch enables the flow control knob which is situated just beneath it.
The flow control is used to adjust the speed of the centrifugal pump in the range 0 –
© 2010 MSE (Australia) PL
Devices
39
5000 rpm.
The <Adjust Cannula> button allows you to move the drainage cannula(e) in or out and
to select size of your return cannula.
Finally, the <Mode> button is used to set the system up for either VV or VA ECMO.
By default, the PCI assumes that venous drainage is via a femoral vein through a 24F
catheter and that arterialised return is via a jugular vein through a 21F catheter. The tip
of the jugular catheter has been correctly positioned (using ultrasound) with its tip in the
mid-atrial position.
Cannula Adjustment Interface:
The cannula adjustment interface is used to advance or withdraw the femoral drainage
© 2010 MSE (Australia) PL
40
ECMO Simulation User Manual (v5.7)
catheter using the slide-control at the left. If the tips of the drainage and return cannulae
are positioned too closely, re-circulation will start to occur and oxygenation will be
impaired.
If satisfactory conditions cannot be obtained using a single drainage cannula, the 'Dual
Cannulation' box should checked, and a second slide will appear which will enable the
positioning of a second (SVC) cannula.
Clicking the <Select Return Cannula> button opens up the Cannula Selector window.
Return Cannula Selector Interface:
Select the cannula size that you want and then click <Save> to close the window. Click
<Devices><ECMO System> to return to the ECMO system itself.
3.3
Veno-Arterial ECMO
Note that the VA- and VV-ECMO systems are both accessed through
<Devices><ECMO System> menu item and that the ECMO system is switched
between these modes using the control at the bottom right-hand side of the
ECMO system interface.
The Veno-arterial ECMO module is intended for use by those undergoing training in this
technique and is intended for use in a patient suffering from circulatory failure (with or
without the presence of respiratory failure). The module has three user interfaces:
The Pump Control Interface (PCI) is loosely-based on the Maquet 'CardioHelp'
perfusion system.
© 2010 MSE (Australia) PL
Devices
41
To the left of the interface are three controls which control respectively the inspired
oxygen concentration (%) of gas flowing through the oxygenator; the flow rate (lpm) to
the oxygenator; and the temperature setting control (C) for the heater: cooler. In the
context of VV ECMO, the FiO2 control should always be set at 100%. The flow rate
control is used to control CO2 elimination (the higher the gas flow rate, the greater the
rate of CO2 clearance). The heater: cooler can be used to vary the patient’s
temperature (and their metabolic rate).
Between these three controls and the ‘CardioHelp’ data display area is the electronic
clamp which controls flow through the outlet (‘Arterial’) side of the pump. When the slider
is at the bottom, the clamp is fully closed, when at the top, fully open.
The data display area displays the current values of:
Flow through the system in lpm,
Circuit pressure measured at a point between the pump head and the oxygenator,
Venous oxygen saturation,
Pump speed in rpm,
Haematocrit and
Blood Temperature.
To the right of the display area are four controls:
The main power switch enables the flow control knob which is situated just beneath it.
The flow control is used to adjust the speed of the centrifugal pump in the range 0 –
© 2010 MSE (Australia) PL
42
ECMO Simulation User Manual (v5.7)
5000 rpm.
The <adjust cannula> button allows you to move the drainage cannula(e) in or out and
to select size of your return cannula.
Finally, the <Mode> button is used to set the system up for either VV or VA ECMO.
By default, the PCI assumes that venous drainage is via a femoral vein through a 24F
catheter and that arterialised return is via a femoral artery through a 21F catheter. The
<Dual Cannulation> option is not available in VA ECMO mode.
Cannula Adjustment Interface:
The cannula adjustment interface is used to advance or withdraw the femoral drainage
catheter using the slide-control at the left.
© 2010 MSE (Australia) PL
Devices
43
Clicking the <Select Return Cannula> button opens up the Cannula Selector window.
Return Cannula Selector Interface:
Select the cannula size that you want and then click <Save> to close the window. Click
<Devices><ECMO System> to return to the ECMO system itself.
3.4
Defibrillator
The defibrillator is loosely modelled on the 'Lifepak' series of defibrillators. It must be
connected to the patient monitor (by selecting ECG as a viewable parameter on the
patient monitor). Then, to use it:
1. Turn it on.
© 2010 MSE (Australia) PL
44
ECMO Simulation User Manual (v5.7)
2. Select the energy required for defibrillation by clicking on the <Energy> button.
3. Charge the capacitor by clicking the <Charge> button.
4. When the charge is available, defibrillate using the <Defibrillate> button.
The defibrillator delivers a monophasic current and, depending on the energy selected
and arrhythmia present, the shock may or may not be successful.
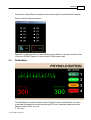
3.5
Ventilator
The ventilator is loosely based on a simple anaesthesia ventilator which automatically
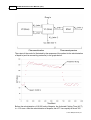
provides an 'Intermittent Mandatory Ventilation (IMV) mode (Pybus DA and Kerr JH).
During IPPV the ventilator acts as a constant flow generator. Inspiratory and expiratory
flow, mouth pressure and delivered tidal volume are shown graphically on the left-hand
side of the device. At the right hand side of the display are the controls for adjusting the
gains of the flow, pressure and volume channels respectively.
For the purposes of the ECMO simulation system, the patient is assumed to be
intubated and connected to the ventilator circuit.
Unless paralysed, the patient will be able to breathe through the circuit (whether or not
the ventilator is turned on).
In order to turn the ventilator <On>, click the button at the top right of the interface. Use
the <Vt> (Tidal Volume), <Rate>, <O2%> and <PEEP> controls to set up the ventilatory
parameters which you want. If you want to suppress the patient's own respiratory
activity, use the <Therapeutic Interface> to administer a respiratory depressant (such
as Fentanyl), or completely eliminate spontaneous respiratory activity by using a muscle
relaxant (Pancuronium).
© 2010 MSE (Australia) PL
Devices
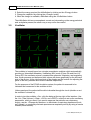
3.6
45
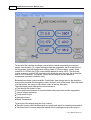
ACT Machine
The effect of heparin (or its reversal with protamine) can be measured with the ACT
machine. In order to perform an ACT measurement, click the <Start> button on the
'Hemochron' device. The ACT will then count up to the current value in the display
window.
© 2010 MSE (Australia) PL
46
3.7
ECMO Simulation User Manual (v5.7)
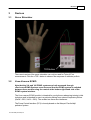
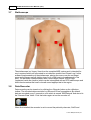
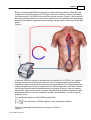
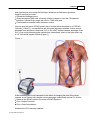
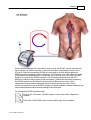
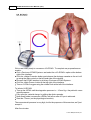
Stethoscope
The stethoscope is a 'legacy' item from the complete MSE system and is intended for
use in systems which are connected to an intubation manikin and 'Smart Lung'. In this
software implementation of the stethoscope, placing the cursor over the red target
areas on the thorax and left-clicking turns on or off the heart or breath sounds in the
area. The hardware implementation uses a much larger number of RFID tags
(implanted inside the manikin) which can be interrogated with an RFID stethoscope and
which then broadcast the heart or breath sound appropriate to the region.
3.8
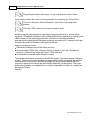
Data Recorder
Data recording can be turned on by clicking the <Record> button on the <Monitor>
toolbar. The recorded data are stored in a Microsoft 'Excel' spreadsheet. By default,
data are recorded every 5 seconds to a file which is named 'MSEData.xls' and stored in
the 'ScenarioData' folder. Click the button again to turn the recorder off.
When first installed, the recorder is set to record the patient's pulse rate, SaO2 and
© 2010 MSE (Australia) PL
Devices
mean arterial blood pressure.
If you wish to record other variables, you must select them by running the
application in <Maintenance Mode>.
To do this:
Start the system in <Maintenance> mode.
Select the <Recorded Variables Editor>.
Select the recorded variables.
Select the <Frequency of Recording>
Click <Save & Exit>
Restart the system in either <Supervised> or <Unsupervised> mode.
The Recordable Variables Editor is 'modal' - which is to say that it must be
closed with the <Save & Exit> button or <Cancel & Exit> button before any
other activities can be undertaken.
© 2010 MSE (Australia) PL
47
48
ECMO Simulation User Manual (v5.7)
If you are using the <Personal> version of the application, only three variables
can be recorded at any one time. If you select more than this number, only the
first three selected variables will be recorded.
Whichever licensed version is used, the data recorder also records all bolus, infusion
and fluid therapy.
The selected variables are retained between runnings of the application.
© 2010 MSE (Australia) PL
Part
IV
50
ECMO Simulation User Manual (v5.7)
4
Camera
4.1
System Requirements
This component of the system has been developed in the 'Windows 7' 32 and
64-bit environments. It has not been tested in earlier versions of the operating
system.
If you are using Logitech cameras, you should only install the appropriate
drivers. The application may not function correctly if the 'Webcam / Vid'
software is also installed.
4.2
Camera Overview
The <Camera> window is made available within the <Trainee> program, but effectively
functions as a separate application.
It can either be used to film the supervisor during the pre-simulation briefing (for
example if making a 'PowerPoint' presentation), or, alternatively, it can be used to
record the activities of the trainee during the simulation itself.
In order to save on display space, the <Monitor> and <Therapeutic Interface > windows
should be turned off when making 'PowerPoint' presentations.
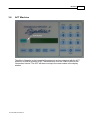
The camera window has 3 menu items:
<Tools><Select Camera>
<Tools><Start Recording>
<Tools><Start Streaming>
© 2010 MSE (Australia) PL
Camera
51
You must <Select a Camera> before <Recording> can be commenced. The selection
dialog is shown above.
Two camera types are currently supported.
1. Any Web or other digital camera which is directly connected to the computer.
2. Any IP camera which can be accessed over the LAN / WAN.
Select the type you want and <Test> the video feed once you have made the
appropriate selection.
Once you have selected a camera, you can <Close> the selector window and <Start
Recording> if you wish.
The video stream is recorded in ASF format and the video files are recorded to the
application directory and are named according to the following protocol:
By default, the recorded video file name is in the form :"MSExxxx.asf" where "xxxx" is
an auto-incrementing, 3 digit sequence.
If you change the Session Name, this name (rather than "MSE") will be used as the file
prefix.
3 data storage rates are available:
<Small> corresponds to about 200 Kbits/sec.
<Medium> corresponds to about 1000 Kbits/sec.
<Large> corresponds to about 2000 Kbits/sec.
© 2010 MSE (Australia) PL
52
ECMO Simulation User Manual (v5.7)
Whenever possible, the system attempts to record at a frame rate of 29.97 fps.
<Large> video files consume disk space at about 1Gb /hr. Therefore, you
should periodically clear out recordings you don't want, otherwise your disk
space will rapidly disappear!
You can <Stream> the video output to somewhere else on your LAN. To do this, simply
click on the <Start Streaming> menu item. The streamed output is sent to port 10500 on
the application computer, and can be viewed by any media player which is capable of
interpreting an 'MMS' video data stream.
There is significant latency in the streamed output in this version of the
program (~5 seconds). This will be addressed in future versions.
To connect to the URL, enter an address in the form "mms://<IP address>:10500". The
IP Address of the server is shown at the top right hand side of the <Monitor> window.
Thus a valid URL might be: mms://192.168.0.249:10500
You will almost certainly have to adjust your firewall in order to permit access to
port 10500.
There are two small 'lights' at the top left-hand side of the window. The first indicates
whether or not recording is occurring (red / green) the second whether or not streaming
4.3
Compatible Equipment
Computers:
You will need a 'high end' system if you want to make full HD recordings using this
program. The system has been developed on a computer which is based on dual, six
core, I7 processors clocked at 3.33 Ghz. When recording at 2 Mbits/sec, CPU
utilisation on this machine is about 10%.
Devices:
The following devices are known to be compatible with the system and can be
recommended:
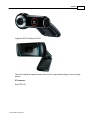
Web Cameras:
Logitech QuickCam Pro 9000.
© 2010 MSE (Australia) PL
Camera
53
Logitech HD Pro Webcam C910.
The video quality and performance of the C910 is quite astounding for such a cheap
device.
IP Cameras:
Axis PTZ 213.
© 2010 MSE (Australia) PL
54
ECMO Simulation User Manual (v5.7)
Axis 243SA
Television systems:
Toshiba 47WL66
Panasonic TH-50PZ80
Other Equipment:
Axis P8221 Audio Encoder. This device permits encoding and streaming of any
microphone signal at very low latency.
Axis 243SA Video Encoder. This device permits encoding and streaming of any PAL
or NTSC video signal at very low latency.
D-Link Dir 655 router.
The following URL's have been successfully tested on Axis equipment:
Axis PTZ 213:
http://xxx.xxx.xxx.xxx/axis-cgi/mjpg/video.cgi
axrtpu://xxx.xxx.xxx.xxx/mpeg4/media.amp
Axis 243SA:
http://xxx.xxx.xxx.xxx/axis-cgi/mjpg/video.cgi
Axis P8221:
axrtsp://xxx.xxx.xxx.xxx/axis-media/media.amp
© 2010 MSE (Australia) PL
Part
V
56
ECMO Simulation User Manual (v5.7)
5
Models
5.1
Cardio-Respiratory Model
The cardio-respiratory model is based on the work of Dickinson, and comprises five
functional units. These units are the:
1. Native Heart.
2. Native Lung.
3. Arterial Blood Pool.
4. Peripheral Tissue Pool.
5. Venous Blood Pool
The model describes the passage of blood from the tissue pool through the venous pool
and the native lung to the arterial pool - in an iterative fashion.
During a single iteration cycle, the blood is passed from one pool to the next in an
amount which corresponds to the volume which has flowed during the iterative period.
This incoming blood is then mixed perfectly with the blood in the existing pool and the
new contents of oxygen, carbon dioxide and metabolic acids are calculated. When
blood passes through the 'ideal compartment' of a lung pool, gas exchange occurs and
oxygen and carbon dioxide diffuse across the alveolar:capillary membrane according to
their pressure gradients. These lungs behave as 'Open Glottis' lungs which are exposed
to atmospheric air (See: Hardman).
At the end of each iteration, oxygen is added to the tissue pool in an amount which
corresponds to the amount which was acquired during transit through the lungs, and
carbon dioxide is removed according to the amount which was expired in the ventilating
© 2010 MSE (Australia) PL
Models
57
gas.
Finally oxygen is removed from the tissue pool and carbon dioxide added to the pool
according to the metabolic rate.
The native lung itself is modelled as as a classical 'Riley' three compartment structure.
The model has been designed to allow for the inclusion of additional the lungs within the
circuit. In particular, an artificial lung can be placed in parallel with the native lung (in
order to simulate cardio-pulmonary bypass or veno-arterial ECMO), or in series with
(before) the native lung (in order to simulate veno-venous ECMO). Alternatively, two
native lungs (with variable parameters corresponding to the right and left lungs) can be
placed in parallel with one another in order to simulate the physiology of differential lung
ventilation (or one-lung anaesthesia).
All blood gas results are corrected to 37 C and reported at this temperature.
See:
Dickinson CJ. (1977). A Computer Model of Human Respiration/ MTP Press Limited.
ISBN 0852001738
Hardman JG, Wills JS, Aitkenhead AR. Investigating hypoxemia during apnea:
validation of a set of physiological models. Anesth Analg. 2000 Mar;90(3):614-8.
Riley RL and Cournand A. (1949) ‘Ideal’ Alveolar air and the analysis of ventilationperfusion relationships in the lungs. J. Appl. Physiol., 1, 825-847
© 2010 MSE (Australia) PL
58
5.2
ECMO Simulation User Manual (v5.7)
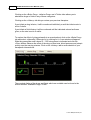
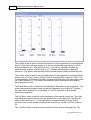
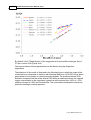
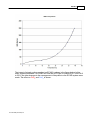
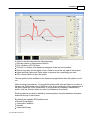
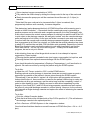
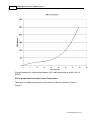
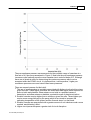
Qs/Qt and Cardiac Output
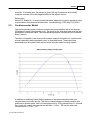
The relationship between Qs/Qt of the native lung and the cardiac output has been
modeled with some reference to the data of Dantzker et al.
These authors found that Qs/Qt varied in a more-or-less linear fashion with cardiac
output in a group of 20 patients with severe ARDS.
The relationship between Qs/Qt and Cardiac Output in the group of patients with ARDS
is shown (in black) in the figure above.
In this study, the authors remarked that: "The marked influence of cardiac output on
intrapulmonary shunt shown in this study emphasizes that interpretation of
improvements in gas exchange seen in ARDS must take into account
accompanying hemodynamic changes. Interventions which appear to improve
lung function may be acting predominantly by depression of cardiac output
without improving the pulmonary pathologic process, and may be deleterious
© 2010 MSE (Australia) PL
Models
59
to overall tissue oxygenation."
In the MSE system, the change in Qs/Qt which follows a change in cardiac
output is shown superimposed in red.
In this case, cardiac output has been changed from ~ 1.0 lpm to ~ 7.0 lpm.
Note that the curve is somewhat steeper than the data of Dantzker and that even at very
low cardiac outputs, a significant shunt is still apparent. This apparent discrepancy is
intentional. - Clearly, if Qs/Qt falls to zero at a cardiac output of about 25% of baseline,
phenomena such as 'differential circulation' could not occur. Accordingly, in the MSE
model, the intercept of the shunt line has been set at about 40% of the baseline shunt
value.
Reference:
Dantzker DR, Lynch JP, Weg JG. Depression of cardiac output is a mechanism of shunt
reduction in the therapy of acute respiratory failure. Chest. 1980 May;77(5):636-42.
5.3
Blood Gas Calculations
Blood:gases are calculated in the various compartments at a frequency of 0.5 Hz using
standard techniques and equations. Kelman, Severinghaus and Christoforides et al
have provided the most important algorithms in this area.
References:
Christoforides C, Laasberg LH, Hedley-Whyte J. Effect of temperature on solubility of
O2 in human plasma. J Appl Physiol. 1969 Jan;26(1):56-60.
Kelman GR. (1966) Digital computer subroutine for the conversion of oxygen tension
into saturation. J Appl Physiol. 1966 Jul;21(4):1375-6.
Kelman GR (1967). Digital computer procedure for the conversion of PCO2 into blood
CO2 content. Resp. Physiol. 3, 111-115.
Severinghaus JW. Simple, accurate equations for human blood O2 dissociation
computations. J Appl Physiol. 1979 Mar;46(3):599-602.
5.4
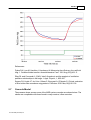
Pharmacokinetic Model
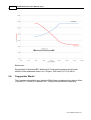
The pharmacokinetic model is loosely based on the work of Maitre and Shafer who
described a method of predicting anaesthetic drug concentrations based on a three
compartment model of drug distribution and elimination.
Their model has been subject to three additional refinements:
1. The ability to calculate drug concentrations at effector sites has been added.
2. The ability to define the potency of any drug at any effector site has been added.
3. A mechanism of competitive antagonism has been added.
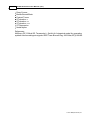
The basic structure of the model is shown bellow.
© 2010 MSE (Australia) PL
60
ECMO Simulation User Manual (v5.7)
The output of the model is illustrated by the response of the patient to the administration
of heparin (and its reversal by protamine) in the graph below.
Before the administration of 10,000 units of heparin, the Activated Clotting Time (ACT)
is ~ 130 secs. After the administration of heparin, the ACT rises rapidly to about 325
© 2010 MSE (Australia) PL
Models
61
seconds. 10 minutes later, the patient is given 100 mg of protamine and virtually
complete reversal of the anticoagulant effect of the heparin occurs.
References:
Maitre PO, Shafer SL. A simple pocket calculator approach to predict anesthetic drug
concentrations from pharmacokinetic data. Anesthesiology. 1990 Aug;73(2):332-6.
5.5
Cardiovascular Model
The cardiovascular model combines a ventricular pump together with a four element
'Windkessel' model (Stergiopulos et al). The pump is pre- and after-load sensitive and
generates a sinusoidal output. The intra-vascular pressure calculations are computed
every 5 msecs.
The effect of variation in pre-load on the cardiac output of the model (in a patient with
normal contractility and sympathetic tone) is illustrated below. These data were
generated from the system itself and recorded using the data recording system.
In addition to exhibiting Frank-Starling behaviour, the cardiovascular model also
incorporates some reflex activity. The effect of haemorrhage on blood pressure and
pulse rate is shown below. Over a 60 second period, a 70 kg patient loses 1L of blood.
As a result, the systolic blood pressure falls from ~115 to ~ 50 and the pulse rate
increases from ~ 70 to ~ 115.
© 2010 MSE (Australia) PL
62
ECMO Simulation User Manual (v5.7)
References:
Stergiopulos N, Westerhof BE, Westerhof N. Total arterial inertance as the fourth
element of the windkessel model. Am J Physiol. 1999 Jan;276(1 Pt 2):H81-8.
5.6
Oxygenator Model
The oxygenator is modelled as a classical 'Riley' three compartment lung placed either
in series (VV - ECMO) or in parallel (VA - ECMO) with the patient's native lung.
© 2010 MSE (Australia) PL
Models
63
By default, Qs/Qt ('Shunt Fraction') of the oxygenator at a nominal blood flow of 3.0 lpm
is set to 0.08 and is varied in a linear manner according to the blood flow through the
device (Segers et al).
© 2010 MSE (Australia) PL
64
ECMO Simulation User Manual (v5.7)
By default, Vd/Vt (''Dead Space') of the oxygenator at a nominal blood and gas flow of
3.0 lpm is set to 0.08 (Pybus et al).
The nominal values of these parameters can be altered using the Supervisor
Application.
The behaviour of the model is illustrated in the following figure in which the output of the
model has been compared in real-time with data acquired from a CDI-500 'in-line' blood
gas analyser from a patient on cardio-pulmonary bypass. The predicted arterial PO2
has been compared with the actual arterial PO2 during a manoeuvre where the inspired
oxygen concentration to the oxygenator (green line) was reduced from 100% to ~ 60%
and then returned to 100% two minutes later. The concordance between the actual and
predicted readings is clearly apparent.
© 2010 MSE (Australia) PL
Models
65
References:
Pybus DA, Lyon M, Hamilton J, Henderson M. Measuring the efficiency of an artificial
lung: 1. Carbon dioxide transfer. Anaesth Intensive Care. 1991 Aug;19(3):421-5.
Riley RL and Cournand A. (1949) ‘Ideal’ Alveolar air and the analysis of ventilationperfusion relationships in the lungs. J. Appl. Physiol., 1, 825-847
Segers PA, Heida JF, de Vries I, Maas C, Boogaart AJ, Eilander S. Clinical evaluation
of nine hollow-fibre membrane oxygenators. Perfusion. 2001 Mar;16(2):95-106.
5.7
Cannula Model
The pressure drops across some of the MSE system cannulae are shown below. The
values are comparable with those found in many modern, inflow cannulae.
© 2010 MSE (Australia) PL
66
ECMO Simulation User Manual (v5.7)
During VV-ECMO, the cannula model takes into account the relative positions of the
tips of the drainage and return cannula(e). If these are positioned too closely, recirculation will start to occur and oxygenation will be impaired.
Return cannula size can be set by the trainee in the range 15 - 24F using the 'Cannula
Selector Interface'.
© 2010 MSE (Australia) PL
Models
67
The effect of changing the size of the return cannula on pre-membrane pressure (at a
flow rate of 4 lpm) is shown below.
© 2010 MSE (Australia) PL
68
5.8
ECMO Simulation User Manual (v5.7)
Centrifugal Pump Model
The centrifugal pump used by the MSE is modelled according to the standard 'Pump
Affinity Laws'. As an example of the performance of the MSE pump, in the graph below,
the stagnation pressure of the pump has been compared with that of a 'Rotaflow' ECMO
device at speeds in the range 0 – 5000 rpm. (The stagnation pressure is the pressure
achieved at the outlet of a centrifugal pump when the pump is working against a
completely occluded outflow and is a measure of the total energy of the system at that
particular rpm.)
Black line: MSE pump. Red triangles published data for ‘Rotaflow’ pump.
5.9
Thermal Model
The patient is modelled as a three-compartment thermal model (fast, medium, slow).
The temperature of the fast compartment is reported to the monitoring system as the
naso-pharyngeal temperature, whereas the metabolic rate is determined by the
temperature of the medium compartment. The system constrains temperature in the
range 15 - 40C.
The effect of temperature on basal metabolic rate (BMR) is modelled according to the
data of Kirklin. In the figure below, the effect of temperature on BMR is shown in a
patient with a nominal BMR at 37 centigrade of 200 ml/min.
© 2010 MSE (Australia) PL
Models
69
The impact of simply cooling a patient on ECMO is shown in the figure below. In this
case, a patient on stable VV ECMO at a flow rate of 5.0 lpm is cooled by 5 C from 38.8
to 33.8. No other changes to the management of the patient or the ECMO system were
made. The effect on PaO2 and SaO2 is shown.
© 2010 MSE (Australia) PL
70
ECMO Simulation User Manual (v5.7)
References:
Kirklin JW and Barratt-Boyes BG. 'Cardiac Surgery'. New York: Churchill Livingstone,
1993:61-127.
5.10
ECG Model
The ECG model is based on the work of McSharry et al. and is available on the '
Physionet' website as 'ECGSYN'. According to these authors:
" ECGSYN generates a synthesized ECG signal with user-settable mean heart rate,
number of beats, sampling frequency, waveform morphology (P, Q, R, S, and T timing,
amplitude,and duration), standard deviation of the RR interval, and LF/HF ratio (a
measure of the relative contributions of the low and high frequency components of the
RR time series to total heart rate variability). Using a model based on three coupled
ordinary differential equations, ECGSYN reproduces many of the features of the human
ECG, including beat-to-beat variation in morphology and timing, respiratory sinus
arrhythmia, QT dependence on heart rate, and R-peak amplitude modulation. The
output of ECGSYN may be employed to assess biomedical signal processing
techniques which are used to compute clinical statistics from the ECG."
© 2010 MSE (Australia) PL
Models
71
By default, the available ECG patterns are:
Normal Sinus Rhythm
Ventricular Fibrillation
Asystole
Ventricular Ectopy
Deep Q wave
Bundle Branch Block
Peaked T wave
ST elevation +
ST elevation ++
ST elevation +++
ST Depression
Nodal rhythm
References:
McSharry PE, Clifford GD, Tarassenko L, Smith LA.A dynamical model for generating
synthetic electrocardiogram signals. IEEE Trans Biomed Eng. 2003 Mar;50(3):289-94.
© 2010 MSE (Australia) PL
Part
VI
Scenarios
6
Scenarios
6.1
Scenarios - Overview
73
Scenarios are collections of resources which can be used to enhance the reality of a
simulation session. The resources themselves are computer files which may consist of:
A definition of an initial physiological state (contained within a 'pat' file).
The Clinical Notes of the patient.
'Investigations' such as Chest X-Rays, ECG's or Laboratory Results.
'Resources' such as Educational Videos, Scientific Papers or Links to useful websites.
All of the resource files must be stored in the ScenarioData folder of the Main
Application.
The scenario database is a Microsoft 'Access' database ('MSEScenario.mdb') which
contains links to the various constituent components of a scenario. In <Unsupervised>
mode the trainee can select a scenario by clicking on the <Tools><Load Scenario>
menu option of the main environment. In <Supervised> mode the supervisor selects the
scenario on the <Scenarios> page of the Supervisor Application.
The basis structure of a record in the scenario database is shown below.
In the example, The ECMO Tutorial (1) scenario consists of:
A set of 'Clinical Notes' contained in the document 'ECMO Tutorial 1.pdf';
A single investigation (Chest X-Ray 'ARDS_X-Ray.jpg' in 'jpg' format) and
© 2010 MSE (Australia) PL
74
ECMO Simulation User Manual (v5.7)
Six 'resources' in either 'jpg' or 'pdf' format.
Although not shown in the diagram, the database record also includes a reference to the
initial patho-physiological state in the form of a 'pat' file.
Refer to the section 'Scenarios - Creating Resources' for a description of the
techniques which may be used to create a resource.
6.2
Scenarios - File Formats
The file formats which can be used as resources by the system are:
File Extension:
Intended Use:
PAT
Patient File
PDF
Document or Image
display
WMV
Video Display in
PAL or NTSC
Video format
AVI
Video Display in
PAL or NTSC
Video format
JPG
Image Display
BMP
Image Display
URL
Web-Site Address
WAV
Audio File
PPT
PowerPoint
PPTX
PowerPoint
Note that DOC or DOCX files cannot be incorporated into the database. If you wish to
author a document in this format, you must convert it to PDF format before inclusion.
Conversion can most easily be performed using the Microsoft 'Save As PDF' plugin
which is freely available on the Microsoft Site.
The full version of Microsoft Office 'PowerPoint' is required if you wish to show
'PowerPoint' files in the Inspector Windowr. The system will not work with the 'Viewer'
version of this program.
Depending on the version of 'PowerPoint' which you are using, you may also need to
modify the Windows registry to permit successful display. A registry-modification script
which will make all the necessary alterations has been included in the installation
package. Refer to the section entitled 'Displaying PowerPoint Files' further information
on this topic.
© 2010 MSE (Australia) PL
Scenarios
6.3
75
Scenarios - Creating Resources
The creation of scenarios involves two distinct steps:
First, all the resources to be used in the scenario must be created and placed in the
application's 'ScenarioData' folder.
Second, links to the collection of resources which constitute the scenario must then be
added as a new record within the scenario database.
In this section we will only describe the first stage. A complete description of the second
stage can be found in the section entitled 'Scenarios - Database Editor'.
Creating an initial patho-physiological state:
The initial patho-physiological state must be created by the supervisor by adjusting the
patient's parameters using the 'MSE Supervisor' application while connected to the
Main Application ('MSEHDTVxxxx.exe'). Thus, for example, if the supervisor wishes to
generate a hypovolaemic patient, the steps required are:
Start the Main Application in <Supervised Mode>.
Click the 'Display' button on the patient monitor and select 'ECG', 'Direct Arterial
Pressure' and 'Central Venous Pressure'.
Click the 'Display' button again to display these parameters.
Start the 'MSE Supervisor' application.
Connect the Supervisor Application to the Main Application.
Click on the 'Getting Started' scenario in the left-hand window of the <Scenarios>
page.
Click on the <Load> button to load this (normal) patient into the Main Application.
Click on the <CVS / ECG> page tab and slide the <Loss>control up to 1000 mls/min.
Observe the patient monitor. When an appropriate degree of hypotension and
tachycardia has developed, return the <Loss> control on the Supervisor Application
back to zero.
In the Main Application:
Save the patient's current patho-physiological state under an appropriate name (eg
'Hypovolaemia') using the <Tools><Save Patient> menu option of the main
environment.
Using the 'Windows Explorer' confirm the presence of a file named 'Hypovolaemia.
pat' in the scenario data folder.
The patho-physiological state contained within the ''Hypovolaemia.pat' file can then be
used in any scenario in which a hypovolaemic patient is required at start-up.
Creating the clinical notes of the patient:
The clinical notes of the patient should be written in a format which would typically be
provided by the admitting physicians of your institution. They can be created using any
word processor. The notes should include at least:
The height, weight and age of the patient;
The history of the presenting complaint;
The previous medical history;
A description of the relevant findings on examination;
A description of current drug therapy;
© 2010 MSE (Australia) PL
76
ECMO Simulation User Manual (v5.7)
A listing of any drug (or other) allergies;
Additionally, the clinical notes can contain data such as ECG’s, Laboratory Results,
Respiratory Function tests etc. However, it should be noted that it is generally more
appropriate to allocate these data to the ‘Investigations’ section of the Scenario.
There is no restriction on the number of pages which can be contained within the
‘Clinical Notes’.
Once the notes have been composed, they must be converted to 'pdf' format and placed
in the scenario data folder. If you wish to improve verisimilitude by providing 'handwritten' (ie illegible!!) notes, you may do so by scanning the hand-written documents and
saving them in 'pdf' format.
These clinical notes will be displayed when the <Clinical Notes> menu option of the
'Inspector' window is clicked.
Investigations:
The patient's investigations should also be placed in the scenario data folder. These
can be in the form of:
Documents (eg Laboratory Results) in 'pdf' format.
Static images (eg Chest x-Rays) in 'jpg' or 'bmp' format.
Audio files (eg Heart Sounds) in 'wav' format.
Video files (eg Echo loops) in either 'wmv' or 'avi' format.
There are several good sites on the WWW which can be used as a source of X-Rays,
ECG's, Scans etc.
The investigations will be displayed when the <Investigations> menu option of the
'Inspector' window is clicked.
Resources:
Similarly, appropriate resources should also be placed in the scenario data folder. As
with the patient's investigations these can be in the form of:
Documents (eg Scientific References) in 'pdf' format.
Static images (eg ECMO Circuit Diagrams) in 'jpg' or 'bmp' format.
Audio files (eg Lectures) in 'wav' format.
Video files (eg Instructional videos) in either 'wmv' or 'avi' format.
In addition, the URL's of relevant websites can also be included as resources.
The resources will be displayed when the <Resources> menu option of the 'Inspector'
window is clicked.
6.4
Scenarios - Database Editor
The scenario database editor can be accessed from the <System><Scenario Editor>
menu in the main environment when running in <Maintenance Mode>. The editor is not
available in the Evaluation Version.The user interface of the editor is shown below.
© 2010 MSE (Australia) PL
Scenarios
77
The editor is 'modal' - which is to say that it must be closed with the <Save &
Exit> button or <Cancel & Exit> button before any other activities can be
undertaken.
In order to navigate the file system you must either click on the folders themselves or on
the <+/-> signs at the left-hand side of the folders.
Adding a new scenario:
We'll now work through adding a complete new scenario to the database in order to
illustrate the use of the editor. To do this:
Create all the files which are required for the scenario and place them in the
'ScenarioData' folder (refer to the section entitled 'Scenarios - Creating Resources'
for a description of the technique).
Start the system in <Maintenance Mode>.
Click <System> <Scenario Editor>.
In the <Folder Navigator> window:
Click on the <+> sign by the side of the drive which contains the application.
Keep on clicking on the <+> signs until you reach the <ScenarioData> folder and its
contents are visible to you.
Click on the file 'MSEScenario.mdb' to select it.
Right mouse button click this file to open it in the database editor.
The database should now appear in the <Database Editor> window (as in the figure
© 2010 MSE (Australia) PL
78
ECMO Simulation User Manual (v5.7)
above.). In the <Database Editor> window:
Click on the 'MSEScenario.mdb' folder. An <Add a new scenario?> dialog box will
appear.
In the <Scenario Title> field enter something like 'Test'.
Move the cursor to the <File Name> field.
Click on a 'pat' file in the left-hand window (eg 'Normal Patient.pat'). This file name
should appear in the <File Name> field of the <Add a new scenario?> dialog box.
Click <Save>.
At this stage, a new folder names <Test> should appear in the database tree of the
right-hand window. You have successfully created a new scenario which contains
physiological data, but does not yet include any Clinical Notes, Investigations or
Resources.
To add Clinical Notes:
Click on the <+> sign to the left of the <Test> folder.
Click on the <Clinical Notes> folder itself. An <Add Clinical Notes?> dialog box will
appear.
Move the cursor to the <File Name> field.
Click on a 'pdf' file in the left-hand window (eg 'Getting Started.pdf'). This file name
should appear in the <File Name> field of the <Add Clinical Notes?> dialog box.
Click <Save>.
The clinical notes which are contained in the folder 'Getting Started.pdf' should now be
visible in the <Clinical Notes> folder.
To add Investigations and Resources, go through a similar process to that described for
the addition of 'Clinical Notes'.
Finally, click the <Save & Exit> button to commit the changes to the database and then
click <System><Exit> to shut down <Maintenance Mode>.
Start the Main Application in <Unsupervised Mode> and click on <Tools><Load
Scenario> and confirm that a new scenario named <Test> is now available.
Adding a new investigation to an existing scenario:
To add a single item (for example a pre-operative 12-lead ECG) to an existing
scenario, take the following steps:
Make an electronic copy of the 12-lead ECG that you wish to include. The copy must
be in 'jpg' or 'pdf' format and should have a width of <= 800 pixels and a height of <=
1000 pixels.
Place a copy of the file in the 'ScenarioData' folder.
Start the system in <Maintenance Mode>.
Click <System> <Scenario Editor>.
Navigate to the 'ScenarioData' folder in the <Folder Navigator> window.
Click on the file 'MSEScenario.mdb' to select it.
Right mouse button click this file to open it in the database editor.
In the right-hand <Database Editor> window:
© 2010 MSE (Australia) PL
Scenarios
79
Navigate to the scenario in which the addition is to be made.
Click on the <+> sign to expand the scenario.
Click on the <Investigations> folder itself.
An <Add an Investigation> dialog window should now appear.
Select the item which you want to add as an investigation from the <Folder Navigator>
window.
This item should appear as the <File Name> in the dialog window.
Add a short description of the investigation in the <Investigation Title> field (eg
Preoperative ECG).
Click <Save>.
Click <Save & Exit>.
Click <System><Exit>
6.5
Scenarios - Required Files
The <Scenario Editor> provides you with two tools for helping you ensure that all your
necessary scenario files are in the 'ScenarioData' folder.
To use the tools you must first, in the <Folder Navigator> window, navigate to the
scenario database file ('MSEScenario.mdb') which you are currently using . Now,
double click on this file. The database file will appear in the <Database Editor> window
and two buttons will appear below this window.
<Required> Button:
Clicking the <Required> button will list all files which are required by the database in a
<Data File List> window.
<Missing> Button:
Clicking the <Missing> button will list all files which are required by the database, but
which cannot be found in the 'ScenarioData' folder, in a <Data File List> window.
An example of a <Data File List> window is shown below.
The <Data File List> window is 'modal' - which is to say that it must be closed
with the <Close> button before any other activities can be undertaken.
© 2010 MSE (Australia) PL
80
6.6
ECMO Simulation User Manual (v5.7)
Scenarios - Changing the data source
The 'ScenarioData' folder which, by default, is in the executable directory, can be moved
to another location on the network. If this is done, the system must be made aware of the
new location. To do this:
Start the application in <Maintenance Mode>.
Click <System><Scenario Data Source>.
Navigate to the folder's location in the browsing dialog.
Highlight the folder.
Click <OK>.
Click <System><Exit>.
Restart the application in <Supervised> or <Unsupervised> mode.
© 2010 MSE (Australia) PL
Scenarios
6.7
81
Scenarios - Database Structure
The scenario database is contained within a Microsoft 'Access' database named
'MSEScenario.mdb' and can be found in the 'ScenarioData' folder in the executable
directory.
The basis structure of a scenario is shown below.
© 2010 MSE (Australia) PL
82
ECMO Simulation User Manual (v5.7)
In the example, The ECMO tutorial scenario consists of:
A set of 'Clinical Notes' contained in the document 'ECMO Tutorial 1.pdf';
A single investigation (Chest X-Ray 'ARDS_X-Ray.jpg' in 'jpg' format) and
Six 'resources' in either 'jpg' or 'pdf' format.
6.8
Scenarios - ECG Editor
The ECG database editor can be accessed from the <System><ECG Editor> menu in
the main environment when running in <Maintenance Mode>. The editor is not available
in the Evaluation Version.The user interface of the editor is shown below.
© 2010 MSE (Australia) PL
Scenarios
83
In order to use the editor take the following steps:
Start the system in <Maintenance Mode>.
Click <System><ECG Editor>.
Click the <+> button in the database navigator at the top of the window.
Enter a new name for the rhythm in the <Pattern> box at the top-right of the window.
Adjust the Beta, Alpha and Theta values to produce the morphology you want.
Click <Save & Exit> to store the profile.
The new profile will be available to the supervisory application when the system is next
run.
When creating new patterns, it is essential that the profile start and finish on or close to
the zero line. Refer to the work of McSharry et al for an explanation of the significance of
the Beta, Alpha and Theta parameters. If you generate a completely unsatisfactory
profile, click the <Reset> button to restore a semblance of normality.
Existing patterns can also be edited by accessing them using the database navigator
buttons at the top of the window.
By default, the available ECG patterns are:
Normal Sinus Rhythm
Ventricular Fibrillation
Asystole
Ventricular Ectopy
© 2010 MSE (Australia) PL
84
ECMO Simulation User Manual (v5.7)
Deep Q wave
Bundle Branch Block
Peaked T wave
ST elevation +
ST elevation ++
ST elevation +++
ST Depression
Nodal rhythm
References:
McSharry PE, Clifford GD, Tarassenko L, Smith LA.A dynamical model for generating
synthetic electrocardiogram signals. IEEE Trans Biomed Eng. 2003 Mar;50(3):289-94.
© 2010 MSE (Australia) PL
Part
VII
86
ECMO Simulation User Manual (v5.7)
7
Tutorials
7.1
Scope Of Tutorials
The system comes with a series of ten pre-loaded tutorials which are intended to
familiarize the user with the simulation system and to explore the techniques and
problems associated with the use of VV- and VA- ECMO.
The learning objectives contained in each tutorial are summarized in the following table:
Tutorial
7.2
Objectives
Getting Started
To become familiarized with the basic elements of the MSE
simulation environment.
VV ECMO (1)
To understand the design of a basic veno-venous ECMO circuit.
To become familiarized with the basic controls of a VV ECMO
system.
To become familiarized with the basic behaviour of a centrifugal
pump.
VV ECMO (2)
To investigate the effect of cannula position on ECMO system
performance.
To investigate the effect of temperature control on metabolic
rate (and oxygenation).
VV ECMO (3)
To examine the impact of return cannula size on ECMO system
performance.
VV ECMO (4)
To understand the impact of obstruction of the inlet or outlet line
on ECMO system performance.
VA ECMO (1)
To understand the design of a simple veno-arterial ECMO
circuit.
To become familiarized with the basic controls of a VA ECMO
system.
To understand the mechanism of ‘Differential Hypoxia’.
VA ECMO (2)
To explore the cardiovascular effects of VA ECMO in a patient
with cardiogenic shock.
VA ECMO (3)
To recognise the signs of oxygenator gas supply failure.
VA ECMO (4)
To recognise the signs of oxygenator failure.
Getting Started
Conventions:
In the early tutorials, essential mouse or keyboard input is indicated by a mouse icon.
Computer controls, items or windows are referred to in the text between ‘Less than’
© 2010 MSE (Australia) PL
Tutorials
87
and ‘Greater than’ symbols.
The terms ‘Click’ and ‘Select’ refers to usage of the left mouse button.
The tutorials are all viewable by clicking the <Notes> menu item of the <Inspector>
window, however, it’s a good idea to print off the first few tutorials and work through
them from a hard copy (In order to reduce constant switching between the various
functions of the <Inspector> window).
‘Unsupervised’ tutorials (like this one) are designed to be run as ‘stand alone’
applications, whereas, ‘Supervised’ tutorials require input from the supervisory
application and cannot be run in isolation.
The supervisory status of the tutorial is indicated at the top left-hand corner of the first
page of the tutorial.
Okay, let’s get started.
The learning objective of this tutorial is to become familiarized with the basic elements
of the MSE simulation environment.
Click on the <Start> <All Programs> <MSE ECMO Simulator > <MSE
ECMO> menu item of the desktop.
You will be given the opportunity to start the application in one of three modes:
1. Unsupervised Simulation Mode
2. Supervised Simulation Mode
3. Maintenance Mode
Select <Unsupervised Simulation Mode> (the default selection) and click the
<Start> button.
The system's three primary windows will appear. At the left-hand side of the screen is
the <Inspector> window, to the right-hand side is the <Patient Monitor> and below this is
the <Therapeutic Interface>.
Inspector Window:
The <Inspector> window is used to display textual or audio-visual information relating to
the scenario and to allow the user to manipulate the virtual devices which can be used in
the treatment of the patient.
Click the <Notes> menu item in the <Inspector> window.
The notes are normally used to outline the clinical history and findings of the patient in
the current scenario. If more than one page is available, use the <Next> and <Prev>
menu options of this window to navigate to other pages within the notes. In this instance,
we have used the <Notes> to describe the conduct of the tutorial rather than to present
the clinical picture of the patient.
© 2010 MSE (Australia) PL
88
ECMO Simulation User Manual (v5.7)
Click the < Investigations > menu item in the <Inspector> window.
The <Investigations> menu item lists the investigations which are currently available for
the patient. (Oxygenator Blood Gas Analysis is only available if an ECMO system is in
use.)
Click the <Investigations><Arterial Blood Gas Analysis> menu item in the <
Investigations > list.
The <Arterial Blood Gas Analysis> menu item displays the patient’s current blood
gases and stores them as a blood gas report in the installation directory of the
application.
Click the < Devices > menu item in the <Inspector> window.
The <Devices> menu item is used to visualise any of the 6 devices which are available
to the user. These devices are a:
Ventilator,
VV or VA ECMO System,
ACT Monitor,
Nerve Stimulator,
Defibrillator and
Stethoscope.
Click the <Devices><Nerve Stimulator> menu item in the <Inspector>
window.
Clicking on the <Devices><Nerve Stimulator> menu item displays the nerve stimulator.
Click the <TOF > button in the < Nerve Stimulator > window.
Clicking on the <TOF> button stimulates the ulnar nerve with a supramaximal, 0.5Hz
‘Train of Four’ and produces contraction of Adductor Pollicis (unless a muscle relaxant
has been administered).
Click the <Resources > menu item in the <Inspector> window.
The <Resources> menu item lists the resources which are available for the current
scenario. These resources can include: documents, videos, still images or websites.
© 2010 MSE (Australia) PL
Tutorials
89
Click the <Resources ><ELSO Homepage> menu item in the <Inspector>
window.
This will take you to the ELSO website.
Click the <Help><Help Manual> menu item in the <Inspector> window.
The <Help Manual> opens a navigable version of the system’s user manual. If you want
to reposition the <Inspector> window, place the mouse at the top right-hand corner of
the window's title bar and drag it while holding down the left mouse button. The position
of the window will be retained when you next start the application. Refer to the section
entitled ‘Inspector' in the user manual for a complete description of the functionality of
this window.
Patient Monitor:
The <Patient Monitor> is based on a modern physiological monitor and is used to
display the patient's current vital signs. The patient who has been selected for this
scenario is essentially normal.
Click the < Display > button in the < Patient Monitor > window.
Clicking the <Display> button on the Patient Monitor allows you to select the parameters
which you want to view.
Check <ECG>, <Direct Arterial Pressure> and <Central Venous Pressure>
in the <Display> window.
Click the < Display > button in the < Patient Monitor > window.
The <Display> window will now close, and the ECG, Direct Arterial Pressure and
Central Venous Pressure waveforms will be displayed in the <Patient Monitor> window.
The parameters which can be displayed include:
ECG,
NIBP,
Direct Arterial Pressure
Central Venous Pressure,
SaO2,
SaO2 waveform,
BIS,
Temperature,
© 2010 MSE (Australia) PL
90
ECMO Simulation User Manual (v5.7)
Capnographic Waveform and
Inspired and Expired Gas values.
If you want to reposition the <Patient Monitor>, place the mouse at the top right-hand
corner of the monitor and drag it while holding down the left mouse button. The position
of the window will be retained when you next start the application. Refer to the section
entitled 'Patient Monitor' in the user manual for a complete description of the
functionality of this window.
Therapeutic Interface:
The <Therapeutic Interface> window is used to administer drugs and or fluids to the
patient. The interface has four 'tabbed' pages:
Bolus Drug,
Infusion Drug,
Fluids and
History.
To explore the effect of giving adrenalin to a normal patient:
Click the <Bolus Drug > tab in the <Therapeutic Interface> window.
Select <Adrenalin (100 mcg/ml)> from the list.
A new window will appear.
Slide the green slider until a dose of ~ 50 micrograms is indicated.
Click the <Give> button.
Observe the effect of the drug on heart rate, blood pressure and ectopic activity over the
ensuing minutes.
Click on the <History> tab in the <Therapeutic Interface> window.
Clicking on the <History> tab allows you to review details of all of your therapeutic
interventions. If you want to reposition the <Therapeutic Interface>, place the mouse at
the top right-hand corner of the window and drag it while holding down the left mouse
button. The position of the window will be retained when you next start the application.
Refer to the section entitled ‘Therapeutic Interface' in the user manual for a complete
description of the functionality of this window.
© 2010 MSE (Australia) PL
Tutorials
91
Click on the <View> menu item of the main window.
The three primary windows will be listed as menu items. Checking or unchecking any of
these items will turn on or off their visibility.
Click on the <Tools> menu item of the main window.
Two menu items (<Load Scenario> and <Load Patient>) and will now appear. Selecting
a new scenario from the list of available scenarios will load a new patient together with a
completely new set of clinical notes, investigations and resources. In contrast, selecting
a new patient from the list of available patients will load a patient with a different pathophysiological state, but the notes, investigations and resources will remain unchanged.
Finally, to close the system down:
Click on the <System><Exit> menu item of the main window.
7.3
VV ECMO (1)
Some of the manoeuvres undertaken in this tutorial generate extreme circuit
pressures and are only intended to demonstrate the performance
characteristics of the system. They should not be employed under clinical
conditions.
In this simulation, we’ll explore the fundamental characteristics of a modern centrifugal
pump - which can be used in either a veno-venous (VV) or veno-arterial (VA) ExtraCorporeal Membrane Oxygenation (ECMO) system.
The learning objectives of the session are:
To understand the design of a basic veno-venous ECMO circuit.
To become familiarized with the basic controls of an ECMO system.
To become familiarized with the basic behaviour of a centrifugal pump.
We will be simulating the use of a system in a patient with essentially normal
cardiovascular function, but with severe respiratory failure. The patient is a 24 year-old
man, weighing 75 kgs, who has been transferred to your Intensive Care Unit for VenoVenous ECMO. He had been admitted to the Intensive Care Unit of a large regional
hospital 3 days before transfer to your institution. At that time, he presented a four day
history of increasing respiratory distress, fever and a productive cough. The patient had
been sedated, intubated and ventilated shortly after admission to the regional ICU.
Blood and sputum cultures grew a methicillin-sensitive staphylococcus aureus. Despite
treatment with appropriate antibiotics, the use of prone ventilation, permissive
hypercarbia and inhaled nitric oxide, he continued to deteriorate. Following discussions
with the clinicians at the regional hospital, he has been transferred to your institution for
initiation of veno-venous ECMO. On arrival in your ICU the patient is being given
assisted ventilation (via an ‘Ambu’ © bag) on 100% oxygen.
© 2010 MSE (Australia) PL
92
ECMO Simulation User Manual (v5.7)
Blood gas analysis is reported as:
PaO2
45 mm Hg
PaCO2
44 mm Hg
pH
7.3
BXS
- 3.5
Temp
37.0
SaO2
74%
The patient has an Acute Lung Injury Score (‘Murray Score’) of 3.5 but has no other
significant co-morbidities. He has a Haemoglobin of ~ 12 gm/dL and you estimate his
‘shunt fraction’ (Qs/Qt) to be about 65%. The results of some ancillary investigations
(Echo, CXR and ECG) are also available.
Click the <Investigations> <TG SAX> in the <Inspector> window.
We’ll start the tutorial by connecting the patient to our monitoring system and putting him
on a ventilator.
Click the <Display> button in the <Patient Monitor> window.
Clicking the <Display> button on the Patient Monitor allows you to select the parameters
which you want to view.
Check <ECG>, <Direct Arterial Pressure>, <Central Venous Pressure> and
<SaO2> in the <Display> window.
Click the <Display> button in the <Patient Monitor> window.
The <Display> window will now close, and the ECG, Direct Arterial Pressure, Central
Venous Pressure and SaO2 signals will be displayed in the <Patient Monitor> window.
As you can see, the patient is profoundly hypoxic (SaO2 ~ 70%) and is having frequent
ventricular ectopic beats.
To ventilate the patient:
Click the <Devices><Ventilator> menu item in the <Inspector> window.
The ventilator should now appear in the <Inspector> window (Figure 1).
Figure 1.
© 2010 MSE (Australia) PL
Tutorials
93
Turn the ventilator on by clicking the power switch at the top right-hand side
of the device. Set the tidal volume (Vt) to 500 mls, the rate to 12 bpm, the
FiO2 to 100% and the PEEP to 5 cms H2O.
**Note that the ventilator’s controls are not enabled until the ventilator is turned <on>.
The ventilator is based on a simple anaesthesia system which is in ‘Intermittent
Mandatory Ventilation’ (IMV) mode. At this time, the pressure, flow and volume signals
appear somewhat chaotic (because the patient is also breathing spontaneously). If any
of the signal traces appear discontinuous, adjust the gain of the appropriate signal
channel using the green arrows at the right-hand side of the display. Also note that the
peak airway pressure is very high (~ 35 cms H2O) - because the patient has a very low
static lung compliance ( < 20 mls / cm H2O).
Stop the patient 'fighting' the ventilator by controlling his ventilation. To do this:
Click <Bolus Drug><Pancuronium (2mg/ml)>in the <Therapeutic Interface>
window.
Drag the green slider until it says ~ 8 mgs and click the <Give> button.
If you wish to monitor the onset of muscle paralysis by monitoring his ‘Train of Four’:
Click the <Devices><Nerve Stimulator> menu item in the <Inspector>
window.
Click the <TOF> button on the nerve stimulator itself.
© 2010 MSE (Australia) PL
94
ECMO Simulation User Manual (v5.7)
In order to assess the patient’s gas exchange:
Click the <Display> button in the <Patient Monitor> window.
Check < Capnography > and < Gases > in the <Display> window.
Click the <Display> button in the <Patient Monitor> window.
And perform a baseline blood gas analysis:
Click <Investigations><Arterial Blood Gas Analysis> in the <Inspector>
window.
You may also wish to paralyse the patient and control his ventilation. To do this:
Click <Bolus Drug><Pancuronium (2mg/ml)>in the <Therapeutic Interface>
window.
Drag the green slider until it says ~ 8 mgs and click the <Give> button.
If you wish to monitor the onset of muscle paralysis by monitoring his ‘Train of Four’:
Click the <Devices><Nerve Stimulator> menu item in the <Inspector>
window.
Click the <TOF> button on the nerve stimulator itself.
Sedation may be administered by selecting the appropriate bolus or infusion drugs
using the <Therapeutic Interface> and monitoring the depth of sedation by turning on the
<BIS> display on the physiological monitor.
You elect to cannulate the patient percutaneously via the right internal jugular and
femoral veins using the Seldinger technique and ultrasonic guidance.
Imagine now that you have:
Placed the Seldinger wires,
Given the patient 7500 units of heparin (Select <Heparin> from the <Therapeutic
Interface> <Bolus Drug> page and <Give> 7500 units) and
Positioned the cannulae under ultrasonic control.
The cannulae are connected to the ECMO system. The entire system is heparin-coated.
Active venous drainage from the inferior vena cava is via a 24F femoral cannula and
‘arterialised’ return to the right atrium via a 21F Internal Jugular cannula. The system’s
centrifugal pump is responsible both for generating the negative pressure which is
required to facilitate drainage and the positive pressure which is required to pump
blood through the artificial lung and back into the patient. The pump head and
oxygenator are integrated into a single, disposable unit which is mounted on the system
console.
© 2010 MSE (Australia) PL
Tutorials
95
Before commencing ECMO you may wish to confirm that the patient is effectively anticoagulated. Select <Devices><ACT Monitor> and click <Start> in order to commence
the measurement. The ECMO circuit we’ll be using is shown in Figure 2. We’re actively
draining (sucking) blood from a point in the inferior vena cava just below the diaphragm,
pumping it through the oxygenator and returning it via the superior vena cava to the right
atrium.
Figure 2.
In essence, what we’re trying to do when we put a patient on VV ECMO, is to ‘capture’
as large a proportion of his venous return as we can and pump it through an artificial
lung where carbon dioxide will be removed and oxygen added. This oxygenated blood
is then pumped back into the circulation close to the tricuspid valve, from where it flows
into the right ventricle and through the patient’s own lungs. In theory, if we can capture
the patient’s entire venous return, his native lung will have no need to participate in gas
exchange at all and so can be completely ‘rested’ (not ventilated) - in order to permit
healing to occur.
To visualize the interface of the ECMO system itself:
Click <Devices> <ECMO System> in the <Inspector> window.
The key components of the interface are shown in Figure 3.
Figure 3.
© 2010 MSE (Australia) PL
96
ECMO Simulation User Manual (v5.7)
To the left of the interface are three controls which control respectively the inspired
oxygen concentration (%) of gas flowing through the oxygenator; the gas flow rate (lpm)
to the oxygenator; and the temperature setting control (Co) for the heater: cooler. In the
context of VV ECMO, the FiO2 control should always be set at 100%. The gas flow rate
control is used to control CO2 elimination (the higher the gas flow rate, the greater the
rate of CO2 clearance). The heater: cooler can be used to vary the patient’s
temperature (and metabolic rate). Between these three controls and the data display
area is the electronic clamp which controls flow through the outlet (‘Arterial’) side of the
pump. When the slider is at the bottom, the clamp is fully closed, when at the top, fully
open.
The data display area displays the current values of:
Blood flow through the system in lpm,
Circuit pressure measured at a point between the pump head and the oxygenator,
Venous oxygen saturation,
Pump speed in rpm,
Haematocrit and
Blood Temperature.
To the right of the display area are four controls.
The main power switch enables the flow control knob which is situated just beneath it.
© 2010 MSE (Australia) PL
Tutorials
97
The flow control is used to adjust the speed of the centrifugal pump in the range 0 –
5000 rpm.
The <Adjust Cannula> button allows you to move the drainage cannula(e) in or out and
to select size of your return cannula.
Finally, the <Mode> button is used to set the system up for either VV or VA ECMO.
**Note that the flow control is not enabled until the ECMO system is turned <On>.
Additional information regarding the ECMO system can be found by clicking on the
<Resources> menu of the <Inspector> window and selecting the resource which you
want to view. These resources include lectures on ECMO, images of various systems,
relevant websites and various descriptions and protocols relating to the technique.
Before commencing VV ECMO you may wish to confirm that the patient is effectively
anti-coagulated:
Select <Devices><ACT Monitor> and click <Start> in order to commence
the measurement.
If you do this, you’ll need to click <Devices><ECMO System> to return to the ECMO
interface. (You can periodically return to the ACT Monitor to check on the progress of
the estimation).
If you decide that you need to give more Heparin:
Select <View><Therapeutic Interface> from the main menu. When the <Therapeutic
Interface> window has opened, select <Heparin> as a bolus drug and give an
appropriate dose.
In the first part of the tutorial, we’re going to turn on the pump and examine its behaviour
when confronted with an excessive afterload.
Click the power switch of the ECMO system and slowly rotate the flow
control clockwise.
In the display area, note how the pump speed and circuit pressure both increase, but
that no other parameters change. Eventually, at 5000 rpm you should see a circuit
pressure of about 750 mm Hg. So what’s going on here? - Well, we’re running the pump
with the outlet line fully clamped. As we increase the rpm, so we increase the total
energy delivered to the system – but, because the blood can’t go anywhere, the
pressure within the pump head (‘stagnation pressure’) progressively rises. This is
characteristic behaviour for a (non-occlusive) centrifugal pump and can be contrasted
with the behaviour of volumetric ‘roller’ pumps which are commonly used during routine
cardio-pulmonary bypass.
Figure 4.
© 2010 MSE (Australia) PL
98
ECMO Simulation User Manual (v5.7)
The relationship between this ‘stagnation pressure’ and RPM is shown in Figure 4 where the black line represents the behaviour of the simulator’s centrifugal pump and
the red triangles the stagnation pressures of a modern ECMO system (Maquet
CardioHelp © ) at the various rpm’s.
Now let’s see what happens if we go through the same exercise, but with the outlet line
unclamped.
Before we do this, we’ll perform a baseline blood gas analysis:
Click <Investigations><Arterial Blood Gas Analysis>in the <Inspector>
window.
And return to the ECMO system:
Click <Devices> <ECMO System> in the <Inspector> window.
Now, turn the flow control back to zero and set a flow of oxygen of about 8 lpm. Fully
release the outlet clamp by sliding the clamp control to the top of the scale and slowly
increase the pump rpm to about 2250. This time, the response of the system is quite
different. In the data display area, note that the pressure increase is much smaller, that
blood is flowing through the system at about 3.4 lpm and that the SvO2 is rising. On the
patient monitor, there has been no great change in either CVP or arterial pressure, but
the saturation has risen, and the frequency of ectopy has fallen. If you now further
increase the rpm, you’ll see that both flow and pressure begin to fall progressively until
eventually (at about 4000 rpm) flow ceases completely. We’ll explore the reasons for
this in a future tutorial, but, for the moment, just note it and return the rpm to about 2250
© 2010 MSE (Australia) PL
Tutorials
99
so that flow is maximized.
Start the timer on the patient monitor:
Click the <Timer> button in the <Patient Monitor> window.
And, after five minutes, repeat the blood gas analysis. Compare the results with the
previous analysis. The salient differences are that:
The PaO2 is higher.
The SaO2 is higher.
The PaCO2 is markedly lower.
Note that we have successfully raised the PaO2 to a ‘safe’ level (~60 mm Hg) and that
the PaCO2 is now quite low. However, the PaO2, while improved, is hardly excessive.
These blood gas results (effective normalization of PaCO2 but with a lesser impact on
PaO2) are typical of patients undergoing VV ECMO. In future tutorials we’ll explore
ways of achieving a greater impact on arterial oxygenation in patients on ECMO.
Now let’s experiment with the effect of changing the gas flow rate through the
oxygenator. Leave the rpm unchanged, but reduce the gas flow rate from 8 lpm to 1 lpm
and re-start the timer (by clicking it twice). After five minutes, repeat the blood gas
analysis and note how the PaCO2 has risen markedly, but with little change in PaO2.
Thus we can see that we use the gas flow rate through the oxygenator to control the
patient’s PaCO2.
In the final part of this tutorial we’ll explore the effect of reducing the blood flow through
the oxygenator. We’ll do this by progressively clamping the outlet line. (This is not the
way in which we would normally achieve this, but it will also allow us to illustrate another
feature of the behaviour of centrifugal pumps.)
Whilst leaving the rpm unchanged, slowly clamp the outlet by moving the slider
downwards over the course of a few minutes. Note how the flow decreases while the
driving pressure increases until eventually the stagnation pressure (of about 150 mm
Hg) is achieved and flow ceases completely.
By progressively applying the clamp we are effectively converting the kinetic energy of
the moving blood to static (potential) energy. At the same time, if you look at the patient
monitor, the saturation will have fallen and the heart rate and incidence of ectopy will
have increased. If we repeat the blood gas analysis we will see that, once again, PaO2
has dropped. Thus we can see that blood flow through the oxygenator is an important
determinant of arterial oxygenation.
The observation that the kinetic and static energies of a fluid were ‘interchangeable’ and
that the total energy of a fluid could be considered as the sum of its kinetic and static
components was first described by Daniel Bernoulli in 1738. It is the cause of the
‘afterload dependence’ of centrifugal pumping systems and is the explanation of the
flow variability which is seen in some clinical situations. It can be contrasted with the
behaviour of volumetric (‘Roller’) pumping systems which are widely used during routine
cardio-pulmonary bypass.
In summary, we have now explored some of the features of a modern VV ECMO circuit
and have experimented with the basic controls of such a system. The impact of VV
ECMO on oxygen and carbon dioxide exchange in a patient with severe respiratory
© 2010 MSE (Australia) PL
100
ECMO Simulation User Manual (v5.7)
failure has been demonstrated. We have shown that we can control the patient’s arterial
oxygenation by varying the blood flow through the system and the patient’s PaCO2 by
varying the gas flow through the system. We can formulate these observations as two
‘rules’:
PaO2 is proportional to ECMO Blood Flow.
PaCO2 is proportional to ECMO Gas Flow.
In future tutorials we’ll examine the determinants of oxygen transfer in much more detail,
explore the effect of adjusting cannula position, characterize the impact of using dual
drainage cannulae and learn to identify clinical problems including re-circulation and
caval collapse.
7.4
VV ECMO (2)
Some of the manoeuvres undertaken in this tutorial generate extreme circuit
pressures and are only intended to demonstrate the performance
characteristics of the system. They should not be employed under clinical
conditions.
In this simulation, we’ll continue to explore the characteristics of a Veno-Venous ExtraCorporeal Membrane Oxygenation (VV ECMO) system.
The learning objectives of the session are to investigate:
The effect of cannula position on ECMO system performance.
The effect of temperature control on metabolic rate (and oxygenation).
We will be simulating the use of a system in a patient with essentially normal
cardiovascular function, but with severe respiratory failure. The patient is a 24 year-old
man, weighing 75 kgs, who has been transferred to your Intensive Care Unit for VenoVenous ECMO. He had been admitted to the Intensive Care Unit of a large regional
hospital 3 days before transfer to your institution. At that time, he presented a four day
history of increasing respiratory distress, fever and a productive cough. The patient had
been sedated, intubated and ventilated shortly after admission to the regional ICU.
Blood and sputum cultures grew a methicillin-sensitive staphylococcus aureus. Despite
treatment with appropriate antibiotics, the use of prone ventilation, permissive
hypercarbia and inhaled nitric oxide, he continued to deteriorate. Following discussions
with the clinicians at the regional hospital, he has been transferred to your institution for
initiation of veno-venous ECMO. On arrival in your ICU the patient is being given
assisted ventilation (via an ‘Ambu’ © bag) on 100% oxygen.
Blood gas analysis is reported as:
PaO2
43 mm Hg
PaCO2
41 mm Hg
pH
7.35
BXS
-1.0
Temp
37.0
© 2010 MSE (Australia) PL
Tutorials
SaO2
101
68%
The patient has an Acute Lung Injury Score (‘Murray Score’) of 3.5 but has no other
significant co-morbidities. He has a Haemoglobin of ~ 12 gm/dL and you estimate his
‘shunt fraction’ (Qs/Qt) to be about 65%. The results of some ancillary investigations
(Echo, CXR and ECG) are also available.
We’ll start the tutorial by connecting the patient to our monitoring system and putting him
on a ventilator.
To do this:
Click the <Display> button in the <Patient Monitor> window.
Check <ECG>, <Direct Arterial Pressure>, <Central Venous Pressure> and <SaO2
and
Click the <Display> button again to close this window and display the physiological
signals.
As you can see, the patient is profoundly hypoxic (SaO2 ~ 70%) and is having frequent
ventricular ectopic beats.
To ventilate the patient:
Click the <Devices><Ventilator> menu item in the <Inspector> window.
The ventilator should now appear in the <Inspector> window.
Turn the ventilator on by:
Clicking the power switch at the top right-hand side of the device, and then
Set the tidal volume(Vt) to 500 mls, the rate to 10 bpm, the FiO2 to 100% and the
PEEP to 5 cms H2O.
**Note that the ventilator’s controls are not enabled until the ventilator is turned <On>.
The ventilator is based on a simple anaesthesia system which is in ‘Intermittent
Mandatory Ventilation’ (IMV) mode. Because the patient is still breathing spontaneously,
the flow, pressure and volume traces appear somewhat disorganised.
In order to fix this, you may wish to control the patient's ventilation. To do this:
Click <Bolus Drug><Pancuronium (2mg/ml)>in the <Therapeutic Interface> window.
Drag the green slider until it says ~ 8 mgs and click the <Give> button.
If you wish to monitor the onset of muscle paralysis by monitoring his ‘Train of Four’:
Click the <Devices><Nerve Stimulator> menu item in the <Inspector> window.
Click the <TOF> button on the nerve stimulator itself.
Sedation may be administered by selecting the appropriate bolus or infusion drugs
using the <Therapeutic Interface> and monitoring the depth of sedation by turning on the
<BIS> display on the physiological monitor.
In order to assess the patient’s gas exchange you may want to turn on the gas analyser:
Click the <Display> button in the <Patient Monitor> window.
Check < Capnography > and < Gases > in the <Display> window.
© 2010 MSE (Australia) PL
102
ECMO Simulation User Manual (v5.7)
Click the <Display> button again to close this window and display the additional
signals.
And perform a baseline blood gas analysis:
Click <Investigations><Arterial Blood Gas Analysis>in the <Inspector> window.
You elect to cannulate the patient percutaneously via the right internal jugular and
femoral veins using the Seldinger technique and ultrasonic guidance.
Imagine now that you have:
Placed the Seldinger wires,
Given the patient 7500 units of heparin (Select <Heparin> from the <Therapeutic
Interface> <Bolus Drug> page and <Give> 7500 units) and
Positioned the cannulae under ultrasonic control.
The cannulae are connected to the ECMO system. The entire system is heparin-coated.
Active venous drainage from the inferior vena cava (IVC) is via a 24F femoral cannula
and ‘arterialised’ return to the right atrium via a 21F Internal Jugular cannula. The
system’s centrifugal pump is responsible both for generating the negative pressure
which is required to facilitate drainage and the positive pressure which is required to
pump blood through the artificial lung and back into the patient. The pump head and
oxygenator are integrated into a single, disposable unit which is mounted on the system
console.
Figure 1.
© 2010 MSE (Australia) PL
Tutorials
103
Before commencing ECMO you may wish to confirm that the patient is effectively anticoagulated:
Select <Devices><ACT Monitor> and
Click <Start> in order to commence the measurement.
The ECMO circuit we’ll be using is shown in Figure 1. We’re actively draining (sucking)
blood from a point in the inferior vena cava just below the diaphragm, pumping it through
the oxygenator and returning it via the superior vena cava to the right atrium. Additional
information regarding the ECMO system can be found by clicking on the <Resources>
menu of the <Inspector> window and selecting the resource which you want to view.
These resources include lectures on ECMO, images of various systems, relevant
websites and various descriptions and protocols relating to the technique.
To visualize the interface of the ECMO system itself:
Click <Devices> <ECMO System> in the <Inspector> window.
We’re going to start by initiating ECMO with a single drainage cannula positioned in the
infra-hepatic region of the IVC and a single (21F), correctly positioned, return cannula.
To initiate VV ECMO:
Turn the ECMO power switch <On>.
Set a flow of oxygen of about 6 lpm.
© 2010 MSE (Australia) PL
104
ECMO Simulation User Manual (v5.7)
Set an inspired oxygen concentration of 100%.
Fully release the outlet clamp by sliding the clamp control to the top of the scale and
Slowly increase the pump rpm until the maximum blood flow rate (of ~3.4 lpm) is
reached.
**Note that if the rpm continue to be increased after 3.4 lpm is reached, flow
progressively declines until eventually, it ceases altogether.
This plateauing (and subsequent decline) of ECMO blood flow with increasing rpm is
known as ‘Inflow Limitation’. – Remember that the centrifugal pump is generating a
positive pressure on its outlet side and a negative pressure on its inlet (drainage) side.
In this case, because the central venous pressure is relatively low and the wall of the IVC
is quite close to the drainage cannula, the wall gets ‘sucked’ onto the cannula drainage
ports and begins to limit inflow. As the rpm are further increased, more and more cava
is sucked onto the cannula until eventually drainage ceases altogether, and no forward
flow is generated at all. After five minutes, you’ll see that the arterial saturation has risen
to about 87% and that the end-tidal CO2 has fallen quite markedly. Repeat the <Arterial
Blood Gas Analysis> and note that the patient is now mildly hypocarbic and that the
PaO2 has risen to ~ 55 mm Hg, but is still not great. – Clearly, we’ve made some
progress, but we’re not yet in control.
In this situation, there are a few things which we can do in an attempt to improve
oxygenation. These include:
Ensuring that the patient’s metabolic rate (and oxygen consumption) is kept low, and
Ensuring that we have optimal venous drainage into the ECMO system.
If you check the patient’s temperature (<Display><Temperature>), you’ll see that he is
pyrexial. We can correct this by cooling the patient using the ECMO system.
To do this:
Adjust the <HC Temp> control to <33C> on the ECMO device.
Ensuring optimal venous drainage is important, because we want to pass as great a
proportion as possible of the patient’s venous return through the ECMO system.
(Theoretically, if we are able to ‘capture’ all of this return and oxygenate and remove
carbon dioxide from it, there would be no need for the patient’s native lung to make any
contribution at all to gas exchange, and the native lung could be completely ‘rested’ in
order to allow healing to occur.) Ideally, we need to drain blood separately from the
Superior Vena Cava (SVC) and IVC blood using separate cannulae and we’ll explore
the effect of using dual drainage cannulae in a future tutorial. However, for the moment,
we’ll stay with a single drainage cannula and explore the effect of advancing the cannula
up the IVC.
To do this:
Click the <Adjust Cannula> button.
Slide the blue slider at the left-hand side of the CXR to position ‘8’. (This will advance
the drainage cannula to the optimal position.)
Click <Devices> <ECMO System> in the <Inspector> window.
You should see that there has been a small increase in ECMO flow (from ~3.4 to ~ 4.0
lpm).
© 2010 MSE (Australia) PL
Tutorials
105
Apart from positioning the drainage cannula there are two other techniques which we
can use to increase venous return through the system. In particular, elevation of the CVP
(by transfusion or posture adjustment) and the use of dual cannulae should be
considered when confronted with this problem. So, at this stage in the exercise, we’ve
done two things in an attempt to improve oxygenation:
1. We’ve advanced the cannula further up the IVC and
2. We’ve cooled the patient in order to lower his oxygen consumption.
Given that the patient is mildly hypocarbic, we can also reduce his total ventilation. To
do this:
Reduce the gas flow to the oxygenator to 3.0 lpm,
Reduce his tidal volume to 200 mls and
Reduce the ventilatory frequency to 5 bpm.
After ten minutes or so, note that his saturation has risen further (to ~ 93%) and that his
temperature has fallen to ~ 35 C.
At this stage, a repeat blood gas analysis should show a PO2 of about 65 and a PCO2
of ~40.
The effect of temperature on metabolic rate has been studied by various authors. In this
simulator, the data of Kirklin et al has been used to determine the magnitude of the
effect. In Figure 2, the effect of temperature on oxygen consumption (VO2 ) in a patient
with a VO2 of 200 mls/min @ 37C is shown.
Figure 2.
© 2010 MSE (Australia) PL
106
ECMO Simulation User Manual (v5.7)
We can formulate the relationship between VO2 and temperature as a third ‘rule’ of
ECMO:
VO2 is proportional to Heater:Cooler Temperature.
The impact of changing the patient’s temperature on SaO2 is shown in Figure 3.
Figure 3.
© 2010 MSE (Australia) PL
Tutorials
107
In this case, I’ve taken a pyrexial patient (38.8C) on stable VV ECMO and, over a period
of ten minutes, cooled him by 5.0C. Note how the arterial saturation rises from ~ 91% to
~ 99%.
This concludes the exercise. In future tutorials we’ll examine the effect of using dual
drainage cannulae and changing the size of the return cannula on the efficacy of ECMO.
References:
Kirklin JW and Barratt-Boyes BG. 'Cardiac Surgery'. New York: Churchill Livingstone,
1993:61-127.
7.5
VV ECMO (3)
Some of the manoeuvres undertaken in this tutorial generate extreme circuit
pressures and are only intended to demonstrate the performance
characteristics of the system. They should not be employed under clinical
conditions.
In this simulation, we’ll continue to explore the characteristics of a Veno-Venous ExtraCorporeal Membrane Oxygenation (VV ECMO) system.
The learning objectives of the session are to investigate:
The impact of return cannula size on ECMO system performance.
We will be simulating the use of a system in a patient with essentially normal
© 2010 MSE (Australia) PL
108
ECMO Simulation User Manual (v5.7)
cardiovascular function, but with severe respiratory failure. The patient is a 24 year-old
man, weighing 75 kgs, who has been transferred to your Intensive Care Unit for VenoVenous ECMO.He had been admitted to the Intensive Care Unit of a large regional
hospital 3 days before transfer to your institution. At that time, he presented a four day
history of increasing respiratory distress, fever and a productive cough. The patient had
been sedated, intubated and ventilated shortly after admission to the regional ICU.
Blood and sputum cultures grew a methicillin-sensitive staphylococcus aureus. Despite
treatment with appropriate antibiotics, the use of prone ventilation, permissive
hypercarbia and inhaled nitric oxide, he continued to deteriorate. Following discussions
with the clinicians at the regional hospital, he has been transferred to your institution for
initiation of veno-venous ECMO. On arrival in your ICU the patient is being given
assisted ventilation (via an ‘Ambu’ © bag) on 100% oxygen.
Blood gas analysis is reported as:
PaO2
44 mm Hg
PaCO2
41 mm Hg
pH
7.34
BXS
-3.5
Temp
37.4
SaO2
73%
The patient has an Acute Lung Injury Score (‘Murray Score’) of 3.5 but has no other
significant co-morbidities. He has a Haemoglobin of ~ 12 gm/dL and you estimate his
‘shunt fraction’ (Qs/Qt) to be about 65%. The results of some ancillary investigations
(Echo, CXR and ECG) are also available.
We’ll assume that you have already worked your way through VV ECMO tutorials (1)
and (2), so we’ll quite quickly set up our monitoring:
Click the <Display> button in the <Patient Monitor> window.
Check <ECG>, <Direct Arterial Pressure>, <Central Venous Pressure> and <SaO2>
and
Click the <Display> button again to close this window and display the physiological
signals.
Ventilate the patient:
Click the <Devices><Ventilator> menu item in the <Inspector> window.
Click the power switch at the top right-hand side of the device.
Set the tidal volume(Vt) to 500 mls, the rate to 10 bpm, the FiO2 to 100% and the
PEEP to 5 cms H2O.
Paralyse the patient:
Click <Bolus Drug><Pancuronium (2mg/ml)>in the <Therapeutic Interface> window.
Drag the green slider until it says ~ 8 mgs and click the <Give> button.
And perform a baseline blood gas analysis:
Click <Investigations><Arterial Blood Gas Analysis>in the <Inspector> window.
You elect to cannulate the patient percutaneously via the right and left internal jugular
© 2010 MSE (Australia) PL
Tutorials
109
and right femoral veins using the Seldinger technique and ultrasonic guidance.
Imagine now that you have:
Placed the Seldinger wires,
Given the patient 7500 units of heparin (Select <Heparin> from the <Therapeutic
Interface> <Bolus Drug> page and <Give> 7500 units) and
Positioned the cannulae under ultrasonic control.
You are using the same ECMO system that is similar to that described in VV ECMO
Tutorials (1) and (2) – except that we are using two drainage cannulae. Active venous
drainage from the inferior vena cava (IVC) is via a 24F femoral cannula, drainage of the
SVC is via a right internal jugular cannula and ‘arterialised’ return to the right atrium via
a 21F left internal jugular cannula (Figure 1.).
Figure 1.
In this exercise, we’re only interested in the effect of changing the size of the return
cannula, so we’ll make sure that the venous drainage is absolutely optimal. To do this:
Switch to the ECMO system (Devices><ECMO System>).
Click <Adjust Cannula>.
Click <Dual Cannulation>.
Advance the SVC drainage cannula:
© 2010 MSE (Australia) PL
110
ECMO Simulation User Manual (v5.7)
Slide the top left-hand slider down to <2> and
Advance the IVC drainage cannula:
Slide the bottom left-hand slider up to <8>.
Switch back to the ECMO system (Devices><ECMO System>).
Turn on the <Main Power>.
Set a gas flow of <6> lpm.
Fully open the arterial clamp.
Increase the blood flow to <4.0> lpm.
Note the pre-membrane pressure (~130 mm Hg), and the rpm (~2375).
We’re now going to reduce the return cannula size from 21F to 15F. To do this:
Click <Adjust Cannula>.
Click <Cannula>.
Select <15F>.
Click <Save>.
Switch back to the ECMO system (Devices><ECMO System>).
Note that the blood flow has now fallen from ~ 4.0 lpm to ~ 2.9 lpm and the premembrane pressure has risen to (~150 mm Hg). To return the flow to 4.0 lpm you will
need to increase the rpm to ~3100 (and the pre-membrane pressure will rise to about
250 mm Hg as a result). Thus, we can see that the resistance of the 15F cannula is
much higher than that of the 21F cannula, and the ECMO pump has to work much
harder to achieve a flow rate of 4.0 lpm.
Now let’s examine the effect of increasing return cannula size. To do this:
Click <Adjust Cannula>.
Click <Cannula>.
Select <24F>.
Click <Save>.
Switch back to the ECMO system (Devices><ECMO System>).
Note that the blood flow has now increased to ~ 4.4 lpm and the pre-membrane
pressure has fallen to (~140 mm Hg). Return the flow to 4.0 lpm by decreasing the rpm
to ~2500 and note that the pre-membrane pressure falls further to 115 mm Hg.
Figure 2.
© 2010 MSE (Australia) PL
Tutorials
111
The pre-membrane pressure measurements for the complete range of cannulae at a
flow rate of 4.0 lpm are summarized in Figure 2. Note how the pre-membrane pressure
increases quite markedly once the return cannula size is reduced below 21F. Although
there are no absolute rules for determining the maximum pressure which can be
accepted within the ECMO circuit, it is believed that, ‘ceteris paribus’, higher premembrane pressures are more harmful than lower pressures.
There are several reasons for this belief.
1. The use of small cannulae is inevitably associated with higher circuit velocities at any
given flow rate. These higher velocities are associated with higher shear stresses on
both red cells and platelets. Shear stress on red cells is a potential cause of
haemolysis, and shear stress on platelets a potential cause of platelet activation.
2. Smaller cannulae require higher rpm to achieve a given flow rate. These higher rpm
require more energy delivery by the pump which in turn tends to increase the
operating temperature of the system and the ‘thermal stress’ on the blood.
3. Smaller cannulae are associated with a greater amount of exit turbulence and a more
marked ‘sand-blasting’ effect.
4. Higher circuit pressures pose a greater risk of circuit disruption.
© 2010 MSE (Australia) PL
112
ECMO Simulation User Manual (v5.7)
Thus, the take home message (in adults) is to use a 21F return cannula if possible.
This concludes the exercise.
7.6
VV ECMO (4)
The manoeuvres performed in this simulation must never be performed on a
real patient.
In this simulation, we’ll continue to explore the characteristics of a Veno-Venous ExtraCorporeal Membrane Oxygenation (VV ECMO) system.
The learning objectives of the session are to investigate:
The impact of obstruction of the inlet or outlet line on ECMO system performance.
We will be simulating the use of a system in a patient with essentially normal
cardiovascular function, but with severe respiratory failure. The patient is a 24 year-old
man, weighing 75 kgs, who has been transferred to your Intensive Care Unit for VenoVenous ECMO. He had been admitted to the Intensive Care Unit of a large regional
hospital 3 days before transfer to your institution. At that time, he presented a four day
history of increasing respiratory distress, fever and a productive cough. The patient had
been sedated, intubated and ventilated shortly after admission to the regional ICU.
Blood and sputum cultures grew a methicillin-sensitive staphylococcus aureus. Despite
treatment with appropriate antibiotics, the use of prone ventilation, permissive
hypercarbia and inhaled nitric oxide, he continued to deteriorate. Following discussions
with the clinicians at the regional hospital, he has been transferred to your institution for
initiation of veno-venous ECMO. On arrival in your ICU the patient is being given
assisted ventilation (via an ‘Ambu’ © bag) on 100% oxygen.
Blood gas analysis is reported as:
PaO2
44 mm Hg
PaCO2
41 mm Hg
pH
7.35
BXS
- 3.5
Temp
37.0
SaO2
74%
The patient has an Acute Lung Injury Score (‘Murray Score’) of 3.5 but has no other
significant co-morbidities. He has a Haemoglobin of ~ 12 gm/dL and you estimate his
‘shunt fraction’ (Qs/Qt) to be about 65%. The results of some ancillary investigations
(Echo, CXR and ECG) are also available.
We’ll assume that you have already worked your way through the previous VV ECMO
tutorials, so we’ll quite quickly set up our monitoring:
Click the <Display> button in the <Patient Monitor> window.
Check <ECG>, <Direct Arterial Pressure>, <Central Venous Pressure> and <SaO2>
and
© 2010 MSE (Australia) PL
Tutorials
113
Click the <Display> button again to close this window and display the physiological
signals.
Ventilate the patient:
Click the <Devices><Ventilator> menu item in the <Inspector> window.
Turn on the ventilator and set the tidal volume (Vt) to 500 mls, the rate to 12 bpm, the
FiO2 to 100% and the PEEP to 5 cms H2O.
Paralyse the patient:
Click <Bolus Drug><Pancuronium (2mg/ml)>in the <Therapeutic Interface> window.
Drag the green slider until it says ~ 8 mgs and click the <Give> button.
And perform a baseline blood gas analysis:
Click <Investigations><Arterial Blood Gas Analysis>in the <Inspector> window.
You elect to cannulate the patient percutaneously via the right and left internal jugular
and right femoral veins using the Seldinger technique and ultrasonic guidance.
Imagine now that you have:
Placed the Seldinger wires,
Given the patient 7500 units of heparin (Select <Heparin> from the <Therapeutic
Interface> <Bolus Drug> page and <Give> 7500 units) and
Positioned the cannulae under ultrasonic control.
The ECMO circuit we’ll be using is shown in Figure 1. We’re actively draining (sucking)
blood from a point in the inferior vena cava just below the diaphragm, pumping it through
the oxygenator and returning it via the superior vena cava to the right atrium (Figure 1.).
Figure 1.
© 2010 MSE (Australia) PL
114
ECMO Simulation User Manual (v5.7)
In this exercise, we’re only interested in the effect of obstruction of the drainage or return
lines, so, initially, we’ll make sure that the venous drainage is absolutely optimal. To do
this:
Switch to the ECMO system (Devices><ECMO System>).
Click <Adjust Cannula>.
Slide the bottom left-hand slider up to <8> to advance the IVC cannula.
Switch back to the ECMO system (Devices><ECMO System>).
Turn on the <Main Power>.
Set a gas flow of <6> lpm.
Fully open the outlet (arterial) clamp.
Increase the blood flow to <3.5> lpm.
Start the timer.
Note the pre-membrane pressure (~107 mm Hg), and the rpm (~2125).
After five minutes,
Perform an <Oxygenator Blood Gas Analysis>.
Perform an <Arterial Blood Gas Analysis>.
Now ask the supervisor to kink the outlet (arterial) line and:
Re-start the timer.
© 2010 MSE (Australia) PL
Tutorials
115
After five minutes,
Repeat the <Oxygenator Blood Gas Analysis>.
Repeat the <Arterial Blood Gas Analysis>.
Note the pre-membrane pressure has risen slightly to ~130 mm Hg, the rpm (~2125)
are unchanged, but that the blood flow rate has fallen from <3.5> lpm to <0.6> lpm. Note
also that the <Oxygenator Blood Gas Analysis> results have paradoxically
‘improved’ (the PO2 is higher and the PCO2 is lower) but that the patient’s arterial
blood gas values have deteriorated again. So what’s happening here? If we look at the
pressure and flow data first, we see that the pre-membrane pressure is now nearly
equal to the stagnation pressure at this rpm and that the flow rate has fallen dramatically.
– Nearly all of the pump’s energy is being used to overcome the additional resistance of
the obstructed outlet line and very little flow is occurring (Figure 2.).
Figure 2 *.
© 2010 MSE (Australia) PL
116
ECMO Simulation User Manual (v5.7)
The low blood flow through the oxygenator in the face of an unchanged gas flow results
in inadvertent hyperventilation of the artificial lung, so, in the blood leaving the
oxygenator, the PCO2 falls quite markedly and the PO2 rises. Thus the hallmarks of
outlet line obstruction can be summarized as: a rising pre-membrane pressure and
falling blood flow rate in association with ‘Supernormal’ oxygenator blood gases. This
can be compared with oxygenator failure, which may have a similar impact on
© 2010 MSE (Australia) PL
Tutorials
117
oxygenator blood pressure and flow, but which is associated with a failure of gas
transfer and deterioration in oxygenator blood gas values.
Let’s now examine what happens if we kink the inlet line to the system.
Ask the supervisor to unkink the outlet line and:
Re-start the timer.
After five minutes, note that the pre-membrane pressure has returned to ~107 mm Hg
and the flow rate to ~ 3.5 lpm.
Now:
Ask the supervisor to kink the inlet line and:
Re-start the timer.
After five minutes,
Repeat the <Oxygenator Blood Gas Analysis>.
Repeat the <Arterial Blood Gas Analysis>.
Note the pre-membrane pressure has dropped markedly to ~15 mm Hg, the rpm
(~2125) are unchanged, and that the blood flow rate has fallen from <3.5> lpm to <0.5>
lpm. The blood gas pictures in the oxygenator blood and the arterial blood are very
similar to those which were found when the outlet line was partially obstructed. The
explanation of these results is that the pump is being ‘starved’ of inflow and
consequently is unable to generate an outlet pressure because there is, quite simply, no
blood to pump. Once again, the low blood flow through the oxygenator in the face of an
unchanged gas flow results in inadvertent hyperventilation of the artificial lung, so, in the
blood leaving the oxygenator, the PCO2 falls quite markedly and the PO2 rises.
In summary, the hallmarks of inlet line obstruction are: a falling pre-membrane pressure
and falling blood flow rate in association with ‘Supernormal’ oxygenator blood gases.
In real life, how should we prevent inlet or outlet line obstruction?
Two simple measures which can be taken are to:
Ensure that long tubing runs are avoided (so that redundant circuit loops cannot form).
Ensure that the entire circuit is kept exposed and therefore visible (and not concealed
under sheets).
This concludes VV ECMO tutorial 4.
* I am grateful to Claudio Soto, Perfusionist, St Vincent’s Hospital, Sydney for
permission to use this photograph.
7.7
VA ECMO (1)
In this simulation, we’ll explore the basic behaviour of a modern veno-arterial (VA) ExtraCorporeal Membrane Oxygenation (ECMO) system.
The learning objectives of the session are:
To understand the design of a simple veno-arterial ECMO circuit.
© 2010 MSE (Australia) PL
118
ECMO Simulation User Manual (v5.7)
To become familiarized with the basic controls of an ECMO system.
To understand the mechanism of ‘Differential Hypoxia’.
We will be simulating the use of a system in a patient with normal cardio-respiratory
function before moving on to treating patients with severe cardio-respiratory impairment
in subsequent sessions.
Scenario:
Briefly, the patient is a fit 30 year old who weighs 70 kgs. For the purposes of the
tutorial we’re going to imagine that he’s been intubated (and perhaps surprisingly, is
tolerating the endotracheal tube very well!).
We’ll start by connecting him to our monitoring system:
Click the <Display> button in the <Patient Monitor> window.
Clicking the <Display> button on the Patient Monitor allows you to select the parameters
which you want to view.
Check <ECG>, <Direct Arterial Pressure>, <Central Venous Pressure> and
<SaO2> in the <Display> window.
Click the <Display> button in the <Patient Monitor> window.
The <Display> window will now close, and the ECG, Direct Arterial Pressure, Central
Venous Pressure and SaO2 signals will be displayed in the <Patient Monitor> window.
It should be noted that the arterial pressure is being measured in the right radial artery.
As you can see, the patient is normotensive, with a pulse rate of about 70 bpm and a
central venous pressure of ~ 3 mm Hg. The pulse oximeter is indicating a saturation of
~98%. In order to eliminate the effects of spontaneous ventilation, and to make the
scenario more typical of a real patient on VA ECMO, we’ll also ventilate him. Currently,
the system always assumes that the patient is intubated, so in order to do this, simply:
Click the <Devices><Ventilator> menu item in the <Inspector> window.
When the ventilator appears in the <Inspector> window (Figure 1):
Figure 1.
© 2010 MSE (Australia) PL
Tutorials
119
Turn the ventilator on by clicking the power switch at the top right-hand side
of the device, and then choose the settings which you think are appropriate
by ‘dragging’ on the control knobs.
**Note that the ventilator’s controls are not enabled until the ventilator is turned <on>.
**For the purpose of this tutorial, ensure that the Inspired Oxygen concentration is set to
21%.
In order to assess the patient’s gas exchange:
Click the <Display> button in the <Patient Monitor> window.
Check < Capnography > and < Gases > in the <Display> window.
Click the <Display> button in the <Patient Monitor> window.
And perform a baseline blood gas analysis:
Click <Investigations><Arterial Blood Gas Analysis>in the <Inspector>
window.
To paralyse the patient and control his ventilation:
Click <Bolus Drug><Pancuronium (2mg/ml)>in the <Therapeutic Interface>
window.
© 2010 MSE (Australia) PL
120
ECMO Simulation User Manual (v5.7)
Drag the green slider until it says ~ 8 mgs and click the <Give> button.
If you wish to monitor the onset of muscle paralysis by monitoring his ‘Train of Four’:
Click the <Devices><Nerve Stimulator> menu item in the <Inspector>
window.
Click the <TOF> button on the nerve stimulator itself.
Sedation may be administered by selecting the appropriate bolus or infusion drugs
using the <Therapeutic Interface> and monitoring the depth of sedation by turning on the
<BIS> display on the physiological monitor. You elect to cannulate the patient
percutaneously employing the Seldinger technique and using a 21F cannula in the right
femoral artery and 24F cannula in the right femoral vein.
Imagine now that you have:
Placed the Seldinger wires in the artery and vein,
Given the patient 7500 units of heparin (Select <Heparin> from the <Therapeutic
Interface> <Bolus Drug> page and <Give> 7500 units) and
Positioned the cannulae under ultrasonic control.
The cannulae have been connected to the ECMO system. The entire system is heparincoated. The system’s centrifugal pump is responsible both for generating the negative
pressure which is required to facilitate drainage and the positive pressure which is
required to pump blood through the artificial lung and back into the patient. The pump
head and oxygenator are integrated into a single, disposable unit which is mounted on
the system console.
Figure 2.
© 2010 MSE (Australia) PL
Tutorials
121
Active venous drainage from the inferior vena cava is via the 24F venous cannula and
return via the 21F arterial cannula. A femoral ‘backflow’ cannula has not been used
(Figure 2). Before commencing ECMO you may wish to confirm that the patient is
effectively anti-coagulated. Select <Devices><ACT Monitor> and click <Start> in order
to commence the measurement. If you do this, you’ll need to click <Devices><ECMO
System> to return to the ECMO interface. (You can periodically return to the ACT
Monitor to check on the progress of the estimation). Additional information regarding
the ECMO system can be found by clicking on the <Resources> menu of the
<Inspector> window and selecting the resource which you want to view. These
resources include lectures on ECMO, images of various systems, relevant websites and
various descriptions and protocols relating to the technique.
To visualize the ECMO interface itself:
Click on the <Devices> <ECMO System> menu item of the <Inspector>
window.
Select the <VA ECMO> option at the bottom right of the interface.
© 2010 MSE (Australia) PL
122
ECMO Simulation User Manual (v5.7)
The key components of the system interface are shown above.
To the left of the interface are three controls which control respectively the inspired
oxygen concentration (%) of gas flowing through the oxygenator; the gas flow rate (lpm)
to the oxygenator; and the temperature setting control (Co) for the heater: cooler. The
heater: cooler can be used to vary the patient’s temperature (and metabolic rate).
Between these three controls and the ‘CardioHelp’ data display area is the electronic
clamp which controls flow through the outlet (Arterial) side of the pump. When the slider
is at the bottom, the clamp is fully closed, when at the top, fully open.
The data display area displays the current values of:
Flow through the system in lpm,
Pre-membrane circuit pressure measured between the pump head and the
oxygenator,
Venous oxygen saturation,
Pump speed in rpm,
Haematocrit and
Blood Temperature.
© 2010 MSE (Australia) PL
Tutorials
123
To the right of the display area are four controls.
The main power switch enables the flow control knob which is situated just beneath it.
The flow control is used to adjust the speed of the centrifugal pump in the range 0 –
5000 rpm.
The <Adjust Cannula> button allows you to move the drainage cannula(e) in or out and
to select the size of your return (Arterial) cannula.
Finally, the <Mode> button is used to set the system up for either VV or VA ECMO.
**Note that the flow control is not enabled until the ECMO system is turned <On>.
The first exercise we’ll be undertaking is initiation of VA ECMO.
First, we’ll perform a baseline blood gas analysis (<Investigations><Arterial Blood Gas
Analysis>) and then return to the ECMO system (<Devices> <ECMO System>).
Click the <Adjust Cannula> button and advance the drainage cannula as far as it will go
using the slide control on the left hand side of the window then re-open the ECMO
interface by clicking <Devices><ECMO System>.
Click the main power button at the top right of the interface.
Turn on 4 LPM of oxygen using the middle knob at the left of the interface.
At this point we’re ready to initiate ECMO. However, we must remember that, unlike the
case for VV ECMO, there is a pressure gradient across the circuit and if we simply
open the clamp, blood will flow from the arterial side of the circuit to the venous side and
a large left-to-right shunt will be created.
In order to avoid this effect, we need to generate a ‘stagnation pressure’ that is a little bit
above the patient’s mean arterial pressure. To do this, slowly turn up the flow control until
the indicated pressure is ~ 10 mm Hg above the patient’s mean arterial pressure with
the clamp still fully closed.
Now progressively release the arterial clamp by moving the slide control upwards and
observe that flow increases to about 1 lpm.
Increase the flow further by slowly rotating the flow control and note how the patient’s
pulse pressure becomes progressively smaller until it eventually disappears altogether.
Also note that if you go on rotating the flow control, the indicated flow reaches a
maximum (at about 4.7 lpm) and then starts to decrease. We’ll explore the reasons for
this in a future tutorial, but for the moment, just accept it and:
Adjust the flow control knob so that the maximum blood flow rate is achieved.
At this point the patient is on full cardio-pulmonary bypass, the aortic valve remains
closed throughout the cardiac cycle and there is no flow through the pulmonary
circulation or the left side of the heart. After a few minutes, note that carbon dioxide has
virtually disappeared from the capnography trace and that the end-tidal CO2 is close to
zero. Also note that the pulse oximeter has stopped reporting the patient’s saturation
© 2010 MSE (Australia) PL
124
ECMO Simulation User Manual (v5.7)
(because pulsatile blood flow has ceased).
Perform a blood gas analysis (<Investigations><Arterial Blood Gas Analysis>) and note
that the PaO2 is now ~ 450 - 500 mm Hg and that there is mild hypocarbia. These
results are typical for a normally-functioning VA ECMO system when 100% oxygen is
administered under full bypass conditions.
Under these conditions, we could if we wanted, turn the ventilator completely off.
However, in this tutorial, we won’t do this!
It is debatable whether or not a patient should be maintained on full bypass if clinically
satisfactory conditions can be obtained by using only partial support. Full bypass
abolishes pulmonary arterial flow and entails the risks of left heart distension, pulmonary
or left heart thrombosis and coronary ischaemia (due to increased left ventricular wall
stress). In contrast, partial bypass maintains pulmonary flow and reduces the risks of left
heart distension and thrombosis, but creates the possibility of differential hypoxia and
mandates some form of ongoing ventilation.
We’ll now examine what happens if we adjust the ECMO system to provide only partial
support.
Very slowly rotate the flow control knob so that a blood flow rate of ~ 2.5 lpm
is achieved.
Note that pulsatile blood flow returns and that the pulse oximeter starts working again.
Note also, that carbon dioxide has now re-appeared in the capnograph trace and that
the end-tidal CO2 is about 12 – 15 mm Hg.
After a few minutes in this state:
Perform an arterial blood gas analysis. (Investigations> <Arterial Blood Gas
Analysis>.
And:
Perform an oxygenator blood gas analysis. (Investigations> <Oxygenator
Blood Gas Analysis>.
Examine the two blood gas reports and note the differences:
1. The radial arterial PO2 is much lower than the oxygenator PO2.
2. The radial arterial PCO2 is much lower than the oxygenator PCO2.
3. There is a marked respiratory alkalosis in the radial sample.
So what’s going on here? Well, this is an example of ‘Differential Hypoxia’. – Because
the patient is only on partial cardio-pulmonary bypass (and has a considerable amount
of blood flowing through his own lungs), the upper part of the body (including the right
radial artery) is being perfused with blood which has been pumped out of the left
ventricle. This blood has reached the left ventricle from the native lung – which is being
relatively over-ventilated with a gas mixture containing only 21% oxygen. Hence, the
lower PO2 and PCO2.
In contrast, the lower part of the patient’s body is being perfused with blood exiting the
© 2010 MSE (Australia) PL
Tutorials
125
femoral arterial cannula. This blood has passed through the oxygenator which is
supplied with 100% oxygen and is less markedly over-ventilated. As a result, the PO2
and PCO2 are considerably higher.
If peripheral arterial cannulation is used, the ratio of oxygenator blood flow to total
systemic flow determines the point in the aorta where there is a mixing interface
between blood which has passed through the oxygenator, and blood which has passed
through the native lung.
As oxygenator flow is increased, so this point moves closer and closer to the aortic
valve, until, on full bypass, aortic valve opening ceases, all systemic flow is derived from
blood which has passed through the oxygenator and differential hypoxia disappears.
It should be noted that the two arterial systems which are at greatest risk of differential
hypoxia are the coronary and innominate vascular beds. It should also be noted that the
problem of differential hypoxia relates only to those undergoing VA ECMO and cannot
occur in those being treated with VV ECMO.
We’ll conclude this exercise by weaning the patient from VA ECMO.
To do this, slowly reduce the blood flow through the ECMO system by reducing the rpm
until a flow rate of ~ 1 lpm is observed. Note that pulsatility increases further and that the
end-tidal CO2 has risen to a more ‘normal’ level. Now progressively clamp the arterial
line by dragging the slider of the electronic clamp downwards until all forward flow
ceases. Finally reduce the rpm to zero and turn the ECMO system off.
This technique of weaning ensures that the arterial line is fully-occluded before the rpm
are reduced below a level which permits backflow to occur.
This concludes our introductory tutorial to VA ECMO. In future tutorials we’ll examine the
problem of backflow, explore the impact of VA-ECMO on a patient in cardiogenic
shock, and take a look at some of the complications of this form of therapy
7.8
VA ECMO (2)
During the conduct of this simulation, ventricular ejection ceases completely.
This form of support is not recommended in the management of most patients.
The learning objectives of the session are:
To explore the cardiovascular effects of VA ECMO in a patient with cardiogenic
shock.
We will be simulating the use of a system in a patient with severe left ventricular failure –
which is associated with significant respiratory impairment.
Scenario:
You are called urgently to see a 24 year-old man in the Emergency Department of your
hospital. The patient had been brought in by ambulance complaining of chest pain and
dyspnoea. You arrive in the department just after the patient has been intubated by the
resident. The resident tells you that the patient deteriorated shortly after having a
portable chest x-ray. He performed the intubation because the patient became
profoundly hypotensive, unresponsive to commands and started to have frequent
© 2010 MSE (Australia) PL
126
ECMO Simulation User Manual (v5.7)
ventricular ectopy.
History:
According to the family, the young man had suffered a flu-like illness some weeks
before and had been complaining of increasing shortness of breath and lethargy ever
since. His family practitioner had prescribed two courses of broad-spectrum antibiotics
and some bronchodilator therapy.
Initial Examination:
The endotracheal tube appears to be correctly positioned and breath sounds are
symmetrical. The patient is hypotensive, tachycardic and has an irregular pulse. He is
afebrile. His ventilation is being assisted using 100% oxygen and an Ambu © bag.
Pulse oximetry indicates a saturation of ~90%.
Previous Medical History:
The family tells you that the patient has previously been in good health, that he takes no
regular medications, and that he has no drug allergies. He has no relevant previous
medical history.
Subsequent Management:
The patient is transferred to the Intensive Care Unit, further investigations are
performed, a tentative diagnosis of viral myocarditis is made, and the decision is taken
to support the patient with VA ECMO. The results of some of these investigations
(Echo, ECG, CXR, and ABG) can be seen by clicking <Investigations> on the main
menu.
We’ll start the tutorial by connecting the patient to our monitoring system and putting him
on a ventilator.
To do this:
Click the <Display> button in the <Patient Monitor> window.
Check <ECG>, <Direct Arterial Pressure>, <Central Venous Pressure> and <SaO2
and
Click the <Display> button again to close this window and display the physiological
signals.
As you can see, the patient is profoundly hypoxic (SaO2 ~ 70%) and is having frequent
ventricular ectopic beats.
To ventilate the patient:
Click the <Devices><Ventilator> menu item in the <Inspector> window.
The ventilator should now appear in the <Inspector> window.
Turn the ventilator on by:
Clicking the power switch at the top right-hand side of the device, and then
Setting the tidal volume (Vt) to 500 mls, the rate to 12 bpm, the FiO2 to 100% and the
PEEP to 5 cms H2O.
**Note that the ventilator’s controls are not enabled until the ventilator is turned <On>.
The ventilator is based on a simple anaesthesia system which is in ‘Synchronised
Intermittent Mandatory Ventilation’ (SIMV) mode.
In order to assess the patient’s gas exchange you may want to:
© 2010 MSE (Australia) PL
Tutorials
127
Turn on the gas analyser:
Click the <Display> button in the <Patient Monitor> window.
Check < Capnography > and < Gases > in the <Display> window.
Click the <Display> button again to close this window and display the additional
signals.
And perform a baseline blood gas analysis:
Click <Investigations><Arterial Blood Gas Analysis>in the <Inspector> window.
You may also wish to paralyse the patient and control his ventilation. To do this:
Click <Bolus Drug><Pancuronium (2mg/ml)>in the <Therapeutic Interface> window.
Drag the green slider until it says ~ 8 mgs and click the <Give> button.
If you wish to monitor the onset of muscle paralysis by monitoring his ‘Train of Four’:
Click the <Devices><Nerve Stimulator> menu item in the <Inspector> window.
Click the <TOF> button on the nerve stimulator itself.
Sedation may be administered by selecting the appropriate bolus or infusion drugs
using the <Therapeutic Interface> and monitoring the depth of sedation by turning on the
<BIS> display on the physiological monitor.
An inotrope can also be administered using the <Therapeutic Interface>.
You elect to cannulate the patient percutaneously via the right femoral artery and vein
using the Seldinger technique and ultrasonic guidance.
Imagine now that you have:
Placed the Seldinger wires in the artery and vein,
Given the patient 7500 units of heparin (<Therapeutic Interface> <Bolus Drug>
<Heparin> <Give> 7500 units) and
Positioned the cannulae under ultrasonic control.
The cannulae have been connected to the ECMO system. The entire system is heparincoated. The system’s centrifugal pump is responsible both for generating the negative
pressure which is required to facilitate drainage and the positive pressure which is
required to pump blood through the artificial lung and back into the patient. The pump
head and oxygenator are integrated into a single, disposable unit which is mounted on
the system console (Figure 1.).
Figure 1.
© 2010 MSE (Australia) PL
128
ECMO Simulation User Manual (v5.7)
Active venous drainage from the right atrium is via the 24F venous cannula and return
via the 21F arterial cannula. A femoral ‘backflow’ cannula has not been used.
Additional information regarding the ECMO system can be found by clicking on the
<Resources> menu of the <Inspector> window and selecting the resource which you
want to view. These resources include lectures on ECMO, images of various systems,
relevant websites and various descriptions and protocols relating to the technique.
To visualize the ECMO interface itself:
Click on <Devices><ECMO System> menu item of the <Inspector> window.
The key features of the ECMO system have been outlined in the tutorials entitled “VA
ECMO Tutorial 1” and “VV ECMO Tutorial 1”. Refer to these examples for an
explanation of the use of the system.
Before commencing VA ECMO you may wish to confirm that the patient is effectively
anti-coagulated ( <Devices><ACT Monitor> <Start>). If you do this, you’ll need to click
<Devices><ECMO System> to return to the ECMO interface. (You can periodically
return to the ACT Monitor to check on the progress of the estimation). Give more
Heparin if you think it is needed.
We’re now nearly ready to commence VA ECMO. To complete our preparations we
need to:
© 2010 MSE (Australia) PL
Tutorials
129
Click <Devices><ECMO System> and select the <VA ECMO> option at the bottom
right of the interface.
Click the <Adjust Cannula> button and advance the drainage cannula as far as it will
go using the slide control on the left hand side of the window.
Re-open the ECMO interface by clicking <Devices><ECMO System>.
Click the <Main Power> button at the top right of the interface.
Turn on 6 LPM of oxygen using the middle knob at the left of the interface.
At this point we’re ready to initiate ECMO. However, we must remember that, unlike the
case for VV ECMO, there is a pressure gradient across the circuit and if we simply
open the clamp, blood will flow from the arterial side of the circuit to the venous side and
a large left-to-right shunt will be created.
In order to avoid this effect, we need to generate a stagnation pressure that is a little bit
above the patient’s mean arterial pressure. To do this:
Slowly turn up the flow control until the indicated pressure is ~ 10 mm Hg above the
patient’s mean arterial pressure with the clamp still fully closed.
Progressively release the arterial clamp by moving the slide control upwards.
Observe that flow increases to about 1 lpm. Now:
Increase the flow further by slowly rotating the flow control.
Note how the patient’s pulse pressure becomes progressively smaller until it eventually
disappears altogether (at a flow of about 4.0 lpm). What’s happening here? - Well, as
we steadily increase ECMO flow, so we progressively deprive the left ventricle of more
and more of its inflow (preload), until the point is reached where it has none at all, and
ejection ceases. At this point the patient is on full cardio-pulmonary bypass (CPB),
there is no flow through the pulmonary circulation or the left side of the heart and the
aortic valve remains closed throughout the cardiac cycle.
The ‘Rule of Thumb’ which describes the relationship between ECMO flow rate and LV
preload can be summarized as:
LV Preload is proportional to 1/ECMO Flow.
Or, in plain language: “Left ventricular preload decreases with increasing ECMO flow
rate.” This ‘Rule of Thumb’ can be contrasted with the relationship between ECMO flow
rate and LV afterload, where:
LV Afterload is proportional to ECMO Flow.
Or, in plain language: “Left ventricular afterload increases with increasing ECMO flow. ”
The situation of the patient on full VA ECMO differs from the patient on full (surgical)
bypass in two important respect s:
The circuit does not include a venous drainage reservoir and,
Venous drainage is ‘active’ rather than ‘passive’.
The presence of a venous reservoir in a surgical CPB circuit allows the perfusionist to
control LV preload relatively independently of main pump flow (by adjusting the volume
© 2010 MSE (Australia) PL
130
ECMO Simulation User Manual (v5.7)
of blood in the reservoir). In contrast, during VA ECMO, the perfusionist can only adjust
LV preload by changing the main pump flow rate. As a result, ‘tight’ control of systemic
blood pressure is more difficult to achieve during VA ECMO than during surgical CPB.
In this simulation, note how the mean arterial pressure (MAP) has risen from ~ 65 mm
Hg before bypass to ~ 105 mm Hg. This higher mean pressure reflects the fact that the
patient’s total systemic flow (LV output + ECMO output) is now higher than before
ECMO and that the patient’s Systemic Vascular Resistance (SVR) is little changed. As
a result, mean arterial pressure is considerably higher.
Under normal circumstances, if we were on surgical CPB, we would respond to this
scenario by temporarily reducing the arterial pump flow at the same time as minimizing
left ventricular (LV) preload by ensuring that drainage into the venous reservoir was
unimpeded. However, during VA ECMO, if we reduce blood flow rate, we will divert
more flow through the pulmonary circulation, increase LV preload, and the left ventricle
will begin to eject again. In practice, we can only adjust SVR by the use of vaso-dilator
or constrictor therapy and we can only adjust circulating blood volume by fluid
administration or diuretic therapy.
After a few minutes, perform a blood gas analysis:
<Investigations><Arterial Blood Gas Analysis>
And note that the PaO2 is now ~ 500 mm Hg and that the PaCO2 is within the normal
range. These results are typical for a normally-functioning VA ECMO system when
100% oxygen is administered under full bypass conditions. It is debatable whether or
not a patient should be maintained on full bypass if clinically satisfactory conditions can
be obtained by using only partial support.
Full bypass abolishes pulmonary arterial flow and entails the risks of left heart
distension, pulmonary or left heart thrombosis and coronary ischaemia (due to
increased left ventricular wall stress).
In contrast, partial bypass maintains pulmonary flow and reduces the risks of left heart
distension and thrombosis, but creates the possibility of differential hypoxia and the
requirement for some form of ongoing ventilation.
Finally, we’ll examine the effect of the administration of a powerful vasodilator (Sodium
Nitroprusside (SNP)) on the behaviour of the EMO system.
Commence an infusion of SNP by:
Selecting <Therapeutic Interface> <Infusion Drug> <SNP (100mcg/ml)>
And starting it at 20 ml/hr:
Slide green slider to <20> and click <Set>
After about 5 minutes, note that the:
Mean arterial pressure has fallen to 65 – 70 mm Hg;
The pump flow rate has increased to ~ 5 lpm and
The CVP has fallen.
© 2010 MSE (Australia) PL
Tutorials
131
Why is this so? The SNP is both an arterial and veno-dilator. As the plasma level of the
drug rises, so SVR and MAP both fall. As a result, it is now ‘easier’ for the ECMO
system to pump and so pump output increases despite the fact that the rpm remain
unchanged. The CVP also falls because of the veno-dilatation induced by the drug.
This concludes VA ECMO tutorial 2.
7.9
VA ECMO (3)
Some of the manoeuvres performed in this simulation must never be performed
on a real patient.
The learning objectives of the session are:
To recognise the signs of oxygenator gas supply failure.
We will be simulating the use of a system in a patient with severe left ventricular failure –
which is associated with significant respiratory impairment.
Scenario:
You are called urgently to see a 24 year-old man in the Emergency Department of your
hospital. The patient had been brought in by ambulance complaining of chest pain and
dyspnoea. You arrive in the department just after the patient has been intubated by the
resident. The resident tells you that the patient deteriorated shortly after having a
portable chest x-ray. He performed the intubation because the patient became
profoundly hypotensive, unresponsive to commands and started to have frequent
ventricular ectopy.
History:
According to the family, the young man had suffered a flu-like illness some weeks
before and had been complaining of increasing shortness of breath and lethargy ever
since. His family practitioner had prescribed two courses of broad-spectrum antibiotics
and some bronchodilator therapy.
Initial Examination:
The endotracheal tube appears to be correctly positioned and breath sounds are
symmetrical. The patient is hypotensive, tachycardic and has an irregular pulse. He is
afebrile. His ventilation is being assisted using 100% oxygen and an Ambu © bag.
Pulse oximetry indicates a saturation of ~80%.
Previous Medical History:
The family tells you that the patient has previously been in good health, that he takes no
regular medications, and that he has no drug allergies. He has no relevant previous
medical history.
Subsequent Management:
The patient is transferred to the Intensive Care Unit, further investigations are
performed, a tentative diagnosis of viral myocarditis is made, and the decision is taken
to support the patient with VA ECMO. The results of some of these investigations
(Echo, ECG, CXR, and ABG) can be seen by clicking <Investigations> on the main
menu.
© 2010 MSE (Australia) PL
132
ECMO Simulation User Manual (v5.7)
We’ll assume that you have already worked your way through VA ECMO tutorials (1)
and (2), so quite quickly we’ll:
Set up our monitoring:
Click the <Display> button in the <Patient Monitor> window.
Check <ECG>, <Direct Arterial Pressure>, <Central Venous Pressure> and <SaO2>
and
Click the <Display> button again to close this window and display the physiological
signals.
Ventilate the patient:
Click the <Devices><Ventilator> menu item in the <Inspector> window.
Click the power switch at the top right-hand side of the device, and then set the tidal
volume (Vt) to 500 mls, the rate to 12 bpm, the FiO2 to 100% and the PEEP to 5 cms
H2O.
Paralyse the patient:
Click <Bolus Drug><Pancuronium (2mg/ml)>in the <Therapeutic Interface> window.
Drag the green slider until it says ~ 8 mgs and click the <Give> button.
And perform a baseline blood gas analysis:
Click <Investigations><Arterial Blood Gas Analysis>in the <Inspector> window.
You elect to cannulate the patient percutaneously via the right femoral artery and vein
using the Seldinger technique and ultrasonic guidance.
Imagine now that you have:
Placed the Seldinger wires in the artery and vein,
Given the patient 7500 units of heparin (<Therapeutic Interface> <Bolus Drug>
<Heparin> <Give> 7500 units) and
Positioned the cannulae under ultrasonic control.
The cannulae have been connected to the ECMO system. The entire system is heparincoated. The system’s centrifugal pump is responsible both for generating the negative
pressure which is required to facilitate drainage and the positive pressure which is
required to pump blood through the artificial lung and back into the patient. The pump
head and oxygenator are integrated into a single, disposable unit which is mounted on
the system console (Figure 1.).
Figure 1.
© 2010 MSE (Australia) PL
Tutorials
133
We’re now nearly ready to commence VA ECMO. To complete our preparations we
need to:
Click <Devices><ECMO System> and select the <VA ECMO> option at the bottom
right of the interface.
Click the <Adjust Cannula> button and advance the drainage cannula as far as it will
go using the slide control on the left hand side of the window.
Re-open the ECMO interface by clicking <Devices><ECMO System>.
Click the <Main Power> button at the top right of the interface.
Turn on 6 LPM of oxygen using the middle knob at the left of the interface.
To initiate VA ECMO:
Turn up the <RPM> until the stagnation pressure is ~ 10 mm Hg > the patient’s mean
arterial pressure.
Fully open the <arterial clamp> by sliding the slider upwards.
Now slowly further increase the <RPM> until the maximum flow rate of ~ 5 lpm is
achieved.
Start the <Timer> (on the physiological monitor).
Because the mean arterial pressure is high, commence an infusion of SNP by:
Selecting <Therapeutic Interface> <Infusion Drug> <SNP (100mcg/ml)>
© 2010 MSE (Australia) PL
134
ECMO Simulation User Manual (v5.7)
And starting it at 20 ml/hr:
Slide green slider to <20> and click <Set>
After five minutes:
Perform an Arterial Blood Gas Analysis,
Perform an Oxygenator Blood Gas Analysis and
Return to the <ECMO System>.
As there is no ventricular ejection, there is little difference between the arterial and
oxygenator samples. In both cases, the PO2 should be about 425 mm Hg and the
PCO2 about 40 mm Hg.
Now, ask the Supervisor to disconnect the gas supply to the oxygenator and
Re-start the timer.
After five minutes note that:
There is evidence of increased sympathetic tone;
Ventricular ejection may be just apparent;
There is frequent ventricular ectopy and
The mixed venous saturation has fallen quite markedly.
Now, repeat the <Arterial> and <Oxygenator Blood Gas Analysis>.
Note that the:
Patient is profoundly hypoxic,
PaO2 is very low and that
PCO2 is markedly elevated (‘Hypercarbia’).
Oxygenator pre-membrane pressure is unchanged.
Oxygenator blood flow is unchanged.
These are the hallmarks of disconnection of the gas supply to an oxygenator.
In real life, how should we respond to suspected disconnection of the gas supply to an
oxygenator?
Our response can be divided into four separate stages.
Checking the integrity of the oxygen supply chain.
Performing a ‘Bobbin Drop’ test.
Performing an exhaust gas analysis.
Performing an <Oxygenator Blood Gas Analysis>.
To check the integrity of the oxygen supply chain, the gas supply should be
systematically checked from the wall to the oxygenator.
At the wall (Figure 2.), confirm that:
1. The gas supply is oxygen.
2. The rotameter is securely connected.
3. The gas is flowing.
4. The supply line is connected.
© 2010 MSE (Australia) PL
Tutorials
135
Figure 2.
If the system includes a blender, confirm that it is set to deliver 100% oxygen (Figure 3.).
Figure 3.
© 2010 MSE (Australia) PL
136
ECMO Simulation User Manual (v5.7)
Next, make sure that there is no obstruction anywhere along the course of the supply line
(Figure 4.).
Figure 4.
And, finally, confirm that the supply line is connected to the oxygenator (Figure 5.).
Figure 5.
© 2010 MSE (Australia) PL
Tutorials
137
If the oxygenator supply chain appears intact, you should now perform a ‘Bobbin Drop’
test.
To perform this test, transiently clamp the oxygen supply line at the oxygenator whilst
observing the bobbin. During clamping, the bobbin should transiently fall. If the bobbin
does not fall, it suggests that there is a leak somewhere in the supply chain and this
check should be repeated.
If the supply chain check and the ‘Bobbin Drop’ tests fail to reveal any form of
disconnection, exhaust gas analysis should be performed.
To do this, place the tip of a side-stream gas analyser catheter into the exhaust port of
the oxygenator. If pure oxygen is being supplied to the oxygenator, the effluent gas
should contain about 95% oxygen and 5% carbon dioxide. The absence of carbon
dioxide implies that the gas supply to the oxygenator has been disconnected.
Finally, repeat the oxygenator blood gas analysis. If hypoxia and hypercarbia persist,
urgently consider the possibility of oxygenator failure. We will deal with this in the next
tutorial.
However, before we conclude this exercise, we’ll use the simulator to explore the effect
of inadvertently administering air (rather than 100% oxygen).
© 2010 MSE (Australia) PL
138
ECMO Simulation User Manual (v5.7)
To do this:
Ask the Supervisor to re-connect the gas supply to the oxygenator.
Reduce the <inspired oxygen concentration> on the ECMO system to 21%.
Leave the other ECMO controls unchanged.
Re-start the <timer>.
After five minutes,
Repeat the <Oxygenator Blood Gas Analysis>.
Note that the effluent blood from the oxygenator is relatively hypoxic (PaO2 ~ 75 mm
Hg), but hypo- rather than hyper-carbic (PCO2 ~ 34 mm Hg). This picture (relative
hypoxia in association with normo- or hypo-carbia) is characteristic of an oxygenator
which is being supplied with air rather than oxygen.
7.10
VA ECMO (4)
Some of the manoeuvres performed in this simulation must never be performed
on a real patient.
The learning objectives of the session are:
To recognise the signs of oxygenator failure.
We will be simulating the use of a system in a patient with severe left ventricular failure –
which is associated with significant respiratory impairment.
Scenario:
You are called urgently to see a 24 year-old man in the Emergency Department of your
hospital. The patient had been brought in by ambulance complaining of chest pain and
dyspnoea. You arrive in the department just after the patient has been intubated by the
resident. The resident tells you that the patient deteriorated shortly after having a
portable chest x-ray. He performed the intubation because the patient became
profoundly hypotensive, unresponsive to commands and started to have frequent
ventricular ectopy.
History:
According to the family, the young man had suffered a flu-like illness some weeks
before and had been complaining of increasing shortness of breath and lethargy ever
since. His family practitioner had prescribed two courses of broad-spectrum antibiotics
and some bronchodilator therapy.
Initial Examination:
The endotracheal tube appears to be correctly positioned and breath sounds are
symmetrical. The patient is hypotensive, tachycardic and has an irregular pulse. He is
afebrile. His ventilation is being assisted using 100% oxygen and an Ambu © bag.
Pulse oximetry indicates a saturation of ~80%.
Previous Medical History:
The family tells you that the patient has previously been in good health, that he takes no
regular medications, and that he has no drug allergies. He has no relevant previous
medical history.
© 2010 MSE (Australia) PL
Tutorials
139
Subsequent Management:
The patient is transferred to the Intensive Care Unit, further investigations are
performed, a tentative diagnosis of viral myocarditis is made, and the decision is taken
to support the patient with VA ECMO. The results of some of these investigations
(Echo, ECG, CXR, and ABG) can be seen by clicking <Investigations> on the main
menu.
We’ll assume that you have already worked your way through the previous VA ECMO
tutorials, so quite quickly we’ll:
Set up our monitoring:
Click the <Display> button in the <Patient Monitor> window.
Check <ECG>, <Direct Arterial Pressure>, <Central Venous Pressure> and <SaO2>
and
Click the <Display> button again to close this window and display the physiological
signals.
Ventilate the patient:
Click the <Devices><Ventilator> menu item in the <Inspector> window.
Click the power switch at the top right-hand side of the device, and then set the tidal
volume (Vt) to 500 mls, the rate to 12 bpm, the FiO2 to 100% and the PEEP to 5 cms
H2O.
Paralyse the patient:
Click <Bolus Drug><Pancuronium (2mg/ml)>in the <Therapeutic Interface> window.
Drag the green slider until it says ~ 8 mgs and click the <Give> button.
And perform a baseline blood gas analysis:
Click <Investigations><Arterial Blood Gas Analysis>in the <Inspector> window.
You elect to cannulate the patient percutaneously via the right femoral artery and vein
using the Seldinger technique and ultrasonic guidance.
Imagine now that you have:
Placed the Seldinger wires in the artery and vein,
Given the patient 7500 units of heparin (<Therapeutic Interface> <Bolus Drug>
<Heparin> <Give> 7500 units) and
Positioned the cannulae under ultrasonic control.
The cannulae have been connected to the ECMO system. The entire system is heparincoated. The system’s centrifugal pump is responsible both for generating the negative
pressure which is required to facilitate drainage and the positive pressure which is
required to pump blood through the artificial lung and back into the patient. The pump
head and oxygenator are integrated into a single, disposable unit which is mounted on
the system console (Figure 1.).
Figure 1.
© 2010 MSE (Australia) PL
140
ECMO Simulation User Manual (v5.7)
We’re now nearly ready to commence VA ECMO. To complete our preparations we
need to:
Click <Devices><ECMO System> and select the <VA ECMO> option at the bottom
right of the interface.
Click the <Adjust Cannula> button and advance the drainage cannula as far as it will
go using the slide control on the left hand side of the window.
Re-open the ECMO interface by clicking <Devices><ECMO System>.
Click the <Main Power> button at the top right of the interface.
Turn on 6 LPM of oxygen using the middle knob at the left of the interface.
To initiate VA ECMO:
Turn up the <RPM> until the stagnation pressure is ~ 10 mm Hg > the patient’s mean
arterial pressure.
Fully open the <arterial clamp> by sliding the slider upwards.
Now slowly further increase the <RPM> until a flow rate of 5 lpm is achieved.
Start the <Timer> (on the physiological monitor).
The mean arterial pressure is very high, but for the purposes of this exercise, we’ll just
accept it.
After five minutes:
© 2010 MSE (Australia) PL
Tutorials
141
Perform an <Arterial Blood Gas Analysis>,
Perform an <Oxygenator Blood Gas Analysis> and
Return to the <ECMO System>.
As there is no ventricular ejection, there is little difference between the arterial and
oxygenator samples. In both cases, the PO2 should be about 400 mm Hg and the
PCO2 about 35 mm Hg. Note, also that the pre-membrane pressure is ~ 305 mm Hg
and that the rpm are about 3500.
Now, ask the Supervisor to cause the oxygenator to fail **.
Over the next few minutes, observe that:
The pre-membrane pressure has risen to ~ 330 mm Hg,
The blood flow has fallen to ~ 3.5 lpm and that
Some ventricular ejection has become apparent.
Start the <Timer> and after five minutes::
Repeat the <Arterial Blood Gas Analysis> and
Repeat the <Oxygenator Blood Gas Analysis>.
Note that the Arterial and Oxygenator PO2 has fallen precipitously to about 45 mm Hg
and that the PCO2 has risen by about 10 mm Hg to ~ 47.
How can we interpret these results?
We suspect that the oxygenator is becoming partially occluded by the deposition of
fibrin and/or thrombus. As a result, the pre-membrane pressure is rising and the
delivered flow falling. (If we were to measure the pressure drop across the oxygenator,
we would see that it had increased.) The gas transfer function of the oxygenator is also
failing. (The supervisor has ‘failed’ about 50% of the membrane). As a result, the PO2 is
falling and the PCO2 rising.
These results are typical of one of the more common forms of oxygenator failure and
can be summarized as:
Elevation of the pre-membrane pressure,
Reduction of the blood flow rate - in association with
Hypoxia and
Hypercarbia.
In real life, how can we think about oxygenator failure?
One method is to classify it according to the mechanism of failure of the oxygenator.
Using this approach, we can identify three categories:
Failure of gas transfer function,
Failure of structural integrity and
Failure of heat transfer function.
In the example given above, the oxygenator failure is manifest as both a failure of gas
transfer function and as a failure of structural integrity (the membrane resistance has
© 2010 MSE (Australia) PL
142
ECMO Simulation User Manual (v5.7)
increased).
Fibrin or thrombus deposition is one of the most common causes of this type of
oxygenator failure in ECMO systems which use non-porous, polymethylpentene, hollowfibre membrane systems (Figure 2.).
Figure 2.
In contrast, the older, micro-porous, polypropylene, hollow-fibre systems were prone to
plasma leakage which occurred much earlier in the life-cycle of the device. An example
of this is shown in figure 2.
Figure 2.
© 2010 MSE (Australia) PL
Tutorials
143
In this case, plasma leakage was associated with a significant degree of gas transfer
failure which necessitated an urgent oxygenator change out.
This concludes VA ECMO Tutorial 4.
** Supervisor’s note:
Increase Oxygenator <Qs/Qt> to 0.5,
<Vd/Vt> to 0.5 and
<Membrane Resistance> to 50 mm Hg/L/Min
over the course of a few minutes.
© 2010 MSE (Australia) PL
Part
VIII
MSE System
8
MSE System
8.1
Overview
145
The Modular Simulation Environment (MSE) is a high-fidelity, 'immersive' patient
simulation system which can be based on more-or-less any intubation or resuscitation
manikin. At the heart of the system is the 'Smart Lung' ( a pneumatically-powered,
computer-controlled lung) which is connected to the trachea of the manikin (Figure 8.1.)
Figure 8.1.
The 'Smart Lung' is, in turn, controlled by the MSE software and, unless respiratory
depressant drugs or muscle relaxants have been administered, exhibits spontaneous
respiratory activity. The trainee is able to mask-ventilate the 'Smart Lung' (via the
intubation manikin) or, if the trachea has been intubated, attach the patient to any
modern anaesthesia / ICU ventilator.
The trainee administers drugs and fluids via the <Therapeutic Interface> of the Main
Application, and observes the patient's responses on the <Patient Monitor>. Additional
information concerning the simulation scenario is provided to the trainee in the
<Inspector> window.
The system supervisor controls the simulation using the Supervisor Application running
on a second PC, Netbook or Mobile phone.
The simulation can be recorded using a high-resolution webcam and the in-built data
recording system.
© 2010 MSE (Australia) PL
146
ECMO Simulation User Manual (v5.7)
A small group of observers are able to watch the simulation on a remote, high-definition
television.
© 2010 MSE (Australia) PL
Part
IX
148
ECMO Simulation User Manual (v5.7)
9
Trouble Shooting
9.1
FAQ
Can I run it on a MAC?
One correspondent has told me that it will run in 'VirtualPC' on a Macintosh.
Can I alter the weight of the patient?
In this version of the program the weight of the patient is fixed at 75 Kgs although the
supervisor is able to vary the patient's nominal oxygen utilisation in the range ~1 - 5 mls/
kg/min.. The parameters of the underlying models are generally indexed to body weight
and are appropriate for adults in the range 20 - 100 kgs. However, it should be noted
that some parameters (such as FRC and other lung volumes) are defined in absolute
values and will not change if body weight is altered. The pharmacokinetic parameters
have been modelled using data obtained from adults.
How do I move one of the main windows?
If you want to move the <Patient Monitor>, <Inspector> or <Therapeutic Interface>
window:
Place the mouse at the top right-hand corner of the window and
Drag it while holding down the left mouse button.
The position of the window will be retained when you next start the application.
What's the difference between loading a 'Patient' and loading a 'Scenario' on the
<Tools> menu?
If you load a 'Patient', you will load a patient's nominal physiological state, but all other
components of the current scenario (notes, investigations and resources) will remain
unchanged.
If you load a 'Scenario', you will load the patient who is represented in that scenario
together with the notes, investigations and resources which are associated with the
selected scenario.
Refer to the 'Scenarios' section for more detailed information on the structure of a
scenario.
Can I run the system using a direct ethernet connection between two computers?
Yes you can. For advice on how to set up such a connection, see, for example, Conniq.
com.
Can I run the system under 'Windows 7' operating system?
The application runs under the 32 & 64-bit versions of 'Windows 7 Ultimate' ('Release to
Manufacturers' version).
How do I install the Supervisor Application on another computer?
Copy the file 'MSESupervisor.exe' from the installation directory to the computer of your
choice. No other files are needed. Refer to the section entitled 'System Requirements'
for a description of the hard- and soft-ware requirements of the supervisory device.
© 2010 MSE (Australia) PL
Trouble Shooting
149
Can I run the Main Application and the Supervisor Application on the same computer?
Yes you can, but the screen may become rather crowded (unless you have a 2560 *
1600 display).
How, (as Supervisor) can I make the patient hypoxic?
Two techniques are available.
Progressively increase the <QsQt> value on the <Lung> page of the Supervisor
Application.
Administer a hypoxic mixture using the <FiO2> control. However, it should be
noted that it is not possible to administer a hypoxic mixture to the patient if
the ventilator is turned on.
How, (as Supervisor) can I make a spontaneously breathing patient hypercarbic?
Progressively increase the <CO2 SP> value on the <Misc> page of the Supervisor
Application.
How, (as Supervisor) can I make a ventilated patient hypercarbic?
Progressively increase the <VdVt> value on the <Lung> page of the Supervisor
Application.
How, (as Supervisor) can I make the patient hypotensive?
Either slowly reduce the SVR, or slowly reduce the CI on the <CVS/ECG> page of the
Supervisor Application.
Is there a drug database editor?
No. At the present time, it is not possible to add new drugs to the system.
Can I run the system using a dual display?
Yes, the system has been tested on conventional dual -display (second monitor)
systems as well as remote dual display systems such as 'Maxivista'.
How, (as Supervisor) can I change the patient ('pat') file which is associated with a
scenario?
Start the Main Application in <Maintenance Mode>.
Click <System><Scenario Editor>.
Navigate to the 'ScenarioData' folder by clicking the appropriate <+> signs in the
<Folder Navigator> folder tree.
Click on the database file 'MSEScenario.mdb'.
Right Mouse Button click this file to load it into the <Database Editor> window.
Click on the folder of the Scenario whose patient file you wish to change.
Click <Edit> in the pane which appears.
Select the 'Pat' file which you want to use from the <Folder Navigator> window. (This
file name should be transferred into the 'File Name' field of the editor pane).
Click the <Save> button.
Click <Save & Exit>.
Click <System><Exit>
Do the alarms work on the physiological monitor?
No (Not yet).
© 2010 MSE (Australia) PL
150
ECMO Simulation User Manual (v5.7)
If I don't heparinise the patient, will the oxygenator clot?
It will not do this automatically. However, the supervisor may choose to fail the
oxygenator if you do not heparinise the patient in a 'supervised' session.
Why do many of the tutorials advocate paralysing and ventilating the patient?
The patient has a considerable amount of innate respiratory behaviour. If ventilation is
not controlled, it makes it harder for the trainee to identify the effects of the various
manoeuvres which are being performed.
Why do the PaO2 and SaO2 rise transiently if I initiate ECMO without any fresh gas flow?
The oxygenator is assumed to have been flushed with oxygen before use. The transient
rise represents oxygen delivery from the shell ("Functional Residual Capacity") of the
oxygenator.
How do I change the units of partial pressure of blood gases?
Start the application in 'Maintenance mode' and select the 'Miscellaneous Settings'
option. Check the 'kPa' or 'mm Hg' item and then click on 'Save and Exit'. The next time
you run the application in 'Supervised' or 'Unsupervised' mode, the selected units will be
used and will continue to be used until changed in 'Maintenance Mode' again.
How do I change the background colour of the system?
Start the application in 'Maintenance mode' and select the 'Miscellaneous Settings'
option. Check the 'Colour' button and select the background colour that you want. The
next time you run the application in 'Supervised' or 'Unsupervised' mode, the selected
colour will be used and will continue to be used until changed in 'Maintenance Mode'
again.
9.2
Troubleshooting
The Supervisor Application will not connect with the Main Application.
There are two simple solutions to this problem:
Make sure that the Main Application is running in <Supervised Mode>.
Make sure that the IP Address entered in the Supervisor Application is identical to
that shown in the Patient Monitor of the Main Application.
If neither of these approaches are successful, you must ascertain that:
Both the Main Application computer and supervisory computer are connected to the
network.
That the firewall / security settings of your LAN permit incoming and outgoing TCP / IP
streams between these computers on port 8000. The integrity of these streams can
be examined with the 'ipconfig', 'ping' and 'net view' system commands.
To do this:
Open a command prompt window and confirm with the ipconfig command that your
network adapter is not in a Media disconnected state.
Ping the desired host using its IP address. If the ping command fails with a "Request
timed out" message, verify that the host IP address is correct, that the host is
operational, and that all of the gateways (routers) between this computer and the host
© 2010 MSE (Australia) PL
Trouble Shooting
151
are operational.
Test host name resolution by pinging the desired host using its host name. If the ping
command fails with an "Unable to resolve target system name" message, verify that
the host name is correct and that the host name can be resolved by your DNS server
Confirm TCP/IP connectivity by typing 'net view \\ComputerName' in the command
prompt window. The net view command lists the file and print shares of a computer
running Windows by establishing a temporary connection. If there are no file or print
shares on the specified computer, the net view command displays a "There are no
entries in the list" message.
If the net view command fails with a "System error 53 has occurred" message, verify
that ComputerName is correct, that the computer running Windows is operational, and
that all of the gateways (routers) between this computer and the computer running
Windows are operational.
If the net view command fails with a "System error 5 has occurred. Access is denied."
message, verify that you are logged on using an account that has permission to view the
shares on the remote computer.
The buttons on the monitor are the wrong size.
Make sure that the text size is set to 100% (not 125 or 150) in the 'Screen Display'
options.
9.3
Installing a new license file
The following procedure should be followed if you are asked to install a different license
for the MSE ECMO system:
Stop the MSE Application if it is running.
Using ‘Windows Explorer’, navigate to the application’s installation directory. By
default, this directory is C:\Program Files\MSE (Australia) PL\MSE ECMO Simulator.
Delete the MSE license file (‘MSE.lic’) from this directory.
Copy the license file which has been provided to you into the installation directory.
Rename this file ‘MSE.lic’.
Re-start the application.
Note that it is not necessary to re-install the complete application in order to
install a new license.
9.4
Error Messages
Scenario Data Source not Found:
This error message is generated if the scenario data folder cannot be found on the
system. To fix the problem:
Restart the application.
Select <Maintenance Mode>.
Click on the <System> menu.
© 2010 MSE (Australia) PL
152
ECMO Simulation User Manual (v5.7)
Select <Scenario Data Source>.
Navigate to the <ScenarioData> folder.
Highlight this folder.
Click <OK>.
Click <System>.
Click <Exit>.
Restart the application.
Click <Start>.
The instruction at 'xxxxxxxxxx' referenced memory at '0x00000014'. The memory could
not be 'read':
This is a known bug in the Adobe Acrobat 'Reader' plug-in which is used by the
<Inspector> module. If you have been browsing the web (using the inspector) and you
open a web-based pdf document, the plug-in occasionally generates an exception on
subsequent closure of the MSE. The exception occurs after closure of MSE itself and is
known to 'Adobe' and 'Microsoft' - both of whom are 'working on the problem'.
The dialog window shown below appears. The exception appears to have no adverse
consequences.
Connection Refused - Change Mode of Main Application:
This error is generated when you try to 'Supervise' the Main Application when it is in
'Unsupervised' mode. Re-start the Main Application in 'Supervised' mode and then restart the supervisory application and click the connect button.
License Validation Failed:
Invalid data has been found in the license file. Contact your software supplier.
License File Missing:
The license file (MSE.lic) is missing from the executable directory. Contact your
software supplier.
No Valid MSE ECMO Dongle Was Found:
You are attempting to run a licensed version of the application without the Dongle.
No variables selected for recording:
You are attempting to run the data recorder without having first selected the variables
which you wish to record. Run the application in <Maintenance Mode> and select
<System><Recorded Variables Editor> in order to specify a recorded variable dataset.
Refer to the section entitled <Data Recorder> for full details.
Invalid Desktop Font:
© 2010 MSE (Australia) PL
Trouble Shooting
153
You are attempting to run the application with the desktop font set to something other
than 96 dpi. Set the desktop text size to 'Smaller (100%)' using the 'Control Panel >
Display' option.
9.5
HDTV Connection
In order to connect the system to a high-definition television you will need a video card
which supports a 1920 * 1080 pixelar resolution and has an HDMI or DVI output
connector. You should also make sure that over-scanning is turned off on the television
itself.
If you connect the application using a DVI connector you will also need to separately
connect the audio stream to the television system.
9.6
Aberrant Behaviour
Blood Gas Model:
Inevitably, the blood:gas model has limitations although in general, it is able to simulate
quite extreme conditions. The design of the model requires the imposition of some
constraints and, as a result, may produce 'anomalous' behaviour under some
circumstances.
Some of the more important constraints are:
That the PCO2 in any compartment is constrained to 500 mm Hg.
That the maximum inducible base deficit is constrained to -15.
That the peak (sustained) oxygen utilisation rate is constrained to about 800 mls/
minute.*
That gas exchange does not occur in the ideal compartment if it does not have blood
flow.
That temperature is constrained to the range 15 - 40 degrees C.
The supervisor should avoid producing rapid, marked changes in some variables as
this will result in transient, 'anomalous' behaviour for some minutes. In particular,
instantaneous changes in body temperature of more than a few degrees and rapid
changes in haematocrit of more than a few % should both be avoided. If such changes
are made, the partial pressures of the respiratory gases in all compartments will take
some time to reach a new steady state and for many minutes, the reported blood gas
values will be clearly erroneous.
* This compares very unfavourably with the sustained VO2 achieved by Alberto
Contador who apparently was able to utilise ~ 7000 mls/minute for over half an hour in a
recent Tour De France!!.
© 2010 MSE (Australia) PL
154
ECMO Simulation User Manual (v5.7)
Absence of Haptic technology:
The present implementation includes no haptic technology. In general, this has no
implications on the fidelity of the simulation. However, in real life, the rpm controllers of
ECMO pumps exhibit considerable force-feedback (so that it is relatively difficult to
produce sudden, marked changes in pump output). Clearly, this is not the case in the
simulated environment and, unless care is taken in control adjustment, sudden,
unrealistic, changes in pump output can be produced.
9.7
Displaying PowerPoint Files
When you try to open a a Microsoft Office PowerPoint 2007 document in the 'Inspector'
window, the document may not open in this window, but, instead, a new PowerPoint
2007 / 2010 window opens to display the document.
This is a feature of newer versions of 'PowerPoint'. To prevent this from happening, you
should alter the Windows registry by double clicking on the file "PowerPointFix.reg"
which can be found in the executable directory. This operation only needs to be
performed once.
For further information refer to: http://support.microsoft.com/kb/927009.
9.8
APIPA
The 'Personal' version of the software limits network connectivity between the Main
(Trainee) application and the Supervisor application. Communication between these
applications is only permitted if the applications are running on the same device, or if a
direct connection between two devices using Automatic Private IP Addressing (APIPA)
has been implemented.
APIPA is a DHCP failure mechanism. Under APIPA, DHCP clients obtain IP addresses
when a DHCP server is not available and for this reason, connection between two
separate computers will not occur if either is connected to a router. APIPA
restricts the range of IP addresses used by the two devices to 169.254.0.0 169.254.255.255 and and both must reside on the same subnet.
A side-effect of this architecture is that access to the Internet is not possible
using the 'Personal' version if the Main application is running in 'Supervised'
mode whilst under the control of an attached device.
© 2010 MSE (Australia) PL
Trouble Shooting
© 2010 MSE (Australia) PL
155
Part
X
References
10
References
10.1
References
157
The seminal work on medical simulation - which provided the inspiration for this work is that of Dickinson (Dickinson CJ. (1977). A Computer Model of Human Respiration/
MTP Press Limited. ISBN 0852001738).
Some other important sources of data or descriptions of computational and/or
mathematical techniques can be found in the work of:
Christoforides C, Hedley-Whyte J. Effect of temperature and hemoglobin concentration
on solubility of O2 in blood. J Appl Physiol. 1969 Nov;27(5):592-6.
Christoforides C, Hedley-Whyte J. Supersaturation of blood with O2. J Appl Physiol.
1969 Feb;26(2):239-40.
Christoforides C, Laasberg LH, Hedley-Whyte J. Effect of temperature on solubility of
O2 in human plasma. J Appl Physiol. 1969 Jan;26(1):56-60.
Dantzker DR, Lynch JP, Weg JG. Depression of cardiac output is a mechanism of shunt
reduction in the therapy of acute respiratory failure. Chest. 1980 May;77(5):636-42.
Dash RK, Bassingthwaighte JB. Ann Biomed Eng. 2004 Dec;32(12):1676-93. Blood
HbO2 and HbCO2 dissociation curves at varied O2, CO2, pH, 2,3-DPG and
temperature levels.
Dickinson CJ. A digital computer model to teach and study gas transport and exchange
between lungs, blood and tissues ('MacPuf'). J Physiol (Lond). 1972 Jul;224(1):7P-9P
Douglas AR, Jones NL, Reed JW. Calculation of whole blood CO2 content. J Appl
Physiol. 1988 Jul;65(1):473-7.
Glass PS, Bloom M, Kearse L, Rosow C, Sebel P, Manberg P. Bi-spectral analysis
measures sedation and memory effects of propofol, midazolam, isoflurane, and
alfentanil in healthy volunteers. Anesthesiology. 1997 Apr;86(4):836-47.
Green HD (1944). Circulation: Physical Principles. Medical Physics 1. 208 – 232.
Hardman JG, Wills JS, Aitkenhead AR. Factors determining the onset and course of
hypoxemia during apnea: an investigation using physiological modelling. Anesth Analg.
2000 Mar;90(3):619-24.
Hardman JG, Wills JS, Aitkenhead AR. Investigating hypoxemia during apnea:
validation of a set of physiological models. Anesth Analg. 2000 Mar;90(3):614-8.
Kelman GR. (1966) Digital computer subroutine for the conversion of oxygen tension
into saturation. J Appl Physiol. 1966 Jul;21(4):1375-6.
Kelman GR (1967). Digital computer procedure for the conversion of PCO2 into blood
© 2010 MSE (Australia) PL
158
ECMO Simulation User Manual (v5.7)
CO2 content. Resp. Physiol. 3, 111-115.
Kirklin JW and Barratt-Boyes BG. 'Cardiac Surgery'. New York: Churchill Livingstone,
1993:61-127.
Lewis RP, Rittogers SE, Froester WF, Boudoulas H. A critical review of the systolic
time intervals. Circulation. 1977 Aug;56(2):146-58.
Maitre PO, Shafer SL. A simple pocket calculator approach to predict anesthetic drug
concentrations from pharmacokinetic data. Anesthesiology. 1990 Aug;73(2):332-6.
McSharry PE, Clifford GD, Tarassenko L, Smith LA.A dynamical model for generating
synthetic electrocardiogram signals. IEEE Trans Biomed Eng. 2003 Mar;50(3):289-94.
Murray, F. W., On the computation of saturation vapor pressure, J. Appl. Meteorol., 6,
203-204, 1967.
Nunn JF. Applied Respiratory Physiology. 4th edition.
Pappenheimer JR, Comroe JH and Cournand A et al. Standardization of the definitions
and symbols in respiratory physiology. Fedn Proc 9, 602
Pybus DA, Kerr JH. A simple system for administering intermittent mandatory ventilation
(IMV) with the Oxford ventilator. Br J Anaesth. 1978 Mar;50(3):271-4.
Pybus DA, Lyon M, Hamilton J, Henderson M. Measuring the efficiency of an artificial
lung: 1. Carbon dioxide transfer. Anaesth Intensive Care. 1991 Aug;19(3):421-5.
Riley RL and Cournand A. (1949) ‘Ideal’ Alveolar air and the analysis of ventilationperfusion relationships in the lungs. J. Appl. Physiol., 1, 825-847
Riley RL, Lilienthal JL, Proemmel DD, Franke RE. On the determination of the
physiologically effective pressures of oxygen and carbon dioxide in the alveolar air. Am
J Physiol. 1946 147, 191.
Riley,RL and Cournand,A (1949). ‘Ideal’ alveolar air and the analysis of ventilationperfusion relationships in the lungs. J. Appl. Physiol., 1, 825-847
Segers PA, Heida JF, de Vries I, Maas C, Boogaart AJ, Eilander S. Clinical evaluation
of nine hollow-fibre membrane oxygenators. Perfusion. 2001 Mar;16(2):95-106.
Severinghaus JW. Simple, accurate equations for human blood O2 dissociation
computations. J Appl Physiol. 1979 Mar;46(3):599-602.
Shappell SD and Lenfant CJM. Adaptive, genetic, and iatrogenic alterations of the
oxyhemoglobin-dissociation curve. (1972) Anesthesiology, 37, 127.
Stergiopulos N, Westerhof BE, Westerhof N. Total arterial inertance as the fourth
element of the windkessel model. Am J Physiol. 1999 Jan;276(1 Pt 2):H81-8.
Syroid ND, Agutter J, Drews FA, Westenskow DR et al. Development and evaluation of
© 2010 MSE (Australia) PL
References
a graphical anesthesia drug display. Anesthesiology. 2002 Mar;96(3):565-75.
© 2010 MSE (Australia) PL
159
Part
XI
License Agreement
11
161
License Agreement
END USER LICENSE AGREEMENT:
This ECMO simulator is intended only for teaching the users of ECMO systems
the principles of this form of therapy. Under no circumstances must it be used
as a guide to the medical management of any living person.
This software end user license agreement ("EULA") is a legal agreement between you
(either an individual or, if purchased or acquired by or for an entity, an entity) and MSE
(Australia) pl. It provides a license to use this software and contains warranty
information and liability disclaimers. By downloading, installing or using the software you
are indicating your assent to the terms of this license. If you do not agree to all of the
following terms, do not download or install the software, discontinue its use immediately
and destroy all copies in your possession.
1. DEFINITIONS
a) "Software" means the executable code of MSE ECMO Simulator, additional tools,
libraries, source files, header files, data files, any updates or error corrections provided
by MSE (Australia) PL, any user manuals, guides, printed materials, on-line or
electronic documentation.
b) "License Key" means a serial number issued to you by MSE (Australia) PL to
activate and use the Software.
c) "Named User" is an individual authorized by you to use the Software through the
assignment of a single user ID, regardless of whether or not the individual is using the
Software at any given time. A non-human operated device is counted as a User in
addition to all individuals authorized to use the Software, if such device can access the
Software.
d) "Maintenance Plan" is a time-limited right to technical support and Software updates
and upgrades. Technical support only covers issues or questions resulting directly out of
the operation of the Software. MSE (Australia) PL will not provide you with generic
consultation, assistance, or advice under any other circumstances.
2. LICENSE GRANTS
2.1 Trial Period License. You may download and use the Software for free for thirty (30)
days after installation ("Trial Period"). During the Trial Period, MSE (Australia) PL
grants You a limited, non-exclusive, non-transferable, non-renewable license to copy
and use the Software for evaluation purposes only and not for any commercial use. At
MSE (Australia) PL's discretion, MSE (Australia) PL may provide limited support
through email or discussion forums at the download web site. The evaluation copy of the
Software contains a feature that will automatically disable the Software at the end of
Trial Period. MSE (Australia) PL will have no liability to you if this feature disables the
Software.
2.2 License After Trial Period. This Software is licensed, not sold. During the Trial
Period, you have the option of paying a license fee in order to use the Software after the
expiration of the Trial Period. Upon your payment of the license fee, MSE (Australia) PL
provides you with a permanent registration number ("License key"), hardware protection
device (“Dongle”) and grants you a limited, non-exclusive, non-transferable license to:
a) use the Software on a Named User basis meaning specific individuals are
authorized to access the Software and the total number of named users may not exceed
© 2010 MSE (Australia) PL
162
ECMO Simulation User Manual (v5.7)
the total number licensed by You.
b) copy the Software in machine-readable form solely for archival and backup purposes.
2.3 The Named User of the Software may install and use the Software on any number of
computers (including operating systems and Virtual Machine Environments) that are
connected to each other in a network (there has to be a TCP/IP connection between
these computers).
3. LICENSE RESTRICTIONS
3.1 You shall undertake any necessary steps to protect the License Key and Dongle
against unauthorized use.
3.2 You may not alter, merge, modify, adapt or translate the Software, or decompile,
reverse engineer, disassemble, or otherwise reduce the Software to a humanperceivable form.
3.3 You may not sell, rent, lease, sub license, transfer, resell for profit or otherwise
distribute the Software or any part thereof.
3.4 You may not modify the Software or create derivative works based upon the
Software.
3.5 You may not remove or obscure any copyright and trademark notices relating to the
Software.
4. OWNERSHIP AND INTELLECTUAL PROPERTY RIGHTS
4.1 This Agreement gives you limited rights to use the Software. MSE (Australia) PL
retains all rights, title and interest in and to the Software and all copies thereof, including
copyrights, patents, trade secret rights, trademarks and other intellectual property rights.
All rights not specifically granted in this Agreement, including International Copyrights,
are reserved by MSE (Australia) PL. The structure, organization and code of the
Software are valuable trade secrets and confidential information of MSE (Australia) PL.
5. LIMITATION OF LIABILITY
5.1 MSE (Australia) PL's cumulative liability to you or any other party for any loss or
damages resulting from any claims, demands, or actions arising out of or relating to this
Agreement shall not exceed the license fee paid to MSE (Australia) PL for use of the
Software.
5.2 MSE (Australia) PL shall be relieved of any and all obligations for any portions of the
software that are revised, changed, modified, or maintained by anyone other than MSE
(Australia) PL.
6. PATENT AND COPYRIGHT INDEMNITY
6.1 MSE (Australia) PL represents and warrants that the Software shall not infringe or
misappropriate any copyrights, patents, trade secret rights, trademarks and other
intellectual property rights.
6.2 In the event the Software is found to infringe, MSE (Australia) PL will have the
option, at its expense, to:
a) modify the Software to cause it to become non-infringing;
b) substitute the Software with other Software reasonably suitable to You, or
c) if none of the foregoing remedies are commercially feasible, terminate the license for
the infringing Software and refund any license fees paid for the Software.
6.3 MSE (Australia) PL will have no liability for any claim of infringement based on:
a) code contained within the Software which was not created by MSE (Australia) PL;
b) use of a superseded or altered release of the Software, except for such alteration(s)
or modification(s) which have been made by MSE (Australia) PL or under MSE
© 2010 MSE (Australia) PL
License Agreement
163
(Australia) PL's direction, if such infringement would have been avoided by the use of a
current, unaltered release of the Software that MSE (Australia) PL provides to you, or
c) the combination, operation, or use of any Software furnished under this Agreement
with programs or data not furnished by MSE (Australia) PL if such infringement would
have been avoided by the use of the Software without such programs or data.
7. LIMITED WARRANTIES
7.1 the software is provided on an "as is" basis. MSE (Australia) PL makes no warranty
of any kind, express or implied, including without limitation any implied warranty or
merchantability or fitness for a particular purpose. Without limitation, you assume sole
responsibility for selecting the software to achieve your intended results and for the
installation, use and results obtained from the software. MSE (Australia) PL makes no
warranty that the software will be error free or free from interruptions or other failures. In
particular, the software is not designed for use in hazardous environments requiring failsafe performance. MSE (Australia) PL expressly disclaims any warranty of fitness for
high-risk activities.
7.2 MSE (Australia) PL warrants that it holds the proper rights allowing it to license the
Software and is not currently aware of any actions that may affect its rights to do so.
7.3 MSE (Australia) PL cannot guarantee that the Software will work at all times. If you
change your operating system, the software may not work anymore. You acknowledge
and agree that such changes are fair and reasonable.
7.4 You should make sure that it is legal to use the Software in your country or
jurisdiction. MSE (Australia) PL only provides a license for you to use the software. It is
your responsibility to make sure that You are allowed to use the Software.
7.5 MSE (Australia) PL reserves the right at any time to cease the support of the
Software and to alter prospectively the prices, features, specifications, capabilities,
functions, licensing terms, release dates, general availability or other characteristics of
the Software.
8. SUPPORT
8.1 Except as provided herein, support for the Software is provided to you free of
charge for a period of two years after purchase of a full license.
9. HIGH RISK ACTIVITIES
9.1 The Software is not fault-tolerant and is not designed, manufactured or intended for
use or resale as on-line control equipment in hazardous environments requiring fail-safe
performance, such as in the operation of direct life support machines, in which the
failure of the Software could lead directly to death, personal injury, or severe physical or
environmental damage ("High Risk Activities"). MSE (Australia) PL and its suppliers
specifically disclaim any express or implied warranty of fitness for High Risk Activities.
9.2 Furthermore, under no circumstances must the Software be used as a guide to the
medical management of any living person.
10. THIRD PARTY SITES AND SOFTWARE
10.1 The Software will direct you to third party Web sites. MSE (Australia) PL does not
control, endorse, or guarantee content, including software, data or other information
found on such third party sites. You agree that MSE (Australia) PL is not responsible for
any content, associated links, resources, or services associated with a third party site.
You further agree that MSE (Australia) PL shall not be liable for any loss or damage of
any sort associated with your use of third party content. Access to these sites is
provided for your convenience only.
© 2010 MSE (Australia) PL
164
ECMO Simulation User Manual (v5.7)
10.2 The Software contains third party software. By accepting this EULA, you are also
accepting the additional terms and conditions with respect to such software, if any, forth
herein.
11. SEVERABILITY
11.1 If any provision hereof shall be held illegal, invalid or unenforceable, in whole or in
part, such provision shall be modified to the minimum extent necessary to make it legal,
valid and enforceable, and the legality, validity and enforceability of all other provisions
of this Agreement shall not be affected.
12. GOVERNING LAW
12.1 This Agreement is to be governed by and construed in accordance with the laws
and jurisdiction of the defending party. Service of process upon either party shall be
valid if served by registered or certified mail, return receipt requested and to the most
current address provided by such party. The United Nations Convention on Contracts for
the International Sale of Goods shall not apply to this Agreement.
13. TERMINATION
13.1 Your license to use the Software continues until terminated. This license will
terminate automatically if you fail to comply with any term hereof. No notice shall be
required from MSE (Australia) PL to effect such termination. You may also terminate
this Agreement at any time by notifying MSE (Australia) PL in writing of termination. On
termination, you must destroy all copies of the Software. Your obligation to pay accrued
charges and fees shall survive any termination of this Agreement.
14. ASSIGNMENT
14.1 Neither this Agreement nor any rights granted hereunder may be sold, leased,
assigned, or otherwise transferred, in whole or in part, by you, whether voluntary or by
operation of law. Any such attempted assignment shall be void and of no effect without
the prior written consent of MSE (Australia) PL.
15. ENTIRE AGREEMENT
15.1 This Agreement contains the entire agreement between MSE (Australia) PL and
you related to the software and supersedes all prior agreements and understandings,
whether oral or written. It may be amended only by a writing executed by both parties.
© 2010 MSE (Australia) PL
Index
Index
-HHaematocrit
32, 153
Heart Rate
29, 61
Heparin
27, 59, 148
-AACT Machine
45
APIPA
15, 154
Audio
21
Axis Camera
52
-I-
-BBIS
32
Blood Gas Analysis
BMR
32, 68
Bolus Drugs
27
19, 56, 59
-KK SetPoint
-CCamera
19, 52
Cannula
Position
7, 37, 40, 65
Size
7, 37, 40, 65
Cardiac Index
29, 148
CO2 SetPoint
32, 148
32
-LLatency
50
License
150, 151, 161
Logitech
52
Loss
29
-M-
-DData Recorder
46, 151
Defibrillator
43
Devices
24, 37, 40, 43, 44, 45, 46
Diathermy
29
Distractors
29
Dongle
9, 15
Drug Administration
10, 27, 59
Dual-Display
8, 15, 148
Mode of Operation
10, 13
Models
56, 59, 61, 62, 65, 68, 70
MSE
7, 145
-NNerve Stimulator
NIBP
21
37
-O-
-E-
Oxygenator Failure
ECG
29, 43, 70, 82
Ectopic Frequency
29
Error Messages
151
-FFAQ
148
Fluids
27
FRC
31
33, 62
-PPat Files
13, 19, 73, 74, 75, 148
Patient Monitor
10, 21
ping
150
PowerPoint
74, 150, 154
Protamine
27, 59, 148
-Q-
-GGain
Infusion Drugs
27
Inspector
10, 24
Installation
8, 9, 151
Investigations
24, 75, 76, 80, 81
ipconfig
150
Qs/Qt
31, 56, 58, 148
29
-RRe-circulation
© 2010 MSE (Australia) PL
37, 65
165
166
ECMO Simulation User Manual (v5.7)
Record
21
Resources
24, 75, 76, 80, 81
-SScenarios
29, 73, 74, 81
DataSource
13, 80, 151
Editing
75, 76, 79, 80, 82
Loading
19, 29
Session Name
50
Stethoscope
46
Supervisor
7, 13, 27, 29, 31, 32, 33
SVR
29, 148
System Requirements
8, 153
-TTCP/IP
8, 21, 27, 150
Temperature
32, 68, 153
Therapeutic Interface
10, 27
Timer
21
Trainee
7, 19, 21, 24, 27
TroubleShooting
148, 150, 151
Tutorials
86, 91, 100, 107, 112, 117, 125, 131, 138
-VVA ECMO
7, 33, 40
Vd/Vt
31, 148
Ventilator
44
Versions
15, 46, 154
Video Bit Rate
50
VV ECMO
7, 33, 37
-ZZoom
19
© 2010 MSE (Australia) PL