1
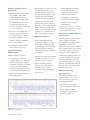
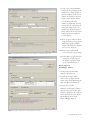
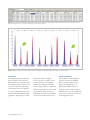
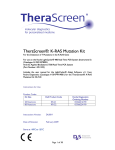
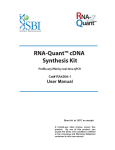
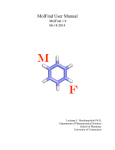
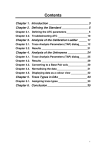
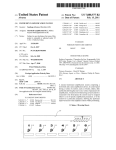
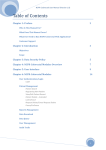
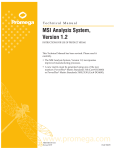
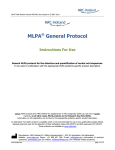
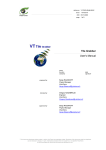
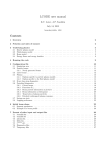
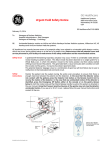
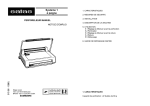
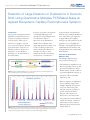
Application Note Quantitative Multiplex PCR-based Assay
Detection of Large Deletions or Duplications in Genomic
DNA Using Quantitative Multiplex PCR-Based Assay on
Applied Biosystems Capillary Electrophoresis Systems
Introduction
Large genomic rearrangements such as
duplications and deletions have been
recognized as pathogenic mutations
for many diseases. These types of
mutations are thought to represent
5.5% of reported mutations1. However,
given that mutation scans have not
included searches for deletions and
duplications, it seems likely that
these figures are an underestimate of
the actual number1.
Detection of genomic rearrangements
is technically challenging and is
typically done using techniques such
as Southern blot analysis or
fluorescence in situ hybridization
(FISH). These techniques often
require high quantities of DNA or can
be time-consuming and laborious,
therefore limiting the efficiency of
molecular screening. To better
facilitate the detection of such large
rearrangements, researchers have
3’
5’
5’
3’
Figure 1. Overview of Multiplex PCR-based assay. The colored bars represent exons that are amplified using
fluorescently-labeled primers represented by the colored arrows.
Overview of Quantitative
Multiplex PCR
The multiplex PCR-based assay
consists of the following steps:
• The simultaneous amplification and
fluorescent labeling of short, specific
genomic DNA fragments, using a
limited number of cycles to allow an
exponential amplification (Figure 1).
• Separation of fluorescent DNA
fragments by CE.
Candidate amplicons
Control amplicons
developed simple, semi-quantitative
methods using a multiplex PCR-based
assay of short fluorescent fragments1,2
on Applied Biosystems capillary
electrophoresis (CE) platforms. In this
application note, we highlight this
technique on the Applied Biosystems
3130/3130xl Genetic Analyzers and
the Applied Biosystems 3730/3730xl
DNA Analyzers.
Control sample
Unknown sample
Figure 2. Example of deletions after control amplicon normalization. Reduction of the height of the peaks corresponds
to the deleted regions while an increase of the height of the peaks suggests a partial duplication of a given region.
The peaks are being displayed using the custom plot colors feature in GeneMapper® Software.
• Pattern comparison of amplification
between different samples. Each
multiplex PCR will yield a pattern
composed of fluorescent peaks,
with each peak corresponding to a
specific exon/genomic DNA
fragment. The comparison of
fluorescence is done between the
same peaks generated from different
samples (for example, normal and
diseased tissue) and not between
different peaks generated from the
sample (Figure 2).
www.appliedbiosystems.com
Multiplex PCR-Based Assay
Requirements
1. Multiplex PCR products, labeled
with 6-FAM™, VIC®, NED™
or PET® fluorescent dye and
generated from one fluorescently
labeled ABI PRISM® primer and
one unlabeled primer for each
exon/genomic DNA fragment and
one control amplicon.
2. GeneScan™ size standard. The size
standard is used in all capillaries
as an internal ladder to align data
from different capillaries and to
eliminate capillary-to-capillary or
run-to-run variability.
3. GeneMapper® Software v4.0 for
data analysis and reporting.
Preparing for multiplex
PCR-based Assay
PCR and sample preparation:
1. Co-amplify short fragments
(>50 and <500bp) in a single tube
with a limited number of cycles2.
It should be noted that users might
need to optimize the multiplex
reaction by designing primers that
are similar in size and melting temperature or modifying components
of the PCR reaction.
2. During PCR, one primer from each
pair is labeled with a fluorescent
dye. The same fluorescent dye can
be used to label all amplicons. Since
the same dye is used to label all
amplicons, it is important that the
fragments do not overlap in size.
Users can choose from a variety of
fluorophores such as 6-FAM™, VIC®,
NED™ or PET® dyes to label their
primers. In the data presented in this
application note, 6-FAM™ dye was
used to label all primers (Figure 3).
Capillary Electrophoresis
1. Dilute each multiplexed PCR
product (final dilution can range
from 1:100 to 1:1000 depending
on peak heights on the instrument)
in 15 μl of Hi-Di™ Formamide
and 0.5 μl of GeneScan™-500 Liz®
Size Standard.
2. Denature the double-stranded PCR
products for 3 minutes at 95°C,
then cool on ice for 2 minutes.
3. Subject the PCR products to
electrophoresis on the Applied
Biosystems 3130 or 3730
series systems using the following
run protocols:
• FragmentAnalysis_36_POP-7
run module and G5 dye set
(Applied Biosystems 3130 or
3130xl Genetic Analyzer).
• GeneMapper_36_POP-7 run
module and G5 dye set (Applied
Biosystems 3730 or 3730xl
DNA Analyzer).
Note: Refer to the instrument user guide or
contact your local Applied Biosystems support
group for additional information.
Data Analysis with GeneMapper®
Software v4.0
Following sample separation on the
3130 or 3730 series analyzers,
data is visualized and analyzed with
GeneMapper® Software v4.0.
Migration of sample peaks is calculated
and normalized relative to the internal
size standard. Samples can then be
compared and the GeneMapper®
Software Report Manager feature can
be used to calculate the peak height
ratio between different samples for
each region. We suggest two analysis
methods: a manual method using the
Dye Scale feature and an automated
method for large series.
Manual analysis using
Dye Scale feature
This method should be used to
compare samples one by one to
the control sample, preferred for
low-throughput analysis
• Export the Genotype tables to
perform calculations in Microsoft®
Excel to identify candidate
samples that contain deletions or
duplications (Figure 4).
Figure 3. Example of a multiplex assay for the 9p21 region using 6-FAM™ dye-label and multiple control amplicons
used for sample normalization.
www.appliedbiosystems.com
Reviewing Plots in
GeneMapper® Software
Described below is a summary of how
plots can be reviewed in GeneMapper®
Software. For additional information,
please refer to the GeneMapper®
user manual.
Figure 4. Example of normalization and ratio calculation in Microsoft Excel using a control sample (blue outlined area)
and Control 11 as the control amplicon. The red outlined region shows a candidate CDKN2A_1528 deletion (ratio < 0.7).
1. Overlay the control and candidate
sample plots.
2. To view the plots in custom colors,
select the Legends options from
under the View menu and then
select Plot Colors/Custom.
3. Normalize the profile to the control
peak height using the Dye Scale
feature. Enter a value in the dye scale
window so that the peak heights of
the control amplicon in the two
samples are the same (Figure 5).
Figure 5. Example of sample normalization with control 11 amplicon using the Dye Scale feature in GeneMapper®
Software v4.0. Deletion of CDKN2A is confirmed as indicated by the arrow.
4. Compare the 2 profiles: Reduction
of the height confirms a deletion
and increase of the height confirms
a duplication of a given exon.
Automated analysis
This method can be used to analyze
series of samples in a more automated
fashion.
1. Steps 1 and 2 from manual analysis
can be automated by choosing the
AFLP analysis method and selecting
“Within run” for Normalization
Scope and “Sum of signal” for
Normalization Method as shown in
Figure 6 (green boxed region).
2. Steps 3 and 4 from manual analysis
can be automated using the Report
Manager function. A summary of
the steps are provided below. Please
refer to the GeneMapper® Software
v4.0 Loss Of Heterozygosity
Getting Started Guide for detailed
information on the use of the
Report Manager.
Figure 6. AFLP analysis method used to normalize samples by sum of signal.
I. Set up a new vertical calculation
that divides the peak height of the
amplicon for a sample by that of
the same amplicon in the control
samples. An example is shown in
Figure 7. Note that the number
of rows will depend on the
number of samples that are being
assayed. Also, the row location of
the control sample needs to be
specified as indicated in Figure 7.
In the example shown, the control
sample was the first sample in a
set of 8 samples.
II. Next, set up an analysis as shown
in Figure 8 and set an appropriate
threshold to identify candidate
samples with deletions or duplications in exons (Figure 8).
Figure 7. The Calculations option lets you specify custom calculations, such as ratio, averages or sums.
III. Repeat steps I and II for all
exons and save the report setting.
IV. In the final step, apply the report
setting that was just created to
the samples to generate a final
report as shown in Figure 9.
Review of plots in
GeneMapper® Software
1. Overlay control and candidate
samples in the plots view.
2. View the plots (Figure 10) in
custom colors as described in the
earlier section (View Menu/Legends
then select Plot Colors/Custom).
3. Compare the 2 profiles:
Reduction of the height confirms a
deletion and increase of the height
confirms a duplication of considered
exons. The results shown in Figure
10 match those shown in the
Report Manager (Figure 9).
Figure 8. Final analysis can be performed to identify duplications or deletions.
www.appliedbiosystems.com
Figure 9. Report generated by GeneMapper® Software v4.0. Candidate deletion or duplication can be flagged for further review. Sample data in line 2 correspond to the red
plots shown in Figure 10. Line 1 is the control sample (blue plot) used for data comparison.
Figure 10. Example of confirmed deletion for sample candidates (red), CDKN2A_1528 and CDKN2A_1530. Refer to Figure 7 for ratio calculation.
Conclusion
The Applied Biosystems 3130 series
Genetic Analyzers and 3730 series
DNA Analyzers, in conjunction with
GeneMapper® Software v4.0, provide
an optimal solution for performing
routine relative fluorescent quantitation assays. These instruments can be
used for both small and large sample
populations. The integration of these
www.appliedbiosystems.com
Acknowledgement
instruments with GeneMapper®
Software provides a complete system
for electrophoresis, data collection,
fragment size calling, and the final
scoring of large deletion or duplication
studies. Together, these features enable
the generation of large amounts of
high-quality data with minimal handson time and streamlined data review.
We would like to acknowledge the
generous contribution of Michel
Barrois and Annie Minière at the
Département de Biologie et de
Pathologie Médicales, Service de
Génétique, Institut Gustave-Roussy,
Villejuif, France, who ran samples that
were used to generate the data shown
in this Application Note.
References
1
J.A.L. Armour, D.E. Barton, D.J.
Cockburn, and G.R. Taylor 2002.
The Detection of Large Deletions or
Duplications in Genomic DNA.
HUMAN MUTATION 20:325-337.
2
Françoise Charbonnier, Grégory Raux,
Qing Wang, Nathalie Drouot,
Frédéric Cordier, Jean-Marc Limacher,
Jean-Christophe Saurin, Alain
Puisieux, Sylviane Olschwang, and
Thierry Frebourg 2000. Detection of
Exon Deletions and Duplications of
the Mismatch Repair Genes in
Hereditary Nonpolyposis Colorectal
Cancer Families Using Multiplex
Polymerase Chain Reaction of Short
Fluorescent Fragments. CANCER
RESEARCH 60, 2760–2763.
Ordering Information
Product
P/N
3130xl and 3100 Capillary Array (36 cm)
4315931
3130 and 3100–Avant Capillary Array (36 cm)
4333464
3130 POP-7 Polymer
4352759
™
10x 31XX Genetic Analyzer Buffer with EDTA
402824
3730 Capillary Array (36 cm)
4331247
3730xl Capillary Array (36 cm)
4331244
3730 POP-7 Polymer (5 pack)
4335615
10x 3730 Running Buffer with EDTA
4335613
Hi-Di Formamide
4311320
™
™
Matrix Standard Set DS-33
4345833
GeneScan -500 LIZ Size Standard
4322682
GeneMapper Software v4.0, Initial License
4366925
GeneMapper Software v4.0, 1 Client License
4366846
™
®
®
®
For additional GeneMapper® Software v4.0 part numbers please visit our web site at
www.appliedbiosystems.com
For Research Use Only. Not for use in diagnostic procedures.
Notice to Purchaser: License Disclaimer
GeneMapper® Software: Purchase of this software product alone does not imply any license under any process, instrument or other apparatus, system, composition, reagent or kit
rights under patent claims owned or otherwise controlled by Applera Corporation, either expressly, or by estoppel.
ABI PRISM, Applied Biosystems, GeneMapper, PET and VIC are registered trademarks and AB (Design), Applera, FAM, GeneScan, Hi-Di, NED and POP-7 are trademarks of Applera
Corporation in the US and/or in certain other countries. All other trademarks are the sole property of their respective owners.
Copyright© 2006. Applied Biosystems. All rights reserved.
Printed in the USA, 1/2006, Publication 106AP23-01
Headquarters
850 Lincoln Centre Drive | Foster City, CA 94404 USA
Phone 650.638.5800 | Toll Free 800.345.5224
www.appliedbiosystems.com
International Sales
For our office locations please call the division
headquarters or refer to our Web site at
www.appliedbiosystems.com/about/offices.cfm