1
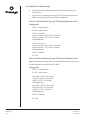
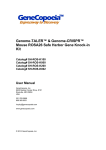
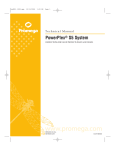
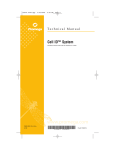
Technical Manual
MSI Analysis System,
Version 1.2
INSTRUCTIONS FOR USE OF PRODUCT MD1641
This Technical Manual has been revised. Please read it
carefully.
• The MSI Analysis System, Version 1.2, incorporates
improved manufacturing processes.
• A new matrix must be generated using one of the new
matrices: PowerPlex® Matrix Standards 310 (Cat.# DG4640)
or PowerPlex® Matrix Standards 3100/3130 (Cat.# DG4650).
PRINTED IN USA
Revised 9/07
Part# TM255
MSI Analysis System, Version 1.2
All technical literature is available on the Internet at: www.promega.com/tbs/
Please visit the web site to verify that you are using the most current version of this Technical Manual.
Please contact Promega Technical Services if you have questions on use of this system.
E-mail: [email protected]
I.
Description..................................................................................................................................2
A. The MSI Analysis System ...............................................................................................2
B. Microsatellite Instability Testing Overview.................................................................4
C. The Internal Lane Standard 600.....................................................................................4
II.
Product Components and Storage Conditions ....................................................................5
III.
DNA Extraction Methods.........................................................................................................5
IV.
DNA Amplification Using the MSI Analysis System .......................................................6
A. Amplification Setup.........................................................................................................6
B. Amplification Thermal Cycling .....................................................................................8
V.
Detection of Amplified Fragments Using the
ABI PRISM® 310 Genetic Analyzer .......................................................................................9
A. Matrix Standardization ...................................................................................................9
B. Sample Preparation........................................................................................................10
C. Instrument Preparation .................................................................................................10
VI.
Detection of Amplified Fragments Using the ABI PRISM® 3100
Genetic Analyzer with Data Collection Software, Version 1.0.1 or 1.1........................11
A. Spectral Calibration .......................................................................................................11
B. Sample Preparation........................................................................................................12
C. Instrument Preparation .................................................................................................12
VII.
Detection of Amplified Fragments Using the ABI PRISM® 3100 or
3100-Avant Genetic Analyzer with Data Collection Software, Version 2.0,
and the Applied Biosystems 3130 or 3130xl Genetic Analyzer ......................................15
A. Spectral Calibration .......................................................................................................15
B. Sample Preparation........................................................................................................16
C. Instrument Preparation .................................................................................................16
VIII.
Data Analysis ...........................................................................................................................18
A. MSI Analysis Overview ................................................................................................19
B. Importing Panel and Bin Files for GeneMapper® Software, Version 4.0................21
C. Creating an Analysis Method Using GeneMapper® Software, Version 4.0............21
D. Creating a Size Standard...............................................................................................23
E. Processing Data ..............................................................................................................24
F.
Reviewing the Size Standard........................................................................................24
G. Reviewing Analyzed Sample Data..............................................................................24
IX.
Troubleshooting.......................................................................................................................25
X.
References .................................................................................................................................27
XI.
Appendix ...................................................................................................................................27
A. Related Products ............................................................................................................27
B. Allele Frequencies for Mononucleotide Repeat Loci................................................28
Promega Corporation · 2800 Woods Hollow Road · Madison, WI 53711-5399 USA · Toll Free in USA 800-356-9526 · Phone 608-274-4330 · Fax 608-277-2516 · www.promega.com
Printed in USA.
Revised 9/07
Part# TM255
Page 1
I.
Description
I.A. The MSI Analysis System
The MSI Analysis System, Version 1.2 (a–e), is a fluorescent PCR-based assay to
detect microsatellite instability. Typically, MSI analysis involves comparison of
allelic profiles of microsatellite markers generated by amplification of DNA
from matching normal and tumor samples. Alleles that are present in the tumor
sample but not found in the corresponding normal samples indicate MSI. The
MSI Analysis System includes fluorescently labeled primers for co-amplification
of seven markers including five mononucleotide repeat markers (BAT-25,
BAT-26, NR-21, NR-24 and MONO-27) and two pentanucleotide repeat markers
(Penta C and Penta D) (Figure 1 and Table 1). The mononucleotide markers are
used for MSI determination, and the pentanucleotide markers are used to detect
potential sample mix-ups and/or contamination. Internal lane size standards
(Figure 2) are added to the amplified samples to assure accurate sizing of alleles
and adjust for run-to-run variation. The PCR products are separated by capillary
electrophoresis (CE) using an ABI PRISM® 310 or 3100 or Applied Biosystems
3130 or 3130xl genetic analyzer, and the output data may be analyzed with the
GeneMapper® software (Applied Biosystems) to determine MSI status of tumor
samples. To simplify data analysis, we have created panel and bin files to allow
automatic assignment of genotypes using GeneMapper® software. The proper
panel and bin files for use with GeneMapper® software can be obtained from
the Promega web site at: www.promega.com/techserv/tools/msi/
Table 1. The MSI Analysis System Locus Information.
Marker
Name
NR-213
BAT-26
BAT-25
NR-243
MONO-27
Penta C
Penta D
Size
K562
Primer
GenBank® Major Repeat
1
2
Number
Sequence
Range (bp) Alleles (bp)
Dye
XM_033393
(A)21
94–101
101
JOE
103–115
113
FL
U41210
(A)26
114–124
122
JOE
L04143
(A)25
X60152
(A)24
130–133
130
TMR
142–154
150
JOE
AC007684
(A)27
143–194
164, 174
TMR
AL138752 (AAAAG)3–15
AC000014 (AAAAG)2–17
135–201
168, 187
FL
1Amplicon
size range is based on genotyping 300–500 individuals from three
different racial groups (Caucasian-American, Asian-American and AfricanAmerican). Rare alleles outside these size ranges may exist.
2Allele
3See
sizes determined using the ABI PRISM® 3100 genetic analyzer.
reference 1.
Promega Corporation · 2800 Woods Hollow Road · Madison, WI 53711-5399 USA · Toll Free in USA 800-356-9526 · Phone 608-274-4330 · Fax 608-277-2516 · www.promega.com
Part# TM255
Page 2
Printed in USA.
Revised 9/07
The mononucleotide repeat markers included in the MSI Analysis System were
selected for high sensitivity and specificity to alterations in tumor samples with
mismatch repair defects (1–3). These mononucleotide repeat markers are quasimonomorphic; that is, almost all individuals are homozygous for the same
common allele for a given marker (see Section XI.B for allele frequencies). Use
of monomorphic markers simplifies data interpretation. The pentanucleotide
repeat markers have been selected for their high level of polymorphism and
low degree of MSI to uniquely identify samples, helping confirm that tumor
and matching normal samples are from the same individual.
A.
B.
C.
4586CCA
D.
Figure 1. The MSI Analysis System, Version 1.2. A single normal genomic DNA
template (1–2ng) was amplified using the MSI Analysis System, and the PCR products
were analyzed using an ABI PRISM® 3100 genetic analyzer. Panel A. An
electropherogram shows the five mononucleotide loci, two pentanucleotide loci and
Internal Lane Standard 600 peaks. Panel B. An electropherogram showing peaks of the
fluorescein-labeled loci, BAT-26 and Penta D. Panel C. An electropherogram showing the
peaks of JOE-labeled loci, NR-21, BAT-25 and MONO-27. Panel D. An electropherogram
showing the peaks of TMR-labeled loci, NR-24 and Penta C.
Promega Corporation · 2800 Woods Hollow Road · Madison, WI 53711-5399 USA · Toll Free in USA 800-356-9526 · Phone 608-274-4330 · Fax 608-277-2516 · www.promega.com
Printed in USA.
Revised 9/07
Part# TM255
Page 3
I.B. Microsatellite Instability Testing Overview
Microsatellites are short, tandemly repeated DNA sequences from 1–6 base pairs
in length (4,5). These repeats are distributed throughout the human genome and
often vary in length from one individual to another due to differences in the
number of tandem repeats at each locus. Microsatellite markers can be used to
detect a form of genomic instability called microsatellite instability (MSI) (6–9).
MSI is a change in length of a microsatellite allele due to insertion or deletion of
repeating units during DNA replication and failure of the DNA mismatch
repair system to correct these errors. MSI analysis can be used as a screening
method to identify samples for further characterization.
In 1997, a National Cancer Institute (NCI) workshop recommended a panel of
five microsatellite markers to detect MSI consisting of two mononucleotide
markers and three dinucleotide repeats (10). Samples with instability in two or
more of these markers are defined as MSI-High (MSI-H), whereas those with one
unstable marker are designated as MSI-Low (MSI-L). Samples with no detectable
alterations are MSI-stable (MSS). Limitations in the original panel resulting
from inclusion of dinucleotide repeats were addressed at a 2002 NCI workshop,
and revised recommendations for MSI detection were proposed (11). It was
recommended to substitute mononucleotide for dinucleotide repeat markers to
improve sensitivity and specificity for detection of MSI.
I.C. The Internal Lane Standard 600
The Internal Lane Standard 600 (ILS 600) contains 22 DNA fragments of 60, 80,
100, 120, 140, 160, 180, 200, 225, 250, 275, 300, 325, 350, 375, 400, 425, 450, 475,
500, 550 and 600 bases in length (Figure 2). Each fragment is labeled with
carboxy-X-rhodamine (CXR) and is detected separately (as a fourth color) in the
presence of MSI Analysis System-amplified material using the ABI PRISM® 310
or 3100 or Applied Biosystems 3130 or 3130xl genetic analyzer. The ILS 600 is
designed for use in each CE injection to increase precision in analysis when
using the MSI Analysis System. Protocols for preparation and use of this
internal lane standard are provided in Sections V.B, VI.B and VII.B.
1,200
100
200
400
300
600
500
1,000
800
600
60 80
120 140 160 180
225 250 275
325 350 375
425 450 475
550
400
0
5751TA
200
Figure 2. Internal Lane Standard 600 (ILS 600).
Promega Corporation · 2800 Woods Hollow Road · Madison, WI 53711-5399 USA · Toll Free in USA 800-356-9526 · Phone 608-274-4330 · Fax 608-277-2516 · www.promega.com
Part# TM255
Page 4
Printed in USA.
Revised 9/07
II.
Product Components and Storage Conditions
Product
MSI Analysis System, Version 1.2
Size
100 reactions (50 reaction pairs)
Cat.#
MD1641
For In Vitro Research Use Only. Not For Use In Diagnostic Procedures.
Each system contains sufficient reagents to perform 100 reactions (50 reaction pairs).
Includes:
Preamplification Components Box (Yellow Label)
• 1 × 100μl MSI 10X Primer Pair Mix
• 1 × 300μl Gold ST★R 10X Buffer
• 1 × 1.25ml Nuclease-Free Water
•
1 × 3μg K562 High Molecular Weight DNA (10ng/μl)
Postamplification Components Box (Magenta Label)
• 1 × 150μl Internal Lane Standard (ILS) 600
•
1 Protocol
Storage Conditions: Store all components at –20°C. The MSI 10X Primer Pair Mix
and the Internal Lane Standard 600 are light-sensitive and must be stored in the
dark.
Available Separately
Product
PowerPlex® Matrix Standards 310
PowerPlex® Matrix Standards 3100/3130
Size
1 each
1 each
Cat.#
DG4640
DG4650
Not for Medical Diagnostic Use.
III. DNA Extraction Methods
Obtaining sufficient high-quality DNA from formalin-fixed, paraffin-embedded
tissues can be problematic. DNA is often degraded due to prolonged or unsuitable
fixation of the tissue sample before embedding in paraffin. Therefore, we recommend
using the MagneSil® Genomic, Fixed Tissue System (Cat.# MD1490) to extract DNA
from paraffin-embedded tissues when using the MSI Analysis System. The MagneSil®
Genomic, Fixed Tissue System provides a simple technique to prepare genomic DNA
from formalin-fixed, paraffin-embedded tissue. After an overnight Proteinase K
digestion, genomic DNA can be manually purified from formalin-fixed, paraffinembedded thin tissue sections in less than an hour. Amplifiable genomic DNA can
be isolated from 10μm thin sections without the use of organic solvents or
centrifugation of the lysate prior to purification. Samples can be processed in the
manual format using the MagneSphere® Technology Magnetic Separation Stand
(twelve-position) (Cat.# Z5342). DNA extraction using the MagneSil® Genomic,
Fixed Tissue System can also be automated. Please contact your local Promega
Branch Office or Distributor (contact information available at: www.promega.com)
or email: [email protected] for more information.
Promega Corporation · 2800 Woods Hollow Road · Madison, WI 53711-5399 USA · Toll Free in USA 800-356-9526 · Phone 608-274-4330 · Fax 608-277-2516 · www.promega.com
Printed in USA.
Revised 9/07
Part# TM255
Page 5
IV. DNA Amplification Using the MSI Analysis System
Materials to Be Supplied by the User
• thermal cycler [GeneAmp® system 9600 or 9700 (Applied Biosystems)]
• microcentrifuge
• 0.2ml (thin-walled) microcentrifuge tubes, MicroAmp® reaction tube strips or
MicroAmp® optical 96-well reaction plates (Applied Biosystems)
• 1.5ml amber-colored microcentrifuge tubes
• aerosol-resistant pipette tips
• AmpliTaq Gold® DNA polymerase (Applied Biosystems)
The MSI Analysis System is optimized to amplify 1–2ng of genomic DNA in a 10μl
reaction volume using the protocols detailed below. However, optimization of input
DNA amounts should be performed in individual laboratories to adjust for
variations in yield and quality of DNA resulting from differences in samples and/or
DNA isolation methods. Using excessive amounts of DNA template may result in
peak heights exceeding the linear detection range of the CE instruments. Use of
insufficient DNA template can result in low PCR yields, and peak heights may fall
below detection limits (50RFU). Accurate quantitation of template DNA is highly
recommended.
The MSI Analysis System is optimized for use with the GeneAmp® PCR system 9600
and 9700 thermal cyclers.
IV.A. Amplification Setup
Note: We strongly recommend using gloves and aerosol-resistant pipette tips to
prevent cross-contamination. We recommend keeping all preamplification and
postamplification reagents in separate rooms. Prepare amplification reactions in
a room dedicated for reaction setup. Use equipment and supplies dedicated for
amplification setup.
1.
Thaw the Gold ST★R 10X Buffer and MSI Analysis System 10X Primer
Pair Mix.
2.
Mix these reagents by vortexing for 5–10 seconds before each use. A
precipitate may form in the Gold ST★R Buffer. If this occurs, warm the
buffer briefly at 37°C, then vortex until it is in solution.
3.
To prepare the Amplification Mix, determine the number of reactions to be
set up. This should include positive and negative control reactions. Add
1 or 2 reactions to this number to compensate for losses during pipetting.
This approach ensures that you will have enough PCR master mix for all
samples. It also ensures that each reaction contains the same master mix.
4.
Place one 0.2ml microcentrifuge tube for each reaction into a rack, and
label appropriately. Alternatively use MicroAmp® optical 96-well reaction
plates.
Promega Corporation · 2800 Woods Hollow Road · Madison, WI 53711-5399 USA · Toll Free in USA 800-356-9526 · Phone 608-274-4330 · Fax 608-277-2516 · www.promega.com
Part# TM255
Page 6
Printed in USA.
Revised 9/07
5.
The following table shows the component volumes per sample when
using a DNA template volume of 2μl in a 10μl reaction volume. If a
different template volume is required, the water volume should be
adjusted accordingly.
Amplification Mix for the MSI Analysis System
Component
Nuclease-Free Water
Gold ST★R 10X Buffer
MSI Analysis System 10X Primer Pair Mix
AmpliTaq Gold® DNA polymerase (5u/μl)
total reaction volume
Volume Per Sample
5.85μl
1.00μl
1.00μl
0.15μl
8.00μl
Note: Pipetting volumes smaller than 1μl is inaccurate. We recommend
preparing enough Amplification Mix to avoid pipetting such small
volumes.
6.
Combine the final volumes of Nuclease-Free Water, Gold ST★R 10X
Buffer, MSI Analysis System 10X Primer Pair Mix and AmpliTaq Gold®
DNA polymerase in a sterile, 1.5ml amber tube. Mix gently.
7.
Transfer 8μl of the Amplification Mix to the bottom of each reaction tube
or well.
8.
Pipet 2μl of the template DNA (1–2ng) for each sample into the bottom of
the respective tube or well containing Amplification Mix. Mix by pipetting
several times.
!
Be sure that the template DNA is well mixed before transferring it into the
bottom of the tube or well containing the Amplification Mix.
Note: Store DNA templates in nuclease-free water or TE–4 buffer [10mM
Tris HCl (pH 8.0), 0.1mM EDTA]. If the template DNA is stored in TE
buffer that is not pH 8.0 or contains a higher EDTA concentration, the
volume of DNA sample added should not exceed 20% of the final reaction
volume. PCR amplification efficiency and quality can be greatly altered by
changes in pH (due to added Tris-HCl), available magnesium
concentration (due to chelation by EDTA) or other PCR inhibitors, which
may be present at low concentrations depending on the source of the
template DNA and the extraction procedure used.
9.
For the positive amplification control, dilute the K562 Genomic DNA
sample 1:10 to 1ng/μl in Nuclease-Free Water. Pipet 2ng of the diluted
DNA into the bottom of the tube or well containing the Amplification Mix.
Mix by pipetting several times.
10. For the negative amplification control, pipet Nuclease-Free Water (instead
of template DNA) into a microcentrifuge reaction tube or well containing
the Amplification Mix. Mix by pipetting several times.
Promega Corporation · 2800 Woods Hollow Road · Madison, WI 53711-5399 USA · Toll Free in USA 800-356-9526 · Phone 608-274-4330 · Fax 608-277-2516 · www.promega.com
Printed in USA.
Revised 9/07
Part# TM255
Page 7
IV.B. Amplification Thermal Cycling
1.
Assemble the tubes or MicroAmp® optical 96-well reaction plates in a
thermal cycler.
2.
Select and run a recommended protocol for the GeneAmp® PCR system
9600 or the GeneAmp® PCR system 9700 provided below.
Protocol for the Perkin-Elmer GeneAmp® PCR System 9600 Thermal Cycler
Cycling profile:
95°C for 11 minutes, then:
96°C for 1 minute, then:
94°C for 30 seconds
ramp 68 seconds to 58°C, hold for 30 seconds
ramp 50 seconds to 70°C, hold for 1 minute
for 10 cycles, then:
90°C for 30 seconds
ramp 60 seconds to 58°C, hold for 30 seconds
ramp 50 seconds to 70°C, hold for 1 minute
for 20 cycles, then:
60°C for 30 minutes
4°C soak
Protocol for the Perkin-Elmer GeneAmp® PCR System 9700 Thermal Cycler
Note: Perkin-Elmer GeneAmp® PCR system 9700 thermal cycling conditions are
in 9600 emulation mode and use the silver block.
Cycling profile:
95°C for 11 minutes, then:
96°C for 1 minute, then:
ramp 100% to 94°C for 30 seconds,
ramp 29% to 58°C for 30 seconds,
ramp 23% to 70°C for 1 minute,
for 10 cycles, then:
ramp 100% to 90°C for 30 seconds,
ramp 29% to 58°C for 30 seconds,
ramp 23% to 70°C for 1 minute,
for 20 cycles, then:
60°C for 30 minutes
4°C soak
Promega Corporation · 2800 Woods Hollow Road · Madison, WI 53711-5399 USA · Toll Free in USA 800-356-9526 · Phone 608-274-4330 · Fax 608-277-2516 · www.promega.com
Part# TM255
Page 8
Printed in USA.
Revised 9/07
3.
After completion of the thermal cycling protocol, store the samples at
–20°C, protected from light.
Note: DNA quantity and quality affect PCR yield. Use the recommended
DNA purification methods and accurate quantitation to minimize
problems. Cycle number may be modified to adjust for variations in DNA
amount but should not exceed 32 cycles.
V.
Detection of Amplified Fragments Using the ABI PRISM® 310 Genetic Analyzer
Materials to Be Supplied by the User
• dry heating block, water bath, or thermal cycler
• 310 capillaries, 47cm × 50μm (Applied Biosystems)
• performance optimized polymer 4 (POP-4™) (Applied Biosystems)
• 10X genetic analyzer buffer with EDTA (Applied Biosystems)
• sample tubes and septa (Applied Biosystems)
• aerosol-resistant pipette tips
• Hi-Di™ formamide (Applied Biosystems Cat.# 4311320)
• PowerPlex® Matrix Standards, 310 (Cat.# DG4640)
• crushed ice
!
Note: The quality of the formamide is critical. Use Hi-Di™ formamide with a
conductivity less than 100μS/cm. Freeze formamide in aliquots at –20°C. Multiple
freeze-thaw cycles or long-term storage at 4°C may cause a breakdown of the
formamide. Formamide with conductivity greater than 100μS/cm may contain ions
that compete with DNA during injection. This results in lower peak heights and
reduced sensitivity. A longer injection time may not increase the signal.
!
Caution: Formamide is an irritant and a teratogen; avoid inhalation and contact with
skin. Read the warning label, and take appropriate precautions when handling this
substance. Always wear gloves and safety glasses when working with formamide.
V.A. Matrix Standardization
The PowerPlex® Matrix Standards, 310 (Cat.# DG4640), are required for matrix
standardization on the ABI PRISM® 310 genetic analyzer. The PowerPlex®
Matrix Standards, 3100/3130 (Cat.# DG4650), cannot be used to generate a
matrix on the ABI PRISM® 310 genetic analyzer. For protocols and additional
information on matrix standardization, see the PowerPlex® Matrix Standards, 310
Technical Bulletin #TBD021 (supplied with Cat.# DG4640) available upon
request from Promega or online at: www.promega.com/tbs/
Proper generation of a matrix file is critical to evaluate multicolor systems
with the ABI PRISM® 310 genetic analyzer. A matrix must be generated for each
ABI PRISM® 310 genetic analyzer. For answers to questions about matrix
creation send an e-mail message to: [email protected]
Promega Corporation · 2800 Woods Hollow Road · Madison, WI 53711-5399 USA · Toll Free in USA 800-356-9526 · Phone 608-274-4330 · Fax 608-277-2516 · www.promega.com
Printed in USA.
Revised 9/07
Part# TM255
Page 9
V.B. Sample Preparation
The Internal Lane Standard 600 is included in each experiment to standardize
the analysis of amplified samples and uses a fourth color.
1.
Prepare a loading cocktail by combining and mixing the Internal Lane
Standard 600 (ILS 600) and deionized formamide as follows:
[(1.0μl ILS 600) + (24μl deionized formamide) × (# injections)]
2.
Combine 25μl of the prepared loading cocktail and 1μl of amplified sample.
Note: Instrument detection limits vary; therefore, injection time or the
amount of product mixed with loading cocktail may need to be increased
or decreased. If the peak heights are too high (i.e., greater than 3,000RFU),
the samples can be diluted in Gold ST★R 1X Buffer before mixing with
loading cocktail. This may result in uneven allele peak heights across loci.
For best results, use less DNA template in the amplification reactions. The
volume of ILS 600 can also be adjusted.
3.
Denature the samples and ladder by heating at 95°C for 3 minutes and
immediately chill on crushed ice for 3 minutes. Denature the samples just
prior to loading.
4.
Assemble the tubes in the appropriate autosampler tray (48- or 96-tube).
5.
Place the autosampler tray in the instrument, and close the instrument
doors.
V.C. Instrument Preparation
Refer to the ABI PRISM® genetic analyzer user’s manual for instructions on
cleaning the pump block, installing the capillary, calibrating the autosampler
and adding polymer to the syringe.
1.
Open the ABI PRISM® 310 collection software.
2.
Prepare a GeneMapper® sample sheet as described in the ABI PRISM® 310
genetic analyzer user’s manual. Enter the appropriate sample information
in the sample info column.
3.
Create a new GeneMapper® injection list. Select the appropriate sample
sheet by using the pull-down menu.
4.
Select the “GS STR POP4 (1ml) A” Module using the pull-down menu.
Change the injection time to 2 seconds, and keep the settings for the
remaining parameters as shown below:
Inj. Secs:
1–5
Inj. kV:
15.0
Run kV:
15.0
Run °C:
60
Run Time:
30
Note: You may need to optimize injection time for individual instruments.
Injection times of 1–5 seconds are recommended with 1–2ng of template
DNA.
Promega Corporation · 2800 Woods Hollow Road · Madison, WI 53711-5399 USA · Toll Free in USA 800-356-9526 · Phone 608-274-4330 · Fax 608-277-2516 · www.promega.com
Part# TM255
Page 10
Printed in USA.
Revised 9/07
5.
Select the appropriate matrix file (Section V.A).
6.
To analyze the data automatically, select the auto-analyze check box
and the appropriate analysis parameters and size standard. Refer to the
ABI PRISM® 310 genetic analyzer user’s manual for specific information
on these options.
7.
After loading the sample tray and closing the doors, select “Run” to start
the capillary electrophoresis system.
8.
Monitor the electrophoresis by observing the raw data and status windows.
Each sample will take approximately 30 minutes for syringe pumping,
sample injection and sample electrophoresis.
VI. Detection of Amplified Fragments Using the ABI PRISM® 3100 Genetic Analyzer
with Data Collection Software, Version 1.01 or 1.1
!
!
Materials to Be Supplied by the User
• dry heating block, water bath, or thermal cycler
• crushed ice
• aerosol-resistant pipette tips
• 3100 capillary array, 36cm
• performance optimized polymer 4 (POP-4™) (Applied Biosystems)
• 10X genetic analyzer buffer with EDTA (Applied Biosystems)
• sample tubes and septa for the 3100 (Applied Biosystems)
• Hi-Di™ formamide (Applied Biosystems Cat.# 4311320)
• PowerPlex® Matrix Standards, 3100 (Cat.# DG4650)
Note: The quality of the formamide is critical. Use Hi-Di™ formamide with a
conductivity less than 100μS/cm. Freeze formamide in aliquots at –20°C. Multiple
freeze-thaw cycles or long-term storage at 4°C may cause a breakdown of the
formamide. Formamide with conductivity greater than 100μS/cm may contain ions
that compete with DNA during injection. This results in lower peak heights and
reduced sensitivity. A longer injection time may not increase the signal.
Caution: Formamide is an irritant and a teratogen; avoid inhalation and contact with
skin. Read the warning label, and take appropriate precautions when handling this
substance. Always wear gloves and safety glasses when working with formamide.
VI.A. Spectral Calibration
The PowerPlex® Matrix Standards, 3100/3130 (Cat.# DG4650) are required for
spectral calibration on the ABI PRISM® 3100 genetic analyzer. The PowerPlex®
Matrix Standards, 310 (Cat.# DG4640) cannot be used to generate a matrix on
the ABI PRISM® 3100 genetic analyzer. For protocols and additional
information on spectral calibration, see the PowerPlex® Matrix Standards,
3100/3130 Technical Bulletin #TBD022 (supplied with Cat.# DG4650) available
upon request from Promega or online at: www.promega.com/tbs/
Proper spectral calibration is critical to evaluate multicolor systems with the
ABI PRISM® 3100 genetic analyzer. Spectral calibration must be performed for
each ABI PRISM® 3100 genetic analyzer. For answers to questions about matrix
creation send an e-mail to: [email protected]
Promega Corporation · 2800 Woods Hollow Road · Madison, WI 53711-5399 USA · Toll Free in USA 800-356-9526 · Phone 608-274-4330 · Fax 608-277-2516 · www.promega.com
Printed in USA.
Revised 9/07
Part# TM255
Page 11
VI.B. Sample Preparation
The Internal Lane Standard 600 is included in each experiment to standardize
analysis of amplified samples and uses a fourth color.
1.
Prepare a loading cocktail by combining and mixing the Internal Lane
Standard 600 (ILS 600) and deionized formamide as follows:
[(0.5μl ILS 600) × (# injections)] + [(9.5μl deionized formamide) × (# injections)]
Note: The volume of internal lane standard used in the loading cocktail
can also be increased or decreased to adjust the intensity of the size
standard peaks. The optimal peak height for the 100-base fragment of the
internal lane standard is 500–1,000RFU. If the peak heights are too low, we
recommend altering the formamide/internal lane standard mix to contain
1.0μl of ILS 600 and 9.0μl of Hi-Di™ formamide. If the peak heights are
too high, we recommend altering the loading cocktail to contain 0.25μl of
ILS 600 and 9.75μl of formamide.
2.
Vortex for 10–15 seconds.
3.
Pipet 10μl of formamide/internal lane standard mix into each well.
4.
Add 1μl of amplified sample. Cover wells with appropriate septa.
Note: Instrument detection limits vary; therefore, the injection time or the
amount of product mixed with loading cocktail may need to be increased
or decreased. If peak heights are too high (>4,000–6,000RFU), the samples
can be diluted in Gold ST★R 1X Buffer before mixing with loading
cocktail.
5.
Centrifuge plate briefly to remove air bubbles from the wells if necessary.
6.
Denature samples at 95°C for 3 minutes, then immediately chill on
crushed ice for 3 minutes. Denature the samples just prior to loading the
instrument.
VI.C. Instrument Preparation
Refer to the ABI PRISM® 3100 genetic analyzer user’s manual for instructions
on cleaning the pump blocks, installing the capillary array, performing a spatial
calibration and adding polymer to the reserve syringe.
1.
Open the ABI PRISM® 3100 data collection software.
2.
Open a new plate record. Name the plate, and select “GeneScan”. Select
the plate size (96-well or 384-well). Select “Finish”.
3.
Complete the plate record spreadsheet for the well you have loaded. Enter
appropriate information into the “Sample Name” column (Figure 3).
4.
In the “Project Name” column, select “3100_Project1” from the pull-down
menu.
5.
In the “Dye Set” column, select “F” from the pull-down menu.
Promega Corporation · 2800 Woods Hollow Road · Madison, WI 53711-5399 USA · Toll Free in USA 800-356-9526 · Phone 608-274-4330 · Fax 608-277-2516 · www.promega.com
Part# TM255
Page 12
Printed in USA.
Revised 9/07
4769CA
Figure 3. The Plate Editor.
6.
In the “Run Module 1” column, select “GeneScan36_POP4DefaultModule”
from the pull-down menu.
7.
To collect the data without autoanalyzing, select “No Selection” in the
“Analysis Module 1” column. Analysis parameters can be applied after
data collection and during data analysis using the GeneMapper® analysis
software.
To analyze the data during data collection, an appropriate analysis
module must be selected in the “Analysis Module 1” column. Refer to the
ABI PRISM® 3100 genetic analyzer user’s manual for specific instructions
on creating analysis modules.
8.
Select “OK.” This new plate record will appear in the pending plate
records table on the plate setup page of the collection software.
9.
Place the samples in instrument, and close the instrument doors.
10. In the pending plate records table, click once on the name of the plate
record you just created.
11. Once the plate record is highlighted, click the plate graphic corresponding
to the plate on the autosampler that contains your amplified samples.
Promega Corporation · 2800 Woods Hollow Road · Madison, WI 53711-5399 USA · Toll Free in USA 800-356-9526 · Phone 608-274-4330 · Fax 608-277-2516 · www.promega.com
Printed in USA.
Revised 9/07
Part# TM255
Page 13
VI.C. Instrument Preparation (continued)
4637CA
12. When the plate record is linked to the plate, the plate graphic will change
from yellow to green, the plate record moves from the pending plate
records table to the linked plate records table, and the “Run Instrument”
button becomes enabled (Figure 4).
Figure 4. The Plate View tab.
13. Select “Run Instrument” on the tool bar to start the sample run.
14. Monitor electrophoresis by observing the run, status, array and capillary
views windows in the collection software. Each run (16 samples/
capillaries) will take approximately 45 minutes.
Promega Corporation · 2800 Woods Hollow Road · Madison, WI 53711-5399 USA · Toll Free in USA 800-356-9526 · Phone 608-274-4330 · Fax 608-277-2516 · www.promega.com
Part# TM255
Page 14
Printed in USA.
Revised 9/07
VII. Detection of Amplified Fragments Using the ABI PRISM® 3100 or 3100-Avant
Genetic Analyzer with Data Collection Software, Version 2.0, and the Applied
Biosystems 3130 or 3130xl Genetic Analyzer
Materials to Be Supplied by the User
• 95°C dry heating block, water bath or thermal cycler
• crushed ice
• aerosol-resistant pipette tips
• 3100 or 3130 capillary array, 36cm
• performance optimized polymer 4 (POP-4™) (Applied Biosystems)
• 10X genetic analyzer buffer with EDTA (Applied Biosystems)
• MicroAmp® optical 96-well plate and septa (Applied Biosystems)
• Hi-Di™ formamide (Applied Biosystems Cat.# 4311320)
• PowerPlex® Matrix Standards, 3100/3130 (Cat.# DG4650)
!
The quality of the formamide is critical. Use Hi-Di™ formamide with a conductivity
less than 100μS/cm. Freeze formamide in aliquots at –20°C. Multiple freeze-thaw
cycles or long-term storage at 4°C may cause a breakdown of the formamide.
Formamide with a conductivity greater than 100μS/cm may contain ions that
compete with DNA during injection. This results in lower peak heights and reduced
sensitivity. A longer injection time may not increase the signal.
!
Caution: Formamide is an irritant and a teratogen; avoid inhalation and contact with
skin. Read the warning label, and take appropriate precautions when handling this
substance. Always wear gloves and safety glasses when working with formamide.
VII.A. Spectral Calibration
The PowerPlex® Matrix Standards, 3100/3130 (Cat.# DG4650) are required for
spectral calibration on the ABI PRISM® 3100 genetic analyzer. The PowerPlex®
Matrix Standards, 310 (Cat.# DG4640) cannot be used to generate a matrix on
the ABI PRISM® 3100 genetic analyzer. For protocols and additional information
on spectral calibration, see the PowerPlex® Matrix Standards, 3100/3130 Technical
Bulletin #TBD022 (supplied with Cat.# DG4650) available upon request from
Promega or online at: www.promega.com/tbs/
Proper spectral calibration is critical to evaluate multicolor systems with the
ABI PRISM® 3100 genetic analyzer. Spectral calibration must be performed for
each ABI PRISM® 3100 genetic analyzer. For answers to questions about matrix
creation send an e-mail to: [email protected]
Promega Corporation · 2800 Woods Hollow Road · Madison, WI 53711-5399 USA · Toll Free in USA 800-356-9526 · Phone 608-274-4330 · Fax 608-277-2516 · www.promega.com
Printed in USA.
Revised 9/07
Part# TM255
Page 15
VII.B. Sample Preparation
The Internal Lane Standard 600 is included in each experiment to standardize
analysis of amplified samples and uses a fourth color.
1.
Prepare a loading cocktail by combining and mixing the internal lane
standard and Hi-Di™ formamide as follows:
[(0.5μl ILS 600) × (# injections)] + [(9.5μl Hi-Di™ formamide) × (# injections)]
Note: The volume of internal lane standard used in the loading cocktail
can also be increased or decreased to adjust the intensity of the size
standard peaks. The optimal peak height for the 100-base fragment of the
internal lane standard is 500–1,000RFU. If the peak heights are too low, we
recommend altering the formamide/internal lane standard mix to contain
1.0μl of ILS 600 and 9.0μl of Hi-Di™ formamide. If the peak heights are
too high, we recommend altering the loading cocktail to contain 0.25μl of
ILS 600 and 9.75μl of formamide.
2.
Mix for 10–15 seconds using a vortex mixer.
3.
Pipet 10μl of formamide/internal lane standard mix into each well.
4.
Add 1μl of amplified sample. Cover wells with appropriate septa.
Note: Instrument detection limits vary; therefore, injection time or the
amount of product mixed with loading cocktail may need to be increased
or decreased. Use the “Module Manager” in the data collection software to
modify the injection time or voltage in the run module. If the peak heights
are higher than desired, the samples can be diluted in Gold ST★R 1X
Buffer before mixing with loading cocktail. This may result in uneven allele
peak heights across loci. For best results, use less DNA template in the
amplification reactions or reduce the number of cycles in the amplification
program by 2–4 cycles to achieve the desired signal intensity.
5.
Centrifuge plate briefly to remove air bubbles from the wells if necessary.
6.
Denature samples at 95°C for 3 minutes, then immediately chill on
crushed ice for 3 minutes. Denature the samples just prior to loading the
instrument.
VII.C. Instrument Preparation
Refer to the instrument users’ manual for instructions on cleaning, installing the
capillary array, performing a spatial calibration and adding polymer.
Analyze the samples as described in the user’s manual for the ABI PRISM® 3100
or 3100-Avant genetic analyzer with data collection software, version 2.0, and
Applied Biosystems 3130 or 3130xl genetic analyzer with the following
exceptions.
Promega Corporation · 2800 Woods Hollow Road · Madison, WI 53711-5399 USA · Toll Free in USA 800-356-9526 · Phone 608-274-4330 · Fax 608-277-2516 · www.promega.com
Part# TM255
Page 16
Printed in USA.
Revised 9/07
1.
In the Module Manager, select “New”. Select “Regular” in the Type dropdown list, and select “HIDFragmentAnalysis36_POP4” in the Template
drop-down list. Confirm that the injection time is 5 seconds and the
injection voltage is 3kV. Lengthen the run time to 2,000 seconds. Give a
descriptive name to your run module, and select “OK”.
Note: Sensitivities of instruments may vary. The injection time and voltage
may be adjusted in the Module Manager. A suggested range for the
injection time is 3–22 seconds and for the injection voltage is 1–3kV.
2.
In the Protocol Manager, select “New”. Type a name for your protocol.
Select “Regular” in the Type drop-down list, and select the run module
you created in the previous step in the Run Module drop-down list.
Lastly, select “F” in the Dye-Set drop-down list. Select “OK.
3.
In the Plate Manager, create a new plate record as described in the
instrument user’s manual. In the dialog box that appears, select
“GeneMapper—Generic” in the Application drop-down list, and select the
appropriate plate type (96-well). Add entries in the owner and operator
windows, and select “OK”.
Note: If autoanalysis of sample data is desired, refer to the instrument
user’s manual for instructions.
4.
In the GeneMapper® plate record, enter sample names in the appropriate
cells. Scroll to the right. In the “Results group 1” column, select the
desired results group. In the “Instrument Protocol 1” column, select the
protocol you created in Step 2. Be sure this information is present for each
row that contains a sample name. Select “OK”.
Notes:
1.
To create a new results group, select “New” in the drop-down menu
in the results group column. Select the General tab, and enter a
name. Select the Analysis tab, and select “GeneMapper—Generic” in
the Analysis type drop-down list.
2.
It is helpful to use names with similar initial characters when naming
matched tumor and normal samples so that these samples remain
together when analysis results are sorted.
5.
Place samples in the instrument, and close the instrument doors.
6.
In the spectral viewer, confirm that dye set F is active, and set the correct
active calibration for dye set F.
7.
In the run scheduler, locate the plate record that you just created in Steps
3 and 4, and click once on the name to highlight it.
8.
Once the plate record is highlighted, click the plate graphic that
corresponds to the plate on the autosampler that contains your amplified
samples.
9.
When the plate record is linked to the plate, the plate graphic will change
from yellow to green, and the green Run Instrument arrow becomes
enabled.
Promega Corporation · 2800 Woods Hollow Road · Madison, WI 53711-5399 USA · Toll Free in USA 800-356-9526 · Phone 608-274-4330 · Fax 608-277-2516 · www.promega.com
Printed in USA.
Revised 9/07
Part# TM255
Page 17
VII.C. Instrument Preparation (continued)
10. Click on the green Run Instrument arrow on the toolbar to start the
sample run.
11. Monitor electrophoresis by observing the run, view, array or capillaries
viewer window in the data collection software. Each injection will take
approximately 45 minutes.
VIII. Data Analysis
VIII.A. MSI Analysis Overview
Detection of MSI is based on comparison of allelic profiles generated from
amplification of matching normal and tumor DNA. The appearance of novel
alleles in the tumor DNA indicates microsatellite instability (Figure 5). The MSI
Analysis System allows the co-amplification and detection of a panel of
microsatellite markers that have been shown to be sensitive and specific for
detection of MSI-H tumors with mismatch repair deficiencies (2,3). Specific PCR
product sizes and the respective fluorescent dyes used for labeling of each
microsatellite marker are described in Table 1.
NR-21
BAT-26 BAT-25 NR-24
MONO-27
Penta D
4639TA
Penta C
Figure 5. Microsatellite instability assays using the MSI Analysis System. Matching normal
samples (top panel) and MSI-positive colon tumor samples (bottom panel) were analyzed using the
MSI Analysis System. Two nanograms of genomic DNA were amplified and analyzed using an
ABI PRISM® 3100 genetic analyzer, and the allelic patterns of the normal and tumor samples are
shown. The presence of new alleles in the tumor sample (see arrows) that were not present in the
normal sample indicates MSI. PCR product sizes and respective fluorescent dyes for loci contained in
the MSI Analysis System are provided in Table 1.
Promega Corporation · 2800 Woods Hollow Road · Madison, WI 53711-5399 USA · Toll Free in USA 800-356-9526 · Phone 608-274-4330 · Fax 608-277-2516 · www.promega.com
Part# TM255
Page 18
Printed in USA.
Revised 9/07
The Bethesda guidelines (10,11) recommend that tumor samples in which ≥40%
of microsatellite markers are altered (≥2 altered markers out of 5) be classified
as MSI-H. Tumor samples with less than 40% mononucleotide repeat markers
altered may be classified as nonMSI-H. However, the occurrence of even one
altered mononucleotide marker in mismatch repair-proficient tumors is
uncommon, and repeating the MSI assay or performing additional methods of
analysis may be necessary to accurately classify these samples (3).
Pentanucleotide markers are not intended for use in MSI classification.
Amplification of microsatellite markers will yield one or two major allele peaks,
depending upon whether the individual is homozygous (one) or heterozygous
(two) for that marker. In addition, amplification of microsatellite markers often
generates artifact peaks called stutter (12). Electropherograms of
mononucleotide markers show a number of less intense stutter peaks at 1bp
intervals from the most prominent or true allele peak (Figure 6). A shift in allele
size of 3bp or more in the tumor samples compared to matching normal samples
is usually scored as MSI-positive for that marker. The mononucleotide markers
included in the MSI Analysis System are nearly monomorphic so that most
individuals are homozygous for the same common allele for a given marker
(see Section XI.B for allele frequencies).
Penta C
4635TA
NR-24
Figure 6. Stutter artifact peaks. Stutter peaks (arrows) generated by polymerase slippage during
PCR amplification of short tandem repeats are clearly visible at the mononucleotide marker NR-24
(left) at 1bp intervals from the true or tallest allele peak. Much smaller stutter peaks can also be seen
at the Penta C marker, 5bp from true allele peaks.
Promega Corporation · 2800 Woods Hollow Road · Madison, WI 53711-5399 USA · Toll Free in USA 800-356-9526 · Phone 608-274-4330 · Fax 608-277-2516 · www.promega.com
Printed in USA.
Revised 9/07
Part# TM255
Page 19
VIII.A. MSI Analysis Overview (continued)
Two polymorphic pentanucleotide repeat markers, Penta C and Penta D, are
included in the MSI Analysis System to help confirm that tumor and matching
normal samples are from the same individual (13,14). Alleles found in the
normal sample should also be present in the tumor if the tumor is from the
same individual. MSI has been observed in 14% of MSI-H tumors in Penta C
and 35% in Penta D, so additional pentanucleotide alleles may also be present
in some MSI-H tumor samples (2). A matching probability between 1:10 and
1:16 was calculated for Penta C, and between 1:18 to 1:33 for Penta D based
upon allele frequency data (13,14). Matching probability is the average number
of randomly selected people you would have to survey before you would find
two with the same allelic pattern. Using both pentanucleotide markers should
allow detection of sample mix-ups over 99% of the time.
For data analysis, the GeneMapper® analysis software from Applied Biosystems
is required. The software allows manual and automated analysis of the raw data
and generates electropherograms with accompanying data tables displaying
PCR fragment lengths (in base pairs) and quantitation of peak heights (in RFU).
GeneMapper® results should be reviewed to eliminate artifact peaks caused by
bleedthrough, stutter or CE spikes (Figures 6 and 7). Refer to the GeneMapper®
analysis user’s manual for detailed instructions on fragment analysis and
genotyping. To simplify data analysis, we have created panel and bin files to
allow automatic assignment of genotypes using GeneMapper® software. The
proper panel and bin files for use with GeneMapper® software can be obtained
from the Promega web site at: www.promega.com/techserv/tools/msi/
BAT-26
BAT-25
MONO-27
Penta D
4634TA
NR-21
Figure 7. Bleedthrough or pull-up peaks. Smaller peaks (arrows) directly under much higher peaks
in another color channel are called bleedthrough or pull-up peaks. Bleedthrough can occur when
peak heights are excessive or if a poor or incorrect matrix has been applied to the samples.
Promega Corporation · 2800 Woods Hollow Road · Madison, WI 53711-5399 USA · Toll Free in USA 800-356-9526 · Phone 608-274-4330 · Fax 608-277-2516 · www.promega.com
Part# TM255
Page 20
Printed in USA.
Revised 9/07
VIII.B. Importing Panel and Bin Files for GeneMapper® Software, Version 4.0.
To facilitate analysis of data generated with the MSI Analysis System, Version 1.2,
we have created panel and bin files to allow automatic assignment of genotypes
using GeneMapper® software, version 4.0. For GeneMapper® software, version
3.5 or 3.7, we recommend upgrading to version 4.0. Version 4.0 has been
improved to allow analysis of the mononucleotide and pentanucleotide repeats
amplified by the MSI Analysis System.
Panel and bin files for the MSI Analysis System, Version 1.2, can be downloaded
from the Promega web site at: www.promega.com/techserv/tools/msi/
1.
Open the GeneMapper® software, version 4.0.
2.
Select ”Tools”, then “Panel Manager”.
3.
Highlight the Panel Manager icon in the upper left tile (navigation pane).
4.
From the menu, select “File”, then “Import Panels”.
5.
Navigate to the file location where the panel and bin files have been saved
on your computer. Select the file “Promega_Panels_MSI_GM4.0.0.txt”,
then “Import”.
6.
In the navigation pane, highlight the “Promega MSI” folder that you just
imported.
7.
Select “File”, then “Import Bin Set”.
8.
Navigate to the file location where the panel and bin files have been saved
on your computer. Select the file, “Promega_Bins_MSI_GM4.0.0.txt”, then
“Import”.
9.
At the bottom of the Panel Manager window, select “Apply”, then “OK”.
The panel manager window will close automatically.
VIII.C. Creating an Analysis Method Using GeneMapper® Software, Version 4.0
1.
Select “Tools”, then “GeneMapper Manager”.
2.
Select the Analysis Methods tab.
3.
Select “New”, and a new analysis method dialog box will open.
4.
Select “Microsatellite”. Select “OK”.
5.
Enter a descriptive name for the analysis method, such as “Promega MSI”.
6.
Select the Allele tab.
7.
Select the bin set corresponding to the Promega MSI System,
“Promega_MSI”.
8.
Ensure that the “Use marker-specific stutter ratio if available” box is
checked.
Promega Corporation · 2800 Woods Hollow Road · Madison, WI 53711-5399 USA · Toll Free in USA 800-356-9526 · Phone 608-274-4330 · Fax 608-277-2516 · www.promega.com
Printed in USA.
Revised 9/07
Part# TM255
Page 21
VIII.C. Creating an Analysis Method Using GeneMapper® Software, Version 4.0
(continued)
Enter the values shown in Figure 8 for proper filtering of peaks when
using the MSI Analysis System. These filter settings will allow the user to
display plotted data with the highest RFU peak labeled in each set of
amplified fragments within each mononucleotide marker range. These
settings can be changed if an alternative labeling strategy is desired. For
an explanation of the proper usage and effect of these settings, refer to
your GeneMapper® software version 4.0 documentation.
6975TA
9.
Figure 8. The Analysis Method Editor. The PlusA ratio setting for Mono repeats is 0.9999.
10. Select the Peak Detector tab. We recommend the settings shown in Figure 9.
Peak Amplitude Thresholds should be determined by the individual
laboratory based on desired sample peak intensity range, dynamic range
of the instrument, and noise or background signal that is observed in
analyzed data. Peak Amplitude Thresholds of between 50 and 200RFU are
commonly used.
11. Select “OK” to save your settings.
Promega Corporation · 2800 Woods Hollow Road · Madison, WI 53711-5399 USA · Toll Free in USA 800-356-9526 · Phone 608-274-4330 · Fax 608-277-2516 · www.promega.com
Part# TM255
Page 22
Printed in USA.
Revised 9/07
6976TA
Figure 9. The recommended settings for the Peak Detector tab.
VIII.D. Creating a Size Standard
1.
Select “Tools”, then “GeneMapper Manager”.
2.
Select the Size Standard tab.
3.
Select “New”.
4.
Select “Basic or Advanced” (Figure 9). The type of analysis method
selected must match the peak detection algorithm selected on the peak
detector tab for the analysis method. Select “OK”.
5.
Enter a detailed name, such as “ILS 600”, in the Size Standard Editor.
Make sure that red is selected as the color for the size standard dye.
6.
Enter the sizes of the internal lane standard fragments into the table.
7.
Select “OK”.
Promega Corporation · 2800 Woods Hollow Road · Madison, WI 53711-5399 USA · Toll Free in USA 800-356-9526 · Phone 608-274-4330 · Fax 608-277-2516 · www.promega.com
Printed in USA.
Revised 9/07
Part# TM255
Page 23
VIII.E. Processing Data
1.
In the File menu, select “New Project”, then “Microsatellite”.
2.
Import sample files into a new project using the “Add Samples to Project”
selection under the File menu.
3.
In the Sample Type column, use the drop-down menu to select “Sample”,
“Positive Control” or “Negative Control” as appropriate.
4.
In the Analysis Method column, select the analysis method created in
Section VIII.D.
5.
In the Panel column, select “Promega MSI” from the Promega MSI folder.
This is the panel set that was imported in Section VIII.C.
6.
In the Size Standard column, select the size standard that was created in
Section VIII.E.
7.
If analyzing data from an ABI PRISM® 310 genetic analyzer, ensure that
the appropriate matrix file is selected in the Matrix column.
8.
Select “Analyze” (green arrow button) to start the data analysis.
VIII.F. Reviewing the Size Standard
When correctly labeled, the ILS 600 should give a Sizing Quality score near 1.0.
Problems with ILS analysis (extra peaks, mislabeling, etc.) will generate a Sizing
Quality score of between 0.0 and 1.0 and may result in sample analysis failure.
If analysis fails but the fragments have been assigned correctly, the Sizing
Quality can be overridden by selecting “Override SQ”. The samples can then be
reanalyzed. For more information refer to Section IX or your GeneMapper®
software, version 4.0, documentation.
1.
Select all samples in the Samples tab by selecting “Edit”, then “Select All”.
2.
Open the Size Match Editor by selecting “Analysis”, then “Size Match
Editor”.
3.
View the Size Matches tab to review the Size Quality score, size standard
peaks and size standard peak labels for each sample.
4.
Determine if all peaks in the size standard are present and labeled
correctly for the Promega Internal Lane Standard (ILS) 600 as shown in
Figure 2.
VIII.G. Reviewing Analyzed Sample Data
The GeneMapper® software, version 4.0, provides a variety of options for
sample data display. The Promega MSI Analysis System panel and bin
download package includes an informational document and an example plot
settings file, which illustrates one option for review of sample data. For
additional information on viewing sample plots please refer to your
GeneMapper® software version 4.0 documentation.
Promega Corporation · 2800 Woods Hollow Road · Madison, WI 53711-5399 USA · Toll Free in USA 800-356-9526 · Phone 608-274-4330 · Fax 608-277-2516 · www.promega.com
Part# TM255
Page 24
Printed in USA.
Revised 9/07
IX. Troubleshooting
For questions not addressed here, please contact your local Promega Branch Office or Distributor.
Contact information available at: www.promega.com. E-mail: [email protected]
Symptoms
Weak fluorescent signal
for allele peaks
Excessive fluorescent
signal for allele peaks
Causes and Comments
Insufficient template DNA. Make sure DNA is accurately
quantitated, and use the recommended amount of template
DNA.
Degraded DNA. Prepare new genomic DNA.
Impure DNA template. Impurities in DNA preparation may
inhibit PCR. Clean up DNA or prepare new genomic DNA.
Poor-quality DNA. Improper or prolonged fixation of
paraffin-embedded samples can result in low DNA yields
and poor-quality DNA. Repeat DNA preparation, or use the
MagneSil® Genomic, Fixed Tissue System (Cat.# MD1490).
Poor capillary electrophoresis injection (ILS 600 peaks also
affected). Re-inject sample. Check instrument manual for
instructions.
Poor-quality formamide. Use high-quality formamide with
conductivity of <100μS/cm.
High salt concentration or altered pH. DNA volume should
not exceed 20% of the total reaction volume. Carryover from
DNA sample of K+, Na+, Mg2+ or EDTA can have a deleterious
effect on PCR. Changes in pH may also affect PCR.
Thermal cycler or tube problems. Confirm PCR program is
correct. Use recommended thermal cycler and tubes.
Calibration of heat block may be required.
Samples not properly denatured before loading. Heatdenature samples for recommended time and cool on crushed
ice immediately prior to loading the capillary.
Amplification reaction components not added to the bottom of
the tube or well. Gently tap the tube or plate to move the drop
to bottom, or centrifuge briefly.
Too much template DNA.
• Make sure DNA is accurately quantitated, and use 1–2ng in
PCR.
• Dilute PCR product 1:5 to 1:10 in sterile deionized water or
1X Gold ST★R Buffer prior to preparing loading solution.
Promega Corporation · 2800 Woods Hollow Road · Madison, WI 53711-5399 USA · Toll Free in USA 800-356-9526 · Phone 608-274-4330 · Fax 608-277-2516 · www.promega.com
Printed in USA.
Revised 9/07
Part# TM255
Page 25
IX. Troubleshooting (continued)
Symptoms
Extra peaks visible in
one or all dye colors
Preferential amplification
of smaller loci
Causes and Comments
Microsatellite artifacts (i.e., stutter). PCR amplification of
microsatellite loci generates artifacts that appear as smaller
peaks 1bp above or below the prominent mononucleotide
repeat allele or 5bp below a pentanucleotide repeat allele.
Stutter band peak heights will be higher if too much template
DNA is used.
Excess amount of DNA. One to two nanograms of DNA are
recommended. Amplification of >2ng DNA template may
result in a higher number of stutter bands. Use less DNA
template, or reduce the number of cycles in the amplification
program by 2 or more cycles.
Pull-up or bleedthrough. Pull-up can occur when peak heights
are excessive or if a poor or incorrect matrix has been applied
to the samples. Increase the peak amplitude threshold
(i.e., 150–200RFU) in the analysis method and reanalyze. If
problems persist, generate a new matrix or perform a new
spectral calibration, and apply to samples.
Samples not properly denatured prior to loading. Heatdenature the samples for the recommended time and cool on
crushed ice immediately prior to loading the capillary.
CE-related artifacts (contaminants). Contaminants in the water
used both on the ABI PRISM® 310 genetic analyzer and to
dilute the 10X genetic analyzer buffer may generate peaks in
the blue and green dye colors. Use autoclaved water, change
vials and wash the buffer reservoir.
Contamination with another template DNA or previously
amplified DNA. Cross-contamination can be a problem. Use
aerosol-resistant pipette tips, and change gloves regularly.
DNA is cross-linked in sample. DNA prepared from paraffinembedded samples often contain DNA that is cross-linked
with other DNA or protein molecules, preventing
amplification of longer DNA fragments. Use the MagneSil®
Genomic, Fixed Tissue System to purify DNA.
Degraded DNA. DNA template is degraded into smaller
fragments with the larger loci showing diminished yield.
Insufficient template DNA. Use the recommended amount of
template DNA.
Excess amounts of DNA. We recommend 1–2ng of DNA.
Amplification of >2ng DNA template may result in an
imbalance in yields with the smaller loci showing more
amplification product than the larger loci. Use less DNA
template, or reduce the number of cycles in the amplification
program by 2 or more cycles.
Promega Corporation · 2800 Woods Hollow Road · Madison, WI 53711-5399 USA · Toll Free in USA 800-356-9526 · Phone 608-274-4330 · Fax 608-277-2516 · www.promega.com
Part# TM255
Page 26
Printed in USA.
Revised 9/07
X.
References
1.
Suraweera, N. et al. (2002) Evaluation of tumor microsatellite instability using five quasimonomorphic
mononucleotide repeats and pentaplex PCR. Gastroenterology 123, 1804–11.
2.
Bacher, J.W. et al. (2004) Development of a fluorescent multiplex assay for detection of MSI-High
tumors. Dis. Markers 20, 237–50.
3.
Murphy, K.M. et al. (2006) Comparison of the microsatellite instability analysis system and the Bethesda
panel for the determination of microsatellite instability in colorectal cancers. J. Mol. Diagn. 8, 305–11.
4.
Tautz, D. (1989) Hypervariability of simple sequences as a general source for polymorphic DNA
markers. Nucleic Acids Res. 17, 6463–71.
5.
Weber, J. and May, P. (1989) Abundant class of human DNA polymorphisms which can be typed
using the polymerase chain reaction. Am. J. Hum. Genet. 44, 388–96.
6.
Aaltonen, L. et al. (1993) Clues to the pathogenesis of familial colorectal cancer. Science 260, 812–6.
7.
Ionov, Y. et al. (1993) Ubiquitous somatic mutations in simple repeated sequences reveal a new
mechanism for colonic carcinogenesis. Nature 363, 558–61.
8.
Peltomaki, P. et al. (1993) Microsatellite instability is associated with tumors that characterize the
hereditary non-polyposis colorectal carcinoma syndrome. Cancer Res. 53, 5853–5.
9.
Thibodeau, S.N., Bren, G. and Schaid, D. (1993) Microsatellite instability in cancer of the proximal
colon. Science 260, 816–9.
10.
Boland, C.R. et al. (1998) A national cancer institute workshop on microsatellite instability for cancer
detection and familial predisposition: Development of international criteria for the determination of
microsatellite instability in colorectal cancer. Cancer Res. 58, 5248–57.
11.
Umar, A. et al. (2004) Revised Bethesda guidelines for hereditary nonpolyposis colorectal cancer
(Lynch syndrome) and microsatellite instability. J. Natl. Cancer Inst. 96, 261–8.
12.
Levinson, G. and Gutman, G. (1987) Slipped-strand mispairing: A major mechanism for DNA
sequence evolution. Mol. Biol. Evol. 4, 203–21.
13.
Bacher, J. et al. (1999) Pentanucleotide repeats: Highly polymorphic genetic markers displaying
minimal stutter artifact. Proceedings from the Ninth International Symposium on Human Identification. This
can be viewed online at: www.promega.com/geneticidproc/ussymp9proc/default.html
14.
Bacher, J. and Schumm, J. (1998) Development of highly polymorphic pentanucleotide tandem repeat
loci with low stutter. Profiles in DNA 2(2), 3–6.
XI. Appendix
XI.A. Related Products
Product
MagneSil® Genomic, Fixed Tissue System*
ART® 20P Pipet Tip, 20μl
ART® 100 Pipet Tip, 100μl
ART® 100E Pipet Tip, 100μl
ART® 200 Pipet Tip, 200μl
ART® 1000E Pipet Tip, 1,000μl
Size
100 samples
960/pk
960/pk
960/pk
960/pk
800/pk
Cat.#
MD1490
DY1071
DY1101
DY1111
DY1121
DY1131
*For Laboratory Use.
Promega Corporation · 2800 Woods Hollow Road · Madison, WI 53711-5399 USA · Toll Free in USA 800-356-9526 · Phone 608-274-4330 · Fax 608-277-2516 · www.promega.com
Printed in USA.
Revised 9/07
Part# TM255
Page 27
XI.B. Allele Frequencies for Mononucleotide Repeat Loci
BAT-25
BAT-26
Size (bp) Caucasian African Asian
Size (bp) Caucasian African Asian
113
114
115
116
117
118
119
120
121
122
123
124
1
0
0
0
0
0
0
7
108
58
8
0
1
1
12
7
1
8
14
111
103
12
5
0
0
0
0
0
0
0
0
4
93
30
0
0
n=
182
274
127
103
104
105
106
107
108
109
110
111
112
113
114
115
0
0
0
0
1
0
0
0
0
14
140
22
0
23
0
0
2
0
0
0
0
4
38
131
57
0
0
0
0
1
0
0
0
0
0
3
115
8
0
n=
177
255
127
NR-24
Size (bp) Caucasian African Asian
MONO-27
130
131
132
133
60
113
0
0
197
34
0
2
49
77
0
2
Size (bp) Caucasian African Asian
n=
173
233
128
NR-21
Size (bp) Caucasian African Asian
94
95
96
97
98
99
100
101
1
1
0
0
27
134
14
1
2
0
3
60
100
62
9
0
8
0
0
0
14
89
23
1
n=
178
236
135
142
143
144
145
146
147
148
149
150
151
152
153
154
155
0
0
0
0
0
0
0
59
107
5
0
0
0
0
1
0
0
0
0
0
3
88
141
4
1
0
1
0
0
0
0
0
0
0
0
42
83
1
0
0
0
1
n=
172
239
127
Promega Corporation · 2800 Woods Hollow Road · Madison, WI 53711-5399 USA · Toll Free in USA 800-356-9526 · Phone 608-274-4330 · Fax 608-277-2516 · www.promega.com
Part# TM255
Page 28
Printed in USA.
Revised 9/07
(a)U.S. Pat. Nos. 6,844,152 and 7,202,031 and Australian Pat. No. 2001290868 have been issued to Promega Corporation for detection of
microsatellite instability and its use in diagnosing tumors. Other patents are pending.
(b)U.S. Pat. Nos. 6,238,863 and 6,767,703 and Korean Pat. No. 691195 have been issued to Promega Corporation for materials and methods
for identifying and analyzing intermediate tandem repeat DNA markers. Other patents are pending.
(c)Licensed under U.S. Pat. Nos. 6,566,053 and 7,090,978.
(d)This product is designed and sold for use in the multiplex PCR process covered by U.S. Pat. No. 5,582,989, Canadian Pat. No. 1,339,731
and Australian Pat. No. 634175. A limited license has been granted under the patent to use only this amount of the product to practice the
multiplex PCR process and is conveyed to the purchaser by the purchase of this product.
(e)STR loci are the subject of U.S. Pat. No. RE 37,984, German Pat. No. DE 38 34 636 C2 and other patents issued to the Max-Planck-
Gesellschaft zur Förderung der Wissenschaften, e.V., Germany. The development and use of STR loci are covered by U.S. Pat. No.
5,364,759, Australian Pat. No. 670231 and other pending patents assigned to Baylor College of Medicine, Houston, Texas.
Patents for the foundational PCR process, European Pat. Nos. 201,184 and 200,362, expired on March 28, 2006. In the U.S., the patents
covering the foundational PCR process expired on March 29, 2005.
© 2004, 2007 Promega Corporation. All Rights Reserved.
MagneSil, MagneSphere and PowerPlex are registered trademarks of Promega Corporation.
ABI PRISM, GeneMapper and MicroAmp are registered trademarks of Applera Corporation. AmpliTaq Gold and GeneAmp are registered
trademarks of Roche Molecular Systems, Inc. ART is a registered trademark of Molecular Bio-Products, Inc. GenBank is a registered
trademark of U.S. Department of Health and Human Services. POP-4 and Hi-Di are trademarks of Applera Corporation.
Products may be covered by pending or issued patents or may have certain limitations. Please visit our Web site for more information.
All prices and specifications are subject to change without prior notice.
Product claims are subject to change. Please contact Promega Technical Services or access the Promega online catalog for the most up-todate information on Promega products.
Promega Corporation · 2800 Woods Hollow Road · Madison, WI 53711-5399 USA · Toll Free in USA 800-356-9526 · Phone 608-274-4330 · Fax 608-277-2516 · www.promega.com
Printed in USA.
Revised 9/07
Part# TM255
Page 29