1
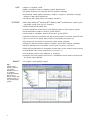
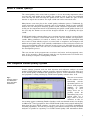
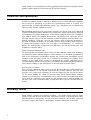
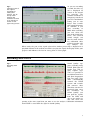
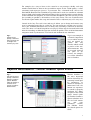
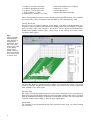
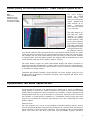
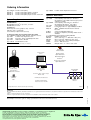
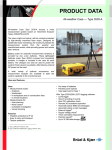
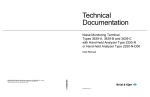
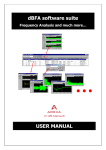
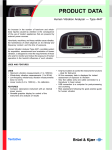
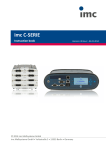
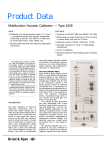
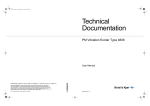
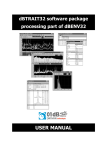
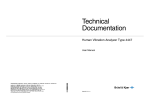
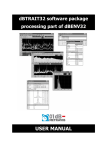
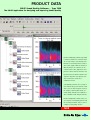
PRODUCT DATA PULSE Sound Quality Software Type 7698 The PULSE Application for Analysing and Improving Sound Quality PULSE Sound Quality Software Type 7698 is advanced, stand-alone software which can record, analyse, edit and play back binaural or monaural product sounds or other audio signals. With the benefit of OLE automation, the software can be controlled from other applications and provides a direct interface with the new Psychoacoustic Test Bench software. This organises subjective and objective tests and correlates the results into a combination metric. Sound Quality software can record up to four channels using a four channel sound card. It can also import signals recorded, for example, with Portable PULSE, for sound quality evaluations in addition to other available PULSE analysis methods. PULSE Sound Quality software is the core of a complete sound quality system. Add the necessary hardware and you have a complete sound quality solution. 7698 USES ❍ Analysis of product sound ❍ Editing recorded sounds to simulate product improvement ❍ Preparing listening tests and play lists for product evaluation ❍ Determining sound quality parameters: loudness, sharpness, fluctuation strength, roughness and related parameters ❍ Visualising and editing orders on rotating machinery FEATURES ❍ Runs under Microsoft Windows NT/Windows 2000 with Microsoft sound system compatible sound card (up to 4 channels) ❍ Reads PULSE Data Recorder files ❍ Controls PULSE for measurements with Data Recorder or Time Capture options ❍ Powerful Zwicker Loudness analysis option BZ 5265 ❍ Order Analysis capabilities with Order Analysis option BZ 5277 ❍ Subjective/Objective correlation tool with Psychoacoustic Test Bench option BZ 5301 ❍ Jury Test tool for designing and executing sound quality listening tests ❍ Psychoacoustic correction for improved realism during playback ❍ Frequency and time domain editing of multiple signals with real-time capability ❍ Displays multispectra as waterfalls, contour plots, envelopes and slices ❍ Fully OLE programmable for automating routine tasks such as analysis and reporting ❍ User-definable edits using Visual Basic or Visual C++ ❍ User-definable macros using VBScript or JavaScript ❍ Performs regression analysis and creates a combination metric with Psychoacoustic Test Bench option BZ 5301 BENEFIT Fig. 1 PULSE Sound Quality software runs under Windows NT on an ordinary computer without DSP, and is a proven, robust, and reliable centre of any sound quality system 2 ❍ A complete sound quality solution What is Sound Quality? The sound quality of the noise from a product is of ever increasing importance when assessing the total quality of the product. For products such as sports cars and hand tools, not only the level, but also the quality of the noise it makes are part of what attracts or repels the customer. The right sound can lead to increased sales. Many factors come into play in the sound quality evaluation process. Traditional objective measuring and analysis methods such as A-weighted sound pressure and FFT analysis are not enough for analysing product sound. Customer expectations and jury testing are also important factors for determining acceptable sound quality because, in the end, only the human ear can tell the designer whether he is producing the right sound. PULSE Sound Quality software allows you to perform objective analysis based on Zwicker Loudness. It analyses sound much closer to the way the human ear experiences sounds. Many parameters of sound, or metrics, can be defined and quantified with these tools to show whether aspects of sound such as roughness and sharpness fall within an acceptable range. Used carefully, combinations of these objective results can show good correlation with the subjective results of jury test, although they can never completely replace them. This can save a tremendous amount of time and money in the development process. This new version of the program runs even faster and easier, and consequently saves time. It also provides a direct interface with the new Psychoacoustic Test Bench tool, thus ensuring a complete sound quality solution. The Complete Sound Quality System Besides offering powerful tools for both objective and subjective analysis of sound quality, PULSE Sound Quality software provides complete facilities for every other step of the sound quality evaluation and optimisation process. From calibration, recording, and playback to editing and display, PULSE Sound Quality software does it all. Fig. 2 Creating reports for Microsoft Excel with OLE Automation You can even customise the software to automatically execute operations with its extensive OLE programmability, or with VBScript or JavaScript. These are especially useful for automating long or involved tasks for a large batch of measurements or files or for creating reports containing Zwicker Loudness and user-defined metrics for display in a Microsoft Excel spreadsheet. Since PULSE Sound Quality now controls and imports data from the base PULSE software, you have easy access to PULSE’s multichannel recording capabilities. You can also pre-analyse your data in real time with any of PULSE analyzers in parallel to exporting it to PULSE Sound Quality. OLE automation allows 3 Sound Quality to be controlled from other applications and completely integrates Sound Quality software with the Psychoacoustic Test Bench software. Calibration and Equalisation In order to compare sounds recorded at different times or under different conditions and to repeat as accurately as possible the psychoacoustic effect of a sound, it is important that you work with calibrated signals. Type 7698 allows you to calibrate the input by using acoustic calibration signals. When binaural signals are to be presented to listeners, the output needs to be calibrated as well. PULSE Sound Quality software lets you adjust the output signal level for playback via headphones by placing headphones on the Sound Quality Head and Torso Simulator Type 4100 or 4100 D. The software also includes a weighting curve correction at both the input and the output. This has a number of fixed weightings and also allows userdefined weightings. Using this, you can, for example, apply a frequency weighting to the input to correct the diffuse- or free-field response of Type 4100 to a flat response, or correct the frequency response for a specific set of headphones, e.g., Sennheiser HD 580. The audio quality is improved using FIR filters. You can also define your own headphone correction filters. Charge Injection Calibration (CIC) The Sound Quality Program also allows you to use Brüel & Kjær’s patented CIC technique for calibration checks and fault diagnosis. This method uses an electrical signal directed back to the microphone preamplifier junction via a third cable. Information on the condition of the recording system can be obtained by monitoring the stability of the response to this signal. If the response is unchanged the acoustic calibration can be considered intact. Various other responses can indicate microphone diaphragm damage, short circuits, leakage in the microphone or disconnected or broken cables. Psychoacoustic Correction Once you have calibrated your system, you may discover that the sound played back through headphones is not realistic compared to the real-life situation. This can arise from the sense of the room, vibration, or even the simple fact that you can no longer see the object making the sound. To overcome this, PULSE Sound Quality software contains a psychoacoustic correction filter on top of the normal corrections that allows you to alter the amplitude of the signal over the frequency range 20 Hz to 20 kHz. You can then save your user-defined filter specification when you are satisfied with the results. Recording Sounds Sound Quality supports four channel recording – two audio signals and two tacho signals. Using two ZE 0770 sound cards interconnected with a synchronisation cable (included with the sound card), you can record four channels (one binaural signal and two tacho signals). ZE 0770 A is a high-quality, 2-channel Notebook sound card. 4 Fig. 3 Selecting a part of the original recording for editing and analysis. You do this by either entering the number of seconds or by selecting a section of the signal using cursors As you are recording a sound, the time signal is displayed on screen as the recording proceeds. The sound is recorded in a temporary .wav file on your PC’s hard disk allowing you to save longer time records than would otherwise be available if you were recording to RAM. After recording, you can select the part of the signal of interest. The selected sound sample can then be saved, including calibration data, ready for further editing, analysis, etc. When ready, the part of the signal selected for further processing is displayed in a playback monitor in the toolbar area. When you play the signal, the display shows your progress and indicates the level at every point on a bar graph. Recording with PULSE Fig. 4 Recording with PULSE Sound Quality supports recording using PULSE. With Data Recorder Type 7701 or Time Capture Type 7705, it is possible to record data from Portable Data Acquisition Unit Type 2827. Type 7698 automatically controls the PULSE system and records and retrieves data. Time data can also be retrieved from existing recordings. In Sound Quality, you can pick the signals from the HATS and one or two tacho signals and select the portion of the time signal that you want to use for analysis. Calibration information from PULSE is saved with the signal in Sound Quality. 5 Editing Sounds Fig. 5 The Real-time Filter editing tool Sound quality is normally used interactively, for example in the product design phase, to carry out time and frequency filtering before the signal is played back for listening. This allows the localisation of signal components that are important for the subjective impression of the sound, or the simulation of proposed modifications to a test piece. Both time and frequency domain editing are available, as is real-time editing (see Fig. 5). Using Type 7698 and its advanced, time, and frequency cursors you can apply the following edits: ❍ ❍ ❍ ❍ ❍ ❍ ❍ ❍ ❍ Peak Limit Time Attenuation Demodulation Frequency Attenuate Frequency Shift Passband Peak Limit Frequency Harmonic Frequency Attenuate Harmonic Frequency Shift ❍ ❍ ❍ ❍ ❍ ❍ ❍ ❍ Harmonic Passband Generator Mixer Order Attenuation Order Passband Real-time Filter Frequency Response Filter User-defined Filter The edits can be applied to a signal sequentially in any combination. Each edit sequence is displayed in the project view as a branch of the signal tree. Within the limits imposed by your PC’s RAM, you can have any number of signals in a project, and any number and combination of edits for each signal. You can also create your own using Visual Basic or Visual C++. The cursor readings can be customised using ActiveX. Metrics, special calculations or combinations of standard metrics can easily be tested and require only minor coding in Visual Basic. Real-time Editing The Real-time Filter lets you change filter parameters while listening to the result. This makes it easy to find characteristics of the sound and alter it. Analysing Sound Quality Subjective Listening Tests Subjective listening tests are vital for assessing a product’s competitiveness. The final evaluation of the sound quality of a product is normally made using a group, or jury, representing the targeted customer group, in a listening test. 6 For example, for a jury to listen to the sound in a car prototype, ideally, each jury member would have to drive in the car and then report on the sound quality – a time consuming and expensive process. To overcome this, a binaural head, such as the Brüel & Kjær Head and Torso Simulator Type 4100 can be used as a stand-in for a human being to make a high-quality binaural recording of the specified product sounds directly to the hard disk of a computer or a DAT recorder. Headphones are then used to present the recording in parallel to all members of the jury off-site. The new Psychoacoustic Test Bench option makes the setup and control of these subjective jury tests very easy. Control of the Jury Test tool is fast and easy. It allows you to design and execute jury tests by arranging wave files in a play list. You can create two specific types of tests. One is the Semantic Differential test, in which each recording is rated on an absolute scale. The other is a Paired Comparison test (Fig. 6). Delays may be inserted before and after the recordings to allow the jury time to form an opinion. There is full and automatic integration with Psychoacoustic Test Bench with dedicated user interfaces. Fig. 6 PULSE Sound Quality software’s Play List allows you to design and execute jury tests Fig. 6 is an example of a Paired Comparison test, in which recordings are paired together. The jury decides which sound it prefers of the two. Announcements may be inserted between the pairs to announce, for example, test object identification or number. Objective Measurements – Zwicker Loudness Option BZ 5265 Fig. 7 The PULSE Sound Quality software’s Zwicker Loudness option BZ 5265 adds the ability to calculate and analyse Loudnessbased metrics Zwicker Loudness is the most important tool for objectively determining sound quality parameters, or metrics. It attempts to understand how the human ear experiences sounds by properly weighting the different parts of the sound signal. Sound Quality’s Zwicker Loudness option calculates metrics for both stationary and nonstationary sounds. The Zwicker Loudness-based options include: 7 ❍ ❍ ❍ ❍ ❍ Loudness Averaged Spectrum Loudness Waterfall Spectrum Loudness Contour Spectrum Total Loudness vs. Time Instantaneous Loudness vs. Time ❍ ❍ ❍ ❍ Statistical Instantaneous Loudness Sharpness vs. Time Specific Roughness Specific Fluctuation Strength Other sound quality parameters can be determined through FFT analysis. These include the tone-to-noise ratio, prominence ratio and RMS of time and frequency data. Viewing the Results You can choose to display a signal as a time graph, a spectrum or multispectrum on a frequency scale or psychoacoustic Bark scale. Multispectra can be displayed as contour plots, 3D plots, slices and envelopes. All of these can be displayed simultaneously. PULSE Sound Quality software offers a huge range of axis settings and cursor values for display with graphs. Fig. 8 Specific Loudness waterfall graph with read-out of sound quality parameters. Note the list of cursor values to the right of the display. PULSE Sound Quality software has a very extensive set of cursor values to choose from You can also display a multiple graph to allow easy comparison of data. The graph could, for example, display the FFT of all signals in a project or the results of different edits applied to the same signal. Exporting Data For report generation or further post-processing using a word processor or spreadsheet, data can be exported in ASCII format or via the clipboard. Sound signals can be exported with all calibration information as Windows-compatible .wav files. You can export data in Universal File Format (UFF) to other analysis applications. On-line Help The software is fully documented with both context-sensitive help, an on-line manual and a glossary. 8 Sound Quality on Rotating Machinery – Order Analysis Option BZ 5277 Fig. 9 Plots of Aweighted Level, Specific Loudness and Total Loudness as functions of RPM The Order Analysis Option for PULSE Sound Quality software lets you perform sound quality-based order analysis on rotating machinery, even when the speed is not constant. The order analysis option adds two tacho channels to supplement the two existing sound channels. Data for the tacho channels may either be directly measured, transferred from a digital recorder or imported from files, for example, from the base PULSE software. When transferred from a two channel digital recorder, the tacho signal may either be taken from one of the channels leaving the other for acoustic input. The software can also read signals with the 16th bit of one or both acoustic channels as a digital tacho. If the file format permits (for example UFF or multitrack wave), two sound channels and two tacho channels may be selected. The order analysis option also adds order-related display and analysis functions to allow detection and quantification of order related signals from the sound channels. Order edits attenuate or filter out specific orders or sets of orders for troubleshooting or simulation of design changes. Combined with Zwicker Loudness Option BZ 5265, the order analysis option lets you display Loudness, Roughness, Fluctuation Strength, and A-weighted and Linear levels as functions of RPM. Psychoacoustic Test Bench Option BZ 5301 Psychoacoustic Test Bench is an advanced option which can be run as an addition to Sound Quality. It controls the specific objective tests (metrics) carried out by Sound Quality and also implements the two subjective test methods – Paired Comparison and Semantic Differential. For a set of sound files in .wav format, Psychoacoustic Test Bench will calculate a sound model (a formula for a combination metric) using regression analysis by correlating the subjective and objective tests, thus completing the sound quality solution. Subjective Tests For each subjective test session a corresponding user-defined playlist and jury answer form are produced. Multiple jury preference/voting can be collected using the Internet/ Intranet and then saved in an Excel worksheet. The program provides a fully detailed report score sheet for each jury session and saves the HTMLs, playlists and Excel 9 worksheets. The user can carry out as many subjective tests as required and new worksheets are assigned to each. Fig. 10 Project view and user selected metrics options Objective Tests The objective test tool calculates the user selected metrics for specified wave files in the project input view. The loudness analysis parameters are set from Type 7698. The test results are placed in an Excel worksheet. The saved data includes wave file and metrics names, loudness settings, and the objective metric values. If the sound is binaural, both left and right channel values can be calculated, and displayed both individually and as a mean, and saved. Statistical Analysis The statistical analysis function calculates the correlation between the objective and subjective tests. It is carried out by an advanced Excel function which calculates the optimal straight line estimate for a given set of input and output values. Fig. 11 The statistical analysis calculation showing the plots and graphs displayed in an Excel worksheet 10 The statistical analysis calculation provides an automatic search facility using regression analysis to find and calculate the test model − the final combination metric − based on the preselected number of metrics. It compares the predicted values from the model to the actual results from the subjective listening tests. The final combination metric can be used as a user-defined cursor reading in the Sound Quality program, making it possible to evaluate any signal against the model very quickly. Specifications − PULSE Sound Quality Software Type 7698 SIGNAL INPUT/OUTPUT • 2 channels (+ 2 tacho channels with BZ 5277) • Analog or Digital • Tacho can be read from a 16th-bit encoding or normal encoded • Direct recording with PULSE and Time Capture or Data Recorder options • Loading of time data from existing PULSE projects and recorder files ANALYSIS • Overall Levels: RMS, Statistics, Metric Statistics • FFT • Statistical Regression Analysis (with BZ 5301) ZWICKER LOUDNESS ANALYSIS (with BZ 5265) • Stationary Loudness (according to DIN 45 631/ISO 532B) • Non-stationary Loudness (according to Zwicker Loudness) ZWICKER LOUDNESS METRICS (with BZ 5265) • Loudness • Sharpness • Roughness • Fluctuation Strength OTHER METRICS • Tone-to-noise ratio (according to ANSI S1.13−1995) • Prominence ratio (according to ANSI S1.13−1995) • A, B, C, D weighting • User-defined cursor readings EDITS • Peak Limit • Time Attenuate • Demodulation • Frequency Attenuate • Frequency Shift • Passband • Peak Limit Frequency • Harmonic Frequency Attenuate • Harmonic Frequency Shift • Harmonic Passband • Generator • Mixer • Real-time Filter • Frequency Response Filter • User-defined Filter DISPLAYS • Real-time playback monitor • Time (Lin/Lin, Log/Lin, Lin/Log, Log/Log, Waterfall, Contour) • Single Signal or Multiple Signal Graphs ORDER ANALYSIS (with BZ 5277) • Schmitt trigger of tacho signals • RPM extraction from tacho signals • FFT analysis of sound signal using RPM signal to determine orders ORDER-RELATED EDITS (with BZ 5277) • Order Attenuate position specified by order start and width attenuation in dB or absolute • Order Passband position specified by order start and width stop-band gain in dB or absolute ORDER-RELATED DISPLAYS (with BZ 5277) • Time graphs: Tacho Schmitt triggered tacho RPM • FFT Contour versus RPM • FFT Waterfall versus RPM Zwicker Loudness Metrics (with BZ 5265) • Loudness versus RPM • Roughness versus RPM • Fluctuation Strength versus RPM PSYCHOACOUSTIC TEST BENCH (with BZ 5301) • Controls Type 7698 from an Excel spreadsheet • Set up of calculation of objective metrics for wave signals • Set up of subjective tests and evaluation of results from jury members • Remote jury tests using Internet • Regression analysis for calculation of combination metrics WEIGHTING CURVE CORRECTIONS • Input (Flat, 4100 diffuse-field, 4100 free-field or user-defined) • Output (Flat, HT 0012 or user-defined) CALIBRATION • Input level • Output level • Charge Injection Calibration AUTOMATION • OLE 2 interface • Programmable from e.g., Visual Basic, Visual C++, Microsoft Excel, Microsoft Word • VBScript, JavaScript DATA EXPORT • .WAV (wave file) • .TXT (ASCII text file) • Universal File Format (UFF) DATA IMPORT • .WAV (wave file) • Universal File Format (UFF) • Import from base PULSE software – requires that either Data Recorder Type 7701 or Time Capture Type 7705 is installed on PULSE computer PLAYBACK • Single or repeated • Calibrated or uncalibrated • Synchronised (original vs. edited) JURY TEST • Test methods supported: Paired Comparison, Semantic Differential • Voice annotation • User-defined delays • Play List ON-LINE DOCUMENTATION • On-line, context-sensitive Help and User Manual 11 Ordering Information Type 7698-X1 BZ 5265-X1 BZ 5277-X1 BZ 5301-X1 PULSE PULSE PULSE PULSE Sound Sound Sound Sound Type 3560-C Quality Quality Zwicker Loudness Quality Order Analysis Quality Psychoacoustic Test Bench Portable PULSE Acquisition Front-end Optional Accessories Type 4100 Sound Quality Head and Torso Simulator (Preamplifiers: Type 2669 L with charge injection calibration facility) Type 4100 D Sound Quality Head and Torso Simulator (Preamplifiers: DeltaTron Type 2671) Type 2672 Sound Quality Conditioning Amplifier UA 1324 Positioning Frame for Types 4100 (D) and 2672 WQ 1121 SONY PC 204 Ax Instrumentation Cassette Recorder HT 0012 Sennheiser HD 580 Headphones ZE 0769 Headphone Amplifier, including JP 0352 and 2 × AO 1459 1 or 2 ZE 0770 PCI Sound Card, including AO 1458 ZE 0770 A PCMCIA Sound Card AO 1458 Stereo Jack Plug – 2 × BNC male cable (1 m) AO 1459 Mono Jack Plug – BNC male cable (1 m) JP 0352 Stereo Jack Plug – Stereo Minijack Adaptor JP 0070 Phono – BNC Connector AO 0508 Minijack male – 2 × Phono male cable System Requirements RECOMMENDED PC: 750 MHz Pentium III processor, or better 256 MB RAM, or better CD-ROM drive 1024× 768, 256 colour, graphics card, or better 2 GB free space on hard disk Sound Card (see Optional Accessories) For Data Recording using Portable PULSE Type 3560 C Type 7700-N4 PULSE FFT & CPB Analysis, 4-channel License Type 2827 Portable Data Acquisition Unit Type 3109 Generator, 4/2-ch. Input/Output module Type 7533 LAN Interface Module Type 7701-N PULSE Data Recorder 1.X Specifies license: N for node locked, F for floating Sound Quality Software 7698-X1 Portable PULSE 3560 C Zwicker Loudness Option BZ 5265-X1 Order Analysis Option BZ 5277-X1 Sync. Out ! RS-232 LAN Interface Module Type 7533 Rx Off Int. Clock In Clock Out Sync. In Aux. I/O LAN Tx 4 On Ext. 2 Power on/off Control K Clock Sync. Error B7/6-'89 Input 3 1 Input 0 K B7/6-'89 Input Measuring Stop Overload Output 2 Output 1 4/2-ch. Input/Output Module Type 3109 10Mbit Brüel & Kjær status Battery Brüel & Kjær Follow/Ext. power Battery status Sound Quality Head and Torso Simulator 4100 or 4100 D On/Off 10-32V Ext. Power ! 25kHz Psychoacoustic Test Bench Option BZ 5301-X1 Portable Data Acquisition Unit 2827 Power Amplifier ZE 0769 Generator, 4/2-ch. Input / Output Module 3109 LAN Interface Module 7533 PULSE FFT & CPB Analysis 4-channel License 7700-N4 1. X Specifies license: N for node locked, F for floating Headphones HT 0012 000023/1 03/08 Sound Level Calibrator 4231 Brüel & Kjær reserves the right to change specifications and accessories without notice HEADQUARTERS: DK-2850 Nærum · Denmark · Telephone: +45 4580 0500 · Fax: +45 4580 1405 · bksv.com · [email protected] Australia (+61) 2 9889-8888 · Austria (+43) 1 865 74 00 · Brazil (+55)11 5188-8166 · Canada (+1) 514 695-8225 China (+86) 10 680 29906 · Czech Republic (+420) 2 6702 1100 · Finland (+358) 9-755 950 · France (+33) 1 69 90 71 00 Germany (+49) 421 17 87 0 · Hong Kong (+852) 2548 7486 · Hungary (+36) 1 215 83 05 · Ireland (+353) 1 807 4083 Italy (+39) 0257 68061 · Japan (+81) 3 3779 8671 · Republic of Korea (+82) 2 3473 0605 · Netherlands (+31)318 55 9290 Norway (+47) 66 77 11 55 · Poland (+48) 22 816 75 56 · Portugal (+351) 21 47 11 4 53 · Singapore (+65) 377 4512 Slovak Republic (+421) 25 443 0701 · Spain (+34) 91 659 0820 · Sweden (+46) 8 449 8600 · Switzerland (+41) 1 880 7035 Taiwan (+886) 22 713 9303 · United Kingdom (+44) 14 38 739 000 · USA (+1) 800 332 2040 Local representatives and service organisations worldwide BP 1589 – 19 TRADEMARKS Microsoft, Windows NT, Windows, Visual Basic and Visual C++ are registered trademarks and ActiveX is a trademark of Microsoft Corporation in the United States and/or other countries SONY is a registered trademark of Sony Corporation Pentium is a registered trademark of Intel Corporation or its subsidiaries in the United States and/or other countries