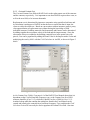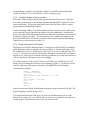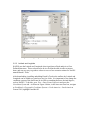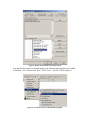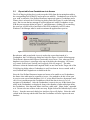
1
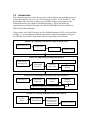
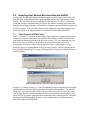
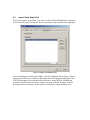
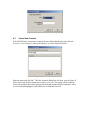
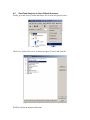
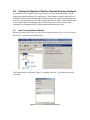
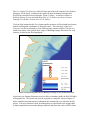
Technical Procedures & Issues:
Importing User Defined Facilities into HAZUS
Midwest Flooding 2008
Albion Township, Dane County, WI
Prepared for the Association of State Floodplain Managers
September 1, 2010
Technical Procedures & Issues:
Importing User Defined Structures into HAZUS
Table of Contents
1.0
INTRODUCTION .............................................................................................................................. 1
2.0
PREPARING USER DEFINED STRUCTURE DATA FOR IMPORT ........................................................... 2
2.1 STUDY AREA DELINEATION AND DATA ACQUISITION .................................................................................... 2
2.2 DATA MANIPULATION AND GEOPROCESSING .............................................................................................. 2
2.2.1
Occupancy Type ...................................................................................................................... 3
2.2.2
Address, City, State, Zip Code ................................................................................................. 4
2.2.3
Cost and Content Cost ............................................................................................................ 5
2.2.4
Year Built, Number of Stories and Area .................................................................................. 6
2.2.5
Design Level and Flood Protection .......................................................................................... 6
2.2.6
Latitude and Longitude ........................................................................................................... 7
2.2.7
Foundation Type and First Floor Height................................................................................ 10
2.3 DATA PROBLEMS AND LIMITATIONS ............................................................................................................ 10
2.3.1
Building Footprint Polygons and Centroids ........................................................................... 11
2.3.2
Parcels................................................................................................................................... 11
2.3.3
Assessment Data .................................................................................................................. 13
2.3.4
NFIP Claims ........................................................................................................................... 14
3.0
IMPORTING USER DEFINED STRUCTURE DATA INTO HAZUS ......................................................... 15
3.1
3.2
3.3
3.4
4.0
PERFORMING FLOOD ANALYSIS ON USER DEFINED STRUCTURES ................................................. 21
4.1
4.2
4.3
4.4
4.5
5.0
ADD & POPULATE HAZUS FIELDS .......................................................................................................... 15
EXPORT TABLE FROM GEODATABASE INTO ACCESS ..................................................................................... 16
CHECKING DATA FIELD TYPES AND SIZES .................................................................................................. 18
IMPORTING USER DEFINED STRUCTURES INTO HAZUS............................................................................... 19
SET HAZARD TYPE ............................................................................................................................... 21
IMPORT FLOOD DEPTH GRID ................................................................................................................. 22
CREATE NEW SCENARIO ....................................................................................................................... 23
DELINEATE FLOODPLAIN ....................................................................................................................... 24
RUN FLOOD ANALYSIS ON USER DEFINED STRUCTURES............................................................................... 25
VIEWING THE RESULTS OF THE USER DEFINED STRUCTURE ANALYSIS .......................................... 26
5.1
5.2
5.3
5.4
VIEW CURRENT SCENARIO RESULTS ........................................................................................................ 26
OPEN USER DEFINED STRUCTURES LOSS TABLE AND MAP........................................................................... 27
SPATIALLY JOINING DAMAGE ESTIMATES TO CLAIMS AND ASSESSMENT DATA ................................................. 29
STATISTICAL ANALYSIS .......................................................................................................................... 31
List of Tables
TABLE 1: HAZUS REQUIRED DATA FIELDS AND DESCRIPTIONS ..................................................................................... 3
TABLE 2: EXAMPLE PORTION OF OCCUPANCY LOOKUP TABLE ...................................................................................... 4
List of Figures
FIGURE 1: PROCEDURE FOR IMPORTING USER DEFINED STRUCTURES & RUNNING FLOOD ANALYSIS IN HAZUS .................... 1
FIGURE 2: DEFINING "COST" IN THOUSANDS USING FIELD CALCULATOR ......................................................................... 5
FIGURE 3: DEFINING "DESIGN LEVEL" USING PRE-LOGIC IN FIELD CALCULATOR ............................................................... 7
FIGURE 4: DEFINE THE DATA FRAME COORDINATE SYSTEM .......................................................................................... 8
FIGURE 5: USE HAWTH'S TOOLS TO ADD LATITUDE/LONGITUDE ................................................................................... 8
FIGURE 6: ADD NEW FIELDS OR UPDATE EXISTING FIELDS WITH LATITUDE/LONGITUDE ...................................................... 9
FIGURE 7: TABLE WITH LATITUDE/LONGITUDE APPENDED ........................................................................................... 9
FIGURE 8: EXAMPLE WHERE BUILDING FOOTPRINTS SPAN MULTIPLE PARCELS WITH DIFFERENT OWNERS ............................. 12
FIGURE 9: AREA WHERE FOOTPRINT CENTROIDS ARE SELECTED THAT FALL OUTSIDE OF PARCELS ........................................ 12
FIGURE 10: AREA OF DANE COUNTY, WI WHERE PARCELS DO NOT LINE UP WITH ORTHOPHOTOGRAPHY ............................ 13
FIGURE 11: IMPORTING ERROR WHEN FIELD LENGTH IS TOO LONG .............................................................................. 15
FIGURE 12: IMPORTING ERROR WHEN DATA TYPES ARE INCOMPATIBLE ........................................................................ 15
FIGURE 13: ERROR WHEN USING A FEATURE CLASS FROM A GEODATABASE CAUSES A HARD CRASH ................................... 16
FIGURE 14: FIELD MAPPING DIALOG USING A FEATURE CLASS FROM A GEODATABASE .................................................... 17
FIGURE 15: FIELD MAPPING DIALOG USING AN ACCESS CREATED .MDB FILE .................................................................. 17
FIGURE 16: MS ACCESS DATABASE WITH TABLE EXPORTED FROM GEODATABASE .......................................................... 18
FIGURE 17: RIGHT-CLICK TO FIND THE IMPORT MENU ITEM IN USER DEFINED FACILITIES WINDOW .................................... 19
FIGURE 18: USER DEFINED STRUCTURES IMPORTED INTO HAZUS .............................................................................. 20
FIGURE 19: HAZUS HAZARD MENU IS THE FIRST STEP OF RUNNING ANALYSIS ............................................................... 21
FIGURE 20: SELECT FLOOD HAZARD TYPE FOR ANALYSIS ........................................................................................... 21
FIGURE 21: IMPORT FLOOD DEPTH GRID ............................................................................................................... 22
FIGURE 22: SET UNITS OF THE IMPORTED FLOOD DEPTH GRID ................................................................................... 23
FIGURE 23: NAME NEW SCENARIO........................................................................................................................ 23
FIGURE 24: ADD THE DEPTH GRID AND SAVE........................................................................................................... 24
FIGURE 25: LAST STEP BEFORE RUNNING THE ANALYSIS ............................................................................................. 24
FIGURE 26: RUNNING THE ANALYSIS ..................................................................................................................... 25
FIGURE 27: SELECT USER DEFINED STRUCTURES FROM THE ANALYSIS OPTIONS ............................................................. 25
FIGURE 28: STEP 1 OF VIEWING RESULTS FOR USER DEFINED STRUCTURES ANALYSIS ...................................................... 26
FIGURE 29: VIEW RESULTS BY WINDOW - CLICK OK ................................................................................................ 26
FIGURE 30: VIEWING THE RESULTS OF USER DEFINED STRUCTURES ANALYSIS ................................................................ 27
FIGURE 31: THE INDIVIDUAL RESULTS OF THE UDF ANALYSIS ..................................................................................... 27
FIGURE 32: MAP SHOWING DIFFERENCES IN DAMAGE PERCENTAGE FOR USER DEFINED STRUCTURES ............................... 28
FIGURE 33: EXPORTING THE USER DEFINED STRUCTURE DAMAGE ESTIMATE RESULTS TO A SHAPEFILE ............................... 29
FIGURE 34: ORIGINAL LOCATIONS OF BUILDING FOOTPRINT CENTROIDS (STAR SYMBOL) VS. HAZUS LOCATIONS AFTER IMPORT
(PLUS SYMBOL) – WITH PARCELS, BUILDING FOOTPRINTS AND FLOOD HAZARD BOUNDARY...................................... 30
FIGURE 35: SPATIALLY JOINING THE HAZUS RESULTS BACK TO ORIGINAL DATA FOR ANALYSIS .......................................... 31
1.0
Introduction
This companion report is written for users who wish to replicate the steps that were used
in the report entitled “Structure Level Flood Damage Analysis: NFIP & HAZUS”. This
document provides the steps in order to run a HAZUS analysis using imported User
Defined Structures (also called User Defined Facilities). These instructions are
supplemental to and should not replace the HAZUS-MH MR3 Flood User Manual or
MR3 Flood Technical Manual.
The procedure for a HAZUS analysis on User Defined Structures (UDS), as shown below
in Figure 1, is to first delineate and format the data in ArcGIS, then prepare and import
the UDS data into HAZUS, then run the analysis, and finally view the results.
Section 2.0: Preparing UDS Data for Import into HAZUS
Define Study Area
Acquire Data
Geoprocessing
Add Lat / Long
Section 3.0: Importing UDS Data into HAZUS
Add & Populate
HAZUS Fields
Define New HAZUS Study Region
Export Table
from GeoDB
into Access
Data Field
Types / Sizes
Import into
HAZUS
Section 4.0: Performing Flood Analysis on UDS in HAZUS
Set Hazard Type
Import Flood
Depth Grid
Create New
Scenario
Delineate
Floodplain
Run Flood Analysis on User Defined Structures
Section 5.0: Viewing the Results of the UDS Analysis
View Current
Scenario
Results
Open UDS Loss
Table then Map
Spatially Join
Damage Estimates
to Claims and
Assessment Data
Statistical Analysis
Figure 1: Procedure for Importing User Defined Structures & Running Flood Analysis in HAZUS
2.0
Preparing User Defined Structure Data for Import
The first step to a HAZUS analysis on User Defined Structures is delineating the study
area and gathering the necessary data. Chapter 5 of the HAZUS-MH MR3 User Manual
details the reasons, procedures and potential sources for collecting additional data and
Chapter 6 describes importing additional data into HAZUS, which will be discussed in
Section 3.0 of this document. The goal of the analysis in the companion report was to
compare HAZUS estimated flood damages against assessment values and against NFIP
damage claims at the structure level from the June 2008 flooding in Dane County.
2.1
Study Area Delineation and Data Acquisition
As discussed in the companion report, the Township of Albion in Dane County,
Wisconsin was chosen as the study area. Section 2.2, Table 1 lists the data that HAZUS
allows for import into the User Defined Facilities table; the more data that you can find
and provide to HAZUS, the more complete your results.
Data acquired from Dane County Land Information Office (LIO) included parcels,
building footprint centroids and digital elevation model. The footprint centroids layer
defines the location of the User Defined Structures that are imported into HAZUS. The
parcels layer not only contained the needed street address information for each parcel, but
also had the assessment data (value of land and value of improvements) for each parcel.
Aside from parcels and footprints, other useful data such as roads, hydrography,
municipal civil divisions, building footprint polygons and orthophotography were also
collected from the county for inclusion in mapping output.
Additional data for each structure, including year-built, number of stories and first floor
square footage was obtained from the company contracted by the Town of Albion to do
their assessments, Accurate Appraisal, LLC.
Fortunately for this analysis, the USGS Wisconsin Water Science Center provided the
flood depth grids from this specific flooding event on its website as an accompaniment to
its “Flood of June 2008 in Southern Wisconsin” (SIR 2008-5235) report. Please visit
http://wi.water.usgs.gov/surface-water/flood2008/ for more information.
For discussion on limitations of the data received and possible issues in the large scale
application of these procedures, see Section 2.3 of this report.
2.2
Data Manipulation and Geoprocessing
Data must first be aggregated together into one table before it can be imported into
HAZUS. With the data being a mixture of GIS Shapefiles and database tables, a number
of spatial joins and table joins will need to occur, as well as detective work to determine
which structures are houses and not garages and therefore able included as a point in the
feature class. First, all the GIS data layers were clipped to the extent of the township
boundary in order decrease file sizes and therefore minimize processing times. Then
each shapefile was imported into a Geodatabase for data consolidation and to synchronize
the projections.
Before the data is aggregated, the fields that HAZUS allows data to be imported into
should be identified. Figure 6.7 on page 6-7 of the HAZUS User Manual lists the Field
Names, Data Types and Field Lengths for the fields that can be imported for a User
Defined Structure analysis and is reproduced in the following table, which also includes
where the data for this analysis originated as well as the section that describes how each
field was assembled or defined.
Field
Type
Size
Where Acquired or How Defined
Section
CONTACT
Text
40
Unnecessary
NAME
Text
40
Unnecessary
ADDRESS
Text
40
Parcels from County, see also Section 3.6.2 in report
2.2.2
CITY
Text
40
Parcels from County
2.2.2
STATE
Text
2
Parcels from County
2.2.2
ZIPCODE
Text
40
Parcels from County
2.2.2
PHONENUMBER
Text
47
Unnecessary
OCCUPANCY
Text
5
Land Use from County
2.2.1
YEARBUILT
Integer
2
Township Assessor: Accurate Appraisal, LLC
2.2.4
COST
Currency
8
Parcels from County, see also Section 3.6.3 in report
2.2.3
BACKUPPOWER
Yes/No
1
Unavailable
NUMSTORIES
Byte
1
Township Assessor: Accurate Appraisal, LLC
2.2.4
AREA
Single
4
Township Assessor: Accurate Appraisal, LLC
2.2.4
BLDGTYPE
Text
15
Unavailable
LATITUDE
Double
16
ArcGIS, Hawth's Tools
2.2.6
LONGITUDE
Double
16
ArcGIS, Hawth's Tools
2.2.6
COMMENT
Text
40
Unnecessary
CONTENTCOST
Currency
8
HAZUS Default, defined by Cost and Occupancy
2.2.3
DESIGNLEVEL
Text
1
HAZUS Default, defined by Year Built
2.2.5
FOUNDATIONTYPE
Text
1
Unavailable, set to multiple variables for comparison
2.2.7
FIRSTFLOORHT
Double
8
HAZUS Default, defined by Foundation Type
2.2.7
SHELTERCAPACITY
Integer
2
Unavailable
-
BLDGDAMAGEFNID
Text
10
Undefined in HAZUS User and Technical Manuals
-
CONTDAMAGEFNID
Text
10
Undefined in HAZUS User and Technical Manuals
-
INVDAMAGEFNID
Text
10
Undefined in HAZUS User and Technical Manuals
-
FLOODPROTECTION
Long Int
4
HAZUS Default, page 6-9 HAZUS User Manual
-
-
-
-
-
2.2.5
Table 1: HAZUS Required Data Fields and Descriptions
2.2.1
Occupancy Type
The building footprint centroids feature class is the starting point for creating the User
Defined Structures. Each point in the centroids layer possesses a Land Use Code, which
is based on the Standard Industrial Classification (SIC) codes used by the Federal
Government. The building footprint centroids layer is a byproduct of Dane County’s
Digital Land Use Inventory, so with that dataset’s User Documentation and Table 3.1
found in the HAZUS Technical Manual on page 3-3, a lookup table was created and
joined to the footprint centroids layer. Table 2 below shows an example of the lookup
table created.
The centroid layer gets joined to the lookup table with Land Use Code as the key. After
the table join, each point in the data layer contains the Occupancy Class. It is very
important to note here that the Occupancy Type field cannot be null when the import into
HAZUS is attempted, or else an error will occur and HAZUS will crash.
LUCODE
9
21
22
23
24
111
113
115
116
129
140
142
190
INVENTORY_TEXT
Shopping Center
Food and Kindred
Textile and Mill
Apparel and Related
Lumber and Wood
Products Manufacturing
Single Family
Two Family
Multiple Family
Farm Unit
Group Quarters
Mobile Home
Mobile Home Park
Seasonal Residential
OCC_TYPE
COM1
IND3
IND1
IND2
IND1
RES1
RES3A
RES3B
RES1
RES5
RES2
RES2
RES4
Table 2: Example Portion of Occupancy Lookup Table
2.2.2
Address, City, State, Zip Code
HAZUS uses the longitude and latitude to define the location of User Defined Structures,
so address information is technically unnecessary for running the HAZUS analysis. But
aside from the fact that humans use address information as a unique identifier, this
analysis focuses on comparing the results from HAZUS to NFIP claims as well as
assessment values. The NFIP data is listed by address, so it is necessary to have address
information during the data assembly and analysis phase.
The building footprint centroids layer did not contain an address field so it needed to be
spatially joined to the parcel layer which did contain address information. This task is
one of the places where error and uncertainty can enter the analysis, as discussed in
Section 2.3.1 of this report. Until these discrepancies are removed from underlying data,
these types of error will need to be fixed one by one, as was the case with this pilot
dataset.
Since the Dane County parcel data also included assessment values, this spatial join to
parcels also allows for the comparison of HAZUS damage estimates to assessment
values. The address information can now be used to table join the NFIP claims data
which will allow the comparison of the HAZUS damage estimates to NFIP claims.
2.2.3
Cost and Content Cost
The Cost and Content Cost fields in HAZUS refer to the replacement cost of the structure
and the contents, respectively. It is important to note that HAZUS requires these costs, as
well as the area field, to be in terms thousands.
Replacement cost is determined by insurance companies using specialized software and
its calculation is analogous to HAZUS in that the more accurate data that is input, the
closer to reality the results are. Based on conversations with an insurance agent, a pretty
close approximation of replacement cost without having the knowledge of each
individual structure’s building materials, finish materials and fixtures can be determined
by adding together the assessment values of the land and the improvements. Since the
assessment values were added to the building centroids layer in the spatial join with
parcels, Cost can be populated by adding the Land Value to the Improvements Value and
multiplying the sum by 0.001 with the Field Calculator in ArcGIS, as shown in Figure 2
below.
Figure 2: Defining "Cost" in thousands using Field Calculator
As for Content Cost, Table 6.5 on page 6-9 of the HAZUS User Manual shows that it is
dependent on the Cost field and the occupancy type, so the Content Cost for a RES1
structure should be (Cost * 0.5), while the Content Cost for a COM6 is (Cost * 1.5).
Another lookup table that contains the multipliers found in the User Manual can be
created and joined to the centroids layer based on Occupancy Type, and then the Field
Calculator in ArcGIS can easily be used to populate the Content Cost field. One time
saving technique would be to include the Content Cost modifier in the lookup table
created in Section 2.2.1 for the Land Use Codes to Occupancy type.
2.2.4
Year Built, Number of Stories and Area
These three fields are filled with the data acquired from the local assessor. Note that
Area is the square footage of the building footprint and that HAZUS requires it to be in
terms of thousands. The assessor data has the area of the first floor, which is a good
approximation of the building footprint.
A table containing Address, Year Built, Number of Stories and Area can be table joined
to the centroids layer provided that the address fields are standardized. As discussed
above, the quality of the data determines the time and labor requirements of what should
be relatively simple procedures. This assessor data can be joined to the address in the
parcel data either before or after the parcels have been spatially joined to the building
centroids layer, as described in Section 2.2.2.
2.2.5
Design Level and Flood Protection
The Design Level field is defined in Table 6.2 on page 6-8 of the HAZUS User Manual
and is dependent on the year that the structure was built. A structure built before 1950
has its design level set to 1, built between 1950 and 1970 is set to 2, and built after 1970
is set to 3. A null year is to be set 0 in the table, although it is stated in the User Manual
on page 6-9 to set the year of a structure that has an unknown year to the local trend or to
1970, so therefore the Design Level is set accordingly.
To set the Design Level, the Field Calculator in ArcGIS is used with Pre-logic VBA
Script Code by clicking the check box next to advanced, (Figure 3). In the text area for
code, the following script can be used (where [YEARBUILT] is the field name
containing the year data):
Number = [YEARBUILT]
If Number < 1950 Then
Digits = 1
ElseIf Number >= 1950 and Number < 1970 Then
Digits = 2
ElseIf Number >= 1970 Then
Digits = 3
Else
Digits = 0
End If
In the lower text box ‘Digits’ should typed (without the quotes) and then click OK. The
field will populate with the Design Level.
As for the Flood Protection field, page 6-9 of the User Manual states to set it to the
default of zero unless it is near a dam or dike, in which case it should be set to that level.
For this project, Flood Protection was set to zero for all records.
Figure 3: Defining "Design Level" using Pre-Logic in Field Calculator
2.2.6
Latitude and Longitude
HAZUS uses the Latitude and Longitude when it performs a flood analysis on User
Defined Structures. These values need to be in a field in the table in order to import
them, and one easy way to get these values is to use a free extension written for ArcGIS
named Hawth’s Tools.
After downloading, installing and adding Hawth’s Tools to the toolbar, the Latitude and
Longitude can be added to a point layer in a few clicks. It is important to first change the
coordinate system of the data frame in ArcGIS to something that uses decimal degrees,
such as NAD83. To do this, go to View > Data Frame Properties and go to the
Coordinate System tab. As shown in Figure 4 below, in the lower text area box, navigate
to Predefined > Geographic Coordinate Systems > North America > North American
Datum 1983, highlight it and hit OK.
Figure 4: Define the data frame Coordinate System
Now that the data frame is in decimal degrees, the Latitude and Longitude can be added
to the table. Go to HawthsTools Menu > Table Tools > Add XY to Table (Figure 5).
Figure 5: Use Hawth's Tools to add Latitude/Longitude
In the Add/Update X,Y Fields dialog box, select the building footprint centroids layer, and
either Add New Fields, as shown in Figure 6, or select existing fields to update, then
select the option to Use the same Coordinate System as the data frame and click OK. It
is important remember that Longitude is the X coordinate (easting, westing) and Latitude
is the Y coordinate (northing). The data table will now contain the decimal degrees
coordinates as shown in Figure 7 below.
Figure 6: Add new fields or update existing fields with Latitude/Longitude
Figure 7: Table with Latitude/Longitude appended
It is important to note that when Hawth’s Tools creates coordinates from the spatial
location of the points, the Latitude and Longitude fields are populated with numbers that
have six decimal places. But after the data is imported into HAZUS, the analysis is run
and the results are mapped, the original point layer will not line up with the HAZUS data
because HAZUS truncates the Latitude and Longitude to only four decimal places.
While this doesn’t create major locational discrepancies, as the average distance
difference between the original data and the imported data for this pilot project was less
than 4 feet, it is important to document this fact when a comparison is being attempted
between HAZUS damage estimates and another piece of data for each structure, for
example, NFIP claim amounts.
2.2.7
Foundation Type and First Floor Height
As discussed in this report, the HAZUS analysis was run four times on the same data but
with different values for Foundation Type and First Floor Height. These two variables,
when combined with the Flood Depth Grid, are integral to the damage estimates that
HAZUS outputs. Part of this analysis became trying to determine which types and
heights came closest to actual claims values because there was no data available for each
of these fields.
Table 6.3 on page 6-8 of the User Manual shows the values that should be entered into
the Foundation Type field for structures with various types of foundations, such as
basement, crawl space or slab on grade. The manual also states on page 6-9 that the
default Foundation Type should be 7, which corresponds to a structure with a slab on
grade.
The defaults for First Floor height are found in Table 6.4 on page 6-9 of the User Manual
and are dependent on the Foundation Type field. These defaults were used in three of the
HAZUS analyses described in the companion report, while one analysis was performed
where Foundation Type was set to basement but the First Floor Height was set to 2 feet
instead of the default 4 feet. The section cited in the last paragraph also discusses the
First Floor Height field and the values that were used for each of the four HAZUS runs.
2.3 Data Problems and Limitations
Problems with data inconsistency can arise when data from many locations and different
creators are attempted to be merged together, as was the case with this analysis. Along
with problems getting datasets to ‘talk’ to one another, it also happens that the only data
available for an attempted task does not necessarily contain exactly what is needed to
perform that specific analysis. This is not a critique, because data is usually created for a
specific situation and there usually is no need to make a dataset do more than the specific
role for which it was created, and the limitations are only discovered when an end user
tries to use the only available data for purposes beyond the original scope of the dataset.
Extracting the best available data and reformatting it into a useable form can be a time
consuming process that should be budgeted for when attempting this type of analysis.
Approximately 80 hours were spent working around the situations described below in this
limited study area for the first phase of this analysis. Some of that time was extraneous
since this is a pilot study and used unfamiliar data. Approximating the time necessary for
an analysis at the county level is difficult because it is not a simple extrapolation. The
data reconciliation tasks only took an additional 80 hours for the township of Albion, and
if some of the recommendations of this report are implemented, the time required for this
step could be reduced if not eliminated and a countywide analysis could be performed in
a lot less time.
2.3.1
Building Footprint Polygons and Centroids
Beyond an identification field and a Land Use Code, each footprint polygon and centroid
does not contain additional data such as street address or parcel number. A spatial join to
parcels is the workaround to get assessment values assigned to the centroids, which leads
to a new problem of multiple points in one parcel being assigned the same replacement
value. This problem is mostly due to the assumption of this analysis that uses the
assessed value as an approximation of replacement cost. If data is available for the
replacement cost of each individual structure on a parcel, then it is possible to use more
than one point per parcel.
The first phase of this analysis was completed before receiving the building footprint data
with the primary or accessory structure attribute, but it was possible to determine the type
of building using a combination of orthophotography, Google Street View and Bing
Maps 3D. A building that was found to be a garage or auxiliary structure was removed
from the point dataset to ensure only one structure was assigned the assessment value as
the replacement cost and so HAZUS calculated the damage estimates correctly. The
Dane County Land Information Office later took over 40 hours to add an attribute to
building centroids in Albion that defines a structure as primary or accessory using the
visual method described above. This work allowed the second phase of this analysis to
proceed for the entire township of Albion. As stated previously, an additional 40 hours
were spent in the second phase cleaning up the data to ensure only one structure was
assigned the value of the assessment for each parcel, as well as determining which parcel
belonged with which centroid as described in the following section.
2.3.2
Parcels
The parcel layer provided by the county generally matched well with the building
footprint locations in the Township of Albion. But the specific area around Lake
Koshkonong where the June flooding occurred had numerous examples of mismatches
between parcel boundaries and building footprints. For example, there are houses on two
parcels that had different owners so it was difficult to determine which parcel data
belonged with which building footprint and which parcel’s address was the correct
address of the building. There are several reasons for possible errors with the parcel
features, such as: many structures on the parcel but only one house; many parcels
individually assessed with the same owner but only one structure; or no structure but the
parcel has an assessment value for both land and improvements. In Figure 8 below,
parcels have been dissolved based on the field ‘Owner Name’ and shown with building
footprints and the original parcel layer as dashed lines.
Figure 8: Example where building footprints span multiple parcels with different owners
There are also examples of the centroids falling outside the boundaries of the parcel
polygons, see Figure 9 below, which can lead to errors when attempting to assign
addresses or assessment values to those structures. A ‘Nearest to’ spatial join may work
for these errors, but the accuracy of this type of join is uncertain when data doesn’t line
up exactly.
Figure 9: Area where footprint centroids are selected that fall outside of parcels
Additionally, areas can be found where it seems a subdivision was platted out differently
from how it was actually built so the road can be seen on the orthophotography running
through parcels (Figure 10).
Figure 10: Area of Dane County, WI where parcels do not line up with orthophotography
These examples indicate that the parcel spatial accuracy, data completeness and data
currency need to be considered when utilizing parcel boundaries within this context.
These issues may lead to the problem of quantifying a level of certainty for errors in
HAZUS damage estimates that were run with data from this feature class.
2.3.3
Assessment Data
The parcel data contained both the assessment value of the land and the assessment value
of the improvements. The parcel metadata claims “it is not intended for site specific
analysis” and the intent of this analysis is site specific, so additional assessment data was
located for the Township of Albion from the company Accurate Appraisal, LLC. The
first phase was completed before the assessor data for the township was received, but a
table was created from their website with the assessment values, year built, square
footage and number of stories and was joined via address to the data to be imported into
HAZUS. A simple table join on address was used during this analysis, but a better
procedure would be to geocode 1 the NFIP claims to a known point address layer or a
streets layer. The second phase of this analysis used the data received from Accurate
Appraisal and geocoded the address data to the county’s parcel layer.
1
“Geocoding is the process of finding associated geographic coordinates from other geographic data, such
as street addresses.” via http://en.wikipedia.org/wiki/Geocoding
The county parcel layer contained the previous year’s assessment data while the data
from Accurate Appraisal contained the most recent assessments taken after the flooding
event in 2008. HAZUS damage estimates should be determined using the assessment
data prior to the flooding event because post-flooding assessment values are useless for
comparison between the HAZUS estimates and the claim amounts.
2.3.4
NFIP Claims
The NFIP Claims data was received as a spreadsheet with a list of addresses and the
claim amounts. The minor reason that this is in the Data Problems section is because of
address standardization. Lack of address standardization can introduce errors that may
have to be manually fixed, such as these three neighbors:
xxx Lakeshore Dr
yyy Lakeshore
zzz Lake Shore Dr
The last address is correct and matches the parcel layer, the first address should be Lake
Shore not Lakeshore, and the second address is missing the street type identifier. With a
small dataset this problem is easily fixed, but as a dataset gets larger, the task of fixing
minor errors can take a significant amount of time.
As mentioned earlier, using a geocoding tool on the NFIP claims data would be a good
way to find the point locations of the structures with claims, and in the process the
software would attempt to standardize the addresses. When geocoding software cannot
assign a location because of an incomplete address, protocols are defined to place the
address in the best location, either by automatically putting it in the center of a zip code
or street segment, or reconfiguring the address to conform to the base data, or manually
placing the point. Also notable is the fact that the geocoding process tends to have better
results in urban areas compared to rural areas. Other potential problems can occur if
there is poor quality, accuracy or currency in the streets layer being used to geocode the
address.
3.0
Importing User Defined Structure Data into HAZUS
At this point, the data table for the building footprint centroids feature class can be a bit
unwieldy with all the tables that have been appended and the new fields that have been
created. The data fields discussed in the last section and found in Table 1 are the only
fields that actually get imported into HAZUS for the number crunching, but some of the
data that does not get imported is still needed for comparing and analyzing the results that
HAZUS estimates. The procedures in this section outline the steps taken with this pilot
dataset to prepare it for import into the User Defined Facilities table in HAZUS.
3.1
Add & Populate HAZUS Fields
Table 1 in Section 2.2 contains the data fields, along with their corresponding data types
and precision lengths, which need to be added to the building centroids layer and then
populated with data as described in the previous sections. It is very important to get the
data types correct as HAZUS will not allow the importation of data that is in an
incompatible data type to what it is programmed to expect. If the length is wrong,
HAZUS will give a warning that the field is too long, Figure 8, and will still import the
field, but when the data type is wrong, it will display the error shown in Figure 9 and not
allow the import.
Figure 11: Importing error when field length is too long
Figure 12: Importing error when data types are incompatible
Section 6.1.3, starting on page 6-5 of the User Manual, discusses importing User Defined
Facilities and was the basis for the procedures described in this appendix. The specifics
found there, especially the tables cited in the previous sections, are necessary to create a
User Defined Structures dataset that has the correct nomenclature and defaults that will
allow HAZUS to properly process the data and produce more accurate results. When the
procedures detailed throughout Section 2.2 are concluded, the User Defined Structure
data can be imported into HAZUS.
3.2
Export table from Geodatabase into Access
The Field Mapping dialog box is used to map the fields from the incoming data table to
the corresponding field in HAZUS and requires an .mdb file. Geodatabases are of the file
type .mdb, so when the User Defined Structures import tool opens a Geodatabase and a
feature class is selected, the Field Mapping dialog looks like Figure 14 on the following
page. But it seems that any attempt to use this import tool with a Geodatabase is met
with the error message shown in Figure 13, and furthermore, clicking OK or cancelling
the error box is followed by a hard crash of HAZUS (technically ArcGIS) where
Windows Task Manager must be used to terminate the application or process.
Figure 13: Error when using a Feature Class from a Geodatabase causes a hard crash
But when an .mdb created with Access is used as the source data instead of a
Geodatabase, the Field Mapping dialog box looks like Figure 14 on the following page.
The difference between these figures is noticeable in two areas. First, when an Access
database is used, there is a message at the top of the dialog box that states “OK button
will remain disabled until Latitude and Longitude fields are mapped.” The other
difference is that the Latitude and Longitude fields are not listed on the Target side of the
Field Mapping dialog when a Geodatabase is used, but when an Access created .mdb is
used, Latitude and Longitude are available in the list.
Since the User Defined Structures import tool seems to be unable to use Geodatabases,
the feature class table must be exported to Access. One method to do this is first open
Access to create a new blank database (Ctrl+N, select Blank Database, then name it and
click Create) and then open the Geodatabase with all the data in Access (Ctrl+O,
navigate to Geodatabase). After the Geodatabase is open in Access, all the feature class
tables in the Geodatabase are displayed, along with a number of other tables that define
the Geodatabase. Note that each feature class has a table with “_Shape_Index” appended
to it. Do not select one of those in the next step. Right click on the centroids layer, select
Export… from the menu and a dialog box similar to Open will display. Select the .mdb
created in the first step and the table from the Geodatabase will now export to the new
database.
Figure 14: Field Mapping dialog using a Feature Class from a Geodatabase
Figure 15: Field Mapping dialog using an Access created .mdb file
3.3
Checking Data Field Types and Sizes
With the data now in a readable format, it should simply be able to be imported into
HAZUS. But it was found in this pilot project that some of the field types and lengths
were altered throughout the process. Granted, many things were attempted along the way
to understand how this process operates and to get it to work, so this problem may not
occur for every dataset.
It is a fairly simple task to double check the field types so problems will not occur when
the User Defined Structures are imported. Open the database that the Geodatabase table
was exported into and click the Design button, seen in Figure 16 below. The Field
Properties for the table will be displayed and each field type can be cross-referenced
against Table 1 in this document and can be modified towards the bottom of that window
if found to be altered.
Figure 16: MS Access database with table exported from Geodatabase
3.4
Importing User Defined Structures into HAZUS
The User Defined Structures import utility in HAZUS is accessed through User Defined
Facilities under the Inventory menu. After the User Defined Facilities window opens,
right click in the blank field and the menu shown in Figure 17 below will appear.
Figure 17: Right-click to find the Import menu item in User Defined Facilities window
Select Import and then the Field Mapping dialog box, discussed previously in Figure 15,
will open. Select each field in the left Source list and then double click on the
corresponding field in the Target list until all the necessary fields are mapped. There is
also a Save function that should be used to store the mapped fields when the same data
fields will be used for future User Defined Structures analysis. More detail can be found
on page 6-3 and 6-4 of the HAZUS User Manual.
The time required to import the User Defined Structures will be based on the size of the
dataset and the specifications of the computer. The 18 structures imported for the pilot
project took very little time to import. A test run of about 2,500 records only took around
15 minutes.
After the importation has finished, the User Defined Facilities dialog box must be closed
and reopened before the imported data will appear in the list. Figure 18 below shows
imported data in the User Defined Facilities window. At this time the structures can be
turned into a point layer by clicking the Map button and can be exported from ArcGIS
and saved as a shapefile.
Figure 18: User Defined Structures imported into HAZUS
4.0
Performing Flood Analysis on User Defined Structures
The steps to running the HAZUS flood analysis on User Defined Structures are very
similar to running a regular HAZUS analysis. The main difference is that the results will
be displayed in a table for each of the individual structures but not in the reports section
where normally the results of the analysis are found. This section will briefly go over the
steps taken during the pilot analysis to run the HAZUS analysis on User Defined
Structures.
Figure 19: HAZUS Hazard menu is the first step of running analysis
4.1
Set Hazard Type
Flood Hazard Type is the first item in the Hazard menu, shown in Figure 19 above.
Figure 20 below shows the Flood Hazard Type input box where the type of analysis,
Riverine only for the pilot study, is chosen.
Figure 20: Select Flood Hazard Type for analysis
4.2
Import Flood Depth Grid
The Hazard menu’s second item, User Data, is where the Flood Depth Grid is imported.
Click to the tab Depth Grid and use Browse to navigate to the location of the depth grid.
Figure 21: Import Flood Depth Grid
After the depth grid is listed in the display, select the depth grid, like in Figure 21 above,
and use the Set Parameters button to choose the units of the imported depth grid. This
USGS flood depth grid was produced from the Dane County DEM so searching the
metadata reveals the units are in feet, which is selected, as shown in Figure 22 below.
Return period was left empty, as this analysis is looking at a single flooding event.
Figure 22: Set Units of the imported Flood Depth Grid
4.3
Create New Scenario
After HAZUS takes a short time to import the user defined depth grid, select Hazard >
Scenario > New and give a name to the analysis, as seen in Figure 23 below.
Figure 23: Name new scenario
Enter the name and click OK. The New Scenario dialog box will open, seen in Figure 24
below, then click the plus button next to Add to selection. The cursor will turn into the
select tool and then click on the polygon for the depth grid that HAZUS imported. After
it is selected and highlighted, click on the Save button and click OK.
Figure 24: Add the depth grid and Save
4.4
Delineate Floodplain
The final step under the Hazard menu is to go to Riverine and then Delineate Floodplain,
which brings up the dialog box shown in Figure 25 below. These settings are correct for
this analysis, click OK and then Yes to the raster processing warning. HAZUS will take a
short time to do the raster processing and the only thing left to do is run the analysis.
Figure 25: Last step before running the analysis
4.5
Run Flood Analysis on User Defined Structures
Finally, go to the Analysis menu and choose Run as seen in Figure 26 below.
Figure 26: Running the analysis
Check User Defined Structures as shown in Figure 27 below and click OK.
Figure 27: Select User Defined Structures from the Analysis Options
HAZUS will run the analysis at this time.
5.0
Viewing the Results of the User Defined Structure Analysis
On a normal Level 1 HAZUS run it is possible to view the results through the built in
reporting mechanism that uses Crystal Reports. When doing an analysis using the User
Defined Facilities as described throughout this document, the normal reporting method is
not used. The following steps show how to find and map the results, join the results back
to the original data for evaluation, and briefly describe some of the ways the flood
estimates were compared to NFIP claim amounts and assessment values.
5.1
View Current Scenario Results
Before the results can be seen, go to the Results menu and choose View Current Scenario
Results By… as shown in Figure 28 below.
Figure 28: Step 1 of viewing results for User Defined Structures analysis
The window below will appear, Figure 29, and then click OK. The results can now be
examined.
Figure 29: View Results By window - Click OK
5.2
Open User Defined Structures Loss Table and Map
The rest of the menu items under Results will now become available. As mentioned
above, in a regular HAZUS analysis, the Summary Reports would be used at this time.
For this type of analysis, the results will be found in the User Defined Facilities… item of
the Results menu, shown in Figure 30 below.
Figure 30: Viewing the results of User Defined Structures analysis
Figure 31: The individual results of the UDF analysis
The User Defined Facilities Loss table will open and each of the imported User Defined
Structures will be listed. Scrolling to the right will show the damage estimates that
HAZUS has calculated for each structure, Figure 31 above. A structure will have a
Building Damage Percent and a Building Loss in U.S. Dollars as well as a Content
Damage Percent and a Content Loss in U.S. Dollars.
Click the Map button then the Close button and the structures will be plotted based on the
latitude and longitude coordinates as discussed earlier. The Symbology of the Layer
Properties can also be adjusted to create different maps, shown in Figure 32 below is a
simple map where color symbols show ranges of Building Damage Percentiles for each
structure overlaid on the flood depth grid.
Figure 32: Map showing differences in Damage Percentage for User Defined Structures
At this time, the Damage Estimates exist in a table in a database inside the HAZUS folder
of Program Files. The results can easily be exported to a shapefile, shown in Figure 33
below, and then imported into the Geodatabase that contains the rest of the data for this
project. The layer can then be used for making maps or joined back to the original data
to make comparisons between the damage estimates and other data, such as NFIP claims.
Figure 33: Exporting the User Defined Structure Damage Estimate results to a shapefile
5.3
Spatially Joining Damage Estimates to Claims and Assessment Data
The fact that HAZUS truncates the Latitude and Longitude numbers to four decimal
places upon import was discussed earlier. It is at this point in the analysis that something
must be done to get the damage estimates joined back to the data so conclusions can be
drawn. Since HAZUS does not include any of the fields from the original data in the
results output, a table join is not possible. Even before the analysis is run, when viewing
the imported User Defined Structures, there is no field available to join back to the data
that it was created from. See Figure 34 below to see the discrepancies between the before
and after locations.
Figure 34: Original Locations of Building Footprint Centroids (Star Symbol) vs. HAZUS Locations
after import (Plus Symbol) – with parcels, building footprints and flood hazard boundary.
A spatial join will have to suffice for this operation, but it is reasonable to think that in a
large dataset with structures that may be very close together, an error could occur that
would result in a damage estimate getting spatially joined to the structure next door and
therefore inaccuracies would be introduced into the conclusions of the analysis.
Since more than likely the results for individual structures will want to be mapped at the
actual location of those structures, the HAZUS results should be spatially joined to the
original dataset. Both feature classes should be brought into ArcGIS and the centroids
layer that was used for importing into HAZUS should be the one that gets right clicked
on to start the join. As shown in Figure 35 below, in the Join Data dialog box, Join data
from another layer based on spatial location should be chosen from the drop down menu
at the top. The next drop down menu should contain the exported layer from HAZUS
that contains the damage estimate results. The second radio button should be chosen.
This will join only one point from the results layer to the only point that it is closest to in
the centroids layer. This option will also append a field that contains the distance
between the two joined points, which will allow the quantification of the locational error
that was created when HAZUS truncated the Latitude and Longitude fields to only 4
decimal places. The location of the file to be created after the spatial join goes in the last
text field and finally OK can be clicked.
The result will be a layer containing the actual locations of the User Defined Structures,
all the fields that were joined and created before the import into HAZUS, and the damage
estimates for each structure.
Figure 35: Spatially Joining the HAZUS results back to original data for analysis
5.4
Statistical Analysis
With the HAZUS damage estimates in the same table as the assessment values and NFIP
claims data, it is a simple procedure to get sums, means, medians and standard deviations
for each of the fields. These sums and averages can then be compared to each other to
draw conclusions. This report contains conclusions drawn in terms of the percentage of
the actual claims that HAZUS was able to estimate and what percent of the assessment
value was the claim or the estimated damage.
With individual structure data, it is also possible to find outliers in the data, such as a
structure that had a very high damage ratio with a relatively low claim value, or even the
opposite, a high claim value on a structure that was estimated to have little or no damage.
Each of these findings can be used to draw conclusions from the dataset that may not
have been able to be seen prior to mapping the results.