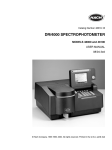
1
INTRODUCTION
TERTIARY TREATMENT OF WASTEWATER BY LEMNA MINOR (DUCKWEED)
John Hobbs
Assistant Professor of Biology
Lake Region State College
Treatment of wastewater from city sewage systems has been a constant problem for years in
terms of cost, storage structures, and method of treatment. During the 1960’s and into the 1970’s
and 80’s, tougher environmental standards have put pressure on local communities and cities to
find less expensive and more effective ways of wastewater treatment.
Smaller towns and industries simply use a lagoon system as a way to deal with the wastewater.
This type of system uses evaporation of the water that leaves the water chemical and waste
products behind.
Larger cities that generate millions of gallons of wastewater daily cannot depend entirely on
evaporation and must discharge the excess wastewater into a river or lake. The primary problem
is that the effluent must not contain waste nutrients or chemicals in excess of the EPA limits for
the discharge to prevent contamination of the surrounding waterbodies.
Devils Lake, North Dakota, has another unique problem that most cities do not have. The lake Devils Lake - is at the southern terminus of a 3600 square mile drainage basin from which there
is no outlet. So the discharge of raw or untreated sewage into the lake could be detrimental to
the shorelines, ecology and recreational fishing. As evidenced by studies made by Ecologists
during the 1970’s, pollutant chemicals such as phosphates, nitrates, nitrites, ammonia, fecal
bacteria, and other contaminants were being discharged from the city lagoon system as overflow
and created some nasty conditions in certain areas of the lake.
Several methods of treating the discharge of sewage water were studied during the latter 1980’s
such as building an expensive chemical treatment plant, building a larger lagoon system, a cattail
aquaculture which has proved only moderately successful.
Another type of aquaculture for treating sewage water is the use of a small, floating plant called
Lemna minor, or Small Duckweed. This is the plant that commonly grows on ponds, sloughs
and around the edges of lakes all over the midwestern United States.
In the early 1980’s, a young sculptor/civil engineer from the Twin Cities came up with the idea
of using Lemna minor as an alternative method for wastewater treatment. Viet Ngo was
fascinated by the small aquatic plant because it has an enormous appetite for nitrogen and
phosphorus. These same pollutants were causing excessive algae growth in the lakes and rivers
that were receiving wastewater discharges. The plant has the ability to convert the elements into
1
PDF created with FinePrint pdfFactory trial version http://www.fineprint.com
high-quality food for wildlife. A $250,000 grant from the Minnesota legislature enabled him to
research the feasibility of using duckweed in water treatment.
Ngo calculated that a water treatment system based on duckweed could be constructed and
operated for a fraction of the cost of conventional systems. This system uses no chemicals for
water treatment and relies on the sun for energy. Ngo patented his designs and formed Lemna
Corporation of Mendota Heights, MN, to market them. Duckweed was such a superior
competitor for nutrients in water that algae died off immediately or within a few weeks. These
nutrients fueled extremely rapid reproduction, with the duckweed's biomass doubling ever 3 to 5
days.
Also, harmful substances such as dissolved solids and heavy metals were reduced to levels well
below EPA requirements. And the duckweed, unlike algae, didn’t produce putrid odors or a
breeding ground for mosquitoes.
The City of Devils Lake Commission approved a pilot project to test the feasibility of using a
“Lemna System” to clean the City’s wastewater in 1988. The project was a 10 X 200 foot pond,
filled with untreated wastewater and inoculated with duckweed.
A private, independent testing firm approved by EPA did the preliminary tests for
Orthophosphates, Total Phosphates, BOD’s, TSS, and Coliforms. The results showed a
significant decrease in all parameters tested.
Since some of the major concerns were having a system of this type so far north (most systems
were located in the southern states) and building a large enough facility to handle the wastewater
for about 10,000 people compacted into a 60 acre site allocated for a Lemna system. Plans and
designs were drawn up by Lemna Corporation which included upgrading the existing 3 lagoons
as the primary settling ponds with new dikes and rip rap developing the Davis Flats for
secondary treatment and constructing the Lemna System for the tertiary treatment of the water
before discharging. Total cost of the entire system was approximately $4.5 million of which the
EPA funded 2/3 of the cost and the city 1/3 of the cost.
The Lemna System consists of a serpentine-shaped canal system compressed into a 60 acre site.
The canals are actually 4 miles long, 200 feet across, and 6-10 feet deep. The canals are divided
into 3 holding “ponds” separated by a dike and gravity flow gates:
1) Lemna Pond North - 5-6 acres
2) Lemna Pond Center - Channels 1, 2, 3, 4 - 22.5 acres
3) Lemna Pond South - Channels 5, 6, 7, 8 and 001 discharge pump - 22.5 acres
Floating barrier grids are placed in the channels to keep the duckweed in place, protected from
the winds. Since duckweed floats on top of the water and has short roots, wind greatly affects
the plants from blowing to one side or the other in the channels.
Lemna minor or Little Duckweed is the smallest known flowering plant, ranging in size from .5
mm to 1 cm. The plant grows in most ponds, sloughs and lake shores and can form dense mats
on the water’s surface. During the growing season, with water temperatures between 20-24o C
2
PDF created with FinePrint pdfFactory trial version http://www.fineprint.com
and a sufficient supply of nutrients, the plant will double its biomass every 3-5 days.
Reproduction is mainly by budding off small fronds (leaves) which become independent plants.
It will also form very small flowers and seeds under ideal conditions.
This amazing plant will absorb phosphates in several forms, nitrates, ammonia, some heavy
metals and other nutrients from the water. It grows to such a thick mat that algae cannot grow
and prevents mosquito larva from breathing at the surface. When nutrients are low, each small
frond grows a root, sometimes up to 10 cm long.
Duckweed is very winter hardy and sinks to the bottom sediments just before freeze-up. When
spring comes, the old fronds will fill up with CO2 and float to the surface and begin budding.
The plant is generally used as the final or tertiary treatment of wastewater. The plants remove
dissolved chemicals from the water before being discharged.
Turn around time for the Lemna System varies with the weather but is generally every 3 to 4
weeks from discharge, filling, treatment to discharge. On the average, about 3.5 million gallons
of wastewater can be treated per day.
The duckweed is harvested off the Lemna System approximately every 3 to 5 weeks or when the
density is between .8-1.5 lbs. of duckweed per square foot. Special amphibious harvesters skim
the duckweed mat off; it is then loaded into semi-trucks and hauled off to farmer’s fields or the
landfill.
The highly successful performance of the Devils Lake Lemna System has led to international
attention. Calls from all over the United States and visitors from all over the world are common
place. Tour groups from all over the U.S., Canada, Sweden, France, Israel, Egypt, and Senegal,
West Africa have visited the site. This system has allowed the City’s wastewater department to
remove up to 91% of the total phosphorous content of its wastewater discharge to levels below
the State and EPA requirements.
3
PDF created with FinePrint pdfFactory trial version http://www.fineprint.com
4
PDF created with FinePrint pdfFactory trial version http://www.fineprint.com
Chemical Tests Performed in the Lab
*1. pH
Hanna pH meter
2. Temperature
Hanna pH meter
*3. Orthophosphates
Spec 20D
*4. Total Phosphates
Spec 20D
*5. Total Suspended Solids
Analytical Balance Isotemp Oven
6. Ammonia nitrogen
DR/4000
7, Nitrate nitrogen
DR/4000
8. Nitrite nitrogen
DR/4000
9. Total chlorine (City drinking water)
DR/4000
10. Fluorides (City drinking water)
DR/4000
11. Dissolved oxygen
YSI Oxygen meter
12. Coliforms
a. Wastewater
b. Drinking water
Membrane filter and m Coli 24 Blue media
100 mL sample and Colilert media
13. Total Dissolved Solids and Conductivity
HACH TDS - Cond. meter
14. Total Dissolved Solids
Evaporation Method - Oven Membrane FiltersVacuum pump and Milipore Set-up
* Lab certified
5
PDF created with FinePrint pdfFactory trial version http://www.fineprint.com
Wastewater-Water Lab Equipment List
1. SPECTRONIC 20D - Milton Roy Company
Milton Roy Company
Analytical Products Division
820 Linden Ave,
Rochester, NY 14625
a. Cetron CEA59RX Phototube 340-600 nm
b. Cetron CEA30 Infra-red Phototube for 880 nm
c. 07-144-33 Activator Tubes
d. 331782-000 1” Photospectral tubes - Milton Roy Company
(34 tubes)
e. 1” tube adapter
f. Spectronic Standards - Milton Roy Company - and Filter Kit, Cat. #33-31-28 for Spectronic
20 and 20D
g. User’s Manual - Spectronic Standards, Milton Roy Company 1990, Spectronic 20D
h. Spectronic 20 Series, Operator’s Manual, Milton Roy Company 1990
2. Denver Instrument Company Analytical Balance, .0001 accuracy - Electronic scale. Checked
yearly by Northern Balance and Scale.
3. pH Meter HI 9224, Portable, pH and Temperature Meter
HANNA Instruments
Woonsocket, RI 02985
4. YSI Model 51B Dissolved Oxygen Meter
Yellow Springs Instrument Co Inc.
Yellow Springs, Ohio 45387
a. YSI 5795A Submersible stirrer
b. 5492A battery pack
c. YSI 5700 Series DO2 probe and membranes
d. Instruction manual
5. Isotemp 500 series oven; 20 to 220o C
Fisher Scientific
711 Forbes Ave
Pittsburgh, PA 15219
6. Dessicator Cabinet, non vacuum, SanPlatec Corp
HACH Company
Box 389
Loveland, CO 80539
6
PDF created with FinePrint pdfFactory trial version http://www.fineprint.com
7. HACH Conductivity/TDS meter
HACH Company
Box 389
Loveland, CO 80539
8. Thermolyne - Type 37900 Culture Incubator
9. Bacterial Incubator - HACH - tube type incubator - 2 temperature settings
HACH Company
Box 389
Loveland, CO 80539
10. ALL AMERICAN Pressure steam sterilizer. model 25X electric sterilizer
Wisconsin Aluminum Foundry Co
Ordered from FREY Scientific
Mansfield, OH
11. Porcelain top stirring hot plate
Fisher Scientific
711 Forbes Ave
Pittsburgh, PA 15219
12. DURASTILL fan-cooled electric water distiller, model 30 with 10 gallon tank
Durastill, Inc
4200 Birmingham Roads
Kansas City, MO 64117
13. GAST vacuum pump model 0211-V45F-G8CX
GAST Mfg Corp
Benton Harbor, Michigan
a. Fisher brand 350 mL filtration unit
b. Gelman Sciences 300 mL magnetic filtration unit
c. 1000 L and 2-500 mL side spout vacuum flasks
14. OHAUS triple beam balance 2610 g. max.
Serviced by Northern Scale Co
15. Fisher 1 hour timer and Barclay Geneve battery timer
7
PDF created with FinePrint pdfFactory trial version http://www.fineprint.com
16. DR/4000 UV-Vis Spectrophotometer Range 190 to 1100 nm wavelength
Single cell module
Carousel module
1 inch matched sampling cells (2)
1 cm matched quartz sample cells (2)
AccuVac and 16 mm vial adapters
1 inch and 1 cm cell adapters
Carousel inserts (1 inch - 4 position)
Carousel insert (1 cm - 6 position)
Replacement tungsten lamp kit
Dust cover and power cord
8
PDF created with FinePrint pdfFactory trial version http://www.fineprint.com
Reference Guides and Operator Manuals
1. “Standard Methods for the Examination of Water and Wastewater”
17th Ed. 1989
1015 15th St NW
Washington, DC 20005
2. “Limnological Analyses, “
Wetzel and Likens
2nd 1991
Springer-Verlag
New York, NY, Inc (Hobbs)
3. HACH DR/4000 UV-Vis Spectrophotometer Handbook - Procedure Manual 1997
HACH Company
Box 608
Loveland, CO 80539
4. Spectronic Standards User’s Manual
Milton Roy Company 1990
Analytical Products Division
Customer Service Dept
820 Lincoln Ave
Rochester, NY 14625
5. Instruction Manual - HI 9224 Portable, Microprocessor, ATC, Printing pH meter
Hanna Instruments, Inc
Highland Industrial Park
584 Park East Drive
Woonsocket, RI 02985
6. Instruction Manual YSI Model 51B Dissolved Oxygen Meter
YSI Incorporated
Yellow Springs Instrument Co Inc
Yellow Springs, OH 45387
7. Procedures for Water and Wastewater Analysis - with Colorimetric Calibrations for
Bausch and Lomb Spectrophotometers
4/1/87, 2nd Ed
HACH Company
Box 389
Loveland, CO 80539
9
PDF created with FinePrint pdfFactory trial version http://www.fineprint.com
8. HACH Company Manual for DR/4000 UV-Vis Spectrophotometer Models 48000 and 48100
1997
HACH Company
Box 389
Loveland, CO 80539
9. Operator’s Manual Spectronic 20 Series
Spectrophotometers - Milton Roy - 20 and 20D
1990
Milton Roy Company
Analytical Products Division
Customer Service Department
820 Lincoln Ave
Rochester, NY 14625
10. HACH Company Bacterial Incubator Model 45900 Manual 1992
HACH Company
PO Box 389
Loveland, CO 80539
11. HACH Company Model 44600 Conductivity/TDS Meter Manual 1989
HACH Company
PO Box 389
Loveland, CO 80539
12. HACH Analytical Procedures - Coliform Procedures - Multiple Tube Fermentation
Techniques
HACH Company
PO Box 389
Loveland, CO 80539
13. Thermolyne Culture Incubator Type 37900 Operation Manual and Parts List Series 379 1993
Barnstead/Thermolyne
PO Box 797
2555 Kerper Boulevard
Dubuque, IA 52004-0797
14. Denver Instrument Company AB Series - Electronic Analytical Balances Operating
Instructions
Denver Instrument Company
6542 Fig Street
Arvadon, CO 80004
10
PDF created with FinePrint pdfFactory trial version http://www.fineprint.com
Sampling Procedures and Schedules
1. Sampling of the main cells, North Marsh and channels of the Lemna system is done on
predetermined days during the week at points indicated on the Devils Lake Wastewater
System Map.
2. A sampler consisting of a metal pipe 3.0 m long with a 1 L plastic bottle clamped to one end
is used to obtain the water samples.
3. A tray holding the sample bottles - plastic bottles 210 mL size - marked with each site is used
to collect the sample of water to be tested and brought back to the lab.
4. Each sample is monitored for pH and temperature immediately when collected and the time
is noted on the data log sheet.
5. Over the past several years, a collecting and testing schedule has been set up to monitor the
parameters required by the State Health Lab and EPA, as well as “in-house” chemical tests
such as TDS, conductivity, ammonia-nitrogen, nitrate-nitrogen, and nitrite-nitrogen.
6. Daily testing schedule per week:
Monday:
Sample: NM in, NM out, LPN, Ch 1, Ch 2, Ch 3, Ch 4, Ch 5, Ch 6, Ch 7, Ch 8
Tests: pH, temp, OP, TP, TDS, conductivity, ammonia-nit; and special samples as required
Tuesday:
Sample: NM in, NM out, LPN, Ch 1, Ch 3, Ch 5, Ch 7, storm channel, any specials
Tests: pH, temp, OP, TP, TDS, conductivity, nitrites-nit
Wednesday:
Sample: NM in, NM out, LPN, Ch 1, Ch 2, Ch 3, Ch 4, Ch 5, Ch 6, Ch 7, Ch 8
Tests: pH, temp, OP, TP, TDS, conductivity, nitrates-nit
Thursday:
Sample: Cell 1, Cell 2, Cell 3, NM in, NM out, LPN, Ch 2, Ch 4, Ch 6, Ch 8, Creel Bay
Tests: pH, temp, OP, TP, TDS, conductivity, nitrites-nit
Friday:
Sample: NM in, NM out, LPN, Ch 1, Ch 2, Ch 3, Ch 4, Ch 5, Ch 6, Ch 7, Ch 8
Tests: pH, temp, OP, TP, TDS, conductivity
7. Special drinking water samples are taken each Friday from four sites: Entry point, Heartland
Court, Middle School and Super Pumper. Tests taken are pH, temp, OP, TP, TDS,
conductivity, Total chlorine, Fluorides. The four City drinking water samples are collected
and tested every Friday year round. A sample of the Lab tap water is also tested for the same
parameters as a cross-reference.
11
PDF created with FinePrint pdfFactory trial version http://www.fineprint.com
8. Special sampling and testing: whenever wastewater is being discharged from 001, 002, 003,
004 (marked on map). Tests taken: pH, temp, orthophosphates, total phosphates, total
suspended solids, TDS, and conductivity are tested and “in-house” coliforms may be done
with split samples with the State Health Lab.
12
PDF created with FinePrint pdfFactory trial version http://www.fineprint.com
13
PDF created with FinePrint pdfFactory trial version http://www.fineprint.com
Discharge Monitoring Report
Quality Assurance Studies (DMR-QA)
Each year, the City of Devils Lake Wastewater Lab participates in the USEPA Office of
Enforcement and Compliance Assurance tests for the parameters certified by the ND State
Health Lab in Bismarck. The National Pollutant Discharge Elimination System (NPDES)
permitees informs the labs of their continuance in performing the DMR-QA studies.
The purpose of these studies is to evaluate the analytical and reporting ability of laboratories
performing chemistry and whole-effluent toxicity self-monitoring analyses required in the
designated NPDES permits.
The Devils Lake Lab performs four (4) in-house chemistry tests. These are: Orthophosphates as
P, Total Phosphates, Total Suspended Solids (non filterable resident) and pH.
All of the other required tests are performed by the ND State Health Laboratories in Bismarck.
These tests include Trace Metals, Other Nutrients (Ammonia, Nitrates, TKN), Demands (COD,
TOC, BOD’s), and Miscellaneous Analytes (Cyanide, Oil and Grease, Phenalics, and Residual
Chlorine).
The tests analyzed at the Devils Lake Wastewater Lab are performed in August or September
and the other test samples are sent on to the ND State Health Lab. The samples are prepared as
to directions and preparation prescribed in the General Instructions of the DMR-QA Study.
Evaluations of the sample test results are usually received in January of the next year and
indicated as “Accepted” or “Not Accepted” as compared to the “true”/calculated values.
When a test value for our lab is ”Not Accepted,” a short report of what may have occurred ( in
our case, only one time, a mathematical error - not a lab procedure error, was incurred) and
another sample was sent to test and the results sent to NPDES permitee.
Other than that one occurrence, all of the test results have met the true values.
14
PDF created with FinePrint pdfFactory trial version http://www.fineprint.com
Sample Acquisition, Testing, Data Recording
and Disposal of Sample
A 1 L sample is taken from each selected site on their scheduled days, the pH, temperature and
time of sample collection is recorded on the Daily log sheet. Also, a 210 mL sample is collected
for lab analysis at the same time and location.
After all samples are collected and recorded, they are brought immediately to the lab and lined
up according to site order (i.e. NM in, NM out, LPN, Ch 1, etc).
The first order of testing is for total phosphate sample preparation. These prepared samples (50
mL) are placed in the autoclave and “cooked down” at 15 lb. pressure for 30 minutes.
Next, the orthophosphate test samples (10 mL) are taken directly from the sample bottles and
tested, recorded absorbance on the Spec 20D and read off the OP graph curve for mg/L OP and
entered into the Official Data Record Book and re-copied to the Daily Log Sheet.
After 30 minutes “cook-down” time in the autoclave, the 50 mL samples are cooled and prepared
for the total phosphate test. The absorbance is recorded on the Spec 20D, read off on the TP
graph curve for mg/L TP, recorded in the Data Record Book and re-copied on the Daily Log
Sheet.
Using the HACH TDS/Conductivity meter, each sample is analyzed for TDS and conductivity
and recorded as before.
Depending on the daily schedule, either ammonia-nitrogen (Mondays), nitrate-nit.
(Wednesdays), nitrite-nit. (Tuesday and Thursdays) are analyzed. Each sample is run up
according to protocol on the DR/4000 spectrophotometer. Results are recorded in the Data Book
and re-copied on the Daily Log Sheet.
Upon completion of testing, what is left of the original sample is dumped down the lab sink, the
bottles are washed with DI water, drained and stored in the cabinet.
Any test samples containing toxic chemicals such as mercury (Nessler’s Reagent-Ammonia test)
and Cadmium (Nitrate test) are disposed of into 2 Red Toxic chemical containers under the sink.
The time is recorded for the beginning of testing and completion of testing in the Data Record
Book; all results are checked and signed by the lab technician. The Daily Log Sheet is copied
and double checked with the Data Record Book and initialed by the lab technician and placed in
the Daily Log Sheet Notebook. From sample collection to test completion, time is between 4 to
5 hours.
15
PDF created with FinePrint pdfFactory trial version http://www.fineprint.com
16
PDF created with FinePrint pdfFactory trial version http://www.fineprint.com
Flow Chart of Samples - Testing and Disposal
Tracking the water samples and spikes from collecting to disposal depends on the daily schedule
and what tests are run on what day or special samples taken when wastewater is being
discharged. From 8 to 14 water samples are collected, time, pH and temperature recorded on the
Daily Log Sheet when collected. At the Lab, blanks for Orthophosphates and Total Phosphates
plus spikes of the samples are made up to check the accuracy of the tests.
Test Analysis
Preparation
Total Phosphates
Blank, TP spike
Results & Data
Preparation and
-->
and TP sample spike
digestion
Results Spec 20D
-->
recorded in Log Book
in autoclave
-->
Preparation
-->
recorded in Log Book
-->
in Log Book
and Daily Log
Ammonia-
Results recorded
-->
Preparation
-->
in Log Book
DR 4000 UV-Vis
Preparation
-->
in Log Book
disposal
container
Waste
-->
and Daily Log
Nitrite-
disposal
container
Results recorded
-->
Preparation
-->
in Log Book
DR 4000
-->
Sink
-->
Sink
and Daily Log
Total Suspended Solids
from selected sites
-->
Results recorded
-->
DR 4000
1 L split samples
Waste
and Daily Log
Nitrate-
Nitrogen
Sink
Results recorded
directly from sample
Nitrogen
-->
and Daily Log
TDS and Conductivity
Nitrogen
Sink
Results Spec 20D
and OP sample spike
HACH meter
-->
and Daily Log
Orthophosphates
Blank, OP spike
Disposal
Preparation
-->
filtered dried
Results recorded
-->
in Log Book
in oven 24 hours
and Daily Log
Special tests
TDS Evap method
Coliform tests
Split samples
17
PDF created with FinePrint pdfFactory trial version http://www.fineprint.com
Samples collected from the Lemna System have time, pH and temperatures tests taken at the
time of collection and recorded on Daily Log Sheet.
The order of testing, preparation, recording results and disposal are indicated by the number in
front of each test. The time for beginning the tests and completion are recorded in the Daily Log
Book and signed by the lab technician.
Most water samples are emptied into the sink when the prescribed tests are completed. Test
samples for Ammonia-Nitrogen (Nessler’s Reagent) are disposed of in the labeled “Ammonia”
chemical waste container and the Nitrate-Nitrogen test samples (NitraVer 6 Reagent) are
disposed of in the labeled "Cadmium” chemical waste container. Both red chemical containers
are located under the sink and when full, are disposed of at the proper facility.
18
PDF created with FinePrint pdfFactory trial version http://www.fineprint.com
Deionized Water for Sampling, Controls and Washing
Deionized water is essential for use in making up control blanks for orthophosphates, total
phosphates and other tests performed in the laboratory test program.
The Devils Lake City Wastewater Lab has a Durastill which produces 10 gallons of distilled
water daily. This water is then pumped through a deionizer tank to remove any remaining
minerals from the distillation process.
The DI water is tested weekly directly from the DI water faucet with the HACH
conductivity/TDS meter set for the CND uS/cm mode. The DI water should test below 2.5
uS/cm for proper testing procedures. When the DI water tests above the 2.5 uS/cm limit, the old
DI tank is replaced by a new tank.
The conductivity readings are recorded on the Deionized Water Conductivity Chart each week.
Recordings include date of test, person testing, DI tank installed and tank recharge date.
19
PDF created with FinePrint pdfFactory trial version http://www.fineprint.com
SAMPLING PROCEDURES
Collecting the water samples for analysis is important to ensure that each sample is collected at
the same site each time and brought into the lab immediately for testing for the parameters
required for that day. The sampling procedure should be followed and collected as close to the
same technique as possible to insure uniform sampling.
1. Set out the white plastic collecting tray for the sample bottles.
2. Depending on the daily schedule as to how many sample bottles will be used, select the
collecting bottles (210mL) and the appropriately marked caps and put them into the
collection tray.
3. Also use the 150 mL Nalgene beaker for pH and temperature tests.
4. Include the HANNA pH-temperature meter (pre-calibrated before testing) in the collecting
tray.
5. Bring along the clipboard, pen and Daily Log Sheet for recording time of sampling, pH and
temperature.
6. When sampling at each site, rinse the sampler twice with the sample water and then dispense
about 100 mL of sample in the Nalgene beaker and place the pH and temperature probes into
the sample, set the pH meter to “ON”, stir the sample and record pH and temperature after 1
minute. Pour the rest of the water sample into the appropriate sample bottle after rinsing and
fill to overflowing. Try not to get duckweed, organisms or other debris in this sample.
Record the time collected.
7. Go on to the next sampling site and follow the same procedure.
8. Whenever a sampling site has duckweed (Lemna minor) covering the surface, use the
sampler and swirl the duckweed away and take the sample 15 to 30 cm below the surface.
9. Bring the water samples into the lab and immediately set up the bottles on the testing bench
in order of collection for the prescribed tests for that day.
pH Values
The measurement of pH of the water samples is one of the most important and frequently used
tests in water chemistry. At a given temperature, the intensity of the acidic or basic character of
a water sample is indicated by pH or hydrogen ion (hydronium) (H3O+) activity. pH ranges from
pH O (highly acid) to pH 14 (highly basic).
The pH of the water samples to be analyzed is taken immediately upon sampling from the
various sites along with temperature and time of collection.
Calibration of the HANNA HI9224 portable pH meter should be done at least once a week or
several times during the week if used frequently. For better accuracy, it is recommended that the
instrument be standardized at least to 2 points of reference, using a standard solution of pH 7.01
and pH 10.00. A check of the range can also be done with a standard solution of pH 4.00.
20
PDF created with FinePrint pdfFactory trial version http://www.fineprint.com
The pH calibration is performed as follows:
1. Rinse the electrode with some pH 7.01 standardized solution. Dip the bottom 2.5 cm of the
electrode into a beaker containing pH 7.01 solution.
2. Press the ON button, then the CAL button. The LCD will blink 7 until the electrode
stabilizes.
3. When the 7 stops blinking, the calibration can be confirmed. Wait about 30 seconds and
press CFM to confirm the first buffer. Record the pH after the 7 stops blinking and after the
CFM button is pressed on the pH Calibration Chart for initial pH and after column in the pH
7.00 area. Both readings should be fairly close.
4. If everything is satisfactory, the secondary LCD will blink 4 expecting the second buffer.
But most of our pH readings are on the alkaline side (pH above 7), the 4 can be changed to
10 by pressing the BUFF button. Rinse the electrode off in DI Water and place it in the pH
10.00 standard solution.
5. When the 10 stops blinking, indicating that the electrode has stabilized, wait about 30
seconds and then press the CFM button again to confirm the second point calibration.
Record the two readings in initial and after pH 10 column.
6. The buffer reference disappears from the secondary display and the meter is calibrated and
ready to use.
7. A third check of the pH meter can be made by simply dipping the electrode into the standard
pH 4.0 solution and recording the reading in the pH 4 column.
8. Wash the electrode in DI Water, shut off the meter and it is ready to use for that set of pH
readings.
9. During calibration, the secondary LCD displays the selected buffer solution value. By
pressing the RANGE button, the temperature value can be displayed. To maintain optimum
performance of the electrode, it is important that the electrode bulb be kept moist. The
plastic cap for the electrode should have a small amount of DI Water in it.
Dissolved Oxygen - YSI O2 Meter
Dissolved oxygen levels in natural and wastewater depends on the physical, chemical, and
biochemical activities in the water body. The analysis for DO is a key test in water pollution and
waste treatment process control.
Calibrating the YSI Model 51B Dissolved Oxygen Meter: read instruction manual for the
preparation of the YSI 5750 Probe used with the Model 51B Oxygen Meter.
Preparing the instrument: Place the meter in its operating position (vertical, tilted or on its back)
before it is prepared for use and calibrated. After the probe has been prepared proceed as
follows:
21
PDF created with FinePrint pdfFactory trial version http://www.fineprint.com
1. With the switch in the OFF position, adjust the meter pointer to zero with the screw in the
center of the meter panel..
2. Switch to ZERO and adjust to zero with the ZERO CONTROL KNOB.
3. Switch to FULL SCALE and adjust the FULL SCALE knob until the meter needle aligns with
the "15" mark on the mg/L scale.
4. Attach the prepared probe to the PROBE CONNECTOR of the instrument and adjust the
retaining ring finger tight. This meter also has the 5795A Submersible Stirrer which screws
onto the 5739 probe. This connects to battery pack on the bottom of the meter.
5. Before calibrating allow 15 minutes for optimum probe stabilization. Repolarize whenever
the instrument has been OFF or the probe has been disconnected.
6. Calibration:
The operator has a choice of three calibration methods - Winkler Titration, saturated water,
and air. Experience has shown that air calibration is quite reliable, yet far simpler than the
other two methods. Only the saturated water and air calibration will be described here.
A. Saturated water method
1. Air saturate a volume of water 300-500 mL by aerating or stirring for at least 15 minutes
at a relatively constant temperature.
2. Place the probe in the sample and stir or use the Submersible Stirrer.
3. With the switch in the CALIB O2 position, adjust the CALIB knob to the mark for the
local altitude (1428 feet). Leave probe in sample for 2 minutes to verify stability.
B. Air calibration method
1. Switch to CALIB O2 position.
2. Place the probe in moist air (use a small bottle with Kimwipes or paper towel saturated
with water). Wait about 10 minutes for temperature stabilization.
3. With the CALIB knob set the meter pointer to the mark for the local altitude (1428 feet
for pond elevations). Be sure reading is steady.
The probe is now calibrated and should hold this calibration value for many
measurements. Check calibration after each series of measurements and in time you will
develop a realistic schedule for recalibration.
Dissolved Oxygen Measurement: With the instrument prepared for use and the probe calibrated,
place the probe in the sample to be measured and provide stirring.
1. Allow sufficient time for probe to stabilize to sample temperature and dissolved oxygen.
2. Turn the switch to TEMP and read temperature from the lower meter scale. Set the O2
SOLUBILITY FACTOR dial to the observed temperature, taking care to use the appropriate
salinity index (usually use the second bar down and set to the correct temperature reading.
See Salinity Correction in manual).
3. Turn the switch to READ O2 and read the dissolved oxygen value in mg/L directly from the
meter. Refer to the Instruction Manual for further details.
22
PDF created with FinePrint pdfFactory trial version http://www.fineprint.com
Operation of Spectronic 20D Spectrophotometer
Study the figure of the Spec 20D on page 4 of the Operator's Manual for the control knobs and
buttons.
Phototube option offers two choices of wavelength tubes:
1. 340 to 600 nm phototube #CEA59RX or 9006, no filter required. This tube is used for
nitrates, nitrites and ammonia determinations and other tests as indicated by test instruction.
2. 600 to 950 nm Infra-red phototube #CEA30 or 9008 with a red infra-red filter. Refer to page
13 and figure 9 for phototube and filter installation. This phototube is used for
orthophosphates and total phosphates determination.
Selection of cuvette adapter depends on the test and method used. Two adapters are provided
with the Spec 20D: 1 inch (2.54 cm) adapter for 1 inch diameter cuvette tubes and 1/2 inch
standard adapter for 1/2 inch cuvette tubes. All phosphates, nitrates and ammonia tests use the 1
inch cuvette and the nitrite test uses the 1/2 inch cuvette and adapter.
Sample measurement for Spec 20D, sequence procedure for sample measurement using
Transmittance and/or Absorbance.
1. Turn power ON (left knob on front). Allow 15 minute warm up.
2. Select wavelength using WAVELENGTH CONTROL (right knob on top deck). Example:
400 nm for nitrates, 425 nm for ammonia, 505 nm for nitrites, 880 nm (infra-red phototube
and filter) for Orthophosphates and Total Phosphates. Other tests or procedures will indicate
other wavelength settings.
3. Set the mode to TRANSMITTANCE (usually the machine starts out with the red LED light
displayed on Transmittance.)
4. With sample compartment empty and cover closed, adjust ZERO CONTROL (left power
switch) so that the meter reads O% T.
5. Insert a reference blank (1 inch or 1/2 inch in diameter cuvette filled with distilled water or
unreacted sample blank) into the sample compartment and set 100% T or press mode button
to ABSORBANCE to read .000 Ab.
6. Remove reference blank and insert unknown sample into compartment and read
measurement from display in percent transmittance or absorbance.
Remember to clean the cuvettes with Kimwipes and do not touch the tubes below the fiducial
line. Always line up the fiducial line on the cuvette with the mark on the adapter.
If more instructions are needed, refer to Section 5, page 13-14, of operator's manual. Directions
for wavelength setting, reference blanks and correction blanks are usually given the "Standard
Methods for the Examination of Water and Wastewater" 1989, 17th Ed., or Milton Roy Test
Kits.
23
PDF created with FinePrint pdfFactory trial version http://www.fineprint.com
Spectronic Standards Test
At least once a year, the Milton Roy Company Spectronic 20D should be evaluated as to the
major parameters of the instrument's performance. This is used as part of the laboratory's normal
quality control program to detect any incipient instrument problems before errors result.
To ensure accurate results and to avoid damaging the standards, be sure to read the sections on
operation and handling techniques of the Operator's Manual on file and also the Care of
Standards before using the standards.
The laboratory has a SPECTRONIC Standards Set #33-31-50 for determining any stray radiant
energy and photometric performance of the Spec 20D. Refer to the SPECTRONIC Standard
User's Manual, page 2, for the description of the standards and other items in the Standards Kit.
Test procedures, page 8-9, User's Manual:
1. Determination of 0% Transmittance and Stray Radiant Energy Test
A. Insert the optical alignment test piece/control standard in the instrument (unlabeled blank).
B. Set the wavelength to 400 nm.
C. Set 100% transmittance.
D. Take out optical alignment test piece and replace the unlabeled control standard with the
0% T standard. Record the result, which is the 0% T reading.
E. Replace the 0% T standard with the SRE 400 nm standard whose wavelength corresponds
to the setting in step b (400 nm). Observe the 0% T reading.
F. Subtract the reading in step d from the reading in step e. Record the result, which is the
stray radiant energy at the test wavelength. This value should be within 0-0.6% T for the
Spec 20/20D (table 1 on page 7) which would conform to the summed tolerances.
2. Photometric Accuracy/Linearity Test:
A. Insert the optical alignment test piece/control standard in the instrument.
B. Set the wavelength to 590 nm. Adjust the instruments to read exactly 100% T.
C. Remove the standard. The 100% T reading should remain essentially unchanged.
D. Replace the optical alignment test piece/control standard with the photometric performance
standard, "white" labeled 47.7% T 590 (near 50% T). Record the instrument reading. The
reading should conform to the summed tolerances in table 1 or + 3.0% T under the
photometric accuracy column.
E. Replace the "50% T" standard with the "white" labeled standard 7.6% T 590 (near 10% T).
Record the instrument reading. The reading should conform to the summed tolerances in
table 1 or + 3.0% T.
F. Record all the results on the SPECTRONIC STANDARDS TEST LOG sheet on the
cupboard.
24
PDF created with FinePrint pdfFactory trial version http://www.fineprint.com
Operation of HACH Conductivity/TDS Meter Model 44600
Electrolytic conductivity is the ability of a solution to pass an electric current and in the
reciprocal of the solution resistivity. Current is carried by inorganic dissolved solids, such as
chloride, nitrate, sulfate and phosphate anions, in the solution, as well as such cations as sodium,
calcium, magnesium, iron and aluminum.
Total Dissolved Solids: TDS measurement expresses the concentration in grams/L and
milligrams/L of the various ions. The conductivity probe of the Model 44600 is not ion-selective
but measures the sum total of the concentrate of the inorganic components of the solution.
Measurement of Conductivity:
1. Press the Power I key and CND key. Verify that the LOBAT indication does not appear.
2. Select the appropriate range. If the range is unknown, begin with the highest ranges, i.e. 20
which measures 0-20 mS/cm conductivity or g/L total dissolved solids; 2 key which
measures 0-2 m S/cm or the 200 key which measures 0-200 m S/cm or mg/L TDS.
Overrange causes a 1 display followed by blank digits.
3. Insert the probe into the sample solution. Immerse the tip to or beyond the vent holes and
agitate the probe vertically to be sure air bubbles are not entrapped. Allow time for the
reading to stabilize.
4. Rinse the probe thoroughly with distilled water after each measurement.
Measurement of Total Dissolved Solids:
1.
2.
3.
4.
Press the Power I key and the TDS key.
Select the appropriate range 20, 2 or 200 in this order.
Insert probe into sample solution as in conductivity measurement and allow time to stabilize.
Rinse probe with distilled water between sample.
Measurement of Temperature:
1. Press Power I key and oC key.
2. Insert probe as before making sure no air bubbles are trapped and let probe stabilize for the
temperature reading.
3. Rinse with distilled water.
Maintenance and Calibration:
On page 14 of the Model 44600 Conductivity/TDS Meter Manual is the procedure for calibrating
the conductivity meter. This procedure should be done at least twice a year, or more, and
recorded in the CONDUCTIVITY METER CALIBRATIONS and CLEANING LOG on the
cupboard.
25
PDF created with FinePrint pdfFactory trial version http://www.fineprint.com
Calibration will be needed periodically due to aging of the probe, a dirty probe, or when a new
probe is installed. Calibration with a standard solution of known conductivity value - HACH
Sodium Chloride Standard Solution 85.47 + .85 mg/L NaCl or 180 + 10 mS/cm is kept in the
chemical cupboard for this procedure.
Calibration:
1. Be sure the probe is clean.
2. The sodium chloride standard is easily contaminated. Always use a clean, dry container for
the standard solution.
3. Immerse the probe to or beyond the vent holes in a beaker containing the sodium chloride
standard solution. Agitate vertically to remove entrapped air.
4. Press the Power I key and CND key. Verify that the LO BAT indication does not appear.
5. Press the 200 mS/cm key.
6. Check the reading on the display. It should read 180 mS/cm. If adjustment is needed, use a
small screwdriver to adjust the CAL control next to the display. Bring the adjustment up to
the standard value.
Other operation notes and conversion factors can be referred to in the Hach Company Model
44600 Conductivity/TDS Manual.
Operation of the Spectrophotometer DR/4000
The DR/4000 Spectrophotometer is a direct reading instrument which is programmed with
calibrations for many tests. Available in two models, the Model DR/400V is used for visible
wavelength, and the Model DR/4000U is used for testing in both ultraviolet and visible
wavelengths. User-entered calibrations can also be stored in the instrument.
The DR/400 Spectrophotometer provides digital readouts in direct concentration units,
absorbance, or percent transmittance. When a user-generated or Hach programmed method is
selected, the on-screen menus and prompts direct the user through the test. This menu system
also can be used to generate reports, statistical evaluations of generated calibration curves, and to
report instrument diagnostic checks.
The DR/4000 monochromator is capable of producing wavelength from 190 to 1100 nm. A
halogen gas-filled tungsten lamp produces light in the visible spectrum (320 to 1100 nm), and a
deuterium lamp available in the Model DR/4000U produces light in the ultraviolet spectrum (190
to 380 nm). The instrument is fully assembled when shipped from the factory. Attach the
supplied power cable to the rear of the instrument before use.
The Model DR/4000U (UV/VIS) Spectrophotometer comes equipped with two modules. The
Single-cell Module includes a 1-cm cell adapter, a 16-mm test tube adapter (also fits COD and
Test ‘N Tube vials), and AccuVac adapter (also fits 1-inch round cells), and a 1-inch square
26
PDF created with FinePrint pdfFactory trial version http://www.fineprint.com
adapter. The Carousel Module includes two interchangeable carousels: 1 4-place, 1-inch-cell
carousel (for 1-inch square cuvettes), and a 6-place 1-cm-cell carousel (for 1-cm cuvettes). The
Carousel Module is an optional accessory for the Model DR/4000V (VIS only)
Spectrophotometer.
Setting up a test run:
1. Turn the DR/4000 Spectrophotometer on. Power switch is located on the lower left side of
the rear of the machine.
2. Let the machine go through its warm-up cycle - about 5 minutes. After 4 beeps, the machine
is ready to run up tests.
3. To use a Standard Program, select the HACH PROGRAM soft key and punch in the
appropriate number code and entry key.
4. In the main menu, select the USER PROGRAM soft key for programs that have been
customized to the usher’s specification. Punch in that number and entry key.
5. For using the 4 cell method, and user programs, the following customized menus have been
programmed for Nitrogen-ammonia: Program #1; Nitrite-nitrogen: Program #3; Nitratenitrogen, low range: Program #4; Fluorides, SPADNS method: Program #2; and Chlorines,
Total-DPD method, Program #5.
27
PDF created with FinePrint pdfFactory trial version http://www.fineprint.com
28
PDF created with FinePrint pdfFactory trial version http://www.fineprint.com
WATER ANALYSIS PROCEDURES
A. PHOSPHORUS ANALYSIS METHOD: 4500P B #5
Reference used to phosphorus analysis is the "Standard Methods" 1989, 17th Ed., pages 4-166178. The two tests employed here are unfiltered samples for determination of dissolved and
suspended forms of Orthophosphates (total) and Total phosphates which includes organic matter,
dissolved and suspended phosphorus. This method requires a digestion process.
1. Total Orthophosphates
Orthophosphates include dissolved and suspended forms available for plant growth. Our
samples are not filtered through a .45 micron membrane filter so include both forms. Filtered
samples would only include the dissolved phosphates in the water.
a. Set up for the test:
1. Place the infra-red detector phototube and red filter in the Spec 20D, turn power on and
set wavelength to 880 nm.
2. Use the 1 inch diameter sample tube adapter.
3. Be sure that the 1 inch spectrophotometer tubes have been washed out with 10% HCl
and rinsed several times with distilled water before using to prevent any contamination.
4. Invert to drain in plastic test tube rack.
5. Zero the transmittance on the Spec 20D.
6. Add 10 mL of distilled water to one 1 inch spec tube, clean with Kimwipes and place in
sample compartment.
7. Punch absorbance mode and set Ab. to read .000 Ab with the right dial. Let machine
warm up for at least 15 minutes to stabilize.
b. Preparation of Chemicals: 4500-P E. Ascorbic Acid Method; "Standard Methods for the
Examination of Water and Wastewater" page 4-177 & 178. Reagents:
1. 5N H2SO4: 70 mL conc. H2SO4, 500 mL distilled water.
2. Potassium antimonyl tartrate solution: 1.3715 g K(SbO)C4H4O6 . ½ H20, 400 mL
distilled in 500 mL volumetric flask, dilute to volume, store in glass-stoppered bottle.
3. Ammonium molybdate solution: 20 g (NH4)6 Mo7O24 . 4H2O, 500 mL distilled water,
store in glass-stoppered bottle.
4. Ascorbic acid .01 M solution: 1.76 g Ascorbic acid, 100 mL distilled water, store in
refrigerator at 4o C, solution stable for 1 week, remake each week.
5. Combined reagent: The four preceding reagents should be mixed just before using in the
following amounts:
29
PDF created with FinePrint pdfFactory trial version http://www.fineprint.com
To make 100 mL of combined reagent, mix
50 mL 5N H2SO4 solution
5 mL Potassium antimonyl tartrate solution
15 mL Ammonium molybdate solution
30 mL Ascorbic acid solution
Mix after addition of each reagent, let solution reach room temperature and mix again.
Mixed reagent will be stable for about 4 hours.
For most sampling runs of 9 to 13 samples, the total volume of mixed reagent can be
halved or 25 mL, 2.5 mL, 7.5 mL and 15 mL, respectively, can be made up to save on
the individual chemicals.
c. Preparation of samples:
1. Using the 1 inch test tubes, set up the number of tubes needed for the number of
samples and two extra. Into the one extra tube, measure out exactly 10 mL of distilled
water using the 10 mL volumetric pipette with the red 25 mL pipette pump or the
Eppendorf pipette set for 10 mL.
2. Measure 10 mL of each sample into respectively lined up test tubes. Be sure to rinse the
pipette each time with the next sample to prevent contamination between samples.
3. Add 1.6 mL of mixed reagent to each of the samples and set the timer for 10 minutes
development.
*Note: after the development time has elapsed and the sample turns a deep blue or
reads over .800 Ab on the Spec 20D, dilute the sample using one of the following
methods: 2 mL sample, 8 mL distilled water (total volume of 10 mL) and multiply by a
factor of 5, or add 5 mL of sample with 5 mL DH2O (total volume of 10 mL) with the
Eppendorf pipette and multiply by a factor of 2. 1.6 mL of mixed reagent is to be
added to either method. Absorbance range for this test is best between .200 to about
.800 Ab.
4. When the distilled water blank has developed, insert it into the compartment and zero
the Absorbance knob to read .000 Ab. The color of the water will not affect the
absorbance at the infra-red 880 nm setting, so no unreacted sample has to be used.
5. After the 10 minute development period, insert each sample and record the absorbance
reading. Convert the absorbance for each sample into mg P/L based on the calibration
curve.
2. Total Phosphates (unfiltered)
Total phosphates in a water sample include all organic matter, dissolved and suspended
phosphorus. This test involves a digestion process prior to the Method E-Ascorbic Acid
colorimeter test. A calibration curve must be constructed for this test also as it will be
different from the Orthophosphate curve (procedure described later).
30
PDF created with FinePrint pdfFactory trial version http://www.fineprint.com
a. Preparation of chemicals
1. Sulfuric Acid solution: add 300 mL conc. H2SO4 to about 600 mL distilled water and
dilute to 1 liter in volumetric flask. Mark for "Total Phosphate Test."
2. Ammonium Persulfate (NH4)2 S2O8, use .4 g/sample
3. 1 N Sodium hydroxide, NaOH: 40 g NaOH pellets in 1 liter volumetric flask or 8 g/200
mL water
4. Aqueous Phenolphthalein solution: dissolve 5 g phenolphthalein disodium salt in
distilled water and dilute to 1 L.
b. Set up for test: 4500 P - Method 5, Persulfate digestion Method, p 4-172-73 "Standard
Methods"
1. Preheat the autoclave.
2. Use the same 880 nm setting on the Spec 20D and adjust the absorbance to .000 Ab with
a 10 mL distilled water + 1.6 mL mixed reagent blank.
3. Mark and line up acid-washed 150 mL fleakers in front of each sample.
4. Measure out 50 mL of sample with a graduated cylinder from the sample bottle and pour
into the fleaker for each sample to be tested. Be sure to rinse graduated cylinder
between sample aliquots.
5. To each sample, add 1 drop (.05 mL) aqueous phenolphthalein, swirl to mix, if sample
does not change color continue on; if the sample turns pink, add dropwise H2SO4 until
color just disappears.
6. To each sample add 1 mL phosphate test (11 N) H2SO4.
7. Using a porcelain spoon add 0.4 g of ammonium persulfate to each sample ( a level
spoonful is .4 g).
8. Mix samples by swirling.
9. Carefully set each sample fleaker into the autoclave and cover all the fleakers with paper
towel to prevent dripping from top. Close and lock top and run pressure up to 15 pounds
and hold for 30 minutes.
10. After cooking for 30 minutes, shut off heat and open steam stopcock to slowly let out
steam until pressure is zero. Open top, let cool.
11. Take out fleakers when cool enough to handle. Again add 1 drop of aqueous
phenolphthalein.
12. Add enough 1 N NaOH solution to neutralize the digested samples to a slight pink
color.
13. Make up to 100 mL with distilled water to the mark on the beaker, swirl to mix.
14. Now, the samples are ready to test for phosphates by Method E - Ascorbic Acid used in
the orthophosphates test - same procedure.
15. Read absorbance for each sample. If absorbance readings go above .700, it may be
necessary to dilute those samples to 5 mL sample water, 5 mL DH2O and multiply by a
factor of 2.
31
PDF created with FinePrint pdfFactory trial version http://www.fineprint.com
3. Calculating the Calibration Curve
a. To determine the mg/L of TOTAL DISSOLVED ORTHOPHOSPHATES, a calibration
curve must be made using known phosphate concentrations.
Beginning with the 1000 ppm P standard, substandard a 50 ppm Standard Solution by
pipetting 25 mL of 1000 ppm standard and diluting to 500 mL volume in 500 mL
volumetric flask. Use the 50 ppm standard to make up the following concentrations of
phosphates for the calibration curve:
ppm
value
0.00
0.10
0.25
0.50
0.75
1.00
1.25
1.50
Formula used:
100 mL 1 ppm = X mL
volume
sol'n
needed
mL 50 ppm
standard
0.0
0.2 mL
0.5 mL
1.0 mL
1.5 mL
2.0 mL
2.5 mL
3.0 mL
final
volume
100 mL
100 mL
100 mL
100 mL
100 mL
100 mL
100 mL
100 mL
Ab
Spect
.000
.160
.428
.700
1.220
1.540
1.600
1.700
50 ppm
standard sol'n
= # of mL 50 ppm standard sol'n
Brought up to 100 mL with DH2O in volumetric flask
Set up 8 1-inch test tubes and pour out about 15-20 mL of each ppm concentration into 8
acid-washed fleakers to prevent any cross contamination. Pipette 10 mL of each standard
into respective tubes, add 1.6 mL of mixed reagent, set the timer for 10 minutes. Zero the
Spec 20D with 0 ppm on absorbance and begin recording the absorbance reading for each
standard.
Construct a graph with mg P/L along the bottom of graph and absorbance readings along
the left side. (see page 11) Label and date calibration curve graph. Use the curve for all
the Orthophosphate tests for the samples. Periodically recheck the calibration curve with
the known standards.
b. To determine the mg/L of TOTAL PHOSPHATES, a curve (straight line) must be
calibrated using known standard phosphate solutions and absorbance readings on the Spec
20D.
32
PDF created with FinePrint pdfFactory trial version http://www.fineprint.com
Setup:
1. Use the same preparation of standard solutions used in the orthophosphate calibration
curve such as: 0, .1, .25, .5, .75, 1.0, 1.25 ppm, measured or calculated out by formula as
before.
2. Mark the 150 mL fleakers for each standard and measure out 50 mL of standard for each
fleaker.
3. Prepare each standard as in previous set up to total phosphates: 1 drop phenophthlein; 1
mL 11N H2SO4 and .4 g ammonium persulfate, heat at 15 pounds for 30 minutes in the
autoclave, cool down, add 1 drop phenolphthlein, neutralize with 1 N NaOH until
slightly pink, and run up through the ascorbic acid method as with orthophosphates.
4. Prepare the total phosphate mg/L curve similar to orthophosphates by preparing 50 mL
samples of known concentrations such as .1, .25, .5, .75. and 1.0 ppm in the 150 mL
fleakers.
A. Add same chemicals before autoclaving (1 drop phenolphthlein, 1 mL 11N H2SO4 and
.4 g ammonium persulfate).
B. After digesting for 30 minutes at 15 pounds pressure, cool standards, add 1
phenolphthlein, neutralize with 1 N NaOH or until slightly pink and bring up to 100 mL
with distilled water.
C. Dispense 10 mL of each standard into respective cuvettes, add 1.6 mL ascorbic acid, let
develop for 10 minutes.
D. Read the absorbance at 880 nm using a distilled water blank, 10 mL, 1.6 mL ascorbic
acid mixture, set at .000 absorbance.
E. Read absorbance for the standard and plot the curve. The slope of the line should be less
than the orthophosphates.
33
PDF created with FinePrint pdfFactory trial version http://www.fineprint.com
34
PDF created with FinePrint pdfFactory trial version http://www.fineprint.com
4. Nitrogen-Ammonia Test, Nessler Method 0 to 2.500 mg/L NH3-N
A. Select the User Program Soft Key (HACH Program 2400).
B. Enter 1 to run the program, then press “enter”. The program will come up on the screen
and the wavelength is 425 nm selected automatically.
C. Fill a 100 mL mixing graduated cylinder to the 25 mL mark with the sample.
D. Fill a second mixing cylinder to the 25 mL mark with deionized water.
E. Add 3 drops each of Mineral Stabilizer (#23766-26) and Polyvinyl Alcohol Dispersing
Agent (#23765-26) to both cylinders. Mix both cylinders by shaking each gently.
F. Pipette 1.0 mL of Nessler Reagent (#21194-29) to each cylinder.
G. Put in a glass stopper into each cylinder, invert the cylinders several times to mix.
H. Press the soft key under start timer to begin a 1 minute reaction period.
I. Pour each solution into matched sample cells to the 25 mL mark.
J. Insert the first “blank” in the carousel module, in the holder with the arrow pointing to it
(lower right corner of carousel), milliliter markings should always point to the center of
the carousel.
K. Place the test sample clockwise (left side) of the blank, mL markings to the center.
L. Place the next blank in the third holder (should be across from the first blank). Finally,
insert the test sample to be read in the 4th cell holder.
M. Close the carousel top and press the start soft key to begin the testing.
N. The machine will zero the blanks automatically for cell holders 1 and 3 and read the
mg/L NH3-N for cells 2 and 4.
O. Remove the 4 sample cells and insert a 2nd run of 4 samples - blank cells following the
same procedure.
5.
Nitrite-Nitrogen, Low Range, Diazotization Method, 0 to .3000 mg/L NO2-N
A. Select user program soft key. Enter 3 for this program and punch in “enter.” (HACH
Program is 2610 Nitrite, LR).
B. Fill 2 matched sample cells with 10 mL of the sample to be tested.
C. Add the contents of one NitriVer 3 Nitrite Reagent Powder Pillows (#21071-69) to the
2nd sample cell. The 1st cell is the blank. Stopper, shake to dissolve (15-20 seconds).
D. Press the start timer soft key. A 20 minute reaction period will begin.
E. After the 20 minute reaction period, the machine will beep. Place the first blank into the
carousel module in the hold with the arrow pointing to it. Insert the test sample to be
read on the blank’s left - markings pointing to the center.
F. Insert the 2nd set of samples with the blank in the 3rd cell holder and the test sample in the
4th sample cell holder.
G. Press the start soft key. The machine will automatically zero sample cells 1 and 3 and
read mg/L NO2-N on the 2nd and 4th samples.
35
PDF created with FinePrint pdfFactory trial version http://www.fineprint.com
6. Nitrate - Nitrogen, Low Range, Cadmium Reduction Method, 0 to 0.50 mg/L NO3-N
A. Select the user program soft key. Enter #4 as the program to be used (HACH Program
2515 N, Nitrate LR).
B. Fill a 100 mL mixing graduated cylinder with 15 mL of sample to be tested.
C. Add the contents of one NitraVer 6 Nitrate Reagent Powder Pillow (#21072-49) to the
cylinder and stopper the cylinder with a glass stopper.
D. Press the start timer soft key for a 3 minute shaking period.
E. After 4 start beeps, press the start timer soft key for the 2 minute reaction period.
F. After the beeps, pour 10mL of the reacted sample into a matched cell.
G. Add the contents of one NitriVer 3 Nitrite Reagent Powder Pillow (#21071-69) to the
sample, stopper and shake.
H. Press the soft key under start timer for a 30 second shake period.
I. After that, press the start timer soft key for a 15 minute reaction period.
J. While waiting, fill a 2nd cell with 10 mL of the original sample for the blank.
K. When the 15 minutes reaction period is complete, place the cells into the module and
press the start soft key to begin the test.
7. Fluorides; SPADNS Method, 0 to 2.00 mg/L
A. Select the user program soft key. Press #2 and “enter” (HACH Program 1900).
B. Pipet 10 mL of the sample into one of the matched cells and 10 mL of deionized water
into a 2nd cell.
C. Pipet 2.0 mL of SPADNS Reagent (#444-49) into each cell. Swirl to mix.
D. Press the soft key under start timer for a 1 minute reaction period.
E. After the beeper sounds, place the cells into the carousel module, DI water sample cell
first and sample cell second to the left of the blank.
F. Press the soft key under start to run the test.
8. Chlorine, Total, DPD Method, 0 to 2.00 mg/L
A. Select the user program soft key. Enter #5 as the program to run and press “enter”
(HACH Program 1450).
B. Fill 2 matched cells with 10mL of the sample to be used.
C. Add the contents of one DPD Total Chlorine Powder Pillow (#21056-69) to the 2nd
sample call. Shaker for 15-20 seconds.
D. Press the start timer soft key to begin a 3 minute reaction period.
E. After the beeper sounds, place the cells into the carousel module, blank first, test sample
second to the left and press the start soft key to begin the test.
Any other tests that may be run on the DR4000 Spectrophotometer can be found in the HACH
DR4000 Handbook with the proper chemical pillow reagents.
36
PDF created with FinePrint pdfFactory trial version http://www.fineprint.com
9. Total Dissolved Solids, Evaporation Method
This is a slightly modified method for determining Total Dissolved Solids at 180o C, Method
2540C, Section 2-74 in the “Standard Method for the Examination of Water and Wastewater,”
1989, 17th Ed. Handbook. Since the lab does not have a steam bath apparatus and TDS
determined by this method therefore, is for “in-house” results only. TDS determined by this
method is used for samples taken from seven sites in Devils Lake (split samples from the ND
State Health Lab - collected in February, May, July and October), Creel Bay, Sheyenne River,
East Stump Lake, Edmore Coulee, and other selected sites.
Procedure for TDS - Evaporation Method:
A. Collect at least 1 liter of sample water in a clean container or plastic bottle.
B. Set up the filtration apparatus-vacuum pump and place a pre-washed and dried Whatman .47
um Glass Microfibre Filter into the filter set-up.
C. Mix the water sample thoroughly and measure out exactly 300 mL of water sample into a
graduated cylinder.
D. Slowly pour the sample into the filtering apparatus under vacuum and collect the filtrate in
the collection flask.
E. Rinse the graduated cylinder and filtering funnel with DI water several times.
F. Remove the collection flask-filtered water sample and pour the contents into a dried, preweighed 300 mL fleaker.
G. Set the Isotemp oven at 90-95o C and place the fleaker-filtered sample into the oven. It will
take 2-3 days to evaporate the water down to dryness.
H. After the fleaker and its contents have dried down, set the oven at 180o C for several hours
to completely dry the salts.
I. Remove the fleaker and salts, place in a dessicator for 20-30 minutes for cool down.
J. Weigh the fleaker plus salts on an analytical balance until the mass is stable (may have to
repeat steps H and I if mass does not stabilize or a constant mass is not achieved.)
K. Calculate the TDS in milligrams/L by using the formula:
mg TDS/L = (A - B) X 1000
sample volume, mL
Where A = weight of dried residue
B = weight of dish, mg
L. Repeat procedure for as many samples as collected.
10. Total Suspended Solids (TSS)
Method 2540 D Solids (Standard Methods, 17th Ed.) Total Suspended Solids dried at 103-105oC
General discussion: The term "solids" includes both suspended and dissolved solids. Solids refer
to any matter suspended or dissolved in water or effluent wastewater. The analysis of solids for
the Devils Lake Lemna System is for suspended solids only.
37
PDF created with FinePrint pdfFactory trial version http://www.fineprint.com
Suspended solids include any materials, living or inorganic, such as soil or mud particles stirred
up by the wind and wave action, planktonic algae, protozoa, daphnia or other swimming
crustraceans, and other nonhomogeneous materials in the water samples.
Materials:
1. Filtration apparatus
A. 1000 L suction flask
B. 47 mm funnel, clamp, support screen and stopper
2. Whatman 934-AH or GF/C glass microfibre filters, 4.7 cm
3. Vacuum suction pump with hose
4. Aluminum weighing dishes, 55 mm diameter
5. Forceps
Procedure:
1. Preparation of glass microfibre filters
A. EPA method 160.2 - prewash each filter with three 20-25 mL volumes of distilled H2O
while under suction through the filtration apparatus.
B. Place filter in marked aluminum tray.
C. Dry in the oven at 103-105o C for at least 6 hours minimum or overnight.
2. Sample preparation
A. Run at least 2 replicates for each sample; 100 mL for heavy suspensions and/or 500 mL for
clear samples.
B. Dry overnight (min. 6 hours) in an oven at 103-105oC.
C. Record tray numbers and let cool for 5-10 minutes in a desiccator.
D. Weigh each tray and filter to ten-thousandths of a gram.
E. Place filter on filtration apparatus and moisten with 20-25 mL of DH2O.
F. Measure out 100 mL (or whatever amount, be sure to record) of the water sample in a clean
graduated cylinder.
G. Pour measured sample into filtration funnel. Turn on vacuum pump to pull water through
filter.
H. Rinse graduated cylinder and funnel with DH2O, about 25-30 mL while suction pump is
on.
I. Remove filter to its numbered weighing tray and place in oven (103-105oC) overnight (min.
of 6 hours).
J. Repeat procedure for replicate of sample or new sample.
K. After drying for at least 6 hours, remove numbered tray and filter from oven, let cool for 510 minutes in desiccator.
L. Re-weigh tray, filter and dried sample accurately. Record. Repeat for the replicate and
other samples.
38
PDF created with FinePrint pdfFactory trial version http://www.fineprint.com
Calculation of TSS:
1. X = (tray + sample + filter weight) - (tray + filter weight)
2. TSS = (X) X 1,000,000 X dilution used / mL of sample
3. Average the TSS readings for each replicate of the sample. Sample results are reported in
mg/L.
Procedure reference from Section 2-71, 2540 Solids, Method D, TSS dried at 103-105oC
(Standard Methods, Ed. 17) and Modified Methods from ND State Health Laboratories.
Replicates, Spikes and Recovery
1. Replicates are repeated sample test operations occurring within an analytical procedure such
as for Orthophosphate and Total Phosphate tests. Two or more analyses for the same
constituent in an extract of a single sample constitute replica extract analyses. For every 10
samples taken for analysis of a particular parameter (such as Orthophosphates), one or two
replicates should be made of any selected sample. Replicates are usually done with LPN,
Channel 7 or Channel 8, 001, Storm Channel or Creel Bay. The absorbance read on the Spec
20D should be the same for the sample and its replicate to check on the procedure for
dispensing the sample and test reagent. Results of both replicates are recorded in the Log
Book as sample 1 and replicate sample labeled “duplicate.”
2. Spikes are prepared in an operation for a particular analyical procedure to check the overall
accuracy of the method being used. In preparing a “Spiked Sample”, a “normal” sample is
used plus a replicate sample with a known ppm Phosphate Standard added - called the
“Spiked sample.”
A “Standard Phosphate Solution is used to “Spike” a water sample and then “developed” to
recover to spiked parts per million (mg/L) phosphates added compared to an unspiked water
sample.
The Standard Phosphate Solution is prepared as follows:
1. To a clean, acid washed 500 mL volumetric flask, add 25 mL of 1000 mg/L
Phosphorus Standard (Cat #PLP9-2Y, SPEX CertiPrep).
2. Bring up to 500 mL volume with DI water and mix.
3. This solution is a 50 mg/L Phosphate mixture.
To prepare a “Spiked Sample”, follow the procedure:
1. Measure out 49 mL of the water sample to be tested in a Fleaker flask.
2. With a 1 mL volumetric pipette, dispense exactly 1 mL of the Standard Phosphate
Solution in the sample (total volume is 50 mL).
3. Swirl to mix and dispense the sample plus the spike for testing.
4. This solution should test for 1 mg/L plus the mg/L of the water sample.
39
PDF created with FinePrint pdfFactory trial version http://www.fineprint.com
Calculation of Recovered mg/L Phosphates:
49 mL mg/L +
(1 mL)
(50 mg/LP)
sample sample
=
50 mL
volume
(xmg/L)
To quantify the accuracy of the Spike Recovery, use the following equation:
Spiked sample Sample
= difference / 1.000 mg/L X
mg/L
mg/L
(Spike Standard)
Example: Channel 6 sample and Channel 6 spiked sample
Spiked sample
Ch 6 sample
1.756 .760
= .996 / 1.000 mg/L
mg/LP
mg/LP
(Standard)
100%
X 100% = 99.6%
Recovery
3. Standard Deviations of Spike Recovery
Standard deviation (S) is a measure of the average departure of individual samples from the
mean for all samples. Standard deviation is calculated using the formula:
S=
sum of the square of the deviations from the mean
number of observations - 1
or
2
S - Σi (X1-u)
n-1
Where Σi = means to sum over the members
S = standard deviation from the mean
X1 = members of the sets
u = mean
n = number of members in the set of data
To determine the Standard Deviation from a set of data, select any 20 samples from the
“Spike Recovery” samples. Examples performed and used daily are:
Set 1: Orthophosphate Spike (49 mL DIH2O + 1 mL Standard P)
Set 2: Sample OP spike (49 mL sample + mL Standard P)
Set 3: Sample Total Phosphate Spike (49 mL sample + 1 mL Standard P, digested)
Sample data was taken from the month of June 1998 (June 1st to July 17th) and June 1999
(June 1 to 22nd).
Calculations and Results:
A. To determine the mean (u) or Average Deviation
Select 20 samples of Spiked Percentages over a month’s period, sum the total and divide
by 20:
mean (u) = sum of results
number of samples
40
PDF created with FinePrint pdfFactory trial version http://www.fineprint.com
B. Deviation and Relative Deviation
1. Deviation is the quantity by which each individual differs from the arithmetic mean
of a same. Sum the differences between each sample and the mean, then divide by 20
(sample set).
2. Relative Deviation is determined by dividing the Deviation by the mean and
multiplying by 100%.
C. Standard Deviation
Use the formula S= Σi (X1 - u)2
n-1
For each sample percentage, subtract the average deviation (mean), square the difference and
add all variations together. Divide the total by n-1 or 19 in this case and take the square root
of the total. This determines the Standard Deviation of that set of 20 samples. From this the
range (minimum and maximum percentages) is determined. Almost all spike percentages
will fall between the percentage range. If a spike does fall outside the range, it can be
suspect as to a variation in the spike standard, not measuring accurately, test sample not
accurately measured or other interferences. Another replicate is made or a new spiked
sample is run up and tested to comply with the range variation.
For space here in the manual, only one set of samples has been written up, but several sets
and standard deviations are done during the testing period each summer to check for
precision and accuracy of test results.
Results:
Set A: 20 samples from June 19th to July 17th, 1998
Set 1: Orthophosphate Spikes (49 mL DIH2O + 1 mL P Standard)
Mean: 98.2%
Relative Deviation: 1.01 or 1.0%
Standard Deviation: 1.47
Orthophosphate Spikes: 98.2 + 1.47: Range = 99.67%
96.73%
Set 2: Sample Orthophosphate Spikes (49 mL sample + 1 mL P Standard)
Mean: 96.68%
Relative Deviation: 1.56 or 1.6%
Standard Deviation: 2.20
Sample of spike: 96.68 + 2.20: Range = 98.88%
94.48%
Set 3: Total Phosphates Sample Spikes (49 mL sample + 1 mL P Standard,
digested)
Mean: 95.45%
Relative Deviation: 1,615 or 1.7%
Standard Deviation: 1.91
Sample Total Phosphate Spike: 95.45 + 1.91: Range = 97.36%
93.54%
41
PDF created with FinePrint pdfFactory trial version http://www.fineprint.com
Set B: 20 samples from June 1st to June 22nd, 1999
Set 1: Orthophosphate Spikes (49 mL DIH20 + 1 mL P Standard)
Mean: 98.5%
Relative Deviation: 1.19 or 1.21%
Standard Deviation: 1.46
OP spikes: 98.5 + 1.46: Range = 99.96%
97.04%
Set 2: Sample Orthophosphates Spikes (49 mL sample + 1 mL P Standard)
Mean 97.66%
Relative Deviation: 1.27 or 1.30%
Standard Deviation: 1.55
Sample OP spikes: 97.66 + 1.55: Range = 99.21%
96.19%
Set 3: Sample Total Phosphate Spikes (49 mL sample + 1 mL P Standard,
digested)
Mean: 93.93
Relative Deviation: 1.297 or 1.38%
Standard Deviation: 1.65
Sample TP spikes: 93.93 + 1.65: Range = 95.58%
92.28%
42
PDF created with FinePrint pdfFactory trial version http://www.fineprint.com
43
PDF created with FinePrint pdfFactory trial version http://www.fineprint.com
44
PDF created with FinePrint pdfFactory trial version http://www.fineprint.com
Cleaning Glassware
All glassware used in testing wastewater samples must be as clean as possible so that no
contamination occurs between sample tests or chemicals used in certain tests do not interfere or
cross-contaminate the results of other tests. Glassware used for testing wastewater samples
include: 150 mL fleakers used to prepare the Total Phosphate samples, the large 2.54 cm (1 inch)
cuvettes used in the Spec 20D, all pipettes, testing cuvettes used in the DR4000 and the
graduated cylinders used for measuring samples and reagent chemicals.
When used glassware is emptied into the proper containers or sink, the following procedure is
followed:
1. Rinse all glassware twice with DI water from the faucet.
2. All fleakers, cuvettes and pipettes are rinsed with a 10-15% HCl solution and again rinsed
with DI water twice.
3. All are placed in the dish drainer to drip dry, then put away in their proper place in the tube
rack and/or cupboard.
Once a week, all glassware used for testing is washed with Liqui-Nox (Phosphate-free), acid
washed and rinsed twice with DI water. It is essential that all glassware is clean to prevent any
stray contamination from the data readings.
45
PDF created with FinePrint pdfFactory trial version http://www.fineprint.com
Maintenance of Durastill Water Distiller
A schedule for the maintenance of the DURASTILL water distiller is set up for cleaning each
week (Friday) after all tests have been completed. This schedule is required to keep scale
deposits from forming inside the steam chamber. The procedure is as follows:
1. Shut off the “automatic fill switch” and the “fan switch” on the front of the Durastill.
2. Open the outlet petcock half way to drain the steam chest.
3. Open the top of the steam chest by loosening the two wingnuts and center plastic screw
slowly to release the steam. Remove the top.
4. Shut off the outlet so that about 1 inch (2.54 cm) of water remains in the steam chest.
5. Mix up a 10-15% HCl acid solution in a squirt bottle (500 mL) and squirt about half the
bottle into the remaining water. It should fizz, dissolving the scale.
6. After 5 to 10 minutes, add a pail of tap water and drain out completely.
7. Squirt the rest of the HCl solution and add about a half pail of tap water until the fizzing
stops.
8. Drain and refill the steam chest with 2 pails of water and drain completely.
9. Replace the top of the steam chest and tighten the center screw and two wingnuts.
10. Turn on the “automatic fill switch” and “fan switch” to refill.
11. Record the date, procedure done, and initial on the Maintenance Chart.
This procedure should be done very other week. On alternative weeks, just drain and refill the
steam chest. Every year or two, new water filters should be replaced in the incoming water line
and under the steam chest.
46
PDF created with FinePrint pdfFactory trial version http://www.fineprint.com
LEMNA SYSTEM
CITY OF DEVILS LAKE
DEVILS LAKE, NORTH DAKOTA
47
PDF created with FinePrint pdfFactory trial version http://www.fineprint.com