1
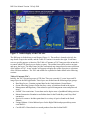
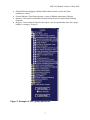
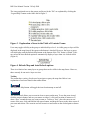
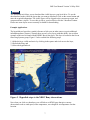
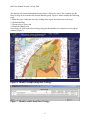
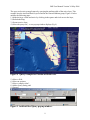
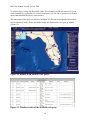
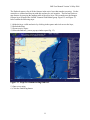
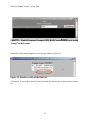
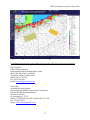
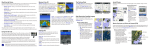
SOUTH ATLANTIC FISHERY MANAGEMENT COUNCIL 4055 FABER PLACE DRIVE, SUITE 201 NORTH CHARLESTON, SOUTH CAROLINA 29405 TEL 843/571-4366 FAX 843/769-4520 Toll Free 866/SAFMC-10 Email: [email protected] Duane Harris, Chairman David M. Cupka, Vice Chairman Website: www.safmc.net Robert K. Mahood, Executive Director Gregg T. Waugh, Deputy Executive Director South Atlantic Habitat and Ecosystem Internet Map Server User Manual Version 3.0 PRELIMINARY DRAFT - July 2009 Project Background The South Atlantic Habitat and Ecosystem Internet Map Server (IMS) offers a unique approach for accessing geospatial datasets across the South Atlantic region. This Web-based application brings the power of Geographic Information System (GIS) technology to ordinary Internet browsers. The Coral and Benthic Habitats IMS application allows users to navigate, overlay, query or print maps in a dynamic, interactive environment. The integration of disparate GIS data into one source provides a one-stop shop for managers, scientists and the public to explore the marine resources of the South Atlantic region. This system provides the Council and regional users a tool to support better conservation of habitat and the evolution to ecosystem management in the region. IMS Viewing Requirements The Coral and Benthic Habitats IMS is a customized application developed with ESRI’s ArcIMS software. The site does not require special plug-ins but works best with Internet Explorer versions 6 and higher. The IMS application is data intensive and performance will be primarily based on the user’s internet connection speed. The site performs best with high-speed internet connections, such as DSL or T1. However, users with slower connection speeds will be able to access the site but should be patient. Users should also disable any pop-up blockers when viewing the site. The URL for the site is <http://ocean.floridamarine.org/efh_coral/ims>. IMS Layout The graphic below displays the user’s initial view when entering the IMS application. The following GIS data layers are displayed by default: 3D bathymetric image, state water delineations, National Data Buoys, and the Exclusive Economic Zone boundary. 1 IMS User Manual Version 3.0 July 2009 Figure 1. Initial display of the IMS site. The IMS page is divided into several frames (Figure 1.). The toolbar is located to the left, the map frame occupies the middle, and the Table of Contents is located to the right. Each frame serves a specific purpose or function. The Table of Contents or TOC frame provides an interface to control which GIS data layers to display or query. The toolbar frame offers tools to navigate and query the layers. The Map Frame provides customized map images based on users selections of the toolbar or TOC. A new window will pop up to display the results of queries or selections of the GIS data attributes. The TOC and toolbar are explained in further detail in the following sections. Table of Contents (TOC) Initially, the TOC lists major groups of GIS data. There are currently 65 vector layers and 30 image layers in the IMS application. These layers are divided into the following major groups: Base Map Layers: Contains regional data for the South Atlantic Coastal States. Ocean Observing Systems: Point data for a variety of platforms found in the region. Management and Regulatory: Data related to special management zones and protected areas. SAFMC Gear restrictions: Vector data used to depict areas of prohibited fishing activites. Marine Sanctuaries: Boundaries and habitat data for the Florida Keys and Grays Reef sanctuaries. Species Occurrence: Includes point data for a variety of species found in the South Atlantic. Unique Habitats: Critical habitat layers for the Right Whale and proposed deep water coral HAPCs. Coral HAPCs: Data related to research products from the Oculina HAPC. 2 IMS User Manual Version 3.0 May 2006 SEAMAP Bottom Mapping: Benthic Habitat data from the coast to the 200 m bathymetric contour. General Habitats: These data represent a variety of habitats important to fisheries. Estuaries: Data related to National Estuarine Research Reserves and National Estuary Programs. Imagery: Various nautical charts for the region.; such as regional data, state data, unique habitats, or imagery. (Figure 2). Figure 2. Example of TOC groups and layers. 3 IMS User Manual Version 3.0 July 2009 The icons positioned next to the groups and layers for the TOC are explained by clicking the “Legend Help” button on the frame and in Figure 3. Figure 3. Explanation of icons in the Table of Contents Frame. Users may toggle visibility at the group or individual layer level. A visible group or layer will be displayed in the map frame if the square radio button is checked. However, the layer or group will not display until the Refresh Map button at the bottom of the TOC frame is clicked. Users may select the Auto Refresh option to automatically display a layer when it is clicked visible (Figure 4). Figure 4. Refresh Map and Auto Refresh options. There is no limit to how many layers or groups that can be visible in the map frame. However, there can only be one active layer at a time. Toolbar The toolbar has a variety of tools used to navigate or query the map data. Below is an explanation of each tool listed in the toolbar frame. The Overview Map button will toggle the inset location map on and off. The Zoom In tool allows you to zoom in closer to areas on the map. To use the zoom in tool, click the zoom in button, and use your mouse to either 1) click on a location of interest or 2) draw a "box" around the area you want to zoom to. To draw a "box", place the cursor at one corner of the area, click and hold the left mouse button, and drag the cursor to the other corner of your area and release. The zoom in tool will zoom in to and center on the clicked point or drawn "box." 4 IMS User Manual Version 3.0 May 2006 The Zoom Out tool allows you to zoom out to view a larger map area. To use the zoom out tool, click the zoom out button, and use your mouse to either 1) click on a location or 2) draw a "box" as described in the Zoom In tool. The zoom out tool will zoom out and center on the clicked point or drawn "box." Note: the smaller the box, the more you zoom out. Pressing the Zoom to Full Extent button will cause the map to zoom to the full extent of all map layers, the State of Florida. Pressing the Zoom to Active Layer button will cause the map to zoom to the full extent of the current active layer. By default, the Florida Shoreline layer is the active layer. To change the current active layer, click the layers button from data tools, and change the Active layer. Pressing the Zoom Last Extent button will cause the map to zoom to the last extent. The Pan tool allows you to move around the map without zooming in or out. Position your cursor anywhere on the map, click and hold the left mouse button, and "drag" the map to the area you are interested in. To use this option select an "Active" and "Visible" data layer from the Table of Contents then click on a feature to get extended information. The Identify tool allows you to identify all features of the active layer that intersect any point you click on the map. By default, the National Data Bouys layer is the active layer. If you would like to identify features for other layers, choose the layers button from the data tools toolbar, and change the Active layer. The Query tool retrieves map features by querying the attribute table. First, make the layer to query active, then click on the Query button. A form will open in a seperate window, which provides controls to build a query string and execute it. In the query form type the query string, or build it by 1) selecting one name in the field list; 2) selecting an operator; 3) typing or selecting a value (clicking the button with a ? will list field values). Click "Add to Query String". Finally, execute the query. If features have been found, the list of selected records will be displayed in a new window. If you click on the record ID column (underlined blue number), you will zoom the map to that specific feature. 5 IMS User Manual Version 3.0 July 2009 Click the button and type in a search string to get a list of all the features in the active layer that match. Use the asterisk as a wildcard. Results from the Find tool appear in a new pop-up window. Select a feature and then click the buffer button. Enter a distance for the buffer and a layer that you want to highlight features from and then click "Buffer". A new map will be returned that shows the buffer and features that fell within it. Buffering may take some time depending on the layer you choose to highlight and your buffer distance. Check the "Display Attributes" checkbox prior to buffering to get a list of features that fall within the buffer. The Select by Rectangle tool allows you to perform a geographic (spatial) query and view tabular data about the resulting selected features on the map. To use the Select by Rectangle tool, either 1) click on the location in which you wish to select features or 2) draw a "box" as described in the Zoom In tool. Use the Clear Selection tool to clear your selected features. NOTE: Only one map layer at a time can be active for the Select by Rectangle tool. The Select by Line/Polygon tool allows you to perform a geographic (spatial) query and view tabular data about the resulting selected features on the map. To use the Select by Line/Polygon tool, click on the map window multiple times following the line/polygon outline of choice. Note that if you click segments too quickly, they may not draw properly and you will get an error message saying "Response from previous request(s) not received." Either click your next segment and wait for the map to redraw or clear you segments with the Clear Selection tool. When you have completed your line or polygon outline, use the Select with Line or Polygon popup window to indicate this. Note the Restart and Delete Last Point options in the Select by Line/Polygon pop-up window. Use the Clear Selection tool to clear your selected features. NOTE: Only one map layer at a time can be active for the Select by Line/Polygon tool. The Clear Selection button will clear any highlighted features on your map. The Print tool allows you to create a print page based on a predefined template. It contains a title, map, legend, and logos. Click on the Print button in the IMS tool bar and you will open the print form in the project links frame. This form allows you to select a predefined title or type a custom title in the text box. Note that ArcIMS prints from the map file rather than by capturing your screen. The extent that prints may not exactly match what your screen displays. 6 IMS User Manual Version 3.0 May 2006 The Download tool allows you to download the visible layers to your local drive. To use the download tool make visible the layers that you want to download. Click on the extract button and enter the required information. The visible layers will be clipped to the current map extent, and compressed into a zip file. To save this zip file to your local drive click the "download" button. Please note some layers are not currently available for downloading. Example Applications The hyperlink tool provides a spatial reference to link users to other sources to gain additional information about a feature. Currently there are only a few layers with this ability. An excellent example of this tool is found with the NDBC Buoys data layer. This layer is located in the Ocean Observing Systems group. Figure 5. below outlines the following steps: 1.) Make the layer visible and active by clicking in the square and circle next to the layer, 2.) Refresh the Map, and 3.) Select the hyperlink tool. Figure 5. Hyperlink steps to the NDBC Bouy observations. Now when you click on a data buoy you will link to an HTML page that gives current observations such as wind speed, water temperature, wave height or air temperature for that location. 7 IMS User Manual Version 3.0 July 2009 The identify tool returns information about a feature of the active layer. This example uses the Base Geology layer located in the General Habitats group. Figure 6. below outlines the following steps: 1.)Make the layer visible and active by clicking in the square and circle next to the layer, 2.) Refresh the Map, 3.) Zoom to active layers and 4.) Select the identify tool. Now when you click on the Base Geology polygons the attributes are returned in a new pop-up window (Figure 7) Figure 6. Identify example using Base Geology. Figure 7. Identify results from Base Geology. 8 IMS User Manual Version 3.0 May 2006 The query tool retrieves map features by querying the attribute table of the active layer. This example uses the Artificial Reefs layer located in the General Habitats group. Figure 8. below outlines the following steps: 1.) Make the layer visible and active by clicking in the square and circle next to the layer, 2.) Refresh the Map, 3.) Zoom to active layer, 4.) Select the query tool, - a new pop-up window displays (Fig 9) Figure 8. Query example for Florida artificial reefs. 5.) Select a field, 6.) Select an operator, 7.) Select a sample value*, 8.) Add to Query String, and 9.) Execute. Figure 9. Artificial Reef Query pop-up window . 9 IMS User Manual Version 3.0 July 2009 *Currently there is a bug with the sample value. Not all unique records are returned. You can work around this by typing the text yourself in the query box. Be sure to put the text in double quotes and remember this tool is case sensitive. The map results of the query are displayed in Figure 10. The map now highlights all artificial reefs in Broward County. Notice the tabular results are displayed in a new pop-up window (Figure 11). Figure 10. Results from artificial reef query. Figure 11. Tabular results of the artificial reef query. 10 IMS User Manual Version 3.0 May 2006 The Find tool returns a list of all the features in the active layer that match a text string. Use the asterisk as a wildcard and keep in mind this tool may be case sensitive. The find tool retrieves map features by querying the attribute table of the active layer. This example uses the Snapper Grouper layer located in the SAFMC Essential Fish Habitat group. Figure 12. and Figure 13. below outline the following steps: 1.) Make the layer visible and active by clicking in the square and circle next to the layer, 2.) Refresh the Map, 3.) Zoom to active layers 4.) Select the find tool, ( a new pop-up window opens Fig. 13) Figure 12. Steps for demonstrating find tool. 5.) Enter a text string, 6.) Click the Find String button. 11 IMS User Manual Version 3.0 July 2009 Figure 13. Find all Snapper Grouper EFH_HAPC areas with the text string “hump” in their name. Results from the Find tool appear in a new pop-up window (Figure 14). Figure 14. Tabular results of the find tool. Clicking the “Zoom to these records” link in the table will take the user to these features (Figure 15). 12 IMS User Manual Version 3.0 May 2006 Figure 15. Map results of the find tool example. For additional information on the Habitat and Ecosystem IMS please contact the following: Roger Pugliese Senior Fishery Biologist South Atlantic Fishery Management Council 4055 Faber Place Drive, Suite 201 Charleston, South Carolina 29405 Phone: (843) 571-4366 Fax: (843)769-4520 Email: [email protected] Tina Udouj Assistant Research Scientist Florida Fish and Wildlife Conservation Commission Fish and Wildlife Research Institute 100 8th Avenue S.E. St. Petersburg, FL 33701 Phone: (727)896-8626 ext 3034; SUNCOM: 523-3034 Fax: (727)893-1679 Email: [email protected] 13